


Abstract
In the design processes of medium-voltage (MV) systems, ensuring insulation safety is considered a critical parameter in terms of both system sustainability and the service life of the components used. In this study, the direct effects of the cross-sectional geometry of conductors used in air-insulated switchgear (AIS) systems on electric field distribution and dielectric strength characteristics were quantitatively investigated through numerical analysis methods. Within the scope of the research, conductor models with different geometric structures were created based on a rated line-to-line voltage level of 17.5 kV, and these models were analyzed using the finite element method with COMSOL Multiphysics® (AC/DC Module 6.2 version) software under the rated peak inter-phase potential difference (24.75 kV). Simulation studies demonstrate that curved transitions at the rounded edges on conductor surfaces cause electric field lines to concentrate at these boundaries, leading to local electric field intensification. In calculations performed on a standard rectangular cross-section conductor with dimensions CU-6 × 180 mm, the maximum electric field strength reached 10.90 kV/cm at the rounded edges. For wider rectangular profiles such as CU-12 × 220 mm and CU-12 × 360 mm, maximum field strengths remained at 7.77 kV/cm and 7.42 kV/cm, respectively. In contrast, adopting equal-area cylindrical configurations for these profiles reduced the peak electric field to 4.54 kV/cm (for the 12 × 220 mm equivalent) and 4.22 kV/cm (for the 12 × 360 mm equivalent) owing to the uniform charge distribution across the continuous cylindrical boundary. Beyond the qualitative understanding of electrostatic curvature, this study quantitatively benchmarks the dielectric safety margins and field utilization factors for standardized industrial MV busbar profiles at 17.5 kV, providing practical geometric criteria for partial discharge mitigation in compact switchgear designs. The findings indicate that profile geometry serves as an effective design measure in mitigating electrical stress and reducing partial discharge risk in medium-voltage equipment.
1. Introduction
Today, with the increasing power demand in energy systems, the capacity needs of transmission-distribution networks tend to increase. In this context, innovative approaches in high-voltage technologies are needed. Koehler and Hari [1], in their study on BOLD® technology, examined system performance and structural aspects. The resulting findings directly affected the design parameters that will increase efficiency in transmission lines. Ghassemi [2] examined the opportunities and challenges of high wave impedance loading (HSIL) lines in detail. He identified the research needs in the near future. These studies have revealed the importance of not only capacity increase but also geometric and structural optimization in transmission and distribution systems. Zhou et al. [3] theoretically and practically investigated ultra-high voltage (UHV) AC/DC transmission systems. They contributed to the literature by highlighting the scale of control problems occurring in insulation and electric field distribution in massive structures.
In medium- and high-voltage systems, insulation design plays a critical role in terms of system sustainability and component lifespan. Recent studies have presented different approaches to optimize electric field distribution. Lu et al. [4] conducted studies on high-power-density medium-voltage transformers. In these studies, they focused on the modeling and design of the insulation structure. In particular, it was observed that the grating ring designs were optimized using the finite element method (FEM) to improve the electric field distribution in polymeric insulators [5]. Research on the arrangement of conductor and insulator geometries to improve the dielectric performance in high-voltage bushings [6] demonstrates the diversity of techniques in this field. In addition, the effects of the physical position and geometry of the conductors on the total electric field in the surrounding structures have also been investigated in detail with modern numerical analysis methods [7]. The common point of these studies is to increase system reliability by minimizing the electric field concentration in complex geometries.
The effects of electromagnetic fields on both the environment and technical equipment should be considered as an integral part of the design processes. Ahsan et al. [8] measured and simulated the magnetic fields generated by high-voltage power lines and reported the distribution characteristics of these fields in detail. Bahrman and Johnson [9] discussed the fundamentals of HVDC technologies, the technical advantages in direct current transmission, and field control requirements comparatively. The safety aspect of electromagnetic fields is naturally of critical importance. Samy [10] evaluated the safe operating limits in detail by calculating the fields around HVDC transmission lines between Egypt and Saudi Arabia. In addition, Duhaini [11] revealed the importance of maintaining limit values in design by examining the biological effects of these fields on human health.
When it comes to the design of the system and its components, insulation safety must have the highest priority. Wang et al. [12] proposed an improved design scheme for high-voltage cable connections. In this study, they demonstrated the applicability of the suggestions presented regarding the optimization of voltage in dielectric materials. Metwally et al. [13] stated that design parameters and potential defects are present at medium-voltage (MV) cable splices. They investigated the effects on the electric field distribution occurring at these points, revealing how geometric defects increase the field strength. The findings from this study are supported by the analysis of Chang et al. [14] on the electric field distribution in voids embedded in dielectric structures. Chang clearly stated how microvoids increase the electric field strength locally. Hossam-Eldin et al. [15] discussed in detail the mechanisms that determine the life of solid insulators by simulating the field distribution in these microvoids.
The geometric arrangement of conductors directly affects not only their own electrical performance but also the surrounding metallic structures. Gouda et al. [16] investigated in detail the effects of magnetic fields occurring in the transmission line on induced voltages on metallic gas pipelines under obstruction. As a result, they comparatively analyzed the corrosion and safety risks. The findings clearly revealed the importance of conductor geometry. Gao et al. [17] demonstrated the challenges of field control in complex systems by modeling and simulating hybrid bipolar HVDC systems. Classical works such as Kuffel, Zaengl, and Kuffel [18] and Arora and Mosch [19] detailed the fundamentals of high-voltage engineering and the dielectric breakdown mechanisms of air insulation. Wadhwa [20] and Naidu and Kamaraju [21] introduced high-voltage testing techniques and discharge events in gas-insulated systems to the literature. Abdel-Salam [22] focused on high-voltage theory and applications, providing fundamental equations that emphasize the importance of geometric form factor in design.
Studies on insulation design and electric field optimization in high- and medium-voltage systems are constantly evolving to improve the reliability of system components. Design and optimization processes aimed at preventing partial discharge (PD) in laminated busbar structures have been investigated, especially under extreme environmental conditions such as aviation applications, and dielectric strength protection strategies have been developed in low-pressure environments [23]. Research shows that optimizing insulation quality and switching performance is critical to achieving a PD-free operating range in laminated busbar systems [24]. Similarly, electrical stress analysis approaches have been used to create discharge-free busbar designs even under low-pressure conditions [25]. In the design of standoff insulators operating under hybrid voltages, the development of new generation insulation materials and dielectric stress management is coming to the forefront [26]. Recent studies have also focused on the application of optimization algorithms to switchgear equipment. For example, structural form optimizations have been performed in three-phase closed gas-insulated disconnectors (GIS) using multi-objective optimization algorithms (MOGOA) and extreme learning machines (ELM) [27]. It has been proven that surface electric field stress can be reduced in 400 kV composite insulators at very high voltage levels by improving corona ring designs [28]. Partial discharge-free (PD-free) design methodologies in insulation systems have also been adapted to laminated busbar structures, revealing the effects of geometric transitions on dielectric lifetime [29]. In the current literature, the investigation of air-insulated systems and switchgear structures using numerical methods has gained momentum. The optimization of the electric field using field regulators at busbar connection points in medium-voltage switchgear has been investigated, and local voltage accumulations in connection regions have been successfully modeled [30]. Research on the optimization of the busbar structure in switchgear at the 40.5 kV level shows the direct effect of geometric forms under high voltage on the field distribution [31]. Furthermore, the analysis of the electric field in air gaps with busbar-insulator mounting using three-dimensional parametric modeling has increased the accuracy of numerical analyses in determining critical insulation distances [32]. Finally, the general framework developed for the insulation design of medium-frequency transformers offers a comprehensive methodology on how to manage dielectric strength limits mathematically and theoretically in air-insulated systems [33].
While the qualitative relationship between surface curvature and electrostatic stress enhancement is fundamentally known, systematic, quantitative parametric data tailored to standardized industrial medium-voltage busbar geometries remain unaddressed in the literature. Recent studies have predominantly focused on specialized laminated busbars for aviation or low-pressure systems [23,24,25,29], field grading rings in GIS equipment [27,28], or isolated joint connections [30,32]. The primary engineering contribution of this study is the rigorous quantitative benchmarking of standard commercial rectangular busbars (CU-6 × 180 to CU-12 × 360 mm) against equal-area cylindrical equivalents under a 17.5 kV operating voltage. By systematically decoupling the minor influence of raw cross-sectional area enlargement from the dominant role of profile geometry, this paper establishes exact dielectric safety margins, field utilization factors, and actionable geometric design thresholds necessary to mitigate partial discharge inception risk in compact air-insulated switchgear (AIS) systems.
2. Theoretical Background
High-voltage engineering is a branch of electrical insulation technology. It examines and analyzes conditions where the electrical potential, and consequently the voltage, and therefore the electric field strength (electrical stress) created by the voltage, are high. The design, production, and use of devices with appropriate structure (material), size, and shape suitable for the working conditions and the electrical field (stress) are crucial for the safety and reliability of the components and systems to be produced and fall under the scope of high-voltage engineering. The importance of static electric field calculations stems from this [20,21,34,35].
In electrostatic theory, the electric field strength (E) at the surface of a conductor is directly related to the charge density (σ) at the surface. According to Gauss’s Law, in static equilibrium, when the electric field inside the conductor is zero, all charges are concentrated on the outer surface of the conductor. The electric field strength at the surface is expressed by Equation (1) [20,21,34,35];
where σ represents the surface charge density and ε0 is the permittivity of free space (ε0 ≈ 8.854 × 10⁻¹² F/m).
The most critical effect of conductor geometry is on the homogeneity of charge distribution on the surface. While charges tend to be homogeneously distributed on a flat surface, as the radius of curvature (r) of the conductor decreases (i.e., as the corners taper), the density of charges in that region increases. For an ideal spherical conductor, the relationship between surface potential (V) and electric field (E) is given in Equation (2) [20,21,34,35].
This fundamental relationship illustrates that as the radius of curvature (r) decreases (as it approaches sharp corners), the electric field strength under the same voltage can theoretically go to infinity. The 90-degree sharp corners in rectangular conductors are the greatest risk factors for locally exceeding the air breakdown threshold, creating a “singularity” effect.
In medium-voltage systems, air, the primary insulator, has a breakdown strength of approximately 30 kV/cm under normal conditions (NTP: 20 °C, 101.3 kPa). However, this value varies depending on the distance between the electrodes, the pressure, and the humidity of the air. In Equation (3), Paschen’s Law states that the breakdown voltage of gases is a function of the product of gas pressure (p) and the distance between the electrodes (d) [20,21,34,35].
Vb = f(p∙d)
Under standard temperature and pressure (NTP: 20 °C, 101.3 kPa) and for macroscopic electrode clearances on the order of centimeters (d = 8 cm), Paschen’s formulation yields the macroscopic quasi-uniform air ionization threshold of approximately Ecrit ≈ 30 kV/cm. In this study, Equation (3) serves as the foundational physical baseline establishing this 30 kV/cm threshold to quantify the dielectric safety margins and partial discharge inception risks across the evaluated geometries.
At the 17.5 kV voltage level used in our analyses, when the local field strength on the conductor surface exceeds this 30 kV/cm threshold, air molecules begin to ionize. This initiates “Partial Discharge” (PD) events, which deplete the insulation’s lifespan even if a complete arc does not form. In this study, triangular finite elements with 3 node points are used. This finite element type is the simplest 2D finite element and a closed element.
The corner points of the triangle ending element are called the node point, and the approach functions are defined for these points. Points inside the element are called inner points. Field variables of points that are not node points are found by interpolation of known points at node points. In this case, the approximate expression is given in Equation (4) [20,21,34,35].
V(x,y) = N1(x,y)φ1 + N2(x,y)φ2 + N3(x,y)φ3
Here, φ1, φ2, and φ3 field variables are defined as interpolation approximation functions. Other functions, N1(x, y), N2(x, y), N3(x, y) functions are form functions.
Equation (4) defines the fundamental spatial discretization mechanism whereby the continuous potential field within each triangular element is approximated via local nodal shape functions (Ni). In the numerical formulation, this interpolation directly governs the adaptive h-refinement process implemented near the rounded edges of the conductors; by subdividing elements into smaller spatial domains around steep potential gradients, the approximation error of Equation (4) is minimized, ensuring rigorous convergence of the computed surface electric field E = −∇V.
In the FEM simulation framework implemented in COMSOL Multiphysics, the spatial distribution of electric potential (V) within the air domain is governed by the source-free Laplace equation, expressed as ∇⋅(ε0εr∇V) = 0. The electric field intensity vector is subsequently derived as the negative gradient of potential, E = −∇V. The theoretical principle represented in Equation (2) mathematically dictates that as the radius of curvature decreases at the edge transitions, local surface charge density (σ) and field stress (E) escalate. In the numerical model, this behavior directly governs the placement of refined triangular elements (Equation (4)) around the rounded edges of the conductors to capture steep potential gradients accurately. Furthermore, Paschen’s formulation (Equation (3)) establishes the physical baseline for the standard 30 kV/cm dielectric threshold used throughout this study to quantify the safety margin against partial discharge inception.
3. Methodology
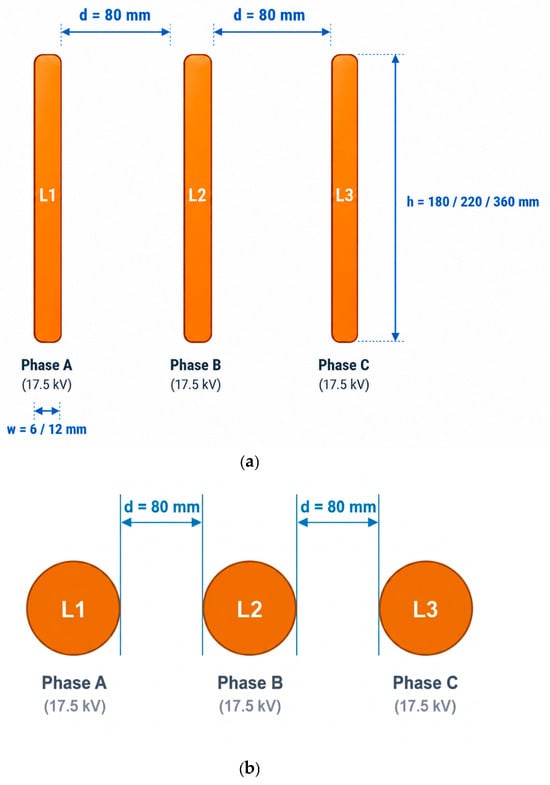
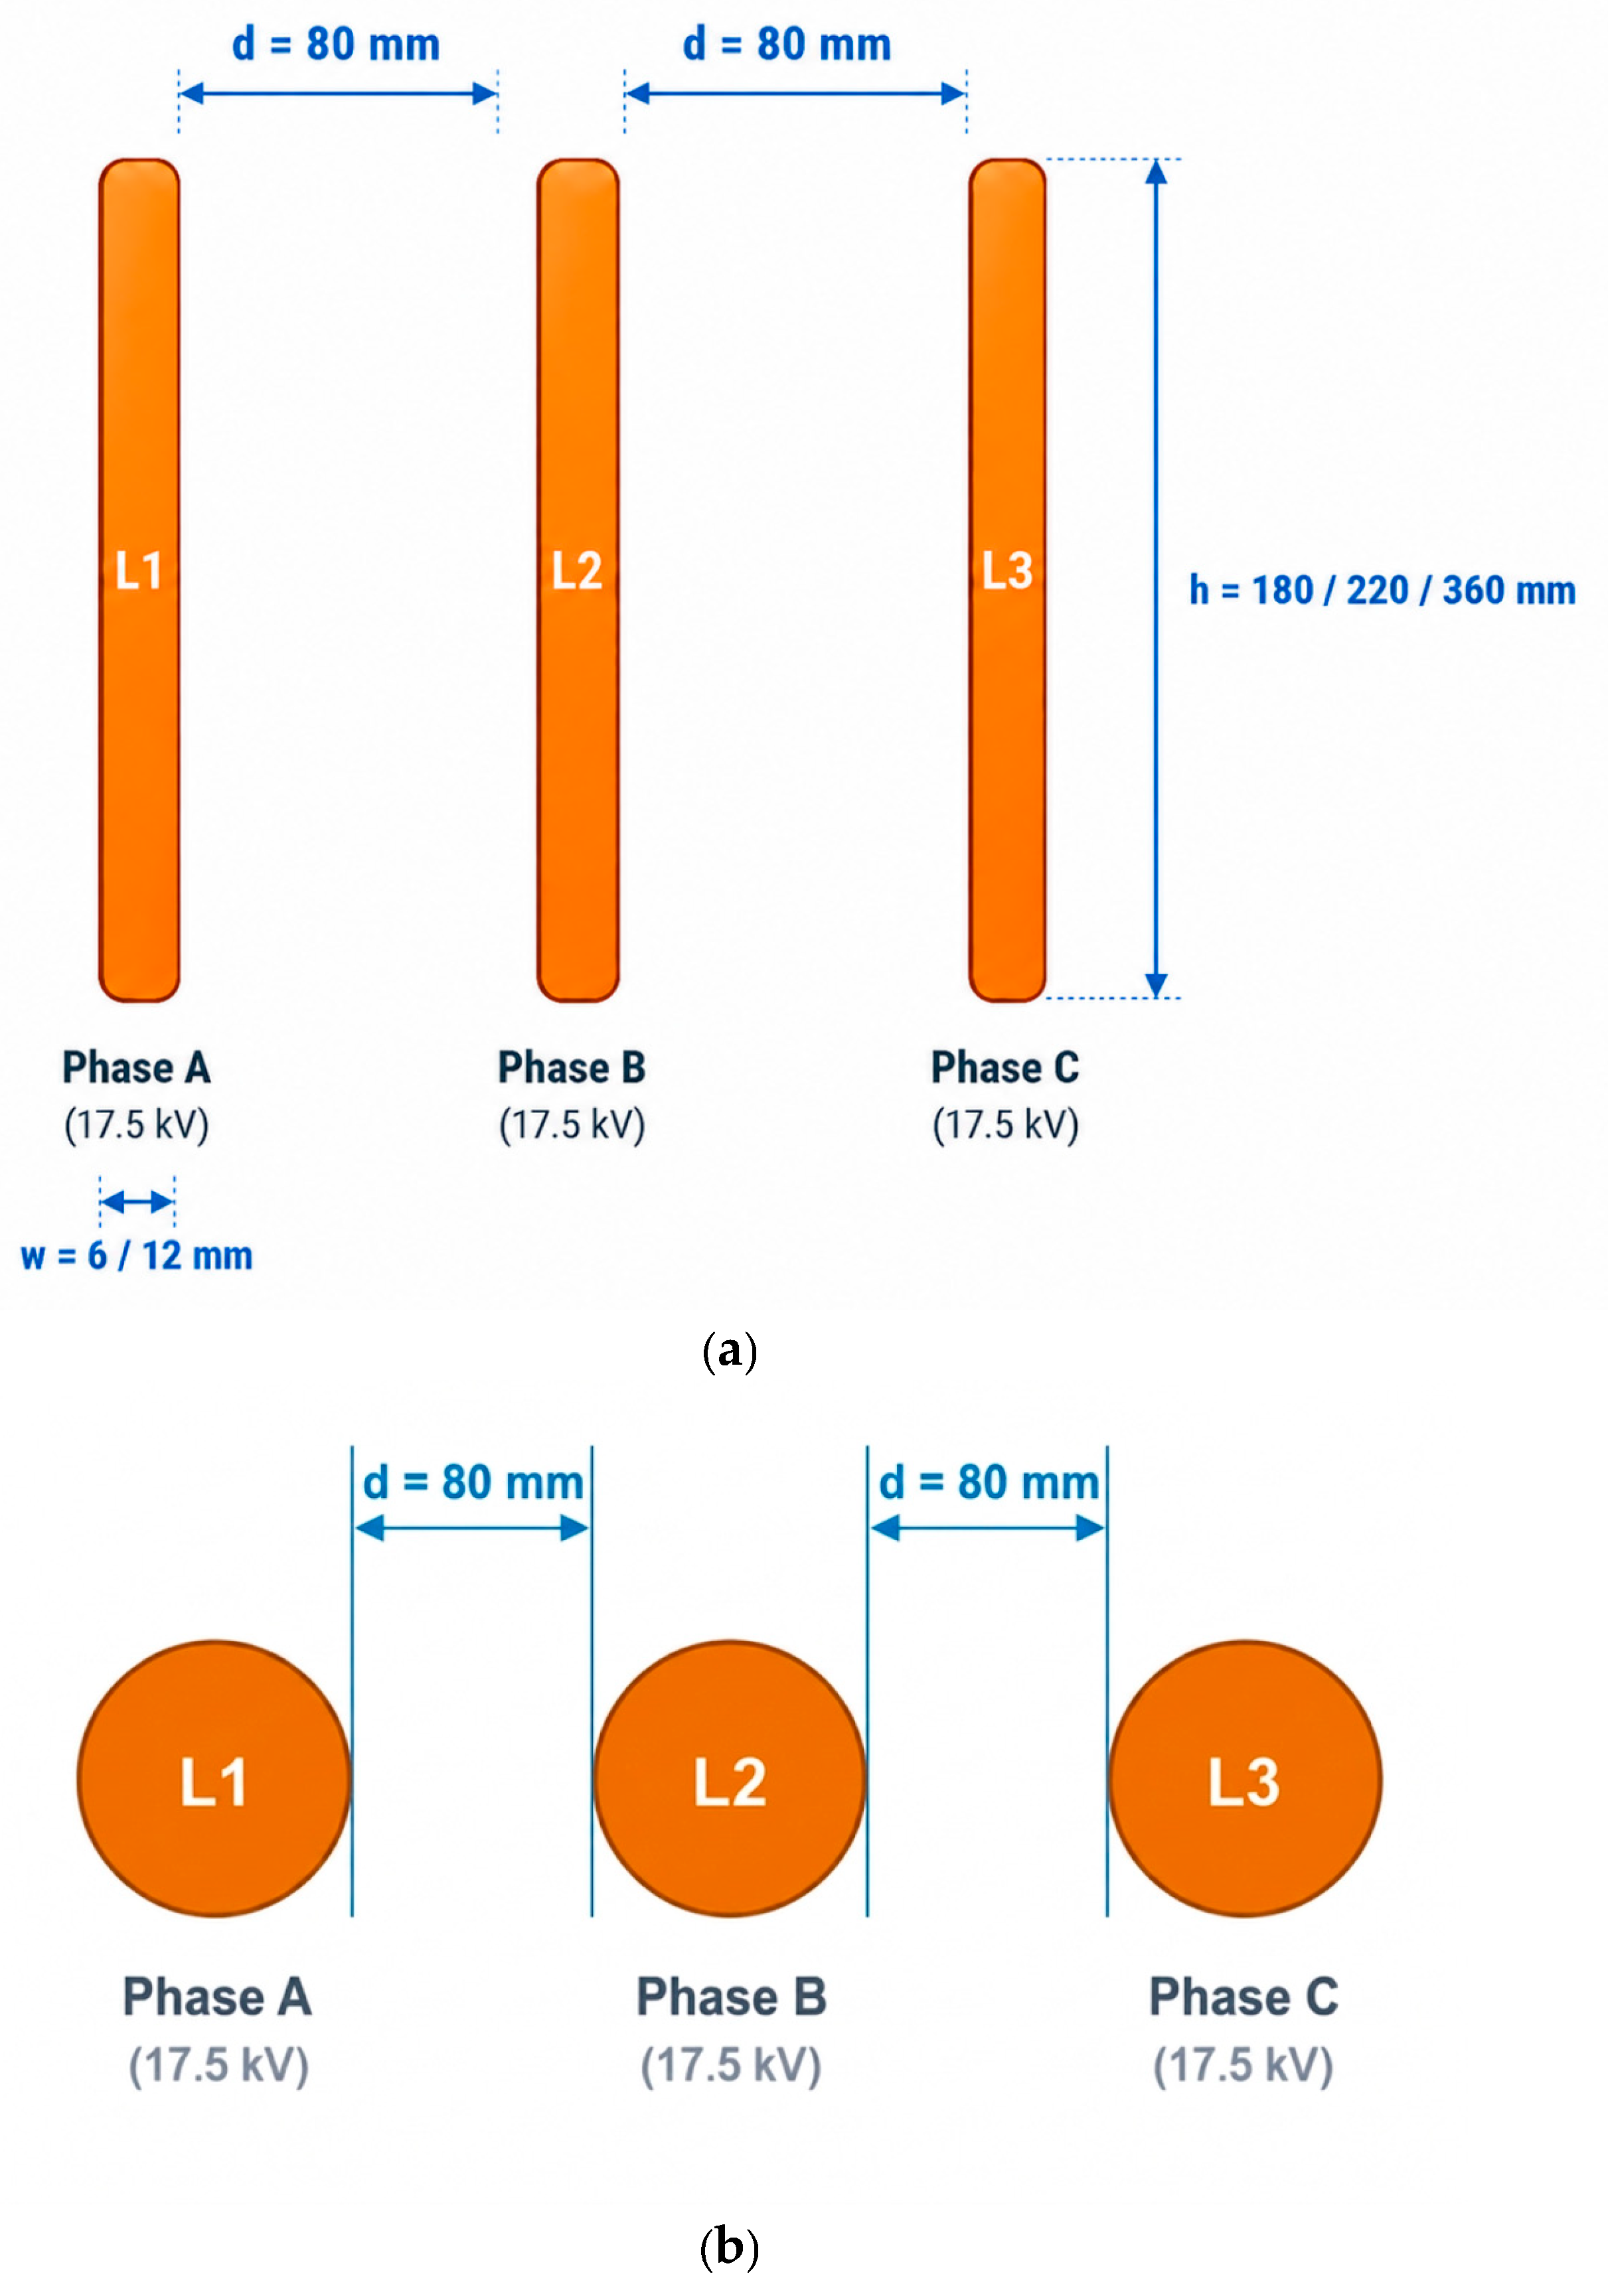
Theoretical models were created using Finite Element Method (FEM) based numerical analyses. The numerical analysis process was structured using an electrostatic solver in the COMSOL Multiphysics software. In the modeling, rectangular copper conductors with dimensions of CU-6 × 180 mm, CU-12 × 180 mm, CU-12 × 220 mm and CU-12 × 360 mm, commonly used in industry, and a cylindrical conductor geometry, determined as the reference point, were defined in the system. The geometric configuration, inter-phase clearance (80 mm), conductor dimensions, and computational domain layout investigated in this study are schematically illustrated in Figure 1, representing the standardized horizontal coplanar busbar arrangement commonly employed in medium-voltage air-insulated compartments.
Figure 1.
Conductor models and computational layout: (a) 2D schematic of rectangular busbars showing the surface-to-surface clearance (d = 80 mm), and (b) 2D schematic of equivalent cylindrical busbars with the identical surface-to-surface air clearance (d = 80 mm).
The finite element mesh discretization utilized second-order (quadratic) triangular Lagrange elements. Across the various conductor geometries, the computational domain comprised approximately 45,000 to 65,000 triangular elements, yielding between 90,000 and 130,000 degrees of freedom (nodes). An adaptive mesh refinement was enforced along high-gradient edge zones with a minimum element size of 0.05 mm, ensuring complete numerical mesh convergence and spatial gradient accuracy.
All electrostatic simulations were defined under standardized reference dielectric test conditions corresponding to Normal Temperature and Pressure (NTP: ambient thermal baseline T = 20 °C/293.15 K, absolute atmospheric pressure p = 101.3 kPa, and relative air permittivity εr = 1.0006). The thermal state across the air insulation domain was modeled as an isothermal boundary at 20 °C to benchmark the baseline intrinsic electrostatic withstand capability prior to continuous thermal loading. To establish a quantitative pass/fail benchmark for dielectric safety, designs exhibiting peak electric fields approaching elevated risk zones (Emax > 10 kV/cm, safety margin < 65%) relative to the critical air breakdown limit (30 kV/cm) are classified as vulnerable configurations prone to localized micro-ionization under transient surges. Conversely, configurations maintaining field stress well below 5 kV/cm (such as cylindrical profiles with Emax ≈ 4.22–4.54 kV/cm and safety margins > 85%) represent optimal, highly conservative operating regimes.
For both conductor groups, the operating voltage was fixed at 17.5 kV (rms) and the phase-to-phase distance at 80 mm, and standard atmospheric air was accepted as the insulation medium. To increase numerical accuracy, the mesh was densified by applying the “adaptive meshing” technique at the rounded edges of the conductors and critical opening regions where the electric field gradient is highest. This approach minimized numerical errors, especially in regions approaching the ionization threshold of air, which is 30 kV/cm.
In the numerical formulation within the COMSOL Multiphysics electrostatic module, copper was defined as the conductor material with an electrical conductivity of σ = 5.8 × 10⁷ S/m and a relative permittivity of εr = 1, while the surrounding insulation medium was set as standard atmospheric air with εr = 1.0006 at 20 °C and 101.3 kPa. The applied boundary conditions were assigned such that the conductor surfaces were excited with representative instantaneous peak potentials derived from a rated line-to-line operating voltage of 17.5 kV (rms), capturing the maximum inter-phase potential gradient, while the external boundaries of the computational domain were defined with zero-charge/electric insulation conditions (n ⋅ D = 0) placed sufficiently far from the busbars to eliminate artificial boundary truncation effects. The computational domain was discretized using second-order (quadratic) triangular Lagrange finite elements. An adaptive mesh refinement strategy was applied specifically around the curved boundary transitions of the busbars, where the electric field gradient is steepest, ensuring high numerical convergence and minimizing discretization errors near the critical breakdown threshold of air. In this fundamental comparative benchmark, the computational boundary was configured with an uncharged boundary condition (n ⋅ D = 0) sufficiently distanced from the conductors to isolate intrinsic phase-to-phase dielectric coupling from specific switchgear chassis geometries. While the boundary excitation was assigned to impose the maximum rated peak potential difference (24.75 kV) between the adjacent outer and central busbars (Phases A and B), practical three-phase installations also encounter dynamic instantaneous phase shifts and central-phase peak conditions. These structural and phase configurations, along with proximity to earthed metal enclosures, are systematically addressed as contextual design limitations in the Section 5.
In industrial three-phase medium-voltage networks, 17.5 kV represents the rated root-mean-square (rms) line-to-line operating voltage (Un). To evaluate the dielectric withstand under the maximum continuous operating stress condition, the instantaneous rated line-to-line peak potential difference () was established as the baseline across the critical inter-phase clearance (d = 80 mm). To rigorously reproduce this exact 24.75 kV peak potential gradient between adjacent active phases in the electrostatic solver, the boundary potentials were symmetrically assigned as VA = +12.375 kV on Phase A and VB = −12.375 kV on Phase B, resulting in an exact inter-phase potential difference of VAB = VA − VB = 24.75 kV. Phase C was assigned to the zero reference potential (VC = 0 kV).
The outer boundaries of the computational air domain were defined with a zero-charge/electric insulation condition (n ⋅ D = 0) and sized to extend more than five times the busbar envelope dimensions (1000 mm × 1000 mm domain size), thereby ensuring that artificial boundary truncation effects on the inter-phase field distribution are strictly eliminated.
Given that medium-voltage switchgear busbars exhibit translational symmetry along their longitudinal axis over extended spans relative to their transverse cross-sectional dimensions, a 2D electrostatic formulation provides a rigorous, highly accurate, and computationally efficient representation of the inter-phase radial field distribution. This 2D approach permits extreme adaptive mesh refinement at the sub-millimeter scale (0.05 mm) along the rounded edges of the conductors without the severe computational memory constraints associated with full 3D domain discretization. While 3D edge boundaries—such as longitudinal bar terminations, busbar joint bends, and support insulator junctions—introduce localized axial fringing fields, the primary dielectric stress driving continuous inter-phase breakdown risk across the active compartment is governed by the transverse radial field captured in this 2D model.
The phase-to-phase clearance distance (d) was strictly fixed at 80 mm (8 cm) across all evaluated models, defined consistently as the minimum surface-to-surface net air clearance between adjacent conductors, rather than the center-to-center pitch distance. Maintaining an identical surface-to-surface clearance of 80 mm ensures that the air insulation gap remains constant across both rectangular and cylindrical geometries, preventing conductor dimensional scaling from distorting the effective dielectric gap. This clearance represents a typical and critical insulation baseline standardized for compact 17.5 kV air-insulated switchgear (AIS) compartments and busbar trunking systems in accordance with IEC 62271-200 design practices. Figure 1 illustrates this unified dimensional definition schematically for both rectangular profiles and their equal-area cylindrical counterparts.
The three-conductor horizontal coplanar arrangement was specifically investigated as it constitutes the primary standard layout in medium-voltage air-insulated switchgear (AIS) compartments and busbar trunking systems, where mutual phase-to-phase dielectric coupling and central-phase electrostatic interactions are most pronounced.
In accordance with standard manufacturing specifications for commercial extruded copper busbars (e.g., DIN or UL or IEC standards), rectangular conductors are fabricated with edge-rounded profiles rather than idealized sharp 90-degree mathematical corners. Accordingly, in the 2D cross-sectional numerical model, the rectangular busbars are modeled with realistic fully rounded/hemi-circular short edges (r = w/2), which accurately represents physical commercial busbar geometry while eliminating artificial non-physical numerical singularities. Specifically, the edge curvature radius for rectangular busbars is explicitly defined as r = w/2 in accordance with manufacturing standards (resulting in r = 3 mm for the 6 mm thick conductor, and r = 6 mm for all 12 mm thick conductors). For the cylindrical equivalent conductors, the continuous radius is determined directly from the equal-area equivalence criteria ().
4. Finite Element Simulation Results
This section presents the results obtained from the simulation studies.
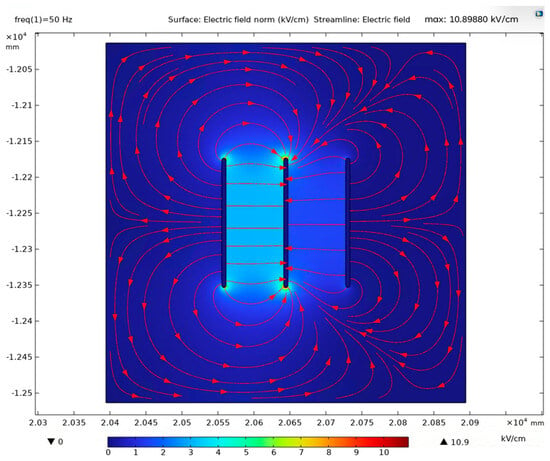
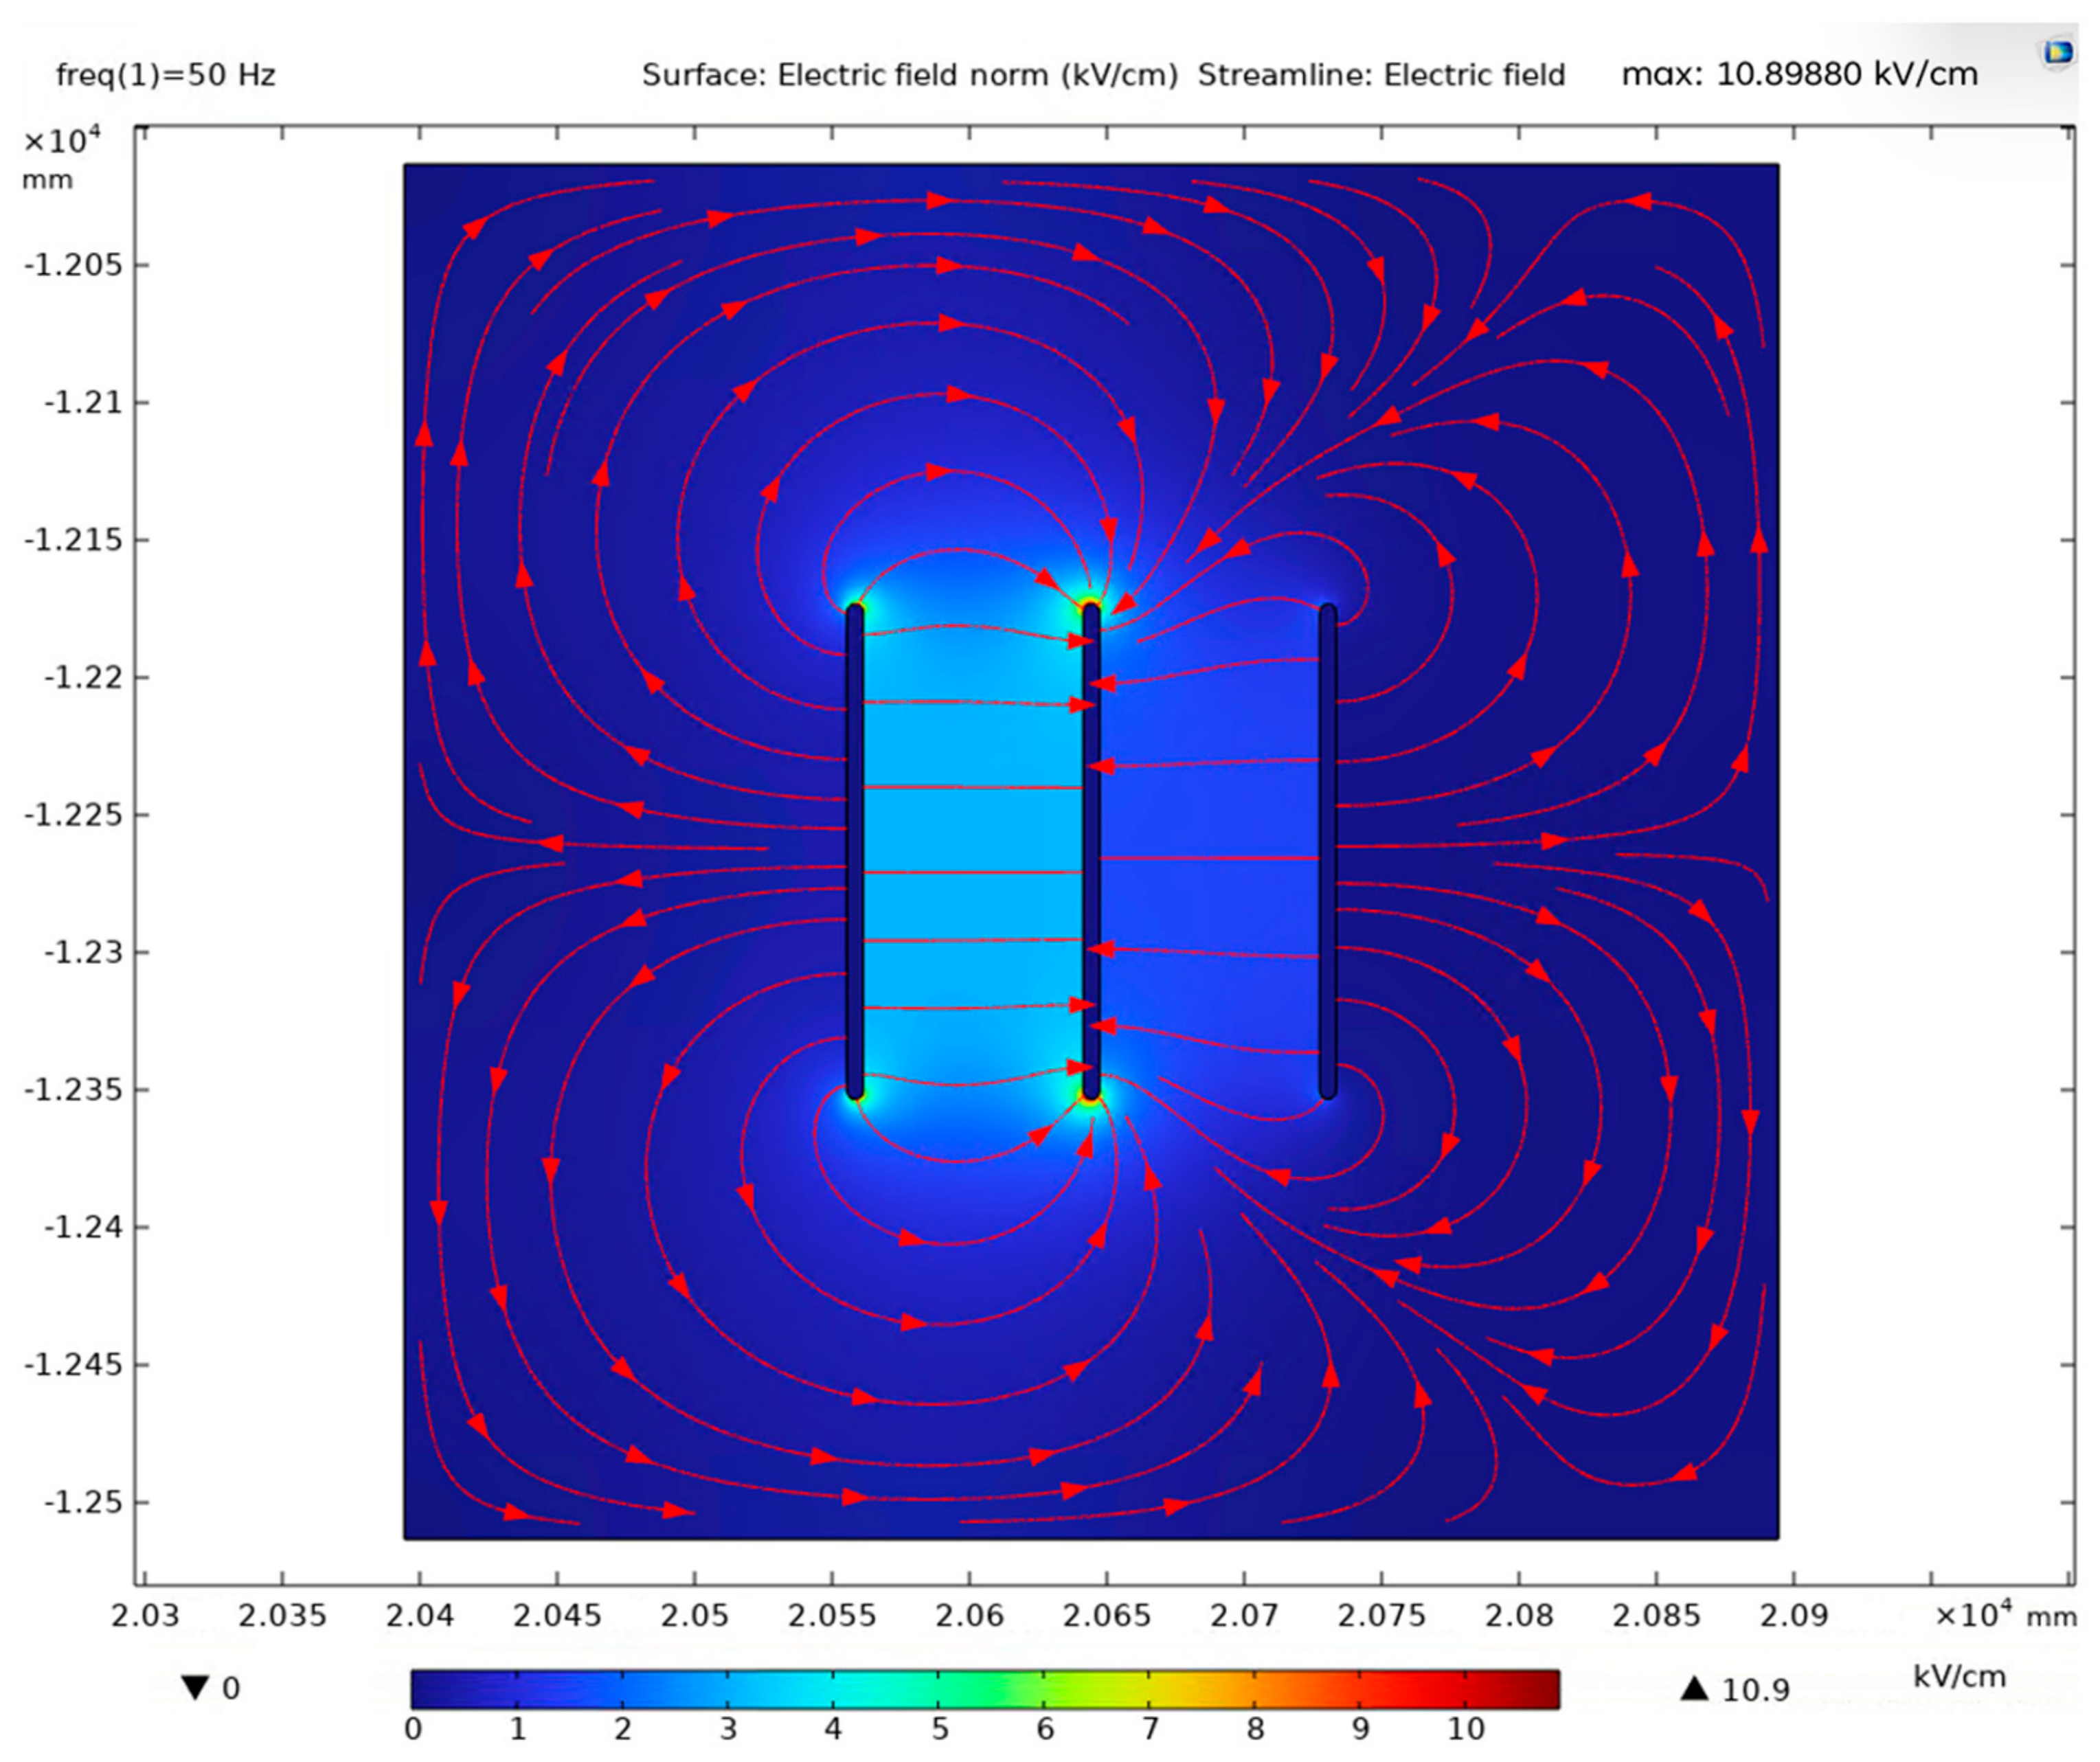
The dielectric field distribution generated at a phase-to-phase clearance of 8 cm under a rated peak line-to-line potential difference corresponding to 17.5 kV, 50 Hz is clearly visible in Figure 2. In the color scale, blue regions represent low electric field intensity, while red and yellow regions highlight localized stress accumulation. The field concentration is observed to intensify predominantly at the rounded edges of the conductors, particularly between the active adjacent conductors (Phases A and B). In this context, electrical stress accumulates prominently in these boundary regions due to the electrostatic edge effect. According to the simulation results, the maximum electric field strength in the system was computed as 10.8988 kV/cm. This value represents an important baseline regarding the insulation integrity of the system, remaining safely below the macroscopic dielectric breakdown strength of air (approximately 30 kV/cm under normal temperature and pressure). The streamlines with directional arrows visualize the electrostatic coupling between the phases, highlighting how the planar profile directs flux lines toward adjacent edges.
Figure 2.
Electrostatic Simulation of CU-6 × 180 mm Conductor Geometry.
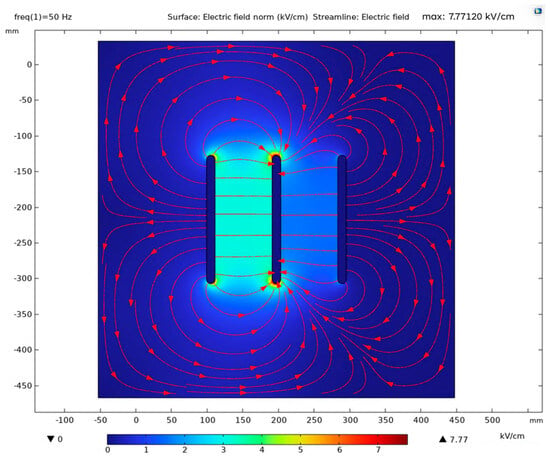
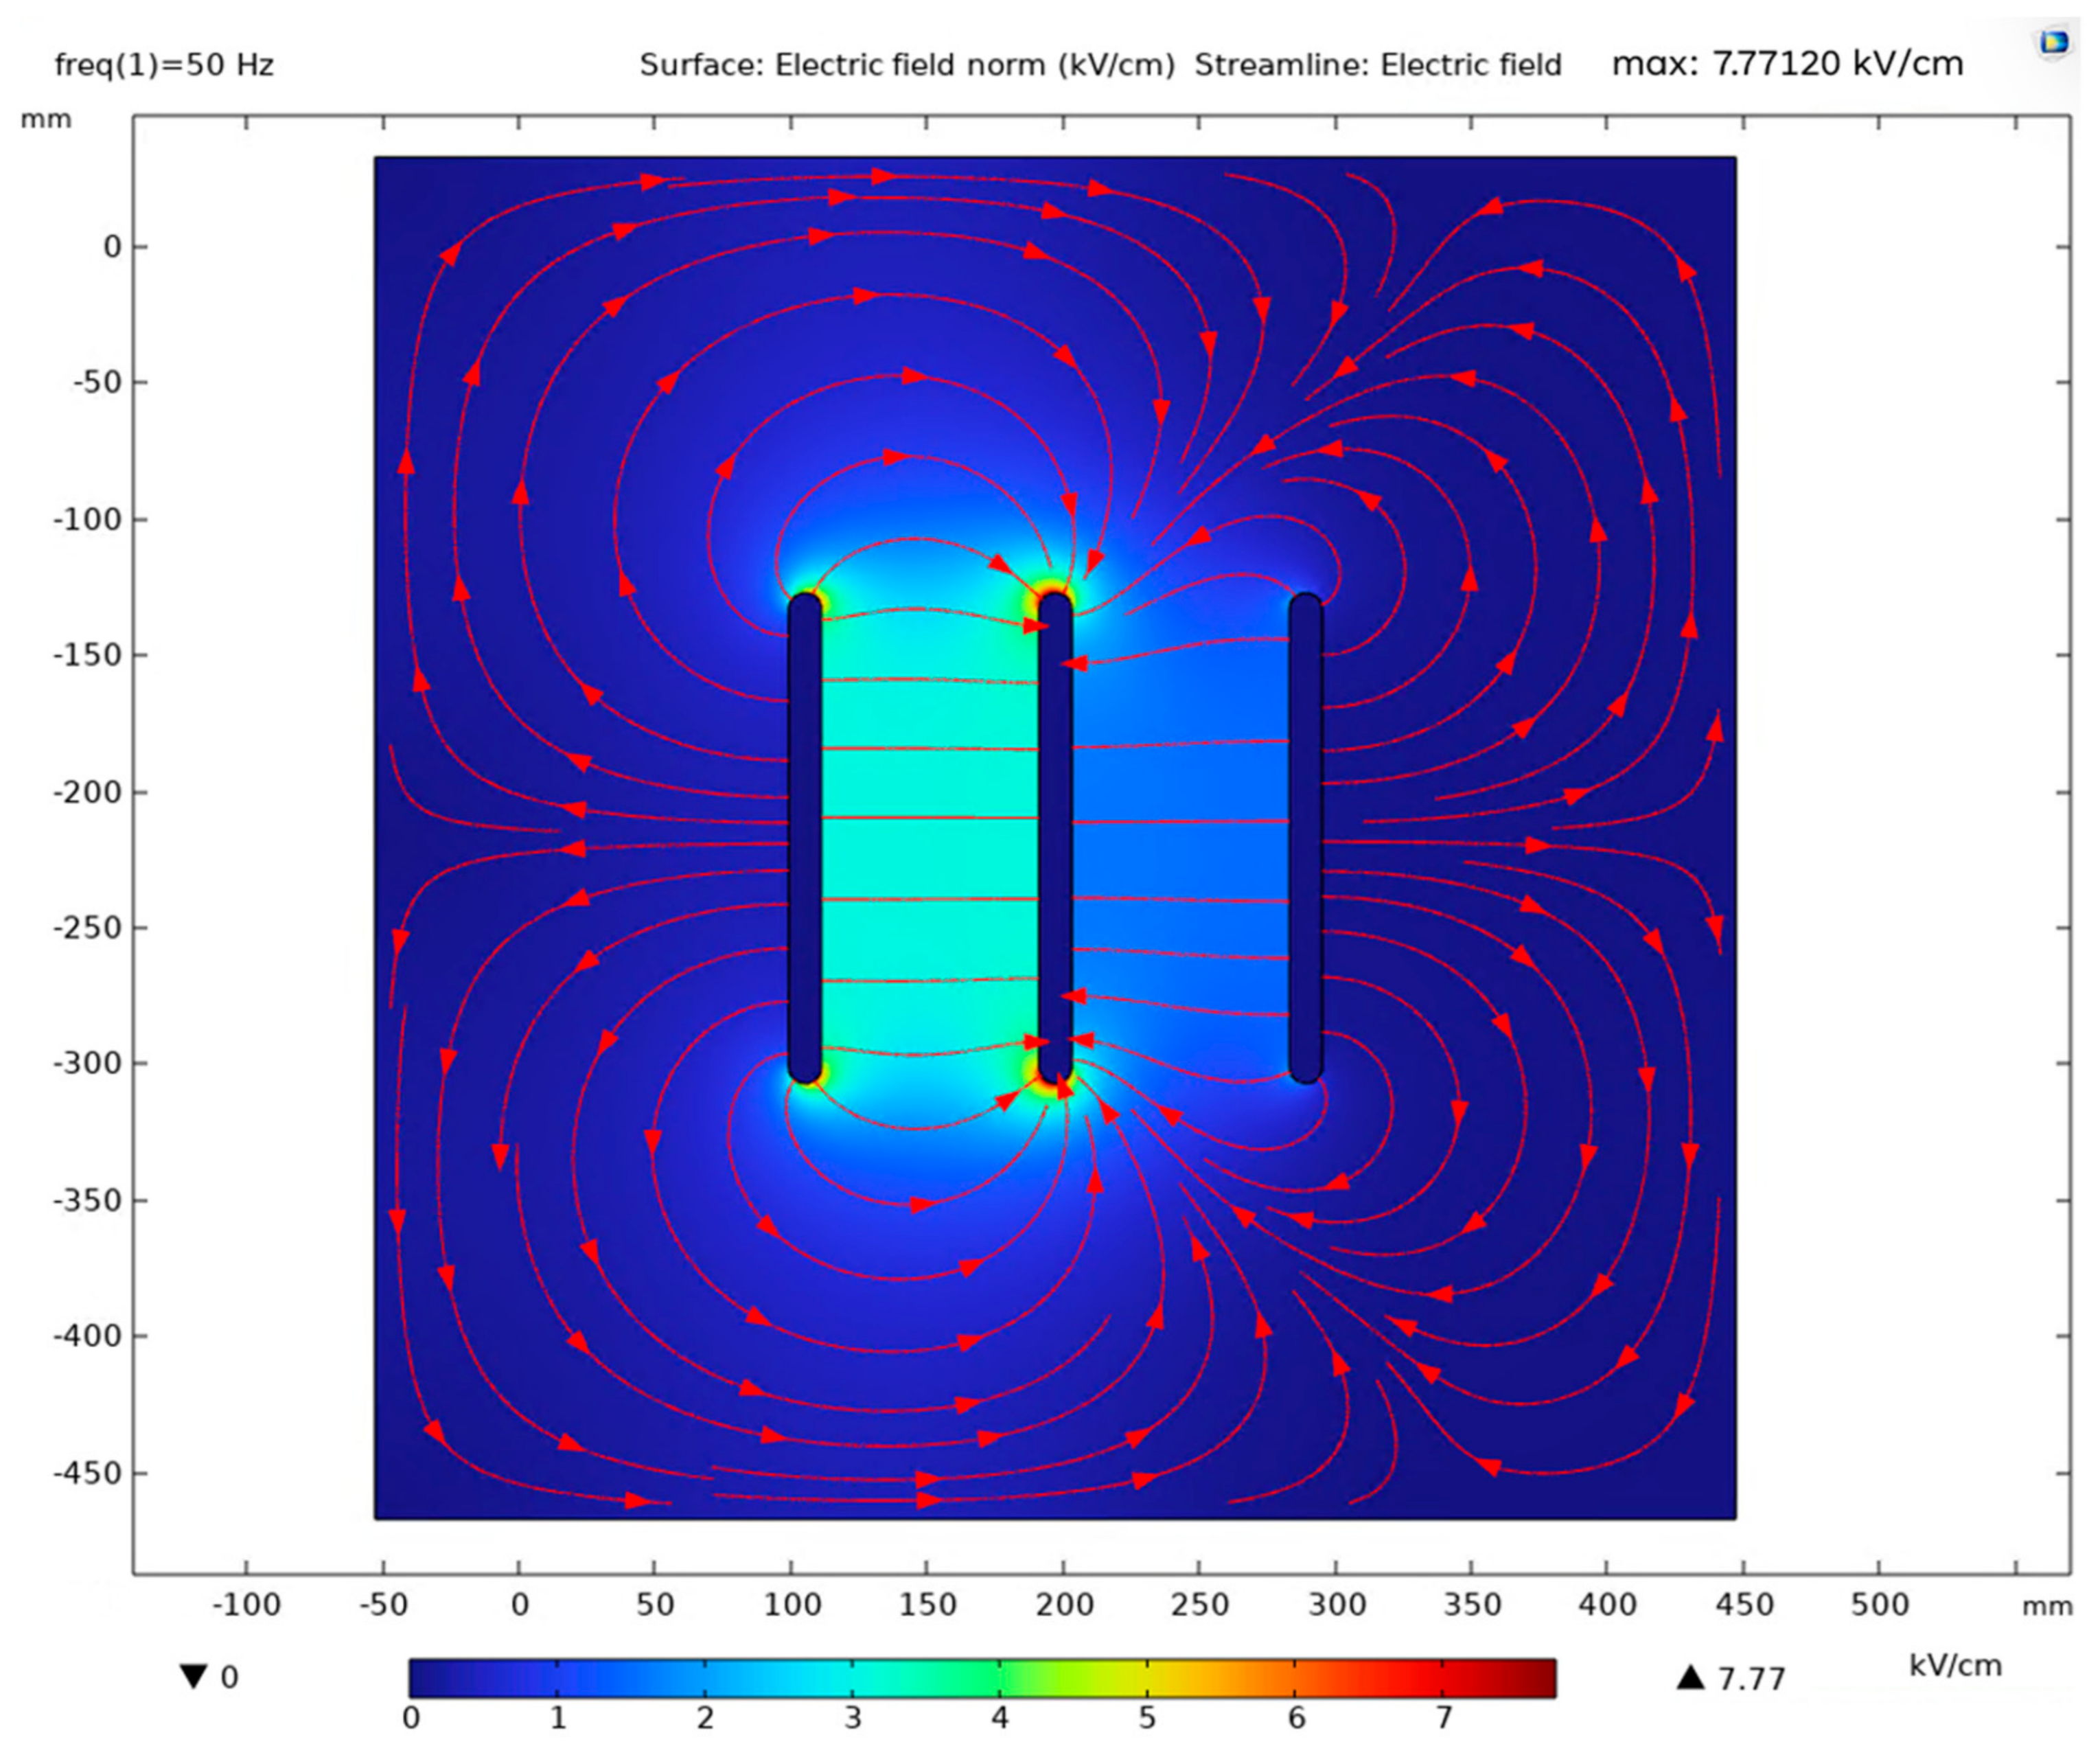
Figure 3 models the electrostatic behavior of rectangular copper conductors (CU-12 × 180 mm) operating under the rated 17.5 kV condition. In this arrangement, with the surface-to-surface clearance maintained at 8 cm, the distribution of electrical stress on the conductor surfaces is depicted. The color contour and streamlines clearly illustrate the inter-phase field interaction across the air clearance. According to the simulation data, the maximum electric field intensity observed in the system was calculated as 7.7712 kV/cm. This localized peak is again concentrated at the curved edges of the conductors. Doubling the thickness from 6 mm (r = 3 mm) to 12 mm (r = 6 mm) noticeably alleviates the corner field gradient, yielding a peak value well below the macroscopic 30 kV/cm air breakdown limit and ensuring an enhanced dielectric safety margin.
Figure 3.
Electrostatic Simulation of CU-12 × 180 mm Conductor Geometry.
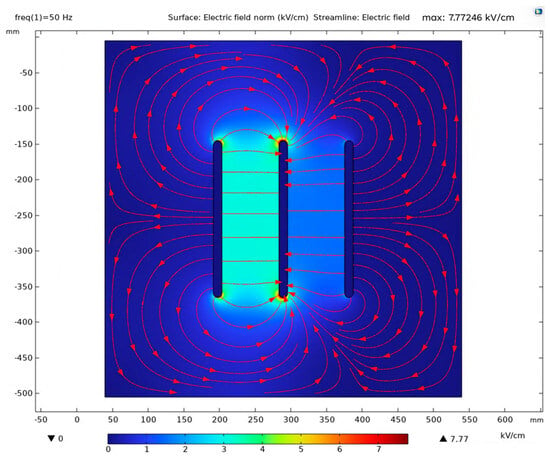
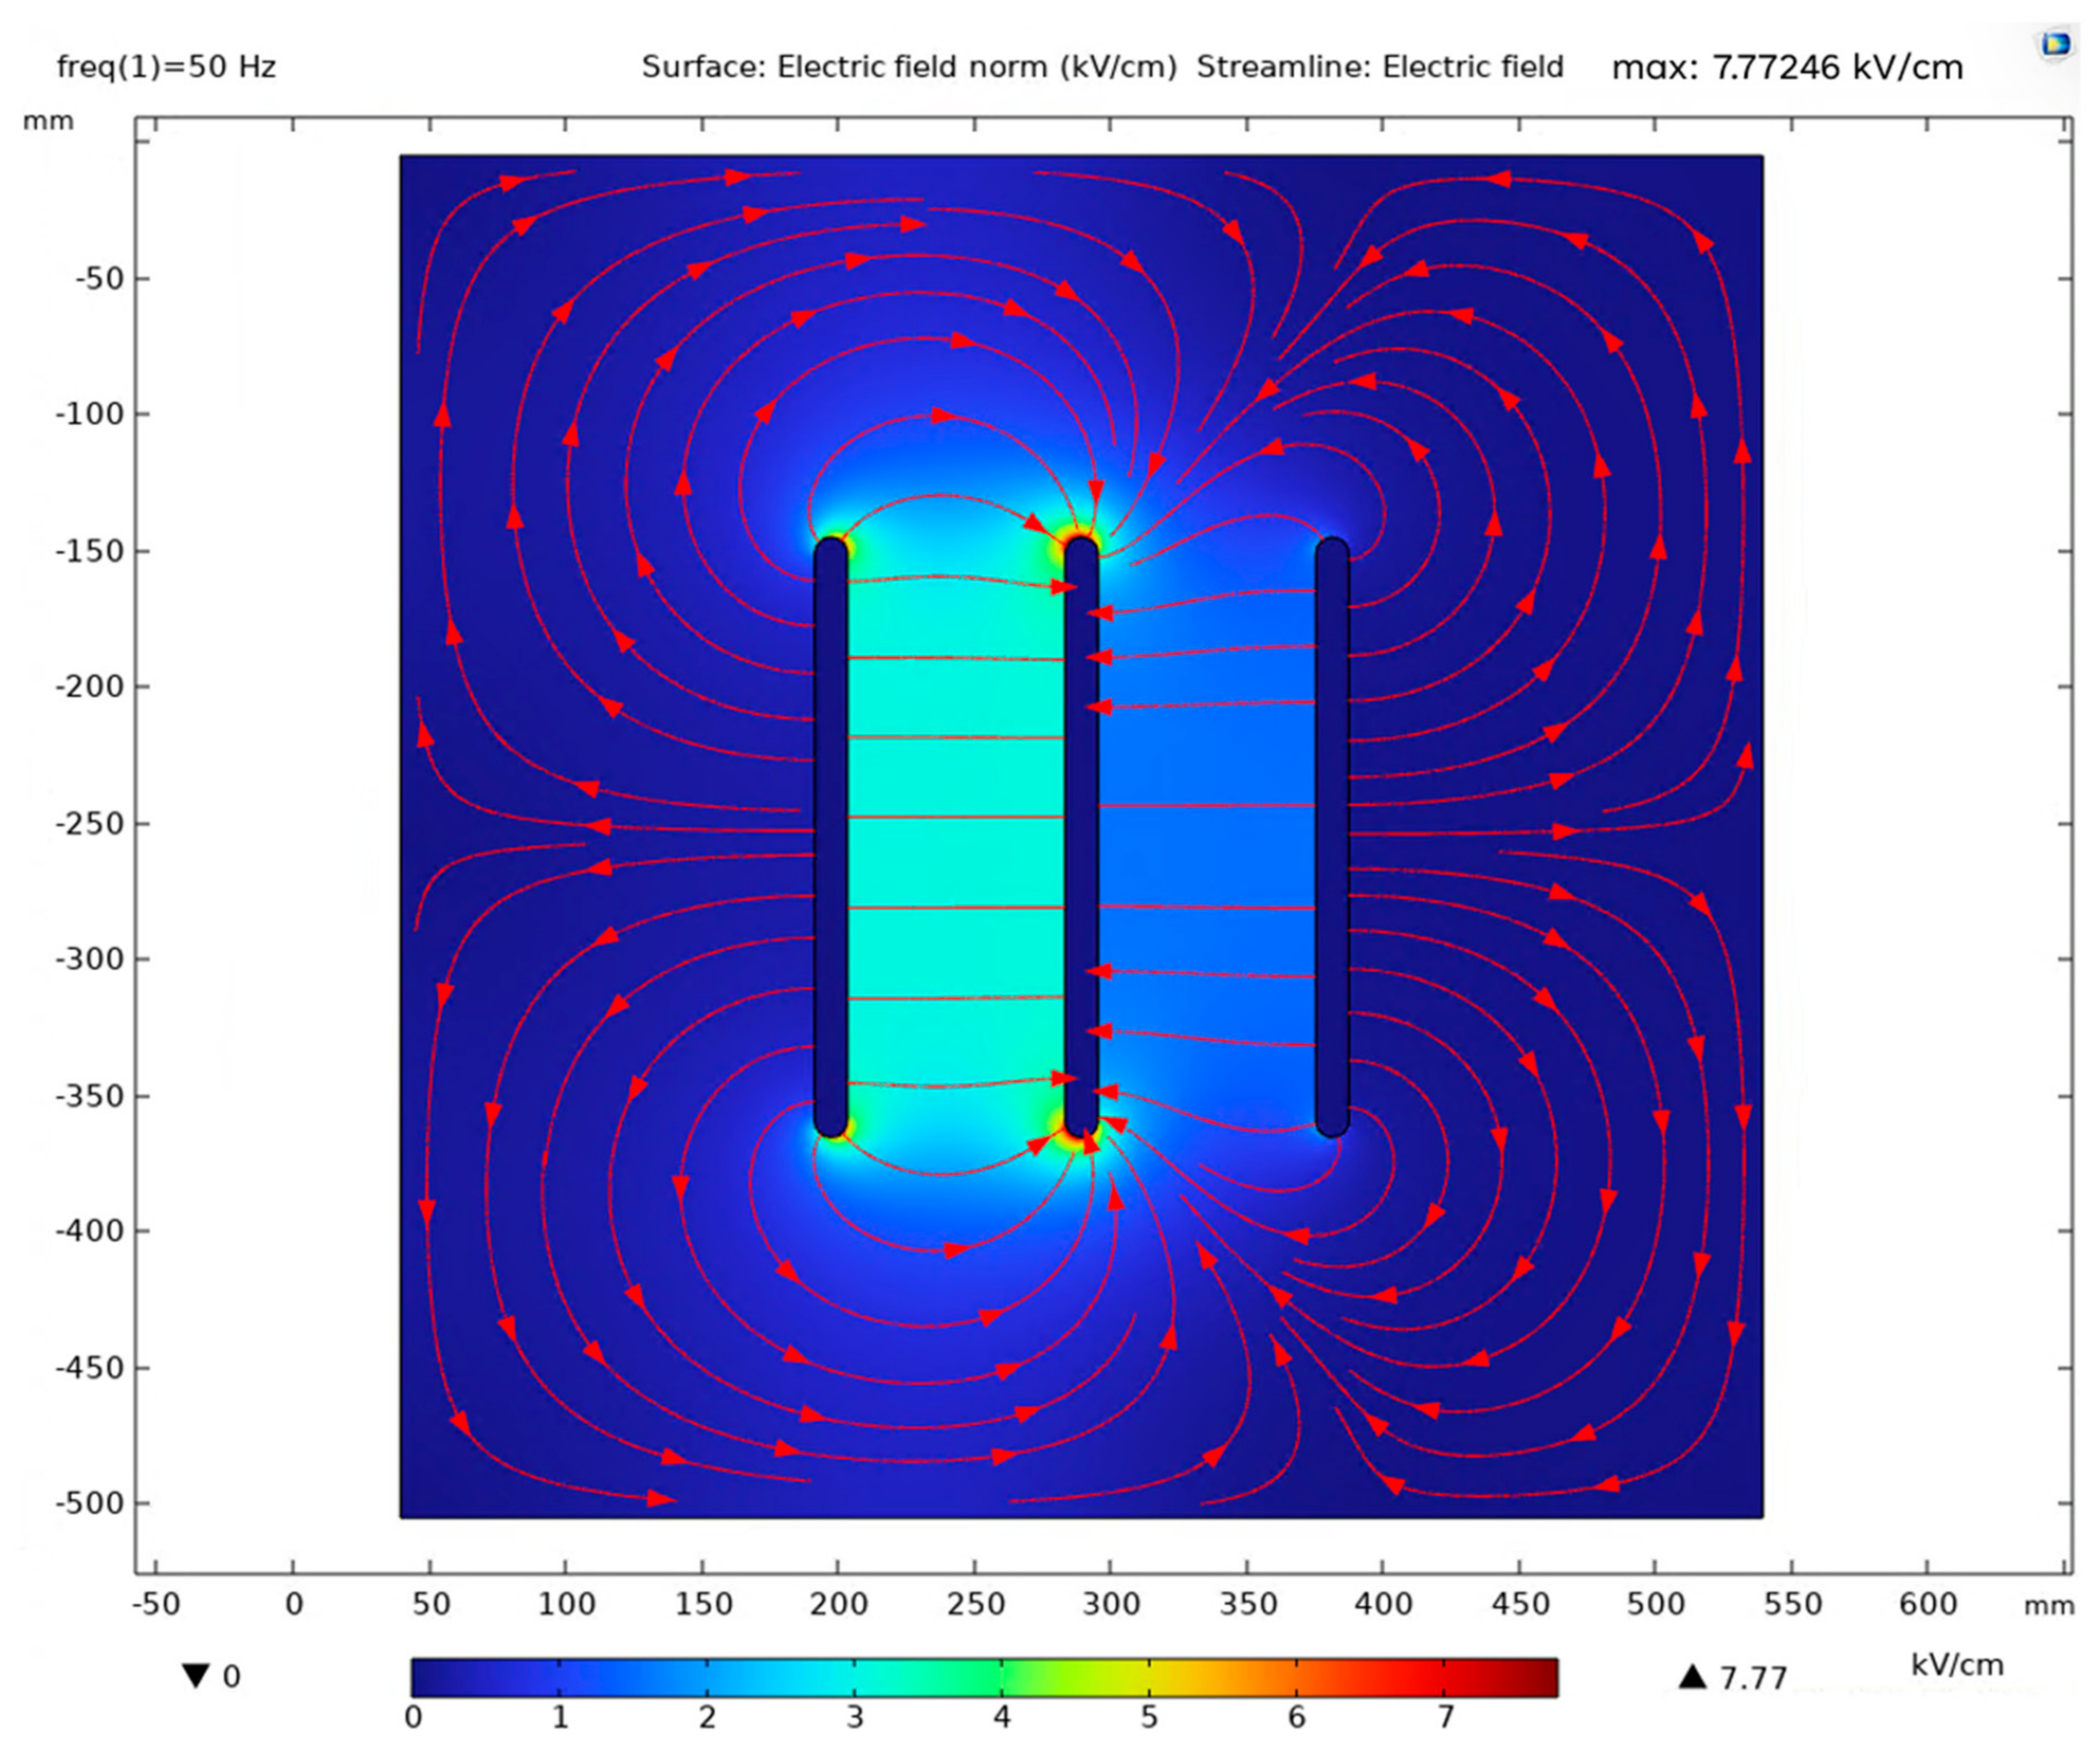
Figure 4 presents the finite element analysis output showing the electric field distribution created by rectangular copper conductors with a cross-section of 12 × 220 mm. According to the numerical findings, the maximum electric field intensity detected in the configuration was measured as 7.7725 kV/cm. Compared to the 12 × 180 mm geometry (7.7712 kV/cm), increasing the conductor height while maintaining identical thickness (12 mm) and edge radius (r = 6 mm) keeps the peak electric field intensity at an almost identical level. This behavior demonstrates that once edge radius is kept constant, extending conductor height has a negligible impact on suppressing local edge stress. The maximum field remains concentrated along the rounded edge transitions, and the peak of 7.77 kV/cm remains safely below the critical air breakdown threshold.
Figure 4.
Electrostatic Simulation of CU-12 × 220 mm Conductor Geometry.
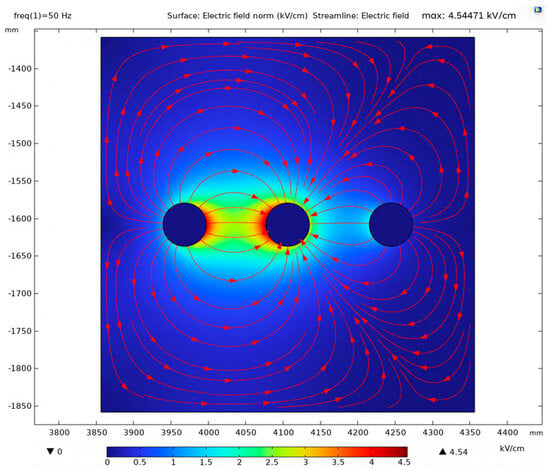
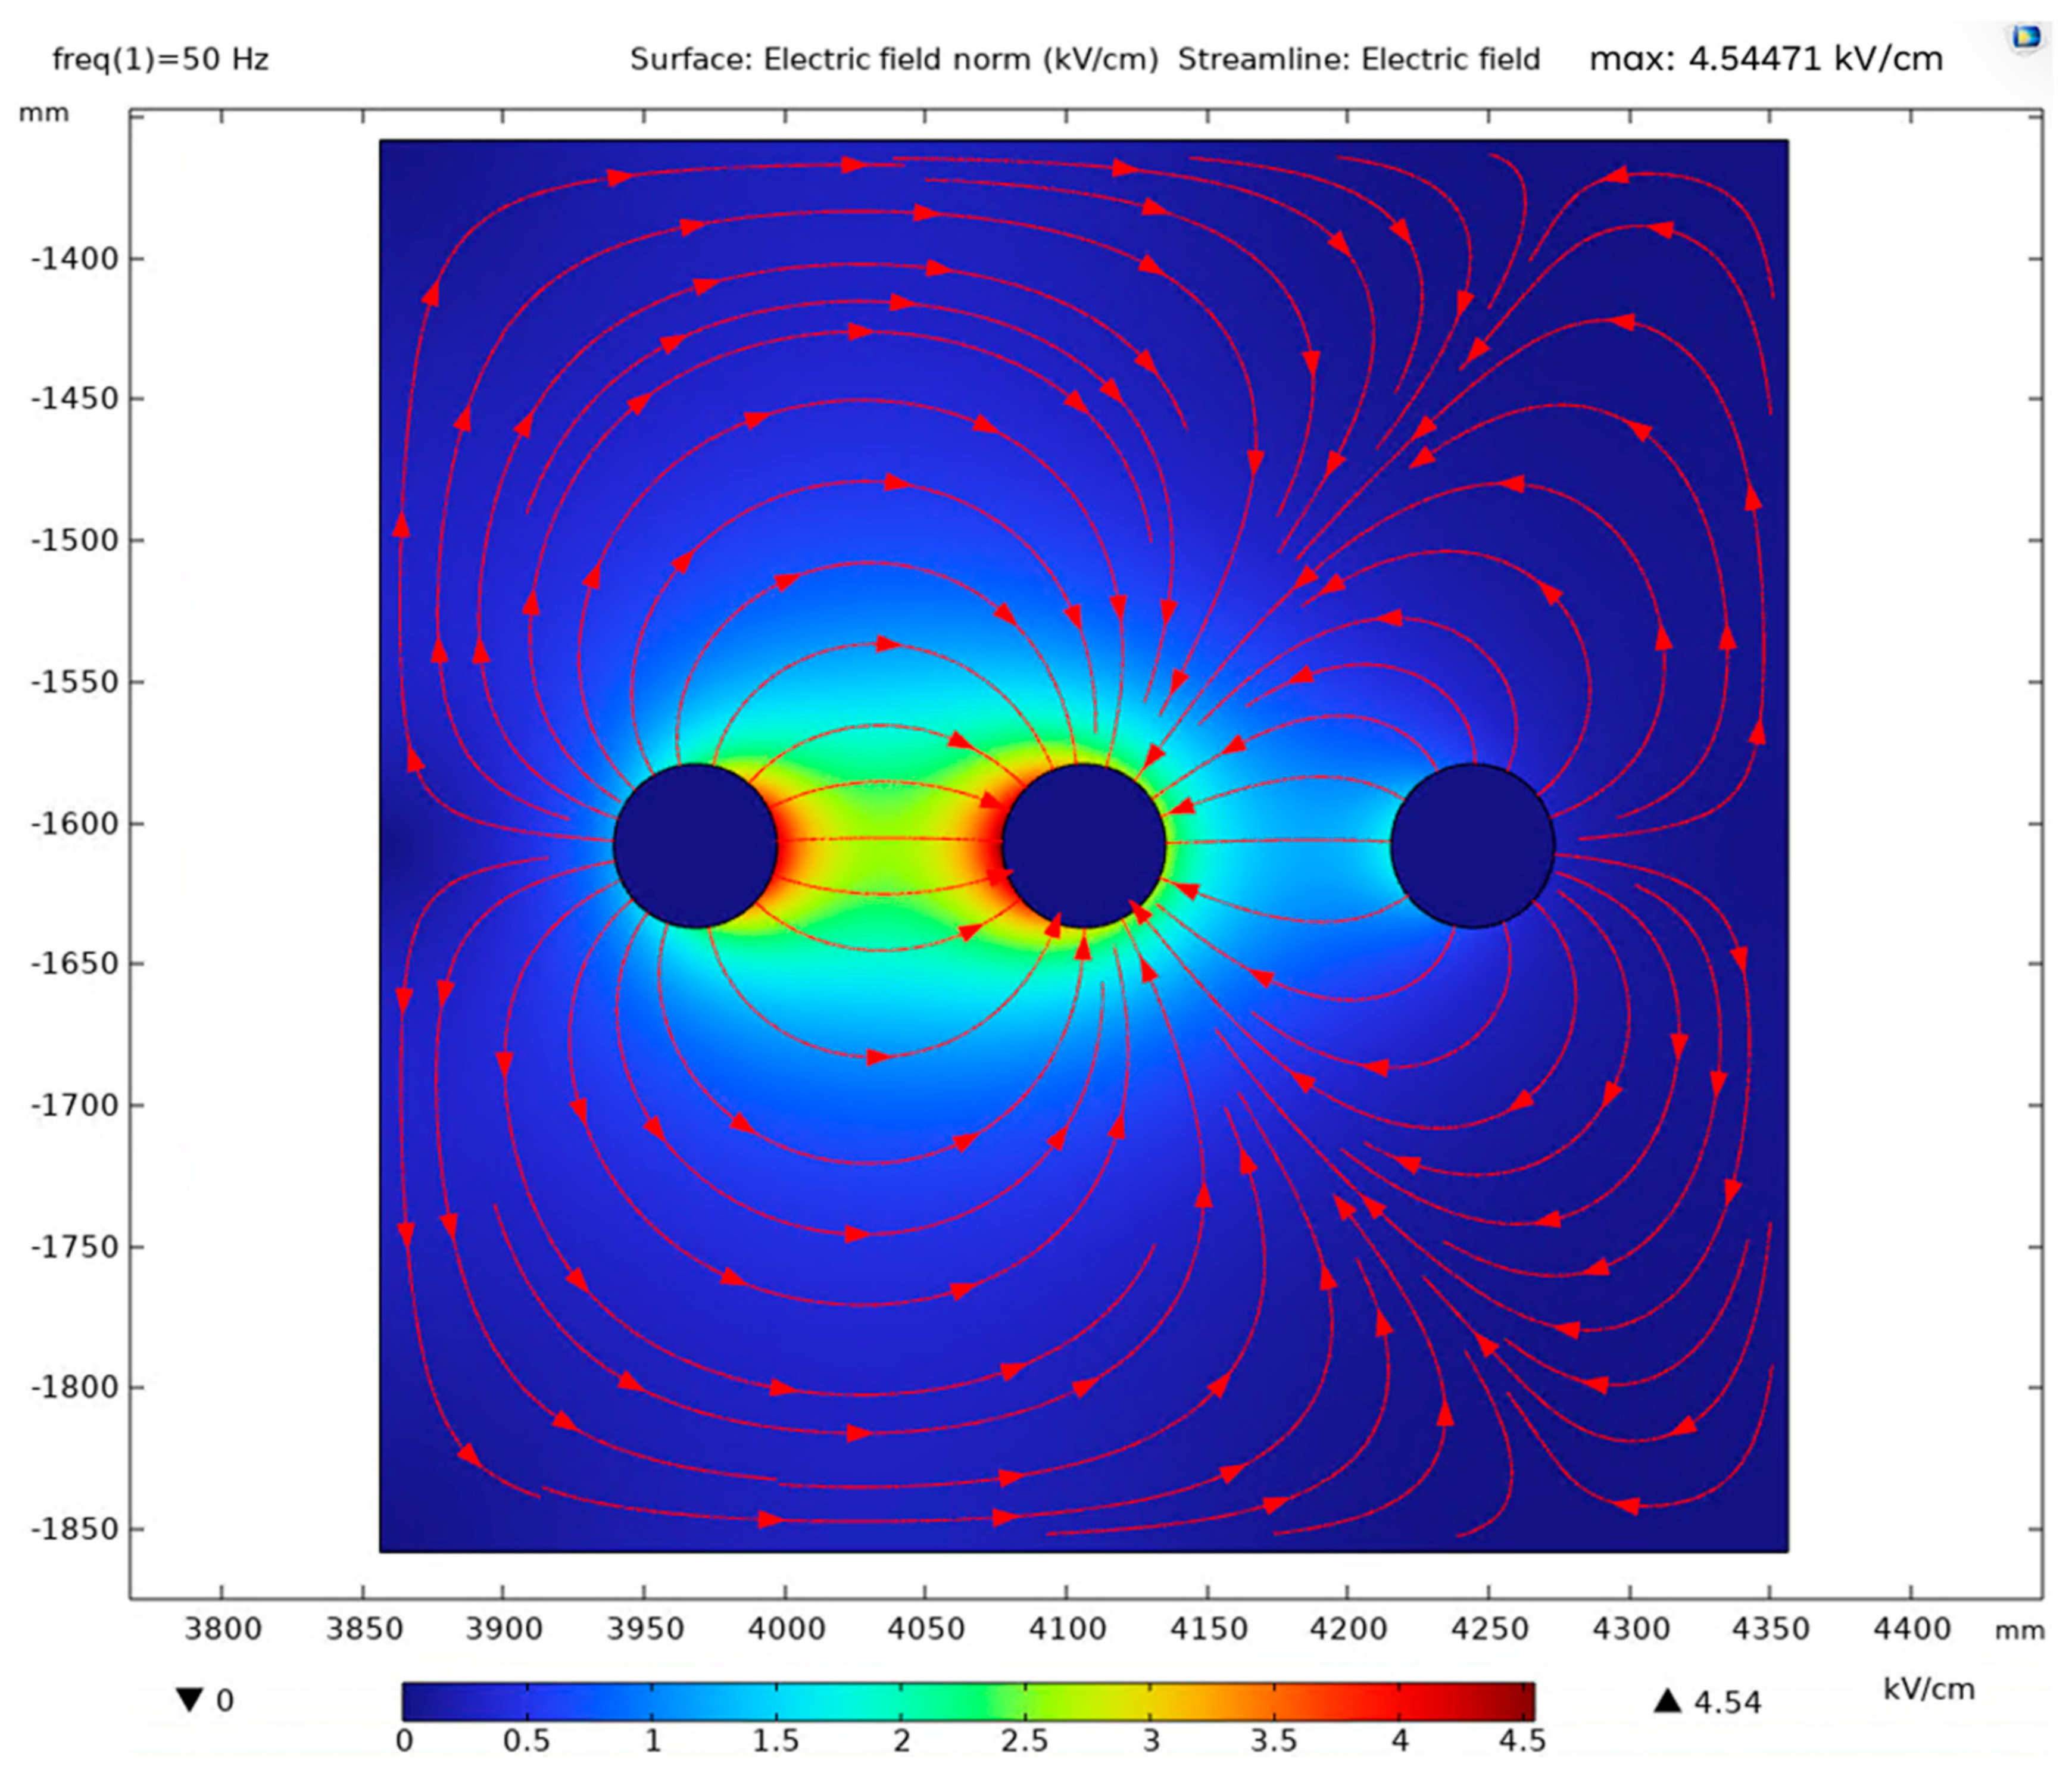
In Figure 5, where the surface-to-surface clearance is strictly maintained at 8 cm, the equal-area cylindrical geometry ensures a significantly more uniform and balanced distribution of electric field lines along the conductor perimeter. The streamlines radiate outward continuously from the conductor boundaries. According to the simulation data, the maximum electric field intensity was calculated as 4.5447 kV/cm. Compared to the rectangular counterpart analyzed in Figure 4 (7.7725 kV/cm), the cylindrical profile reduces peak electrical stress by approximately 41.5%. This notable attenuation is governed by the complete elimination of localized edge transitions and the uniform charge distribution across the continuous cylindrical boundary. Operating at 4.54 kV/cm substantially widens the dielectric safety buffer relative to the 30 kV/cm ionization threshold, markedly mitigating partial discharge risk.
Figure 5.
Electrostatic Simulation of CU-12 × 220 mm Equivalent Cylindrical Conductor Geometry.
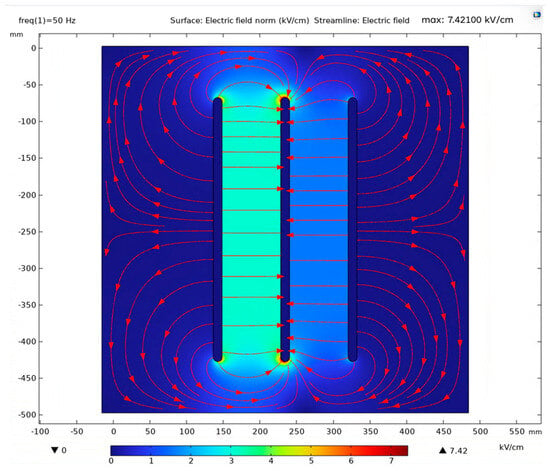
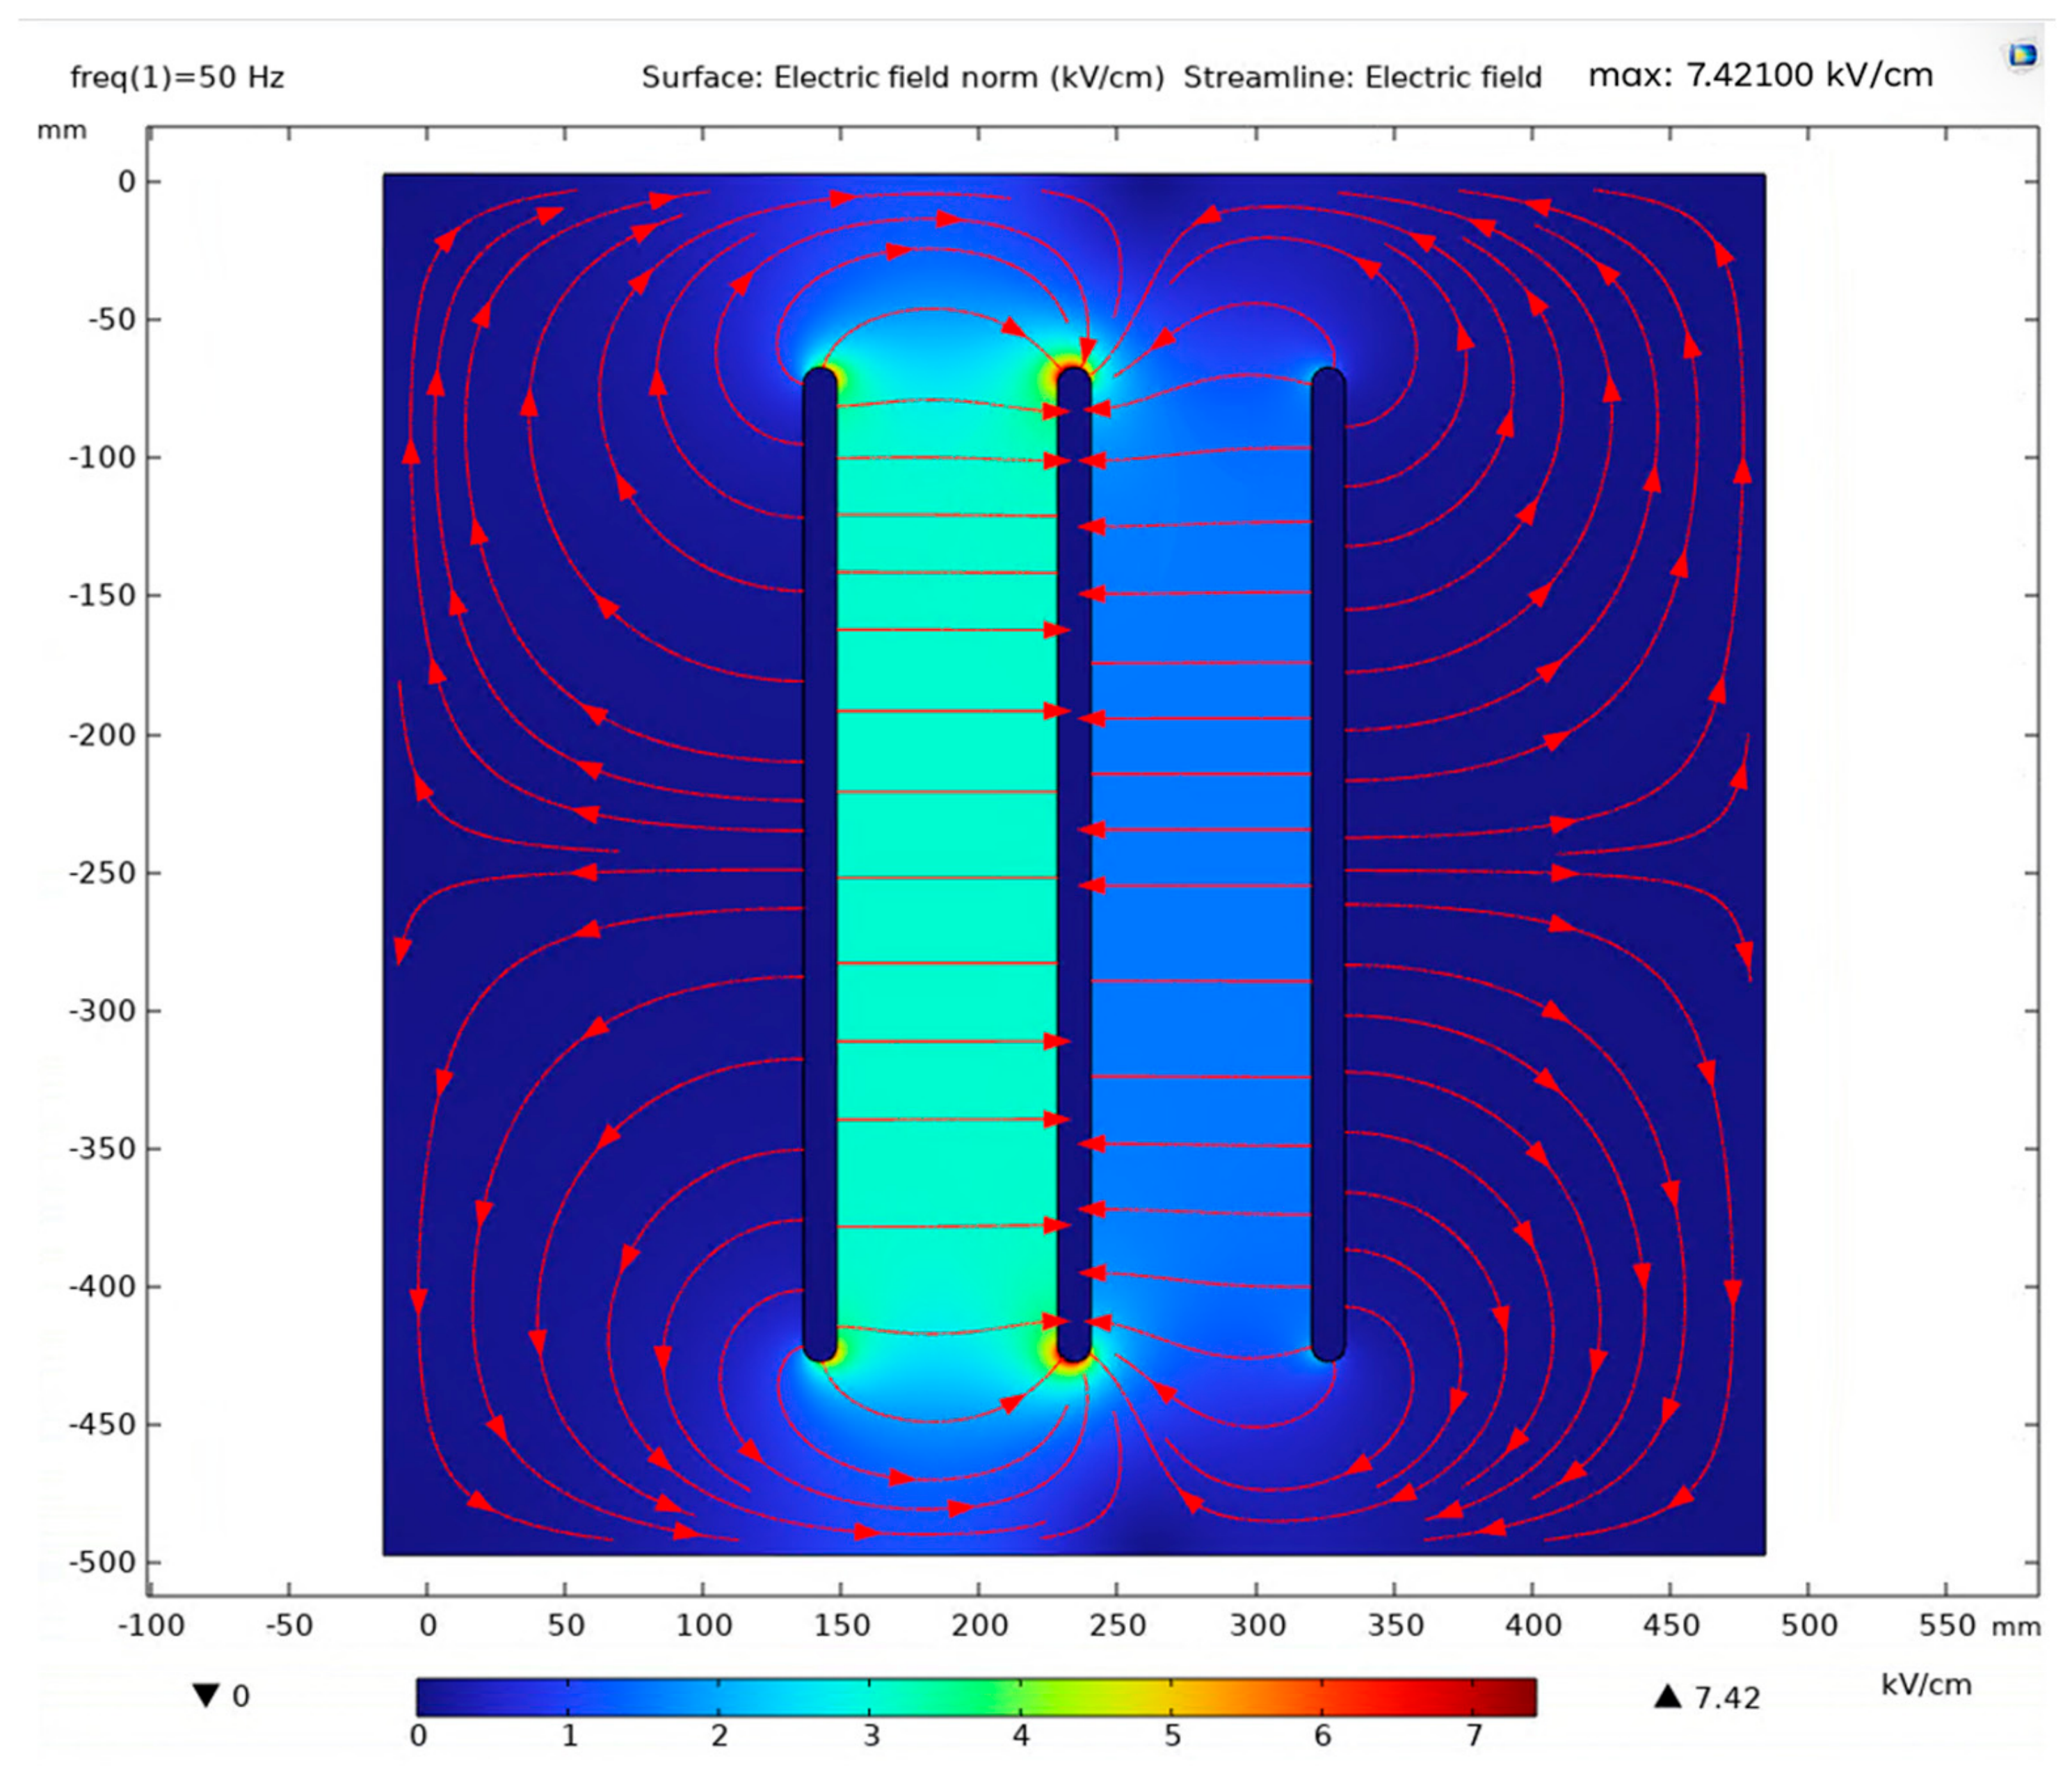
Figure 6 displays the electrical behavior of large cross-section rectangular copper conductors (12 × 360 mm). According to the simulation results, the maximum electric field intensity was recorded as 7.4210 kV/cm. Widening the conductor to 360 mm distributes surface charges over an enlarged peripheral area, which marginally alleviates peak stress compared to narrower 12 mm profiles (7.77 kV/cm). However, this reduction remains modest (approximately 4.5%) because the corner radius (r = 6 mm) remains unchanged. The peak field of 7.42 kV/cm operates comfortably within the dielectric withstand limits of atmospheric air.
Figure 6.
Electrostatic Simulation of CU-12 × 360 mm Conductor Geometry.
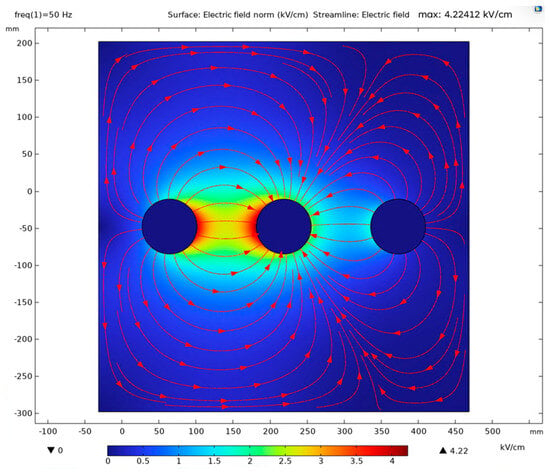
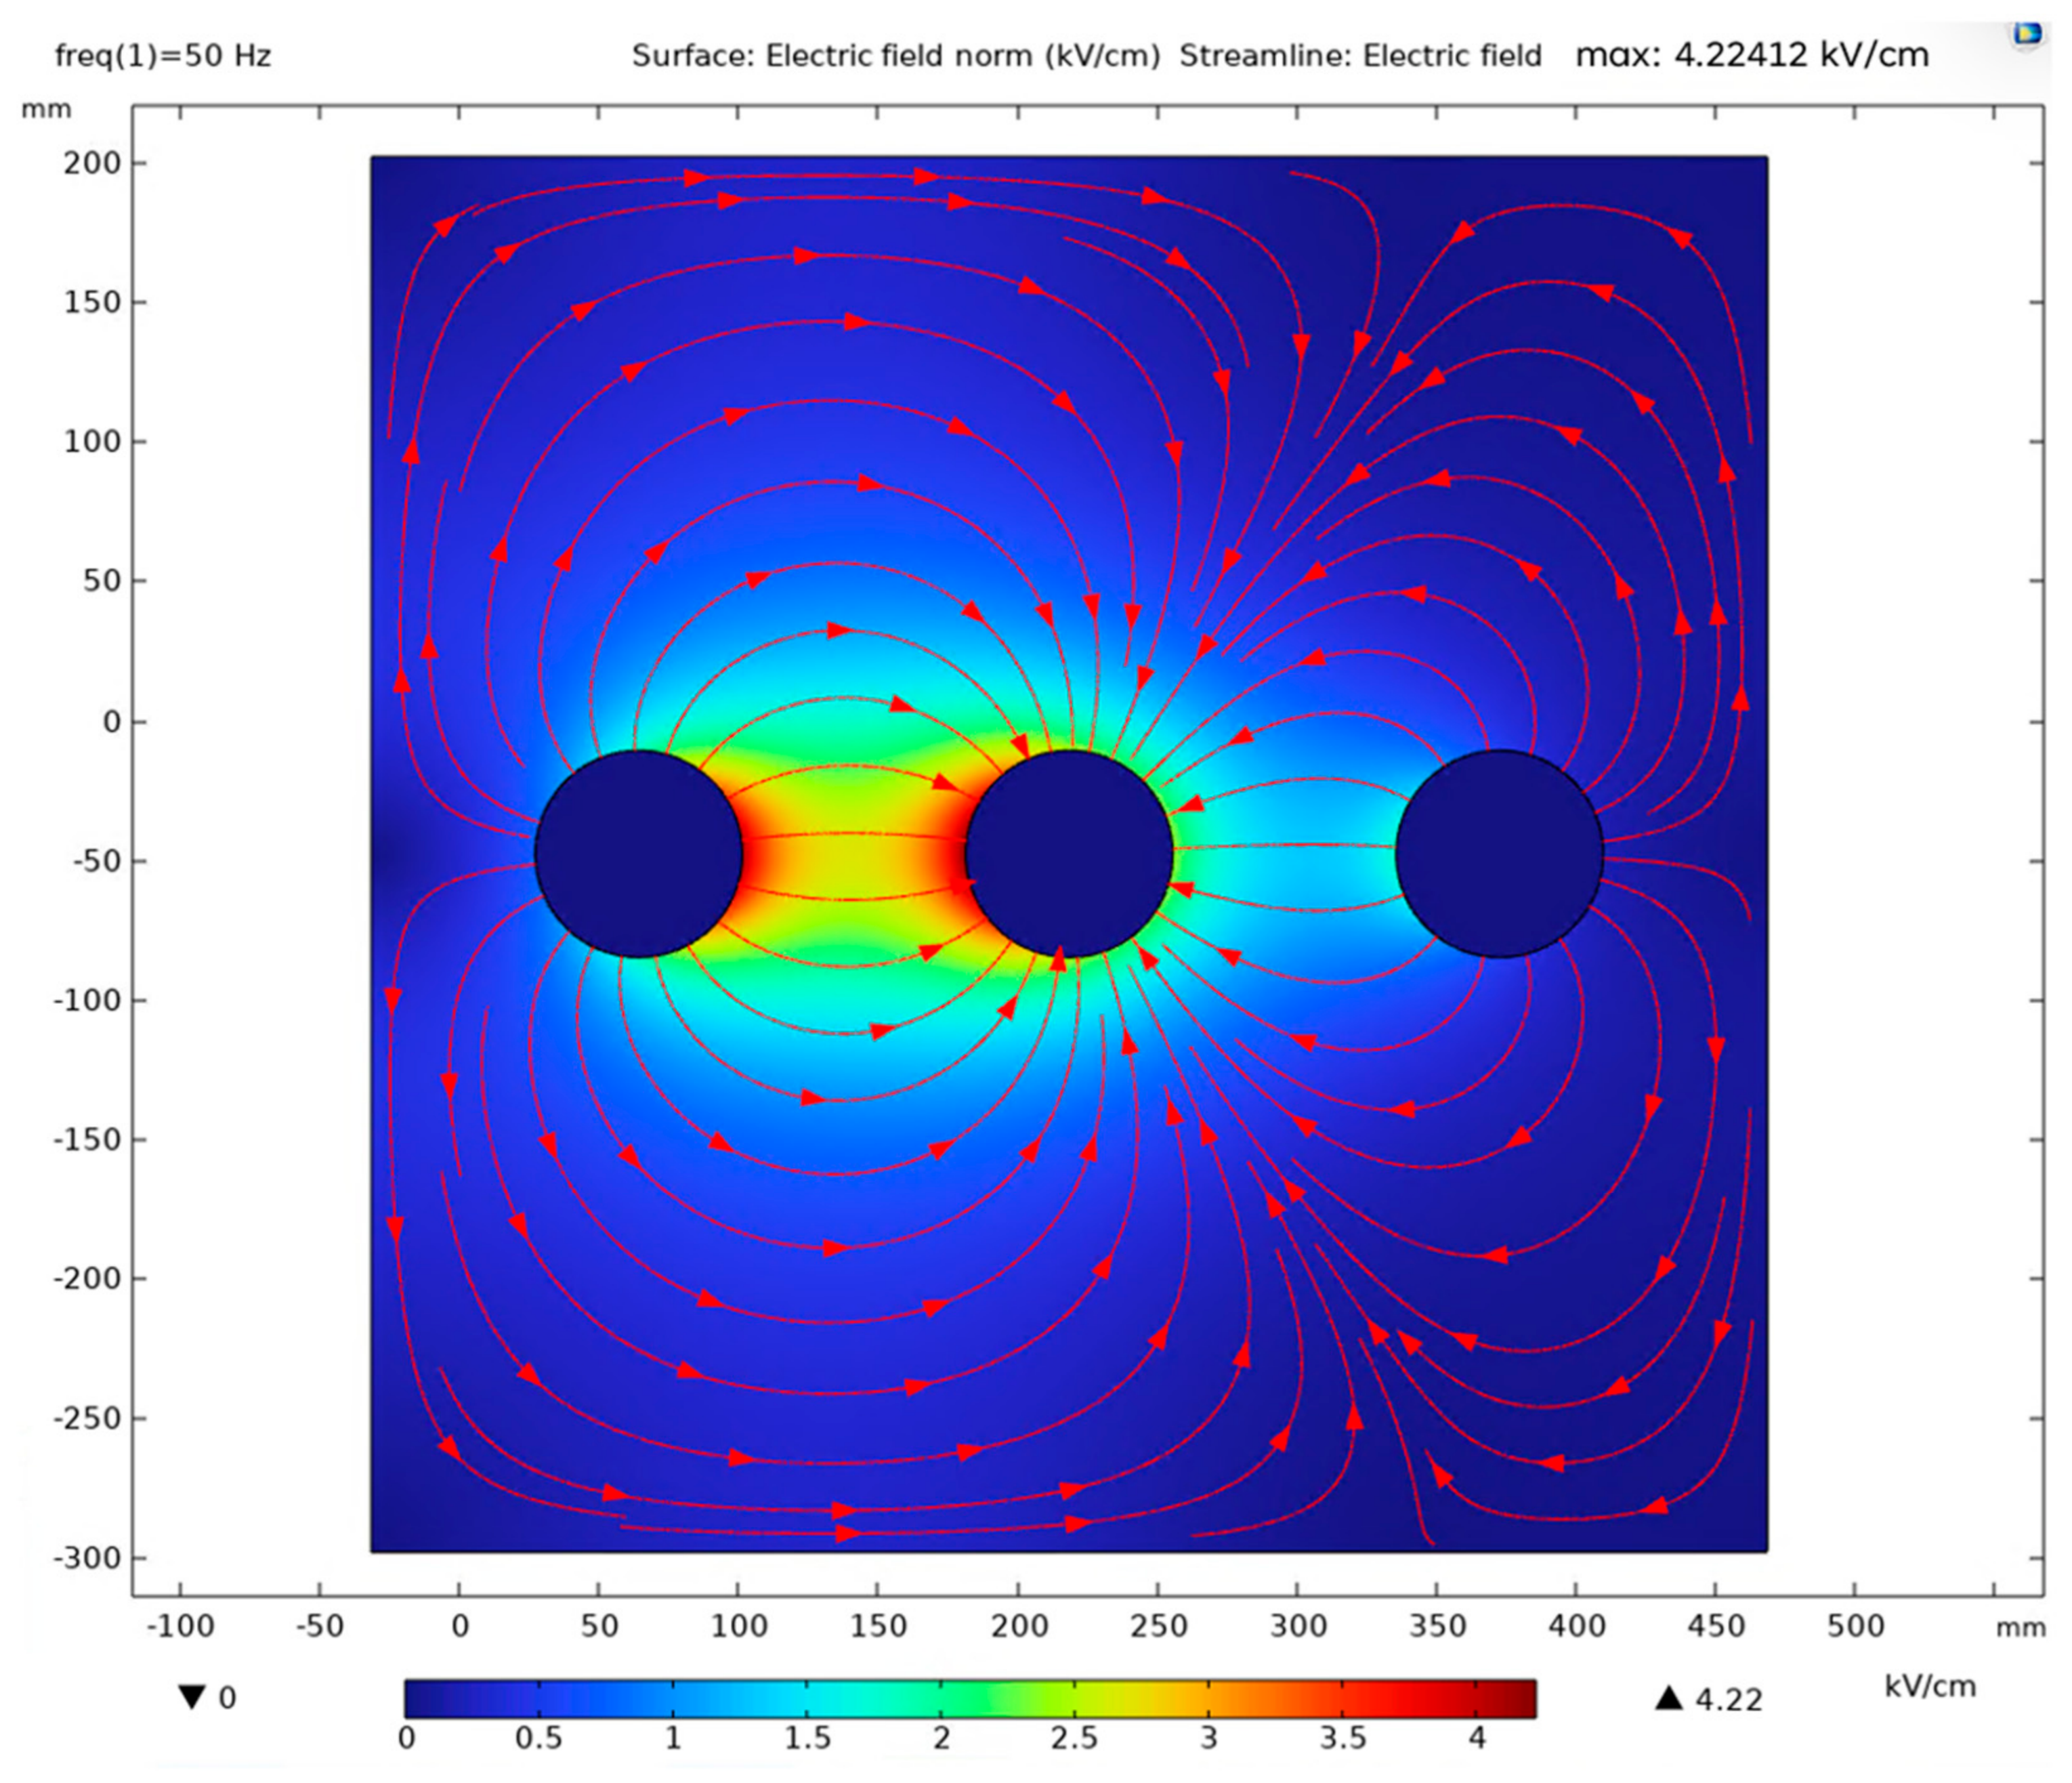
Figure 7 illustrates the electrostatic field distribution for equal-area cylindrical conductors corresponding to the 12 × 360 mm cross-section (A = 4320 mm2) with an identical 8 cm surface-to-surface air gap. The continuous circular boundary yields an exceptionally smooth and symmetrical field profile. The simulation results indicate a maximum electric field strength of 4.2241 kV/cm, representing the lowest peak stress among all investigated models. Eliminating geometric edge discontinuities alongside the large cylindrical radius (R ≈ 37.08 mm) suppresses localized charge accumulation. Compared to the breakdown limit of 30 kV/cm, this operating level of 4.22 kV/cm provides an exceptional dielectric safety buffer against surface corona discharge and air ionization.
Figure 7.
Electrostatic Simulation of CU-12 × 360 mm Equivalent Cylindrical Conductor Geometry.
5. Discussion
Beyond the evaluation of peak field values, a deeper comparative analysis reveals significant differences in the dielectric stress distribution mechanisms governed by conductor geometry. In rectangular cross-sections, the local field intensification at the rounded edges creates steep field gradients, lowering the overall field utilization factor (η). For instance, although the nominal cross-sectional area increases fourfold from 1080 mm2 (CU-6 × 180 mm) to 4320 mm2 (CU-12 × 360 mm), the maximum electric field only decreases from 10.90 kV/cm to 7.42 kV/cm, indicating that cross-sectional enlargement alone has a limited effect on suppressing edge stress. In contrast, transitioning to an equivalent cylindrical geometry eliminates edge-curvature transitions entirely, redistributing the surface charge density uniformly and reducing the peak field stress to 4.22 kV/cm. This geometric transformation expands the dielectric safety margin relative to the critical air breakdown threshold (30 kV/cm) from approximately 63.7% in thin rectangular bars to over 85.9% in cylindrical equivalents, substantially lowering the probability of localized micro-ionization and long-term insulation degradation.
To further understand the parametric sensitivity of electrostatic stress, the interactions between conductor aspect ratio (w/h), total cross-sectional area, and geometric profile were comparatively analyzed. Increasing the conductor height from 180 mm to 360 mm while keeping a constant thickness of 12 mm doubled the cross-sectional area, yet reduced the maximum electric field stress by merely 4.5% (from 7.77 kV/cm to 7.42 kV/cm). This confirms that dimensional scaling of rectangular profiles yields diminishing returns in dielectric stress relief due to the persistent edge curvature concentration (r = 6 mm). In contrast, adopting a cylindrical form at equivalent area reduced the field intensity by over 43.1% (from 7.42 kV/cm down to 4.22 kV/cm). These parametric observations indicate that the geometric contour factor exerts a far more dominant influence on dielectric safety than raw conductor cross-sectional sizing in medium-voltage busbar designs.
The underlying physical mechanism responsible for mitigating the maximum electric field by over 40% in cylindrical conductors lies in the fundamental relationship between surface curvature and electrostatic charge density [18,19]. According to classical electrostatic theory, the localized surface charge density (σ) on a conductor is directly proportional to its local curvature (κ = 1/r) [22,34]. In standard rectangular profiles, the localized edge-radiused boundary (r = w/2) concentrates charge accumulation relative to the broader flat faces, producing pronounced localized field peaks [18,22]. Conversely, a cylindrical conductor presents a continuous, constant-curvature boundary across its entire perimeter [19,34]. This constant curvature allows free electrical charges to distribute themselves symmetrically and uniformly along the outer surface, entirely eliminating localized stress concentrations and resulting in a marked mitigation in peak electric field intensity under identical voltage conditions [18,34].
It is also essential to interpret these numerical findings within the context of practical manufacturing baselines through classical analytical formulations. In commercial switchgear manufacturing, extruded copper busbar surfaces inherently feature standard fabrication tolerances and baseline surface roughness (Ra ≈ 1.6 − 3.2 μm) resulting from industrial extrusion dies. Rather than representing localized physical specimen erosion or post-discharge surface degradation, these standard microscopic surface deviations are evaluated in high-voltage engineering via an analytical empirical surface condition factor (m). In accordance with standard Peek’s formulations, ideal polished electrodes exhibit m = 1.0, whereas typical commercial extruded copper busbars correspond to an analytical derating range of m ≈ 0.82 − 0.90, which derates the effective macroscopic air breakdown threshold to Ecrit,eff = m ⋅ Ecrit ≈ 24.6–27.0 kV/cm. Under this analytical surface consideration, rectangular profiles (exhibiting peak fields up to 10.90 kV/cm) experience an adjusted dielectric safety margin of 55.7%, maintaining acceptable operational withstand under continuous operating voltage but requiring careful shielding against transient surges. Conversely, equivalent cylindrical conductors (operating at Emax ≈ 4.22–4.54 kV/cm) maintain an analytical safety margin exceeding 81 − 83%, demonstrating that the cylindrical contour provides an inherent dielectric buffer capable of accommodating standard manufacturing roughness without initiating localized partial discharge.
Thermal conditions inside enclosed medium-voltage switchgear also interact directly with dielectric performance. Under continuous full-load operating conditions, conductor Joule heating elevates the internal compartment temperature from the 20 °C baseline up to the maximum standardized operating limit of T = 65 °C (in accordance with IEC 62271-1 allowable temperature rise limits). According to gas discharge physics, an increase in air temperature reduces the relative air density factor (), decreasing δ from 1.0 at 20 °C down to approximately 0.867 at 65 °C. This thermal expansion reduces the effective critical air breakdown threshold from 30.0 kV/cm to Ecrit(T) ≈ 26.0 kV/cm. Even under this thermally derated breakdown threshold, the equivalent cylindrical profile (Emax = 4.22 kV/cm) preserves an exceptional dielectric safety margin of 83.8%, whereas the standard CU-6 × 180 mm rectangular conductor (Emax = 10.90 kV/cm) maintains a safety margin of 58.1%. This demonstrates that the geometric advantage of rounded and cylindrical profiles remains fundamentally robust against operational thermal variations.
To establish a rigorous baseline benchmark, this study intentionally focused on the intrinsic inter-phase dielectric behavior governed purely by conductor cross-sectional geometry, adopting an isolated computational domain with non-interacting far boundaries. However, two operational factors in practical medium-voltage switchgear warrant consideration. Firstly, Middle-Phase Peak Excitation: When the central conductor reaches peak potential with outer conductors at opposite polarity, the middle conductor experiences simultaneous bilateral dielectric stress across both clearance gaps. While this bilateral stress primarily affects field symmetry across the central air gap, the fundamental relative advantage demonstrated by cylindrical geometries—namely, suppressing localized edge curvature concentration—remains identical regardless of phase excitation order. Secondly, Earthed Enclosures (Switchgear Chassis): In commercial switchgear compartments, the presence of grounded metal sidewalls introduces phase-to-earth capacitance and electric field lines directed toward the enclosure walls, particularly for the outer phases. Depending on compartment compactness and enclosure clearance, this ground plane can induce secondary localized stress peaks on the outer conductor faces. Consequently, while the findings presented here establish fundamental design rules for inter-phase clearance optimization, final compartment engineering must integrate 3D ground enclosure boundaries and middle-phase peak verification during the physical design stage.
6. Conclusions
In this study, the influences of conductor cross-sectional geometry on electrostatic field distribution and insulation safety margins in air-insulated medium-voltage (MV) busbar systems were systematically benchmarked using finite element numerical modeling under a rated 17.5 kV voltage level. The obtained numerical findings provide quantitative design data demonstrating that profile geometry serves as an effective design parameter in controlling electrical stress concentrations and extending partial discharge (PD) inception safety margins in medium-voltage equipment.
The simulation analyses demonstrate that standard rectangular conductors experience notable electric field intensification at their curved edge boundaries. For a standard rectangular conductor of CU-6 × 180 mm, the peak electric field strength reaches 10.90 kV/cm at the rounded edges of the conductors. Although expanding the rectangular cross-sectional area to CU-12 × 360 mm marginally alleviates stress density to 7.42 kV/cm, this reduction remains strictly limited because the localized edge curvature effect persists. In stark contrast, transitioning to an equivalent cylindrical conductor profile of identical cross-sectional area and material properties eliminates geometric discontinuities entirely, resulting in an exceptionally uniform surface charge distribution and drastically reducing the maximum electric field to 4.22 kV/cm. This geometric transformation expands the dielectric safety margin against standard atmospheric air breakdown (30 kV/cm) from approximately 63.7% in thin rectangular bars to over 85.9% in cylindrical structures. Consequently, adopting optimized corner curvatures or cylindrical busbar profiles presents a robust strategy for effectively mitigating localized air ionization, suppressing surface corona discharge, and supporting the dielectric operational life of MV switchgear assemblies.
Quantitatively correlating the local field stress with the macroscopic air ionization threshold (Ecrit ≈ 30 kV/cm under NTP conditions) reveals that for the CU-6 × 180 mm rectangular conductor, a theoretical voltage escalation to approximately 48.2 kV (rms) is required to trigger local air breakdown at the rounded edges. In stark contrast, for the equivalent cylindrical geometry with Emax = 4.22 kV/cm, the theoretical partial discharge inception voltage (VPDIV) is pushed beyond 124.3 kV (rms), providing an exceptionally robust dielectric margin against operational overvoltages and premature insulation degradation.
Specifically, for medium-voltage switchgear design where conductor cross-sectional area is fixed by continuous current-carrying ampacity requirements, prioritizing cylindrical profiles or maximizing edge rounding radii over conventional sharp rectangular geometries is strongly recommended. From a practical manufacturing standpoint, increasing edge rounding radii represents an accessible and effective engineering measure to mitigate localized air ionization risks and support partial discharge suppression.
From an industrial design perspective, the insights established in this research provide actionable guidelines for developing compact and reliable air-insulated switchgear (AIS) and busbar trunking systems. While mitigating peak electric field stresses through geometry optimization theoretically provides greater design flexibility for compact compartment layouts, any physical reduction of phase-to-phase and phase-to-ground clearance distances must be strictly qualified. Practical switchgear clearances are primarily governed by standardized type-test requirements—most notably lightning impulse withstand voltage (95 kV BIL for 17.5 kV equipment per IEC 62271-1)—as well as electromagnetic electrodynamic forces under peak short-circuit currents. Therefore, geometric field mitigation should be considered an internal safety buffer enhancement rather than a standalone justification for bypassing standardized clearance limits. As future work, the macro-scale 2D electrostatic methodology established herein will be extended toward full 3D parametric electrostatic modeling of longitudinal terminations and joints, coupled CFD-thermal multiphysics simulations, and experimental high-voltage laboratory validation involving partial discharge inception measurements and optical corona imaging.
Author Contributions
Conceptualization, C.C.U.; Methodology, C.C.U., H.A. and B.D.; Software, H.A. and A.C.Y.; Validation, H.A. and A.C.Y.; Investigation, C.C.U.; Writing—original draft, H.A., A.C.Y. and B.D.; Writing—review and editing, B.D.; Supervision, C.C.U. and B.D. All authors have read and agreed to the published version of the manuscript.
Funding
This research received no external funding.
Data Availability Statement
The original contributions presented in this study are included in the article. Further inquiries can be directed to the corresponding authors.
Acknowledgments
The authors wish to extend their sincere appreciation to EAE Electric Inc. for the technical assistance and kind support provided during this study.
Conflicts of Interest
Authors Ahmet Can Yalcin and Huseyin Akdemir were employed by the company EAE Electric Inc. The remaining authors declare that the research was conducted in the absence of any commercial or financial relationships that could be construed as a potential conflict of interest.
References
- Koehler, N.; Hari, S. Breakthrough Overhead Line Design (BOLD): System and Performance Considerations; American Electric Power: Columbus, OH, USA, 2016. [Google Scholar]
- Ghassemi, M. High Surge Impedance Loading (HSIL) Lines: A Review Identifying Opportunities, Challenges, and Future Research Needs. IEEE Trans. Power Deliv. 2019, 34, 1909–1924. [Google Scholar] [CrossRef] [Scilit]
- Zhou, H.; Qiu, W.; Sun, K.; Chen, J.; Deng, X.; Qian, F.; Wang, D.; Zhao, B.; Li, J.; Li, S.; et al. Ultra-High Voltage AC/DC Power Transmission; Springer: Berlin/Heidelberg, Germany, 2017. [Google Scholar] [CrossRef] [Scilit]
- Lu, R.; Li, C.; Yu, J.; Li, C.; Li, W.; He, X. Modeling and Design of Insulation Structure for High Power Density Medium Voltage High-Frequency Transformers. IEEE J. Emerg. Sel. Top. Power Electron. 2023, 11, 6005–6015. [Google Scholar] [CrossRef] [Scilit]
- Aziz, E.; Aouabed, F.; Abdellah, H.; Dineva, A. Case Study: Optimizing Grading Ring Design for High Voltage Polymeric Insulators in Power Transmission Systems for Enhanced Electric Field and Voltage Distribution by Using a Finite Element Method. Energies 2023, 16, 5235. [Google Scholar] [CrossRef] [Scilit]
- Li, L.; Li, Q.; Xu, S.; Liu, R.; Dong, M.; Ying, S.; Tian, J.; Xin, W.; Haddad, M.; Jiang, X. Electric Field Improvement for High-Voltage Bushings. Polymers 2022, 15, 40. [Google Scholar] [CrossRef] [Scilit] [PubMed]
- Liao, Z.; Xu, J.; Wan, B.; Gan, Z.; Wang, Y.; Li, N.; Liu, Y.; Long, T. Finite Element Analysis of Total Electric Field Distribution on the Roof of Flat-roofed Buildings Near HVDC Lines. Electr. Eng. 2023, 105, 1153–1162. [Google Scholar] [CrossRef] [Scilit]
- Ahsan, M.; Baharom, M.N.R.; Zainal, Z.; Khalil, I.U. Measuring and Simulation of Magnetic Field Generated by High Voltage Overhead Transmission Lines. Results Eng. 2024, 23, 102688. [Google Scholar] [CrossRef] [Scilit]
- Bahrman, M.; Johnson, B. The ABCs of HVDC Transmission Technologies. IEEE Power Energy Mag. 2007, 5, 32–44. [Google Scholar] [CrossRef] [Scilit]
- Samy, M.M. Computation of Electromagnetic Fields Around HVDC Transmission Line Tying EGYPT and KSA. In Proceedings of the 2017 Nineteenth International Middle East Power Systems Conference (MEPCON), Cairo, Egypt, 19–21 December 2017; pp. 1276–1280. [Google Scholar] [CrossRef] [Scilit]
- Duhaini, I. The Effects of Electromagnetic Fields on Human Health. Phys. Med. 2016, 32, 213. [Google Scholar] [CrossRef] [Scilit]
- Wang, X.; Wang, C.C.; Wu, K.; Tu, D.M.; Liu, S.; Peng, J.K. An Improved Optimal Design Scheme for High Voltage Cable Accessories. IEEE Trans. Dielectr. Electr. Insul. 2014, 21, 5–15. [Google Scholar] [CrossRef]
- Metwally, I.A.; Al-Badi, A.H.; Al-Hinai, A.S.; Al Kamali, F.; Al-Ghaithi, H. Influence of Design Parameters and Defects on Electric Field Distributions Inside MV Cable Joints. In Proceedings of the 2016 18th Mediterranean Electrotechnical Conference (MELECON), Lemesos, Cyprus, 18–20 April 2016; pp. 1–6. [Google Scholar] [CrossRef] [Scilit]
- Chang, D.D.; Sudarshan, T.S.; Thompson, J.E. Analysis of Electric Stress Distribution in Cavities Embedded Within Dielectric Structures. IEEE Trans. Electr. Insul. 1986, EI-21, 213–219. [Google Scholar] [CrossRef] [Scilit]
- Hossam-Eldin, A.A.; Dessouky, S.S.; El-Mekkawy, S.M.; Abd El-Aal, R.A. Analysis and Simulation of Field Distribution in Micro Cavities in Solid Insulating Materials. In Proceedings of the 2007 Annual Report-Conference on Electrical Insulation and Dielectric Phenomena, Vancouver, BC, Canada, 14–17 October 2007; pp. 792–796. [Google Scholar] [CrossRef] [Scilit]
- Gouda, O.E.; Dein, A.Z.E.; El-Gabalawy, M.A.H. Effect of Electromagnetic Field of Overhead Transmission Lines on the Metallic Gas Pipe-lines. Electr. Power Syst. Res. 2013, 103, 129–136. [Google Scholar] [CrossRef] [Scilit]
- Gao, S.; Zhu, H.; Zhang, B.; Song, G. Modeling and Simulation Analysis of Hybrid Bipolar HVDC System Based on LCC-HVDC and VSC-HVDC. In Proceedings of the 2018 IEEE 3rd Advanced Information Technology, Electronic and Automation Control Conference (IAEAC), Chongqing, China, 12–14 October 2018; pp. 1448–1452. [Google Scholar] [CrossRef] [Scilit]
- Kuffel, E.; Zaengl, W.S.; Kuffel, J. High Voltage Engineering Fundamentals, 2nd ed.; Butterworth-Heinemann: Oxford, UK, 2000. [Google Scholar] [CrossRef] [Scilit]
- Arora, R.; Mosch, W. High Voltage and Electrical Insulation Engineering; Wiley-IEEE Press: Hoboken, NJ, USA, 2011. [Google Scholar] [CrossRef] [Scilit]
- Wadhwa, C.L. High Voltage Engineering, 3rd ed.; New Age International: New Delhi, India, 2010. [Google Scholar]
- Naidu, M.S.; Kamaraju, V. High Voltage Engineering, 5th ed.; Tata McGraw-Hill: New Delhi, India, 2013. [Google Scholar]
- Abdel-Salam, M.; Anis, H.; El-Morshedy, A.; Radwan, R. High-Voltage Engineering: Theory and Practice, 2nd ed.; Marcel Dekker: New York, NY, USA, 2000. [Google Scholar]
- Yuan, Z.; Yuan, Z.; Wang, Y.; Emon, A.I.; Wang, Z.; Narayanasamy, B.; Deshpande, A.; Peng, H.; Luo, F. Insulation Design and Optimization of Laminated Busbar for More Electric Aircraft Motor Drive under High Altitude and Depressurized Environments. In Proceedings of the 2020 AIAA/IEEE Electric Aircraft Technologies Symposium (EATS), New Orleans, LA, USA, 26–28 August 2020; pp. 1–9. [Google Scholar] [CrossRef] [Scilit]
- Yuan, Z.; Wang, Y.; Wang, Z.; Emon, A.I.; Luo, F.; Huitink, D. Insulation and Switching Performance Optimization for Partial-Discharge-Free Laminated Busbar in More-Electric Aircraft Applications. IEEE Trans. Power Electron. 2021, 37, 6831–6843. [Google Scholar] [CrossRef] [Scilit]
- Yuan, Z.; Wang, Y.; Wang, Z.; Emon, A.I.; Peng, H.; Hassan, M.; Narayanasamy, B.; Luo, F. Design of Partial-discharge-free Busbar for More-electric Aircraft Application with Low Pressure Condition. In Proceedings of the 2021 IEEE Applied Power Electronics Conference and Exposition (APEC), Phoenix, AZ, USA, 14–17 June 2021; pp. 1178–1182. [Google Scholar] [CrossRef] [Scilit]
- Montanari, G.; Ghosh, R.; Ramin, R.; Nath, D. Insulating Material Development for the Design of Standoff Insulators Fed by Hybrid Voltage. Materials 2022, 15, 5307. [Google Scholar] [CrossRef] [Scilit] [PubMed]
- Ding, C.; Wang, Z.; Li, J.; Ding, Y. Structural Optimization Design of Three Phase Enclosed GIS Disconnector Based on MOGOA and ELM. IEEJ Trans. Electr. Electron. Eng. 2024, 19, 156–165. [Google Scholar] [CrossRef] [Scilit]
- Salhi, R.; Mekhaldi, A.; Teguar, M.; Kherif, O. Corona Ring Improvement to Surface Electric Field Stress Mitigation of 400 kV Composite Insulator. IEEE Trans. Dielectr. Electr. Insul. 2024, 31, 1509–1516. [Google Scholar] [CrossRef] [Scilit]
- Montanari, G.C.; Cambareri, P. PD-Free Design of Insulation Systems: An Application to Laminated Busbars. Appl. Sci. 2024, 14, 10171. [Google Scholar] [CrossRef] [Scilit]
- Tatkan, A.; Ozbek, S.A.; Togay, A.; Aladag, O.; Duzkaya, H.; Taplamacioglu, M.C. Electrical Field Optimization with Field Regulator in Medium Voltage Switchgears Busbar Connection. In Proceedings of the 2025 26th International Middle East Power Systems Conference (MEPCON), Cairo, Egypt, 13–15 January 2025; pp. 1–6. [Google Scholar] [CrossRef] [Scilit]
- Zheng, L.; Peng, P.; Shao, W.; Liu, X. Research on Optimization of Busbar Structure for 40.5kV Switchgear. In Proceedings of the 2025 5th International Conference on Machine Manufacturing and Intelligent Control (ICMMIC), Guangzhou, China, 24–26 April 2025; pp. 48–51. [Google Scholar] [CrossRef] [Scilit]
- Zhang, C.; An, R.; Yang, C.; Li, Z.; Liu, J.; Wang, Y. Analysis of Busbar-insulator Mounted Air Gap Electric Field Based on Three-dimensional Parametric Modeling. In Proceedings of the 20th International Conference on AC and DC Power Transmission (ACDC 2024), Shanghai, China, 12–15 July 2024; pp. 317–322. [Google Scholar] [CrossRef] [Scilit]
- Korthauer, B.; Biela, J. A Generalized Framework for Medium-Frequency Transformer Insulation Design: Case Study on Air Insulation. IEEE Trans. Power Electron. 2026, 41, 2345–2358. [Google Scholar] [CrossRef] [Scilit]
- Kind, D.; Kärner, H. High-Voltage Insulation Technology: Textbook for Electrical Engineers; Vieweg: Braunschweig, Germany, 1985. [Google Scholar]
- Uydur, C.C.; Arikan, O.; Kalenderli, O. The Effect of Insulation Defects on Electric and Magnetic Field Distributions in Power Cables. Teh. Vjesn. 2021, 28, 1152–1160. [Google Scholar] [CrossRef] [Scilit]
Disclaimer/Publisher’s Note: The statements, opinions and data contained in all publications are solely those of the individual author(s) and contributor(s) and not of MDPI and/or the editor(s). MDPI and/or the editor(s) disclaim responsibility for any injury to people or property resulting from any ideas, methods, instructions or products referred to in the content. |
© 2026 by the authors. Licensee MDPI, Basel, Switzerland. This article is an open access article distributed under the terms and conditions of the Creative Commons Attribution (CC BY) license.