


Abstract
Blast dust in open-pit mines can diverge from mist coverage when fog-cannon settings rely on ground-level observations. This study evaluated a UAV-guided workflow combining three-dimensional meteorological sensing, blasting-parameter mapping, transient CFD, and pre-blast configuration checks. Analysis of historical cases identified source–coverage and wind-field mismatches. The workflow was applied at the Haerwusu Open-Pit Coal Mine. Despite near-calm ground conditions, UAV profiles showed west-to-east flow strengthening from 4.24 m s−1 at 25 m to 6.51 m s−1 at 100 m. Under the archived numerical settings, the CFD design case produced a model-dependent early-plume geometric envelope extending to approximately 17 m, assuming monodisperse 100 μm particles, a uniform 5 m s−1 inlet, and the stored source and solver settings. This envelope was used as a site-specific geometric reference for an 18 m operational coverage target and downwind deployment; field commissioning set the elevation angle at approximately 34° and the horizontal sweep at ±2°. CIELab image-based regional contrasts were 88.36%, 79.09%, and 70.66% at 10, 15, and 20 s, declining to 42.03% at 25 s. UAV PM10 regional contrasts exceeded 86% over retained samples 11–35 and declined to 49.61% over retained samples 36–50. Together, the observations indicated early-to-middle plume–mist alignment followed by late breakthrough. For the investigated field event, the workflow linked elevated wind observations and a short-time CFD design case to site-specific fog-cannon configuration.
1. Introduction
Open-pit coal mining generates mineral aerosols during drilling, blasting, excavation, loading, haulage, crushing, and dumping. Among these operations, blasting presents a particularly acute control problem because rock fragmentation, gas expansion, and particle entrainment occur within seconds, producing a transient plume with high initial momentum and a rapidly changing concentration field. The plume can reduce visibility, interfere with equipment operation, increase occupational exposure to inhalable and respirable particles, and carry dust beyond the active bench. Field investigations and reviews consequently treat blasting dust as both an immediate production-safety issue and a broader environmental-management problem, especially in large, deep pits where repeated operations and recirculating airflows can sustain particulate loading [1,2,3,4].
Dust control can begin at the source. Optimization of hole spacing, burden, charge structure, delay sequence, and specific charge can limit unnecessary overbreak and the generation of fine fragments, while water infusion and aqueous-media blasting introduce moisture directly into the fractured zone. Numerical and field studies show that these measures influence fragmentation, source strength, and the initial release of dust, but their performance remains conditioned by lithology, bench geometry, charging practice, and the spatial heterogeneity of the blast pattern. Water-assisted blasting and blast-coupled mist systems therefore complement, rather than eliminate the need for, downstream interception of the airborne fraction [5,6,7,8,9,10].
For airborne particles, high-pressure atomization, sprinklers, fog cannons, and water-mist generators are widely used because they can be deployed rapidly and adjusted without changing the production cycle. Capture occurs through inertial collision, interception, wetting, agglomeration, and gravitational settling. The probability of capture depends on the relative size and velocity of droplets and particles, whereas the useful spray envelope depends on nozzle geometry, installation angle, pressure, flow rate, ambient wind, and the wetting behavior of the mineral surface. Experimental studies on atomization, spray orientation, nozzle design, and wettability therefore converge on a practical requirement: a well-generated droplet field is effective only when it occupies the same three-dimensional space as the plume during the period of highest transport risk [11,12,13,14,15,16].
Achieving this overlap is difficult in an open pit. Benches, end walls, ramps, and dumps distort the approaching flow and can create elevation-dependent acceleration, separation, and recirculation. As a result, a near-calm ground observation may coexist with a coherent transport current above the bench, and a fog cannon configured from a single near-surface reading may point away from the actual dust path. Mine-scale monitoring and dispersion studies have demonstrated the joint influence of synoptic wind, vertical shear, atmospheric stability, pit geometry, and source location. CFD provides a means to incorporate these boundary conditions and translate them into time-resolved plume direction, height, and extent, but its engineering value depends on using field conditions that represent the airspace in which the dust actually moves [9,17,18,19,20,21,22].
Unmanned aerial vehicles provide a practical bridge between sparse ground observations and three-dimensional dispersion modeling. UAV-borne particulate and meteorological systems have been used to map dust in open-pit mines, resolve vertical aerosol gradients, characterize atmospheric boundary-layer structure, and sample regions that are difficult or unsafe to instrument with fixed stations [23]. UAV monitoring requires attention to rotor-induced flow disturbance, sensor response time, payload placement, and flight-path repeatability. Sequential measurements also require care when interpreted as a spatial field. Together, material-wettability studies and UAV-monitoring research inform mist capture and site-specific monitoring design [15,24,25,26,27,28,29,30,31,32,33].
Despite these advances, source characterization, UAV monitoring, CFD prediction, and fog-cannon operation are often investigated as separate tasks. Integrated monitoring systems have improved the continuity of dust observation and prediction, yet comparatively few field studies show how a pre-blast three-dimensional survey can be converted into specific fog-cannon position, elevation, and sweep settings and then evaluated through the complete early plume evolution [34]. This study develops and tests such a workflow at the Haerwusu Open-Pit Coal Mine. It combines UAV profiles of wind, temperature, humidity, and background PM10 and site blasting parameters with a transient CFD design case; uses the simulated early plume envelope as a geometric reference for equipment settings; rechecks the atmospheric field shortly before initiation; and evaluates the response with time-resolved images and UAV-based PM10 measurements. The analysis focuses on the alignment mechanism, the duration of effective interception, and the operational conditions associated with late-stage plume breakthrough.
2. Field Experiment and Data Analysis Methods
2.1. Engineering Diagnosis from Historical Operating Cases
Historical operating records were examined before designing the principal field experiment. They were used to identify recurrent spatial and meteorological causes of ineffective spraying and to define the information required for targeted control. Two cases were sufficiently documented to reconstruct the mismatch between plume development and fog-cannon coverage.
2.1.1. Source-Coverage Mismatch
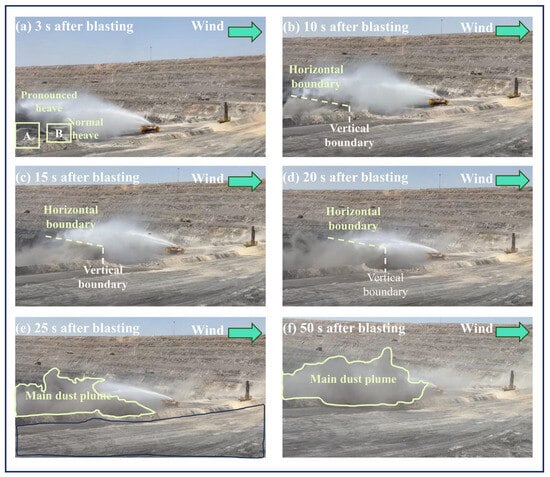
In the first case, a 280 m × 40 m blast area was divided into Regions A, B, and C. Region C contained a denser blasthole arrangement than the other regions but lay outside the effective water-mist envelope. The image sequence at 3, 10, 15, 20, 25, and 50 s showed that the strongest plume formed over Region C. At 10 s, the plume above this region reached approximately 46.78 m, whereas the height difference between Regions A and B was only 3.26 m. The persistence of the Region C plume indicates that a uniform spray plan did not allocate coverage in proportion to the spatial distribution of source intensity.
The image integral-density record reinforces this diagnosis. The index in Region B decreased from 105.92 at 3 s to 35.06 at 50 s, whereas Region C decreased more slowly from 150.84 to 90.08. Region A became quantifiable from 15 s onward and remained between 72.72 and 95.79. The consistently larger Region C index was therefore used as operational evidence that source mapping should precede fog-cannon positioning. The corresponding image integral-density indices are summarized in Table 1.
Table 1.
Image integral-density indices in the first historical operating case.
2.1.2. Wind-Field Mismatch
The second case occurred on a 35-m platform bordered by a wall and a northern end slope approximately 53 m from the blast area. Ground-level observations suggested calm conditions, so the fog cannon was oriented using local visual judgment. The time sequence from 5 to 30 s showed that an elevated east-to-west flow displaced the plume toward the platform boundary while the spray remained directed away from the main transport corridor. This case established that ground-level calmness was not a reliable surrogate for the wind field occupied by the rising blast plume.
Together, the two cases changed the design question from how widely the fog cannon could spray to where the plume would be generated and transported during the first tens of seconds. Source strength, three-dimensional wind direction, plume height, and time-dependent coverage were therefore treated as coupled inputs rather than independent operating judgments.
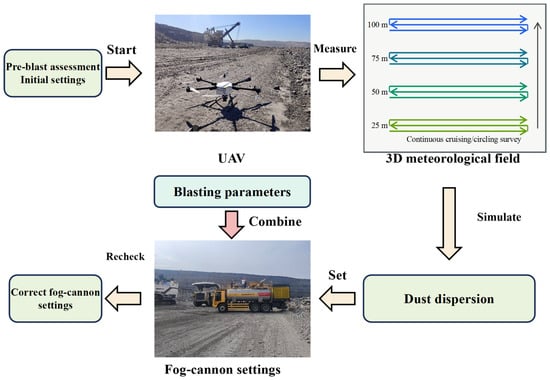
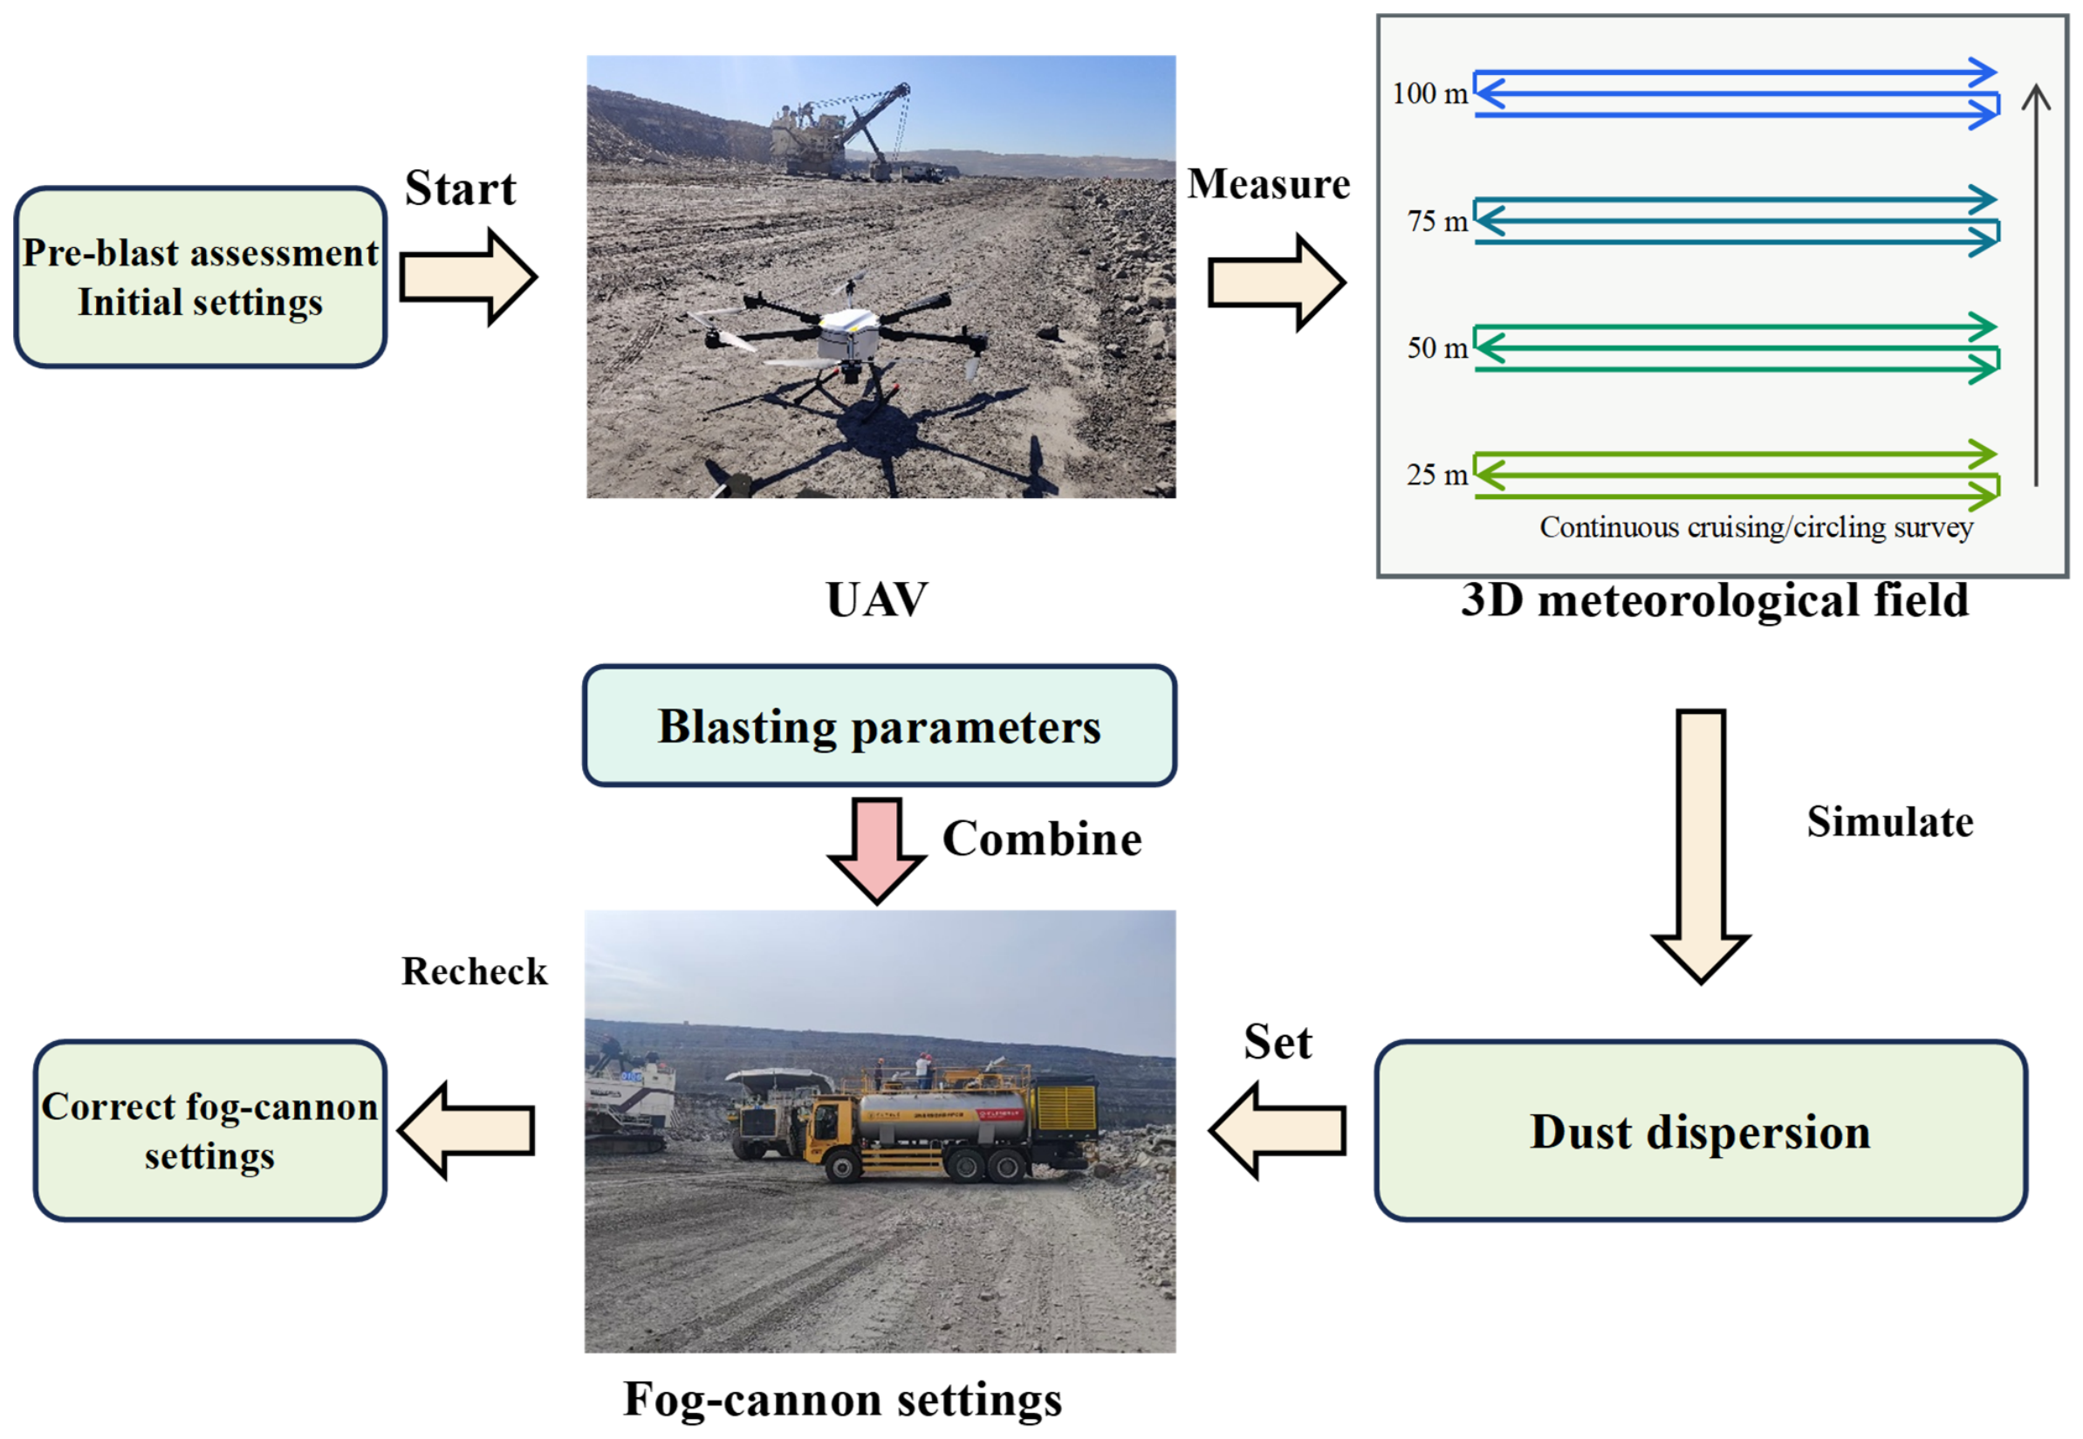
The resulting control framework combines UAV meteorological sensing, blasting-parameter mapping, a CFD design case, and two-stage parameter correction. Before the pressurization period, the UAV surveys the airspace above the bench, while the blasthole layout and specific charge document the spatial source context. The elevated wind observations establish the principal transport direction, and the archived representative-particle CFD case supplies an early geometric plume envelope for field setup. These inputs are then used to select the fog-cannon position, operational coverage height, elevation, and sweep. A second UAV wind check shortly before initiation is used to correct the configuration if the transport direction has changed. The resulting UAV-guided control workflow is summarized in Figure 1.
Figure 1.
UAV-guided targeted fog-cannon dust-suppression workflow adapted from the source material.
2.2. Study Site and Blasting Configuration
The Haerwusu Open-Pit Coal Mine is located in Zhungeer Banner, Ordos, Inner Mongolia, approximately 15 km from Xuejiawan. The mine has a deep, benched excavation with a maximum relative pit depth of approximately 200 m. The regional climate is dry and windy: annual precipitation is approximately 400 mm, concentrated mainly in July–September, whereas evaporation is approximately five times precipitation. These site characteristics provide the physical setting for dust resuspension and terrain-dependent airflow; the atmospheric conditions of the principal blast were determined separately from the pre-blast UAV survey.
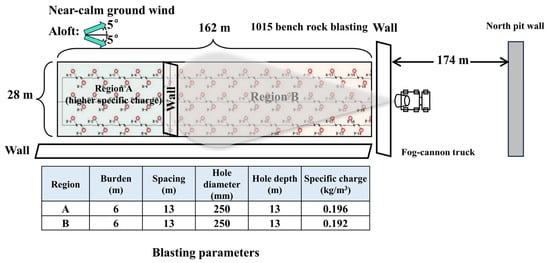
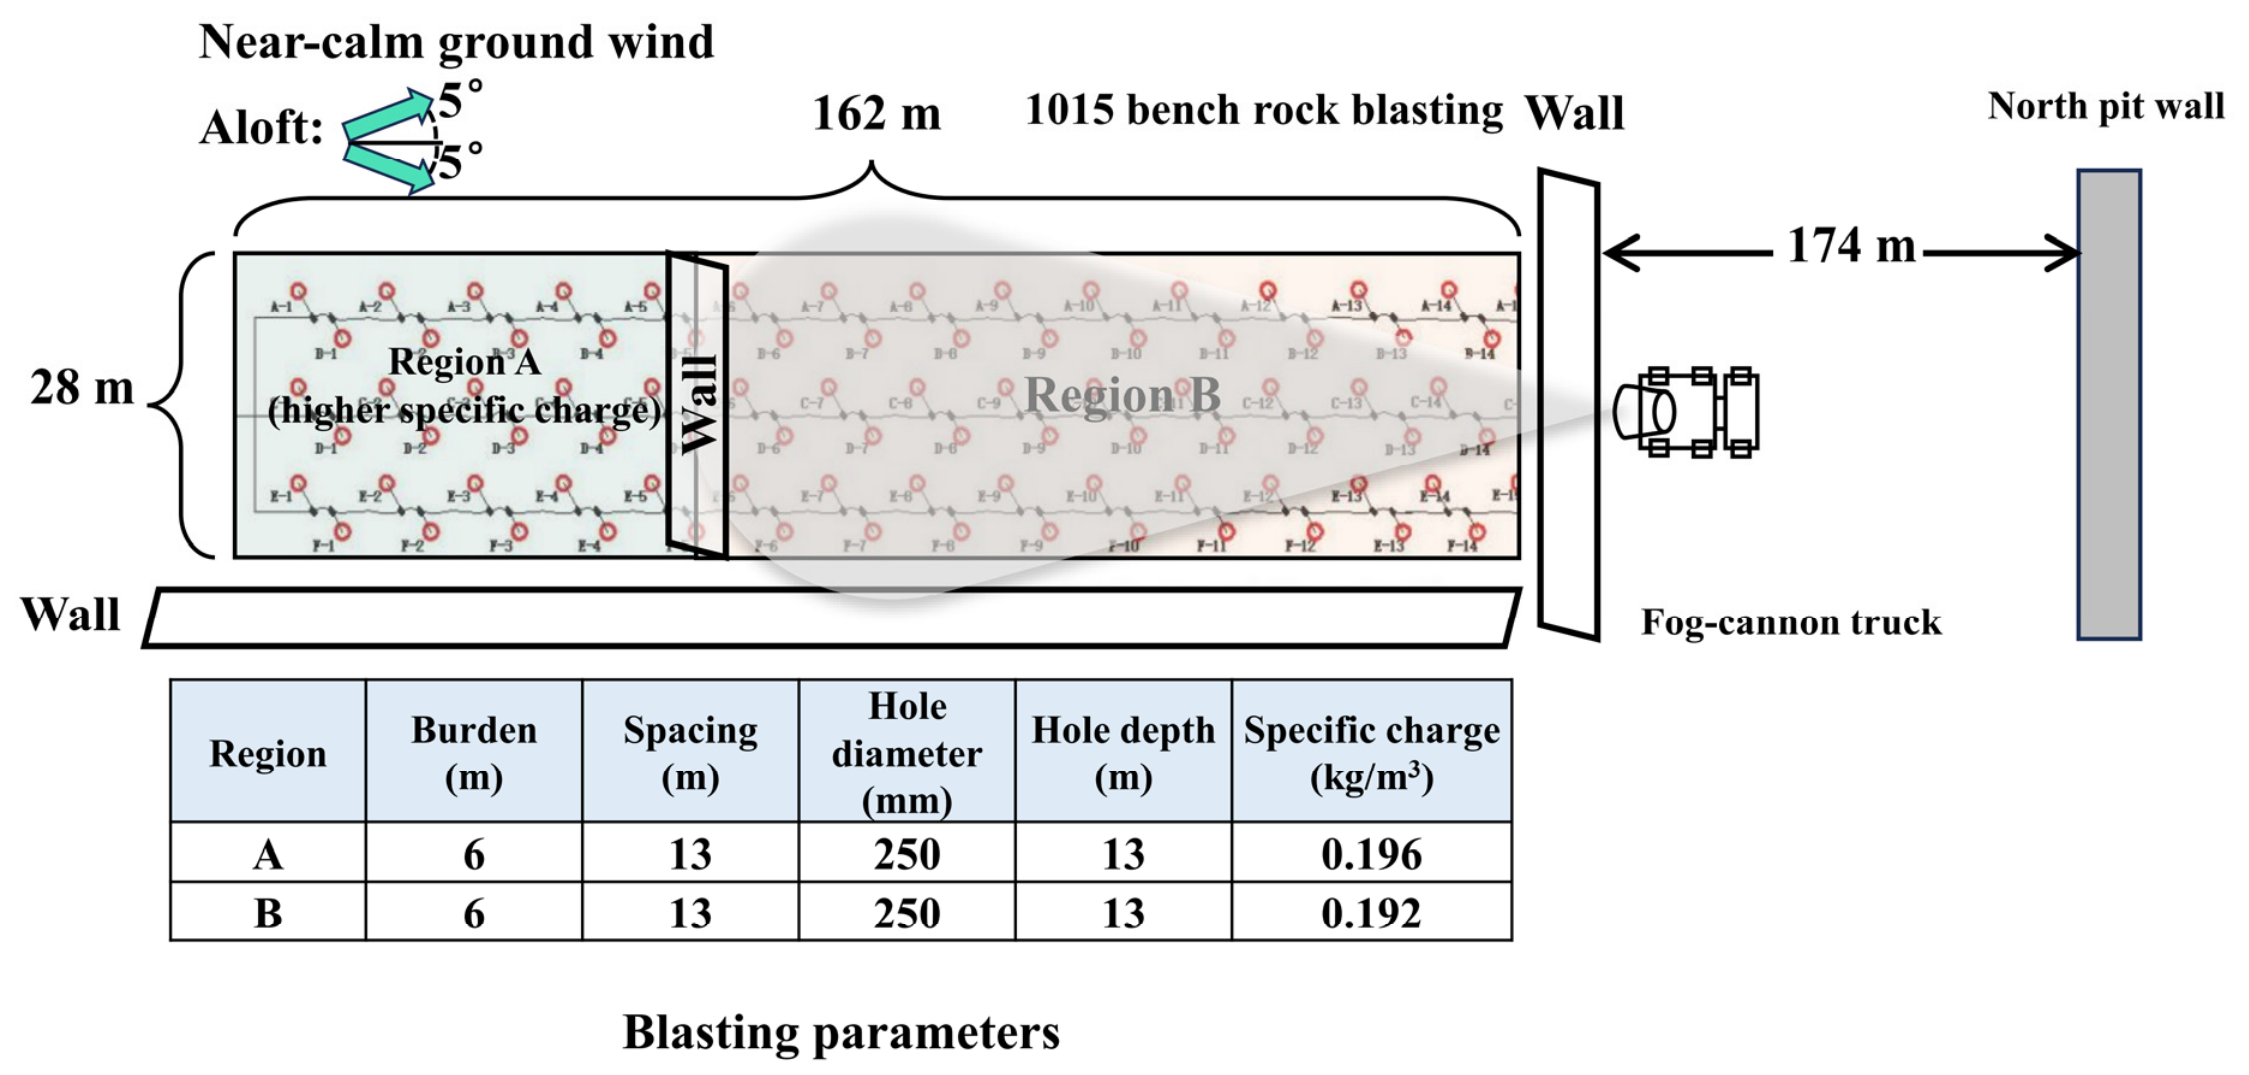
The principal field experiment was conducted on a rock bench at the 1015-m platform of the Haerwusu Open-Pit Coal Mine. The rectangular blast area was approximately 162 m long and 28 m wide and was divided into Regions A and B. Both regions used a row spacing of 6 m, a hole spacing of 13 m, a hole diameter of 250 mm, and a hole depth of 13 m. Because of lithological heterogeneity, the specific charge was approximately 0.196 kg m−3 in Region A and 0.192 kg m−3 in Region B. A retaining wall was located to the east of the blast area, and the northern end wall was approximately 174 m beyond it. These geometric and source-strength differences were retained in the analysis and are considered when interpreting regional contrasts. The blasting parameters and field layout are summarized in Table 2 and Figure 2, respectively.
Table 2.
Blasting configuration of Regions A and B.
Figure 2.
Field layout, blasting configuration, regional division, and fog-cannon position.
Separate dust characterization in the same mine provides supporting context for the fine-particle focus of the field measurements. Six filter-collected blasting-dust samples comprised three rock-dust samples from the 1025, 1040, and 1085 stripping benches and three coal-dust samples from the 930, 955, and 965 mining benches. Laser particle-size measurements, with three parallel tests per sample, gave mean rock-dust D10, D50, and D90 values of 1.12, 7.47, and 62.42 μm, respectively. The corresponding coal-dust values were 9.98, 56.86, and 166.67 μm. This auxiliary dataset indicates a substantially finer rock-dust population and supports attention to the airborne fine fraction during rock-bench blasting. It is not a particle-size measurement of the 1015-platform blast and was not used to prescribe the particle diameter in the production CFD case. The archived CFD case instead used a monodisperse 100 μm injection to represent the early transport of a coarse blast-dust/visible-plume component rather than the PM10 fraction measured in the field.
2.3. Fog-Cannon Deployment and Operating Workflow
The fog-cannon deployment was organized as a two-stage decision process. The vehicle-mounted unit was positioned outside the retaining wall at the downwind edge of Region B. Its mist was directed back toward the blast area. The initial UAV survey and blasting map were used to define the downwind equipment location, design coverage height, elevation angle, and horizontal sweep. These settings were fixed before pressurization so that the mist field would intersect the modelled early-plume envelope rather than follow the plume after it had already dispersed.
A second UAV wind check was performed shortly before initiation. If the transport direction had changed, the cannon orientation and sweep center were corrected while preserving the designed vertical coverage. During the blast sequence, the cannon remained at the selected downwind position and operated within the prescribed narrow sweep. This workflow separates site-specific placement from the atomization mechanism of the equipment and makes the operating decision traceable to measured and simulated inputs.
2.4. UAV Monitoring
Real-time kinematic positioning was used to define the four corners of the blast area, and the UAV flight domain was restricted to the airspace above this projection. A DJI Matrice 300 RTK (DJI, Shenzhen, China) carrying a Sniffer4D V2 mobile atmospheric monitoring system (Soarability Technologies, Shenzhen, China) was used for the aerial survey. The installed particulate module measured PM1.0, PM2.5, and PM10 by laser/light scattering; PM10 (nominal particle-size range 0.3–10 μm) was used in this study. According to the manufacturer, the module has a measurement range of 0–1000 μg m−3, a detection limit and theoretical resolution of 1 μg m−3, repeatability below 2% of full scale, a response time below 10 s, humidity correction, and a normal data-output frequency of 1 Hz. Temperature and relative humidity were recorded by modules integrated into the Sniffer4D V2. All sensors were factory calibrated; no independent field or co-location calibration was performed. The system was powered on and allowed to stabilize for more than 10 s before initiation.
Wind speed and direction were measured using the external ultrasonic module connected to the Sniffer4D V2. Its stated wind-speed range is 0–50 m s−1 with a resolution of 0.1 m s−1; the stated accuracy is ±0.1 m s−1 at 0–10 m s−1, ±1% at 11–30 m s−1, and ±2% at 31–50 m s−1. Wind direction is measured over 0–360° with a 1° resolution and ±1° stated accuracy. The particulate sensor was installed above the UAV body to reduce direct rotor-downwash interference. UAV velocity and attitude data from the onboard GPS and inertial measurement unit were used to compensate the wind observations. The UAV-based monitoring system and its flight-path representation are shown in Figure 3.
Figure 3.
UAV-based meteorological and particulate monitoring system.
The pre-blast survey was conducted as continuous cruising/circling flights within the airspace above the 0–160 m by 0–30 m blast-area projection. Four elevation layers, 25, 50, 75, and 100 m above the reference ground, were surveyed for wind speed, wind direction, temperature, relative humidity, and background PM10. The recorded trajectory data were spatially organized at nominal mapping intervals of 5 m longitudinally and 10 m transversely. These intervals describe the spatial resolution used to construct the three-dimensional maps rather than the number of independent stationary hovering samples.
PM10 was selected as the particulate monitoring variable because it represents the airborne fraction with aerodynamic diameters not exceeding 10 μm, which can remain suspended and be transported with the pit airflow. The spatial survey therefore served two distinct purposes: the wind observations documented the elevated transport direction and wind-speed range used to assess the field consistency of the representative uniform CFD inlet, while the pre-blast PM10 observations documented spatial background conditions for contextual interpretation. The background survey was not used to correct the post-blast concentrations.
2.5. CIELab-Based Image Dust-Intensity Metric
Time-resolved RGB images were converted to the CIELab color space to separate luminance (L*) from the red–green (a*) and yellow–blue (b*) chromatic channels. A field-derived reference chromatic vector (, ) was used to identify warm-toned dust pixels by chromatic-direction similarity. A pixel was classified as dust when the cosine similarity exceeded threshold τ and both a* and b* were positive:
For classified dust pixels, inverse luminance was used as a relative intensity value; all other pixels were assigned zero:
The area-averaged image dust-intensity metric D and the regional relative contrast η were calculated as:
In Equation (1), θ(x, y) is the angle between the pixel chromatic vector [a*(x, y), b*(x, y)] and the field-de rived reference dust-color vector (,), where a* and b* are the red–green and yellow–blue CIELab coordinates, respectively, and τ is the classification threshold. In Equation (2), Ωd is the set of classified dust pixels, P(x, y) is the inverse-luminance dust-intensity value, and L*max is the theoretical maximum luminance. In Equations (3) and (4), Ω is the set of all pixels in the analysis window, N is the total pixel count, Dc and De are the image dust-intensity metrics for the comparison and suppression zones, respectively, and η is the regional relative contrast.
For regional comparison, analysis windows of equal pixel dimensions were defined in the comparison and suppression zones. All pixels within each window were included in N, including non-dust pixels assigned zero by Equation (2). This normalization makes D sensitive to both the fraction of the window occupied by classified dust and the intensity of those pixels, rather than only to the mean intensity within the segmented plume. The spatial patterns were also displayed as pseudocolor maps, with higher metric values shown in red and lower values in blue.
This metric is an image-derived regional contrast rather than a calibrated mass concentration. Water-mist edges can share luminance and chromatic features with the dust plume and may therefore be classified as dust. The image sequence was consequently interpreted together with plume direction, visible mist coverage, and UAV PM10 observations.
Image-based regional metrics were evaluated at 10, 15, 20, and 25 s to cover the interval in which plume transport and mist interception were most clearly expressed. The earliest images were used to document initial plume formation, while the 50-s image was retained to show late-stage breakthrough beyond the original mist envelope. Thus, the complete image sequence supported process interpretation even where a regional image metric was not reported.
2.6. PM10 Monitoring and Data Processing
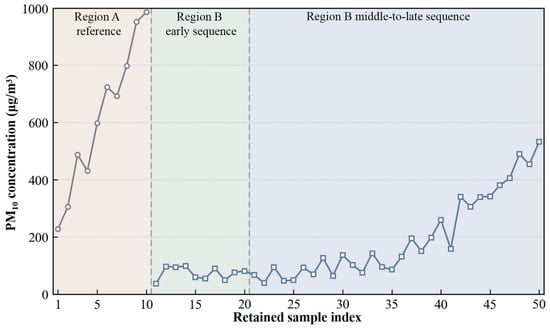
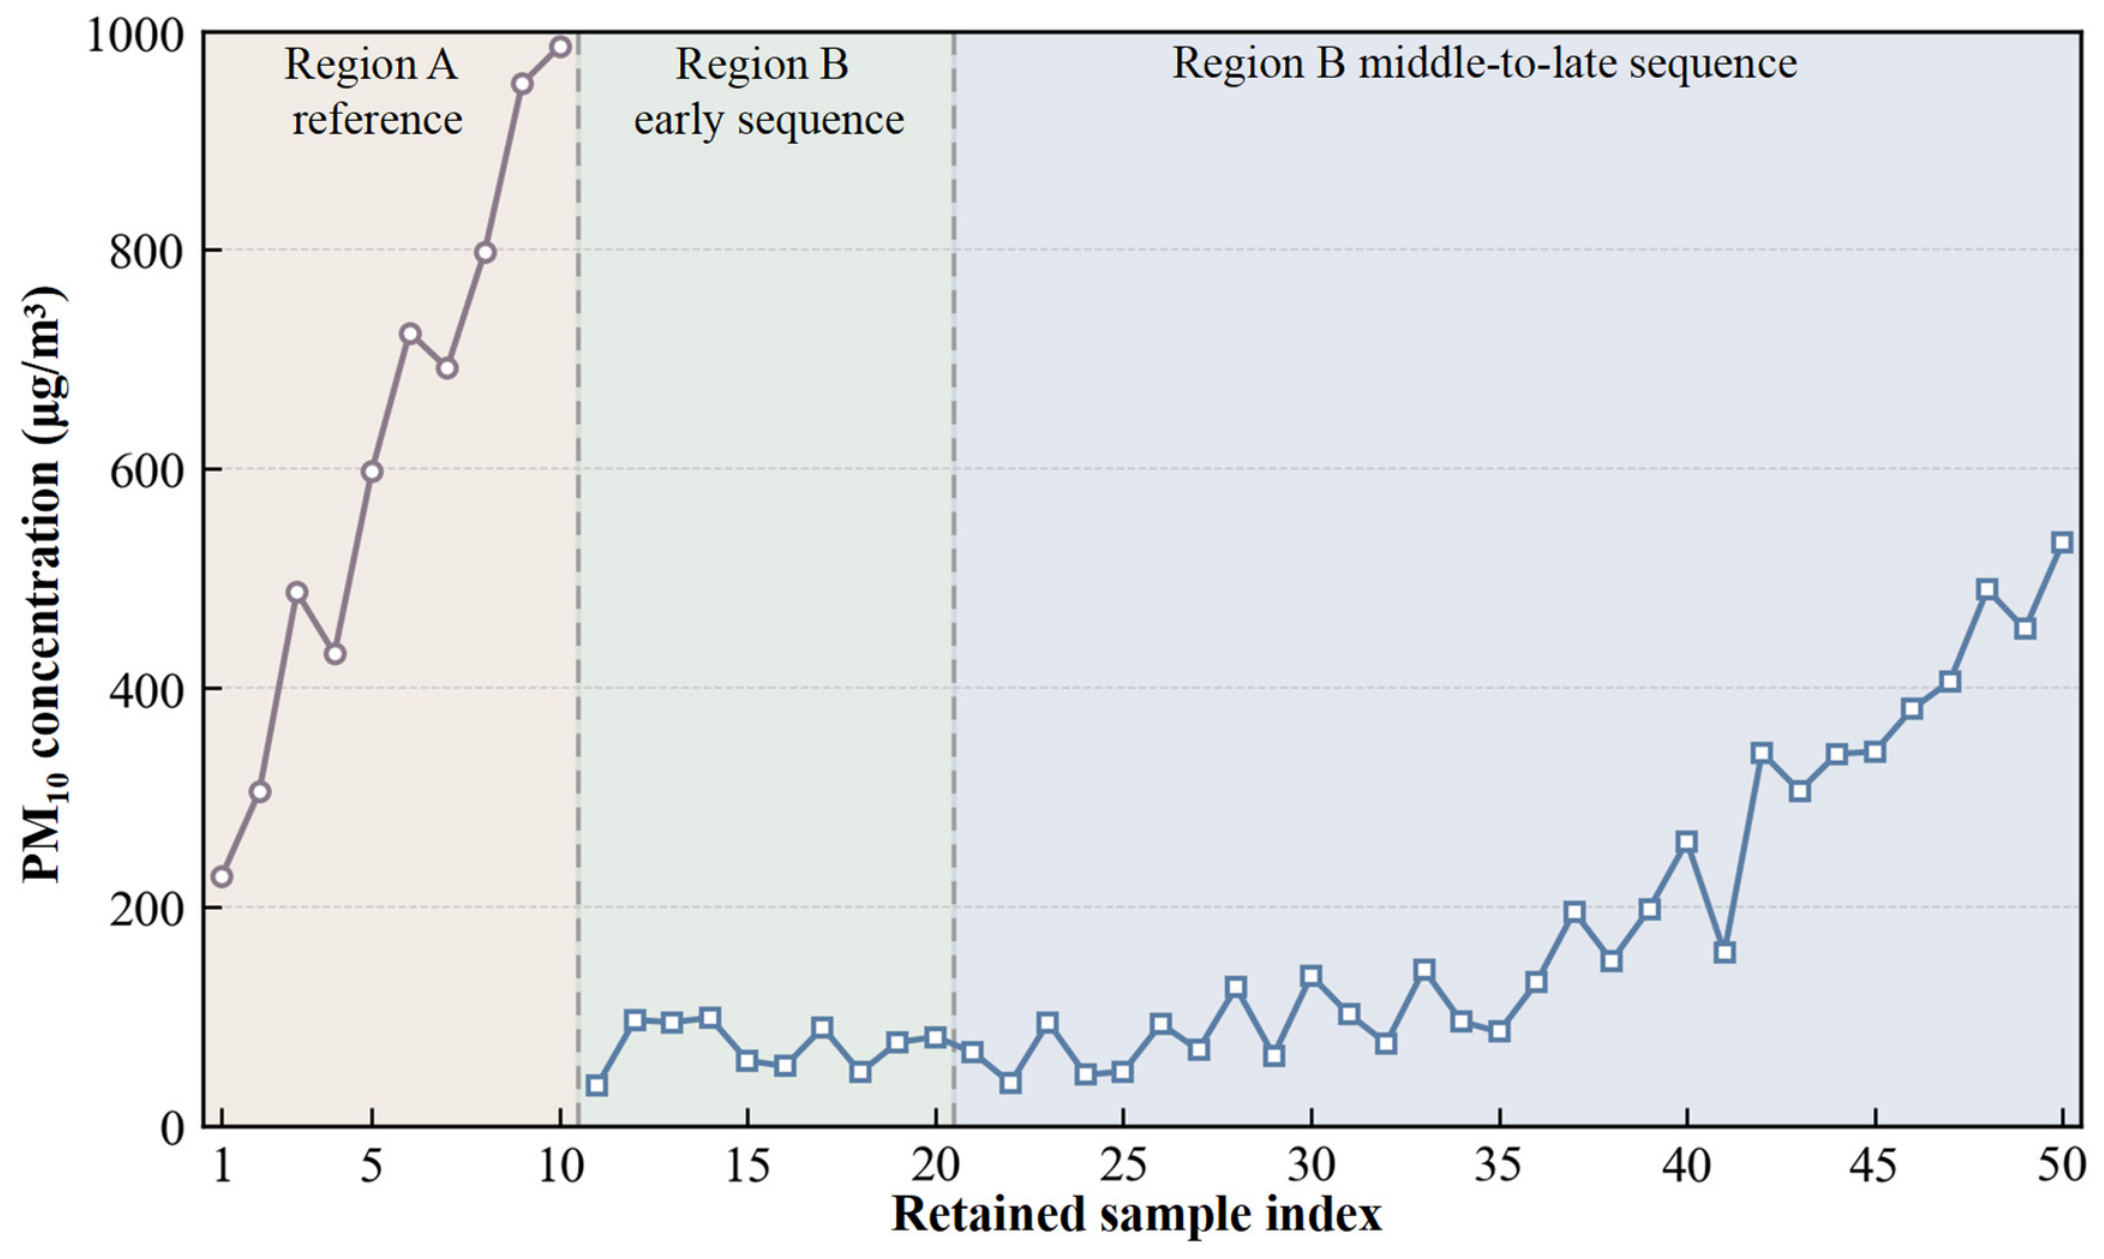
After initiation, the UAV sampled at two fixed monitoring locations in sequence: the center of Region A at 15 m and the center of Region B at 25 m. Region A was treated as the near-source, higher-charge, upwind reference region, whereas Region B was the downwind, fog-cannon-influenced region. Ten valid 1-Hz PM10 samples were retained for Region A and 40 for Region B. Records collected during acceleration, turning, altitude adjustment, or transfer between the two regions were excluded. The exact transfer duration was not independently logged; consequently, the sample index in the retained sequence should not be interpreted as uninterrupted elapsed time after initiation. Region B samples were summarized as early (retained samples 11–20), middle (21–35), and late (36–50) stages. For each Region B stage i, the regional contrast was calculated as 100 × (mean Region A concentration − mean Region B concentration at stage i)/mean Region A concentration. The calculations used recorded concentrations without background subtraction. Although the module outputs data at 1 Hz, its stated response time is below 10 s; adjacent 1-Hz values were therefore not treated as statistically independent measurements, and rapid concentration changes may be temporally smoothed. The pre-blast survey described spatial background variability; its overall mean was not treated as a co-located background for each post-blast sample. These percentages are descriptive regional and temporal contrasts and are not direct fog-cannon removal efficiencies.
The highest retained PM10 value was 985.83 μg m−3, corresponding to 98.6% of the stated upper measurement limit. The regional contrasts were calculated from stage means rather than from the peak value. Because the peak approached the upper limit, short transient values near the peak may be subject to upper-range truncation and consequent underestimation.
2.7. Existing-Evidence Comparison Strategy
The analysis combined three evidence streams with different roles. Historical images identified recurrent failure modes; the archived CFD case used the site geometry and a representative uniform inlet consistent with the direction and range of the elevated wind measurements to estimate an early 100 μm particle envelope; and the principal field experiment evaluated whether the resulting mist geometry intersected the observed plume. The field evaluation comprised one principal blasting event without independent experimental repetition. The pre-blast atmospheric survey used continuous flight paths at four elevations, whereas post-blast PM10 was sampled sequentially at two fixed locations. Regional image and PM10 differences were therefore evaluated descriptively for the available stages, and no inferential significance test was applied.
3. Numerical Simulation and Targeted Suppression Design
3.1. Computational Domain and Mesh
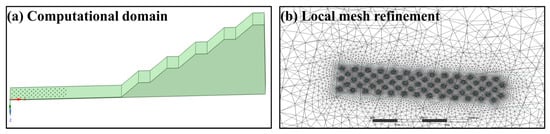
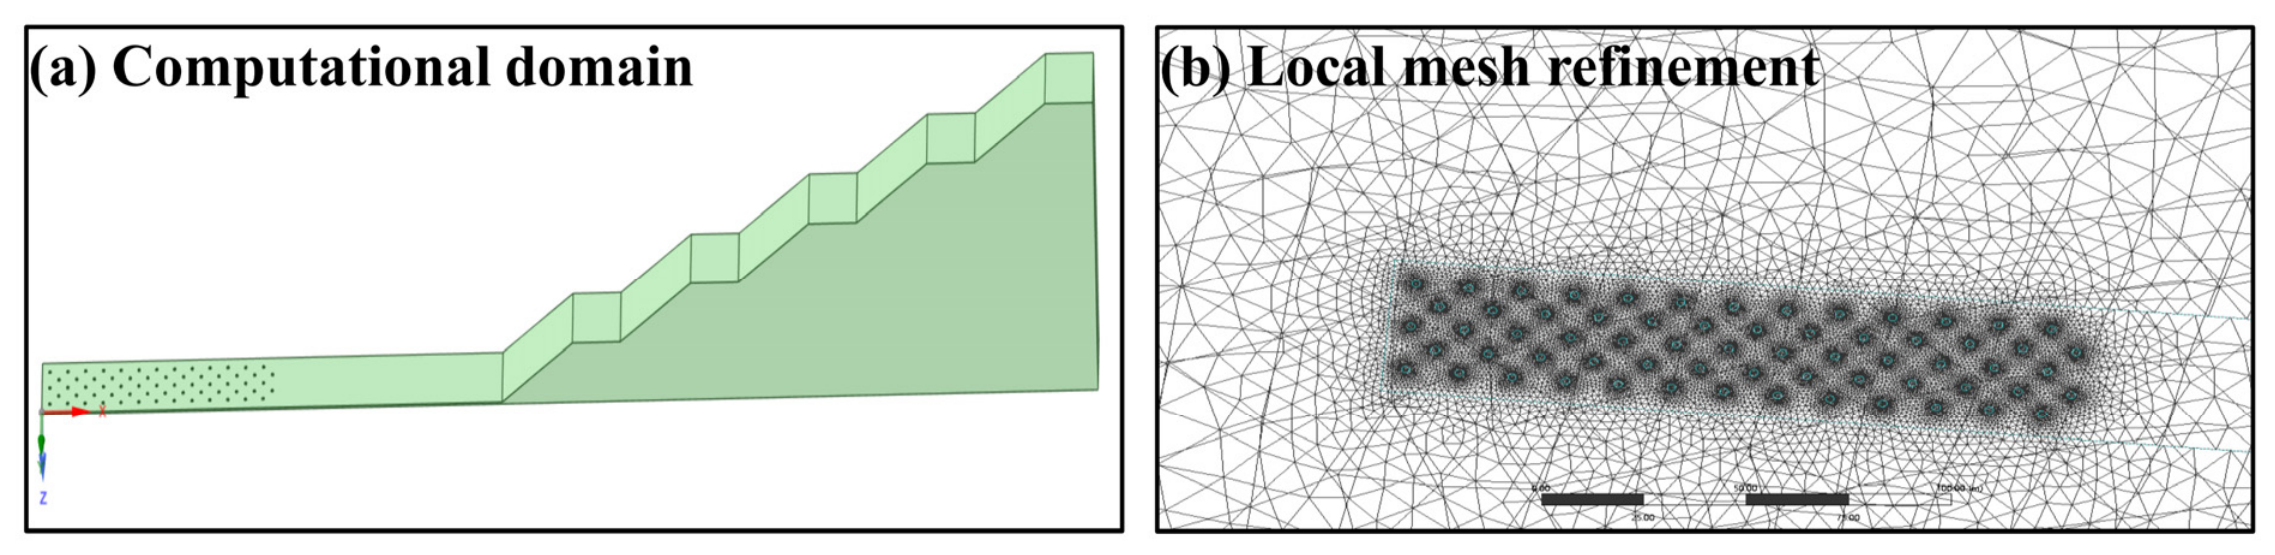
The computational geometry reproduced the working bench, pit slopes, retaining wall, and blast-release surface from the field topography (Figure 4). The archived production case contained 843,714 tetrahedral control volumes and 155,984 nodes. Local refinement was concentrated around the release surface and adjacent terrain, where the initial plume acceleration and near-ground shear were expected to be largest. The upwind face was specified as a velocity inlet, the downwind face as a pressure outlet, and the terrain and structural surfaces as no-slip walls. The principal numerical settings of the archived production case are summarized in Table 3.
Figure 4.
Reconstructed terrain and the 843,714-cell tetrahedral computational mesh.
Table 3.
CFD model and numerical settings reported for the archived Fluent production case.
3.2. Governing Equations and Turbulence Closure
The gas phase was solved in an Eulerian frame using the transient Reynolds-averaged Navier–Stokes equations. Air was treated as incompressible with constant density and viscosity. The continuity and momentum equations are given in Equations (5) and (6), where the dispersed-phase momentum exchange appears as the source term Sp. The realizable k–ε closure was selected because it retains the computational economy of two-equation RANS modelling while allowing a variable eddy-viscosity coefficient for strained and rotating flows [35,36,37]. Its transport equations are summarized in Equations (7) and (8).
In Equations (5)–(8), ρ, u, p, μ, and μt are the air density, mean velocity, pressure, molecular viscosity, and turbulent viscosity, respectively; g is gravitational acceleration; k is turbulent kinetic energy; ε is its dissipation rate; Gk is the production of k; σk and σε are turbulent Prandtl numbers; S is the mean strain-rate magnitude; and C1 and C2 are realizable-model coefficients. Standard wall functions connected the wall-adjacent cells to the fully turbulent region. The selected RANS treatment follows established single-phase and turbulent-flow formulations while providing the carrier-phase field required for the subsequent gas–solid calculation [35,36,37,38].
3.3. Eulerian–Lagrangian Gas–Solid Coupling
Dust was represented by Lagrangian parcels tracked through the Eulerian air field, which is a gas–solid two-phase formulation rather than a single-phase passive-scalar calculation [38,39]. Continuous-phase interaction was enabled, so particle drag generated the equal-and-opposite momentum source Sp in Equation (6). The archived case used spherical particles with a density of 2550 kg m−3 and a monodisperse injection diameter of 100 μm. This diameter represents a coarse blast-dust/visible-plume component and does not represent the PM10 fraction monitored in the field. A surface injection supplied 1 kg s−1 from 0 to 0.5 s (0.5 kg total) with an initial speed of 30 m s−1 in the stored case z direction. The specified mass was a computational source scaling and was not calibrated to the absolute dust mass released by the field blast; absolute simulated concentrations were therefore not compared with the field PM10 measurements. Gravity and spherical drag were active, and turbulent dispersion was represented by stochastic tracking with the archived integral time-scale constant of 0.15. Brownian, pressure-gradient, and virtual-mass forces were disabled.
In Equations (9)–(11), up, ρp, dp, mp, and Rep are the particle velocity, density, diameter, parcel mass, and relative Reynolds number; FD is the drag acceleration coefficient multiplying the relative-velocity term; CD is the dimensionless spherical drag coefficient; V is the cell volume; and Δup is the particle momentum change over Δt. The spherical-drag correlation follows the Reynolds-number-dependent formulation of Morsi and Alexander [40]. Ground impacts were trapped, particles crossing the outlet escaped, and the remaining solid boundaries used reflection. The production case tracked 91,250 particle parcels.
3.4. Boundary Conditions and Numerical Procedure
The archived production case prescribed a uniform 5 m s−1 west-to-east velocity inlet. The UAV observations were used to identify the dominant transport direction and showed that 5 m s−1 lies within the measured 4.24–6.51 m s−1 range at 25–100 m. Because no wind measurements were available below 25 m, consistency with the elevated range does not establish the actual wind field within the 0–17 m plume layer. No height-dependent inlet profile was imposed in the production case. The outlet used zero gauge pressure, and gravity had a magnitude of 9.8 m s−2. The flow was initialized before transient particle release.
The pressure–velocity equations were coupled by PISO. Time integration was first-order implicit with Δt = 0.01 s, giving 1000 steps for the 10 s simulation, and up to 20 iterations were allowed per time step. Pressure was discretized with a second-order scheme; momentum, k, and ε used first-order upwind schemes. Scaled residuals of 10−3 were specified for continuity, the velocity components, k, and ε. The run used eight Fluent solver processes on an Intel Core i5-13420H workstation. Archived checkpoint timestamps from the uninterrupted 3–8 s segment suggest approximately 2.4–4.0 min per additional physical second, equivalent to about 30 min for a 10 s run, excluding case setup, interrupted intervals, and post-processing. This is an approximate wall-clock inference from the archive rather than a solver-reported benchmark; peak memory use was not logged.
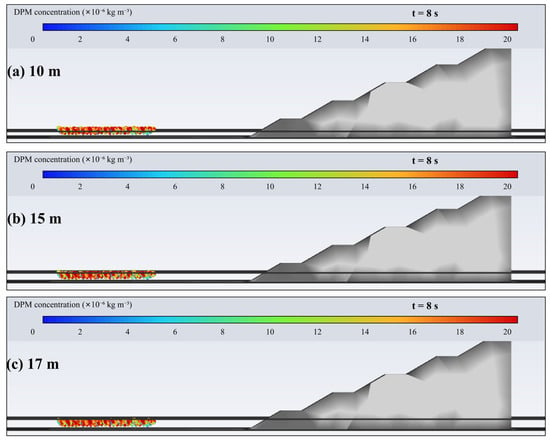
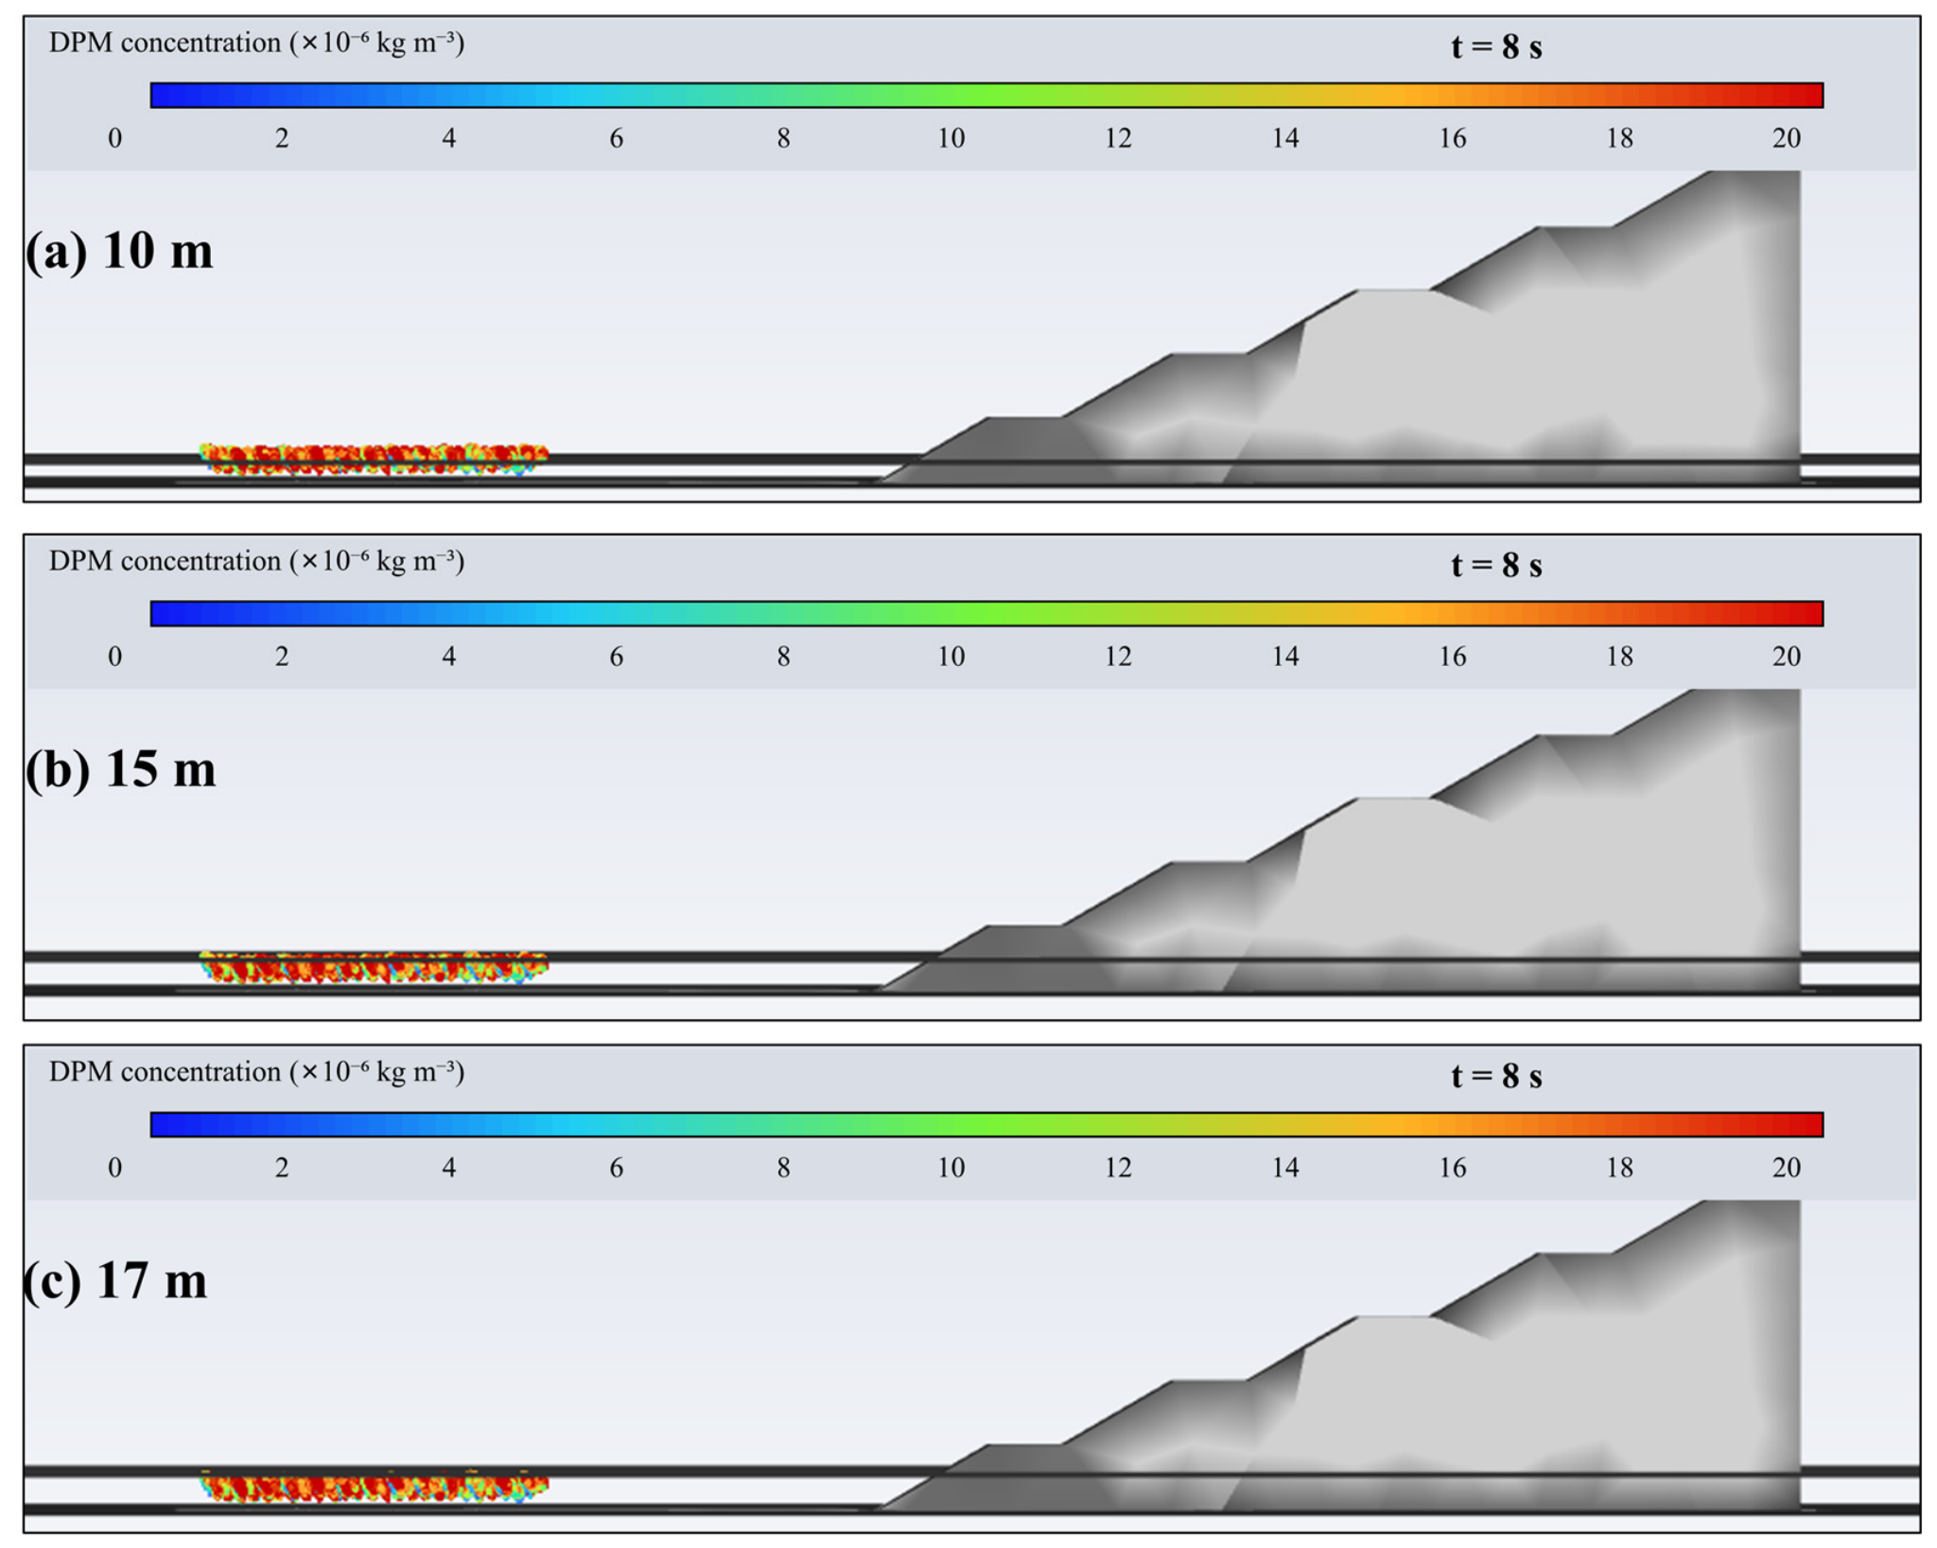
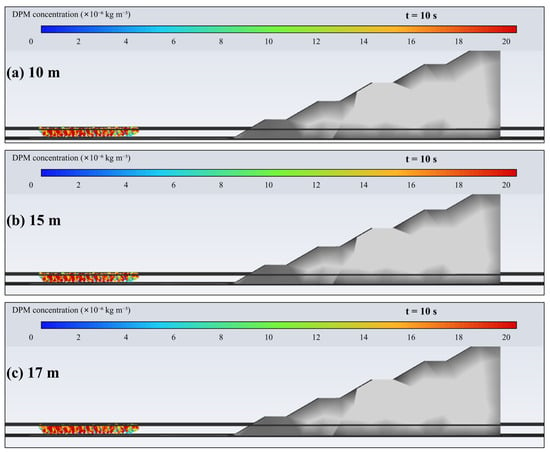
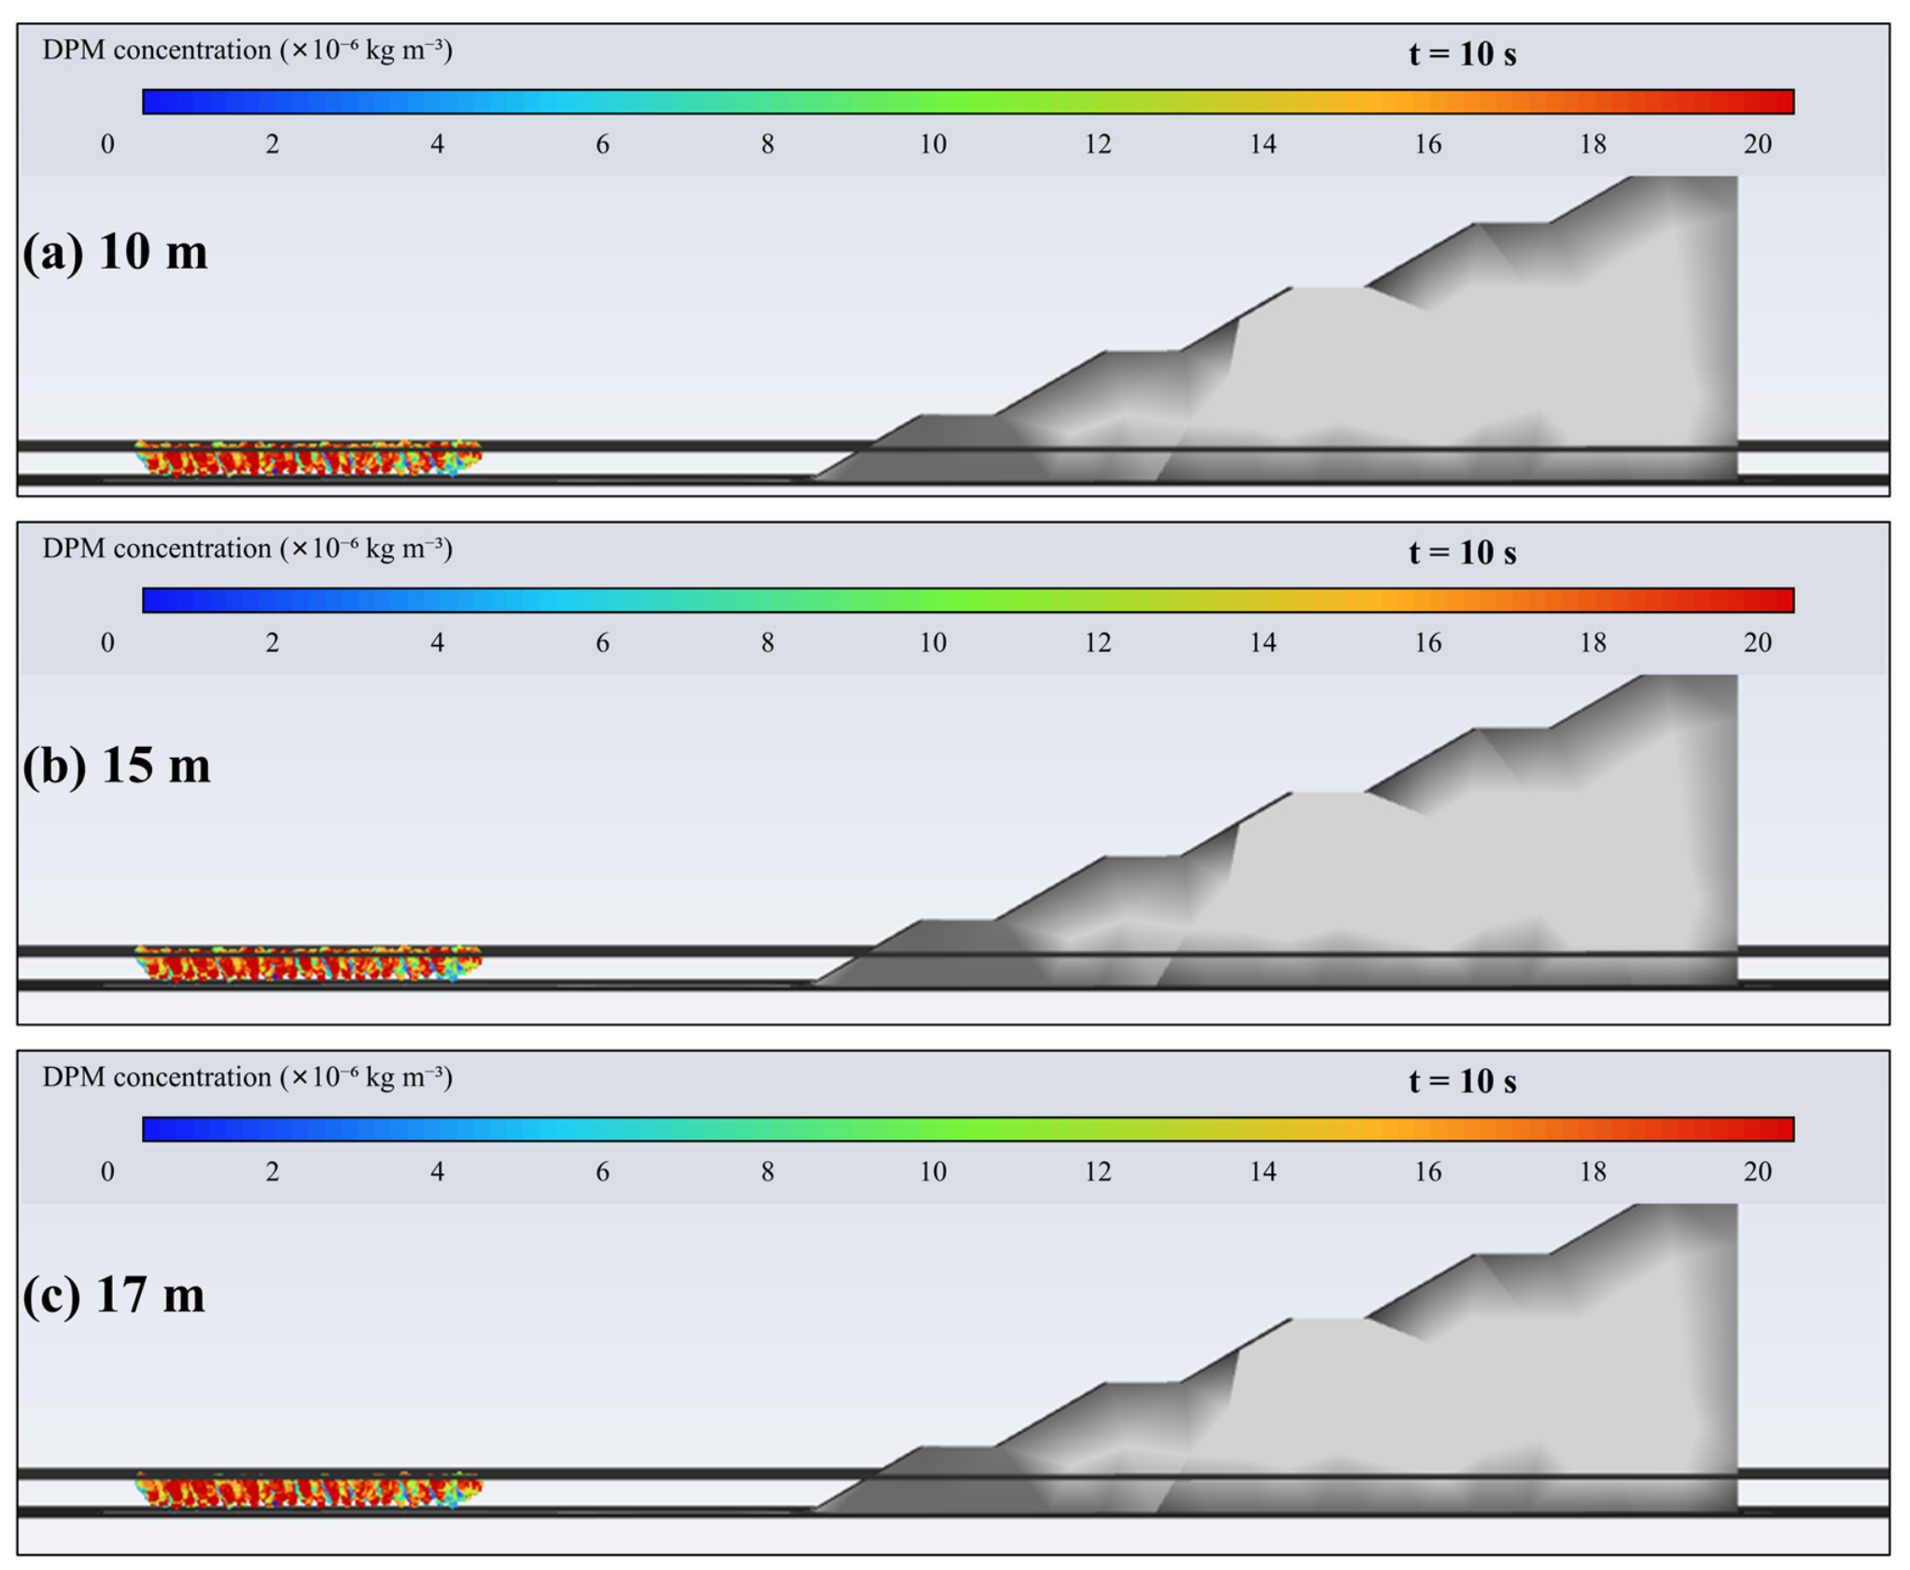
The available archive contains one production mesh and one reported production time step. No independently rerun mesh or time-step sequence could be recovered; therefore, the revised manuscript does not claim grid or time-step independence. The 0.01 s setting is reported as the production time step used for all plume outputs in Figure 5, Figure 6 and Figure 7, and the absence of numerical-verification series is treated as a limitation.
Figure 5.
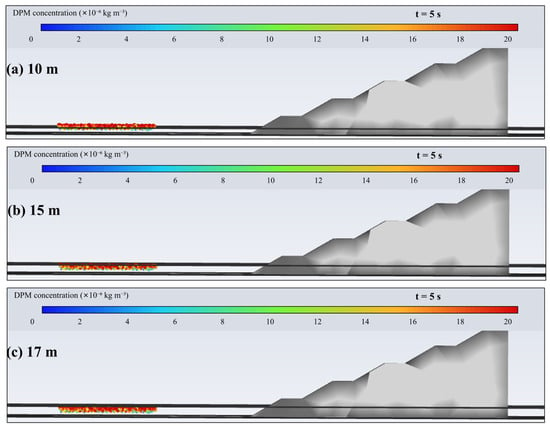
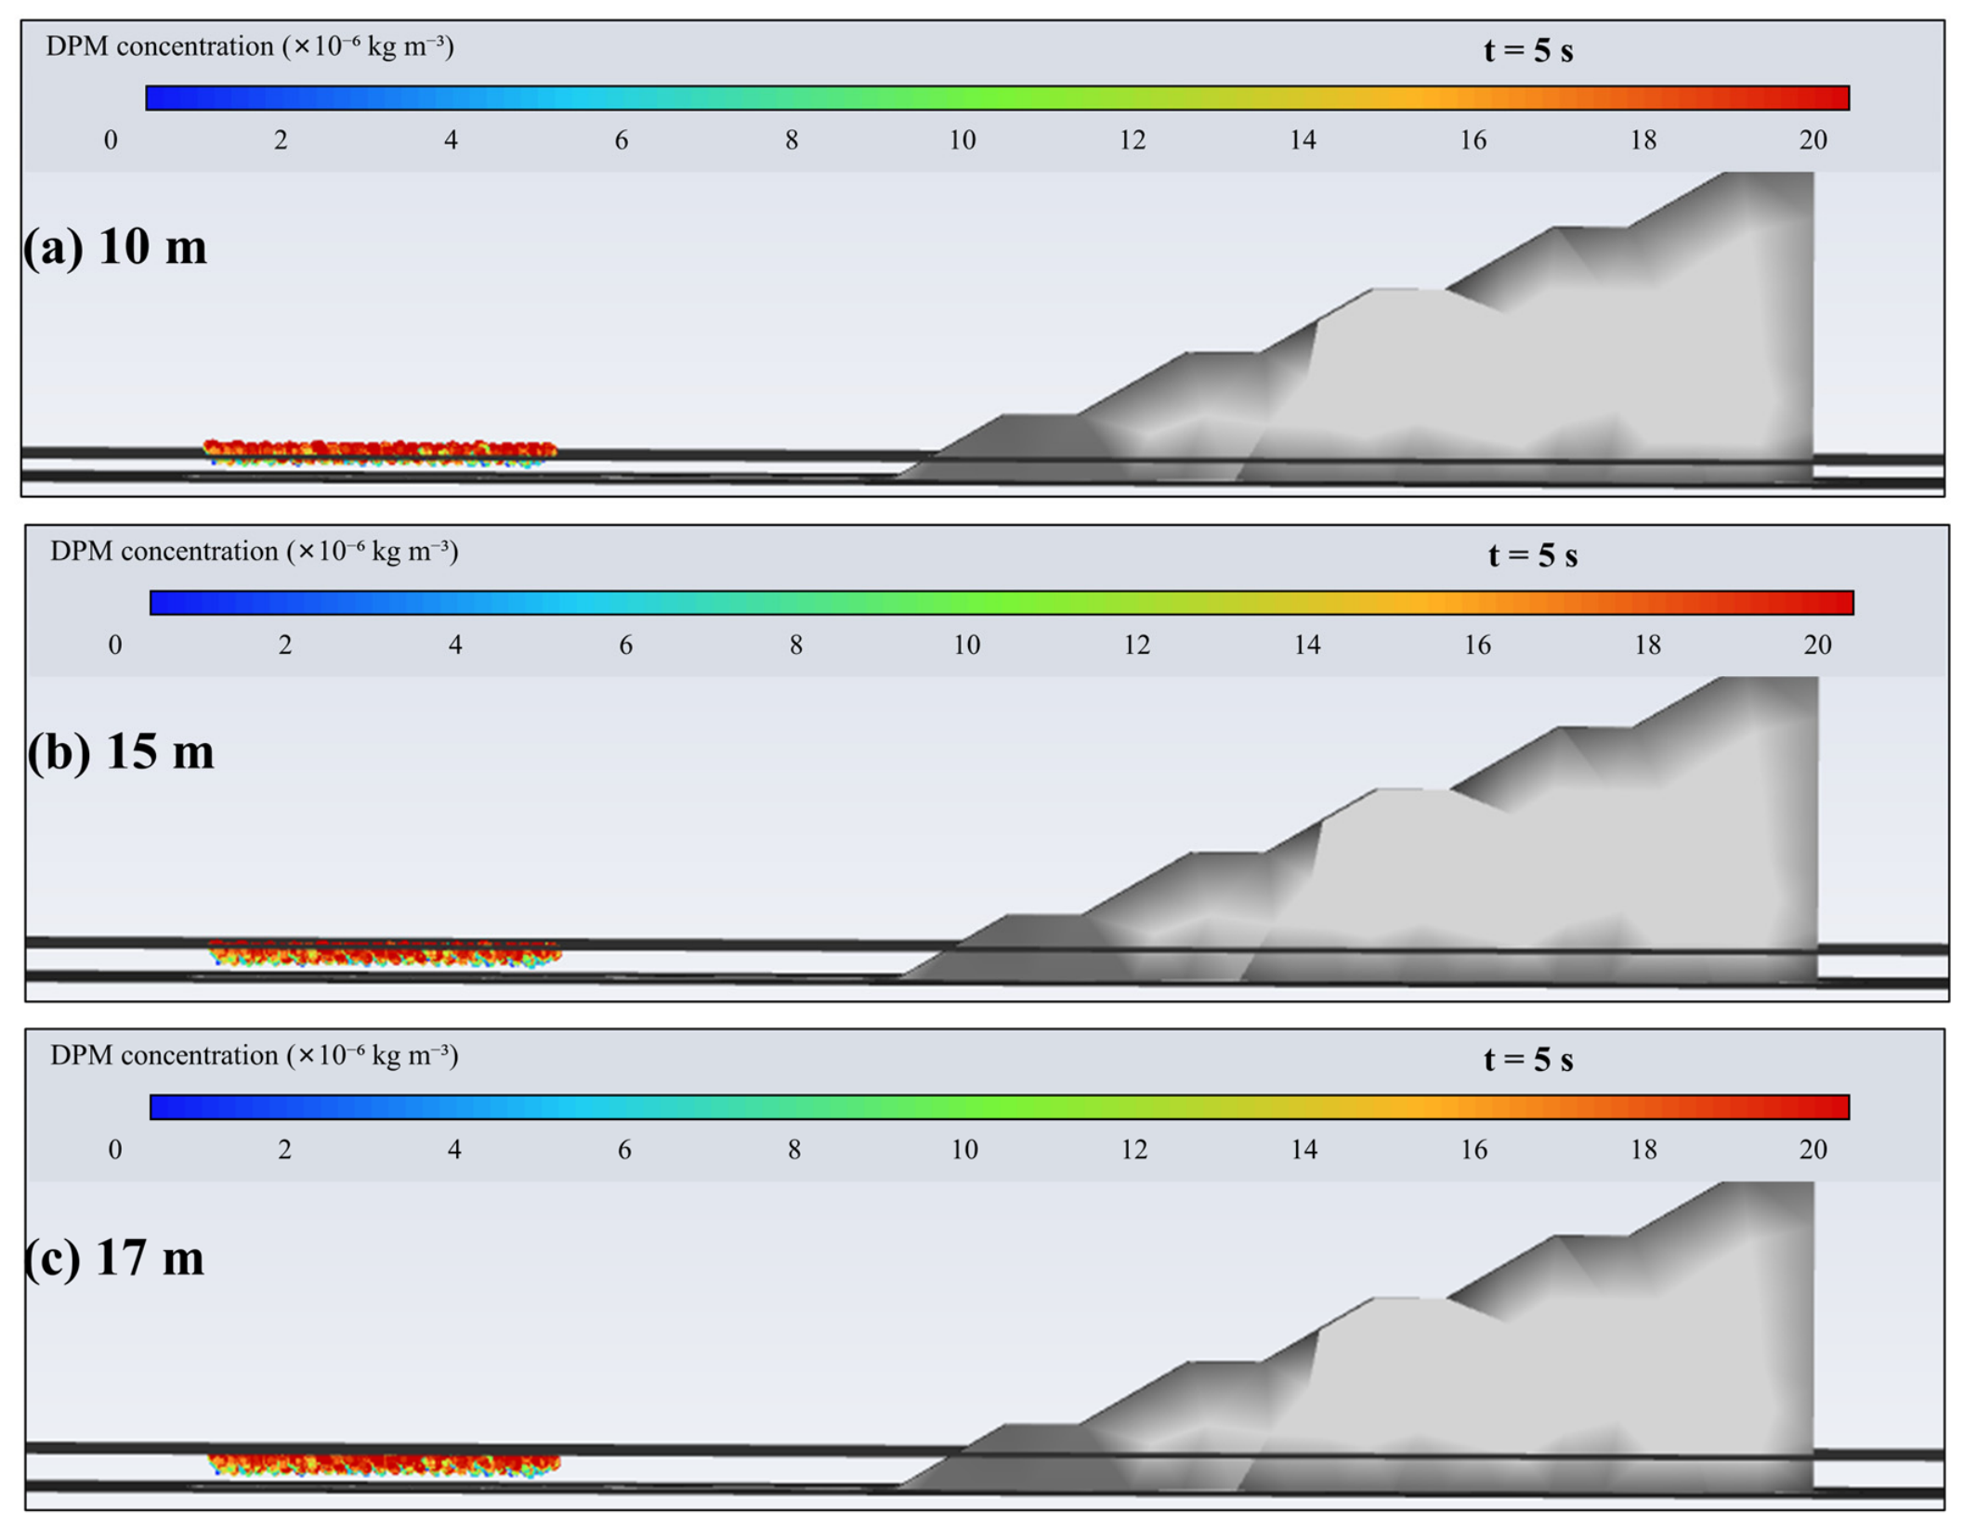
Simulated particle distribution at 10, 15, and 17 m, 5 s after initiation.
Figure 6.
Simulated particle distribution at 10, 15, and 17 m, 8 s after initiation.
Figure 7.
Simulated particle distribution at 10, 15, and 17 m, 10 s after initiation.
3.5. Simulated Plume Evolution
The CFD outputs at 5, 8, and 10 s were evaluated at heights of 10, 15, and 17 m. At 5 s, the simulated particle field was concentrated around the 10 m layer and was weak and discontinuous at 15 and 17 m. At 8 s, the dust field expanded into the 10–15 m layer, while the 17 m plane still showed only isolated particles. By 10 s, the distribution at 10 m contracted as settling became more important, the 15 m layer remained affected, and the 17 m layer did not develop a continuous dust band. For the archived monodisperse 100 μm case, the model-dependent early-plume geometric envelope extended to approximately 17 m. This estimate depends on the assumed particle diameter, uniform 5 m s−1 inlet, computational source representation, and other stored numerical settings; it does not define an upper boundary for PM10 or for the full blast-dust size distribution.
3.6. Suppression-Zone Identification and Fog-Cannon Parameter Design
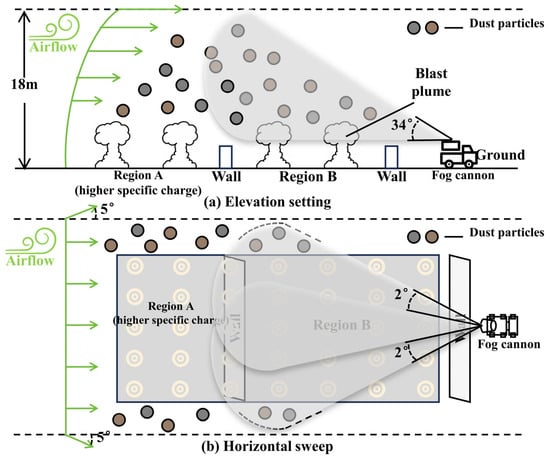
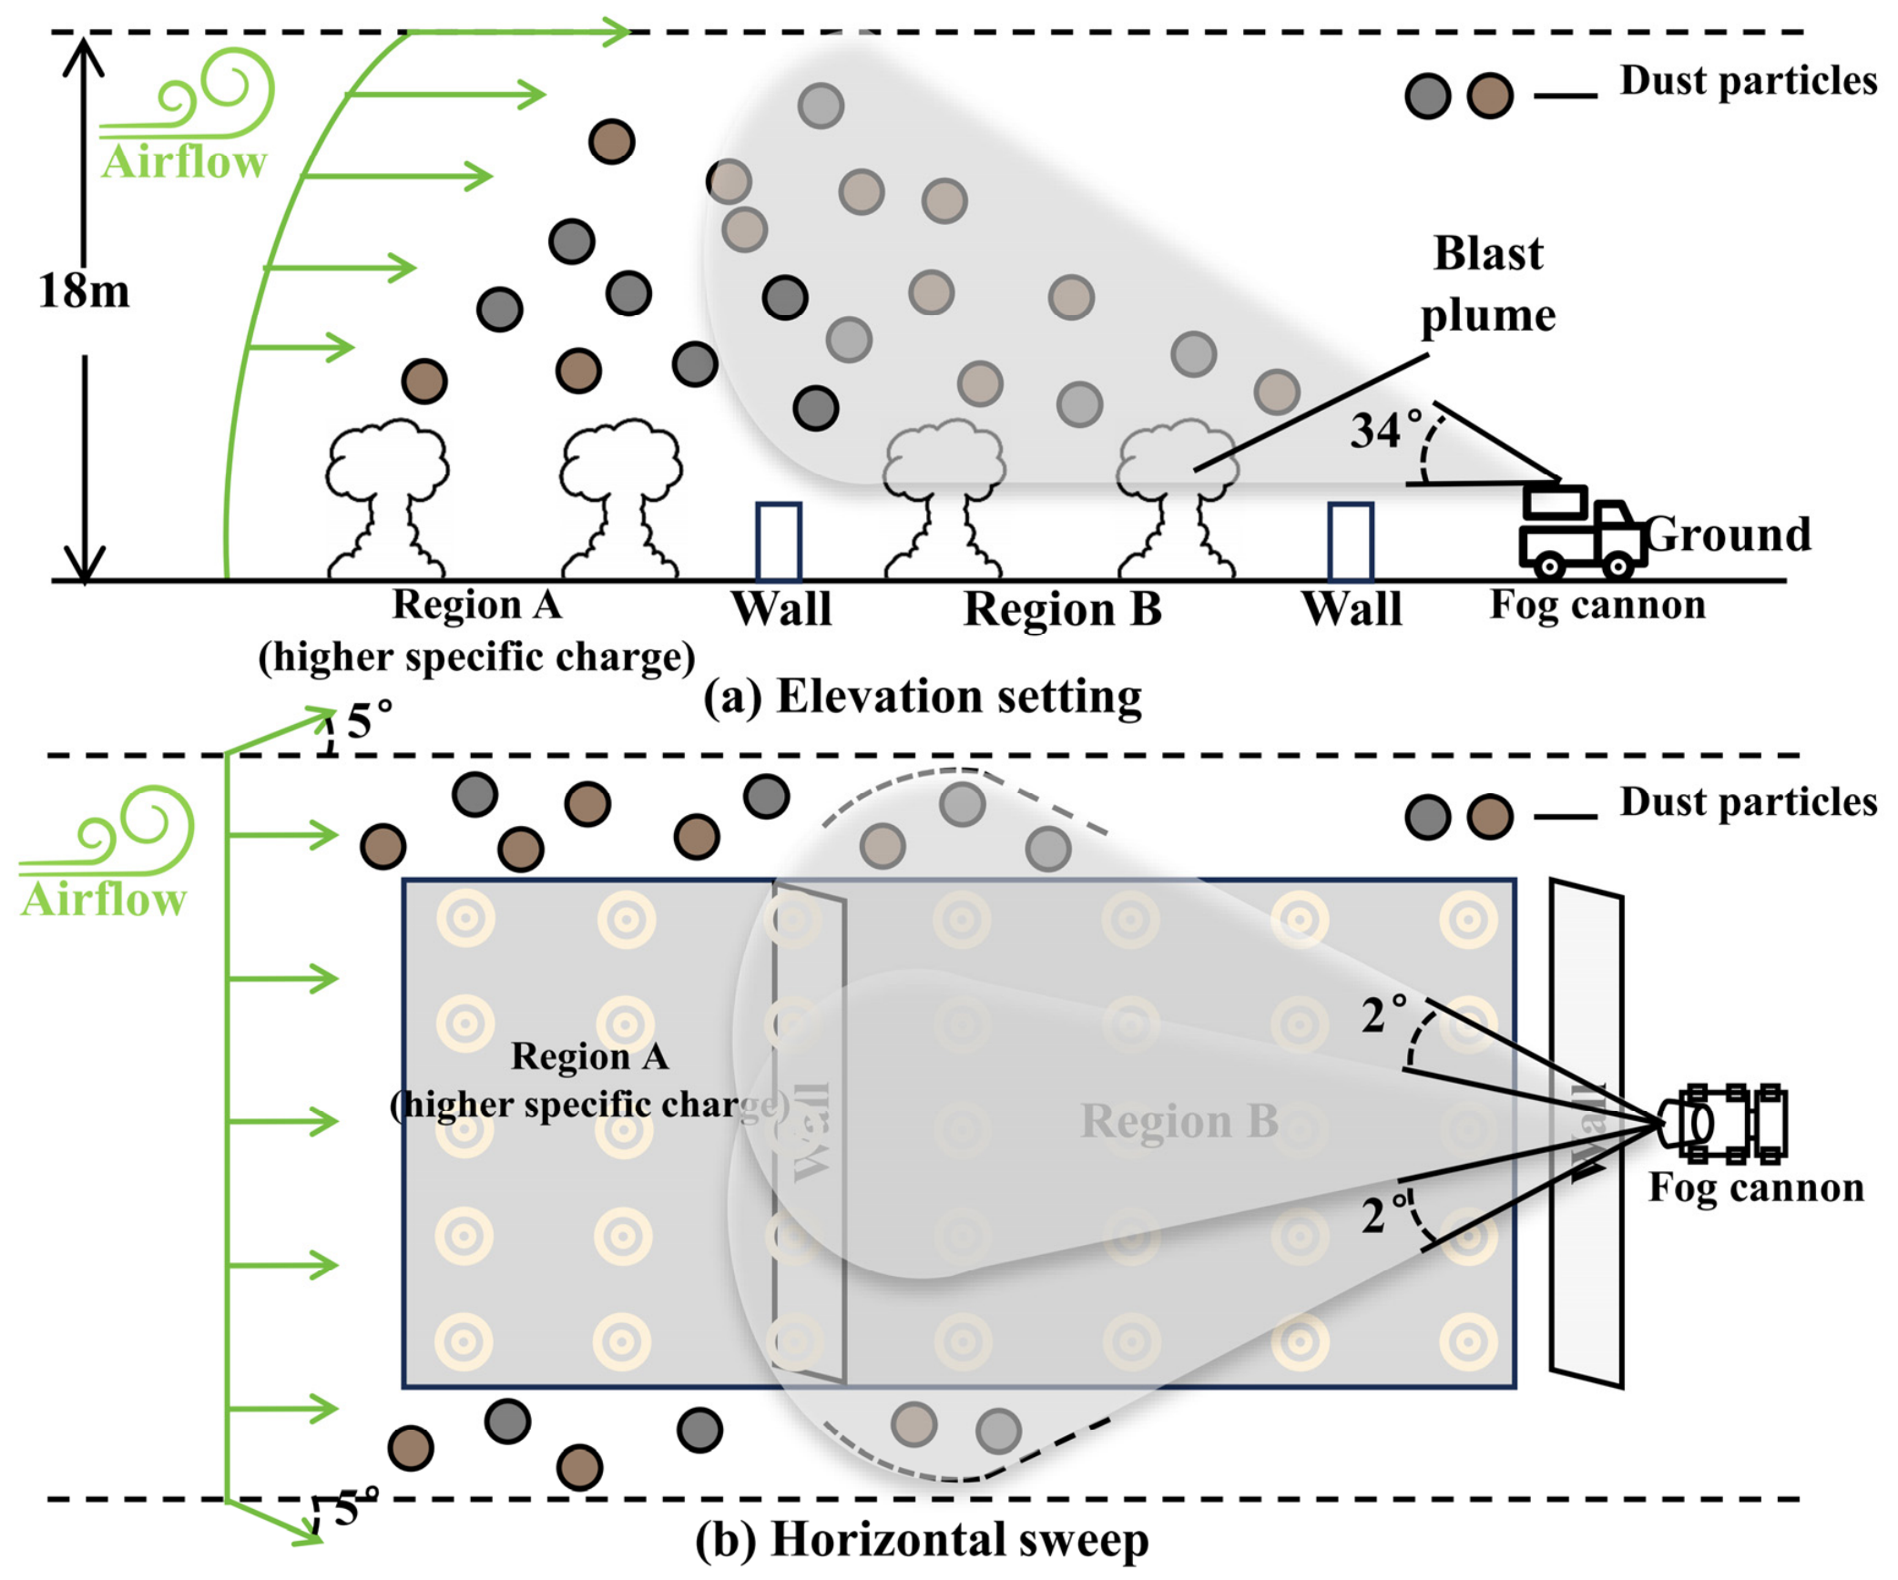
The simulated plume envelope was used as a geometric reference for field setup. The operational coverage target was set at 18 m, one metre above the model-dependent 17 m geometric estimate. This increment was a pragmatic field-commissioning margin rather than a quantified numerical uncertainty or safety factor. The fog cannon was positioned on the downwind side, and field aiming at the selected equipment position established an elevation angle of approximately 34°; this angle was not calculated from the 17 m value alone. The horizontal sweep was limited to ±2° around the principal transport direction to concentrate the droplet field around the observed corridor while allowing limited lateral coverage. This configuration defined the target suppression zone used in the field experiment (Figure 8).
Figure 8.
Vertical and horizontal design of the targeted fog-cannon coverage.
The numerical envelope and the field-selected equipment settings had different roles. The 17 m value came from the representative 100 μm particle case; 18 m was the operational coverage target with an empirical one-metre margin; and the approximately 34° elevation was established by field aiming at the selected downwind position. The ±2° sweep concentrated the mist around the main west-to-east corridor under the relatively stable observed direction. Neither the 18 m target nor the 34° angle is presented as the result of a numerical optimization. Actual coverage also depends on mist-beam width, equipment position, and spray reach.
4. Field Results
4.1. Three-Dimensional Pre-Blast Atmospheric Environment
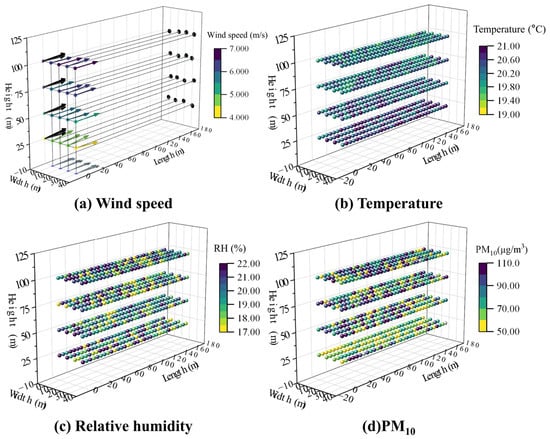
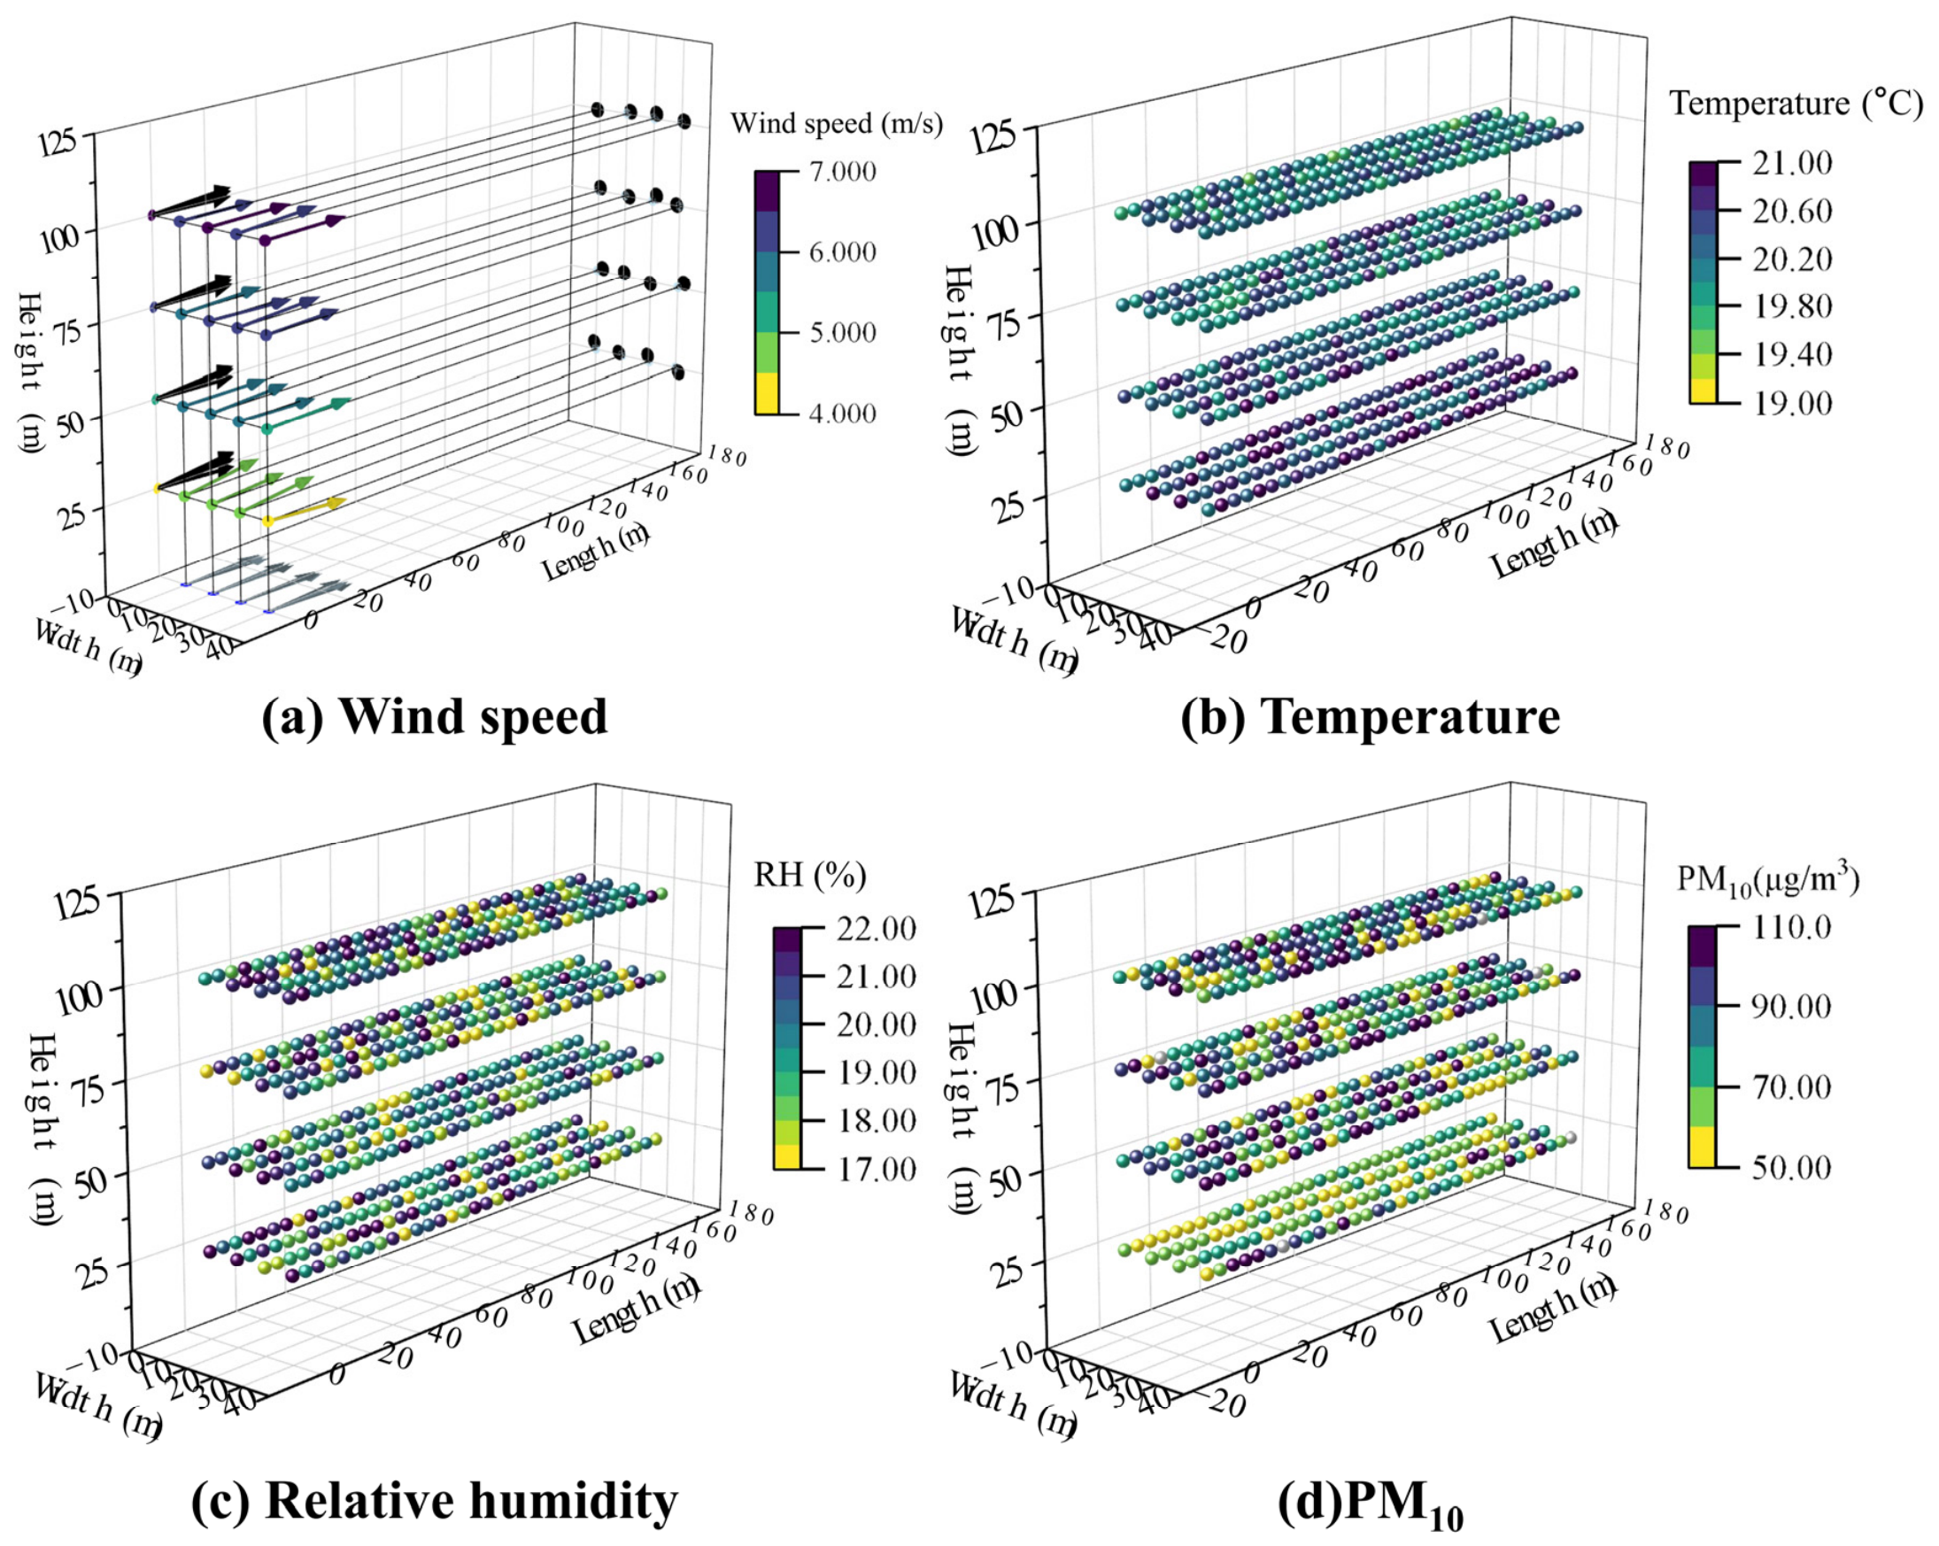
The UAV survey resolved a consistent west-to-east flow above the blast area despite near-calm conditions at ground level. Mean wind speed increased from 4.24 m s−1 at 25 m to 5.48, 5.95, and 6.51 m s−1 at 50, 75, and 100 m, respectively. Horizontal directional deviations were less than 5°. Temperature ranged from 19.56 to 21.00 °C, with a mean of 20.29 °C and a standard deviation of 0.34 °C. Relative humidity ranged from 17.02% to 22.04%, with a mean of 19.68% and a standard deviation of 1.50%. The temperature measurements showed limited variability across the survey. The wind profile and relative humidity indicated vertically sheared flow and a dry environment.
Background PM10 varied from 50.10 to 110.77 μg m−3, with a mean of 78.06 μg m−3 and a standard deviation of 17.207 μg m−3. The spatially clustered high values show that a single ground reference would not have represented the pre-blast particulate field. The combined vertical wind gradient and heterogeneous PM10 background support the use of a spatial rather than single-point configuration workflow. The three-dimensional distributions of wind speed, temperature, relative humidity, and background PM10 are shown in Figure 9.
Figure 9.
Three-dimensional distributions of wind speed, temperature, relative humidity, and background PM10.
4.2. Time-Resolved Evolution of the Dust Plume
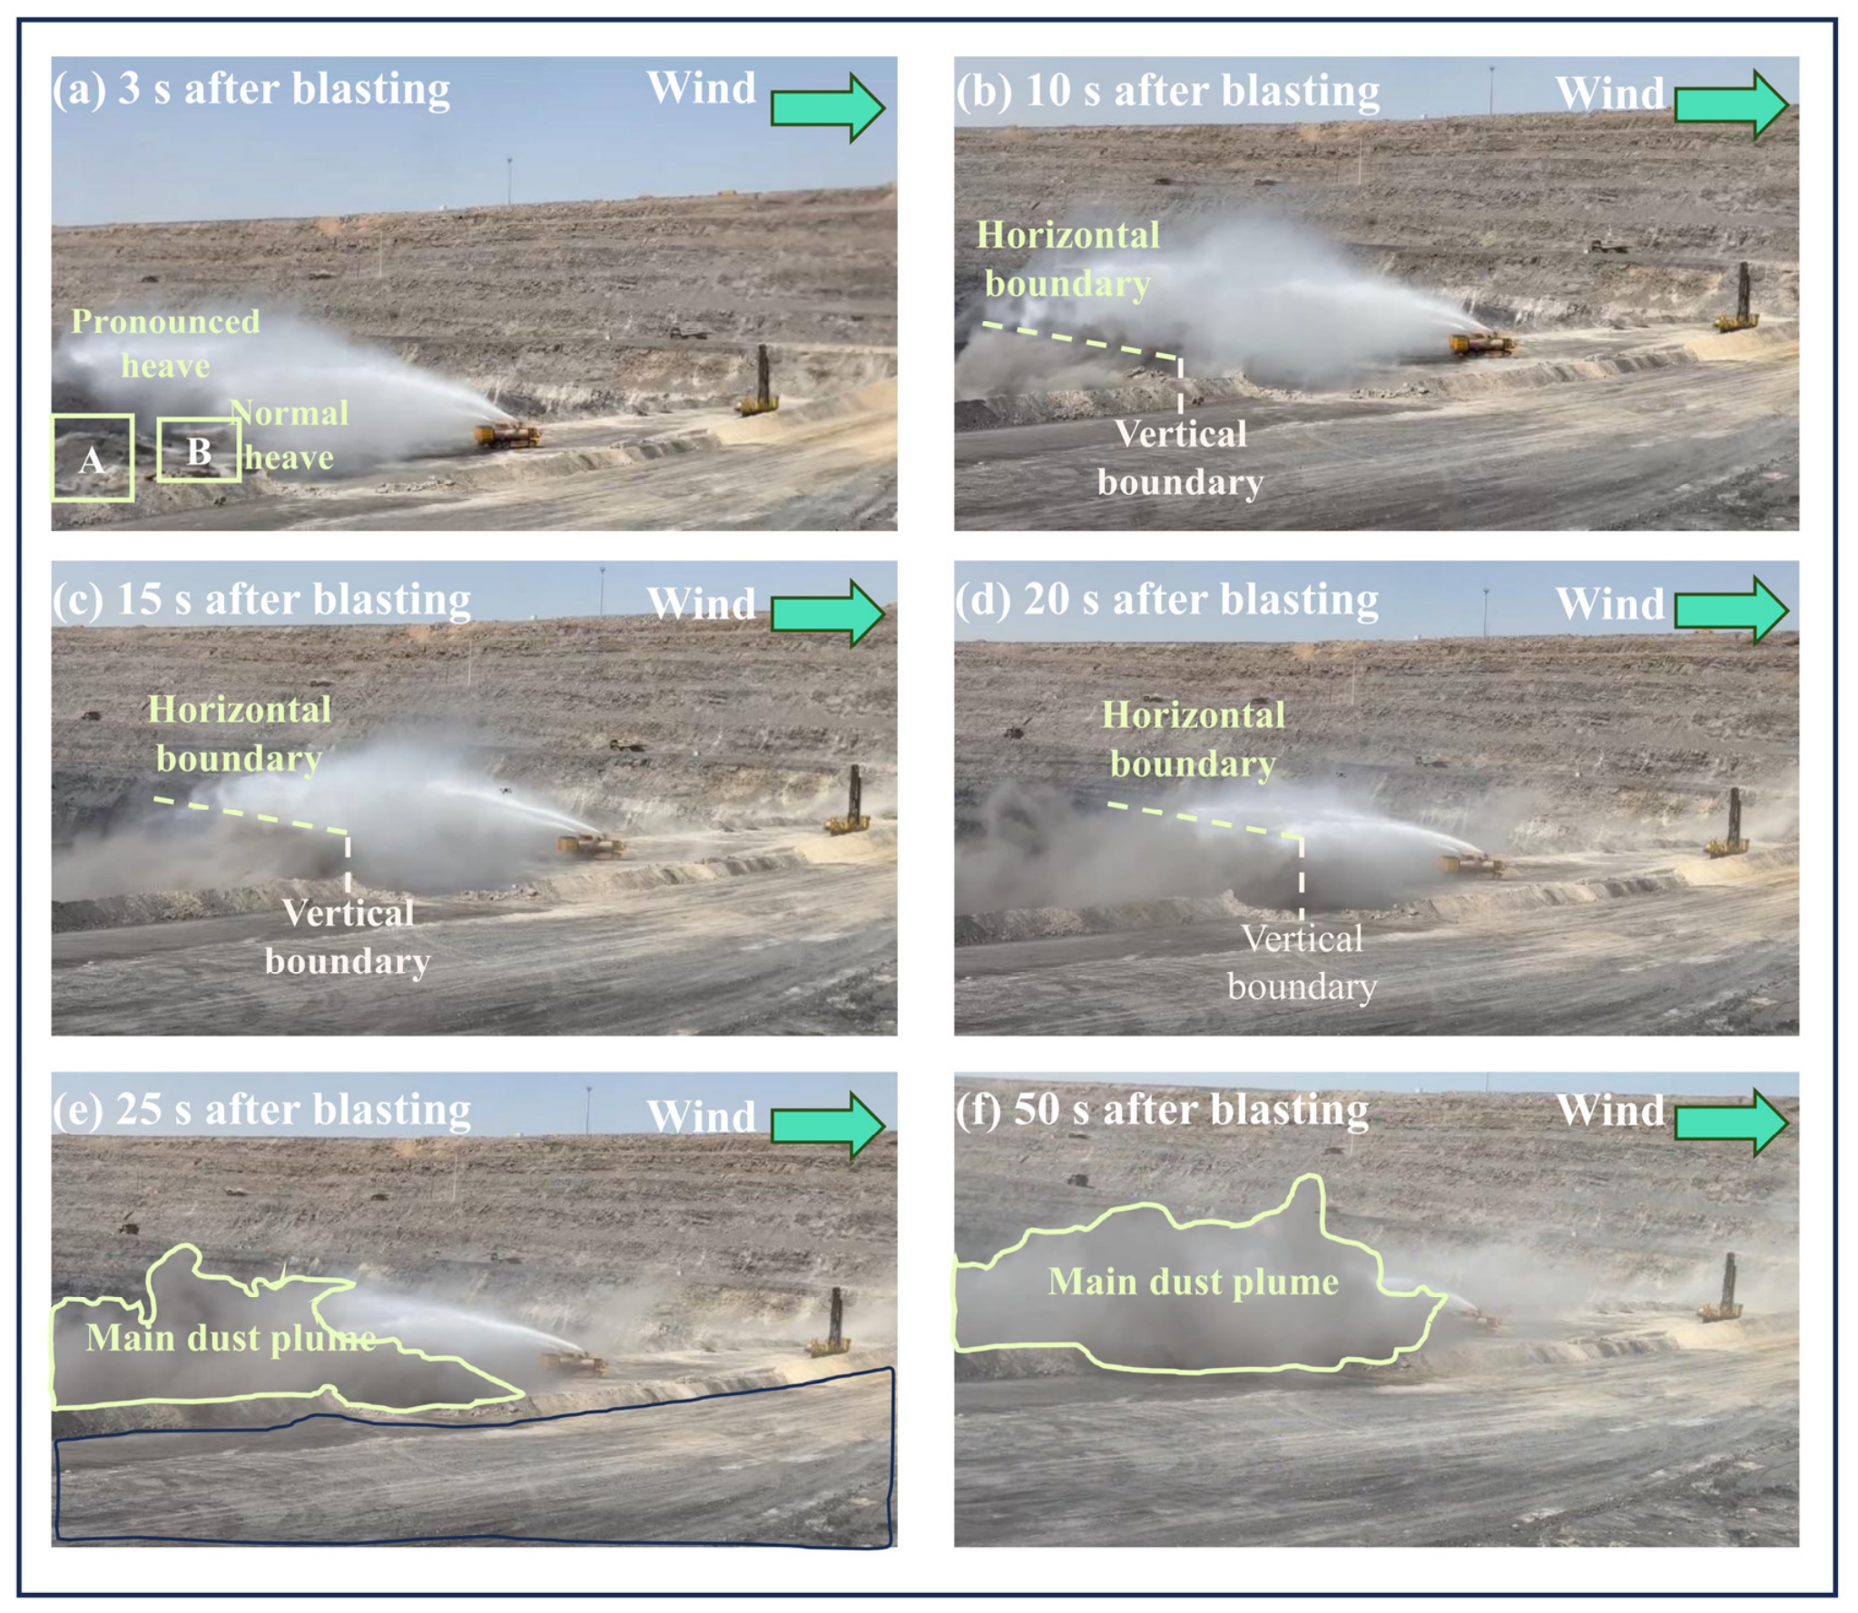
The field images showed that the spray intersected the principal dust-transport path during the early stage. At 10 s, the plume moved eastward from the source region and remained largely on the upwind side of the visible spray boundary. At 15 s, the mist extended above the main plume, consistent with the 34° elevation design. At 20 s, the plume approached the edge of the mist field and the visible plume–mist overlap began to contract. By 25 s, dust entered weaker parts of the spray field, and by 50 s the plume had passed beyond the original coverage boundary. The visual sequence therefore identified a visible plume–mist alignment window of approximately 10–20 s under the tested configuration. The complete field-image sequence is shown in Figure 10.
Figure 10.
Time sequence of the targeted fog-cannon field experiment.
4.3. Image-Based Regional Dust-Intensity Contrasts
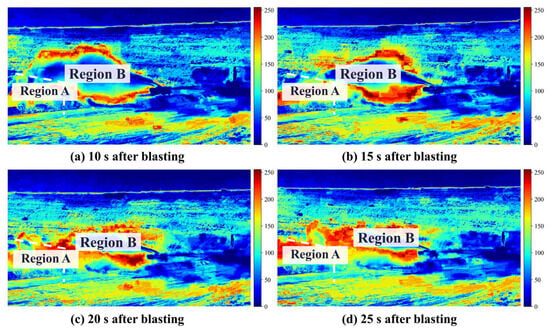
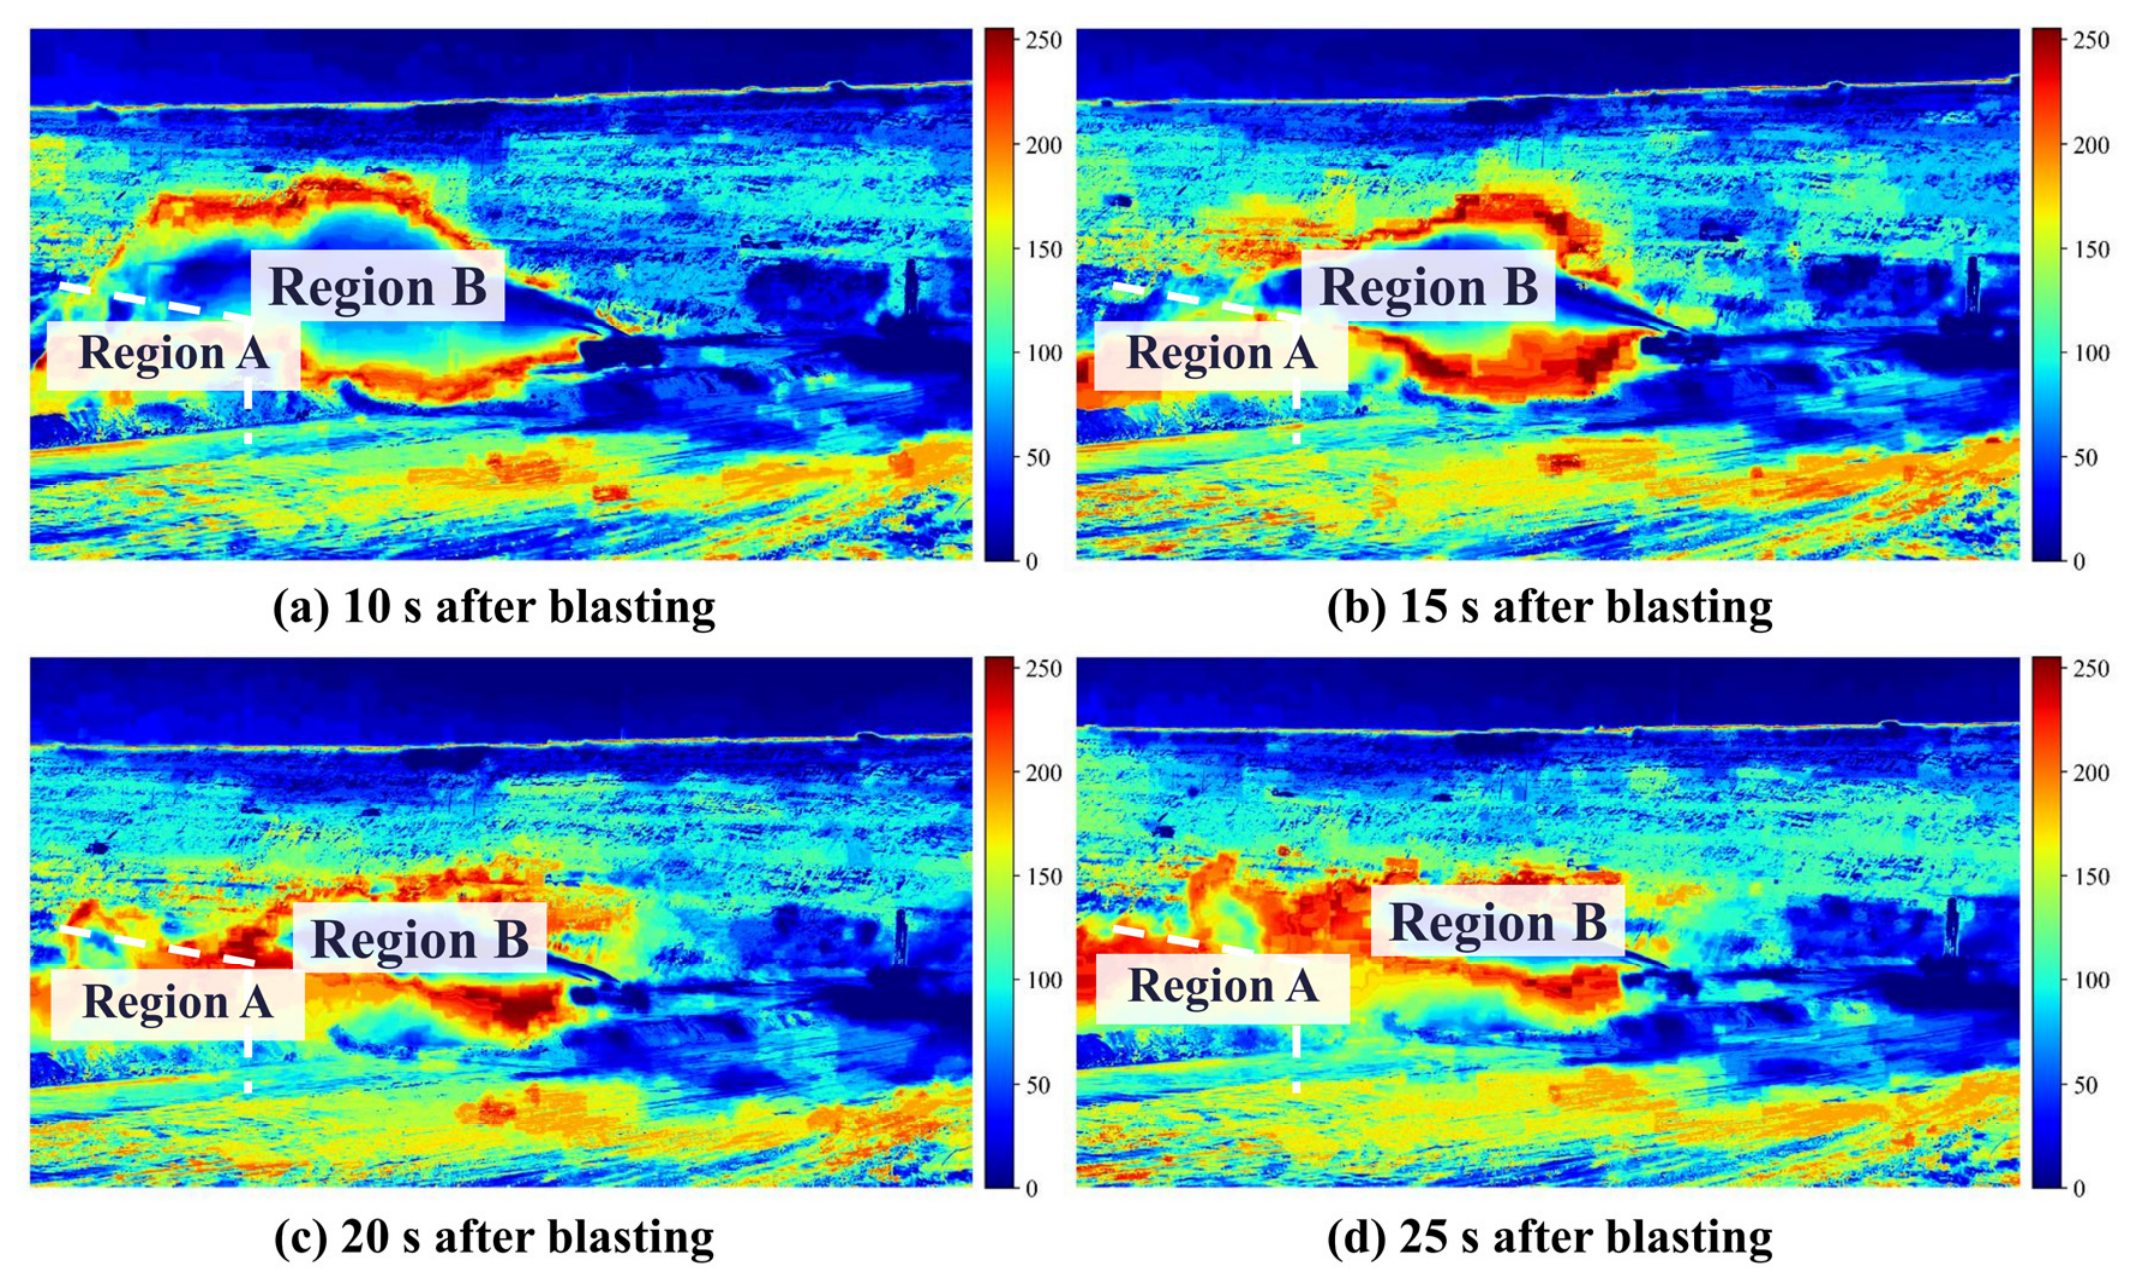
The CIELab mapping showed a continuous high-intensity dust band in Region A and a smaller high-intensity area in Region B during the early interval. The image dust-intensity metrics in Regions A and B were 113.81 and 13.25, respectively, at 10 s, corresponding to a relative contrast of 88.36%. The relative contrast decreased to 79.09% at 15 s and 70.66% at 20 s. At 25 s, the Region B metric increased to 96.52 and the relative contrast fell to 42.03%. This temporal decay agrees with the visible contraction of the mist envelope, although partial confusion between water mist and dust may raise the Region B image metric. The corresponding CIELab distributions are shown in Figure 11, and the regional metrics are summarized in Table 4.
Figure 11.
CIELab-based visualization of regional dust-intensity contrasts at 10–25 s.
Table 4.
Image-derived regional dust-intensity metrics and relative contrasts.
4.4. UAV-Based PM10 Response
The ten retained Region A samples had a mean PM10 concentration of 620.55 μg m−3 and a peak of 985.83 μg m−3. For retained Region B samples 11–20, the mean and peak concentrations were 74.36 and 99.29 μg m−3, giving an 88.02% regional contrast relative to the Region A mean. For retained samples 21–35, the Region B mean was 86.55 μg m−3 and the regional contrast was 86.05%. For retained samples 36–50, the Region B mean increased to 312.71 μg m−3 and the regional contrast declined to 49.61%. The three stages describe the retained sequential record obtained at the two monitoring locations and heights. The retained PM10 sequence and corresponding stage statistics are shown in Figure 12 and Table 5, respectively.
Figure 12.
UAV-measured PM10 sequence over Regions A and B. The horizontal axis represents the retained 1-Hz sample index after removal of transition records and is indexed to the retained sequence.
Table 5.
UAV PM10 statistics for the retained sequential monitoring stages.
5. Discussion
5.1. CFD-Informed Configuration and Field Consistency
The principal engineering result is that the control decision changed when the elevated wind field was measured. Ground observations suggested a near-calm condition, whereas UAV profiles showed a coherent west-to-east flow that strengthened with height. UAV particulate and meteorological studies have demonstrated the value of resolving vertical atmospheric structure [23,24,25,26], and mine-scale studies have emphasized the strong control exerted by local meteorology and pit topography [17,18]. In the present case, the UAV data provided the transport direction, while CFD supplied the early vertical plume envelope needed to translate monitoring into equipment settings.
The archived CFD design case provided a model-dependent geometric reference for the initial configuration, based on the assumed 100 μm particle diameter, uniform 5 m s−1 inlet, computational source representation, and stored solver settings. Field images subsequently showed eastward transport and mist extending above the main visible plume during the early interception stage, qualitatively supporting the setup intent. This visual correspondence does not validate the 17 m value or establish a CFD prediction for PM10; quantitative validation would require co-located plume-height and size-resolved concentration measurements. The CFD outputs describe the first 10 s, whereas the field sequence follows plume evolution through 50 s. The later breakthrough therefore characterizes the operating envelope observed in the tested field configuration. The archived CFD files document the production mesh, solver, phase coupling, particle inputs, and 0.01 s time step reported in Section 3; independent mesh and time-step series were not available for quantitative discretization-uncertainty estimates.
5.2. Qualitative Correspondence of Image and PM10 Evidence
The image sequence and PM10 measurements used different spatial and temporal sampling schemes. The image-based results refer to actual image times of 10–25 s, whereas the PM10 results refer to retained sequential sample windows after transition records were excluded. Both evidence streams show a strong early-to-middle regional contrast followed by a weaker late contrast as dust extended beyond the original mist envelope. This qualitative agreement supports process interpretation across the two evidence streams. The qualitative correspondence between the two evidence streams is summarized in Table 6.
Table 6.
Qualitative correspondence between image observations and retained UAV PM10 stages.
5.3. Engineering Implications and Evidence Boundaries
The contribution lies in the targeted alignment of an established atomization process with the observed plume. Previous work has established the importance of droplet size, nozzle angle, atomization pressure, and water-mist generation [11,12,13]. The present workflow adds a site-specific decision layer that determines where and when this droplet field should be placed. It also connects mine-scale meteorological sensing with short-time plume prediction, complementing longer-term monitoring and prediction systems reported for surface mines [18,34].
The evidence defines a site-specific operating boundary. Regions A and B had different specific charges, and PM10 was sampled sequentially at different heights and time windows. The image metric represents relative optical intensity and can include mist-boundary pixels. Accordingly, the reported percentages describe the observed regional and temporal contrasts of this field case and do not establish causal fog-cannon removal efficiency. The evidence most strongly supports the decision logic of measuring the elevated transport field, estimating an early geometric plume envelope with a representative coarse-particle CFD case, and aligning the fog cannon with that envelope.
5.4. Generalisability
The workflow—measuring the elevated transport field, estimating an early geometric plume envelope with a site-specific design case, and configuring the fog cannon accordingly—is transferable in principle. The numerical results and operating parameters reported here, including the approximately 17 m geometric estimate, 18 m coverage target, 34° elevation angle, and ±2° sweep, remain site-specific and require verification under each new site’s conditions. Application at another mine requires site-specific remeasurement of bench and pit geometry, elevated wind conditions, blast source strength, and the available fog-cannon reach, flow rate, elevation range, and sweep limits. Repeating the configuration step is particularly important where terrain channeling, wind shear, specific charge, or equipment capacity differs from the present case.
5.5. Occupational and Environmental Implications
The observed transient PM10 peaks are relevant to short-duration worker exposure near the blast and to the potential for downwind transport beyond the immediate work area. Comparison with 8-h occupational time-weighted averages or 24-h ambient-air criteria requires synchronized fixed-site monitoring over the applicable averaging periods, together with local background and boundary measurements. The present data identify short-duration exposure-control priorities and potential downwind transport pathways.
5.6. Limitations
The field evaluation was based on one principal blast without independent repetition. Regions A and B differed in specific charge, and PM10 was sampled sequentially at different heights without a synchronized same-height control or stage-specific background correction. The exact UAV transfer duration was not logged. The PM module had only manufacturer calibration, without an independent site co-location check, and its below-10-s response specification means that adjacent 1-Hz outputs are not independent instantaneous measurements. The retained peak reached 98.6% of the stated upper range, so short values near the peak may be affected by upper-range truncation. The image metric can include mist-boundary pixels. In the numerical component, the uniform 5 m s−1 inlet was not measured below 25 m, the monodisperse 100 μm injection does not represent PM10, and the computational source mass was not calibrated to the absolute field dust release. The available field record therefore does not provide a quantitative validation error for the 17 m geometric envelope. The archived numerical project contains the production mesh and time step but not independently rerun mesh and time-step sensitivity series. Continuous fog-cannon flow and pressure records were also unavailable. These constraints limit causal attribution and broad numerical generalization. The primary supported outcomes are the site-specific regional patterns and the documented configuration workflow. Future work should use repeated blasts, synchronized same-height monitors, co-located background measurements, size-resolved plume-height observations, logged equipment operating variables, calibrated source terms, and formal grid/time-step verification.
6. Conclusions
This study evaluated a UAV-guided fog-cannon configuration workflow for blast-dust control at an open-pit coal mine. Historical cases identified mismatches between source intensity, elevated transport, and fixed spraying. In the principal field case, UAV profiles revealed west-to-east flow strengthening with height. Under the archived numerical settings, the CFD design case produced a model-dependent early-plume geometric envelope extending to approximately 17 m for the assumed monodisperse 100 μm particles. This estimate was used as a site-specific geometric reference for an 18 m operational coverage target and downwind placement. It does not define the upper extent of PM10 or of the full dust-size distribution. Field commissioning used an elevation angle of approximately 34° and a horizontal sweep of ±2°. Image-based regional contrasts decreased from 88.36% at 10 s to 42.03% at 25 s, and the PM10 regional contrast in the late retained sequence was 49.61%. For the investigated field event, the results document the application of a site-specific workflow linking elevated wind sensing and a short-time geometric plume estimate to equipment configuration. The numerical envelope and equipment settings require site-specific verification before transfer to other operating conditions.
Author Contributions
Conceptualization, Y.Q., J.Y. and W.Z.; methodology, Y.Q., P.Z. and B.L.; software, P.Z. and B.L.; validation, J.Y. and W.Z.; formal analysis, Y.Q. and P.Z.; investigation, Y.Q., P.Z. and B.L.; resources, J.Y. and W.Z.; data curation, P.Z. and B.L.; writing—original draft preparation, Y.Q.; writing—review and editing, J.Y., W.Z., P.Z. and B.L.; visualization, Y.Q., P.Z. and B.L.; supervision, J.Y. and W.Z.; project administration, Y.Q. and J.Y.; funding acquisition, W.Z. All authors have read and agreed to the published version of the manuscript.
Funding
This work was supported by the National Natural Science Foundation of China (Grant No. 52374145).
Data Availability Statement
The data presented in this study are available from the corresponding author upon reasonable request. The data are not publicly available due to confidentiality restrictions imposed by the mine operator.
Acknowledgments
The authors thank the Haerwusu Open-Pit Coal Mine for providing access to the study site.
Conflicts of Interest
Author Peiyi Zhang was employed by the company China Energy Baorixile Energy Co., Ltd., Hulunbuir, China. The remaining authors declare that the research was conducted in the absence of any commercial or financial relationships that could be construed as a potential conflict of interest.
References
- Kung, H.-C.; Lin, W.-C.; Huang, B.-W.; Mutuku, J.K.; Chang-Chien, G.-P. Techniques for Suppressing Mineral Dust Aerosol from Raw Material Stockpiles and Open Pit Mines: A Review. Aerosol Air Qual. Res. 2024, 24, 230166. [Google Scholar] [CrossRef] [Scilit]
- Yan, J.; Wang, Z.; Lu, X.; Wu, Y.; Luo, H.; Liu, X. Physical and Chemical Characteristics of Explosive Dust at Large Open-Pit Coal Mines in Inner Mongolia, China and Dust Control Research. Atmosphere 2023, 14, 1678. [Google Scholar] [CrossRef] [Scilit]
- Luo, H.; Zhou, W.; Jiskani, I.M.; Wang, Z. Analyzing Characteristics of Particulate Matter Pollution in Open-Pit Coal Mines: Implications for Green Mining. Energies 2021, 14, 2680. [Google Scholar] [CrossRef] [Scilit]
- Lilic, N.; Cvjetic, A.; Knezevic, D.; Milisavljevic, V.; Pantelic, U. Dust and Noise Environmental Impact Assessment and Control in Serbian Mining Practice. Minerals 2018, 8, 34. [Google Scholar] [CrossRef] [Scilit]
- Jia, Z.; Song, Z.; Fan, J.; Jiang, J.; Guo, S. Numerical Simulation Study on Dust Suppression Mechanism of Burning Rock Blasting in Open-Pit Mine. Front. Earth Sci. 2022, 10, 832650. [Google Scholar] [CrossRef] [Scilit]
- Ding, X.; Zhou, W.; Lu, X.; Li, M.; Manda, E.; Shi, X.; Luan, B.; Qi, C. Distribution Characteristics of Fragments Size and Optimization of Blasting Parameters Under Blasting Impact Load in Open-Pit Mine. IEEE Access 2019, 7, 137501. [Google Scholar] [CrossRef] [Scilit]
- Wang, Z.-M.; Zhou, W.; Jiskani, I.M.; Ding, X.-H.; Liu, Z.-C.; Qiao, Y.-Z.; Luan, B. Dust reduction method based on water infusion blasting in open-pit mines: A step toward green mining. Energy Sources Part A Recovery Util. Environ. Eff. 2021, 47, 6029. [Google Scholar] [CrossRef] [Scilit]
- Ding, X.; Liu, X.; Ao, Z.; Qin, H.; Li, X.; Huang, K.; Xiao, S.; Wu, M.; Zhang, D.; Zhu, C. Research on blasting mechanism and blasting effect of aqueous media in open pit coal mines. Sci. Rep. 2023, 13, 19136. [Google Scholar] [CrossRef] [Scilit] [PubMed]
- Huang, Z.; Ge, S.; Jing, D.; Yang, L. Numerical simulation of blasting dust pollution in open-pit mines. Appl. Ecol. Environ. Res. 2019, 17, 10313–10333. [Google Scholar] [CrossRef] [Scilit]
- Shi, J.; Zhao, H.; Xu, W.; Zhang, W.; An, H. Study on Dust Removal Technology of Explosive Water Mist in Drill and Blast Tunnelling. Period. Polytech. Civ. Eng. 2023, 67, 819–834. [Google Scholar] [CrossRef] [Scilit]
- Wang, P.; Tan, X.; Cheng, W.; Guo, G.; Liu, R. Dust removal efficiency of high pressure atomization in underground coal mine. Int. J. Min. Sci. Technol. 2018, 28, 685. [Google Scholar] [CrossRef] [Scilit]
- Lee, Y.-Y.; Yuan, C.-S.; Yen, P.-H.; Mutuku, J.K.; Huang, C.-E.; Wu, C.-C.; Huang, P.-J. Suppression Efficiency for Dust from an Iron Ore Pile Using a Conventional Sprinkler and a Water Mist Generator. Aerosol Air Qual. Res. 2022, 22, 210320. [Google Scholar] [CrossRef] [Scilit]
- Li, H.; Wang, J.; Wang, P.; Liu, J.; Yuan, X.; Han, H. Effect of the Installation Angle of Nozzle on the Atomizing Performance of Air-Assisted Spraying Dust Suppression Device. Atmosphere 2022, 13, 520. [Google Scholar] [CrossRef] [Scilit]
- Han, F.; Liu, J. Flow field characteristics and coal dust removal performance of an arc fan nozzle used for water spray. PLoS ONE 2018, 13, e0203875. [Google Scholar] [CrossRef] [Scilit] [PubMed]
- Wang, P.; Han, H.; Liu, R.; Li, Y.; Tan, X. Effects of Metamorphic Degree of Coal on Coal Dust Wettability and Dust-Suppression Efficiency via Spraying. Adv. Mater. Sci. Eng. 2020, 2020, 4854391. [Google Scholar] [CrossRef] [Scilit]
- Hu, S.; Gao, Y.; Feng, G.; Hu, F.; Liu, C.; Li, J. Experimental study of the dust-removal performance of a wet scrubber. Int. J. Coal Sci. Technol. 2021, 8, 228. [Google Scholar] [CrossRef] [Scilit]
- Wang, Z.; Zhou, W.; Jiskani, I.M.; Yan, J.; Luo, H. Optimizing open-pit coal mining operations: Leveraging meteorological conditions for dust removal and diffusion. Int. J. Coal Sci. Technol. 2024, 11, 54. [Google Scholar] [CrossRef] [Scilit]
- Liu, Z.; Zhang, R.; Ma, J.; Zhang, W.; Li, L. Analysis and Prediction of the Meteorological Characteristics of Dust Concentrations in Open-Pit Mines. Sustainability 2023, 15, 4837. [Google Scholar] [CrossRef] [Scilit]
- Joseph, G.M.D.; Hargreaves, D.M.; Lowndes, I.S. Reconciling Gaussian plume and Computational Fluid Dynamics models of particulate dispersion. Atmos. Environ. X 2020, 5, 100064. [Google Scholar] [CrossRef] [Scilit]
- Silvester, S.A.; Lowndes, I.S.; Hargreaves, D.M. A computational study of particulate emissions from an open pit quarry under neutral atmospheric conditions. Atmos. Environ. 2009, 43, 6415. [Google Scholar] [CrossRef] [Scilit]
- Yi, H.; Kim, M.; Lee, D.; Park, J. Applications of Computational Fluid Dynamics for Mine Ventilation in Mineral Development. Energies 2022, 15, 8405. [Google Scholar] [CrossRef] [Scilit]
- Xie, Z.; Xiao, Y.; Zhao, Q.; Lin, J. Transient analysis of dust exposure under different supply airflow angle in a blasting tunnel based on CFD. Energy Rep. 2022, 8, 45. [Google Scholar] [CrossRef] [Scilit]
- Wang, T.; Han, W.; Zhang, M.; Yao, X.; Zhang, L.; Peng, X.; Li, C.; Dan, X. Unmanned Aerial Vehicle-Borne Sensor System for Atmosphere-Particulate-Matter Measurements: Design and Experiments. Sensors 2019, 20, 57. [Google Scholar] [CrossRef] [Scilit] [PubMed]
- Li, L.; Zhang, R.; Li, Q.; Zhang, K.; Liu, Z.; Ren, Z. Multidimensional spatial monitoring of open pit mine dust dispersion by unmanned aerial vehicle. Sci. Rep. 2023, 13, 6815. [Google Scholar] [CrossRef] [Scilit] [PubMed]
- Zafra-Pérez, A.; Boente, C.; de la Campa, A.S.; Gómez-Galán, J.A.; de la Rosa, J.D. A novel application of mobile low-cost sensors for atmospheric particulate matter monitoring in open-pit mines. Environ. Technol. Innov. 2023, 29, 102974. [Google Scholar] [CrossRef] [Scilit]
- Brosy, C.; Krampf, K.; Zeeman, M.; Wolf, B.; Junkermann, W.; Schäfer, K.; Emeis, S.; Kunstmann, H. Simultaneous multicopter-based air sampling and sensing of meteorological variables. Atmos. Meas. Tech. 2017, 10, 2773. [Google Scholar] [CrossRef] [Scilit]
- Cao, R.; Li, B.; Wang, H.-W.; Tao, S.; Peng, Z.-R.; He, H.-d. Vertical and Horizontal Profiles of Particulate Matter and Black Carbon Near Elevated Highways Based on Unmanned Aerial Vehicle Monitoring. Sustainability 2020, 12, 1204. [Google Scholar] [CrossRef] [Scilit]
- Peng, Z.-R.; Wang, D.; Wang, Z.; Gao, Y.; Lu, S. A study of vertical distribution patterns of PM2.5 concentrations based on ambient monitoring with unmanned aerial vehicles: A case in Hangzhou, China. Atmos. Environ. 2015, 123, 357. [Google Scholar] [CrossRef] [Scilit]
- Liu, B.; Wu, C.; Ma, N.; Chen, Q.; Li, Y.; Ye, J.; Martin, S.T.; Li, Y.J. Vertical profiling of fine particulate matter and black carbon by using unmanned aerial vehicle in Macau, China. Sci. Total Environ. 2020, 709, 136109. [Google Scholar] [CrossRef] [Scilit] [PubMed]
- Hossein Motlagh, N.; Kortoçi, P.; Su, X.; Lovén, L.; Hoel, H.K.; Bjerkestrand Haugsvær, S.; Srivastava, V.; Gulbrandsen, C.F.; Nurmi, P.; Tarkoma, S. Unmanned Aerial Vehicles for Air Pollution Monitoring: A Survey. IEEE Internet Things J. 2023, 10, 21687. [Google Scholar] [CrossRef] [Scilit]
- Villa, T.F.; Jayaratne, E.R.; Gonzalez, L.F.; Morawska, L. Determination of the vertical profile of particle number concentration adjacent to a motorway using an unmanned aerial vehicle. Environ. Pollut. 2017, 230, 134. [Google Scholar] [CrossRef] [Scilit] [PubMed]
- Girdwood, J.; Smith, H.; Stanley, W.; Ulanowski, Z.; Stopford, C.; Chemel, C.; Doulgeris, K.-M.; Brus, D.; Campbell, D.; Mackenzie, R. Design and field campaign validation of a multi-rotor unmanned aerial vehicle and optical particle counter. Atmos. Meas. Tech. 2020, 13, 6613. [Google Scholar] [CrossRef] [Scilit]
- Altstädter, B.; Platis, A.; Wehner, B.; Scholtz, A.; Wildmann, N.; Hermann, M.; Käthner, R.; Baars, H.; Bange, J.; Lampert, A. ALADINA—An unmanned research aircraft for observing vertical and horizontal distributions of ultrafine particles within the atmospheric boundary layer. Atmos. Meas. Tech. 2015, 8, 1627. [Google Scholar] [CrossRef] [Scilit]
- Tripathi, A.K.; Aruna, M.; Parida, S.; Nandan, D.; Elumalai, P.V.; Prakash, E.; Isaac JoshuaRamesh Lalvani, J.S.C.; Rao, K.S. Integrated smart dust monitoring and prediction system for surface mine sites using IoT and machine learning techniques. Sci. Rep. 2024, 14, 7587. [Google Scholar] [CrossRef] [Scilit] [PubMed]
- Argyropoulos, C.D.; Markatos, N.C. Recent advances on the numerical modelling of turbulent flows. Appl. Math. Model. 2015, 39, 693–732. [Google Scholar] [CrossRef] [Scilit]
- Launder, B.E.; Spalding, D.B. The numerical computation of turbulent flows. Comput. Methods Appl. Mech. Eng. 1974, 3, 269–289. [Google Scholar] [CrossRef] [Scilit]
- Shih, T.-H.; Liou, W.W.; Shabbir, A.; Yang, Z.; Zhu, J. A new k-epsilon eddy viscosity model for high Reynolds number turbulent flows—Model development and validation. Comput. Fluids 1995, 24, 227–238. [Google Scholar] [CrossRef] [Scilit]
- Markatos, N.C. Mathematical modelling of single- and two-phase flow problems in the process industries. Oil Gas. Sci. Technol.—Rev. d’IFPEN 1993, 48, 631–662. [Google Scholar] [CrossRef] [Scilit]
- Spalding, D.B. A general purpose computer program for multi-dimensional one- and two-phase flow. Math. Comput. Simul. 1981, 23, 267–276. [Google Scholar] [CrossRef] [Scilit]
- Morsi, S.A.; Alexander, A.J. An investigation of particle trajectories in two-phase flow systems. J. Fluid Mech. 1972, 55, 193–208. [Google Scholar] [CrossRef] [Scilit]



Disclaimer/Publisher’s Note: The statements, opinions and data contained in all publications are solely those of the individual author(s) and contributor(s) and not of MDPI and/or the editor(s). MDPI and/or the editor(s) disclaim responsibility for any injury to people or property resulting from any ideas, methods, instructions or products referred to in the content. |
© 2026 by the authors. Licensee MDPI, Basel, Switzerland. This article is an open access article distributed under the terms and conditions of the Creative Commons Attribution (CC BY) license.