


Abstract
When a markerless system is validated against marker-based motion capture, the result is usually a single number: the average distance between the two systems at a given joint. That number is read as the accuracy of the pose estimator, but it also contains everything else in the measurement chain—where the markers were placed, how well the systems were synchronised, and how good the calibration was. We asked whether differences and rankings between pose estimators remain interpretable once this uncertainty is accounted for. In a single-participant methodological case study, three checkpoints from MMPose, an open-source pose-estimation toolbox (ViTPose, RTMPose-m, HRNet-w32), were compared against an OptiTrack reference using a calibrated stereo pair of industrial cameras in recordings of the elbow and wrist. The distance between the marker-pair midpoint and the triangulated keypoint had a median of 23.9 to 47.1 mm. Calibration, reconstruction scale, temporal offset and median sampling error gave the group medians a combined standard uncertainty of 4.5–14.9 mm (a lower bound, excluding marker placement). No difference between the three checkpoints was resolvable above the uncertainty of the measurement chain, and the leading checkpoint changed when the calibration was resampled. As supporting mechanisms, marker placement produced an offset comparable to the measured distance, whereas the temporal offset barely changed it. These numbers are specific to this participant and protocol; the transferable contribution is the validation and uncertainty-analysis framework.
1. Introduction
Human motion capture provides quantitative measurements of how body segments and anatomical landmarks move over time. It underpins clinical gait and rehabilitation assessment, sports biomechanics, occupational ergonomics and human–robot collaboration, and each of these places different demands on accuracy, portability, preparation time and cost [1,2]. In industrial settings, the requirement is sharpest: a robot sharing a workspace with an operator must know where that operator’s limbs are and must know it without markers or wearable sensors that would interfere with the work being done. Markerless capture has been identified as the scalable option for ergonomic risk analysis on the factory floor, though its accuracy under field conditions remains to be characterized [3].
Several technologies are available, each trading accuracy against practicality in different ways. Marker-based optical systems track reflective markers with calibrated infrared cameras and remain the laboratory reference. Manufacturer guidance indicates submillimetre reconstruction residuals for well-observed markers under controlled conditions [4]. Their limitations stem not from a lack of precision, but from their cost, the dedicated volume they require, and the need to apply markers before every recording. Inertial suits relax the spatial constraint at lower cost, but must be worn, and they depend on sensor-to-segment calibration and drift compensation. Depth cameras reduce cost and preparation further but depend on working range, resolution and a sensor-specific skeleton model. Markerless systems using ordinary RGB cameras avoid both markers and wearable sensors and have become practical as deep-learning pose estimators have matured; their accuracy instead depends on image quality, keypoint visibility, model generalisation and camera geometry [1,2,5].
Even within markerless capture, the camera configuration matters. A monocular system is the simplest to deploy but cannot resolve depth and scale from a single image without additional assumptions, and its accuracy for upper-limb tasks remains limited [6,7]. A large multi-camera installation provides redundancy against occlusion but approaches the cost and complexity of the marker-based system it would replace. A calibrated stereo pair sits between these options: it reconstructs metric positions directly by triangulation, requires only two cameras, and can be set up outside a dedicated laboratory. That simplicity comes with a trade-off, however: with only two views, a small difference in keypoint localisation between the cameras changes the disparity, and the resulting error is amplified in depth.
Markerless systems are validated by comparison against marker-based capture, and the agreement is almost always reported as an aggregate: one distance per joint or one averaged across joints [8,9,10,11,12]. That figure is generally read as the accuracy of the pose estimator, but it is not only that. The reference marker sits on the skin, while the estimated keypoint approximates a joint centre inside the limb, so a systematic offset exists by construction and depends on where the markers were placed; soft-tissue movement adds to it [13,14], and landmark misplacement propagates directly into the estimated kinematics [15]. The two systems are rarely synchronised in hardware, so any temporal offset produces an error that grows with limb speed. The transforms relating the two coordinate frames carry their own uncertainty [16], and lens distortion, triangulation geometry and per-view occlusion each contribute further. All of these belong to the measurement protocol rather than to the estimator, and all end up inside the same number. Two laboratories can, therefore, report different figures for the same model because their marker protocols, camera geometry or synchronisation differ, and a reported error cannot be attributed to the method under test.
This has a direct consequence for comparing pose estimators. Contemporary architectures achieve closely matched accuracy on two-dimensional benchmarks [17,18,19], so any difference between them after stereo reconstruction may be smaller than the uncertainty introduced by their shared acquisition pipeline. Determining whether such a difference is resolvable requires decomposing the aggregate discrepancy rather than reporting it as a single value.
The present study asks whether differences and rankings among contemporary pose-estimation checkpoints remain interpretable once the uncertainty of the validation chain is accounted for. To interpret the measured marker-to-keypoint discrepancy, its components are also separated and quantified; they are treated as mechanisms supporting the comparison rather than as findings in their own right. Three MMPose checkpoints [20], one from each of three architectures—ViTPose [18], RTMPose-m [19] and HRNet-w32 [17], representing transformer-based, real-time and high-resolution convolutional designs with closely matched benchmark accuracy—were compared against an eight-camera OptiTrack system [4] using a calibrated stereo pair of industrial cameras across seven single-joint sessions covering the left and right elbow and wrist of a single participant. The study is a single-participant methodological case study: its numerical results are specific to this participant and experimental protocol, and the transferable contribution is the validation and uncertainty-analysis framework. The contributions are as follows:
- Interpretability of checkpoint differences under validation-chain uncertainty. For the elbow and wrist examined here, the three checkpoints show no difference resolvable within the uncertainty of the measurement chain: the one pairwise comparison of twelve that remains significant after Bonferroni correction comes from a group recorded in a single session, and which checkpoint ranks first changes when the calibration is resampled. A ranking obtained from a single calibration estimate would, therefore, imply more certainty than the chain supports.
- A validation and uncertainty-analysis framework for the comparison. We separate and estimate four contributions to the marker-to-keypoint distance—marker placement, temporal offset, extrinsic calibration and reconstruction scale—and so, bound how much of the measured distance can be attributed to the pose estimators themselves. Marker placement is bounded from above; the other three, together with the sampling error of the median, give a combined standard uncertainty for each joint-side group, which qualifies the absolute discrepancies. Differences between checkpoints are read against the session-level minimum detectable difference and the stability of the ranking under resampling of the calibration.
- Four methodological requirements for stereo-to-motion-capture comparison. Keypoints must be undistorted before triangulation, the validity of the extrinsic calibration must be verified before analysis, and the temporal offset between systems must be estimated per session. Neglecting either of the first two can produce an error indistinguishable from an anatomical offset, and therefore, is capable of being mistaken for a property of the model; the temporal offset did not shift the group medians here, but it is not a system constant and must be checked per session. A fourth requirement, that the anatomical correspondence between the marker-derived reference and the keypoint be defined before their distance is interpreted as accuracy, follows from Contribution 4.
- Supporting mechanism: a geometric account of marker-placement error. The chord geometry predicts that the perpendicular offset between the marker-pair chord midpoint and the joint axis grows with joint thickness. This offset is reported as an upper bound at both joints—calibration and keypoint error contribute to it as well, so the bound holds only if they do not cancel part of the anatomical term, and it is not read as a confirming match against tape-measured circumference—and the radius inference is dropped at the wrist, where the joint’s elliptical cross-section makes the underlying circular model invalid.
- Supporting diagnostic: a left–right test for residual transform error that needs no additional equipment. An error in the transform between coordinate frames cannot reverse sign between the two sides of the body, so a mirrored component of the residual cannot come from calibration. Applying this at the elbow, where limb postures on the two sides were comparable, bounds the lateral component of the residual transform error at about a millimetre, though it constrains nothing about the vertical or depth components.
2. Related Work
This section reviews the evidence on which the study builds, organised around one question: whether a difference between pose estimators measured against marker-based capture can be attributed to the estimators. It covers the validation evidence for markerless capture, the reasons why two-dimensional benchmark accuracy does not transfer directly to stereo reconstruction, and the sources of marker-to-keypoint discrepancy that such a comparison must account for.
2.1. Validation of Markerless Motion Capture
Markerless systems have been evaluated against marker-based capture using positional errors, joint angles, waveform similarity, task-level outcomes and reliability coefficients, and the studies differ in what they set out to establish (Table 1). Multiview systems have reported joint-position discrepancies generally within several tens of millimetres, varying by joint, task and pose-estimation method [8,9,10]; lower-limb motion, gait in particular, has received the greatest attention [10,21]. Monocular methods can provide useful task-specific outcomes, but their validity depends strongly on the outcome, the movement and the viewpoint [6,7]. Stereo capture has been evaluated less often. D’Haene et al. reported favourable angular agreement and inter-session reliability for a stereoscopic pose-and-depth approach to gait while observing constant biases associated with sampling rate and kinematic processing [22]. Balci et al. reported high intraclass correlation coefficients for a ZED stereo system in a single-participant comparison with OptiTrack [23]. These studies use different sensors, anatomical models, outcomes and agreement measures, and systematic reviews confirm that validity is outcome-specific, varying across joints, phases, methods and metrics [3,24].
Upper-limb motion presents different challenges from gait: the arms frequently cross the torso, the wrist can occupy a small image region, the elbow may be partially occluded, and rapid movements amplify the effects of temporal offset and motion blur. Reported upper-limb agreement is joint- and task-dependent, with elbow errors exceeding wrist and shoulder errors in boxing kinematics, joint-angle RMSD below 6° with systematic between-system bias in a clinical reach test, and shoulder-elevation errors of 8–9° that grow substantially for shoulder rotation while forearm pronation–supination remains unreliable [6,11,12]. A review of markerless upper-limb assessment in stroke rehabilitation reported similarly promising but heterogeneous results [25]. Most of these studies use angular or task-level outcomes, in which a constant positional offset can cancel, so they cannot establish the positional accuracy of a triangulated elbow or wrist keypoint.
How agreement is quantified also limits what it can show. Correlation does not establish agreement, since two systems can produce highly correlated trajectories with a large constant bias, and the conventional interpretation of Bland–Altman limits assumes that both systems measure the same underlying quantity. Motion data are, moreover, hierarchical and temporally dependent: consecutive frames share the same anatomy, marker placement, calibration, temporal offset and movement trajectory, and treating them as independent observations leads to pseudoreplication and excessively small p-values. Das et al. addressed this dependence with linear mixed-effects models and 95% functional limits of agreement [26]; session-level summaries and clustered resampling serve the same purpose, but large frame counts should not be interpreted as equivalent to a large number of independent experimental units.
Table 1.
Validation studies of markerless against marker-based motion capture summarising the merits and limitations of each with respect to the present question: what each addressed, and which sources of measurement uncertainty were separated from the reported error. ●, quantified separately; ○, acknowledged but not separated; blank, not addressed. All studies listed compare a marker-derived reference with a learned keypoint whose anatomical correspondence is not independently established.
2.2. From Benchmark Accuracy to Stereo Measurement
All three checkpoints run within MMPose [20] and have closely matched COCO keypoint AP. COCO AP measures two-dimensional localisation relative to manually annotated keypoints; it does not measure metric three-dimensional position, depth reconstruction, temporal stability or anatomical correspondence, and reviews of pose-estimation models in movement analysis call for more standardised evaluation [5]. Benchmarks that relate pose estimation to downstream biomechanical outcomes [28], or that test it on athletic movements outside conventional training distributions [29], show that strong benchmark accuracy cannot substitute for validation under the intended movement and camera configuration. All three models here share one top-down person detector, so the comparison concerns three checkpoints within one processing pipeline rather than entire architectural families.
Stereo reconstruction adds a dependence between the views (Section 1): the relevant quantity is the joint distribution of errors across the two views, not the average two-dimensional error in each image separately. Two models with similar COCO AP may, therefore, show different two-view disagreements, and differences between models may be obscured by uncertainty in calibration or in the definition of the anatomical reference.
2.3. Sources of Marker-to-Keypoint Discrepancy
The mechanisms below are not necessarily additive or independent, and they differ in evidential status: some can be measured independently, whereas others can only be estimated or bounded.
Anatomical correspondence and marker placement: Marker-based systems reconstruct markers with high instrumental precision, but the markers sit on the skin, and soft-tissue artefact and marker-placement variability affect the resulting kinematics regardless of that precision [13,14]. Pose estimators, for their part, inherit keypoint definitions from their training data: the COCO skeleton annotates visually interpreted elbow and wrist locations, not internal joint centres. Ruescas-Nicolau et al. linked image-derived pose keypoints with 3D anatomical landmarks across 51,051 poses from 71 participants, motivated by exactly this lack of correspondence [30], and their marker-augmentation models showed that anatomical-landmark error depends on the landmark, the movement, the model and the rotation axis [31]. If both markers are placed on the anterior side of the limb, their midpoint lies on a chord displaced from the joint axis by an amount that depends on marker separation, marker size, limb cross-section and placement, which offers a plausible explanation for larger discrepancies at thicker joints. Because the cross-section can be non-circular, and soft-tissue movement can make the offset dynamic, a circular model gives, at most, an upper bound on this displacement.
Calibration and triangulation: A stereo pipeline requires valid camera intrinsics, a stable relative pose between the cameras, and a transform between the camera and reference coordinate frames, and these can fail independently: the stereo pair may remain internally rigid while the whole assembly moves relative to the motion capture coordinate system. Manufacturer guidance recommends routine recalibration [4], and CasCalib treats extrinsic calibration and temporal synchronisation as integral parts of multiview motion capture [16]. Keypoints detected in distorted images must be undistorted before triangulation, and reconstruction scale must be checked against an object of known dimensions, because reprojection error is not equivalent to metric 3D error. A camera-to-motion-capture transform estimated from the evaluation data is, moreover, not fully independent of it (Section 3.3, Section 3.4 and Section 3.5).
Temporal alignment: A temporal offset between the two systems produces a positional difference that grows with movement velocity. Software timestamps and nearest-sample matching introduce uncertainty from independent clocks, and even a purpose-designed interface between external sensors and optical motion capture retains measurable delay and temporal variation [32]. An offset estimated from the relationship between discrepancy and velocity is not necessarily a pure clock offset, because motion blur at constant exposure, sequential triggering of the two cameras and reduced estimator accuracy during rapid motion also scale with velocity (Section 3.6). In a stereo pair, an inter-camera delay additionally changes the observed disparity of a moving joint and acts preferentially in depth, and self-occlusion may affect only one view, an asymmetry that a pooled confidence value can hide.
2.4. Research Gap
Existing studies show that markerless systems can approximate marker-based positions and kinematics, but they report the agreement as an aggregate—a Euclidean distance, angular RMSE, correlation or a set of limits of agreement—that characterises the complete measurement procedure without determining why the systems differ. Every mechanism reviewed in Section 2.3 enters that aggregate, and none of the other studies in Table 1 quantifies calibration validity or temporal alignment separately from the reported error.
This matters most when pose estimators are compared with one another. Because their two-dimensional benchmark accuracy is closely matched (Section 1), the differences between their reconstructed keypoints may be smaller than the uncertainty that calibration, timing and anatomical correspondence introduce into the measurement chain they share. Whether differences and rankings between checkpoints remain interpretable once that uncertainty is accounted for cannot be answered from an aggregate discrepancy. It is the question addressed here for upper-limb measurements from a compact stereo pair, where self-occlusion, rapid movement and small cross-view differences can produce substantial depth errors.
3. Materials and Methods
Three markerless pose estimation architectures—ViTPose, RTMPose-m and HRNet-w32—were compared against a marker-based optical reference at four joints: the left and right elbow and the left and right wrist. Seven recording sessions were captured, each targeting a single joint, during unconstrained upper-limb movement at speeds ranging from 169 to 854 mm/s. The compared quantity was the three-dimensional distance between the midpoint of two markers placed across the joint and the corresponding triangulated keypoint, decomposed by axis in the camera 0 frame.
The acquisition, calibration and reconstruction steps followed established practice: intrinsic and stereo calibration with a planar target, hand–eye calibration for camera-to-motion-capture registration, and linear triangulation of undistorted keypoints. The analysis that follows from them does not. Four elements are specific to this study: the decomposition of the measured discrepancy into placement, temporal, calibration and scale contributions (Section 3.6); the retrospective recovery of extrinsic parameters from the measurement data when the original calibration proved invalid (Section 3.4); the use of left–right mirroring to bound the geometric contribution to the lateral component (Section 3.6 and Section 5.3); and the limb-fixed versus camera-fixed decomposition used to bound the residual calibration contribution (Section 3.6).
Because the two systems do not measure the same anatomical point, the correspondence between them and the validity of the transforms relating their coordinate frames are part of the method rather than preliminaries to it.
3.1. Experimental Setup and Data Acquisition
The acquisition system comprised a stereo pair of industrial cameras and a marker-based optical motion capture system operating concurrently in the same volume (Figure 1).
Figure 1.
Acquisition setup viewed from above: two cameras on a common mount, eight OptiTrack cameras around the volume. The stereo pair is near parallel, with a baseline of 633.1 mm, which subtends about 39° at the median keypoint depth of 897 mm (Section 4.3). Circles with a short line, OptiTrack cameras and their viewing directions; rectangles, the two stereo cameras, with their fields of view drawn as lines; black dots, the marker pair.
3.1.1. Cameras
Two Basler daA2448-70uc dart cameras (Basler AG, Ahrensburg, Germany; S-mount, USB3 Vision) were used, built on the Sony IMX548 back-illuminated global-shutter sensor (Sony Semiconductor Solutions Corporation, Atsugi, Japan) with a 2.74 µm pixel pitch and an 8.8 mm diagonal. Images were acquired from a centred 1920 × 1080 region of interest in BayerRG8 format, with a fixed exposure of 6666.7 µs, automatic exposure and gain disabled, and continuous white balance. The lens model was not recorded, but the calibrated focal lengths of 951.9 px and 956.8 px correspond to approximately 2.61 mm and 2.62 mm at this pixel pitch. Both cameras were mounted on a common rigid support with a calibrated baseline of 633.1 mm. The calibrated optical axes were nearly parallel in the horizontal plane (0.4°) and tilted relative to each other by 9.3° vertically, so the pair was close to a parallel rather than a converging configuration; the calibrated horizontal and vertical fields of view were approximately 118° and 65° per camera.
3.1.2. Motion Capture
Marker positions were recorded with eight OptiTrack Prime 13 cameras (NaturalPoint Inc., Corvallis, OR, USA) [4] through Motive software. The Prime 13 has a 1280 × 1024 sensor and a native rate of 240 FPS; it was operated here at 100 Hz. Only a small part of the calibrated volume was used: marker depths relative to the camera pair spanned 0.47–1.15 m, with a median of 0.87 m. Tracking data were exported as CSV (Format Version 1.23, global coordinate space, metres, quaternion rotations) at the full 100 Hz rate.
3.1.3. Image Acquisition
Image pairs were captured by software trigger at a fixed interval. In practice, the loop was limited by image transfer and disk writes, giving a median inter-pair interval of 78.2–78.5 ms, or about 12.8 Hz, consistent across sessions. Camera acquisition covered 7.9–12.9 s within each motion capture take.
The two cameras were triggered sequentially in software rather than over a hardware line, and the recorded timestamps derive from the trigger rather than from independent camera clocks, so the offset between them could not be measured directly. It was bounded indirectly instead. If one camera fired later than the other, each would see the marker at a different instant, so their rays would not intersect cleanly, and the two-view reprojection residual would grow with marker speed. No such dependence was found: partial correlations between the reprojection residual and the velocity component perpendicular to the epipolar plane ranged from −0.031 to +0.043, and the offsets implied by fitting that relationship (+0.42 to −3.83 ms) were not significant. The test has little power, however. One millisecond of offset contributes only 0.087–0.483 px, so even a 10 ms offset would add less than 5 px against a two-view disagreement of 28.0–39.7 px (Section 4.3). The offset is, therefore, reported as bounded at a few milliseconds rather than measured, and the cameras are not claimed to have been synchronised.
3.1.4. Participant and Protocol
A single male participant (age 25 years, height 192 cm, mass 95 kg) performed unconstrained upper-limb movements, including elbow flexion and extension, while facing the camera pair. Movements were not externally paced, and median marker speeds ranged from 169 to 854 mm/s across sessions. The participant was the corresponding author of this study. The procedure was non-invasive, involved nothing beyond attaching adhesive skin markers, and recorded no identifying data other than the images themselves. Limb circumferences were measured with a tape measure after the recordings—295 mm at the elbow with the arm extended, 180 mm at the narrowest point of the wrist—for comparison with the marker-ring geometry (Section 4.6 and Section 5.2).
Seven sessions were recorded on a single day, each targeting one joint: left wrist (1 session), right wrist (2), left elbow (2) and right elbow (2). Session-level parameters are summarised in Table 2.
Table 2.
Session parameters. Marker speed is the median, over all retained observations of that session, of the speed of the marker-pair midpoint, obtained by least-squares differentiation of the motion capture trajectory over a ±50 ms window. Retention is the proportion of image pairs yielding a usable observation after all filtering stages; where a range is given, it reflects small differences between the three pose models. Markers gives the OptiTrack IDs of the two markers forming the pair. τ is the estimated apparent camera-to-motion-capture temporal offset, listed for HRNet-w32, RTMPose-m and ViTPose, respectively, in the same order as Table 3.
3.1.5. Temporal Correspondence
Each image pair was matched to the motion capture sample nearest in time using the image timestamp relative to the export’s capture start time without interpolating marker positions. Since the motion capture interval was 10 ms, this introduces a rounding error of, at most, 5 ms (median 2.4–2.7 ms across sessions).
That rounding is not the whole story. The camera host clock and the Motive clock run independently, so any constant difference between them passes through this procedure unnoticed. That difference contributes to the per-session temporal offset estimated in Section 3.6 (−59 to −4 ms), which also absorbs other velocity-dependent effects and is, therefore, an apparent offset.
Observations for which either marker was missing from the paired motion capture sample were excluded, affecting 5–26% of image pairs depending on session (Table 2).
3.2. Marker Placement and Joint Correspondence
Two spherical retro-reflective markers of 14 mm diameter were taped directly to the skin on either side of the target joint, both on the front of the limb. Their separation, as measured by the motion capture system, was stable within each session, with per-session medians between 71.4 and 75.8 mm (standard deviation, SD, 0.4–2.0 mm within session). Each session tracked one joint only.
The two systems do not measure the same point. A marker sits on the skin, while a learned keypoint approximates a joint centre inside the limb. To narrow that gap, the reference point was taken as the midpoint of the two markers rather than either marker alone: the midpoint of a pair placed across a joint lies closer to the joint axis than either marker does. How much this improves the correspondence is reported in Section 4.5.
Because both markers were placed on the front of the limb rather than on a true diameter, their midpoint lies on a chord displaced forward from the joint centre by δ⊥ (Figure 2). For a circular cross-section, δ⊥ is related to the marker separation d and the effective radius r of the marker ring by
where δ⊥ is the distance from the joint centre to the chord midpoint, d is the separation between the markers and r the effective radius of the marker ring, that is, the limb radius plus the height of the marker base and sphere (7.0 mm). The consequences are analysed in Section 4.6.
r = √(δ⊥2 + (d/2)2),
Figure 2.
Cross-section through the limb: the midpoint of the two markers lies on a chord displaced from the joint centre by δ⊥ (labelled δ); d, marker separation; r, effective radius of the marker ring. Dots, markers; crosses, joint centre (upper) and chord midpoint (lower); arrows, δ⊥ and r.
Each session’s marker pair was mapped to the corresponding COCO keypoint: left wrist (9), right wrist (10), left elbow (7), right elbow (8). As a check on this assignment, every observation was also compared against the keypoint on the opposite side (Section 4.7).
3.3. Camera Calibration
Intrinsic parameters: Both cameras were calibrated with a planar chessboard of 8 × 6 inner corners and 20 mm squares, using the OpenCV fisheye model, which was chosen because of the short focal length of the lenses. Corners were found with findChessboardCorners at half resolution (adaptive thresholding, image normalisation and fast check enabled), and then rescaled and refined at full resolution with cornerSubPix using an 11 × 11 window and a termination criterion of 30 iterations or 0.1 px. Eighty views per camera were used. Mean board reprojection errors were 0.29 px for camera 0 and 0.45 px for camera 1.
Stereo extrinsic parameter: The relative pose of the two cameras was obtained by stereo calibration with fixed intrinsics, giving a reprojection RMS of 0.787 px and a baseline of 633.1 mm.
Camera-to-motion-capture registration: The rigid transform between the camera frame and the OptiTrack world frame was obtained by hand–eye calibration (AX = XB) using chessboard poses seen simultaneously by the cameras and by the motion capture system. Two calibration runs were available, of 41 and 48 board views; the 48-view run was used.
Validation of the reconstruction chain: The accuracy of the stereo reconstruction was assessed without involving either the pose estimators or the motion capture system. Chessboard corners detected in both cameras across the 48 board views were triangulated through the same stereo parameters used for the measurements, and the reconstructed spacing between adjacent corners was compared against the known 20 mm square size, giving 3936 spacings. Because the true spacing is known, and corners are localisable to sub-pixel accuracy, this gives a scale reference independent of any anatomical correspondence. The board views span a shallower depth range than the measurement sessions, so the dependence of scale error on distance was also examined by regressing the per-board scale error on board distance.
Verification of extrinsic validity: Extrinsic parameters can be invalidated by any movement of the camera assembly between calibration and acquisition, so their validity was verified rather than assumed. Loop-closure consistency between the stereo transform and the hand–eye transforms was evaluated for each calibration run. The stereo transform relates the two cameras directly, while the two hand–eye transforms relate each camera to the motion capture frame; composing the latter pair therefore predicts the former, and the angle between the predicted and the measured stereo rotation measures their mutual consistency. This was 0.39° when both transforms came from the same run but 1.99° when transforms from different runs were combined. This indicates that the camera assembly moved between the two calibration dates and that parameters from one date cannot be combined with those from another. Since the images analysed here were recorded three days after the most recent chessboard calibration, the extrinsic parameters were re-derived as described in Section 3.4.
3.4. Retrospective Recovery of Extrinsic Parameters
Before analysis, the recorded marker positions were projected into the images and compared against the corresponding MMPose keypoints. A systematic offset was present in all seven sessions and both cameras (Section 4.2), showing that the existing extrinsic parameters did not describe the geometry at acquisition. Because this comparison is against the keypoint rather than the marker itself, it includes the anatomical marker-to-joint-centre offset and cannot reach zero even under perfect calibration.
Two explanations were tested as a diagnostic. A pure translation of the world origin would give an image offset inversely proportional to depth, whereas a rotation of the camera mount would not, so rotation-only and translation-only models were fitted to the normalised offsets (Section 4.2). This comparison identifies which mode dominates; it does not constrain the correction itself, which was fitted as a full rigid transform including both rotation and translation. Because the rotation-only model fitted better (Section 4.2), the displacement was attributed to a rotation of the camera mount, which leaves the stereo relationship between the two cameras unchanged, consistent with both being fixed to a single rigid support.
Since chessboard recalibration was no longer possible, the extrinsic parameters were recovered from the measurement data instead. In session S6, the centres of both markers were annotated by hand in both camera views across ten frames, selected by farthest-point sampling of the marker-pair midpoint so as to span a volume of 445 × 151 × 394 mm. The annotation view was centred on the detected keypoint rather than on the projected marker position, and no projection overlay was shown, so that the annotation could not be drawn towards the calibration under test. The 40 annotated points were undistorted, triangulated, and registered to the corresponding OptiTrack coordinates by Kabsch alignment. The resulting rigid transform differs from the previous hand–eye calibration by a rotation of 15.0° and a translation of 719 mm; the latter is almost entirely the lever arm of that rotation about the distant world origin rather than a physical displacement, since the rotation alone moves a point at 0.78 m by 197 mm, which is the observed offset. A rigid rather than a similarity fit was used because a similarity fit would rescale the reference to match a biased reconstruction, hiding the reconstruction scale error inside the reference; the S6 annotations alone could not identify the scale in any case (−2.29%, 95% CI −6.77% to +1.04%). Reconstruction scale is instead reported separately (Section 3.3 and Section 4.3) and carried in the uncertainty budget (Section 3.6).
The correction was validated on held-out data. It was fitted using camera 0 of one session (the transform was fitted in the camera 0 frame; camera 1 follows through the stereo extrinsics), leaving 13 of the 14 session × camera combinations out of the fit entirely. Fit stability was assessed by leave-one-frame-out resampling with a geodesic rotation metric; the results are given in Section 4.2.
As a check on the alignment, the marker separation reconstructed from the annotated points was compared against the motion capture measurement of the same distance in the same ten frames (Section 4.2); the difference is consistent with the reconstruction scale error reported in Section 4.3 rather than a separate, independent check on annotation accuracy. The reconstructed separation is also not comparable to the per-session separations in Section 3.2, which are motion capture measurements of different marker pairs applied to the skin on separate occasions.
Marker centres were annotated in the same way in two further sessions, S3 and S5 (ten frames each). These annotations were not used for the transform applied to the reported results; they served for the held-out validation (Section 4.9), the between-session reproducibility term of the uncertainty budget (Section 3.6) and the separation-ratio estimate of reconstruction scale (Section 4.3). For the held-out validation, each session was re-evaluated under a transform fitted without it: leave-one-session-out fits from the other two annotated sessions for S3, S5 and S6 and a fit to the pooled annotations of all three for S1, S2, S4 and S7, which contributed no annotations. In S3 and S5, the assignment of the two markers in each view was guided by the S6-derived transform, although their positions were annotated without it.
3.5. Pose Estimation and 3D Reconstruction
Pose estimation: Three MMPose architectures were evaluated, chosen to differ in architectural family rather than in reported accuracy, so that an effect appearing consistently across all three could be attributed to the measurement chain rather than to a particular network design. ViTPose is transformer-based, HRNet-w32 is a convolutional network with parallel high-resolution branches, and RTMPose-m is a lightweight architecture designed for real-time inference. Their reported COCO average precision is closely matched, so any difference between them is unlikely to be explained by capacity alone. The variants used were ViTPose-base-simple (td-hm_ViTPose-base-simple_8xb64-210e_coco-256x192, AP 0.756), RTMPose-m (rtmpose-m_8xb256-420e_coco-256x192, pretrained on AI Challenger and COCO, AP 0.746) and HRNet-w32 (td-hm_hrnet-w32_8xb64-210e_coco-256x192, AP 0.746); note that the MMPose alias vitpose resolves to ViTPose-base-simple rather than ViTPose-base. Person detection used RTMDet-m (rtmdet_m_8xb32-300e_coco) restricted to the person category, and all three models produced 17 COCO-format keypoints. Inference ran on an NVIDIA RTX 5070 Ti (NVIDIA Corporation, Santa Clara, CA, USA) under MMPose 1.3.2, MMCV 2.2.0, MMDetection 3.3.0, MMEngine 0.10.7, PyTorch 2.11.0 (CUDA 12.8), OpenCV 5.0.0, NumPy 2.5.1 and SciPy 1.18.0. Raw 2D keypoints were cached so that parameter variations could be evaluated without repeating inference.
Keypoint undistortion: The lenses are wide-angle, so the recorded images are substantially distorted. Pose estimation runs on those raw images, and the keypoints it returns are, therefore, in distorted coordinates. Triangulation, in contrast, uses a pinhole camera model, which assumes no distortion at all. Detected keypoints were, therefore, undistorted (cv2.fisheye.undistortPoints) before triangulation. This step is required rather than optional: the correction applied to a point depends on where in the image it lies, so it differs between the two cameras, and any difference between them is mapped by stereo triangulation into depth. Omitting it produces a systematic depth bias that is indistinguishable from an anatomical offset (Section 5.4).
Triangulation: The 3D positions were obtained by linear triangulation (DLT) from the undistorted keypoints and the calibrated projection matrices with reconstructions rejected if the number of valid joints, the two-view reprojection residual (the disagreement between the two cameras about the same keypoint, quantified in Section 4.3, and distinct from the chessboard calibration reprojection error of Section 3.3) or the reconstructed extent fell outside preset bounds. When more than one person was detected, one subject was retained per frame, chosen by lowest reprojection residual. Choosing instead the person closest to the reference marker was deliberately avoided: the marker-to-keypoint distance was the quantity being measured, so selecting on it would keep the frames that happen to look best and make every model appear more accurate than it was.
Confidence threshold: A minimum keypoint confidence of 0.2 was applied, chosen on the basis of insensitivity rather than error minimisation: across thresholds from 0.10 to 0.50, the median 3D distance varied by 0.3 mm (33.4–33.7 mm), whereas 0.05 admitted unreliable keypoints and reduced the usable observations by 27%. The sweep was performed by re-running the full pipeline at each threshold, since the threshold also affects the validity mask, and hence, the reprojection residual used for gating and subject selection.
Data retention: Of 884 image pairs (2652 pair × model cells), 2219 rows (83.7%) were retained after all filtering. Loss was dominated by the reference system rather than the markerless pipeline: 402 of the 433 lost observations (93%) were frames where the motion capture system did not report one or both markers. Person detection never failed, and the minimum-joint gate never fired; the confidence threshold rejected one observation, the residual cap 18, and the physical criterion 12. Retention per session ranged from 73.8% to 95.2%.
Exclusion of non-physical reconstructions: Of the 2231 observations surviving the preceding steps, twelve (0.54%) placed the subject’s body at depths of 4.8–6.4 m against marker depths of 0.47–1.15 m in the retained data (Section 3.1.2). The exclusion criterion was physical rather than error-based and did not use that range: a joint more than 1 m from the body’s median joint position or a body depth outside 0.3–2.5 m. The same frames failed for all three models, indicating a reconstruction rather than a model failure. Gross keypoint errors were retained: five observations exceeding 150 mm, the largest 381 mm, remain in the reported data.
3.6. Outcome Measures and Statistical Analysis
All differences are reported as marker-pair midpoint minus keypoint, in the camera 0 frame with +Z directed away from the cameras, in millimetres.
Summary measures: For each combination of joint, side and model, the following were computed: sample size; per-axis bias and RMSE; median 3D Euclidean distance; its interquartile range and 95th percentile; the proportion of observations below 30 mm and 50 mm; and the numerical component of Bland–Altman agreement (bias ± 1.96 SD per axis). Robust dispersion measures accompany the median because the retained gross keypoint errors (Section 3.5) leave the distribution strongly right-skewed. The dispersion measures and the per-axis limits of agreement are given in Table A1.
Bland–Altman plots in their conventional form were not produced. Comparable validation studies report conventional limits of agreement [1,2], and the departure here is deliberate: the conventional abscissa is the mean of the two measurements, which presumes both instruments estimate the same quantity. Here, one measures a surface marker-pair midpoint and the other a learned internal joint-centre estimate, so their mean has no physical referent. Bias and limits of agreement are, therefore, reported numerically per axis without the plot.
Uncertainty of the recovered transform: Because the extrinsic transform was recovered from the measurement data (Section 3.4) rather than from an independent calibration, two further analyses were performed.
The first propagates its sampling uncertainty into the reported errors. The Kabsch alignment was refitted 400 times by resampling the ten annotation frames with replacement, and each refitted transform was applied to the full dataset with the group medians recomputed (Section 4.9). The resulting bands are not symmetric error bars: they extend further above the reported value than below it (Section 4.9).
The second analysis asks how much of the measured offset could come from the transform at all. An anatomical offset is fixed relative to the limb and rotates with it; an error in the camera-to-motion-capture transform is fixed relative to the cameras and does not. If the limb takes enough different orientations, the two can be told apart from the offsets alone. A limb-fixed coordinate system was, therefore, built for each observation: its first axis runs along the line joining the two markers, its second is derived from the vector running from the parent joint to the marker-pair midpoint, and its third is perpendicular to both. The parent joint was used rather than the measured one, so that the frame was not built from the quantity being measured. The direction of the marker-pair axis was arbitrary and differed between sessions, so it was made consistent using the shoulder-to-shoulder direction; without this, a flipped axis looks like a rotated limb and makes the test appear stronger than it is. Two models were then fitted and compared—a constant offset in the limb-fixed frame and a constant offset in the camera-fixed frame—followed by a combined fit with a limb-fixed term free for each joint group and a single camera-fixed term shared across all groups and sessions. The method was checked by injecting known camera-fixed offsets into the data and confirming that it recovered them, and confidence intervals were obtained by jackknife over sessions, the session being the unit of independence.
A third check uses left–right mirroring. An error in the camera-to-motion-capture transform is fixed relative to the cameras, and therefore, acts in the same direction on both sides of the body, whereas a lateral anatomical offset changes sign between sides. Provided the anatomical offset mirrors between sides, the sum of the lateral components of the left and right groups cancels it and equals twice the camera-fixed lateral term; half that sum was taken as the estimate, with a jackknife standard error. The condition requires comparable limb postures on the two sides, assessed from the 10th to 90th percentile range of the angle between the marker-pair axis and the stereo baseline (Section 4.10).
Model comparison: Images were captured at about 12.8 Hz during continuous movement, so consecutive observations within a session are nearly repeats of one another: the error in one frame strongly predicts the error in the next (lag-1 correlation of 0.725 at the median across the 21 session-by-model series). Treating frames as independent would, therefore, overstate how much information the data contain—732 time points carry roughly as much as 132 independent observations (n(1 − ρ)/(1 + ρ) computed per session on the model-averaged series and summed over sessions)—and the paired differences between models are autocorrelated in the same way, so pairing does not remove the problem.
Models were, therefore, compared at the session level, using one median 3D distance per session and model and comparing the seven sessions with the Friedman test followed by pairwise Wilcoxon signed-rank and sign tests. This is conservative. As a secondary analysis with more power, a moving-block bootstrap was applied within each joint and side, resampling blocks of 10 consecutive frames (about 0.78 s) so that the autocorrelation within a block was preserved; the results were unchanged for block lengths of 1, 5, 10 and 20 frames. The minimum detectable difference between models was computed from the between-session standard deviation of the paired session medians in the complete-case set using the exact noncentral t distribution with a two-sided α = 0.05 and 80% power. Bonferroni correction was applied over the twelve bootstrap comparisons and over the 21 session × model tests of the acceleration coefficient B of Equation (2) below.
Speed-dependent effects: Marker velocity and acceleration were obtained from the 100 Hz motion capture data by a per-axis least-squares polynomial fit over a ±50 ms window (linear for the speeds in Table 2, quadratic for the velocity and acceleration in Equation (2)), rather than by differencing adjacent samples, which is sensitive to noise. A temporal offset was then estimated for each session by fitting
where d is the marker-to-keypoint difference vector (marker-pair midpoint minus keypoint); v and a are the velocity and acceleration of the first-listed marker of the pair in Table 2, estimated by a per-axis quadratic least-squares fit to the 100 Hz motion capture trajectory over a ±50 ms window, all three expressed in the camera 0 frame; and R is the rotation from the limb-fixed coordinate system defined above to the camera 0 frame. The scalar coefficient A, fitted jointly across the three axes, estimates the temporal offset τ, defined as the time of the paired motion capture sample minus the instant shown in the image: a negative τ means that each image shows the limb |τ| later than the motion capture sample it is paired with; that is, the camera timestamps run early relative to the motion capture clock. Because A absorbs every effect that scales with velocity, including motion blur and speed-dependent keypoint localisation (Section 3.1.5), τ is an apparent rather than a measured temporal offset: it equals the clock offset between the two systems only if those effects are absent, and the term temporal offset is used in this sense throughout. The constant c absorbs the anatomical offset, which is present even at rest and would otherwise be forced into A; it is expressed in the limb-fixed frame because the anatomical offset rotates with the limb, whereas a camera-fixed constant would let its orientation-dependent part leak into A. The acceleration term B tests for any mechanism that scales with acceleration rather than speed. As a sensitivity check, the model was also fitted with a camera-fixed c.
d = A·v + B·a + R·c,
No temporal correction was applied to the reported results. The offset was estimated by minimising the same residual that is subsequently reported as accuracy, so applying it would lower that figure by construction rather than by improving the measurement. It would also remove more than a clock offset, since the fitted term absorbs a velocity- and acceleration-dependent component (Section 4.7), and its effect on the reported group medians is, at most, 0.5 mm (Section 4.11).
Three mechanisms scale with marker velocity here: motion blur during the exposure, the camera-to-motion-capture offset, and any inter-camera trigger offset. Because the exposure was identical in every session, blur extent is speed multiplied by a constant and is collinear with speed to numerical precision, so the three cannot be separated within this dataset; any speed-dependent effect reported below is jointly attributable to all of them. Separating them would require sessions recorded at different exposure times. Blur is, nonetheless, expected to add dispersion rather than bias: its extent is small against the observed errors (1.1–5.7 mm per session), and for a symmetric exposure window at roughly constant velocity, the blur centroid falls at mid-exposure, which is the instant the timestamp convention already assumes.
Uncertainty budget: Following the Guide to the Expression of Uncertainty in Measurement (GUM) [33], the measurand y is the group median of the marker-to-keypoint distance, taken as the median over the three models of the group medians in Table 3. Each contribution was propagated exactly into y by re-evaluating y under the corresponding perturbation, so that its sensitivity coefficient is built in: calibration sampling (Type A; standard deviation of y over the 400 bootstrap refits described above), calibration between-session reproducibility (Type A; standard deviation of y over three single-session fits to the S3, S5 and S6 annotations of Section 3.4, which, with two degrees of freedom, makes this term a rough estimate), reconstruction scale (Type B; keypoints and annotation points rescaled by 1/0.9591, the separation ratio of Section 4.3, and the transform refitted), temporal offset (Type B; the change in y when A·v from Equation (2) is subtracted, carried in full as a standard uncertainty because the correction is not applied) and the sampling error of the median (Type A; moving-block bootstrap, block length 10). The contributions were combined by root-sum-square as uncorrelated. The expanded uncertainty U(y) was obtained for a 95% level of confidence following GUM Annex G [33]: the effective degrees of freedom νeff of uc(y) were computed by the Welch–Satterthwaite formula (Eq. G.2b), and the coverage factor k was taken from the Student’s t distribution at νeff. The degrees of freedom assigned were 9 for calibration sampling (ten annotation frames), 2 for between-session reproducibility (three sessions), neff − 1 for the sampling error of the median (from the effective sample size defined under model comparison above, per group) and, for reconstruction scale, approximately 13 from Eq. G.3 of [33], the relative uncertainty of that term being the standard error of the scale error divided by its magnitude (0.008 on 0.041, i.e., about 0.2). The temporal-offset term is the full effect of the fitted correction on y rather than a sample standard deviation, so its degrees of freedom were taken as infinite. Welch–Satterthwaite assumes independent, approximately normal input quantities; where the two-degree-of-freedom reproducibility term is the largest contribution to uc(y) (right elbow and right wrist), νeff is small, and both νeff and U(y) are themselves rough figures, as is the reproducibility term on which they rest. U(y) is sensitive only to the assignment for reconstruction scale: taking two degrees of freedom for it instead would raise U(y) by, at most, 7.1 mm (left wrist), whereas the other assignments change it by less than 0.2 mm. Marker placement, which was not independently quantified, and two-view disagreement (Section 5.1) are excluded, as is the uncertainty of the reference system. Although the sign of the scale error is known, it was not corrected, because its cause is not established, and the available estimates differ (Section 4.3); it is carried as a Type B uncertainty instead. Because the between-session reproducibility term already contains the sampling variability of each single-session fit, part of the calibration sampling is counted twice; as a sensitivity analysis, uc(y), νeff, k and U(y) were, therefore, recomputed without the calibration-sampling term, with the other four terms and their degrees of freedom unchanged (Section 4.11).
Table 3.
Discrepancy between the marker-pair midpoint and the triangulated keypoint (marker minus keypoint, camera 0 frame, +Z away from the cameras). Values in millimetres except where indicated.
4. Results
Section 4.1, Section 4.2 and Section 4.3 cover the dataset and the accuracy of the acquisition chain, Section 4.4, Section 4.5, Section 4.6, and Section 4.7 the measured discrepancy between marker-pair midpoint and keypoint and the temporal offset, Section 4.8 and Section 4.9 the comparison between models and its sensitivity to the recovered transform, Section 4.10 the origin of the offset in limb-fixed versus camera-fixed terms, and Section 4.11 the combined uncertainty. Interpretation is deferred to Section 5.
4.1. Data Accounting
Of the 884 image pairs acquired (2652 pair × model cells), 2219 rows were retained. Almost all of the loss came from frames where the motion capture system did not report one or both markers (402 of 433); the remaining filters removed 31 observations between them. A further reduced set of 732 time points (2196 rows), those with a valid reconstruction from all three models, was used for the model comparison in Section 4.8.
Counts at other confidence thresholds differ from 2219 because the threshold also alters the validity mask, and hence, the reprojection residual used for gating; they range from 2164 to 2226 across thresholds from 0.10 to 0.50 and fall to 1630 at 0.05. Data loss showed no association with movement speed across sessions (r = −0.205, p = 0.66), so the retained observations are not biased towards slower movement.
4.2. Verification and Recovery of Extrinsic Parameters
Loop-closure consistency between the stereo and hand–eye transforms was 0.39° within a calibration run and 1.99° when runs were combined, corresponding to 6.1 and 31.2 mm at the median keypoint depth of 897 mm. Projecting the recorded markers into the images using the existing calibration gave a systematic offset in every session and both cameras, with per-session × camera medians of 159–225 px (150–212 mm). The offset did not scale inversely with depth over the depth range of the diagnostic frames (0.52–1.15 m, markers projected through the original calibration; marker depths of the full dataset spanned 0.47–1.15 m, Section 3.1.2), and a rotation-only model gave lower residuals than a translation-only model in 13 of the 14 session × camera combinations.
Kabsch alignment of the annotated marker reconstructions to the motion capture coordinates gave a rotation of 15.0°, reducing the projection offset to 11–40 px (10.6–37.9 mm) across all 14 combinations (Figure 3). The fitted combination retained a residual of 35 px (32.7 mm), larger than 12 of the 13 held-out combinations. Leave-one-frame-out resampling gave a fit stability of 0.21–1.26° (0.9–2.9 mm at a point on the camera 0 optical axis at the median keypoint depth), and the median marker separation reconstructed from the annotated points was 70.2 mm (SD 2.9) against 72.9 mm (SD 1.5) measured over the same ten frames, a difference of −3.7% between medians (−2.8% as the mean of the per-frame ratios; Section 4.3).
Figure 3.
Marker projection before (a) and after (b) recovery of the extrinsic parameters, shown for one frame of session S2, which was held out of the fit. Across sessions and cameras, the median offset fell from 159–225 px (150–212 mm) before correction to 11–40 px (10.6–37.9 mm) after; the residual includes the anatomical marker-to-joint-centre offset. The line joins the projected midpoint to the detected keypoint.
4.3. Reconstruction Chain Accuracy
Triangulating the calibration target through the stereo pair reconstructed the 20.0 mm squares as 19.702 mm, from 3936 adjacent-corner spacings over 48 board views. This is a scale error of −1.49% (95% CI −1.73% to −1.25%, treating each board as the independent unit), with an RMSE of 0.373 mm about the true value.
The scale error grew with depth. Boards spanned 594–872 mm, and the per-board scale error correlated with board depth (r = −0.478, p = 6 × 10⁻⁴) with a slope of −0.60% per 100 mm; the near half of the boards gave −1.15% and the far half −1.83%. Extrapolated to the median keypoint depth of 897 mm, the board-based regression predicts a scale error of −2.68%, smaller in magnitude than the pooled marker-based estimates below (−3.46% and −4.09%).
The triangulated inter-marker separation in the 30 annotated frames of Section 3.4 was 4.09% shorter than the motion capture separation (ratio 0.959, standard error 0.008; 95% CI −5.7% to −2.5%), with the same sign in all three sessions (means of the per-frame ratios: S6 −2.76%, S3 −4.19%, S5 −5.31%). Similarity fits to the same annotated points gave −2.29% (S6 alone; 95% CI −6.77% to +1.04%) and −3.46% (three sessions; 95% CI −5.75% to −1.28%). These three estimates share the same hand annotations and are not independent.
The transverse image scale follows Z/f, from 0.525 mm/px at 0.5 m to 1.261 mm/px at 1.2 m. Reconstructed keypoint depths had a median of 897 mm, at which 1 px corresponds to 0.942 mm. The two-view reprojection residual at the target keypoint had group medians of 28.0–39.7 px, or 27.0–38.7 mm transverse when converted at the median depth of each group. This measures how far the two cameras disagree about the same keypoint and is not comparable with the chessboard reprojection errors of 0.29–0.45 px, which come from precisely localisable corner features. Regressed within each session on the angle between the marker-pair axis and the stereo baseline, the residual showed a significant dependence in three of the seven sessions (r = +0.10 to +0.37), with the same sign in five of seven (sign test p = 0.45); regressed on limb orientation, the dependence was significant in six sessions but with the same sign in only four of seven (sign test p = 1.00).
Board-based lever arm: Because a rigid fit absorbs the scale-induced translation about the centroid of the annotation cloud (776 mm) but not its depth dependence, the board-based scale error reaches the Z difference only through the residual lever arm, contributing +1.8 mm under a constant and +8.9 mm under the depth-dependent model, opposite in sign to the observed negative Z bias. The uncertainty budget uses the separation-ratio estimate (4.09%) instead (Section 3.6).
4.4. Marker-Pair Midpoint Versus Keypoint
Median 3D distances ranged from 23.9 to 47.1 mm, and elbow groups gave larger distances than wrist groups for every model (35.6–47.1 mm against 23.9–29.8 mm). The Z bias was negative in all twelve cells, from −9.8 to −33.7 mm, so the marker-pair midpoint lay closer to the cameras than the keypoint, and RMSE was larger in Z than in X or Y in all twelve cells (Figure 4).
Figure 4.
Bias in each axis by joint and side, pooled across models. Panels show (a) ΔX, (b) ΔY and (c) ΔZ on a common scale; points are means with 95% confidence intervals, and the vertical line marks zero. ΔX changes sign between left and right at the elbow, ΔY and ΔZ do not, and ΔZ is negative in every cell. Values are labelled only for ΔX at the elbow, where the sign change between sides is the feature of interest. Value labels use the colour of the corresponding side.
The 10% trimmed mean differed from the median by, at most, 2.2 mm in every cell, so the bulk of each distribution is well behaved. The right wrist group nonetheless carried a heavy upper tail, with 99th percentiles of 83.2–133.9 mm and maxima up to 381.2 mm, and was the only group with observations exceeding 150 mm; the left wrist group had no tail at all, with maxima of 36.9–51.3 mm.
4.5. Effect of the Midpoint Construction
Comparing the midpoint against each marker individually gave a lower distance for the midpoint in every group and every model (Table 4). The reduction relative to the better-performing individual marker was 8.0–16.6 mm.
Table 4.
Median 3D distance to the keypoint, using the better of the two individual markers, compared with the marker-pair midpoint. Ranges span the three models. All values in millimetres.
4.6. Geometry of the Marker-Pair Offset
At the elbow, the lateral component of the offset was negative in all six left-side cells and positive in all six right-side cells, giving pooled values (mean ± standard error) of −10.5 ± 1.2 mm on the left and +9.4 ± 0.7 mm on the right, a sum of −1.0 ± 1.4 mm. The vertical and depth components kept their sign on both sides. At the wrist, no consistent lateral component was present: the pooled values were −2.7 ± 1.0 mm and +0.0 ± 0.7 mm, and the two right wrist sessions differed in sign.
Decomposing the offset relative to the axis joining the two markers gave a perpendicular component two to three times larger than the parallel one in every group (Table 5). Pooled by joint, that component was 35.8 mm at the elbow against 22.4 mm at the wrist; relative to the mean of the six corresponding medians in Table 3 (40.8 and 27.6 mm), these give ratios of 0.88 and 0.81. These are ratios of magnitudes, not fractions of the discrepancy explained by placement, since the contributions do not add (Section 5.1). The marker-ring radius implied by Equation (1) was 49.9–54.9 mm at the elbow; at the wrist, where the elliptical cross-section makes the circular model invalid, only the perpendicular component is reported: 21.6 mm (left), 23.0 mm (right). The circular model has no geometric margin at the wrist: the marker separation there (72.6 and 73.5 mm) is at least as large as the 71.3 mm diameter of a marker ring built on the wrist circumference measured at its narrowest point.
Table 5.
Decomposition of the midpoint-to-keypoint offset relative to the marker-pair axis. Counts are pooled across the three models, so each image pair contributes up to three rows. All values in millimetres. The implied radius is not reported at the wrist, where the elliptical cross-section invalidates the circular model of Equation (1).
The Z component correlated with the sine of the angle between the marker-pair axis and the camera axis in the predicted direction when pooled within each group (r = −0.22 to −0.56, all p < 1 × 10⁻³), but this is not a within-limb geometric slope. The sine spanned only 0.56–1.00 (5th percentile 0.75), and within the right wrist group, the two sessions gave slopes of opposite sign (+95.2 and −243.9 mm per unit sine), so the pooled slope of −224.5 reflects the difference between sessions rather than any relationship within either. The chord offset it implies exceeds the directly measured perpendicular component of 23.0 mm by an order of magnitude.
The two right wrist sessions differed by 28.0 mm in Z bias despite sharing joint, day, calibration and models (S3, +0.6 mm pooled; S2, −27.3 mm). Marker-pair orientation does not account for it: median angles between the pair axis and the camera axis were 80.8° for S2 and 70.7° for S3, both near 90° where the sine is flat, predicting a difference of −1.0 mm, and restricting both sessions to their overlapping sine range left the gap unchanged. The difference is a tail rather than a shift in location—S3 had a skew of +4.48 against −0.20 for S2—and is examined in Section 5.4.
4.7. Temporal Offset and Method Checks
The camera-to-motion-capture temporal offset estimated per session (median across the three models) ranged from −59.3 to −4.1 ms (Table 2), all negative; sessions S2–S7 drifted approximately linearly at −1.15 ms/min (≈−19 ppm, r = −0.995) over the 28.7 min spanning them, consistent with slow, independent drift between the two host clocks. Within each session, the three models agreed to within 3.9 ms and to within 2.7 ms in four of the seven. Expressing the constant of Equation (2) in the limb-fixed frame fitted better than expressing it in the camera-fixed frame (pooled RMS residual 10.2 against 12.4 mm, lower in 18 of 21 session × model cells) and changed the per-session offsets by, at most, 5.8 ms. The acceleration coefficient B ranged from −3555 to +2160 ms2 and was positive only in S2; it differed from zero in 16 of the 21 session × model cells (13 after Bonferroni correction).
Two assignments were checked. The marker-pair midpoint was never closer to the contralateral keypoint than to the assigned one in any observation. And the median 3D distance varied by only 0.3 mm across confidence thresholds from 0.10 to 0.50, with the number of retained observations varying by under 3%; at a threshold of 0.05, it fell by 27%, as unreliable keypoints entered the pairing.
4.8. Comparison Between Models
At the session level, the Friedman test across the seven sessions gave χ2 = 1.143, p = 0.565, and no pairwise comparison approached significance: HRNet-w32 against RTMPose-m gave a median difference of 0.0 mm (Wilcoxon p = 0.688), HRNet-w32 against ViTPose 1.1 mm (p = 0.375), and RTMPose-m against ViTPose 1.0 mm (p = 1.000). ViTPose gave the lowest median distance in four of the seven sessions, RTMPose-m in two and HRNet-w32 in one.
The per-frame 3D distance was strongly autocorrelated within sessions (lag-1 correlation: median 0.725 across the 21 session × model series); computed per session on the model-averaged series and summed, the effective sample size was about 132 against a nominal 732, and the paired differences were themselves autocorrelated (r = +0.01 to +0.52).
The within-group moving-block bootstrap retained three of the twelve pairwise differences with confidence intervals excluding zero before correction for multiple comparisons. Two were at the left wrist, where HRNet-w32 differed from RTMPose-m by +4.14 mm and from ViTPose by +5.17 mm, and one at the right elbow, where RTMPose-m differed from ViTPose by +2.13 mm. After Bonferroni correction for the twelve comparisons, only one survived: HRNet-w32 against ViTPose at the left wrist (p = 0.0016, pBonferroni = 0.019). This group was recorded in a single session (S1). All three raw intervals lay between +0.62 and +9.48 mm. The remaining nine differences ranged from −2.38 to +1.38 mm with intervals spanning zero, and the results were unchanged for block lengths of 1, 5, 10 and 20 frames. With seven sessions, the minimum detectable difference between models was 3.0–5.1 mm (between-session standard deviation of the paired differences 2.4–4.0 mm); resolving a 1 mm difference would require an estimated 46–130 sessions.
4.9. Sensitivity to the Recovered Calibration
Bootstrap resampling of the annotation frames (400 refits) gave a rotation deviation from the point estimate with a median of 1.14°, a 95th percentile of 2.61° and a maximum of 4.06°. At the median keypoint depth of 897 mm, 1° of rotation about the camera corresponds to 15.7 mm, but because each refit also re-estimates the translation, which compensates most of this lever arm, the refitted transforms displaced a point on the camera 0 optical axis at that depth by a median of only 4.0 mm (95th percentile 9.4 mm).
Propagating these refits through to the group medians gave the bands in Table 6. The bands span 5.8–15.8 mm, and the maximum shift from the reported value ranged from 3.4 to 11.1 mm, corresponding to 8–39% of the reported median. The narrowest bands occurred in the left elbow group, from which the annotation frames were drawn; the widest occurred in the two right-side groups.
Table 6.
Group medians under bootstrap resampling of the recovered extrinsic transform (400 refits). Maximum shift is the larger distance of a band edge from the reported value. All values in millimetres.
The difference between elbow and wrist groups was +13.2 mm at the point estimate, ranged from +9.8 to +16.0 mm across refits, and was positive in 100% of the 400 refits.
The model giving the lowest median distance, by contrast, changed with the refitted transform. RTMPose-m ranked first in 86.0% of refits at the left elbow and 82.2% at the right wrist and ViTPose in 79.5% at the right elbow and 97.5% at the left wrist. In three of the four groups, the leading model changed in 14–21% of refits. Under the held-out assignment of Section 3.4, the pooled median distance rose from 33.7 to 36.0 mm, and the leading model changed in two of the four joint-side groups.
4.10. Origin of the Offset: Limb-Fixed Versus Camera-Fixed
The limb-fixed frames were well conditioned in every group: the angle between the two defining vectors ranged from 48.2° to 86.0°, with no observation below 15°, and the marker-pair axis spanned 34–137° relative to the camera axis. Canonicalising the sign of that axis was necessary, since its ordering differed between the two right-wrist sessions; left uncorrected, this produced an apparent rotation spread (mean angular deviation of the limb-frame orientation from the group mean) of 80.5° in that group against 29.5° after correction.
Fitting a constant offset in the limb-fixed frame gave a lower residual than fitting one in the camera-fixed frame at equal parameter count, but the separation was confined to the elbows. At the left elbow, the advantage was 7.3 mm (30.8 against 38.1 mm) and at the right elbow 5.3 mm (20.9 against 26.2 mm), with both constituent sessions agreeing in sign in each case. At the wrists, the two models were indistinguishable: 0.5 mm at the left (16.9 against 17.4 mm) and 1.0 mm at the right (38.2 against 39.2 mm), where the two sessions disagreed in sign. Pooled, the residual RMS was 30.2 mm against 33.8 mm and the Akaike information criterion (AIC) 38,059 against 39,568, a separation driven entirely by the elbows. With one or two sessions per group, session-level resampling has no resolution, so no confidence intervals are given.
The failure to separate the models at the wrist has a different origin on each side. The left wrist rests on a single session with the smallest sample (n = 228) and a substantially narrower range of limb orientations than the other three groups (12.1° against 26.7–29.5° on the same measure), so it is underpowered. The right wrist is not: it has the largest sample (n = 767) and the widest range of orientations, and still separates by under 1 mm, with its two sessions disagreeing in sign. Those same two sessions differ by 28 mm in depth bias and in the sign of the lateral component (Section 4.6), so the three observations are consistent with a single heterogeneity between them rather than three independent effects.
Repeating the comparison with the limb-fixed frame built from four different parent keypoints—including the contralateral shoulder and the same-side hip, which share no limb segment with the target joint—left the sign of the difference unchanged in every group, with pooled advantages of +2.02 to +3.61 mm.
In the combined fit, adding a camera-fixed term shared across all groups and sessions reduced the residual RMS from 30.15 to 28.70 mm, accounting for 9.4% of the residual variance, and shifted the limb-fixed terms by 18–20 mm per group. The fitted term itself was not stable: its magnitude ranged from 11.1 to 23.2 mm across the four frame variants, the depth component varying over 17 mm and the lateral component changing sign, with only the vertical component consistently negative. A jackknife over the seven sessions, taking the session as the unit of independence, gave intervals spanning zero laterally and vertically and [+6.7, +26.8] mm in depth. A bootstrap over frame clusters gave intervals roughly a third as wide and was not used, since observations within a session share a marker application, a limb posture range and a temporal offset and are not independent replicates.
The camera-fixed term is, therefore, reportable as a bound rather than an estimate: a component of the order of 11–23 mm, concentrated in depth and in the vertical, with the lateral component consistent with zero. Identifiability was confirmed by injecting known camera-fixed offsets into the data, which were each recovered exactly, and by the condition number of the design (9.3 with the camera-fixed term included against 1.8 without).
Two further results bear on that bound. The mirroring of the lateral component between sides gives an independent estimate along that axis, provided the limb postures on the two sides are comparable: a camera-fixed error cannot change sign with side, so the sum of the two sides equals twice the term. The condition holds at the elbow (10th–90th percentile range of the pair-axis angle to the baseline 41.7° left, 39.9° right), where the estimate was −0.52 ± 0.69 mm, an order of magnitude smaller than the combined fit and within its own jackknife standard error. It does not hold at the wrist (12.4° left, 60.5° right), so the wrist comparison is not treated as a bound. And because the cameras were fixed and the participant upright throughout, the gravitational vertical is itself a camera-fixed direction—it maps to [−0.063, −0.997, +0.041] in the camera 0 frame—and slightly over half of the fitted camera-fixed term lies along it.
4.11. Combined Uncertainty
Combining the five contributions propagated into y (Section 3.6) gave a combined standard uncertainty uc(y) of 4.5 mm at the left elbow, 10.1 mm at the left wrist, 14.9 mm at the right elbow and 8.7 mm at the right wrist, or 9.6 mm (left elbow), 21.5 mm (left wrist), 35.6 mm (right elbow) and 22.2 mm (right wrist) expanded at 95% coverage (Table 7). The Welch–Satterthwaite effective degrees of freedom were 15.6, 15.5, 6.7 and 5.0, giving k = 2.12, 2.13, 2.39 and 2.57; the between-session reproducibility term, with two degrees of freedom, contributed 80–97% of the Welch–Satterthwaite sum at the left elbow, right elbow and right wrist, whereas at the left wrist, reconstruction scale contributed the most (57%). The largest contribution was reconstruction scale at the left wrist (8.3 mm), between-session calibration reproducibility at the right elbow and right wrist (10.8 and 6.8 mm), and the sampling error of the median at the left elbow (2.8 mm); the temporal offset contributed 0.1–0.5 mm in every group. With a transform fitted to the pooled S3, S5 and S6 annotations in place of the production transform, uc(y) was 4.6–11.9 mm.
Table 7.
Estimated contributions to the measured marker-to-keypoint discrepancy and to its combined standard uncertainty. Marker placement, temporal offset, extrinsic calibration and reconstruction scale are systematic; the sampling error of the median is statistical; two-view disagreement is treated as a between-session random component and reported separately for the reason given below. Temporal offset, the two calibration terms, reconstruction scale and the sampling error of the median combine by root-sum-square into the combined standard uncertainty uc(y) of the measurand y (Section 3.6) reported in Section 4.11; u(y) denotes a contribution propagated into y. Marker placement is excluded because it is not independently quantified, so the combined uncertainty is a lower bound. The uncertainty of the reference system itself is not included (Section 5.7).
Removing the calibration-sampling term (Section 3.6) lowered uc(y) by 0.3–1.0 mm, or 3–11%, to 4.2 mm (left elbow), 9.8 mm (left wrist), 14.4 mm (right elbow) and 7.7 mm (right wrist). Removing it also increased the relative weight of the two-degree-of-freedom reproducibility term in the Welch–Satterthwaite sum, so νeff fell to 12.0, 14.0, 5.9 and 3.2 and k rose to 2.18, 2.15, 2.46 and 3.07. U(y) therefore became 9.2, 21.1, 35.5 and 23.6 mm, slightly lower in three groups and higher at the right wrist.
5. Discussion
This study examined the discrepancy between a marker-based OptiTrack reference and three markerless pose estimators within a stereo reconstruction pipeline. The discussion addresses what that discrepancy represents, which parts of the measurement chain determine it, and whether the differences between the models were large enough to be distinguished from the uncertainty of the chain they share.
5.1. What the Measured Discrepancy Represents
The principal question here is whether differences between the checkpoints remain interpretable once the uncertainty of the validation chain is accounted for (Section 5.5); the decomposition discussed in this and the following sections is the means of answering it. The distance between a surface-marker reference and a triangulated keypoint was not treated as a measure of pose estimation accuracy, but as the outcome of a chain comprising anatomical correspondence, marker placement, image-based localisation, stereo reconstruction, temporal association and camera-to-motion-capture registration. The marker-pair midpoint was used as the reference because it is the simplest point obtainable from two surface markers without a segment model; it lies on the chord between the markers rather than on the joint axis, so its offset from the keypoint contains the placement term by construction.
Six quantities can be estimated, and they are not of the same kind (Table 7). Four are systematic contributions to the measured discrepancy; the sampling error of the median is statistical; the sixth is the disagreement between the two camera views, treated as a between-session random term, which, because it behaves largely as a session-level offset, does not average out over the frames of a session and limits how far the systematic terms can be separated for individual observations and group medians alike.
The two-view disagreement deserves separate comment, because it is a disagreement between two independent localisations of the same point rather than a displacement of the reference frame, and is, therefore, distinct from the residual transform error bounded in Section 5.3. It is not, however, purely random: its magnitude exceeds the within-group scatter of the per-axis offsets, so it behaves largely as a session-level offset, and where it depends on viewing angle (Section 4.3), the sign of that dependence follows neither the limb nor the cameras consistently across sessions. It is, therefore, treated as a between-session random term. Its isotropy cannot be tested, since the reprojection residual is insensitive to disagreement along the epipolar line, which maps into depth.
Five contributions—calibration sampling, between-session calibration reproducibility, reconstruction scale, temporal offset and the sampling error of the median—were each propagated into the same measurand, y (Section 3.6), so they combine by root-sum-square into a combined standard uncertainty, uc(y), of 4.5–14.9 mm per joint-side group (Section 4.11). The terms combined are standard uncertainties of the same quantity y, not the displacements that each mechanism produces in an individual observation; the point-level magnitudes in Table 7, therefore, do not add. The terms were combined as uncorrelated; the between-session reproducibility term already contains the sampling variability of each single-session fit, so part of the calibration sampling is counted twice. Removing the calibration-sampling term lowers uc(y) by 0.3–1.0 mm (Section 4.11), so the double-counting does not alter the conclusions drawn from the budget. Nor does it affect the comparison between models, which rests on paired session-level differences and the minimum detectable difference rather than on uc(y) (Section 5.5). Because marker placement is excluded, the budget as a whole remains a lower bound. Two contributions are excluded from uc(y). Marker placement is not independently quantified. Two-view disagreement is excluded because it is a property of the pose estimators, the two views disagreeing about the same keypoint, and is therefore part of what y measures rather than an uncertainty in measuring it; its group-median magnitude at the left wrist (38.7 mm) also exceeds the measured discrepancy there (24.9 mm). It is reported separately in Table 7 instead.
In summary, the perpendicular component, an upper bound on the placement term, is of the same order as the reported discrepancy, and calibration, reconstruction scale, temporal offset and the sampling error of the median give the group medians a combined standard uncertainty of 4.5–14.9 mm, which a study reporting only the aggregate would leave unstated.
5.2. Anatomical Correspondence and Marker Placement
The compared points represent different constructs. The reference was the midpoint of two skin-mounted markers; the model output was a learned COCO keypoint. Taking the midpoint rather than either marker alone reduced the discrepancy by 8–17 mm, but neither point is an independently established joint centre [14].
Because both markers sat on the front of the limb rather than on a true diameter, their midpoint lies on a chord displaced forward from the joint axis. Two of the three predictions following from Equation (1) are consistent with the data. The displacement was perpendicular to the marker-pair axis rather than along it by a factor of two to three in every group, and it was larger at the thicker joint. At the elbow, the implied marker-ring radius of 49.9–54.9 mm is of the same order as the 54.0 mm derived from measured limb circumference; because r also contains calibration and keypoint error, it is an upper bound on the anatomical radius only under the assumption stated below for the perpendicular component—that those contributions do not cancel part of the anatomical offset—and is not an estimate of it, so the comparison is not read as a confirming test. At the wrist, where the elliptical cross-section makes the circular model invalid, only the perpendicular component is reported: 21.6 mm (left) and 23.0 mm (right). Soft-tissue movement was not measured, so the perpendicular component bounds from above the combined effect of anatomical non-correspondence, marker placement and soft-tissue movement, under the assumption that calibration and keypoint error do not cancel part of it; the label marker placement in Table 7 is used in this combined sense. The third prediction, that the projected displacement varies with the orientation of the marker-pair axis, is not supported within sessions; all recordings placed the pair close to perpendicular to the camera axis, so the available range is too narrow to test it.
This geometry is consistent with the larger discrepancy at the elbow than at the wrist. That difference was +13.2 mm and stayed positive in all 400 bootstrap refits of the extrinsic transform, making it the finding least affected by the calibration. The same ordering has been reported independently with different markerless systems and movement tasks [8,11], so it is unlikely to be specific to this protocol.
Soft-tissue movement may contribute alongside the static geometry. Stable marker separation within a session does not exclude both markers moving together relative to the bone [14], and the present design cannot separate that from placement. The reported quantity should, therefore, be described as a marker-to-keypoint discrepancy rather than as joint-centre error.
5.3. Separating Anatomical from Geometric Contributions
Two analyses address whether the observed offset could originate in the recovered transform rather than in anatomy, and both use structure in the data rather than an independent calibration.
The first is the left–right comparison. At the elbow, the lateral component changed sign between sides (−10.5 ± 1.2 and +9.4 ± 0.7 mm, summing to −1.0 ± 1.4 mm), while the other two components kept their sign. A static geometric transform has no knowledge of which limb it is imaging, so any error it introduces acts in the same direction on both sides; a component that mirrors, therefore, cannot come from the extrinsic calibration, and, because limb postures on the two sides were comparable at the elbow (Section 4.10), this bounds the lateral component of any residual transform error there at about a millimetre. The test needs no additional equipment, only that measurements be grouped by side. It does not exclude every non-anatomical explanation—a systematic difference in subject position between left- and right-side sessions would produce the same pattern—but it excludes the specific alternative it was designed to test.
The second exploits a different invariance. An anatomical offset is fixed relative to the limb and rotates with it, whereas a transform error is fixed relative to the cameras. At the elbow, a constant offset in the limb-fixed frame gave a residual 5.3–7.3 mm lower than one in the camera-fixed frame, with both sessions agreeing, and the ordering held when the frame was rebuilt from parent keypoints sharing no limb segment with the target joint. For the elbow, then, the offset behaves as an anatomical quantity. At the wrist, the two models are indistinguishable for different reasons on each side: the left wrist is underpowered, with one session and the narrowest range of limb orientations, while the right wrist has the largest sample and the widest range, yet its two sessions disagree in sign—the same heterogeneity discussed in Section 5.4.
The combined fit bounds any residual camera-fixed term at 11–23 mm, and even that overstates the calibration contribution, because the term absorbs every camera-fixed cause. With fixed cameras and an upright participant, the gravitational vertical is itself camera-fixed, and a substantial part of the fitted term lies along it—which is what markers on the upper surface of a limb would produce.
5.4. Geometric and Temporal Validity of the Chain
Valid stereo reconstruction requires consistent treatment of lens distortion. Pose estimation operated on distorted images, while triangulation used calibrated projection matrices, so keypoints had to be undistorted beforehand. Omitting that step displaces the image rays differently in each camera and produces a systematic depth bias resembling an anatomical offset. Systematic reviews of markerless capture for industrial ergonomic assessment report accuracies in the 5–20 mm range against 0.5–1.5 mm for marker-based systems [3]; the present decomposition indicates how much of such a figure belongs to the protocol.
The original extrinsic registration was invalid at acquisition (Section 4.2), and the loss of loop-closure consistency between calibration runs indicates that the camera assembly had moved between calibration dates. Retrospective recovery reduced the offsets to 11–40 px (10.6–37.9 mm, a figure that includes the anatomical marker-to-keypoint offset), and because the combination used for fitting retained a larger residual than twelve of the thirteen held-out combinations (Section 4.2), the correction does not favour the data it was fitted to. The transform was, nevertheless, fitted to experimental marker data rather than to an independent target, and bootstrap refitting showed the resulting uncertainty to be large enough to affect both absolute discrepancies and model rankings.
The two views also disagreed substantially about the target keypoint. During right wrist self-occlusion, confidence fell in camera 0 while camera 1 was unaffected, and the depth discrepancy correlated with camera 0 confidence (r = −0.703) but not with camera 1 (r = +0.004). A single-camera failure propagates preferentially into depth: at 900 mm, one pixel of transverse displacement corresponds to 0.95 mm but one pixel of disparity error to 1.34 mm, so a 100 px error in one view displaces the point by roughly 47 mm transversely and 134 mm in depth. Per-view confidence is, therefore, more informative than a pooled value, which cannot detect an asymmetric failure. Excluding observations below a camera 0 confidence of 0.90 reduced the between-session difference at the right wrist from 28.0 to 15.9 mm; the remainder cannot be attributed with these data, since marker placement, between-session calibration reproducibility (13–17 mm for an individual observation) and session-specific temporal effects are confounded.
The temporal offset varied in magnitude between sessions (−59 to −4 ms, all negative), so it is not a system constant. Within the block S2–S7, it decreased approximately linearly (Section 4.7); the earlier session S1 lies off this line, suggesting a clock adjustment between S1 and S2. Because the acceleration coefficient B differed from zero in most session × model cells (Section 4.7), the fitted term also absorbs a velocity- and acceleration-dependent component and is not a pure clock offset. The fitted term cannot be uniquely separated from motion blur or speed-dependent localisation, since exposure was identical throughout, and should be described as an apparent rather than a measured clock offset. Its point-level magnitude is substantial (median 10.1 mm across sessions, 30.1 mm in S7), but the displacement A·v is directed along the instantaneous motion rather than along the discrepancy, so it changes |d| only through its projection on d; removing it changed the reported group medians by, at most, 0.5 mm (Section 4.11). It does, however, contribute to the per-observation dispersion reported in Table A1. No correction was applied, because the offset was estimated by minimising the same residual subsequently reported, and applying it would lower that figure by construction. The cameras were triggered sequentially in software and are not claimed to have been synchronised.
5.5. Comparison of the Pose-Estimation Models
Because consecutive observations within a session are strongly autocorrelated, models were compared at the session level [26]. Across seven sessions, the Friedman test found no difference (p = 0.565), and the largest median pairwise difference was 1.1 mm. A moving-block bootstrap retained three of twelve pairwise effects with intervals excluding zero, all between 2.1 and 5.2 mm, of which one remained after Bonferroni correction (HRNet-w32 against ViTPose at the left wrist, a group recorded in a single session, so the difference cannot be separated from that session)—small against both the total discrepancy and the sensitivity to calibration. The minimum detectable difference of 3.0–5.1 mm with seven sessions (Section 4.8) exceeds the largest median pairwise difference across sessions (1.1 mm).
Ranking was itself calibration-sensitive: under plausible bootstrap refits of the recovered transform, the leading model changed in three of the four joint-side groups. A ranking reported from a single registration would imply more certainty than the calibration supports.
This does not demonstrate equivalence. With seven sessions, the study had limited power, and no equivalence margin was prespecified, so the supportable conclusion is that no difference between these three checkpoints was resolvable above the uncertainty of the present pipeline. That the systematic terms nonetheless appear alike across three architectures of substantially different design is informative, since an effect common to all three is unlikely to belong to any one of them. For the joints and conditions studied, no median pairwise difference across sessions between these checkpoints reached the minimum detectable difference (Section 4.8), and the leading checkpoint changed with the calibration, so the present protocol could not resolve one.
5.6. Methodological Implications
Set against the gap identified in Section 2.4, the main finding is that, within this protocol, differences and rankings among the three checkpoints were not interpretable above the uncertainty of the validation chain. One of twelve pairwise comparisons remained significant after Bonferroni correction in a group recorded in a single session; no median pairwise difference across sessions reached the minimum detectable difference; and the leading checkpoint changed under resampling of the calibration. That conclusion rests on the session-level comparison and on resampling of the calibration. The decomposition of the marker-to-keypoint discrepancy explains why the absolute values cannot be read as model accuracy, and it supplies the supporting mechanisms. The perpendicular placement component bounds the marker contribution from above and is of the same magnitude as the corresponding group medians (ratios of 0.81 at the wrist and 0.88 at the elbow; Section 4.6). Calibration, scale, temporal and sampling terms give a combined standard uncertainty of 4.5–14.9 mm per joint-side group. The left–right mirroring bounds the lateral component of the residual transform error at the elbow, and the limb-fixed analysis bounds any residual camera-fixed term at 11–23 mm. The transferable framework consists of verifying the extrinsic calibration before analysis, checking reconstruction scale against an object of known dimensions, estimating the apparent temporal offset per session, propagating the identified contributions into a GUM budget for the group median, comparing models at the session level against a minimum detectable difference, and resampling the calibration to test whether the ranking is stable. The findings impose specific requirements on how comparable studies are set up and reported, stated in Section 6; the limitations that qualify them follow.
5.7. Limitations
The findings come from one participant and seven sessions, with one or two sessions per joint-side group, so they constitute a single-subject methodological case study. The magnitudes reported here—the placement component, the calibration contributions, the temporal offset and the differences between models—are, therefore, specific to this participant and experimental protocol and may differ for other participants, marker sets and protocols; what transfers is the validation and uncertainty-analysis framework, not the magnitudes it produced here. Only one checkpoint of each architecture was tested, within one shared top-down pipeline, so the comparison does not extend to architecture families, input resolutions or training regimes. The participant is also the corresponding author. All outcomes are instrumental, and none depends on participant judgement or self-report, so this is not expected to bias the measured quantities directly, but marker application and movement execution were not blinded to the aims of the study. Thousands of frames do not substitute for participant- or session-level replication, since observations within a session share anatomy, marker placement, calibration and movement conditions [26]. The extrinsic transform was recovered retrospectively, introducing partial dependence between registration and evaluation; the scope of that dependence is narrower than it first appears, since intrinsics, stereo extrinsics, undistortion, triangulation and the chessboard scale check involve no motion capture data, and the paired comparison between architectures is less exposed, since a shared transform error affects all three models alike. It is not immune, because the median distance depends nonlinearly on the transform, and the leading model changed under bootstrap refits (Section 4.9). For the absolute distances and per-axis biases, the analyses of Section 5.3 bound the concern rather than removing it. A held-out check—re-evaluating each session under a transform fitted without its own annotations (Section 3.4), since the ten S6 frames used for the production fit are also part of the evaluation data—shifted the reconstructed median from 33.7 to 36.0 mm (Section 4.9), a modest change given the dependence, although the leading model changed in two of the four joint-side groups.
Several further constraints affect specific quantities. The reconstruction residual and wand calibration error of the reference system on the day of acquisition were not retained, so the reference system’s own uncertainty is not included in Table 7; manufacturer guidance indicates submillimetre residuals for well-observed markers [4], small against the terms of 20–40 mm considered here, but this could not be verified for this dataset. A study concluding that the measurement chain must be qualified should also state how the reference itself is qualified. A tracking ground truth is characterised by comparison against a metrology-grade reference observed in the same working volume—a calibrated length artefact or a coordinate measuring instrument with a traceable calibration certificate—from which its trueness and expanded uncertainty are obtained following the GUM [33]; a protocol for such a laboratory-specific evaluation with standard equipment has been described [34]. The expanded uncertainty of the reference limits how finely the absolute discrepancies between a method and the reference (Table 3) can be read: a method-to-reference discrepancy is established only to the extent that it exceeds the expanded uncertainty of the reference combined with that of the comparison chain. Differences between two methods measured against the same reference are far less sensitive to it, because the reference error is common to both. Here, the reference was not characterised, so Table 7 omits it; the absolute discrepancies of Table 3 carry this unquantified term in addition to the 4.5–14.9 mm of Table 7, whereas the between-model comparison of Section 5.5 rests on the minimum detectable difference and is not affected in the same way. Reconstruction scale was measured with boards spanning 594–872 mm against measurements at a median keypoint depth of 897 mm, so its value at that depth is extrapolated, and board planarity correlated with both depth and scale error. The reconstruction is also systematically shorter than the OptiTrack reference by 4.09% (95% CI 2.5 to 5.7%); this is consistent across three estimators built from the same hand-annotated points, so they are not independent confirmations, and the cause is not established by this dataset. A fixed exposure prevented separation of motion blur from other velocity-dependent effects. And image pairs were acquired at approximately 12.8 Hz, which supports statements about accuracy at sampled instants but not about trajectory smoothness or jitter. Several analyses, including the right-wrist occlusion investigation and the limb-frame diagnostics, were partly post hoc; they identified plausible mechanisms but would need prospective validation.
5.8. Future Work
Placing the marker pair on a true diameter of the joint, or deriving the joint centre from a segment-mounted cluster, would remove the largest systematic term identified here. Recording several participants would establish whether the perpendicular placement offset and the mirrored lateral component behave as the geometry predicts across body types. Hardware triggering would eliminate the per-session temporal offset, recording at more than one exposure time would separate motion blur from the temporal terms, and calibrating on the day of acquisition would remove the need for retrospective recovery. A planar fiducial target left in the working volume during each recording would, additionally, make the verification of extrinsic validity prospective; a rigid plate carrying both a printed board and retroreflective markers, observed by both systems at once; would give the camera-to-motion-capture transform directly; and comparative evaluations of planar marker systems can guide the choice of marker family [35]. Finally, the per-camera confidence behaviour seen under self-occlusion suggests that a rejection criterion applied per view would catch a failure mode a pooled criterion misses; this was observed rather than designed for, and would need to be specified in advance and tested on independent data.
6. Conclusions
This single-participant methodological case study asked whether differences and rankings among three MMPose checkpoints—ViTPose, RTMPose-m and HRNet-w32—remained interpretable once the uncertainty of the validation chain was accounted for, comparing them against an eight-camera OptiTrack system for elbow and wrist measurements with a calibrated stereo pair of industrial cameras. They did not. The validation and uncertainty-analysis framework used to answer the question decomposes the marker-to-keypoint discrepancy into placement, temporal, calibration and scale terms with an explicit combined uncertainty. Two supporting analyses accompany it: a geometric account of why placement error is expected to grow with joint thickness, and a left–right diagnostic that bounds the lateral component of residual transform error without additional equipment, at the elbow, where limb postures on both sides were comparable. Four methodological requirements for stereo-to-motion-capture comparison follow. The numerical values reported here are specific to this participant and protocol; the framework is the transferable contribution.
The median distance between the marker-pair midpoint and the corresponding triangulated keypoint ranged from 23.9 to 47.1 mm, within the range reported by comparable validation studies. That distance should not be read as a measure of pose estimation accuracy. The two systems do not measure an anatomically identical point, and the result depends on the geometric and temporal validity of the whole acquisition and reconstruction chain.
Among the supporting mechanisms, the largest identifiable term, bounded from above by the perpendicular offset component, is consistent with where the markers were placed relative to the joint axis, a geometric effect that predicts larger discrepancies at thicker joints. Further contributions came from the uncertainty of the recovered extrinsic calibration and from reconstruction scale; the temporal offset between the two systems varied in magnitude between sessions recorded on the same day but changed the reported medians by, at most, 0.5 mm. Disagreement between the two camera views about the location of the same joint, which arises in the pose estimators themselves, was of the same order as the discrepancy. Two diagnostic analyses—the mirroring of the lateral error component between the left and right side and the separation of limb-fixed from camera-fixed offsets—bound components of the residual contribution from the recovered transform, and at the elbow in this participant, both indicate that the offset behaves more like an anatomical quantity than like a residual calibration error; whether the geometry holds across body types requires further participants.
No difference between the three checkpoints was resolvable above the uncertainty of the measurement chain. The largest median pairwise difference was 1.1 mm at the session level, and resampling the recovered calibration changed which model ranked first in three of the four joint-side groups. This does not demonstrate that the checkpoints are equivalent: with seven sessions, the study had limited power, and no equivalence margin was prespecified. What it does show is that a ranking obtained from a single calibration estimate implies more certainty than the calibration supports.
Four requirements follow for comparable work. Keypoints detected in distorted images must be undistorted before triangulation, since the resulting bias is indistinguishable from an anatomical offset. Extrinsic calibration must be verified at acquisition rather than assumed valid from an earlier date, prospectively where possible, for example, with a planar fiducial target kept in the working volume during recording (Section 5.8). The temporal offset must be established independently or estimated for each session, because it is not a system constant, and its effect grows with limb speed. And the anatomical correspondence between the marker-derived reference and the learned keypoint must be defined before their distance is interpreted as accuracy.
The broader implication is that an aggregate marker-to-keypoint discrepancy confounds properties of the protocol with properties of the method under test. Validation should report not only the size of the disagreement between systems, but whether the compared points are anatomically equivalent and whether the measurement chain is valid enough to support the comparison. For this dataset, protocol-related uncertainty was greater than the observed differences between the three models.
Author Contributions
Conceptualization, M.C. and A.C.; methodology, M.C. and A.C.; software, M.C.; validation, A.C.; formal analysis, M.C.; investigation, M.C.; resources, A.C.; data curation, M.C.; writing—original draft preparation, M.C.; writing—review and editing, M.C., A.C., J.C., O.H. and D.R.; visualization, M.C.; supervision, J.C. and A.C.; project administration, D.R. All authors have read and agreed to the published version of the manuscript.
Funding
This research was funded by the Slovak Research and Development Agency under contract no. APVV-24-0390, the Scientific Grant Agency of the Ministry of Education, Research, Development and Youth of the Slovak Republic No. 1/0637/23 and 1/0045/25, and by the Slovak University of Technology in Bratislava through an internal grant for teams of young researchers, project OPTIVISION.
Institutional Review Board Statement
Formal ethical review and approval were not required under the applicable legislation of the Slovak Republic and the Czech Republic and the relevant institutional procedures. According to Slovak Act No. 576/2004 Coll. on Healthcare and Czech Act No. 378/2007 Coll. on Pharmaceuticals, formal ethical approval is legally required primarily for biomedical and invasive research. The study was conducted in full compliance with the Slovak Code of Research Integrity and Ethics (2024, VAIA), Slovak Act No. 172/2005 Coll. on the Organization of State Support for Research and Development, Czech Act No. 130/2002 Coll. on the Support of Research and Development, and the research integrity principles applied by Czech academic institutions. The motion capture data collection involved the corresponding author as the sole voluntary participant, posed no physical or psychological risk, and did not involve the processing of sensitive personal or medical data.
Informed Consent Statement
Informed consent was obtained from the sole participant involved in the study, who is the corresponding author of this manuscript. The participant consented to the non-invasive data collection, subsequent data analysis, publication of the resulting outputs presented in this paper, and the sharing of the de-identified data.
Data Availability Statement
The data supporting the findings of this study—the 2219 retained observations with a column dictionary, the per-frame 2D keypoints of the participant, the annotated marker-centre coordinates (sessions S3, S5 and S6) used for extrinsic recovery, the recovered camera-to-motion-capture transform, the camera calibration files, the frame timestamps and the analysis scripts that reproduce the tables, the in-text results and Figure 4—are openly available in Zenodo at https://doi.org/10.5281/zenodo.22936156. Raw camera images are not shared because they show the participant and, in some frames, other persons; detections of persons other than the participant were removed from the deposited keypoint data.
Acknowledgments
During the preparation of this manuscript, the authors used Claude (Anthropic, San Francisco, CA, USA; Claude Sonnet 5 and Claude Opus 5) for the purposes of code development, statistical analysis, and manuscript drafting and editing.
Conflicts of Interest
The authors declare no conflicts of interest.
Abbreviations
The following abbreviations are used in this manuscript:
| AI | Artificial intelligence |
| RGB | Red-green-blue |
| AP | Average precision |
| AIC | Akaike information criterion |
| CI | Confidence interval |
| COCO | Common objects in context |
| CSV | Comma-separated values |
| DLT | Direct linear transformation |
| FPS | Frames per second |
| GUM | Guide to the Expression of Uncertainty in Measurement |
| IQR | Interquartile range |
| LoA | Limits of agreement |
| P95 | 95th percentile |
| RMS | Root-mean-square |
| RMSE | Root-mean-square error |
| SD | Standard deviation |
Appendix A
Table A1.
Dispersion of the 3D marker-to-keypoint distance and per-axis limits of agreement by group and model. IQR is the interquartile range and P95 the 95th percentile of the 3D distance; LoA are the Bland–Altman limits of agreement (bias ± 1.96 SD) per axis in the camera 0 frame. All values in millimetres.
References
- Colyer, S.L.; Evans, M.; Cosker, D.P.; Salo, A.I.T. A Review of the Evolution of Vision-Based Motion Analysis and the Integration of Advanced Computer Vision Methods towards Developing a Markerless System. Sports Med. Open 2018, 4, 24. [Google Scholar] [CrossRef] [Scilit] [PubMed]
- Wade, L.; Needham, L.; McGuigan, P.; Bilzon, J. Applications and Limitations of Current Markerless Motion Capture Methods for Clinical Gait Biomechanics. PeerJ 2022, 10, e12995. [Google Scholar] [CrossRef] [Scilit] [PubMed]
- Scataglini, S.; Fontinovo, E.; Khafaga, N.; Khan, M.U.; Khan, M.F.; Truijen, S. A Systematic Review of the Accuracy, Validity, and Reliability of Markerless versus Marker Camera-Based 3D Motion Capture for Industrial Ergonomic Risk Analysis. Sensors 2025, 25, 5513. [Google Scholar] [CrossRef] [Scilit] [PubMed]
- NaturalPoint, Inc. Quick Start Guide: Precision Capture. OptiTrack Documentation. Available online: https://docs.optitrack.com/quick-start-guides/quick-start-guide-precision-capture (accessed on 17 August 2026).
- Roggio, F.; Trovato, B.; Sortino, M.; Musumeci, G. A Comprehensive Analysis of the Machine Learning Pose Estimation Models Used in Human Movement and Posture Analyses: A Narrative Review. Heliyon 2024, 10, e39977. [Google Scholar] [CrossRef] [Scilit] [PubMed]
- Scott, B.; McInnes, M.; Chadwick, E.K.; Blana, D. Assessing Single Camera Markerless Motion Capture with OpenSim Inverse Kinematics during Upper Limb Activities of Daily Living. Int. Biomech. 2025, 12, 35–47. [Google Scholar] [CrossRef] [Scilit] [PubMed]
- Donahue, S.; Peiffer, J.D.; Richardson, R.T.; Zhong, Y.; Tan, S.Q.Y.; Marteau, B.L.; Russo, S.A.; Wang, M.D.; Cotton, R.J.; Chafetz, R. Monocular Markerless Motion Capture Enables Quantitative Assessment of Upper Extremity Reachable Workspace. Sensors 2026, 26, 3421. [Google Scholar] [CrossRef] [Scilit] [PubMed]
- Nakano, N.; Sakura, T.; Ueda, K.; Omura, L.; Kimura, A.; Iino, Y.; Fukashiro, S.; Yoshioka, S. Evaluation of 3D Markerless Motion Capture Accuracy Using OpenPose with Multiple Video Cameras. Front. Sports Act. Living 2020, 2, 50. [Google Scholar] [CrossRef] [Scilit] [PubMed]
- Needham, L.; Evans, M.; Cosker, D.P.; Wade, L.; McGuigan, P.M.; Bilzon, J.L.; Colyer, S.L. The Accuracy of Several Pose Estimation Methods for 3D Joint Centre Localisation. Sci. Rep. 2021, 11, 20673. [Google Scholar] [CrossRef] [Scilit] [PubMed]
- Kanko, R.M.; Laende, E.K.; Davis, E.M.; Selbie, W.S.; Deluzio, K.J. Concurrent Assessment of Gait Kinematics Using Marker-Based and Markerless Motion Capture. J. Biomech. 2021, 127, 110665. [Google Scholar] [CrossRef] [Scilit] [PubMed]
- Lahkar, B.K.; Muller, A.; Dumas, R.; Reveret, L.; Robert, T. Accuracy of a Markerless Motion Capture System in Estimating Upper Extremity Kinematics during Boxing. Front. Sports Act. Living 2022, 4, 939980. [Google Scholar] [CrossRef] [Scilit] [PubMed]
- Hansen, R.M.; Arena, S.L.; Queen, R.M. Validation of Upper Extremity Kinematics Using Markerless Motion Capture. Biomed. Eng. Adv. 2024, 7, 100128. [Google Scholar] [CrossRef] [Scilit]
- Leardini, A.; Chiari, L.; Della Croce, U.; Cappozzo, A. Human Movement Analysis Using Stereophotogrammetry. Part 3: Soft Tissue Artifact Assessment and Compensation. Gait Posture 2005, 21, 212–225. [Google Scholar] [CrossRef] [Scilit] [PubMed]
- Camomilla, V.; Dumas, R.; Cappozzo, A. Human Movement Analysis: The Soft Tissue Artefact Issue. J. Biomech. 2017, 62, 1–4. [Google Scholar] [CrossRef] [Scilit] [PubMed]
- Della Croce, U.; Leardini, A.; Chiari, L.; Cappozzo, A. Human Movement Analysis Using Stereophotogrammetry. Part 4: Assessment of Anatomical Landmark Misplacement and Its Effects on Joint Kinematics. Gait Posture 2005, 21, 226–237. [Google Scholar] [CrossRef] [Scilit] [PubMed]
- Tang, J.; Suri, S.; Ajisafe, D.; Wandt, B.; Rhodin, H. CasCalib: Cascaded Calibration for Motion Capture from Sparse Unsynchronized Cameras. In Proceedings of the IEEE International Conference on Automatic Face and Gesture Recognition (FG); IEEE: New York, NY, USA, 2024. [Google Scholar] [CrossRef] [Scilit]
- Sun, K.; Xiao, B.; Liu, D.; Wang, J. Deep High-Resolution Representation Learning for Human Pose Estimation. In Proceedings of the IEEE/CVF Conference on Computer Vision and Pattern Recognition (CVPR), Long Beach, CA, USA, 15–20 June 2019; pp. 5693–5703. [Google Scholar] [CrossRef] [Scilit]
- Xu, Y.; Zhang, J.; Zhang, Q.; Tao, D. ViTPose: Simple Vision Transformer Baselines for Human Pose Estimation. In Proceedings of the Advances in Neural Information Processing Systems (NeurIPS), New Orleans, LA, USA, 28 November–9 December 2022; Volume 35, pp. 38571–38584. [Google Scholar]
- Jiang, T.; Lu, P.; Zhang, L.; Ma, N.; Han, R.; Lyu, C.; Li, Y.; Chen, K. RTMPose: Real-Time Multi-Person Pose Estimation Based on MMPose. arXiv 2023, arXiv:2303.07399. [Google Scholar] [CrossRef] [Scilit]
- MMPose Contributors. MMPose: OpenMMLab Pose Estimation Toolbox and Benchmark. Available online: https://github.com/open-mmlab/mmpose (accessed on 17 August 2026).
- Liang, S.; Zhang, Y.; Diao, Y.; Li, G.; Zhao, G. The Reliability and Validity of Gait Analysis System Using 3D Markerless Pose Estimation Algorithms. Front. Bioeng. Biotechnol. 2022, 10, 857975. [Google Scholar] [CrossRef] [Scilit] [PubMed]
- D’Haene, M.; Chorin, F.; Colson, S.S.; Guérin, O.; Zory, R.; Piche, E. Validation of a 3D Markerless Motion Capture Tool Using Multiple Pose and Depth Estimations for Quantitative Gait Analysis. Sensors 2024, 24, 7105. [Google Scholar] [CrossRef] [Scilit] [PubMed]
- Balci, I.C.; Sayin, I.; Salturk, S.; Gursoy, R.; Ozsoy, U.; Dogru, H.C.; Akca, G.; Eraslan, A.; Sahin, O.; Demircali, A.A.; et al. Reliability Assessment of Markerless Technologies in Biomechanical Motion Analysis: A Performance Comparison. Front. Sports Act. Living 2026, 7, 1712332. [Google Scholar] [CrossRef] [Scilit] [PubMed]
- Chougule, A.; Dowsett, M.; Ekundayomi, D.; Machesney, A.; Mather, T.; Gompels, B.; McDonnell, S. Accuracy and Validity of 3D Markerless Motion Capture Compared to Marker-Based Systems for Lower-Limb Biomechanical Assessment: A Systematic Review. Sensors 2026, 26, 3956. [Google Scholar] [CrossRef] [Scilit] [PubMed]
- Shenoy, P.; Sundaram, S.M.; Kumaran, S.D.; Natarajan, M.; Kolekar, S. Advancements in Markerless Motion Capture Systems for Upper Limb Functional Assessment in Stroke Rehabilitation: A Comprehensive Review. Digit. Health 2026, 12, 20552076251412636. [Google Scholar] [CrossRef] [Scilit] [PubMed]
- Das, K.; de Paula Oliveira, T.; Newell, J. Comparison of Markerless and Marker-Based Motion Capture Systems Using 95% Functional Limits of Agreement in a Linear Mixed-Effects Modelling Framework. Sci. Rep. 2023, 13, 22880. [Google Scholar] [CrossRef] [Scilit] [PubMed]
- Uhlrich, S.D.; Falisse, A.; Kidziński, Ł.; Muccini, J.; Ko, M.; Chaudhari, A.S.; Hicks, J.L.; Delp, S.L. OpenCap: Human Movement Dynamics from Smartphone Videos. PLoS Comput. Biol. 2023, 19, e1011462. [Google Scholar] [CrossRef] [Scilit] [PubMed]
- Gozlan, Y.; Falisse, A.; Uhlrich, S.; Gatti, A.; Black, M.; Hicks, J.; Delp, S.; Chaudhari, A. OpenCapBench: A Benchmark to Bridge Pose Estimation and Biomechanics. In Proceedings of the IEEE/CVF Conference on Computer Vision and Pattern Recognition Workshops (CVPRW); IEEE: New York, NY, USA, 2025. [Google Scholar]
- Yeung, C.K.; Suzuki, T.; Tanaka, R.; Yin, Z.; Fujii, K. AthletePose3D: A Benchmark Dataset for 3D Human Pose Estimation and Kinematic Validation in Athletic Movements. In Proceedings of the CVSports Workshop at CVPR; IEEE: New York, NY, USA, 2025. [Google Scholar]
- Ruescas-Nicolau, A.V.; Medina-Ripoll, E.J.; Parrilla Bernabé, E.; de Rosario Martínez, H. Multimodal Human Motion Dataset of 3D Anatomical Landmarks and Pose Keypoints. Data Brief 2024, 53, 110157. [Google Scholar] [CrossRef] [Scilit] [PubMed]
- Ruescas-Nicolau, A.V.; Medina-Ripoll, E.; de Rosario, H.; Navarro, J.S.; Parrilla, E.; Lizandra, M.C.J. A Deep Learning Model for Markerless Pose Estimation Based on Keypoint Augmentation: What Factors Influence Errors in Biomechanical Applications? Sensors 2024, 24, 1923. [Google Scholar] [CrossRef] [Scilit] [PubMed]
- Pierce, T.M.; Noble, E.; Davis, L.; Wilkins, J.; Loh, K.J. A Wireless Analog Interface with Near Frame-Accurate Synchronization for Optical Motion Capture. Electronics 2026, 15, 2787. [Google Scholar] [CrossRef] [Scilit]
- JCGM 100:2008; Evaluation of Measurement Data—Guide to the Expression of Uncertainty in Measurement. Joint Committee for Guides in Metrology: Sèvres, France, 2008.
- Eichelberger, P.; Ferraro, M.; Minder, U.; Denton, T.; Blasimann, A.; Krause, F.; Baur, H. Analysis of Accuracy in Optical Motion Capture—A Protocol for Laboratory Setup Evaluation. J. Biomech. 2016, 49, 2085–2088. [Google Scholar] [CrossRef] [Scilit] [PubMed]
- Jurado-Rodriguez, D.; Muñoz-Salinas, R.; Garrido-Jurado, S.; Medina-Carnicer, R. Planar Fiducial Markers: A Comparative Study. Virtual Real. 2023, 27, 1733–1749. [Google Scholar] [CrossRef] [Scilit]
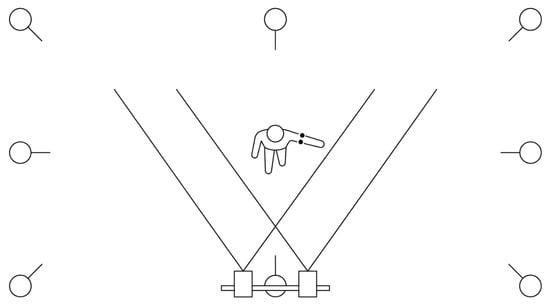
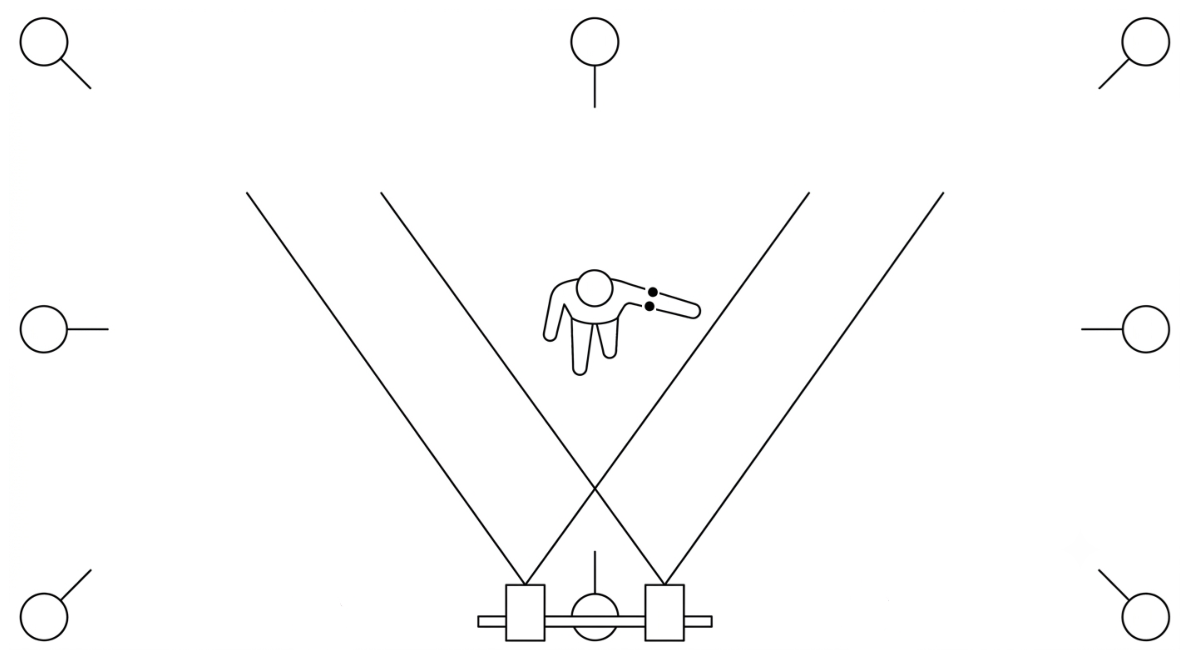
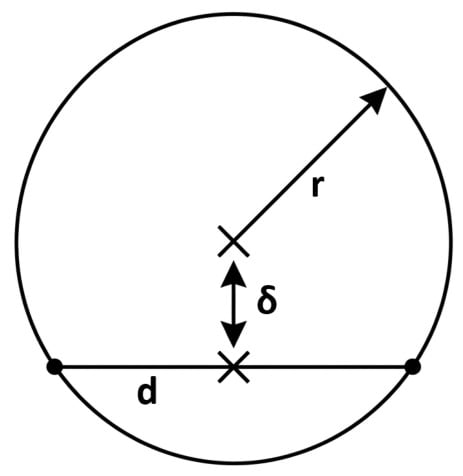
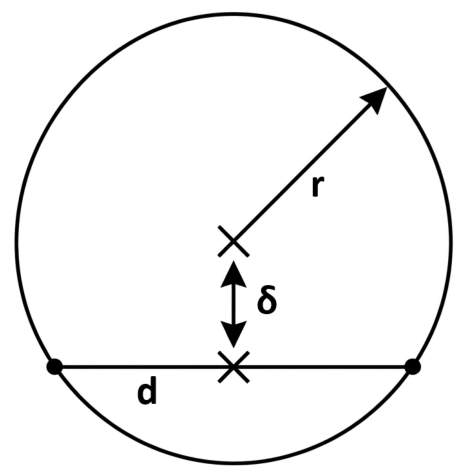
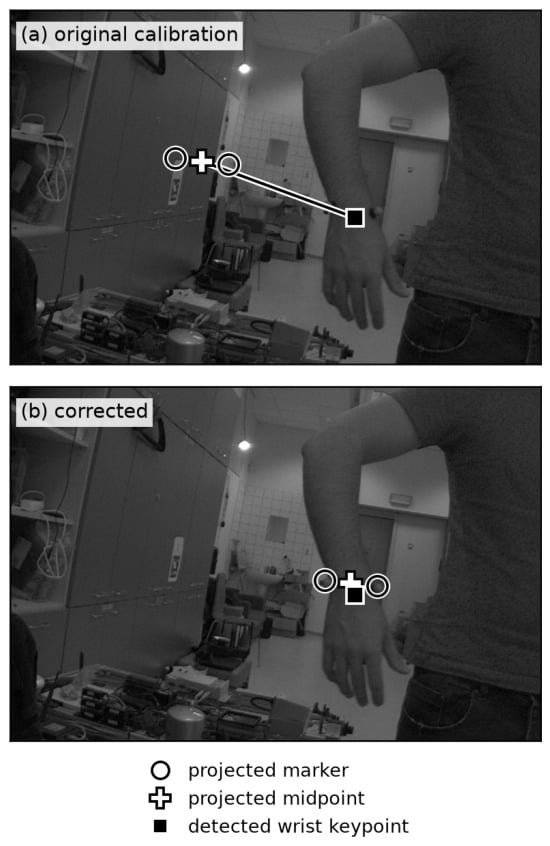
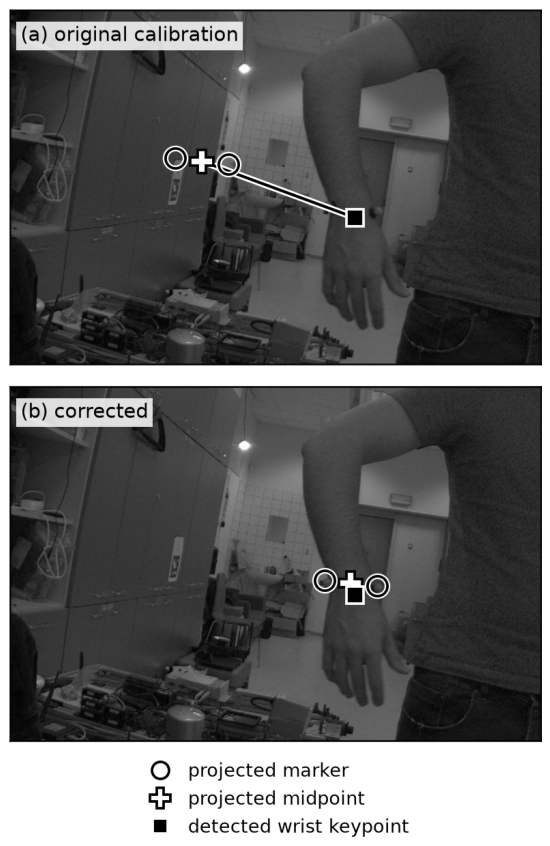
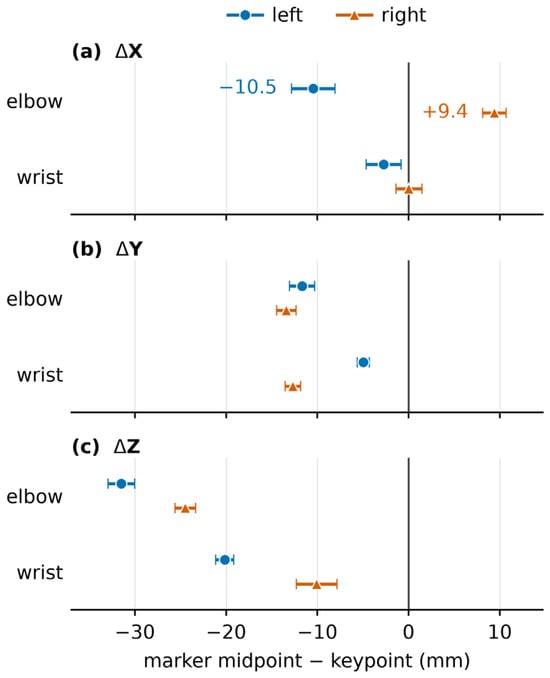
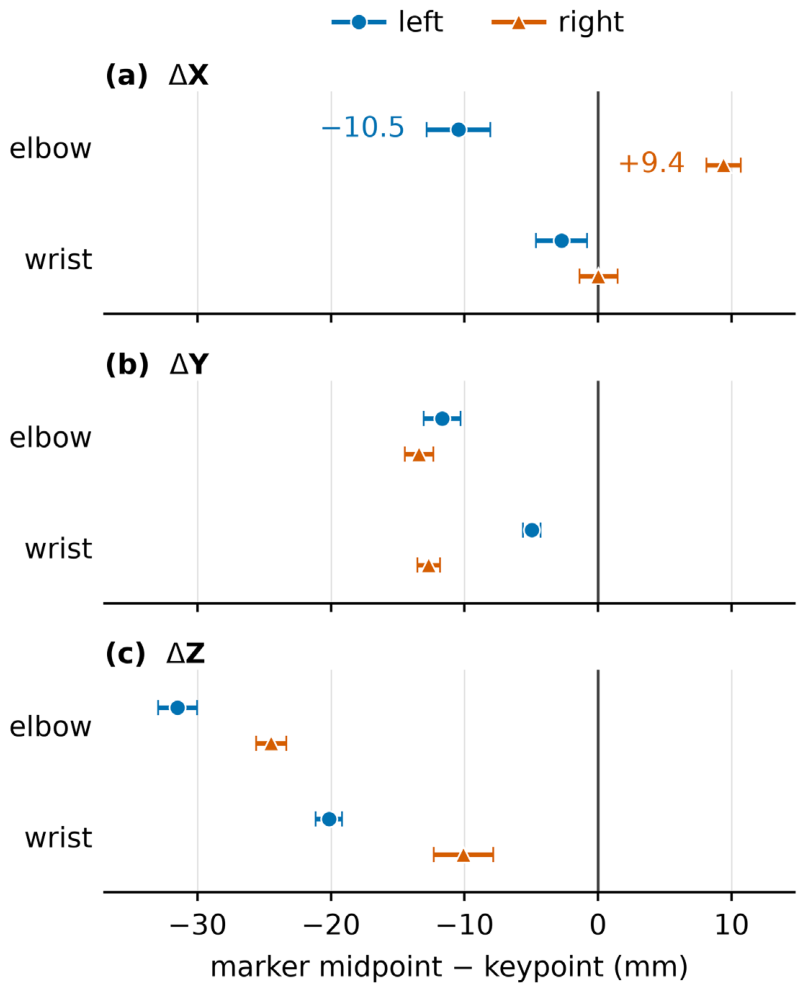

Disclaimer/Publisher’s Note: The statements, opinions and data contained in all publications are solely those of the individual author(s) and contributor(s) and not of MDPI and/or the editor(s). MDPI and/or the editor(s) disclaim responsibility for any injury to people or property resulting from any ideas, methods, instructions or products referred to in the content. |
© 2026 by the authors. Licensee MDPI, Basel, Switzerland. This article is an open access article distributed under the terms and conditions of the Creative Commons Attribution (CC BY) license.