


Abstract
The residual life of metallic structures is dictated by microstructural plastic damage, which conventional linear ultrasonics often fail to detect early. This study investigates the continuous, in-situ evolution of the second-order acoustic nonlinearity parameter (β2) throughout the monotonic tensile response of S235 structural steel, from the elastic regime to fracture. Bulk longitudinal waves were excited by a contact piezoelectric transducer and detected through-thickness using a non-contact Laser Doppler Vibrometer on a notched specimen. This allowed the normalized acoustic parameters to be mapped directly onto the macroscopic stress-strain curve. Three distinct acoustic regimes were identified. Up to the onset of the yield plateau, the nonlinearity parameter and the linear attenuation remained at unity within the specimen-to-specimen scatter. Beyond the yield point, β2/β2(0) rose steeply to approximately 4.5, whereas the normalised attenuation increased by at most approximately 20%. The rise extended over the yield plateau of the stress–strain curves and the parameter saturated when work hardening resumed (nominal strain ≈ 0.031–0.033), ahead of the maximum load (≈0.043); a lower value was recorded only at the last acquisition, at which the signal quality was degraded. The departure of β2 from unity, i.e., the first increase of the second-harmonic amplitude, occurred between nominal strains of 0.015 and 0.021, coinciding with the onset of the yield plateau (≈0.017) and slightly above the 0.2% offset yield strain (0.0128 ± 0.0004), as expected for a notched specimen in which plasticity reaches the interrogated volume once it spreads across the ligament; this supports its potential as a marker of yield onset. The increasing trend provides a continuously acquired ferritic-pearlitic reference data set and is consistent with, although not by itself proof of, a governing role of the initial dislocation substructure in harmonic generation.
1. Introduction
The structural integrity and remaining useful life of critical engineering infrastructure depend heavily on the mechanical performance of widespread metallic alloys. During their operational lifespan, these materials are frequently subjected to severe mechanical loading that can induce localized yielding and progressive plastic deformation. This accumulation of plastic damage at the microstructural level, primarily driven by dislocation motion and multiplication [1] and by the subsequent nucleation, growth and coalescence of micro-voids [2], acts as an early precursor to macroscopic cracking and ultimate structural failure. Consequently, identifying and quantifying this microstructural degradation before it evolves into irreversible macroscopic damage is of paramount importance for predictive maintenance and Structural Health Monitoring (SHM).
Conventional Non-Destructive Testing (NDT) techniques, including standard linear ultrasonic testing, typically rely on variations in acoustic wave velocity and linear attenuation to detect structural flaws. However, these linear acoustic properties are predominantly governed by the macroscopic elastic moduli of the material. As a result, they remain largely insensitive to early-stage, sub-wavelength microstructural anomalies. Linear ultrasound generally becomes effective only when the damage has already progressed to a detectable macroscopic scale, such as severe thickness loss or macro-crack formation, thereby limiting its utility for early-stage diagnostics. Jhang [3] reviewed this limitation in the context of micro-damage assessment; Su et al. [4] compared linear and nonlinear acousto-ultrasonic features under fatigue and found the nonlinear features to respond earlier; Frouin et al. [5] monitored the linear and nonlinear acoustic behaviour of titanium alloys in real time during cyclic loading; and a more recent study on fatigued steel plates [6] confirms the higher sensitivity of harmonic-based indicators.
To address this diagnostic gap, Nonlinear Ultrasonics (NLU) has emerged as a highly sensitive alternative. NLU techniques exploit the nonlinear interaction between a propagating finite-amplitude ultrasonic wave and the microstructural defects of the medium. As the wave propagates through a damaged or plastically deformed material, anharmonicities in the crystalline lattice and interactions with dense dislocation networks distort the waveform. This distortion transfers acoustic energy from the fundamental frequency to higher-order harmonics. The magnitude of this effect is commonly quantified by the second-order acoustic nonlinearity parameter β2, which has been shown to exhibit a strong, direct correlation with dislocation density and plastic strain accumulation, as shown by dislocation-based modelling validated on tensile specimens of stainless steel and Inconel 718 [7], by the second-harmonic measurement techniques reviewed by Matlack et al. [8], and by measurements on cold-worked AISI 304 stainless steel [9].
Despite the well-established sensitivity of nonlinear acoustics to plastic damage, its application under continuous mechanical loading raises a specific experimental difficulty. Contact piezoelectric receivers are sensitive to variations in couplant thickness and contact pressure, both of which change as the specimen elongates and its cross-section contracts during a tensile test. Because the second-harmonic amplitude scales with the square of the fundamental, even modest fluctuations at the reception interface propagate disproportionately into the extracted nonlinearity parameter and may be misinterpreted as material degradation [8].
To overcome these experimental bottlenecks, recent advancements have proposed the integration of Laser Doppler Vibrometry (LDV) into nonlinear acoustic setups. LDV provides a non-contact, high-resolution measurement of surface velocities, rendering it immune to couplant inconsistencies and ideally suited for capturing the delicate, low-amplitude higher harmonics [10]. The present group has applied LDV detection to the nonlinear monitoring of hardening cementitious materials [11], while in-situ nonlinear measurements during loading have also been reported with permanently mounted piezoelectric probes on notched steel under fatigue [12] and with integrated piezoelectric transducers for plastic strain determination [13].
The measurement configuration adopted here derives from a nonlinear acoustic platform previously developed and characterised by the present authors. Kordatou et al. [14] developed the automated excitation, LDV detection and synchronisation platform used here and reported its stability and linearity limits in an application to cement-based composites, while Kordatou et al. [15] applied a Rayleigh-wave implementation to low-cycle fatigue of aluminium 6061-T6, extracting the second- and third-order parameters between load blocks at a controlled zero-load state. Neither study addressed monotonic plasticity in a metal: the former concerned cement-based composites and the latter cyclic degradation, in which harmonic generation is dominated by the asymmetric opening and closure of microcrack faces. The material problem examined here differs in kind. Under monotonic tension the dominant source of acoustic nonlinearity, up to the maximum load, is the multiplication and rearrangement of dislocations within an initially crack-free microstructure, and the governing damage variable is plastic strain rather than accumulated cycles.
Nonlinear ultrasonic evaluation of tensile plasticity is an established field and the present work should be positioned within it explicitly. Shui et al. [16] correlated the nonlinearity of longitudinal waves with plastic strain in metallic specimens loaded and unloaded in steps, and measurements on cold-worked austenitic stainless steel [17] and on martensitic steel supported by finite-element modelling of dislocation evolution [18] report the same direction of response. Pfeifer et al. [19] and Walker et al. [20] applied nonlinear Rayleigh waves to X52 and A36 steels respectively. Most directly relevant to the configuration used here, Cai et al. [21] evaluated tensile damage in aluminium alloy specimens using non-contact electromagnetic acoustic transducers and through-thickness longitudinal waves, and reported a relative nonlinearity parameter that remained unchanged under elastic loading, rose rapidly once plastic deformation began, and fell sharply at the position where necking developed while positions outside the necked region continued to harden. Vetrone et al. [22] combined acoustic emission with nonlinear ultrasonics on A572 Grade 50 structural steel in order to identify the strain at which plastic deformation initiates, and found the third-harmonic coefficient more sensitive to plastic deformation than the second.
The qualitative three-stage response reported in the present work is therefore consistent with, and not novel with respect to, this body of work. What remains open is a quantitative question. Although the majority of published studies report that the nonlinearity parameter increases with plastic strain, Kim and Matlack [23] measured a monotonic decrease during in-situ monotonic tensile loading of 316L stainless steel, attributed to the scaling of the parameter with monopole loop length and therefore to the initial dislocation substructure, with saturation coinciding with a planar-to-wavy transition of the dislocation arrangement. The origin of this divergence is currently the subject of dedicated investigation [24]. Well-characterised data on ferritic-pearlitic structural steels, the class of material for which the question is of most direct engineering consequence, are comparatively scarce. The contribution of the present study is a continuously acquired data set for S235 within this debate, obtained through a third non-contact detection modality, laser interferometry, which complements the electromagnetic and air-coupled approaches used previously and offers higher spatial selectivity on the interrogated surface. Beyond the choice of material and the continuity of acquisition, the specific new elements are: (i) an experimental bound on the reversible acoustoelastic contribution within the elastic range of stress, obtained from the same test, together with a conditional estimate of this contribution beyond yield; (ii) a quantitative comparison between the strain interval in which the second harmonic first increases and the mechanical yield, referred both to the 0.2% offset and to the onset of the yield plateau, with an assessment of its sensitivity to the threshold criterion, to the processing and to noise; (iii) a comparison of linear and nonlinear sensitivity in which both metrics are derived from the same optical waveform and therefore share the same reception path; and (iv) a dislocation-based rationale, formulated as a falsifiable prediction, for the opposite signs of the response reported for ferritic and austenitic steels.
The objective of this study is accordingly neither the demonstration of an instrument nor the claim of a previously unobserved phenomenon, but the provision of a continuous, quantitative characterisation of the acoustic nonlinearity of S235 structural steel across its complete monotonic tensile response. Because the acoustic and mechanical quantities are acquired synchronously on the same specimen and without unloading, every value of the normalised parameter β2/β2(0) can be assigned to a specific point of the stress–strain curve. Three questions are addressed: the magnitude and direction of the response of a ferritic-pearlitic structural steel, in relation to the conflicting trends reported for austenitic alloys; the strain at which the parameter departs from its pristine value, in relation to the macroscopic yield point; and the behaviour of the parameter during late uniform plastic deformation, up to the maximum load. To make these questions testable, the following quantitative criteria are used: the strain interval in which the second harmonic first increases is compared with the 0.2% offset yield strain and with the onset of the yield plateau, and is regarded as consistent with yield onset if it contains, or lies within one acquisition interval of, these mechanical reference strains; the sensitivity of each acoustic metric is expressed as its relative change between the pristine state and the end of uniform plastic deformation; reproducibility is expressed as the coefficient of variation across the three specimens; and a change is treated as significant only when it exceeds three times the elastic-regime scatter of the same metric.
2. Materials and Methods
2.1. Theoretical Background
2.1.1. Nonlinear Ultrasonic Principles
The fundamental principle of nonlinear ultrasonics relies on the interaction between a propagating finite-amplitude elastic wave and the microstructural features of a solid medium. In a perfectly linear elastic material, wave propagation is governed by the linear Hooke’s law. However, structural materials accumulating plastic damage exhibit a nonlinear stress-strain relationship. In the presence of microstructural anomalies, such as dislocation networks and micro-voids induced by plastic deformation, the nonlinear elastic response of the material must be accounted for by expanding the stress-strain relationship using higher-order elastic constants, whose role in harmonic generation is set out in [25,26] and whose experimental determination is addressed in [27,28].
For a one-dimensional longitudinal (bulk) wave propagating along the x-direction, the nonlinear wave equation can be expressed as:
where u is the particle displacement, t is time, c is the longitudinal wave velocity, and β is the second-order acoustic nonlinearity parameter of the material.
Assuming a monochromatic sinusoidal excitation of fundamental frequency ω introduced at the boundary (x = 0), the perturbation solution of the nonlinear wave equation yields a primary wave at the fundamental frequency and a generated second harmonic. The corresponding amplitudes of the fundamental (A1) and the second harmonic (A2) after a propagation distance x are related by:
where k is the wave number. By rearranging this relationship, the absolute nonlinearity parameter β can be determined. However, in practical experimental configurations where the wave number and propagation distance remain constant, the relative acoustic nonlinearity parameter (β′) is conventionally adopted as a robust indicator of the microstructural state:
During tensile loading, the accumulation of plastic strain increases the dislocation density, which inherently enhances the material’s anharmonicity [16]. Consequently, the relative nonlinearity parameter β′ rises with plastic damage accumulation in many metals, although, as discussed in Section 2.3, the direction of the response depends on the initial dislocation substructure. However, to quantitatively track the progressive degradation of the material throughout the tensile test, the measured relative nonlinearity parameter (β′) at each loading stage was normalized against its initial baseline value (β′0) recorded at the pristine, unloaded state. Consequently, the acoustic evolution is presented in terms of the normalized acoustic nonlinearity parameter (β′/β′0). This normalization effectively cancels out invariant system-related constants, such as transducer efficiency and optical sensitivity, so that the remaining variations arise predominantly from changes in the material state, together with any residual changes in contact conditions or signal quality (Section 2.4.2 and Section 3.3).
For notational consistency, the relative second-order parameter defined by Equation (3) is denoted β2 throughout the remainder of this paper, and its value normalised to the pristine, unloaded state is denoted β2/β2(0). The symbol β is reserved for the absolute nonlinearity parameter appearing in Equations (1) and (2).
Equation (2) describes a single travelling wave over a distance x. In the present through-thickness configuration the tone burst is longer than the specimen thickness (Section 2.4.2), so that the full received waveform contains the direct arrival superposed on successive reverberations. The analysis was therefore restricted to a 1 µs window beginning at the first arrival, shorter than the through-thickness round-trip time, so that the analysed segment corresponds to a single pass over the propagation distance x = 3 mm, as assumed in Equation (2). The window contains the leading five cycles of the Hann-weighted burst, that is, its rising half, over which the envelope increases from zero towards its maximum. The analysed segment is therefore not a steady-state portion of the signal, and the absolute values of A1 and A2 depend on the choice of window. Because the same window, referred to the first arrival, is applied to every acquisition, this dependence is common to the pristine and the deformed states and cancels in the normalised ratio β2/β2(0), to the extent that the arrival time does not change appreciably during the test. The window limits the spectral resolution to approximately 1 MHz; this is sufficient to separate the fundamental (5 MHz) and second-harmonic (10 MHz) components. A representative raw waveform cannot be shown: the LabVIEW 2014 (National Instruments, Austin, TX, USA) acquisition software processed each averaged waveform in real time and stored the extracted spectral amplitudes, so that the raw waveforms of the tensile tests were not retained. The level of the second harmonic relative to the noise was therefore evaluated from the calibration of Section 2.5 at the excitation voltage used in the tests (250 V), taking as the noise level the spectral amplitude at 15 MHz, where no harmonic signal is detectable. Three observations characterise this level. First, it is not set by quantisation: for the 12-bit digitiser, the 60-point Hann window and the 50-fold averaging used here, the quantisation floor lies more than 100 dB below the fundamental, whereas the 15 MHz amplitude lies 76–82 dB below it; the floor is therefore optical and electronic noise of the interferometric detection. Second, it is predominantly independent of the excitation: over the eight calibration levels, in which A1 varies by a factor of three, the 15 MHz amplitude varies by a factor of 1.4 only, with a weakly significant linear component (3.6 × 10⁻⁵ A1, i.e., −89 dB relative to the fundamental) that may represent residual spectral leakage of the fundamental through the short window. Third, at 250 V the measured second-harmonic amplitude exceeds the 15 MHz level only by a factor of approximately 1.3 (≈2 dB): in the pristine state the second harmonic is of the same order as the noise, and its noise-corrected value (Section 2.5) is correspondingly uncertain, by roughly ±20–30% for a single acquisition. A component proportional to A1 in the 10 MHz bin, such as leakage, cannot be resolved from the eight calibration levels (its inclusion in the fit is not significant, p = 0.16), but, like the noise, it is present in the pristine state and does not increase during loading, since A1 decreases; both can therefore only inflate β2(0) and compress the normalised ratio towards unity. After yield the measured second harmonic exceeds the 15 MHz level by a factor of approximately 2.7 (≈9 dB); its increase relative to the pristine state, by a factor of approximately 2.1 before and 3 after noise correction, amounts to about eight standard deviations of the noise level and occurs while A1 decreases by 17%, which excludes a common change of gain or coupling as its origin. The practical consequence is that the magnitude of β2/β2(0) is approximate and, if anything, underestimated, whereas the strain at which it departs from unity and the direction of its change rest on the post-yield increase of A2 well above the noise and are robust. The repeatability of the normalised parameter under conditions in which A2 is unchanged is given directly by the specimen-to-specimen scatter of the first acquisitions in Section 3.3 (standard deviation 0.15–0.20 about a mean of 1.0–1.1 for n = 3). The window and the propagation distance remain constant during the test, apart from the plastic thinning of the ligament, which is of the order of a few per cent of the thickness before localisation and would, if anything, lead to a slight underestimate of the parameter. The normalised ratio β2/β2(0) is therefore used as the relative indicator of changes in material nonlinearity, and absolute values of β are not reported.
2.1.2. Linear Acoustic Attenuation
For a comprehensive comparative analysis, the linear acoustic attenuation (α) is simultaneously evaluated. Attenuation quantifies the loss of acoustic energy due to scattering and absorption as the wave travels through the material. It is typically expressed in decibels (dB) as:
where A1 is the fundamental amplitude at the current damage state, and A1,0 is the baseline fundamental amplitude measured at the pristine (unloaded) state. While attenuation is highly sensitive to macroscopic flaws, it is generally considered less responsive to the sub-wavelength micro-plasticity changes that occur during early-stage yielding [29,30]. By construction α = 0 in the pristine state, so that α cannot be normalised by its own pristine value. The normalised attenuation reported in Section 3 is therefore defined as the ratio of the pristine to the current fundamental amplitude, A1,0/A1 = 10^(α/20), which equals unity in the pristine state and exceeds unity as the transmitted amplitude decreases. On this definition a value of 1.2 corresponds to an attenuation increase of approximately 1.6 dB over the propagation path. To avoid an undefined ratio, this quantity is denoted A1,0/A1 throughout the paper and in the figures.
2.2. Separation of Acoustoelastic and Damage-Induced Contributions
This section and Section 2.3 do not introduce additional measurement steps; they set out the two interpretive premises on which the analysis of Section 3 relies, namely the conditions under which a measurement acquired under load can be attributed to permanent microstructural change (Section 2.2), and the sign of the response to be expected for S235 (Section 2.3). Because the measurements reported here are acquired while the specimen is under load, the extracted parameter contains in principle two contributions. The first is permanent and reflects the microstructural state, that is the density and arrangement of dislocations and the population of micro-voids. The second is reversible and arises from acoustoelasticity, the dependence of the effective second- and third-order elastic constants on the applied stress; this contribution vanishes upon unloading and carries no information on damage. Failure to distinguish the two is a recognised source of ambiguity in measurements performed under load [8,23].
Without unloading, the two contributions cannot be separated formally, but the reversible part can be bounded within the present experiment. Throughout the elastic regime the microstructure is unaltered, so any variation of the measured parameter over that interval is attributable solely to acoustoelasticity. The excursion of the parameter in the elastic regime therefore constitutes a direct experimental upper bound on the acoustoelastic contribution over the corresponding range of applied stress. In the present acquisition sequence the elastic regime is represented by a single acquisition below yield (Section 3.3), so that the bound rests on that acquisition and on its specimen-to-specimen scatter. Provided this bound is small relative to the change observed beyond yield, the post-yield evolution may be attributed predominantly to permanent microstructural change, subject to the conditions stated below. This bound applies strictly only to the elastic range of stress and to the undeformed microstructure. Beyond yield, an estimate, but not a strict bound, can be obtained under two assumptions: that the acoustoelastic term depends on the applied stress rather than on strain and scales approximately linearly with it, and that the nominal net-section stress is representative of the stress in the interrogated volume. Beyond yield the nominal net-section stress increases only from approximately 280 to 360 MPa (Section 3.1), i.e., by less than one third of the stress range already covered in the elastic regime, so that under these assumptions the additional acoustoelastic contribution would be of the order of 1%. This figure is conditional: the local stress in the interrogated volume, which under the constraint of the notch may differ from the nominal value, was not measured, and the stress dependence of the effective higher-order elastic constants may itself change as the dislocation structure evolves. Beyond yield the argument therefore neither bounds strictly nor formally decouples the reversible and irreversible contributions. Changes of the effective higher-order elastic constants caused by plastic flow, for example through texture development, are irreversible and are counted here as part of the material-state change. A formal separation requires acquisition at a controlled zero-load state (Section 4). This condition is evaluated against the measured data in Section 3.3. This reasoning is consistent with the observation of Kim and Matlack [23], who reported that the nonlinearity parameter of 316L stainless steel is relatively insensitive to applied stress within the elastic regime. The elastic-regime invariance documented in Section 3.3 therefore constitutes an independent confirmation of that behaviour in a ferritic structural steel, and is used here as a calibration of the acoustoelastic bound rather than as a new finding. The same behaviour, namely an essentially constant relative nonlinearity parameter throughout elastic loading followed by a rapid rise at the onset of plasticity, was reported by Cai et al. [21] using non-contact electromagnetic transduction.
2.3. Expected Dependence of the Nonlinearity Parameter on Plastic Strain
The direction in which the nonlinearity parameter responds to plastic strain is not universal, and the classical dislocation description offers a possible explanation. Following Hikata, Chick and Elbaum [31], the contribution of pinned dislocation monopoles to second harmonic generation is proportional to the dislocation density Λ and to the fourth power of the mean loop length L between pinning points, and inversely proportional to the square of the Burgers vector. The contribution of dislocation dipoles, which becomes significant once a substructure has developed, is proportional to the dislocation density and to the cube of the separation between the dipole poles, and inversely proportional to the Burgers vector [1]. To leading order the monopole term may therefore be written as a proportionality of the form β ∝ Λ L4/b2.
Plastic deformation acts on the two factors of this product in opposite senses. Multiplication raises Λ, which increases the parameter, while the accumulation of forest dislocations and the resulting reduction of the mean free segment between pinning points lowers L, which decreases it. Because L enters at the fourth power while Λ enters linearly, the loop-length term dominates whenever L is free to fall substantially, and the parameter decreases with plastic strain despite the increase in dislocation density. This is the situation in a solution-annealed austenitic alloy, which begins from a low dislocation density with long unpinned segments, and it accounts for the decreasing trend reported for 316L and for its attribution to monopole loop length [23].
The ferritic-pearlitic microstructure of S235 occupies the opposite limit. The as-rolled condition already contains a high density of pinning obstacles, in the form of carbides and pearlite lamellar interfaces, so that L is short in the pristine state and is bounded below by the obstacle spacing rather than by the evolving forest density. The scope for further reduction of L is correspondingly limited, whereas Λ may rise by orders of magnitude, and the density term is expected to dominate. On this reasoning the parameter should increase with plastic strain in S235, which is what is observed in Section 3.3, and the two apparently contradictory bodies of experimental evidence can be rationalised, qualitatively, as the two limiting cases of a single expression. This rationale is not tested directly here, since neither the dislocation density nor the loop length was measured (Section 4).
This reasoning yields a falsifiable prediction that is not tested here but defines the natural continuation of the work: since the magnitude of the increase depends on how tightly L is constrained in the pristine state, a normalised or annealed S235 with a coarser obstacle spacing should exhibit a weaker relative increase than the as-rolled condition, and in the limit of sufficiently long initial loop lengths the sign of the response should reverse.
2.4. Experimental Setup and Methodology
2.4.1. Material and Tensile Testing
The material investigated in this study is S235 structural steel, one of the most widely used grades in civil and mechanical engineering owing to its ductility, weldability and formability. Flat specimens were machined to an overall length of 200 mm, a width of 20 mm and a thickness of 3 mm. Symmetric edge notches were introduced at the centre of the gauge section in order to localise the stress concentration and thereby confine plastic deformation to a reproducible region coincident with the ultrasonic interrogation volume, ensuring that the acoustic path samples the material that actually undergoes damage. Two symmetric edge U-notches of depth 3.2 mm and root radius 1.7 mm were machined, giving a net section of 40.8 mm2 (net width d = 13.6 mm). The elastic stress concentration factor, Kt = 2.6, was obtained from Peterson’s chart for opposite U-shaped notches in a finite-width flat bar under axial tension [32], with notch depth-to-root-radius ratio t/r = 1.88 and r/d = 0.125, and is referred to the nominal net-section stress. The specimen geometry is shown in Figure 1. The material is S235 structural steel according to EN 10025-2 [33]; for this grade the ladle analysis is limited to (wt.%, max) C 0.17, Mn 1.40, P 0.035, S 0.035, N 0.012 and Cu 0.55, with a maximum carbon equivalent of 0.35 (limits of the least restrictive sub-grade, S235JR). No metallographic examination was performed in the present study. The interpretation developed in Section 2.3 relies on the ferritic–pearlitic microstructure characteristic of the grade rather than on measured microstructural parameters; quantities such as grain size and phase fraction would not, in any case, resolve the variables that enter that interpretation, namely the dislocation density and the mean free loop length between pinning points, which require electron microscopy of the deformed notch region (Section 4). A total of 3 nominally identical specimens were tested under the same conditions in order to establish the repeatability of the acoustic trends reported in Section 3. Notched rather than smooth specimens were used deliberately. The through-transmission arrangement interrogates a single, fixed volume beneath the transducer, whereas in a smooth specimen the position of the neck is not known in advance and may form outside that volume; the notch fixes the location of strain localisation at the acoustic path. The price of this choice is a multiaxial stress state at the notch, the consequences of which for the transferability of the results are discussed in Section 4.
Figure 1.
S235 steel notched specimen: (a) photograph; (b) schematic drawing with dimensions (mm) and location of the through-thickness acoustic path at the centre of the notched ligament.
Tensile testing was performed on an Instron 5967 electromechanical frame (Instron, Norwood, MA, USA) under displacement control at a constant crosshead rate of 1 mm/min, corresponding to quasi-static conditions for which strain-rate effects on the elastic constants are negligible (nominal strain rate ≈ 2.1 × 10⁻⁴ s−1 for the 80 mm gauge length). Load and crosshead displacement were recorded continuously and synchronously with the acoustic acquisition, so that each acoustic measurement is associated with a defined point of the mechanical response of the same specimen. Strain is reported throughout as nominal axial strain referred to a gauge length of 80 mm and computed from the crosshead displacement. Because it is computed from the crosshead displacement, the nominal strain includes the compliance of the load train, which explains the low apparent elastic slope of the stress–strain curves (Section 3.1); absolute strain values should be read accordingly, whereas the comparison between acoustic and mechanical quantities is unaffected because both refer to the same strain measure. Owing to the notched geometry, the local strain at the notch root exceeds this nominal value by a factor governed by Kt in the elastic regime and by the developing plastic constraint thereafter; the acoustic parameters are therefore presented as functions of the global loading state rather than of local strain, the former being the quantity accessible to a non-destructive inspection in service. With Kt = 2.6, local yielding at the notch roots is expected to begin at a nominal net-section stress of the order of σy/Kt, well below the macroscopic yield point. These first plastic zones are, however, confined to the immediate vicinity of the notch roots, approximately 6.8 mm from the centre of the ligament, where the transducer and the LDV spot are located (Figure 1b); the interrogated volume is reached by plastic deformation only when plasticity spreads across the net section.
2.4.2. Hybrid Acoustic Measurement System
A hybrid transmission configuration was adopted (Figure 2), combining contact piezoelectric excitation with non-contact optical detection. The excitation, acquisition and synchronisation chain corresponds to the nonlinear acoustic platform whose stability, linearity and repeatability limits have been characterised previously [14,15]; only those aspects relevant to the present material problem are described here. Triggering and digitisation were handled by an NI PXIe-1071 chassis (National Instruments, Austin, TX, USA) operating under a common control environment, the implementation of which is detailed in [14].
Figure 2.
Experimental setup: (a) photograph of the notched S235 specimen mounted in the Instron 5967 frame and of the LDV optical head (the 5 MHz transducer is bonded to the back face of the specimen and is not visible); (b) block diagram of the measurement system.
A narrowband contact piezoelectric transducer with a central frequency of 5 MHz was firmly bonded to the back surface of the specimen’s notched cross-section, using honey as the acoustic couplant. This transducer was driven by a high-power pulser RITEC RPR-4000 (RITEC Inc., Warwick, RI, USA), generating a 10-cycle tone-burst modulated by a Hanning window to suppress spectral leakage and minimize source-induced nonlinearities. The excitation voltage was kept constant at 250 V throughout each test. At 5 MHz the 10-cycle burst has a duration of 2 µs, corresponding to a spatial length of approximately 12 mm in steel (longitudinal velocity ≈ 5900 m/s), i.e., about four times the 3 mm specimen thickness, so that the received waveform contains the direct arrival followed by successive through-thickness reverberations, separated by the round-trip time 2d/c ≈ 1.02 µs. A1 and A2 were therefore extracted from a fixed analysis window of 1 µs, starting at the first arrival (≈0.51 µs after excitation) and identical for all acquisitions. Because this window is shorter than the round-trip time, it contains only the direct arrival, and the first reverberation is excluded; the implications for Equation (2) are discussed in Section 2.1.1.
The longitudinal (bulk) waves propagating through the thickness of the steel specimen were captured on the front surface using a non-contact Laser Doppler Vibrometer (Polytec PSV-400; Polytec GmbH, Waldbronn, Germany) with a high-frequency displacement decoder (bandwidth up to 24 MHz), as in [15]; the velocity decoders of the instrument are limited to frequencies far below the 5 MHz fundamental, so that the displacement output was used throughout. To enhance the optical reflectivity and achieve a maximum signal-to-noise ratio (SNR), a piece of reflective tape was applied directly to the measurement point on the specimen’s surface. Furthermore, the LDV optical head was carefully positioned at the optimal stand-off distance to ensure maximum intensity of the backscattered laser beam. This non-contact reception eliminates the variable contact pressure and couplant inconsistencies at the receiving interface, which in dual-probe contact setups are known to contaminate harmonic amplitude measurements.
The transmitting interface remains a contact interface, and its stability must be considered separately because the transducer is bonded over the notched cross-section where plastic strain is concentrated. Two features of the measurement are expected to limit, but do not eliminate, the effect of changes at this interface on β2. First, a change in the transmitted amplitude changes A1 and A2 in the proportion A2 ∝ A12 (Section 2.5), so that, provided the change is linear and independent of frequency, it cancels to first order in the ratio A2/A12; a deterioration of the coupling would reduce A2 rather than increase it. Second, honey forms a continuous viscous layer that is not expected to generate the clapping-type contact nonlinearity of a dry or partially debonded interface. Both arguments concern linear, frequency-independent changes of the coupling. They do not exclude a frequency-dependent change in the transmission of the interface, which would alter the relative weight of any harmonic content already present in the excitation, nor harmonic generation within the interface itself, for example if the couplant layer or its bond responded nonlinearly as the substrate deformed. Because the transmitting interface was not monitored independently during loading, a residual contribution of the contact cannot be ruled out on the present data. A contribution of this kind would have to increase by a large factor during plastic deformation to account for the change reported in Section 3.3; this is, however, an argument of plausibility rather than a verification, which would require a control measurement (Section 4). The first-order cancellation does not apply to the linear attenuation, which is derived from A1 alone. Part of the increase in A1,0/A1 reported in Section 3.3 may therefore originate at the transmitting interface rather than in the material, and the attenuation values should be regarded as an upper bound on the material contribution.
The choice of a 5 MHz narrowband transmitter fixes the accessible harmonic content. The second harmonic at 10 MHz lies within the useful response of both the transducer and the interferometric decoder for the 3 mm propagation path employed. The third harmonic at 15 MHz falls outside the −6 dB bandwidth of the transmitter and, for the stand-off distance and surface preparation used here, its amplitude in the pristine state was found to remain at the noise floor of the acquisition. This is expected on physical grounds. In the perturbation solution the third harmonic is of second order in the small quantity A2/A1, so that for lattice and dislocation nonlinearity at the available excitation amplitudes it lies several orders of magnitude below A2; it becomes measurable mainly where contact acoustic nonlinearity, which generates strong odd harmonics, is present [15]. The limitation lies in the transmitter rather than in the acquisition, since 15 MHz is well below the 30 MHz Nyquist frequency of the digitiser and within the bandwidth of the LDV decoder. The analysis presented in this paper is therefore restricted to the second-order parameter. The third-order parameter, which has been shown on the same platform to be the more discriminating indicator where contact acoustic nonlinearity dominates [15], would require a lower excitation frequency and is not accessible in the present through-thickness geometry. This is a genuine limitation of the present configuration rather than a design preference. Vetrone et al. [22] reported that in structural steel under quasi-static loading the third-harmonic coefficient is more sensitive to plastic deformation than the second, and the same ordering was obtained on the present platform under fatigue [15]. A lower-frequency implementation permitting simultaneous extraction of both orders is identified in Section 4 as the principal methodological development required.
The entire data acquisition and hardware synchronization sequence was orchestrated by a central PC interfacing with the NI PXIe-1071 chassis. Through this centralized architecture, the central PC commanded the PXI system to simultaneously route a trigger signal to the RITEC unit—initiating the ultrasonic excitation—and to arm the LDV to commence the measurement. The analogue output of the LDV displacement decoder was then transmitted back through the PXI digitizer to the central PC. The acquired time-domain signals were digitized and immediately processed via Fast Fourier Transform (FFT) to extract the spectral amplitudes of the fundamental (A1) and second harmonic (A2) wave components. The linear acoustic attenuation was calculated directly from the LDV-acquired fundamental amplitude (A1) relative to its pristine baseline, ensuring that both linear and nonlinear parameters were derived from the exact same optical measurement without introducing multi-sensor variability.
The LDV output was digitised by an NI PXIe-5105 module at 60 MS/s with 12-bit resolution (60 MHz analogue bandwidth), so that the 10 MHz second harmonic and the 15 MHz third harmonic lie well below the 30 MHz Nyquist frequency. The 1 µs analysis window therefore contains 60 samples and provides a native frequency resolution of 1 MHz, sufficient to separate the 5 MHz and 10 MHz components; a Hanning window was applied to this segment before the FFT. Before the spectral analysis, the signal was band-pass filtered with a Butterworth filter implemented in the LabVIEW acquisition software, centred on the frequency component being extracted, with bounds of approximately ±10–20% of the centre frequency [14]. Each acquisition point is the average of 50 waveforms. Acoustic acquisitions were taken at nominal strain increments of approximately 0.004–0.006, as reflected in the spacing of the data points in Section 3.3.
2.5. System Linearity Assessment
Before loading, the harmonic response of the measurement chain was characterised on the unloaded specimen. This step is required in any nonlinear acoustic measurement, since a nominally sinusoidal excitation distorted by the source electronics or by the reception chain generates harmonic content that is indistinguishable, in the frequency domain, from that produced by the material itself.
The excitation voltage was increased in steps and the fundamental and second-harmonic amplitudes were extracted at each level. Under the perturbation solution of Equation (2), a measurement chain that is itself linear yields A2 proportional to the square of A1; linear regression of A2 on A12 over the eight excitation levels gave a slope of 89.7 V−1 (95% confidence interval 54.1–125.3 V−1), an intercept of 2.67 × 10⁻¹¹ V and R2 = 0.86 (p < 0.001 for a non-zero slope) (Figure 3). This value is lower than that typically obtained in purely electrical calibrations, for a reason specific to the present configuration: in the undamaged state the second-harmonic surface displacement is of the order of the interferometer noise floor, so the calibration is necessarily performed under the least favourable signal-to-noise conditions of the entire experiment. The residuals show no systematic curvature (Figure S1; Durbin–Watson statistic 2.27), which argues against a saturating response, but with eight points and R2 = 0.86 the calibration alone cannot exclude an instrumental contribution of the order of the calibration scatter. The excitation and acquisition chain itself was validated in [14] on a 14.8 mm steel reference block with the same 5 MHz transmitter: over 20 h of continuous monitoring the wave velocity remained effectively constant, and A2 was proportional to A12 with R2 = 0.986 for the averaged series and R2 = 0.974 for the individual records (ten repetitions per excitation level). That validation used receiving transducers on an unloaded specimen; it documents the linearity and stability of the excitation and acquisition electronics, but not those of the bonded transmitting interface under load (Section 2.4.2), and it indicates that the lower R2 obtained here reflects the low signal-to-noise ratio of the second harmonic over the 3 mm path rather than a nonlinearity of the chain. The non-zero intercept reflects the noise floor of the measurement: it agrees with the amplitude recorded in the same acquisitions at 15 MHz, where no harmonic signal is detectable. At the lowest excitation levels A2 is therefore of the order of the noise. After subtraction of this noise level in quadrature, the logarithmic slope of the corrected A2 against A1 is 1.8 ± 0.4 (standard error), consistent with the quadratic dependence expected for a linear measurement chain. The noise floor was therefore subtracted from A2 before β2 was computed. Two further observations constrain the instrumental contribution more tightly than the calibration does. First, the excitation level was held constant during each test, so that harmonic content generated by the source or the reception electronics enters A2/A12 as an approximately constant additive term; such a term can only compress β2/β2(0) towards unity and cannot produce a strain-dependent increase. Second, the mean value of β2/β2(0) remained within 3.8% of unity at the acquisition below the 0.2% offset yield strain and within 10% at the following acquisition, before the yield plateau, under the same excitation and increased by a factor of approximately 4.5 only after yield (Section 3.3).
Figure 3.
Linearity assessment of the measuring system on the unloaded specimen: second-harmonic amplitude A2 versus the square of the fundamental amplitude A12 at eight excitation levels, with linear fit and 95% confidence band. The grey band shows the amplitude at 15 MHz, where no harmonic is detectable, as an estimate of the noise level.
3. Results
3.1. Mechanical Response
The nominal stress–strain curves of the three specimens, recorded synchronously with the acoustic measurements, are shown in Figure 4. The curves are closely reproducible. The mechanical yield points, determined as described in Section 3.5, are 286.2 ± 3.0 MPa at a nominal strain of 0.0128 ± 0.0004 (mean ± standard deviation, n = 3; Table 1), and final separation occurred at a nominal strain of approximately 0.045. The maximum load was reached at a nominal strain of approximately 0.043–0.044, after which the stress dropped abruptly to separation (Figure 4). Between the 0.2% offset yield and the maximum load the curves show a plateau at 319–327 MPa, extending from a nominal strain of approximately 0.017 to approximately 0.033–0.035, with small serrations (Figure 4). In a low-carbon steel such a plateau is characteristic of yield-point elongation by Lüders band propagation; in the present notched geometry it may equally reflect the attainment of the limit load of the ligament once yielding has spread across the net section, and the two cannot be distinguished without local strain measurement. For the present purpose the distinction is immaterial: in either case the onset of the plateau marks the spread of plasticity across the ligament. Work hardening resumes beyond approximately 0.033–0.035. An upper yield point is not resolved, because the nominal strain is derived from the crosshead displacement. For a steel with a yield plateau the mechanical yield is conventionally characterised by the plateau (lower yield strength) rather than by an offset; both the 0.2% offset strain and the onset of the plateau (0.0171, 0.0176 and 0.0170 for Specimens 1–3, defined as the strain at which the stress first reaches 98% of the plateau level) are therefore used below as mechanical reference points. In a displacement-controlled test the maximum load marks the onset of unstable deformation. The formation of a neck was not measured independently, since no local strain measurement was available; the maximum load is therefore used in the following as the only mechanical indicator of the onset of instability.
Figure 4.
Nominal stress–strain curves of the three S235 steel specimens.
Table 1.
Comparison of the mechanical yield of the individual specimens (0.2% offset yield strain and stress; onset of the yield plateau) with the strain interval in which the second harmonic first increases (nominal values; averages are mean ± standard deviation of the three specimens).
3.2. Normalization and Extraction of Acoustic Parameters
To quantitatively track the progressive degradation of the material throughout the tensile test, the measured relative nonlinearity parameter (β′) and the linear attenuation (α) at each loading stage were normalized against their initial baseline values recorded at the pristine, unloaded state. Specifically, the second-order acoustic nonlinearity is evaluated through the normalized ratio β2/β2(0). This ratio is derived from the fundamental (A1) and second harmonic (A2) amplitudes extracted via Fast Fourier Transform (FFT) from the LDV displacement signals.
The linear acoustic attenuation was quantified from the LDV-acquired fundamental amplitude relative to its pristine-state baseline according to Equation (4), and is reported in normalised form (A1,0/A1). Deriving both the linear and the nonlinear metric from the same optical waveform ensures that the two are affected identically by any variation in optical reflectivity or stand-off, so that their relative sensitivities may be compared without introducing multi-sensor variability.
Consequently, the acoustic evolution is presented in terms of the normalized parameters (β2/β2(0) and A1,0/A1). This normalization removes invariant system-related constants, such as transducer efficiency, the optical reflectivity enhancement provided by the reflective tape, and LDV sensitivity. It does not remove changes in the contact conditions at the transmitting interface or in the optical signal quality during loading, which are discussed in Section 2.4.2 and Section 3.3; the normalised parameters therefore reflect predominantly, but not exclusively, the evolution of the material state.
3.3. Comparative Acoustic Response During Tensile Loading
The evolution of the normalised attenuation A1,0/A1 and of the normalised nonlinearity parameter β2/β2(0) with nominal axial strain is presented in Figure 5 and Figure 6 respectively. Each data point represents the mean of 3 nominally identical specimens and the error bars denote one standard deviation. The scatter is largest at large strains (Stage III), where deformation begins to localise and the position of the localised zone relative to the acoustic path may vary between specimens. Both curves display a multi-stage evolution that maps onto the corresponding regions of the stress–strain response, and the comparison between them indicates a hierarchy of sensitivity for the present configuration.
Figure 5.
Normalized acoustic attenuation (A1,0/A1) as a function of nominal strain for the S235 steel specimens (mean ± one standard deviation, n = 3).
Figure 6.
Normalized nonlinear parameter (β2/β2(0)) versus nominal strain for the S235 steel specimens (mean ± one standard deviation, n = 3). The shaded band marks the yield plateau of the stress–strain curves (Figure 4).
Stage I: Elastic regime and pre-plateau yielding (nominal strain 0 to ≈0.017)
During the initial loading phase, both the normalized nonlinearity parameter and the linear attenuation remain remarkably constant, hovering at a value of approximately 1.0. In this regime the macroscopic response of the specimen is elastic and reversible. Local yielding is expected to begin earlier at the notch roots (Section 2.4.1), but it remains confined to small zones outside the interrogated volume at the centre of the ligament, where the material still deforms elastically. Consequently, the anharmonicity of the interrogated volume remains essentially unchanged, and neither additional harmonic distortion nor significant acoustic scattering is introduced into the propagating ultrasonic waves. Within this interval only one acquisition, at ε ≈ 0.011, lies below the 0.2% offset yield strain of 0.0128; the following acquisition, at ε ≈ 0.015, lies above it but before the onset of the yield plateau (≈0.017). At ε ≈ 0.015 the mean value β2/β2(0) ≈ 1.10 ± 0.12 (standard error of the mean, n = 3) is not significantly different from unity, and the noise-corrected second-harmonic amplitude is unchanged within the scatter (A2/A2,0 ≈ 1.01; Figure S2): the small rise of the ratio at this acquisition arises from the 4% decrease of A1 in the denominator rather than from the second harmonic. Both acquisitions are therefore assigned to Stage I, defined acoustically by the absence of a change of the second harmonic. That the second harmonic remains unchanged at ε ≈ 0.015, beyond the offset yield strain, is consistent with the notched geometry (Section 2.4.1): the first plastic zones form at the notch roots, and the interrogated volume at the centre of the ligament is reached only when plasticity spreads across the net section, which in the mechanical record corresponds to the onset of the plateau.
This invariance is itself a quantitative result. As set out in Section 2.2, the microstructure is unaltered throughout the elastic regime, so the excursion of β2/β2(0) over this interval bounds the reversible acoustoelastic contribution over the corresponding range of applied stress. The excursion of β2/β2(0) from unity at the sub-yield acquisition is 3.8%. This figure refers to the mean of the three specimens; the specimen-to-specimen scatter at the same acquisition is larger, with a standard deviation of approximately 0.15 (Figure 6), so that for an individual specimen the bound is of the order of 15%. Even on this more conservative basis, the bound indicates that acoustoelasticity would account for at most a small fraction of the change observed after yield, provided the conditions stated in Section 2.2 hold, and the post-yield evolution is therefore interpreted as predominantly permanent microstructural change. The same observation suggests the departure of β2/β2(0) from unity as a candidate marker of yield onset: the parameter remains flat until plasticity reaches the interrogated volume, and rises as soon as it does.
Stage II: Yield plateau and microstructural degradation (nominal strain ≈ 0.017 to ≈0.031)
Once plasticity spreads across the ligament, the two parameters diverge sharply in sensitivity. The second harmonic first increases between the acquisitions at ε ≈ 0.015 and ε ≈ 0.021 (A2/A2,0 from 1.01 to 1.82; Figure S2), i.e., across the onset of the yield plateau, and the ratio β2/β2(0) rises monotonically up to ε ≈ 0.031, where the plateau ends, and then levels off at approximately 4.4–4.5 (mean of three specimens; Stage III), an increase of about 350% relative to the pristine state. The rise is attributed to plastic deformation at the notch, where dislocation multiplication is expected to raise the dislocation density by orders of magnitude and the associated internal strain fields introduce a strong anharmonic contribution to the local stress–strain response [1,7,16]. In this regime harmonic generation within the material is expected to be a bulk effect distributed over the interrogated volume rather than a contact phenomenon: no internal free surfaces capable of the asymmetric opening and closure associated with contact acoustic nonlinearity yet exist in appreciable number. Linear changes at the transmitting interface are unlikely to account for the increase: a deterioration of the coupling reduces A2 in proportion to A12 and leaves A2/A12 unchanged to first order. Neither a frequency-dependent change in the transmission of the interface nor harmonic generation within it is covered by this argument and, since the interface was not monitored during loading, a residual contribution of the contact to the measured increase cannot be excluded (Section 2.4.2). With A1,0/A1 ≈ 1.2, i.e., A1 reduced to approximately 0.83 of its pristine value, a ratio β2/β2(0) ≈ 4.5 implies that A2 itself increased by a factor of approximately 3. Relative to the noise level, the measured second harmonic rises from approximately 1.3 to 2.7 times that level (Section 2.1.1), an increase of about eight standard deviations of the noise, while A1 decreases; the rise is therefore a genuine increase of the 10 MHz component and not an artefact of a common gain change, of the noise or of residual leakage of the fundamental, all of which are present in the pristine state and do not increase during loading.
In stark contrast, over the exact same strain interval, the normalized linear attenuation (A1,0/A1) exhibits only a marginal, gradual increase, reaching a maximum of approximately 1.2 (an increase of about 20%, i.e., approximately 1.6 dB, part of which may originate at the transmitting interface; Section 2.4.2). For the frequency, geometry, material and propagation path examined here, the nonlinearity parameter is therefore more than an order of magnitude more sensitive to early plasticity than the linear attenuation, consistent with the expectation that linear properties are governed mainly by the elastic moduli and by scatterers comparable to the wavelength, whereas sub-wavelength dislocation structures contribute primarily to harmonic generation [30]. The higher sensitivity of β2 in this region suggests a higher capability to detect early-stage plasticity before macroscopic cracking affects the overall wave transmission.
Stage III: Saturation of the Nonlinearity Parameter during Work Hardening (nominal strain >≈ 0.031)
Between ε ≈ 0.031 and ε ≈ 0.040 the three mean values of β2/β2(0) (approximately 4.4, 4.5 and 4.5) lie within one standard deviation of one another (Figure 6). The parameter is therefore described here as saturating, rather than as passing through a well-defined maximum, while A1,0/A1 levels off at approximately 1.2 (Figure 5). Over the same interval the stress continues to rise slowly, and the maximum load is reached only at ε ≈ 0.043–0.044 (Figure 4); the onset of saturation coincides with the end of the yield plateau and the resumption of work hardening (ε ≈ 0.033–0.035, Figure 4), occurs during uniform plastic deformation, well ahead of the maximum load, and is not associated here with the onset of necking. A lower value, β2/β2(0) ≈ 3.8, was recorded only at the last acquisition (ε ≈ 0.044; red marker in Section 3.5), close to the maximum load and at a point at which the signal quality was degraded. The preceding acquisition (ε ≈ 0.040) showed no decline, and final separation occurred at ε ≈ 0.045. The first detectable decline was therefore recorded approximately 0.001 in nominal strain before separation and, given the acquisition interval, began at most approximately 0.005 before it. Because this reduction rests on a single acquisition and its difference from the preceding values is comparable to the specimen-to-specimen scatter, it is reported as an observation rather than as an established feature of the response, and it is not interpreted as microstructural recovery.
The lower value at the last acquisition may arise from two non-exclusive mechanisms, which the present data cannot separate. First, from a microstructural perspective, strain localisation close to the maximum load may promote the coalescence of micro-voids into internal discontinuities which, if comparable in size to the acoustic wavelength, would scatter the through-thickness bulk waves. Second, from an instrumental perspective, plastic flow in the ligament may roughen the surface (orange-peel effect) and reduce its local thickness, degrading the optical reflectivity required by the Laser Doppler Vibrometer (LDV) and lowering the signal-to-noise ratio (SNR), so that the low-amplitude second harmonic is resolved less reliably from the background noise. Because the second mechanism alone would lower the apparent β2 through the loss of signal-to-noise ratio, the lower value of β2/β2(0) at the last acquisition cannot at present be attributed unambiguously to a change in material state. Figure S2 (Supplementary Materials) shows the normalised amplitudes A1/A1,0 and A2/A2,0, derived from the mean values of Figure 5 and Figure 6, and the second-harmonic amplitude relative to the noise level, as functions of nominal strain. Since A1,0/A1 remains essentially unchanged at the last acquisition (Figure 5), the lower value of β2/β2(0) arises mainly from a reduction of A2, by approximately 15%; at that point the measured second harmonic still exceeds the noise level by a factor of approximately 2.3.
Within the resolution of the present acquisition sequence, the data therefore establish the saturation of β2/β2(0) during late uniform plastic deformation, ahead of the maximum load, but not a decline that could serve as a warning indicator of instability. Two tentative interpretations of the saturation are offered. The first follows from the mechanical record: the rise of the parameter coincides with the yield plateau, during which the Lüders band traverses the ligament and the dislocation density in the interrogated volume increases rapidly from its low initial value; when work hardening resumes, the accumulation of forest dislocations shortens the mean loop length, and in the competition set out in Section 2.3 the loop-length term may offset the further increase of the density term, so that the parameter levels off. The second is that incipient strain localisation within the ligament, as the maximum load is approached, reduces the uniform hardening of the interrogated volume; this would be consistent with the behaviour reported by Cai et al. [21] at the position where necking developed. The two are not exclusive, and distinguishing them requires local strain measurement and microstructural characterisation of the notch region. Establishing whether the saturation, or a subsequent decline, can provide such an indicator would require a denser acquisition around the maximum load, an independent identification of neck formation, for example by digital image correlation, and measurements with independently verified signal quality in the localisation regime.
3.4. Comparison with the Cyclic Response of the Same Measurement Configuration
It is instructive to compare the monotonic response reported above with the behaviour recorded on the same measurement configuration under cyclic loading. In low-cycle fatigue of aluminium 6061-T6, the normalised second- and third-order parameters increased with accumulated cycles and terminated in a plateau attributed to saturation of the crack density within the interrogated volume, while the wave velocity remained invariant and the normalised attenuation increased by 10 to 20 per cent [15]. It should be noted, however, that non-monotonic behaviour has also been documented under fatigue in other systems: in nickel-based superalloys the normalised parameter has been observed to rise, stabilise and subsequently decrease [34]. The shape of the parameter evolution is therefore not by itself diagnostic of the loading regime, and the comparison drawn below concerns the operative microstructural mechanism rather than the form of the curve.
The comparison of greater consequence is with monotonic tensile data for other alloys, where the direction of the effect is not consistent across the literature. Shui et al. [16], measurements on cold-worked austenitic stainless steel [17] and the modelling and experimental study of Zhang and co-workers on martensitic steel [18] all report an increase of the nonlinearity parameter with plastic strain, in agreement with the present results for S235 and with the majority of published work. Kim and Matlack [23], by contrast, measured a monotonic decrease in 316L, from approximately 2.45 in the undeformed state to 1.77 at 1.30% plastic strain, followed by saturation at about 1.8% coinciding with a planar-to-wavy transition of the dislocation structure. The present data therefore fall on the majority side of an open question, and provide a ferritic-pearlitic reference point against which the austenitic exception can be assessed.
The divergence is most plausibly microstructural rather than instrumental, and it can be rationalised, qualitatively, by the competition set out in Section 2.3. Kim and Matlack attribute the decrease observed in 316L to a scaling of the parameter with monopole loop length governed by the initial substructure [23], and report saturation at about 1.8% plastic strain coinciding with a planar-to-wavy transition of the dislocation arrangement. Under the proportionality β ∝ Λ L4 [31] this is the expected behaviour for an alloy whose pristine state combines a low dislocation density with long unpinned segments. The ferritic-pearlitic S235 examined here occupies the opposite limit, in which the pristine loop length is already constrained by carbide and lamellar spacing and multiplication dominates, and the measured increase is therefore the expected sign. The comparative study of cyclic and monotonic deformation in austenitic stainless steel by Zhang and co-workers [35] provides further support that the deformation path and the resulting substructure, rather than the accumulated strain alone, determine the response. This interpretation is consistent with all the experimental evidence cited but is not independently tested by the present measurements; determination of dislocation density and mean loop length within the notch region is required, and is identified in Section 4 as the principal outstanding validation.
Two constraints on the foregoing comparison should be stated. The alloys, the interrogating wave modes and the strain measures differ between the studies cited, and the values reported in the present work are referred to nominal rather than local plastic strain. The comparison is accordingly one of direction and order of magnitude, not of absolute parameter values.
3.5. Derived Representations
Three further representations of the same data set are given in Figure 7, Figure 8 and Figure 9. Figure 7 superimposes the normalised nonlinearity parameter on the engineering stress–strain curves of the specimens using a secondary ordinate, which places the acoustic response and the mechanical response on a common abscissa and permits the departure of β2/β2(0) from unity to be read directly against the macroscopic yield point and against the maximum of the load–elongation record.
Figure 7.
Superposition of the normalized nonlinearity parameter onto the macroscopic stress-strain curve. The rise of the acoustic parameter begins close to the deviation of the stress–strain curves from the elastic regime. Mean ± one standard deviation (n = 3); the red marker denotes the last acquisition, at which the signal quality was degraded (Section 3.3).
Figure 8.
Rate of change of the normalized nonlinearity with respect to strain (dβ2/dε) of the normalised parameter β2/β2(0). The departure of the derivative from its near-zero elastic value locates the acoustic yield strain; the maximum marks the strain of fastest increase within Stage II, and the return to approximately zero marks the onset of saturation of the parameter. The red segments mark the transition to the saturation of the parameter (Stage III).
Figure 9.
Trajectory of the normalized nonlinearity versus the normalized attenuation, with nominal strain acting as the implicit parameter along the path. The steepness of the outgoing branch highlights the sensitivity of β2/β2(0) relative to the normalised attenuation. The final (red) segment leads to the last acquisition, at which the signal quality was degraded.
Figure 8 presents the derivative of the normalised nonlinearity parameter with respect to nominal strain. Differentiation converts the change of regime at yield from a change of slope, which must be identified by eye, into the departure of the derivative from its near-zero elastic value, which can be located against a threshold. The maximum of the derivative marks the strain of fastest increase within Stage II, and its return to approximately zero marks the onset of saturation of the parameter at the end of Stage II. Because the derivative is computed from the same data, these features are not independent of β2/β2(0), but they provide an objective way of locating them. The derivative was computed from the mean response of the three specimens by first-order finite differences between consecutive acquisition points, Δ(β2/β2(0))/Δε, assigned to the midpoint of each strain interval (Δε ≈ 0.004–0.006 in the vicinity of yield), without smoothing. The onset of the increase was identified as the first strain interval over which the derivative exceeds k = 3 times its noise level, the latter estimated from the standard error of the mean of β2/β2(0) at the acquisition below the offset yield strain (≈10 in units of nominal strain−1). Because the derivative is evaluated between discrete acquisitions, the onset is located to within one acquisition interval; half the interval, approximately ±0.003, is the resolution of the estimate. The dependence on the threshold criterion, on the processing and on noise is evaluated below. The approach is analogous to that adopted by Vetrone et al. [22], who extracted the deformation stage of metals from the derivative of the cumulative acoustic emission energy rather than from the cumulative quantity itself. The red segments mark the transition to the saturation of the parameter in Stage III.
The derivatives over the successive intervals are 4, 17, 204, 232, 218, 21 and −2 (in units of nominal strain−1); the first interval exceeding the threshold of 31 is that between the acquisitions at ε ≈ 0.015 and ε ≈ 0.021, in which, as noted in Section 3.3, the second harmonic itself first increases. The onset is therefore reported as the interval 0.015–0.021, or 0.018 ± 0.003, from the mean response of the three specimens (Table 1). In the previous version of this paper the threshold crossing was located by linear interpolation of the derivative between the midpoints of successive intervals, which gave 0.0131; this convention places the onset before the interval in which the increase occurs and has been abandoned. The sensitivity of the result was examined as follows. Varying k between 2 and 4, and estimating the noise of the derivative from the specimen-to-specimen standard deviation instead of the standard error, the first interval exceeding the threshold remained 0.015–0.021 in all cases; the preceding interval, 0.011–0.015 (derivative 17), is below the threshold for every combination. Replacing the forward differences by the derivative of a monotone piecewise-cubic interpolation of β2/β2(0) placed the threshold crossing at 0.014–0.016, i.e., at the lower end of the same interval or marginally before it. The robustness against noise was assessed by a Monte Carlo procedure in which each mean value was perturbed 10,000 times with normally distributed errors equal to its standard error: the first interval exceeding the threshold was 0.015–0.021 in 65% of the realisations and 0.011–0.015 in the remainder, and never a later interval. The onset of the increase is therefore established to lie between ε ≈ 0.011 and ε ≈ 0.021, most probably in the interval 0.015–0.021. Table 1 compares this interval with the mechanical reference strains of the individual specimens, which were determined from the nominal stress–strain curves by the 0.2% offset method, with the elastic reference line fitted to each curve between 100 and 250 MPa, and as the onset of the yield plateau (Section 3.1). The interval lies 0.002–0.008 above the mean 0.2% offset yield strain (0.0128 ± 0.0004; 95% confidence interval 0.0118–0.0138), i.e., above its confidence interval but within one acquisition interval of it, and it contains the onset of the plateau of all three specimens (0.0170–0.0176). For the notched specimen this ordering is the expected one (Section 2.4.1 and Section 3.3): the acoustic parameter responds when plasticity reaches the interrogated volume at the centre of the ligament, which the mechanical record places at the onset of the plateau rather than at the first deviation of the global curve from linearity. Because the acquisition interval near yield (0.004–0.006) is an order of magnitude larger than the specimen-to-specimen scatter of the mechanical yield strains (0.0004), the present data cannot establish whether the acoustic onset precedes, coincides with or lags the plateau onset by less than approximately 0.003. With three specimens, an onset derived from their mean response and this resolution, the agreement supports, but does not by itself validate, the use of the acoustic marker as an estimate of yield onset; a determination for each specimen individually was not possible, because the individual-specimen acoustic records were not available for re-analysis, and a denser acquisition around yield, evaluated for each specimen, is required to establish the accuracy of the acoustic marker more precisely.
Figure 9 presents the two acoustic quantities against one another, with nominal strain as the parameter along the resulting trajectory. In this representation, the sensitivity hierarchy appears as the steepness of the path rather than as a comparison between two separate curves. The steep outgoing branch highlights the higher sensitivity of the nonlinearity parameter to early-stage plasticity compared to the gradual increase of linear attenuation. In its upper part the trajectory levels off (ε ≈ 0.031–0.040), where β2/β2(0) saturates while A1,0/A1 remains at approximately 1.2; the final (red) segment leads to the last acquisition, at which the signal quality was degraded (Stage III).
4. Discussion and Conclusions
This study establishes a continuous correspondence between the second-order acoustic nonlinearity of S235 structural steel and its macroscopic mechanical state under monotonic tensile loading. Bulk longitudinal waves were transmitted through the thickness of notched specimens and detected optically without contact, so that the normalised nonlinearity parameter and the normalised attenuation could be mapped, without interruption of the test, onto the stress–strain curve of the same specimen.
The continuous, simultaneous evaluation of both linear and nonlinear acoustic parameters yielded the following primary conclusions:
Within the specimen-to-specimen scatter, the second harmonic is unchanged in the elastic regime and up to the acquisition at ε ≈ 0.015, and first increases between ε ≈ 0.015 and 0.021, coinciding with the onset of the yield plateau of the stress–strain curves (≈0.017) and 0.002–0.008 above the 0.2% offset yield strain (0.0128 ± 0.0004); for the notched specimen this corresponds to the arrival of plasticity in the interrogated volume at the centre of the ligament. Because the microstructure is unaltered while the mechanical response remains reversible, this invariance bounds the reversible acoustoelastic contribution within the elastic range of stress; beyond yield only a conditional estimate of this contribution, of the order of 1%, is available (Section 2.2), and the subsequent evolution is interpreted as reflecting predominantly permanent microstructural change. The departure from unity therefore provides a candidate non-destructive marker of yield onset, resolved in the present tests to within one acquisition interval (±0.003 in nominal strain) and consistent with the onset of the yield plateau; such a marker is of potential interest in the post-event assessment of steel structural members.
In contrast to the nonlinear response, the normalized linear attenuation (A1,0/A1) exhibited a maximum variation of about 20% over the same strain interval, part of which may originate at the transmitting interface. For the frequency, geometry, material and propagation path examined here, the linear attenuation was therefore considerably less sensitive to early plasticity than the nonlinearity parameter; whether this ordering holds for other frequencies, wave modes and materials has not been established here.
The parameter rises over the yield plateau and saturates at approximately 4.5 when work hardening resumes (ε ≈ 0.031–0.033), well ahead of the maximum load (ε ≈ 0.043). A lower value, approximately 3.8, was recorded only at the last acquisition, close to the maximum load and approximately 0.001 in nominal strain before final separation, at a point at which the signal quality was degraded. Since the attenuation remained essentially unchanged, this reduction arises mainly from A2. The present data cannot determine whether it reflects a change in material state, such as void coalescence obstructing the acoustic path, or the loss of signal-to-noise ratio. A comparable decline beyond localisation has been reported with electromagnetic transduction [21], but its use as a precursor of instability is not established by the present measurements. Tentatively, the saturation may reflect the transition from dislocation multiplication during Lüders-type propagation to forest hardening, in which the loop-length term of Section 2.3 offsets the density term, or the approach to strain localisation; both interpretations require verification by local strain measurement and microstructural characterisation.
The direction and magnitude of the effect measured here agree with the majority of published tensile data [16,17,18] and are opposite to the decrease reported for austenitic 316L under comparable in-situ conditions [23]. The present results therefore contribute a ferritic-pearlitic reference point to an open question concerning the sign of the response, and support the interpretation that the initial dislocation substructure of the alloy, rather than the loading mode alone, determines whether the nonlinearity parameter increases or decreases with plastic strain.
The competing dependence of the monopole contribution on dislocation density and on the fourth power of the mean loop length provides a possible basis for this behaviour and allows the conflicting experimental trends to be interpreted, qualitatively, as the two limiting cases of a single expression. The interpretation is falsifiable: a normalised S235 with a coarser pinning-obstacle spacing should exhibit a weaker relative increase than the as-rolled condition, and this constitutes the most direct test of the proposed mechanism.
Several limitations should be stated. The results refer to a single steel grade, a single notched geometry and a single quasi-static loading rate, and their generalisation to other grades, geometries or strain rates has not been established here. In particular, the notch introduces a multiaxial stress state and fixes the location of localisation. The onset of necking was not identified independently, and no conclusion is drawn here on the behaviour of the parameter beyond the maximum load. The yield plateau was identified from stress–strain curves based on the crosshead displacement, which do not resolve an upper yield point, and the Lüders-type character of the plateau is inferred from its shape and from the known behaviour of the grade rather than observed directly. The invariance in the elastic regime, the sign of the post-yield change and the saturation of the response are expected to reflect the material, whereas the magnitude of the increase and the strains at which the features occur depend on Kt, on the position and size of the interrogated volume and on the use of nominal strain, and are therefore specific to the configuration. Tests on smooth specimens with a scanning LDV, which would allow the neck to be located and interrogated wherever it forms, combined with local strain measurement by digital image correlation, which would also identify the onset of necking independently, are required to establish which features are intrinsic to the material. Regarding loading rate, the yield stress and the dislocation arrangement of ferritic steels are rate sensitive; the strain at which the parameter departs from unity is expected to follow the rate dependence of yield, but the influence of loading rate on the magnitude of the response has not been investigated. The measurements were acquired under applied load; although the invariance of the parameter in the elastic regime bounds the acoustoelastic contribution within the elastic range of stress, only a conditional estimate is available beyond yield (Section 2.2), and a dedicated interrupted-loading campaign with acquisition at a controlled zero-load state, as implemented in [15], would permit the two contributions to be separated formally rather than bounded. The third-order parameter was not accessible in the present through-thickness configuration. Because the tone burst is longer than the specimen thickness, the analysis was restricted to a 1 µs window containing only the leading part of the direct arrival, which limits the spectral resolution and the signal-to-noise ratio of the second harmonic, and the pristine second harmonic lies close to the noise floor (Section 2.1.1), so that the magnitude of the normalised parameter is approximate, and the transmitting interface was not monitored independently during loading, so that a residual contribution of the contact to both acoustic metrics cannot be excluded; a control measurement, for example with an independent reference receiver monitoring the transmitted signal, or with the transducer bonded on an unstrained region of the same specimen, is required to quantify it. Finally, no post-mortem microstructural characterisation was performed, nor was the as-received microstructure characterised beyond the specified composition limits of the grade, so the attribution of the Stage II rise to dislocation multiplication rests on the correlation established in the literature rather than on an independent measurement of dislocation density on these specimens; electron backscatter diffraction and microhardness mapping of the notch region are planned as follow-on work. It should also be stated plainly that the qualitative three-stage response documented here has precedent: an equivalent sequence has been reported for aluminium alloy using non-contact electromagnetic transduction [21], and the identification of the plasticity initiation strain in structural steel by nonlinear ultrasonics has been demonstrated previously [22]. The present contribution is quantitative and material-specific rather than phenomenological.
The results indicate that a non-contact nonlinear ultrasonic measurement can track the mechanical state of a notched structural steel specimen continuously and in situ, distinguishing the regime before the yield plateau, the arrival of plasticity in the interrogated volume at the onset of the plateau, and the saturation of the response when work hardening resumes. Combined with the cyclic data previously obtained on the same measurement configuration, they indicate that the form of the nonlinear acoustic response carries information on the operative damage mechanism. This is a prerequisite for the interpretation of such measurements in structural health monitoring applications, where the loading history of the inspected component is generally not known in advance.
Supplementary Materials
The following supporting information can be downloaded at: https://www.mdpi.com/article/10.3390/app162110869/s1, Figure S1: Residuals of the linear regression of the second-harmonic amplitude A2 on the square of the fundamental amplitude A12 for the eight excitation levels of the system linearity assessment (Figure 3); Figure S2: Second-harmonic amplitude during the tensile tests, derived from the mean values of Figure 5 and Figure 6.
Author Contributions
Conceptualization, A.S.T. and T.E.M.; methodology, A.S.T. and T.Z.K.; software, T.Z.K.; validation, A.S.T., T.Z.K., S.G.F., D.A.E. and T.E.M.; formal analysis, A.S.T.; investigation, A.S.T.; data curation, A.S.T.; writing—original draft preparation, A.S.T.; writing—review and editing, S.G.F. and D.A.E.; visualization, A.S.T.; supervision, T.E.M.; project administration, T.E.M. All authors have read and agreed to the published version of the manuscript.
Funding
This research received no external funding.
Institutional Review Board Statement
Not applicable.
Informed Consent Statement
Not applicable.
Data Availability Statement
The data presented in this study are available on request from the corresponding authors.
Conflicts of Interest
The authors declare no conflicts of interest.
References
- Cantrell, J.H. Substructural organization, dislocation plasticity and harmonic generation in cyclically stressed wavy slip metals. Proc. R. Soc. Lond. A 2004, 460, 757–780. [Google Scholar] [CrossRef] [Scilit]
- Wciślik, W.; Lipiec, S. Void-induced ductile fracture of metals: Experimental observations. Materials 2022, 15, 6473. [Google Scholar] [CrossRef] [Scilit] [PubMed]
- Jhang, K.-Y. Nonlinear ultrasonic techniques for nondestructive assessment of micro damage in material: A review. Int. J. Precis. Eng. Manuf. 2009, 10, 123–135. [Google Scholar] [CrossRef] [Scilit]
- Su, Z.; Zhou, C.; Hong, M.; Cheng, L.; Wang, Q.; Qing, X. Acousto-ultrasonics-based fatigue damage characterization: Linear versus nonlinear signal features. Mech. Syst. Signal Process. 2014, 45, 225–239. [Google Scholar] [CrossRef] [Scilit]
- Frouin, J.; Maurer, J.; Sathish, S.; Eylon, D.; Na, J.K.; Matikas, T.E. Real-time monitoring of acoustic linear and nonlinear behavior of titanium alloys during cyclic loading. MRS Online Proc. Libr. 1999, 591, 79. [Google Scholar] [CrossRef] [Scilit]
- Yang, C.-H.; Jeyaprakash, N.; Wu, S.-Y. Evaluation of fatigue damage in steel plates through non-linear ultrasonic technique. Int. J. Steel Struct. 2023, 23, 1251–1264. [Google Scholar] [CrossRef] [Scilit]
- Mevissen, F.; Meo, M. Dislocation detection of gas turbine materials using a nonlinear ultrasound modulation technique. Mech. Syst. Signal Process. 2023, 200, 110563. [Google Scholar] [CrossRef] [Scilit]
- Matlack, K.H.; Kim, J.-Y.; Jacobs, L.J.; Qu, J. Review of second harmonic generation measurement techniques for material state determination in metals. J. Nondestruct. Eval. 2015, 34, 273. [Google Scholar] [CrossRef] [Scilit]
- Viswanath, A.; Rao, B.P.C.; Mahadevan, S.; Parameswaran, P.; Jayakumar, T.; Raj, B. Nondestructive assessment of tensile properties of cold worked AISI type 304 stainless steel using nonlinear ultrasonic technique. J. Mater. Process. Technol. 2011, 211, 538–544. [Google Scholar] [CrossRef] [Scilit]
- Staszewski, W.J.; Bin Jenal, R.; Klepka, A.; Szwedo, M.; Uhl, T. A review of laser Doppler vibrometry for structural health monitoring applications. Key Eng. Mater. 2012, 518, 1–15. [Google Scholar] [CrossRef] [Scilit]
- Tragazikis, I.K.; Koutrakou, A.N.; Kordatou, T.Z.; Dalla, P.T.; Matikas, T.E. Monitoring the nonlinear acoustic behavior of fresh cementitious materials during the hardening process using laser Doppler vibrometry. Acoustics 2020, 2, 833–846. [Google Scholar] [CrossRef] [Scilit]
- Saponaro, A.; Nobile, R. In situ fatigue damage monitoring by means of nonlinear ultrasonic measurements. Metals 2024, 14, 11. [Google Scholar] [CrossRef] [Scilit]
- Guo, S.; Chen, S.; Zhang, L.; Chen, Y.F.; Yao, K. Plastic strain determination with nonlinear ultrasonic waves using in situ integrated piezoelectric ultrasonic transducers. IEEE Trans. Ultrason. Ferroelectr. Freq. Control 2018, 65, 95–101. [Google Scholar] [CrossRef] [Scilit] [PubMed]
- Kordatou, T.Z.; Exarchos, D.A.; Matikas, T.E. Automated nonlinear acoustics system for real-time monitoring of cement-based composites. Sensors 2025, 25, 6655. [Google Scholar] [CrossRef] [Scilit] [PubMed]
- Kordatou, T.Z.; Farmaki, S.G.; Exarchos, D.A.; Matikas, T.E. Automated Rayleigh-wave nonlinear acoustic platform for real-time fatigue monitoring in metallic materials. Sensors 2026, 26, 3190. [Google Scholar] [CrossRef] [Scilit] [PubMed]
- Shui, G.; Wang, Y.-S.; Gong, F. Evaluation of plastic damage for metallic materials under tensile load using nonlinear longitudinal waves. NDT E Int. 2013, 55, 1–8. [Google Scholar] [CrossRef] [Scilit]
- Zhang, J.; Li, S.; Xuan, F.-Z.; Yang, F. Effect of plastic deformation on nonlinear ultrasonic response of austenitic stainless steel. Mater. Sci. Eng. A 2015, 622, 146–152. [Google Scholar] [CrossRef] [Scilit]
- Zhu, W.; Deng, M.; Xiang, Y.; Xuan, F.-Z.; Liu, C.; Wang, Y.-N. Modeling of ultrasonic nonlinearities for dislocation evolution in plastically deformed materials: Simulation and experimental validation. Ultrasonics 2016, 68, 134–141. [Google Scholar] [CrossRef] [Scilit] [PubMed]
- Pfeifer, D.; Kim, J.-Y.; Jacobs, L.J. Nonlinear Rayleigh waves to evaluate plasticity damage in X52 pipeline material. Mech. Syst. Signal Process. 2020, 143, 106794. [Google Scholar] [CrossRef] [Scilit]
- Walker, S.V.; Kim, J.-Y.; Qu, J.; Jacobs, L.J. Fatigue damage evaluation in A36 steel using nonlinear Rayleigh surface waves. NDT E Int. 2012, 48, 10–15. [Google Scholar] [CrossRef] [Scilit]
- Cai, Z.; Cheng, H.; Liu, C. Nonlinear electromagnetic acoustic testing method for tensile damage evaluation. J. Sens. 2018, 2018, 1745257. [Google Scholar] [CrossRef] [Scilit]
- Vetrone, J.; Obregon, J.E.; Indacochea, E.J.; Ozevin, D. The characterization of deformation stage of metals using acoustic emission combined with nonlinear ultrasonics. Measurement 2021, 178, 109407. [Google Scholar] [CrossRef] [Scilit]
- Kim, C.; Matlack, K.H. In situ nonlinear Rayleigh wave technique to characterize the tensile plastic deformation of stainless steel 316L. Ultrasonics 2023, 131, 106945. [Google Scholar] [CrossRef] [Scilit] [PubMed]
- Yan, X.; Wang, H.; Fan, X. Research progress in nonlinear ultrasonic testing for early damage in metal materials. Materials 2023, 16, 2161. [Google Scholar] [CrossRef] [Scilit] [PubMed]
- Lissenden, C.J. Nonlinear ultrasonic guided waves—Principles for nondestructive evaluation. J. Appl. Phys. 2021, 129, 021101. [Google Scholar] [CrossRef] [Scilit]
- Kundu, T. (Ed.) Nonlinear Ultrasonic and Vibro-Acoustical Techniques for Nondestructive Evaluation; Springer: Cham, Switzerland, 2018. [Google Scholar] [CrossRef] [Scilit]
- Zhong, B.; Zhu, J. Measurement of third-order elastic constants using thermal modulation of ultrasonic waves. Appl. Phys. Lett. 2021, 118, 261903. [Google Scholar] [CrossRef] [Scilit]
- Mohabuth, M.; Khanna, A.; Hughes, J.; Vidler, J.; Kotousov, A.; Ng, C.-T. On the determination of the third-order elastic constants of homogeneous isotropic materials utilising Rayleigh waves. Ultrasonics 2019, 96, 96–103. [Google Scholar] [CrossRef] [Scilit] [PubMed]
- Matikas, T.E.; Aggelis, D.G. New trends in materials nondestructive characterization using surface acoustic wave methodologies. In Acoustic Waves—From Microdevices to Helioseismology; Beghi, M.G., Ed.; InTech: Rijeka, Croatia, 2011. [Google Scholar]
- Espinoza, C.; Feliú, D.; Aguilar, C.; Espinoza-González, R.; Lund, F.; Salinas, V.; Mujica, N. Linear versus nonlinear acoustic probing of plasticity in metals: A quantitative assessment. Materials 2018, 11, 2217. [Google Scholar] [CrossRef] [Scilit] [PubMed]
- Hikata, A.; Chick, B.B.; Elbaum, C. Dislocation contribution to the second harmonic generation of ultrasonic waves. J. Appl. Phys. 1965, 36, 229–236. [Google Scholar] [CrossRef] [Scilit]
- Pilkey, W.D.; Pilkey, D.F. Peterson’s Stress Concentration Factors, 3rd ed.; John Wiley & Sons: Hoboken, NJ, USA, 2008. [Google Scholar] [CrossRef] [Scilit]
- EN 10025-2:2019; Hot Rolled Products of Structural Steels—Part 2: Technical Delivery Conditions for Non-Alloy Structural Steels. European Committee for Standardization (CEN): Brussels, Belgium, 2019.
- Wang, J.J.; Zhang, Y.M.; Ren, H.R.; Yang, Y.Q.; Wen, Z.X.; Yue, Z.F. Characterization and localization of fatigue damage in nickel-based superalloys using nonlinear ultrasonic harmonic method. Int. J. Fatigue 2025, 193, 108785. [Google Scholar] [CrossRef] [Scilit]
- Zhang, J.; Xuan, F.-Z.; Xiang, Y.; Zhao, P. Effects of cyclic and monotonic deformations on nonlinear ultrasonic response of austenitic stainless steel: A comparative study. J. Mater. Eng. Perform. 2016, 25, 2008–2016. [Google Scholar] [CrossRef] [Scilit]
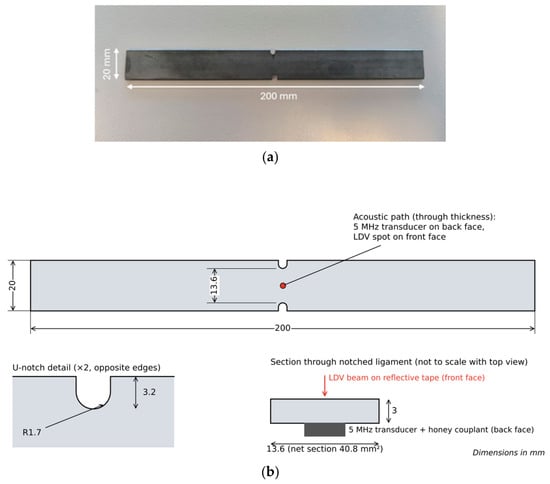
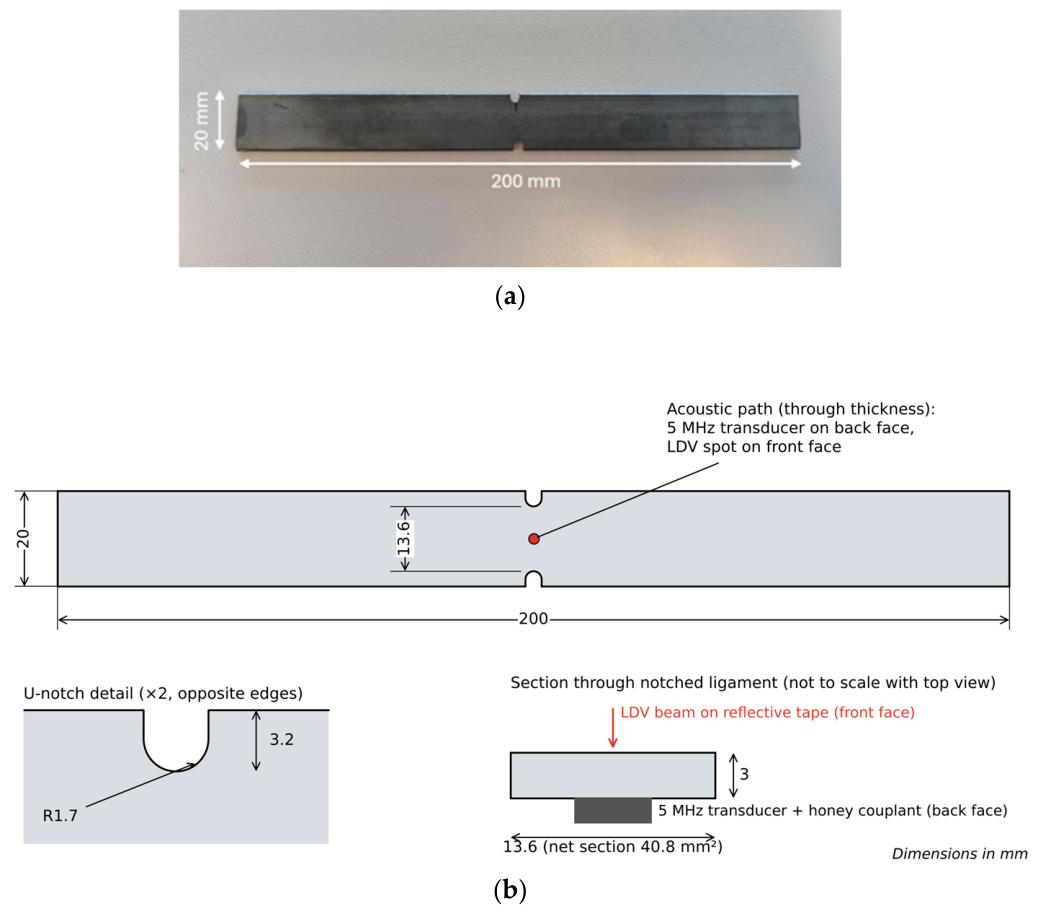
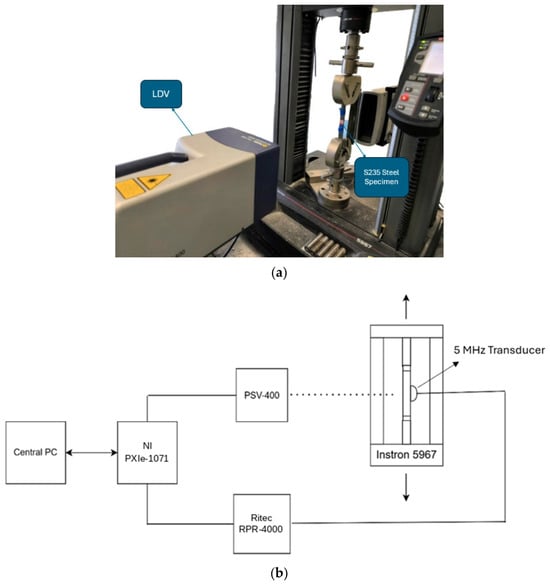
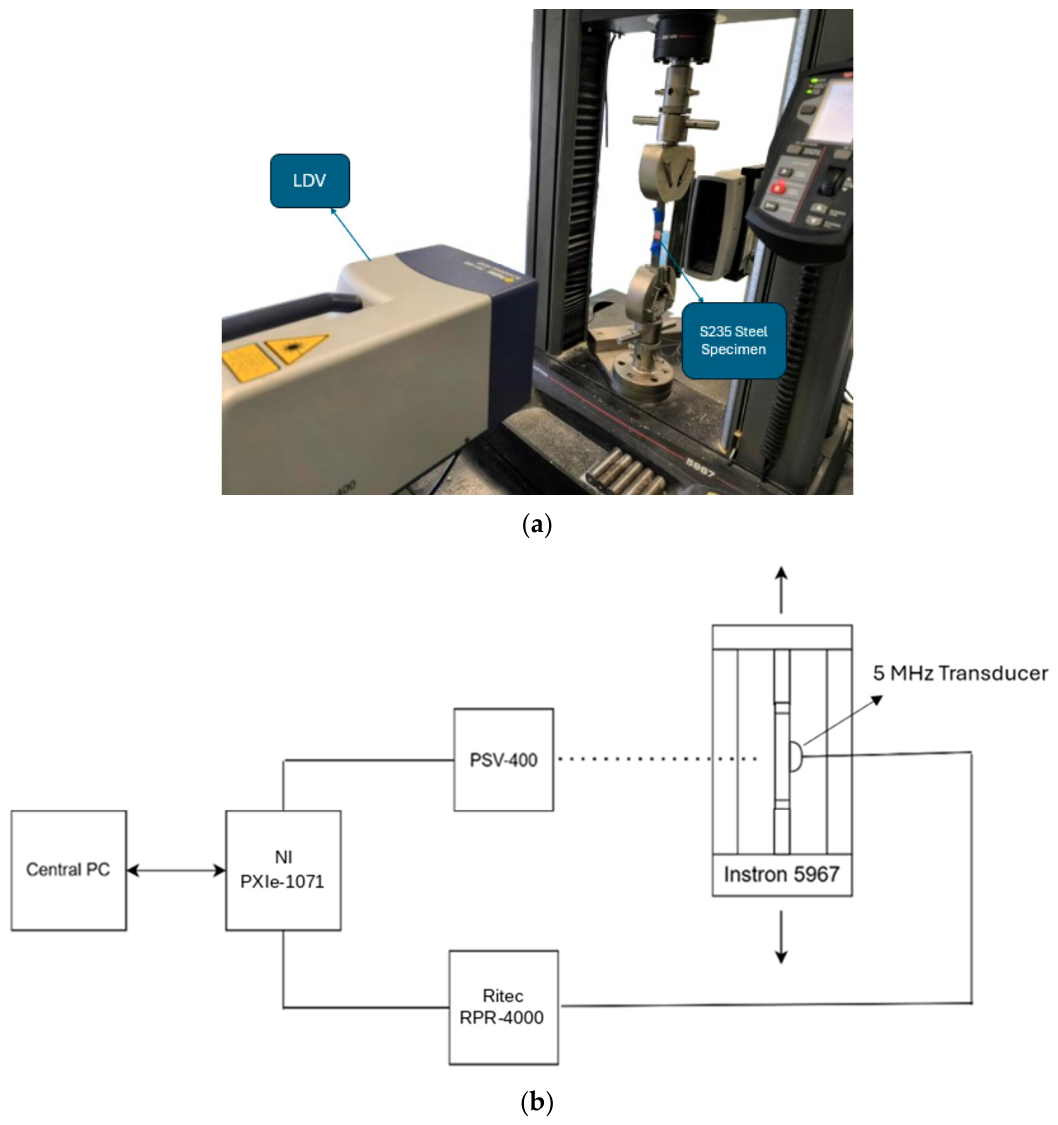
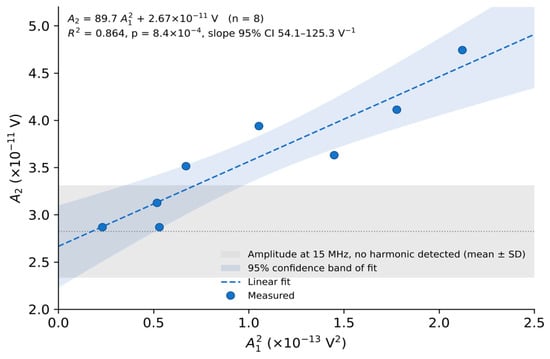
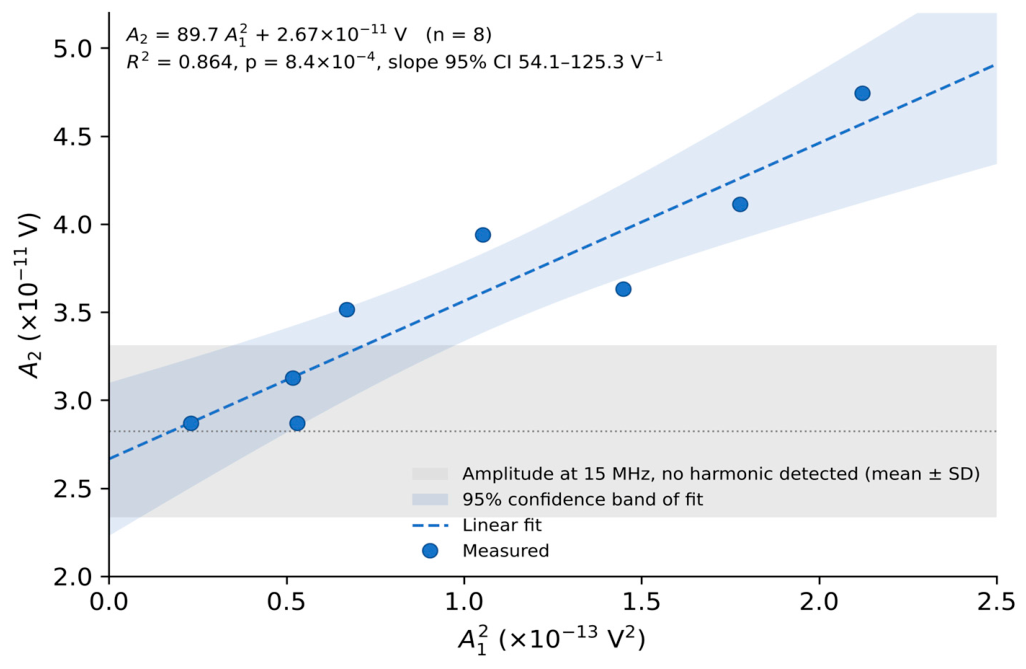
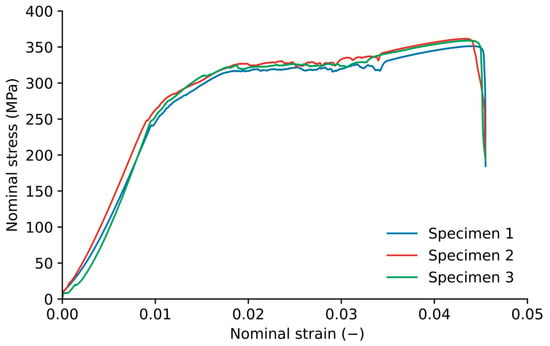
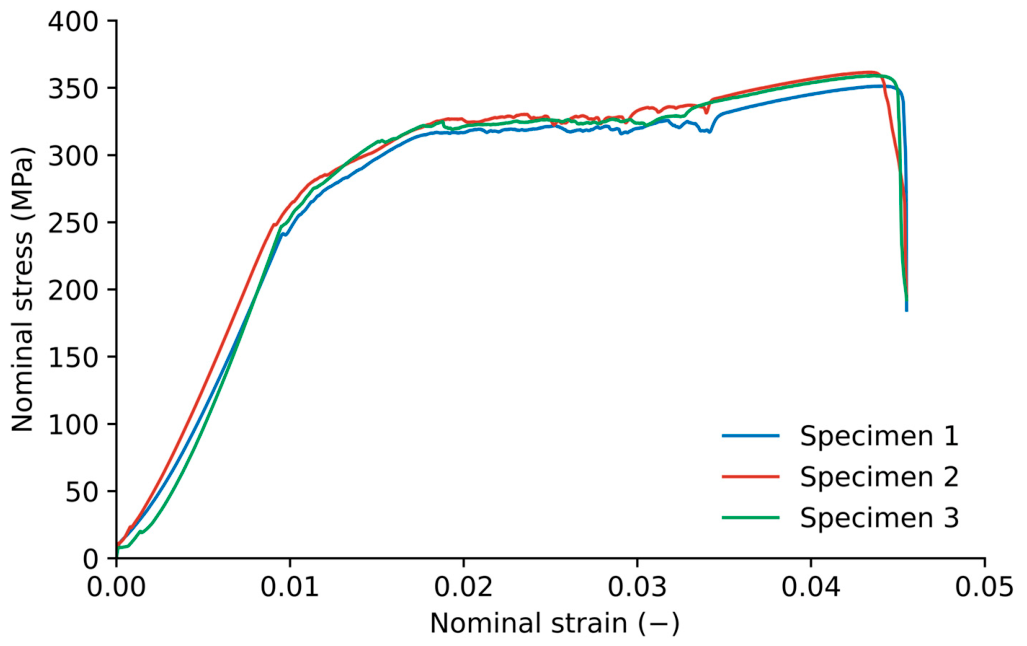
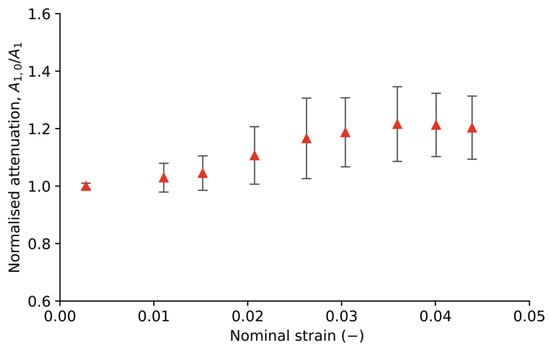
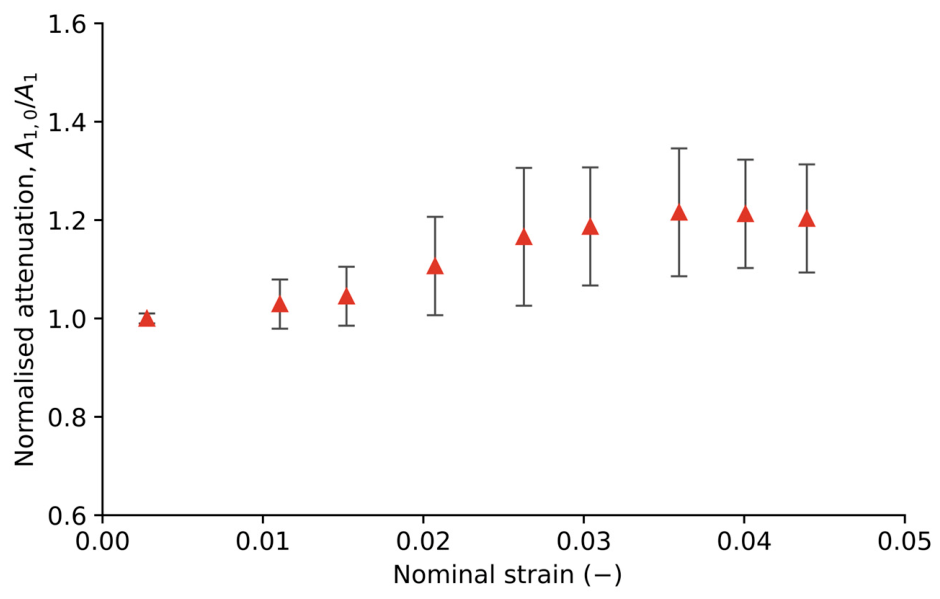
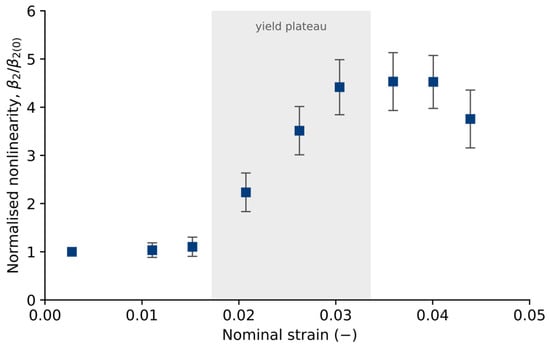
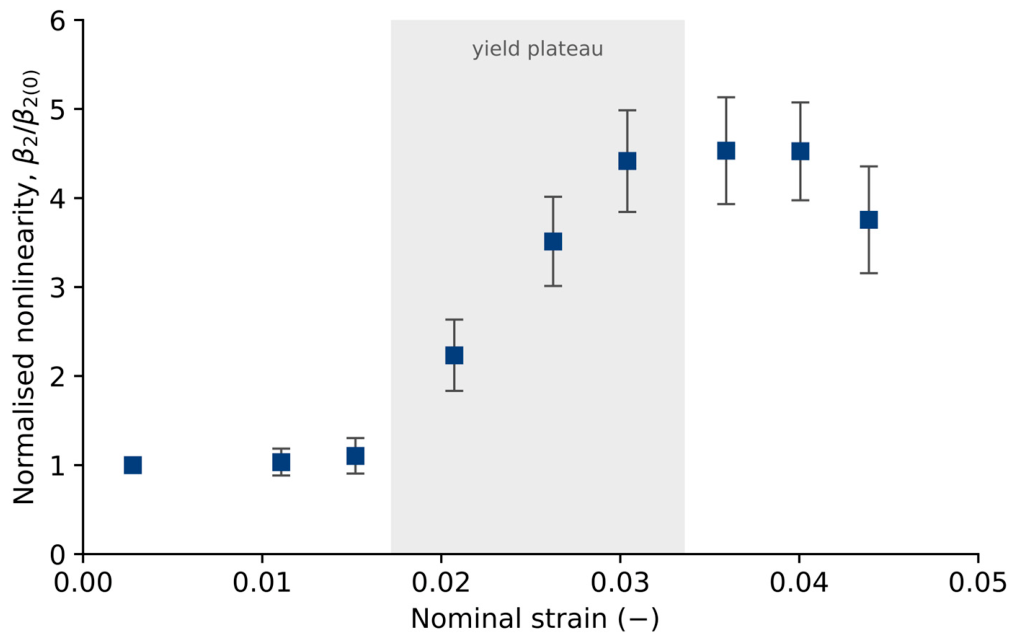
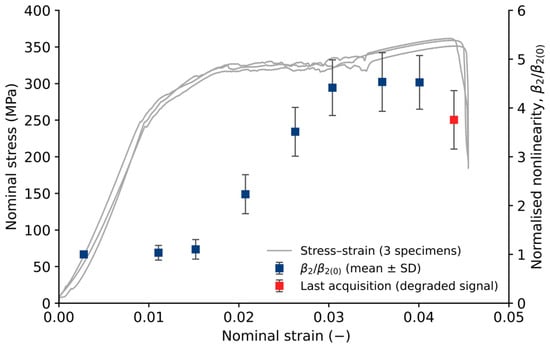
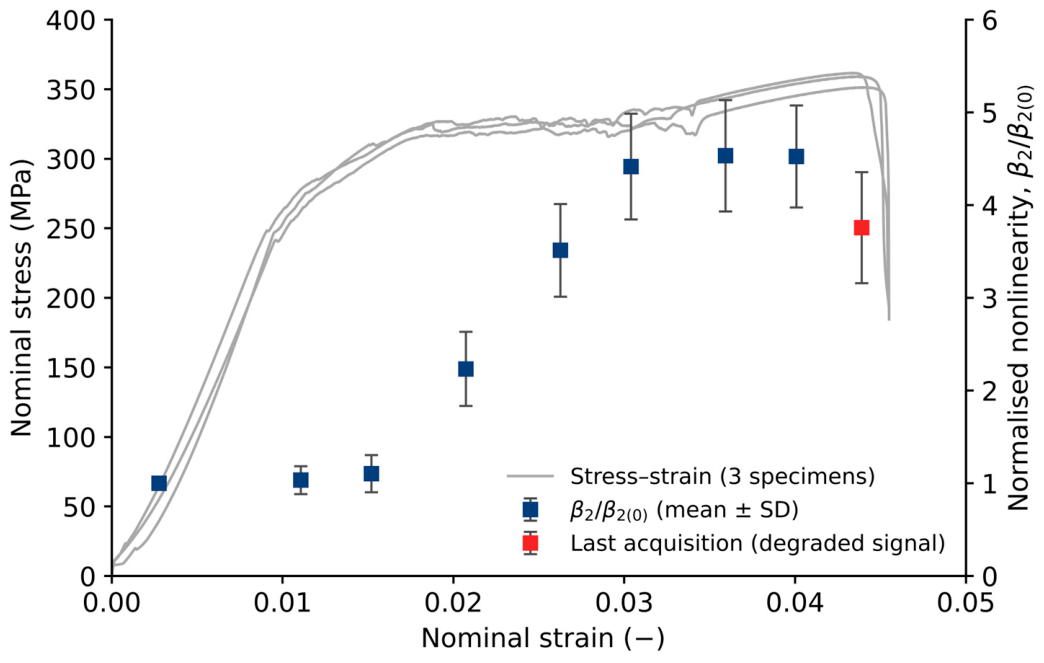
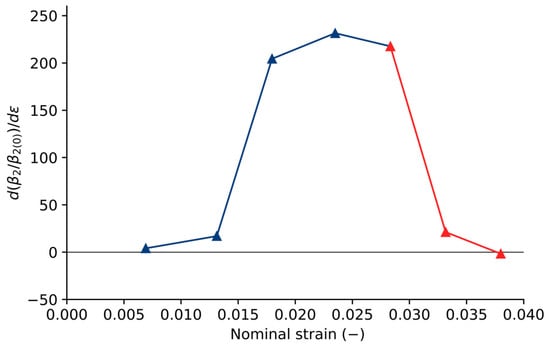
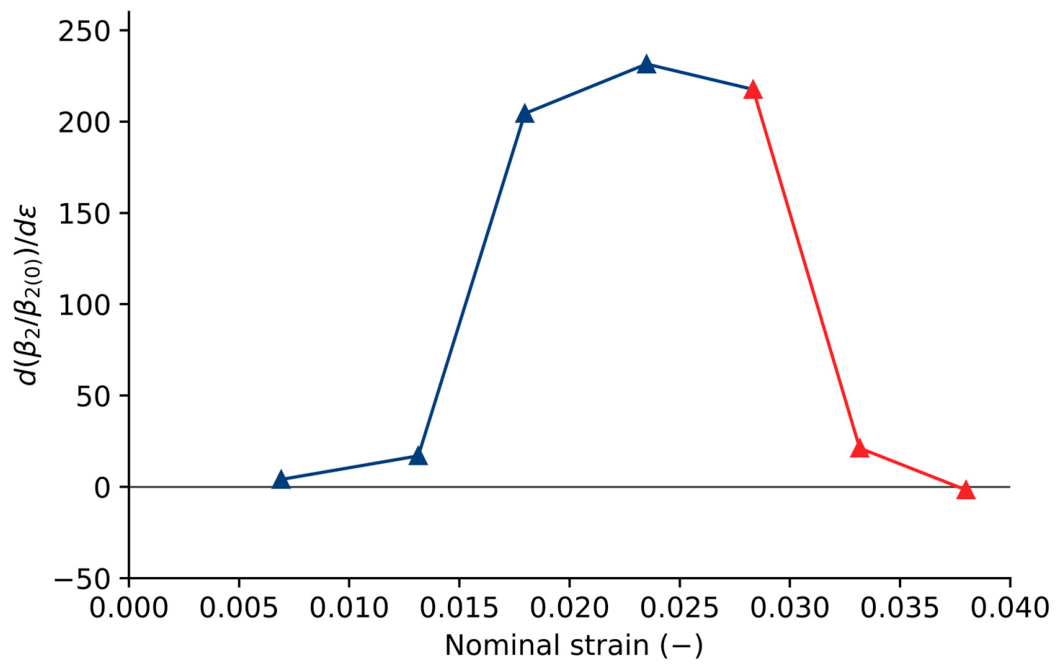
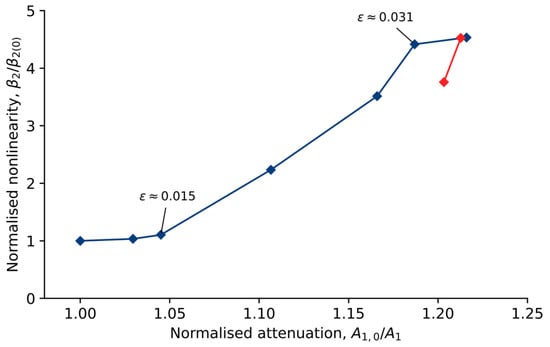
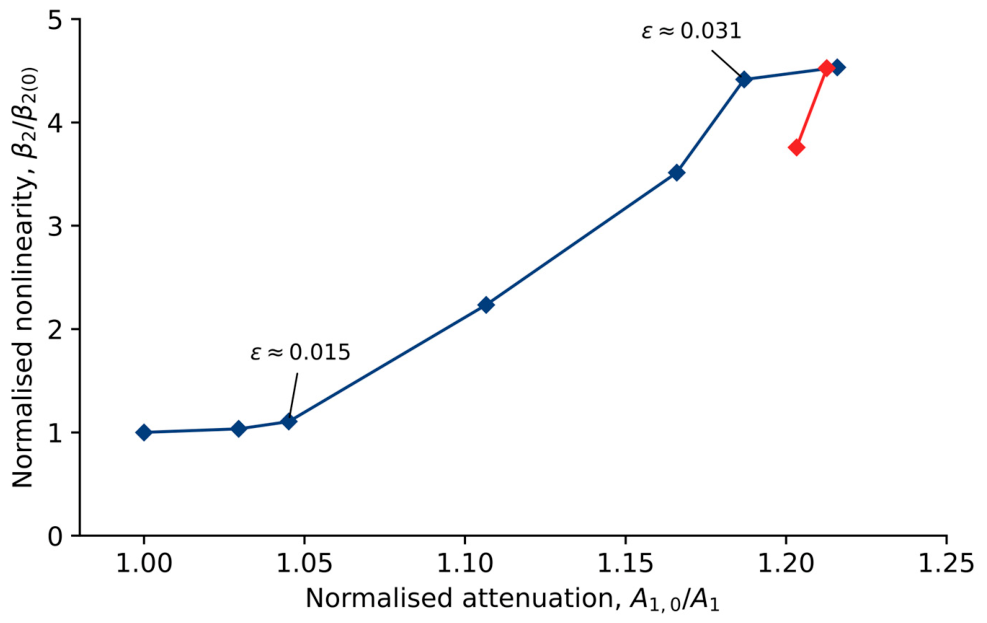

Disclaimer/Publisher’s Note: The statements, opinions and data contained in all publications are solely those of the individual author(s) and contributor(s) and not of MDPI and/or the editor(s). MDPI and/or the editor(s) disclaim responsibility for any injury to people or property resulting from any ideas, methods, instructions or products referred to in the content. |
© 2026 by the authors. Licensee MDPI, Basel, Switzerland. This article is an open access article distributed under the terms and conditions of the Creative Commons Attribution (CC BY) license.