


Abstract
Erdek Bay, in the south western Sea of Marmara, lies along the Central Branch of the North Anatolian Fault system (NAF-C). This study integrates very high-resolution CHIRP, sparker, and high-resolution multi-channel seismic reflection (MCS) data with complementary resolution and penetration to investigate fault geometry, segmentation, and evolution. Seismic stratigraphic correlation with a well-tied regional section and time-structure mapping of four interpreted horizons (acoustic basement, base Pliocene, near-base Quaternary and ~9 ka) enable faults to be traced from the seafloor to the acoustic basement, and the results are summarized in a three-dimensional conceptual model. MCS data image basement-offsetting faults to ~1.3 s two-way travel time. Vertical separation generally decreases toward younger horizons and varies irregularly along strike, consistent with cumulative deformation and fault segmentation. Steep fault geometries, irregular along-strike variations in vertical separation, throw-direction reversal and regional tectonic constraints are compatible with possible oblique-slip components, although individual fault kinematics remain uncertain. Seismic-stratigraphic relationships suggest Pliocene fault activity potentially associated with development of the modern NAF-C tectonic regime; CHIRP and Sparker data document Holocene deformation along selected strands. Scenario-based magnitude estimates for four segments interpreted to offset H1 range from Mw 5.80 to 6.23 under individual-segment rupture assumptions. This multi-resolution approach improves characterization of distributed offshore fault systems.
1. Introduction
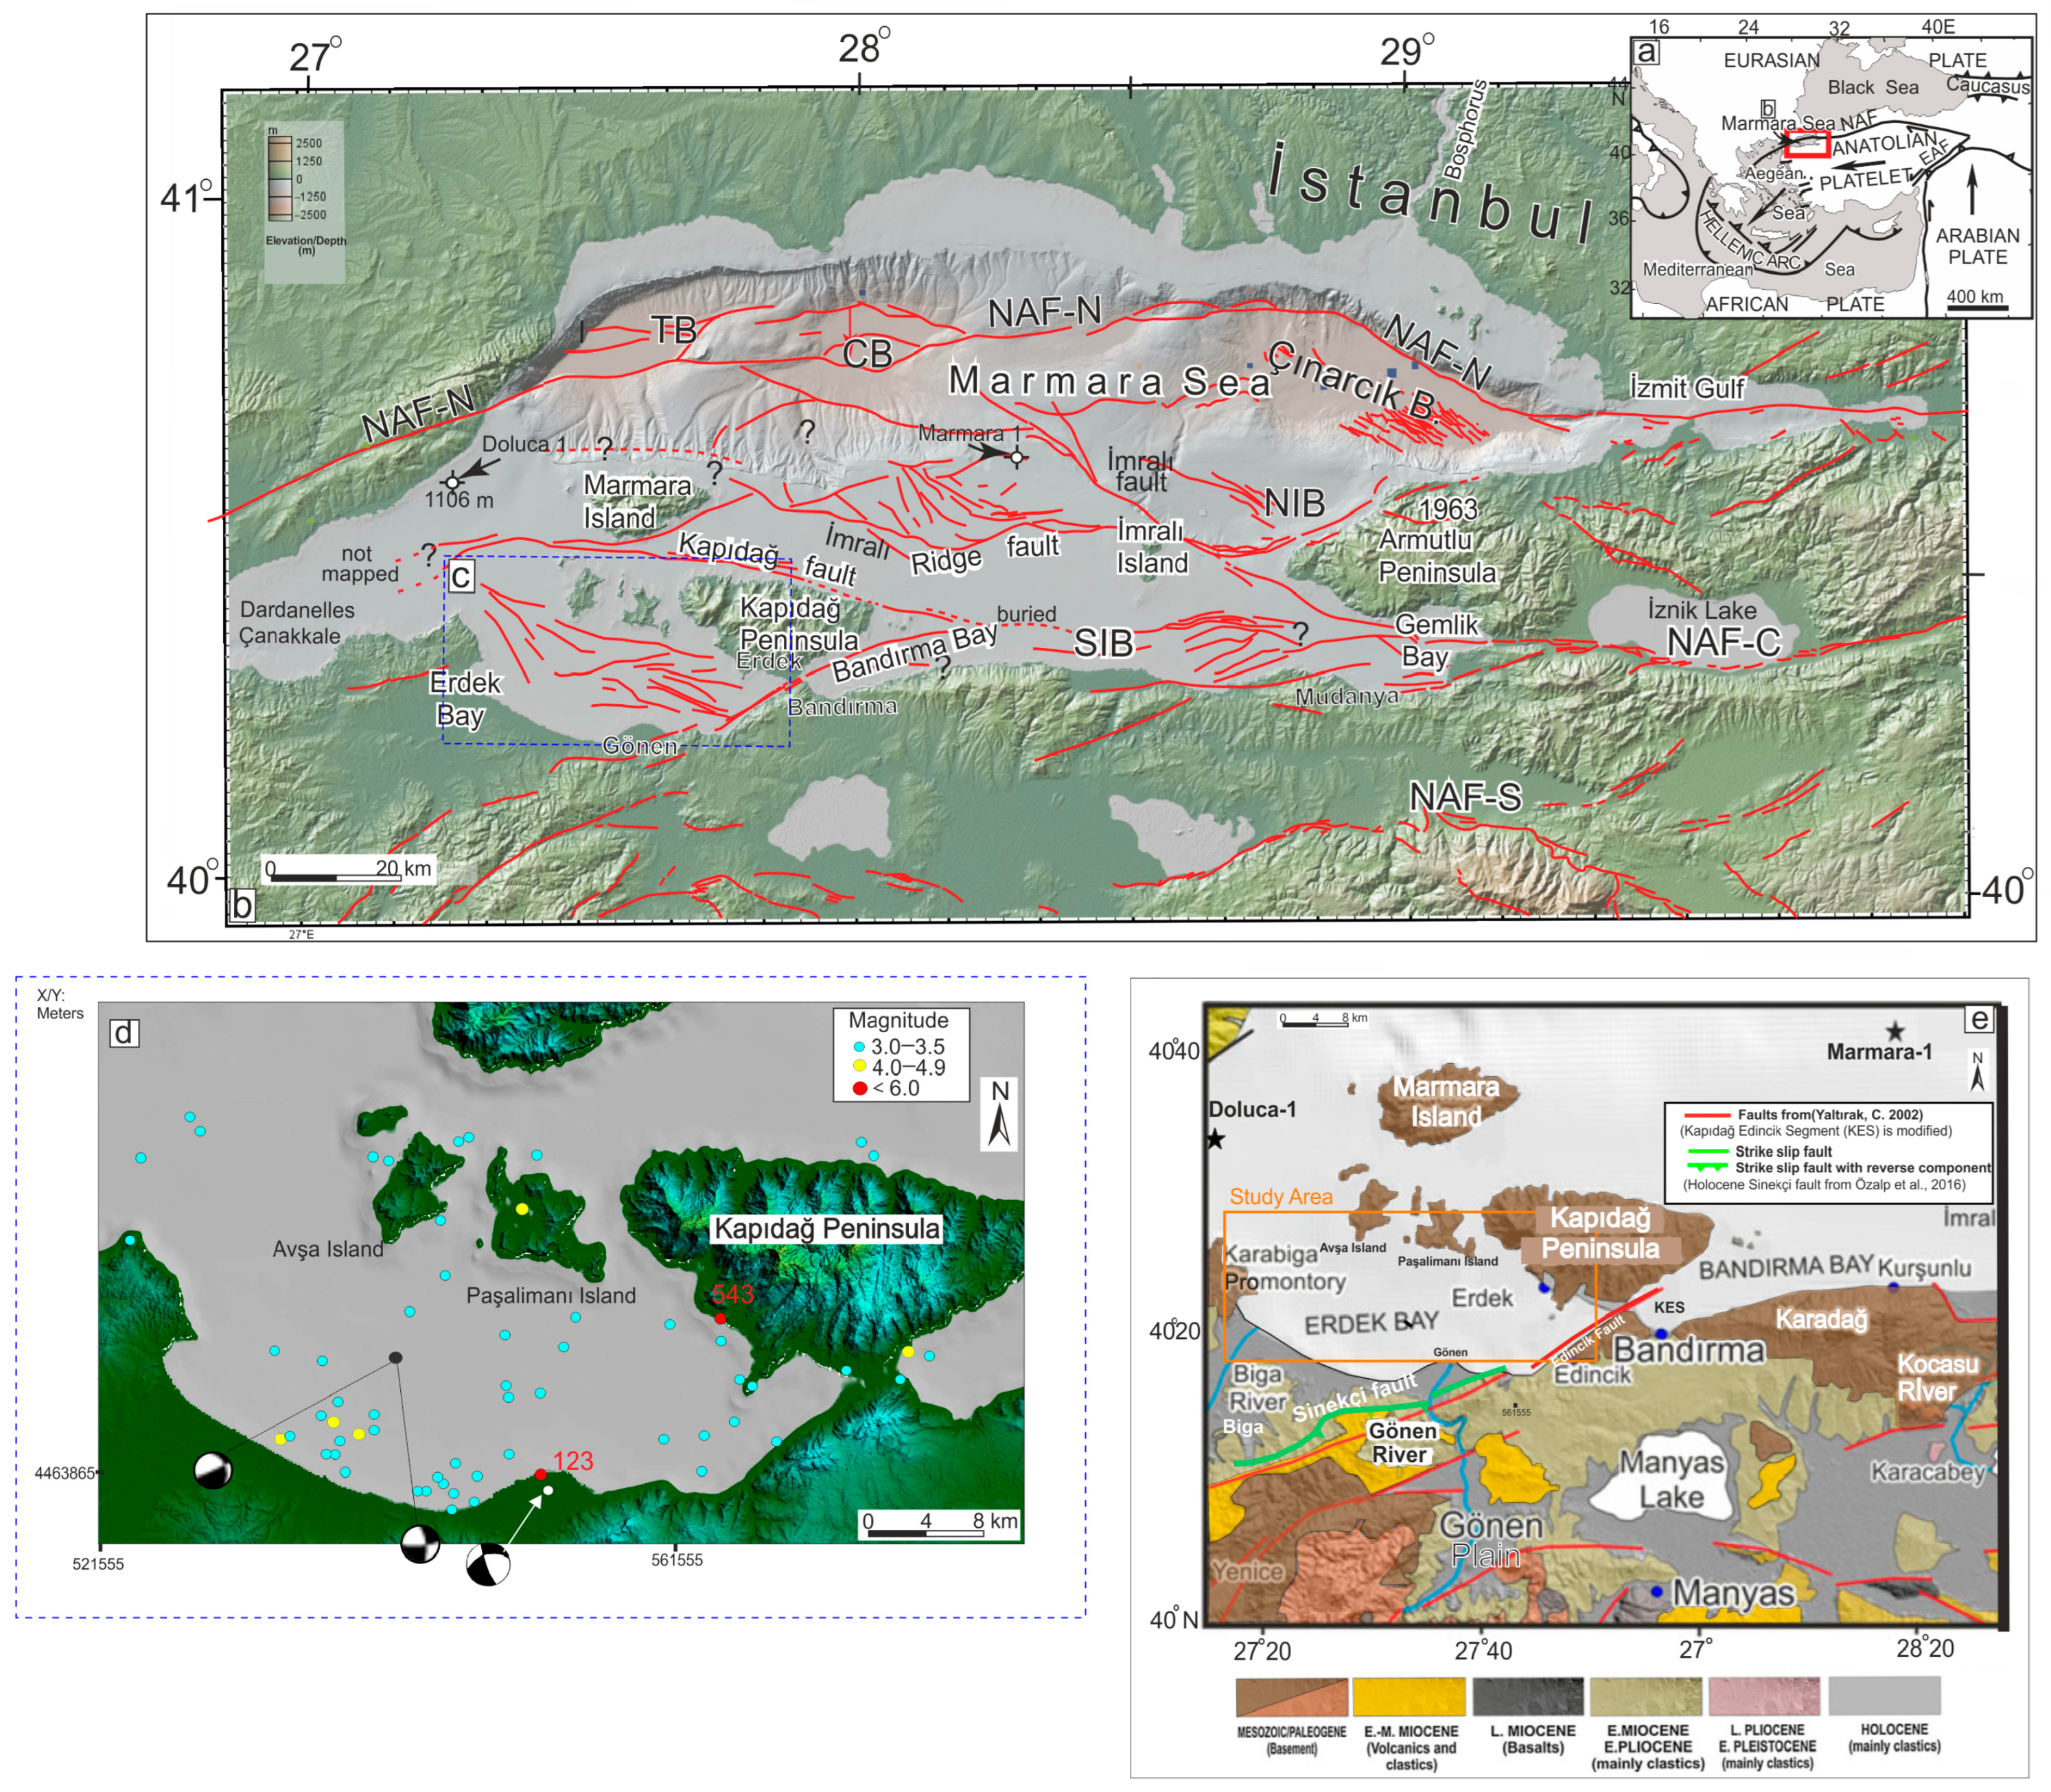
The Sea of Marmara, located along the boundary between the Eurasian and Anatolian plates, is characterized by a complex and significant tectonic setting (Figure 1a). The North Anatolian Fault Zone (NAFZ) is a major right-lateral strike-slip fault system that has been responsible for some of the most destructive earthquakes in Türkiye’s recent history. It bifurcates into three strands in the Sea of Marmara: the northern, central (middle), and southern branches [1]. Although extensive investigations have focused on the northern branch, particularly because of its proximity to the İstanbul metropolitan area, the central and southern strands remain comparatively underexplored. Erdek Bay, situated on the southwestern shelf of the Sea of Marmara, occupies an important position along the Central Branch of the North Anatolian Fault (NAF-C) (Figure 1b,c). The southern Marmara region has experienced numerous historical earthquakes [1], some associated with tsunamis [2], highlighting the importance of investigating offshore fault geometry and activity (Figure 1d). Although the northern strand (NAF-N) has been extensively studied (e.g., [3,4]), the geometry and evolution of several fault systems in the southern shelf remain relatively unresolved.
The timing and structural development of the NAF in the Marmara region remain debated. Regional studies suggest that the NAF was initiated in eastern Anatolia during the late Miocene and propagated westward, reaching the Marmara Sea during the Pliocene [5,6]. Study [7] suggested that the NAF reached the Marmara Sea around 5 Ma. Study [4] proposed that the South Marmara Fault (SMF), considered part of the NAF-C, began moving during the late Middle Miocene and became inactive in the Early Pliocene (some 3.5 Ma ago). Study [8] suggested that the NAF reached the region of the Gallipoli Peninsula by the mid-Pliocene. More recently, Ref. [9] proposed that the NAF-N propagated progressively westward into the Aegean Sea, within continental crust that had already been extended and thinned, and that was affected by a diffuse system of inherited extensional fault zones.
Independent geochronological evidence from the northern Aegean Sea provides additional constraints on regional tectonic development. Using U–Pb dating and geochemical characterization of syn-tectonic calcite cement, Ref. [10] showed that a kinematically distinct, NAF-related strike-slip regime was established no later than the earliest Pliocene (~5.9 Ma), overprinting an already extended Aegean crust. These regional interpretations provide a tectonic framework for investigating fault-system development in Erdek Bay, although they do not directly establish the timing of individual offshore faults.
Previous investigations have documented distributed faulting and Holocene activity along the NAF-C on the southern Marmara shelf, including Erdek Bay [11]. In particular, Ref. [11] investigated post-500 ka and Holocene fault activity across the southern Marmara shelf and identified discontinuous, distributed fault strands in Erdek Bay. However, as a regional study covering the entire southern shelf, Ref. [11] focused primarily on fault distribution and Late Quaternary activity across the southern Marmara shelf rather than a detailed investigation of deeper fault geometry and longer-term structural evolution within Erdek Bay. Earlier shallow seismic investigations [12] identified WNW–ESE-trending faults interpreted as normal faults and defined an acoustic basement corresponding to a ~30 ka stratigraphic boundary. Their interpretation was restricted to the shallow sedimentary succession, with seismic penetration ranging from a few meters to ~60 m, and did not resolve the deeper fault architecture investigated in the present study. Thus, despite these previous contributions, the deeper geometry, segmentation, and Pliocene-to-Holocene evolution of the fault system within Erdek Bay remain insufficiently constrained. The present study therefore provides a focused, detailed investigation of the Erdek Bay fault system.
Addressing these uncertainties requires seismic datasets with complementary penetration depths and resolutions. Shallow, high-resolution seismic data can resolve recent deformation but provide limited information on deeper fault architecture, whereas deeper-penetrating seismic data constrain fault geometry at depth but may lack the resolution needed to characterize the youngest deformation. Integrating these complementary datasets therefore provides a means of linking shallow fault expressions to deeper structures and evaluating deformation across successive stratigraphic levels.
Motivated by this gap, the present study adopts a different scope, focusing on the deeper fault architecture and longer-term tectonic evolution of Erdek Bay. Here, we integrate very high-resolution CHIRP, Sparker, and multichannel seismic reflection (MCS) data to investigate fault architecture from the seafloor to the acoustic basement. CHIRP data resolve shallow sedimentary deformation, Sparker profiles provide intermediate-depth imaging, and MCS profiles constrain deeper fault geometry. This integrated approach enables us to (1) identify and correlate key seismic-stratigraphic horizons extending to the base Pliocene, using the Doluca-1 well-tied regional seismic section of [4] as the stratigraphic reference; (2) revise the previously mapped fault configuration and construct an updated fault map of Erdek Bay; (3) characterize fault geometry and segmentation across the interpreted stratigraphic horizons, from the acoustic basement to the Holocene; and (4) reassess the possible kinematics of faults and evaluate evidence for fault activity through time.
We further quantify vertical separation (Vsep) in two-way travel time (TWT) across selected horizons, following the approach of [13], and construct time-structure maps to examine the spatial distribution of deformation and variations in fault separation. The integrated multi-resolution seismic reflection datasets allow us to investigate fault geometries and vertical separation patterns across four interpreted stratigraphic horizons, extending from the acoustic basement to the Holocene.
Figure 1.
(a) Tectonic setting of the North Anatolian Fault (NAF) system in NW Turkey (after [14]). (b) Basin and structural settings map of the Marmara Sea in NW Turkey. The base map is from [15]. Holocene and late Quaternary active fault segments are in red, based on [11,16,17,18]. (c) The borders of the study area. Faults in Erdek Bay are mapped in this study. (d) Map showing earthquake epicenters in Erdek Bay and its vicinity between 2002 and 2026. Red filled circles, labeled by year CE (Common Era), are historic M6.8 and larger earthquake epicenters from [19]. Focal mechanisms for close to 123 earthquakes are from [20]. The focal mechanism solution in the southern part of Erdek Bay (Mw 3.0, 2016) is discussed in Section 5.2.2. The black dot shows the location of the source centroid from the studies of [21]. Centroid Moment Tensor (CMT) solutions show that the focal mechanism shows strike-slip motion with a normal fault component. Other earthquake epicenters are from the AFAD website. (e) The simplified geology map belonging to the southern Marmara fault in Erdek Bay is modified [22,23]. (The red fault KES (Kapıdağ Edincik Segment) is modified in this map according to [16] and our fault map.) Sinekçi fault is from [24], which is a strike-slip fault with a reverse component.
The resulting distributed and segmented fault pattern raises an important question: Did the fault system develop progressively within the NAF-C, or did pre-existing structures influence its development? The age constraints provided by correlated seismic horizons are used to evaluate the development and activity of this fault system through time. This approach provides new insights into the spatial distribution, segmentation, and longer-term structural evolution of the Erdek Bay fault system since the early Pliocene.
2. Geological and Tectonic Settings
The study area encompasses semi-enclosed Erdek Bay, located on the southwestern shelf of the Sea of Marmara. The Marmara Sea lies between the Black and Aegean Seas, to which it is connected through the Bosphorus and Dardanelles straits, respectively [25,26]. Erdek Bay is bounded by the Kapıdağ Peninsula to the east, which separates it from Bandırma Bay; the Biga Peninsula to the west; the islands of Avşa and Paşalimanı to the north; and the coast of Balıkesir Province to the south.
Erdek Bay is ~49 km long and 21 km wide. Water depths generally range from 10 to 40 m, reaching a maximum of ~55 m in the western sector. Depths were calculated using a water-column velocity of 1500 m/s. Compared with the Bandırma and Gemlik basins, Erdek Bay is shallow and has more uniform bathymetry (Figure 1c). The morphology of Erdek Bay is consistent with that of the broader southern Marmara shelf, whose present-day morphology largely developed during the Holocene [27], with the most recent marine transgression playing an important role. Sea-level fluctuations also influenced the region’s deltas, particularly those of the Biga and Gönen rivers. Relict deltas at elevations of 4–6 m mark Holocene high sea-level stands [28]. The Gönen River delta is prograding in the Erdek Bay. It developed within an area bounded by basement rocks, in front of active fault scarps associated with the dextral Edincik–Bandırma Fault and the Sarıköy Fault [29]. These faults have influenced the Gönen River drainage network, with uplift between them contributing to the development of an ~8 km-long antecedent valley with incised meanders [30]. Beneath these Holocene morphological features, the underlying bedrock records a longer tectonic history. In the Southern Marmara region, the Erdek, Bandırma, and Gemlik bays are prominent coastal features. The bedrock unit exposed near the Kapıdağ Peninsula is dissected by the Kocasu River, reappearing further along and extending onto the Armutlu Peninsula. This bedrock forms an uplifted structure related to the North Anatolian Fault (NAF) [12,31] (Figure 1). The steep uplifted coastlines between the Kapıdağ Peninsula (+803 m above sea level) and the Armutlu Peninsula (+903 m above sea level) (Figure 1) are largely fault-controlled [12].
The onshore sedimentary sequence ranges from Miocene to recent. The pre-Miocene basement is made up of Cretaceous metamorphic rocks and Paleogene sedimentary units. The basement is distributed over a broad area along the coastal region: the Marmara Islands, Kapıdağ and Karabiga, and Karadağ (Figure 1e). This basement is overlain by Lower–Middle Miocene volcanic and Upper Miocene-Pliocene sedimentary units behind the coastal mountains. Holocene alluvial units dominate along the region’s rivers and around Lakes Manyas. In the study area specifically, Lower Miocene and younger deposits unconformably overlie the pre-Miocene to Miocene basement exposed on Marmara Island and the Karabiga and Kapıdağ Peninsulas (Figure 1e) [12].
The westerly motion of Anatolia, with respect to Eurasia and Africa, caused a great change in the tectonic evolution of the eastern Mediterranean, giving rise to the Aegean extensional regime and to internal deformation of Anatolia [5]. The NAF is a relatively narrow, simple transform fault zone, ~1500 km long, accommodating nearly all of the current relative displacement between the Eurasian and the Anatolian plates (e.g., [32,33]). Toward its western end, it splits into three branches-the Northern Branch (NAF-N), the Central Branch (NAF-C), and the Southern Branch (NAF-S), each comprising numerous individual fault strands (Figure 1d).
Despite ongoing debate over its kinematics, the NAF-N is associated with three bathymetric basins up to 1200 m deep, formed by transtensional tectonics (e.g., [3,7,14,22,33,34,35,36,37,38,39]). Additional sediment-filled deep basins occur on the southern shelf of the Marmara Sea; according to [4], some of these may represent older, abandoned basins. The NAF-C splays from the main branch of the NAF east of the Marmara Sea and strikes WSW toward Gemlik Bay [40] (Figure 1b). It then further splits westward into a fan pattern of numerous Holocene active and Late Quaternary strands on the southern shelf of the Marmara Sea [11,41]. Figure 1 shows, in red, the mapped three long strike-slip faults and numerous smaller discontinuous faults on the southern shelf by Ref. [11]. Most of the mapped faults on the southern shelf of the Marmara Sea have been active during the last few hundred thousand years. Smaller, discontinuous fault strands also occur in Erdek Bay.
3. Data and Methods
3.1. Acquisition and Processing of the Multi-Resolution Seismic Reflection Data
The data set was collected by a bilateral cooperation TUBİTAK-NSF Project named SoMar (SOuthern MARmara). We carried out two geophysical cruises in 2013 and 2014 using the R/V K. Piri Reis and the R/V Dokuz Eylül 1 of Dokuz Eylül University.
In this study, we used three sets of seismic reflection data from five surveys with different resolution and penetration (Table 1). Chirp and Multichannel Seismic reflection data were collected simultaneously along the same profile in 2013 onboard R/V K. Piri Reis. Single-channel Sparker data were collected in 2014 onboard R/V Dokuz Eylül 1 of Dokuz Eylül University. Another data set is PirMamara, which was acquired within the scope of the European Sea Observation Network of Excellence project (ESONET-Marmara DM), supported by the EU 6th Framework Program, onboard R/V K Piri Reis in 2010. Figure 2 shows all the datasets we used for mapping.
Table 1.
Data acquisition parameters for multi-resolution data sets.
Figure 2.
Location of all multi-channel seismic reflection, CHIRP, and sparker seismic reflection lines that are used in this study. Green lines are MTA97 data, and we used these data as processed by [42]. Purple lines are Marathon data collected by C&K Petroleum Inc. Houston, TX, USA.
Data processing was done in the Seismic Laboratory of Dokuz Eylül University, Institute of Marine Sciences and Technology. Processing steps of the 2013 high-resolution MCS data were data loading and geometry definition, minimum-phase band-pass filtering (8 to 200 Hz), top mute, F-K filtering, surface-related multiple elimination (SRME), sorting to CDP gathers, velocity analysis, NMO correction and stacking, and post-stack Kirchhoff time migration and amplitude recovery AGC. These processing steps have improved the vertical resolution to 4 m as far down as 1–2 km sub-bottom (for a velocity of 1800 m/s).
Processing steps for 1997 data are ormbsy minimum phase band-pass filtering (3–5–80–120 Hz), amplitude recovery, CDP gathers, seafloor picks, velocity analysis, multiple suppression, NMO correction and stacking, Stolt F-K migration, and seafloor mute [42].
The processing steps that were applied to raw CHIRP data during acquisition are delay time correction, amplitude recovery, de-chirping and amplitude envelope calculations.
The processing steps that were applied to Sparker data were data loading, trace header math, geometry definition, band-pass filtering, amplitude recovery AGC, Mute, Trace mix, and constant velocity Migration.
Part of the SoMar seismic dataset was previously used in [11] for a regional investigation of Late Quaternary fault activity across the southern Marmara shelf. Ref. [11] presented a regional fault map of the southern Marmara shelf, including Erdek Bay, and investigated Late Quaternary fault activity over the last ~500 ka. The present study has a different scope, focusing on the deeper fault architecture and longer-term tectonic evolution of Erdek Bay. Specifically, we (1) interpret the MCS data over their full penetration depth to the acoustic basement; (2) establish a pre-Quaternary seismic-stratigraphic framework by correlating the base-Pliocene and near-base-Quaternary horizons with the Doluca-1 well-tied section of [4]; (3) quantify vertical separation across successive horizons and construct time-structure maps; (4) integrate sparker data and additional MCS profiles from the PirMarmara 2010, MTA 1997, and Marathon datasets; and (5) provide earthquake moment magnitude estimates for H1-offsetting fault segments in Erdek Bay, which were not evaluated in [11].
3.2. Seismic Age Correlation
Based on the interpretation of seismic data, three horizons and the top of the acoustic basement were identified (on the basis of reflection continuity, amplitude, and their ability to be correlated between seismic profiles (Figure 3)). Only horizons that could be confidently traced through the seismic dataset were used. From shallow to deep, the horizons are named H-1 to H-3. The age information for the interpreted seismic horizons is provided in Table 2.
Figure 3.
(a) MCS profile showing interpreted seismic units. The inset map shows the seismic lines used for stratigraphic correlation from south of the Kapıdağ fault into eastern Erdek Bay. (b) Enlarged view of the area outlined by the black dotted rectangle in Figure 3a. The light-blue horizon marks an angular unconformity correlated with the near-base-Quaternary horizon in the section presented by [4]. The dark blue horizon is interpreted as the base Pliocene. (c) Modified schematic representation of the TPAO seismic section from [4], showing the horizons correlated in this study. The location of this NW–SE-oriented profile is shown in the inset map as the green line labeled 102. The well in the northern part of the section penetrates Middle Miocene units, with the Pliocene succession interpreted as eroded at this location.
Table 2.
Interpreted seismic horizons in the study area and their age information.
Red horizon H1 is a high-amplitude reflection identified in the CHIRP and sparker data and corresponds to the transgressive surface mapped by [11]. H1 corresponds to the base marine transgression unconformity (Q1) of [11]. We follow the ~9 ka age assigned to the transgressive surface in Erdek Bay by [11], based on its present depth of ~40–45 m and a eustatic sea-level curve. This age represents an approximate transgressive age rather than a synchronous age across the entire surface, because the timing of marine flooding varies with water depth. H1 was not resolved in the MCS data and is therefore presented on the CHIRP and Sparker profiles in Section 4.
Two other major unconformities are interpreted in our MCS data. The upper unconformity is an angular unconformity (Figure 3b). A section from [4] crossing over the Doluca-1 well interprets Pleistocene above and Middle Miocene below. We used an MCS conventional line to correlate horizons across our MCS data (Figure 3a). So Pleistocene-age deposits are interpreted over an angular unconformity (Figure 3b). Our light blue horizon (H2), which is the base of these sediments, is interpreted as near-base Quaternary on the seismic section of [4] given in Figure 3c.
The basement horizon is interpreted due to its high-amplitude reflections and southward thickening of sediments by faults. The basement horizon is interpreted to be an erosion surface. Doluca-1 drill hole [4] (Figure 3b) penetrated a Middle Miocene Formation described as Gazhandere and reached the basement immediately below it at a depth of 800 m.
Here, our acoustic basement is likely a rock basement similar to rocks on land nearby (Figure 1d). The pre-Miocene basement is made up of Cretaceous metamorphic rocks and Paleogene sedimentary units. The basement is distributed along the coastal region: the Marmara Island, Kapıdağ, Karabiga, Avşa, and Paşalimanı islands (Figure 1e).
We correlated base Pliocene (H3) and near-base Quaternary horizons (H2) by cross-correlating grids of MCS data. In Figure 3, the inset shows the location of the correlation line. We also used other lines in correlation (Figure 2). No borehole is available within Erdek Bay. The ages of H2 and H3 are therefore based on correlation with the Doluca-1 well-tied regional section of [4]. The horizons were traced from the vicinity of the well into Erdek Bay along NW–SE-oriented profiles: the conventional MTA97 MCS profile (green line in Figure 2), shown in Figure 3, and three parallel PirMarmara 2010 profiles (gray lines in Figure 2), which were used for stratigraphic correlation but are not reproduced here because of restrictions on their publication. These profiles extend from close to the Doluca-1 well into the study area and allow the horizons to be traced continuously through intersecting profiles. Because none of the profiles pass directly over the well (the closest PirMarmara profile lies ~2 km from Doluca-1), the ages of H2 and H3 should be regarded as approximate. This correlation is supported by the distinctive character of the horizons, in particular the angular unconformity at H2. The main interpretations of this study, including the relative timing of fault activity and the increase in vertical separation toward older horizons, depend primarily on the stratigraphic order of the horizons rather than on their absolute ages. The base Pliocene horizon is interpreted as merging with the acoustic basement south of the Kapıdağ fault and mostly in the eastern and central parts of Erdek Bay, which is illustrated on the seismic lines presented also in Section 4. We interpret it to be above the basement based on high-amplitude reflections, erosion and thickening of the sedimentary section southward across faults (Figure 3).
3.3. Fault Mapping and Interpretation Reliability
We identified faults on seismic reflection profiles from reflector discontinuities and vertical separation of seismic horizons. We used Kingdom Suite seismic interpretation software to interpret and map the faults. Lateral continuity was evaluated by correlating fault interpretations between adjacent profiles based on their spatial positions, reflector discontinuities, and vertical separation patterns. The software displays projected positions of previously interpreted faults on neighboring profiles as dashed lines. These projections were used as an additional check of geometric consistency rather than as the primary criterion for fault identification. All mapped faults were identified on at least two seismic profiles, providing constraints on their lateral continuity and mapped traces. Where available, complementary MCS, Sparker, and CHIRP datasets were jointly evaluated to improve the reliability of fault identification and mapping.
Seismic coverage varies across the study area and along individual fault traces. Different portions of the mapped faults are therefore constrained by different combinations of seismic datasets. Figure 4d shows the seismic profile distribution and color-codes fault segments according to the datasets supporting their interpretation, illustrating the spatial variation in seismic data coverage. Where deeper-penetrating MCS coverage is unavailable, downward continuation toward the acoustic basement is inferred rather than directly observed.
Figure 4.
(a) Fault map of Erdek Bay derived from seismic data, modified from [43]. The Kapıdağ and İmralı faults are from [11]. Fault colors correspond to those used in the interpreted seismic reflection profiles. Individual fault strands are labeled using the abbreviations Bf, Gf, Cf, and Nf, as shown on the map. Ef is the Edincik fault. Arrows indicate possible strike-slip motion; the slip directions of individual offshore faults are not uniquely constrained by the available seismic data. Numbers indicate vertical separation (Vsep) values greater than 30 ms TWT measured across the acoustic basement horizon along individual faults. (b) Fault segments with acoustic basement Vsep values greater than 30 ms TWT are shown in red. (c) Locations of the seismic profiles presented in the figures, labeled with the corresponding figure numbers. Red lines indicate sparker profiles. (d) Distribution of seismic survey lines and mapped faults in Erdek Bay. Black lines indicate faults mapped using MCS and CHIRP data, with additional Sparker coverage in some areas, whereas yellow lines indicate faults mapped using CHIRP and/or Sparker data only. This distinction illustrates the spatial variation in seismic data coverage supporting the fault interpretations.
In this study, fault activity was assessed from apparent offsets of H1, corresponding to Q1 of [11], and disruption of the overlying sediments. H1 offsets and reflector discontinuities were checked for consistency on at least two adjacent CHIRP or sparker profiles. In areas affected by acoustic masking, possibly associated with shallow gas, H1 offsets were interpreted cautiously because reflector continuity may be obscured. Apparent vertical separations of ~1 ms TWT or greater were considered quantitatively resolved in the CHIRP data, based on their nominal vertical resolution. Smaller apparent separations were treated as tentative evidence of deformation and were not used to calculate vertical separation rates. Where H1 is clearly imaged but shows no fault-related offset or disruption, no resolved evidence of post-H1 activity is identified; where H1 is not imaged above the fault, activity is considered undetermined.
4. Results and Interpretations
4.1. Mapped Horizons and Faults
This section presents the identification of faults and seismic-stratigraphic horizons in Erdek Bay through the integrated interpretation of multi-resolution seismic reflection datasets, including CHIRP and Sparker data for shallow subsurface imaging and multichannel seismic reflection (MCS) data for deeper fault imaging and stratigraphic correlation.
Key seismic-stratigraphic horizons were identified and correlated within the available seismic datasets. The mapped faults were then classified according to the stratigraphic horizons they offset: (1) acoustic basement, (2) base-Pliocene horizon (H3), (3) near-base-Quaternary horizon (H2), and (4) ~9 ka horizon (H1). The complementary seismic datasets were jointly interpreted to investigate fault geometry at different depths, while the identification of faults affecting the youngest sediments relied primarily on CHIRP and Sparker data (Figure 4). Time-structure maps were used to evaluate fault geometries and the spatial distribution of deformation across the interpreted seismic horizons. The integrated seismic datasets allowed us to investigate whether the mapped faults are confined to shallow stratigraphic levels or extend into deeper structures. In several seismic profiles, individual faults could be traced from shallow to deeper stratigraphic levels, demonstrating their vertical continuity where data coverage and imaging quality permitted. Together, the seismic profiles and time-structure maps helped constrain the lateral continuity and spatial distribution of the mapped faults. The fault map of Erdek Bay is presented in Figure 4.
A distributed fault system comprising multiple segmented and curved fault strands was identified in Erdek Bay (Figure 4a). The mapped faults exhibit variable orientations, including NW–SE, WNW–ESE, and E–W trends. Additional NNW–SSE and NW–SE trending faults were identified in the western part of the study area, near the Çanakkale Strait. In the southeastern part of Erdek Bay, the faults are predominantly WNW–ESE trending and form short, discontinuous segments. In areas where MCS data were unavailable, fault interpretations were based on Sparker and/or CHIRP seismic profiles. Although these faults were inferred to extend downward to the acoustic basement, their continuation to this depth could not be directly verified.
The NE–SW-trending fault near the southeastern shoreline of Erdek Bay was identified in the Sparker data, as MCS coverage is unavailable in this area. Previously interpreted as a strike-slip structure [12], it is referred to here as the Kapıdağ–Edincik Segment (KES) (Figure 4). In our Sparker profiles, it exhibits normal separation with downthrow to the north and trends approximately parallel to the southeastern coastline. Several mapped faults extend toward and appear to intersect the KES fault near the southeastern shoreline (Figure 4), although their structural relationships remain uncertain. The KES fault appears to continue eastward into Bandırma Bay. The fault map also shows the Kapıdağ fault striking towards the Çanakkale Strait. Changes in the direction of vertical separation along the Kapıdağ Fault, documented in seismic profiles by [11], are consistent with the right-lateral strike-slip interpretation proposed in that study. In Erdek Bay, the high density of closely spaced fault strands makes it challenging to trace the lateral continuity of individual faults.
Selected seismic profiles from datasets with different resolutions are presented to illustrate fault geometries and their relationships with the interpreted stratigraphic horizons. The variations in Vsep across the interpreted horizons are examined in the following sections. Vertical separation (Vsep) is defined here as the difference in two-way travel time (TWT) of the same stratigraphic horizon on opposite sides of a fault, following the approach of [13].
In the southern part of the bay, faults offset H3 and the acoustic basement, which deepen southward in a step-like geometry (Figure 5, profile GM13-28). In the southern portions of the examined profiles where both horizons can be distinguished, vertical separation across the acoustic basement exceeds that across H3 (Figure 5 and Figure 6). Vertical separation across H2 is smaller than across the underlying horizons, indicating less pronounced fault-related deformation at this stratigraphic level.
Figure 5.
(a) Interpreted MCS section of profile GM13-28. The profile location is shown in the inset map at the bottom right. Several faults exhibit larger vertical separations at the acoustic basement horizon than at shallower horizons. The faults are steeply dipping to nearly vertical. The apparent dip of fault Gf4, calculated from the seismic section at the H3 horizon using an assumed velocity of 2000 m/s, is ~80°. Local folding is observed between faults Gf4 and Gf5. (b) CHIRP profile corresponding to the area indicated by the red dashed rectangle in (a). The ~9 ka horizon (H1), correlated with [11], is imaged at ~50–54 ms TWT and is offset by Gf3, Gf4, Gf5, and Gf8. Fault traces on the CHIRP profiles are shown schematically as vertical lines because their dip directions cannot be reliably constrained by the limited penetration of the data. (c) Comparison of vertical separation (Vsep) across three horizons along Gf6. Vsep is greatest at the acoustic basement, followed by H3 and H2.
Figure 6.
(a) MCS profile GM13-29. The inset shows the location of the seismic profile. The red line indicates the coincident MCS and CHIRP profiles, whereas the yellow line represents the Sparker profile. Faults Nf, Cf, Gf7, and Gf2 are interpreted to offset the yellow horizon, where H3 and the acoustic basement coincide. Faults Gf6, Gf5, and Gf4 exhibit prominent vertical separations in the central part of the profile. The acoustic basement deepens southward, and the H3 horizon onlaps onto it. Fault Cf exhibits a southward throw and a change in dip direction with depth. (b) CHIRP profile showing faults offsetting H1 and (c) Sparker profile showing the same faults offsetting H1 and other deeper undated horizons. A gas front obscures part of the subsurface near the south end of the profile.
On the chirp profile (Figure 6b), several faults are interpreted to offset the 9ka horizon (H1). The high-resolution CHIRP data allow us to assess whether the faults extend upward and deform the shallowest stratigraphic units, providing evidence of post-H1 fault activity. Water depth decreases southward, as also observed in Figure 5b. The vertical separation of H1 varies between the two profiles. In Figure 5b, faults Gf3, Gf4, Gf5, Gf8 and Nf offset H1, whereas Gf6 and Gf7 show no observable vertical separation at this horizon. In Figure 6b, faults Gf2, Gf4, and Gf9 offset H1, whereas Gf5 and Gf7 terminate below this horizon. A change in dip direction with depth is observed along fault Cf on the MCS profile (Figure 6a). This fault also exhibits a reversal in the direction of vertical separation of the same stratigraphic horizon between two parallel seismic profiles. To illustrate the characteristics of the integrated seismic data set, representative MCS, CHIRP and Sparker profiles are presented in Figure 6. The coincident MCS (GM13-29) and CHIRP profiles, together with a Sparker profile, allow comparison of datasets with different resolutions and penetration depths. The MCS profile has limited resolution for identifying faults offsetting the Holocene horizon compared with the CHIRP and Sparker profiles. The acoustic basement deepens southward, and horizon H3 progressively onlaps onto it. The Sparker profile shows that several faults offset the ~9 ka horizon (H1, Figure 6c). However, Gf6, the black and Gf8 do not show observable vertical separation at H1 on this profile. The penetration depth of the Sparker data along this profile is approximately 100 ms two-way travel time, corresponding to ~75 m, assuming a sediment velocity of 1500 m/s. Vertical separation along fault Gf2 is clearly visible in the southernmost part of the Sparker profile. Sedimentary reflections in the southern part of the profile are locally obscured by acoustic masking, possibly associated with shallow gas. The CHIRP profile images the shallow subsurface at high resolution, with penetration of ~10–25 ms TWT below the seafloor (~7.5–18.8 m, assuming a sediment velocity of 1500 m/s; Figure 6b). This profile allows the identification of faults offsetting the H1 horizon and assessment of whether these faults extend upward to the seafloor. Sediments overlying H1 appear to thicken southward, possibly reflecting high sedimentation rates near the Gönen delta.
Figure 7 shows the southern part of Line GM13-21. The most prominent feature is the marked change in the geometry and thickness of the sedimentary section between the SSW and NNE parts of the profile. The acoustic basement deepens toward the central part of the profile and becomes shallower toward the NNE. In contrast, horizon H2 is relatively smooth and continuous compared with the acoustic basement. Fault Bf3 exhibits a vertical separation of approximately 327 ms (TWT) across the united H3–acoustic basement horizon (yellow reflector) in the southwestern part of the profile, with sedimentary reflections dipping toward the fault. The sediments dip toward this fault. Along this profile, H3 and the acoustic basement horizon coincide and are interpreted as a single, united reflector; the acoustic basement horizon appears to represent an erosional surface. The dark blue fault (fault Bf4) also exhibits prominent vertical separation across these horizons, where the acoustic basement is relatively shallow in this area.
Figure 7.
Southern part of MCS profile GM13-21, along the Biga faults (Bf1 and Bf3). The unassigned fault is shown in black, and fault Cf is in the SSW part of the profile, trending NNW-SSE on the fault map (Figure 4). These faults coincide with marked changes in the geometry and thickness of the sedimentary succession between the SSW and NNE parts of the profile.
Along the MCS line GM13-32 (Figure 8), horizon H3 is strongly deformed, particularly in the southwestern and central parts of the profile. The acoustic basement exhibits greater separation in the southwestern part of the profile (Figure 4a). The southeastward continuation of the faults could not be traced due to sparse seismic data coverage.
Figure 8.
SW-NE oriented MCS profile GM13-32 showing the united H3–acoustic basement horizon (yellow reflector). Greater vertical separations are observed at faults across Bf1 and Bf3. The acoustic basement is relatively shallow in this area and becomes progressively shallower toward the northeast.
In Figure 8, the acoustic basement becomes shallower towards NE, with sedimentary reflections onlapping onto this horizon. In the northern part of Erdek Bay, near the islands bordering the bay (Figure 5 and Figure 6), relatively small vertical separations are observed across some faults. These smaller separations may indicate a younger onset of deformation or a shorter period of displacement accumulation in this area. Alternatively, erosion during past sea-level low stands may have removed part of the stratigraphic record of earlier fault deformation, reducing the preserved vertical separation across the faults. In the shallow southeasternmost Erdek Bay, where MCS profiles are unavailable, faults are interpreted from Sparker and CHIRP sections. Sparker profile SP47 shows several faults offsetting the H1 horizon, including fault Gf3, which also offsets the seafloor (Figure 9a).
Figure 9.
(a) Sparker line SP 47, showing Gf3 offsetting the H1 horizon and seafloor. Sedimentary reflections in the southern part of the profile, in front of the Gönen delta, are partly obscured by acoustic masking, possibly associated with shallow gas. (b) SP-44 Sparker profiles showing the SW-NE striking Edincik fault (red), as named in [16] (see Figure 4 for location). Differences in seismic facies across the fault may be consistent with a strike-slip component. Although seismic sequences were identified along this profile, they could not be reliably correlated with those in the northern part of the study area due to the absence of intersecting tie lines connecting the Sparker profiles.
In this area, the pre-Holocene sediments deepen and thicken southwards. This pattern may reflect sediment accumulation associated with the proximity of the Gönen Delta (Figure 1d), together with accommodation space created by the vertical component of displacement along fault Gf3. Sparker profile SP44 (Figure 9b) images the Edincik Fault, which is mapped along the shoreline in the easternmost part of Erdek Bay, where only Sparker profiles are available. The H1 horizon occurs deeper in this area, possibly reflecting increased accommodation associated with deformation along the Edincik Fault. Water depth, however, is relatively shallow in this part of the bay. The E–W- to WNW–ESE-striking curved fault strands, herein referred to as the Gönen faults (Gf1–Gf8), are shown in Figure 4a. Some of these faults offset the ~9 ka horizon (H1), indicating post-H1 fault activity (Figure 10).
Figure 10.
E–W-oriented CHIRP profile showing sediments between the seafloor and the ~9 ka horizon (H1), with a thickness of up to 40 ms TWT (~30 m, assuming a sediment velocity of 1500 m/s). The Gönen faults Gf2 and Gf3 offset both H1 and the seafloor. The red line marks the H1 horizon, while the colored lines indicate interpreted faults. M indicates multiple reflections.
4.1.1. Vertical Separation of Faults on the Acoustic Basement
We acknowledge that the relative horizontal and vertical components of slip on an individual fault may vary through time and that the stratigraphic horizons used for displacement analysis are not perfectly horizontal. These factors may influence the measured vertical separations, which are expressed in two-way travel time (TWT), primarily along the acoustic basement horizon.
Vertical separations are reported in TWT because the interpretations presented here rely on relative comparisons of Vsep along strike and between successive horizons. Vsep can be converted to meters as ΔZ = V × ΔT/2, where ΔZ is vertical separation in meters, ΔT is vertical separation in seconds TWT, and V is the assumed interval velocity. Assuming V = 1800–2200 m/s, the measured basement separations of 31–327 ms TWT correspond to approximately 28–360 m. This velocity range introduces a ±10% variation in converted separation relative to the reference velocity of 2000 m/s. If seismic velocity increases with depth, the observed increase in vertical separation toward older horizons may be more pronounced when expressed in meters rather than in TWT. A velocity of 1500 m/s is used for shallow sediments imaged by CHIRP and Sparker data, and 2000 m/s for the apparent dip of fault Gf4 (Figure 5). Using 1800 rather than 2000 m/s changes the calculated apparent dip of Gf4 from ~80° to ~79°. The estimated vertical resolutions of the datasets are approximately 4–5 ms TWT for MCS, 1.25 ms for Sparker, and ≤1 ms for CHIRP. These values provide an indication of the scale of vertical separations that can be resolved, although the uncertainty of individual Vsep measurements also depends on reflector continuity and imaging quality.
Vertical separation across the acoustic basement varies along individual faults (Figure 4a). In general, smaller vertical separations are observed across shallower stratigraphic horizons than across deeper horizons. Vertical separation across the acoustic basement is consistently greater than that across H2, where both horizons are resolved, and their separations can be measured. In most, but not all, profiles where H3 and the acoustic basement can be distinguished, vertical separation across the acoustic basement is also greater than that across H3 (representative examples in Figure 5, Figure 6 and Figure 7).
The largest vertical separations are observed along the WNW–ESE-trending fault in central Erdek Bay, which bounds a depression in the acoustic basement, and along the Biga faults in the westernmost part of the bay (Figure 4a and Figure 8). Figure 4b illustrates the spatial distribution of fault segments with vertical separations greater than 30 ms TWT on the acoustic basement horizon, shown in red. In areas where the acoustic basement is shallower, the vertical separations are generally smaller or not clearly observed (Figure 4b). (Figure 4b). The smaller separations along the black faults may indicate relatively younger fault activity or lower rates of vertical displacement. However, differences in vertical separation alone do not uniquely constrain fault age or slip rate.
4.1.2. Time Structure Maps of Interpreted Horizons
Time structure maps of the four interpreted seismic horizons are presented in two-way travel time (TWT), measured from sea surface to each horizon (Table 2) (Figure 11a–d). These maps illustrate the structural configurations of the acoustic basement (AB), H3 (base Pliocene), H2 (near base Quaternary), and H1 (~9 ka) horizons and their relationships with the mapped faults.
Figure 11.
Time-structure maps showing two-way travel time (TWT) from the sea surface to the interpreted seismic horizons. The color scales represent TWT values in seconds (s). (a) Acoustic basement (AB). (b) Base–Pliocene horizon (H3). (c) Near-base-Quaternary horizon (H2). (d) ~9 ka horizon (H1). Faults offsetting each horizon are shown as solid black lines.
Owing to their close stratigraphic proximity, the acoustic basement and H3 horizons exhibit broadly similar structural patterns, characterized by a pronounced depression in the southern part of Erdek Bay. The margins of this depression are marked by steep structural faults where the horizons become abruptly deeper.
The most prominent faults are located in the central part of the study area and exhibit predominantly down-to-the-south throws (Figure 5 and Figure 7). This pattern is also evident in the time-structure maps of the acoustic basement and H3 horizons (Figure 11a,b). The geometry of the acoustic basement is largely controlled by these southward-throwing faults (Figure 11a).
The acoustic basement represents the deepest interpretable horizon within the penetration range of the seismic data and is characterized by a high-amplitude reflection. The time-structure map reveals a pronounced basement depression in the southern part of the study area (Figure 11a). The northern margin of the depression is bounded by a long WSW-ENE-trending fault, whereas several WNW–ESE-trending, subparallel fault strands are mapped in the eastern part. Near the western entrance of Erdek Bay, the NNW–SSE-trending Biga faults (Bf2, Bf3, and Bf4) are associated with marked variations in basement relief, producing an elongated depression. The largest vertical separation on the acoustic basement (327 ms TWT) is observed along Bf3, while large separations also occur along several faults in the southern half of Erdek Bay (Figure 4a and Figure 7). The acoustic basement becomes progressively shallower toward the north, indicating that its southward deepening geometry is largely controlled by fault displacement (Figure 11a).
The H3 horizon overlies the acoustic basement and locally overlaps its irregular surface as observed in seismic sections. Large vertical separations are also observed along faults in the northwestern part of the study area. The H3 horizon reaches its greatest TWT depth in the southern part of the area, where it deepens across a WSW-ENE trending fault. In the eastern part of the area, the Gönen faults (Gf4, Gf5 and Gf6) bound areas where the horizon deepens, whereas both H3 and the acoustic basement are relatively shallow farther east (Figure 11a,b). Vertical separations across both horizons indicate fault displacement affecting the base-Pliocene horizon. The larger vertical separation on H3 relative to H2 suggests that part of the displacement accumulated during the Pliocene, before the formation of the near-base-Quaternary horizon.
The vertical separations on the H2 horizon are relatively small compared to those on the deeper horizons, although numerous faults offset this horizon (Figure 11c). Correlating individual fault strands between profiles remains challenging because of their discontinuous and segmented map-view geometry. The H2 horizon progressively deepens from the northern toward the central and southern parts of the study area, reaching its maximum TWT depth in the south. In the eastern part of Erdek Bay, the Gönen faults bound areas of greater horizon depth. The horizon also deepens in the northwestern part of the study area, near the entrance to Erdek Bay, whereas it remains relatively shallow offshore Biga.
H1 horizon is relatively smooth and nearly horizontal throughout much of the study area (Figure 11d). However, it deepens in the southeastern part of the area, near the isthmus part of Kapıdağ Peninsula, where several Gönen faults offset the horizon. The time structure reveals relatively short fault segments exhibiting vertical separation, particularly in the eastern part of the study area. Southeast of the Gönen delta, local variations in H1 relief are observed across the mapped faults. In the seismic profiles shown in Figure 9a,b, the seafloor becomes shallower toward the south, whereas H1 deepens in the same direction, indicating an increase in post-~9 ka sediment thickness. This pattern is consistent with enhanced sediment accumulation near the Gönen Delta and may also reflect fault-related accommodation space associated with the Gf3–Gf7 faults. Based on the gently sloping submarine topography of Erdek Bay, ref. [29] suggested the possible existence of a submarine valley, likely formed during the last sea-level low stand in the Marmara Sea region and representing the former Gönen River valley extending northeastward.
Taken together, the time-structure maps reveal a southward-deepening structural depression bounded by multiple faults with predominantly southward throws. This pattern is most prominently expressed on the acoustic basement and H3 horizons, whereas vertical separations are generally smaller on H2 and H1. The decrease in vertical separation toward younger horizons, observed in most profiles where successive horizons can be distinguished, together with fault offsets affecting H1, suggests a prolonged history of fault activity extending from the Pliocene into the Holocene, although the continuity of fault activity throughout this interval cannot be established. The curved geometries of some fault strands, together with their discontinuous and segmented distribution, are consistent with a distributed fault system, whose possible kinematics and evolution are discussed further in Section 5.2.
5. Discussion
5.1. Multi-Scale Seismic Imaging and Its Implications for Fault Architecture
Integrating multi-resolution seismic datasets increases confidence in fault interpretation by combining observations from different depths and resolutions. While MCS data provide critical information on deep fault geometry and basement deformation, CHIRP and Sparker datasets are necessary to resolve shallow fault offsets and recent deformation. This integration therefore provides more than improved imaging at different depths and resolutions; it links shallow deformation to deep structures and provides a basis for reassessing previous interpretations of fault geometry and possible kinematics. CHIRP data, with the highest resolution (50–75 cm in our data; Table 1), resolve small vertical offsets at the seafloor and across the ~9 ka horizon (Figure 6), but cannot image fault roots at depth. Sparker data provide intermediate penetration, imaging structures in detail to depths of 100–150 m (Figure 6), thereby bridging the shallow CHIRP observations and the deeper MCS record. MCS data resolve fault geometry to ~1.3 s (TWT), including faults extending to and offsetting the acoustic basement, although their resolution is limited near the seafloor. Together, these datasets provide a seismic framework extending from Holocene sediments to the pre-base-Pliocene acoustic basement (Figure 6 and Figure 11).
The principal contribution of the MCS dataset lies in its greater penetration depth, which extends structural interpretation beyond the depth range resolved by CHIRP and Sparker data and enables vertical separation to be quantified across multiple stratigraphic horizons. Figure 12 presents a 3D conceptual representation of the interpreted fault architecture, illustrating the complementary imaging ranges of different seismic datasets and highlighting the improved characterization of shallow-to-deep fault structures compared with previous studies.
Figure 12.
Conceptual 3-D representation of the multi-scale seismic imaging of the Erdek Bay fault system. The model illustrates the complementary penetration ranges of shallow CHIRP data, Sparker data, and MCS data used in this study relative to previous shallow seismic investigations [12]. Fault traces affecting the H1 (~9 ka) and H2 (near-base-Quaternary) horizons are shown in map view at their mapped positions, whereas fault geometries affecting the H3 (base-Pliocene) horizon and acoustic basement are represented at depth. The conceptual 3D model incorporates fault traces at their mapped positions on the corresponding time-structure maps. The colored fault surfaces retain their interpreted horizontal and vertical geometries derived from seismic interpretation software. Geographic coordinates are provided for spatial reference. The vertical axis is not to scale: the vertical spacing between stratigraphic horizons is schematic and does not represent a uniform TWT or depth scale. The actual TWT distributions of the interpreted horizons are shown in the corresponding time-structure maps (Figure 11a–d). The integration of these datasets enables deformation to be evaluated from the shallow Holocene succession to the acoustic basement.
Previous seismic investigations in Erdek Bay were limited by the relatively shallow penetration of the available seismic data. Using seismic data with penetration depths ranging from a few meters to ~60 m in fine-grained sediments, Ref. [12] interpreted the deepest resolvable reflector as the acoustic basement, assigning it an approximate age of 30 ka.
They also identified NW–SE-trending normal faults that were interpreted as not affecting the overlying late Pleistocene–Holocene sedimentary units (C2 and C3 in their stratigraphic framework). In contrast, our integrated seismic datasets reveal deeper fault continuations and larger vertical separations across older stratigraphic horizons, while CHIRP data document offsets of the ~9 ka (H1) horizon along some fault strands. These observations provide additional constraints on fault architecture, recent activity, and possible fault kinematics. Previous investigations of the southern Marmara shelf have also been constrained by differences in seismic data resolution and penetration depth. Earlier conventional seismic surveys, including the Marathon and MTA datasets, provided deeper structural information but had limited ability to resolve shallow sedimentary sequences and near-seafloor fault geometries (Figure 12). At a broader regional scale, previous seismic investigations of the southern Marmara shelf have yielded contrasting interpretations of fault activity. Using conventional MCS data with penetration reaching ~3.5 s TWT, Ref. [39] interpreted most fault families as largely inactive, despite present-day microseismicity. In contrast, Ref. [11], using high-resolution MCS data, identified evidence of fault activity during the past ~500 ka. The results from Erdek Bay demonstrate the importance of integrating seismic datasets with complementary resolution and penetration characteristics to characterize fault architecture across different stratigraphic levels. This integration enabled us to produce a revised fault map of the bay, relate shallow fault offsets affecting the ~9 ka horizon to deeper structures extending toward the acoustic basement, and identify variations in apparent fault dip and vertical separation with depth. Thus, multi-resolution seismic imaging does more than extend the depth of investigation; it improves the characterization of fault architecture and provides a broader structural framework for evaluating possible fault kinematics and the evolution of the fault system. By incorporating deeper structural information from MCS data, previously mapped faults can be reassessed in terms of their downward continuation, apparent dip directions, and larger vertical separations at older stratigraphic levels.
5.2. Geometry, Kinematics, and Timing of the Distributed Fault System in the Erdek Bay
5.2.1. Vertical Separation Patterns and Fault Segmentation
On MCS data, the mapped separation values of faults exhibit significant spatial variations along the acoustic basement horizon, with values ranging from 31 to 327 ms two-way travel time (TWT) (Figure 11a). Vertical separation varies irregularly along individual fault traces, potentially reflecting fault segmentation and the distribution of deformation among different fault strands. Such variations may also occur along strike-slip faults due to changes in fault geometry, including bends, although they do not independently establish strike-slip kinematics. Furthermore, some faults offset the H1 horizon in one seismic profile but show no clearly resolved offset in nearby parallel profiles (Figure 5b and Figure 6b). This spatial variability suggests that recent deformation may distribute unevenly among fault strands rather than being uniformly accommodated along individual faults. The mapped faults offset the base-Pliocene (H3) horizon, and vertical separation increases toward older stratigraphic levels in most profiles where successive horizons can be distinguished (Figure 5, Figure 6 and Figure 7). These observations are consistent with cumulative fault-related deformation since the Pliocene, although the available stratigraphic constraints do not establish continuous activity along individual fault strands throughout this interval. Vertical separation alone, however, cannot be used to determine the total fault displacement or the kinematics of fault slip. As emphasized by [13], maximum Vsep values represent only the apparent vertical component of displacement and should not be considered conclusive evidence for the total amount or sense of fault movement. Integrating these observations with fault geometry, regional tectonic setting, and independent kinematic indicators is therefore necessary to fully constrain the slip behavior of the fault system.
The larger vertical separations observed on the southern faults (red faults on Figure 4b) may reflect longer periods of activity, repeated reactivation, greater cumulative displacement or a combination of these processes; separation values alone cannot distinguish between these possibilities. A decrease in separation toward younger stratigraphic horizons is observed across the central and southern parts of the study area. The larger separations along the southern faults on the acoustic basement and H3 horizons, together with the structural depression visible on corresponding time-structure maps, may indicate localized basin subsidence (Figure 11a,b). These observations suggest cumulative deformation during the Pliocene and Quaternary, although the timing and continuity of activity along individual faults remain uncertain. Differences in vertical separation among faults may reflect different cumulative deformation histories but do not independently constrain total displacement or the relative stage of fault development. The black faults in Figure 4b generally show vertical separations smaller than 30 ms TWT or no measurable separation on the acoustic basement horizon. However, vertical separation along Gf2 and Gf3 could not be determined in the southern part of the study area because of limited seismic coverage. For example, the vertical separation along fault Gf2 cannot be resolved in Figure 7. Sparker data are available in the southernmost part of the study area. In Figure 4b, faults such as Nf and Gf8 also exhibit small or unmeasurable vertical separations (Figure 4b and Figure 5). These faults occur in the northern part of Erdek Bay, where the acoustic basement is relatively shallow.
An alternative interpretation is that, because basement erosion becomes progressively younger toward the north (where the basement is shallower), the vertical component on the faults has been eroded away until much more recently than the faults in the south. Under this interpretation, less of the fault history is preserved in the north because vertical separation of the basement across the fault was continuously removed by erosion during low sea levels/lake levels.
On profile GM13-28 (Figure 5), the faults are relatively steep and variations in sediment thickness between stratigraphic horizons suggest differential subsidence and fault-controlled accommodation, potentially associated with syn-sedimentary fault activity. However, the available data do not unequivocally demonstrate classic growth-fault geometries. The GM13-21 profile reveals strong deformation of the H3 and acoustic basement horizons, together with significant lateral variations in sediment thickness. The observed faults are predominantly steep and appear as separate fault strands in cross-section. Although a strike-slip component is regionally plausible, diagnostic flower structures are not observed, and the deeper connectivity of individual fault strands remains unresolved. Lateral variations in sediment thickness, including local thickening toward the downthrown sides of faults, may reflect syn-sedimentary deformation and fault-controlled accommodation consistent with possible transtensional deformation. However, these geometries alone cannot distinguish between normal faulting and oblique-slip deformation with a normal component. The general increase in vertical separation toward older stratigraphic horizons is consistent with cumulative deformation through time.
According to [11], many faults on the southern Marmara shelf have remained active during the last ~500 ka, with no evidence of declining activity or structural simplification. The similarity in fault patterns between the base-Pliocene and younger (near base-Quaternary to Holocene) horizons in Erdek Bay suggests that the distributed fault architecture developed during the Pliocene and subsequently underwent deformation within the regional NAF-related tectonic regime.
Although the integration of multi-resolution seismic datasets improves fault identification and mapping, the uneven spatial distribution of MCS, Sparker and CHIRP profiles introduces certain limitations. In particular, the absence of MCS data in parts of the southern and south-eastern sectors limits the interpretation of deeper fault geometries and their possible downward continuation toward the acoustic basement. Variations in profile spacing and orientation also introduce uncertainties in the precise geometry and lateral extent of individual fault segments.
Furthermore, the available seismic data do not permit reliable quantification of segment boundaries, overlap zones, or displacement partitioning among individual fault strands. Consequently, segmentation is interpreted primarily from mapped fault geometries and spatial variations in vertical separation rather than from quantitative displacement analyses. The possible kinematic implications of these observations are evaluated in Section 5.2.2.
5.2.2. Possible Fault Kinematics and Regional Tectonic Constraints
The interpretation presented here is based on the combined evaluation of fault geometry, along-strike changes in vertical separation and throw direction, map-view fault patterns, and the regional tectonic setting. The fault system consists of multiple discontinuous and segmented strands with variable strikes. Most fault strands are steeply dipping, and vertical separation varies irregularly along strike. These characteristics are compatible with a complex fault system potentially accommodating both dip-slip and strike-slip components, although they do not uniquely constrain the sense of movement.
Of particular interest is fault Cf, which is nearly vertical and exhibits a reversal in the direction of vertical separation along strike between two parallel seismic profiles: the sense of vertical separation is down to the northwest in Figure 6 and down to the southeast on another profile (see Figure 4a for location of offset reversal). Such along-strike offset reversals are characteristic of strike-slip faults, where lateral motion juxtaposes different stratigraphic sections, and local changes in fault geometry, bends, or oblique components generate opposite apparent vertical separations along different parts of the same structure [44]. In addition, Cf shows a change in dip direction with depth (Figure 6a), which is also commonly used as a criterion for identifying strike-slip faults in seismic sections [44]. These observations are therefore compatible with a possible oblique-slip component along Cf.
The map-view geometry provides additional information on the structural organization of the system (Figure 4a). The Kapıdağ Fault, located north of the study area, has previously been interpreted as a right-lateral strike-slip fault [11], whereas NNW–SSE- and WNW–ESE-trending faults within the bay, including fault Cf, show oblique relationships to the regional fault system (Figure 4a). Within Erdek Bay, several WNW–ESE-trending fault strands (Gf4, Gf5, Gf6, and Gf7) appear to terminate against the NE–SW-trending Edincik Fault near the Kapıdağ Peninsula isthmus, whereas Gf3 appears to extend across this structure. These geometric relationships may reflect interactions between different fault strands within a complex deformation zone, although they do not uniquely constrain the sense of slip. In addition, the mapped fault traces in Erdek Bay are discontinuous and appear as steps in map view. This pattern is common along strike-slip faults [45] but may also develop in segmented normal fault systems; it is therefore considered here as compatible with, but not diagnostic of, strike-slip deformation. Regional geological observations provide further context. The Sinekçi Fault, located on the northern Biga Peninsula, has been described as a 26 km-long right-lateral strike-slip fault with a reverse component [46] (Figure 1e). Together with the Kapıdağ and Edincik faults, it forms part of the broader structural framework surrounding Erdek Bay. Although normal separation is observed across most seismic profiles at different structural levels, this pattern alone cannot distinguish between pure normal faulting and oblique-slip motion with a normal component. Growth geometries could also develop through the cumulative effects of oblique-slip deformation with a normal component over a geological timescale extending back to the early Pliocene.
Stress inversion of first-motion polarities indicates a well-resolved strike-slip stress regime with thrust components in the Erdek Bay region [47], and local folds, potentially related to transpressional deformation, are observed on some seismic profiles (Figure 5 and Figure 9b), although their origin cannot be uniquely established. A single-event focal mechanism located in the southern part of Erdek Bay (27.60° E, 40.35° N; Mw 3.0; 10.2 km depth) shows oblique-normal faulting on a WNW–ESE-striking nodal plane, sub-parallel to the Gönen faults (300°/66°/−115°; fault-plane uncertainty 24°) [48]; although it cannot be attributed to an individual mapped fault, it is consistent with local oblique-slip deformation with a normal component. CMT solutions reported by [21] likewise show predominantly strike-slip mechanisms with normal-fault components. These observations are compatible with possible strike-slip to oblique-slip components along some fault strands. Taken together, the mapped fault orientations and regional tectonic observations suggest a structurally complex deformation zone involving the E–W-oriented, right-lateral Kapıdağ Fault; NW–SE- to WNW–ESE-oriented faults exhibiting a normal component; the Sinekçi Fault, with its reverse component in the south (Figure 1e); and the NE–SW-oriented Edincik Fault, which has been associated with a shear zone identified in high-resolution shallow seismic reflection data in [23]. The NE–SW-trending KES Fault, previously interpreted as a strike-slip structure associated with the Central Branch of the North Anatolian Fault, provides further regional context [12]. This structural configuration is broadly consistent with the kinematic framework interpreted by [11] for the İmralı Ridge Fault. However, the available observations do not permit a unique reconstruction of the local strain field or the slip vectors of individual offshore faults.
The integrated seismic observations indicate that the mapped faults form a distributed and segmented fault system within the regional strike-slip tectonic regime of the Central Branch of the North Anatolian Fault. The interpretation of possible oblique-slip deformation within the mapped fault system is based on the combined evaluation of local structural observations, including along-strike variations in vertical separation and throw-direction reversal along Cf, together with map-view fault configurations and independent regional constraints from stress tensor analyses and earthquake focal mechanisms. Although these observations are collectively compatible with oblique-slip deformation, the available 2D seismic reflection data do not uniquely constrain the kinematics of individual offshore faults, and predominantly dip-slip motion cannot be excluded.
5.2.3. Timing of Fault-System Development
The seismic-stratigraphic relationships provide constraints on the timing of fault activity in Erdek Bay. Regionally, tectonic activity along the southern shores of the Gulf of Erdek during the late Pliocene and Pleistocene has been associated with the development of the dextral Edincik–Bandırma Fault and the fragmentation and subsidence of the Pliocene basin north of this fault, contributing to the formation of the Gulf of Erdek [49].
The faults offset H3 and H2, whereas only some fault strands offset H1. Vertical separation tends to decrease toward younger stratigraphic levels, although this relationship cannot be clearly established in all seismic profiles. These observations are consistent with cumulative fault-related deformation during the Pliocene and Quaternary, with activity extending into the Holocene along selected fault strands. The larger separation on H3 relative to H2 indicates that part of this displacement accumulated between the formation of these two horizons. However, because no intermediate horizon between H3 and H2 is resolved in this study, we cannot determine whether fault activity was continuous throughout this interval or interrupted by periods of inactivity. As noted in the Introduction, [10] constrained the onset of this NAF-related strike-slip regime to no later than ~5.9 Ma in the northern Aegean Sea. Their results also indicate that fault systems such as the Kornos-Aghios Ioannin Fault on Lemnos Island underwent reactivation during the early Pliocene (~4 Ma), consistent with ESE–WNW local compression imparted by ~NE–SW dextral strike-slip kinematics along NAF branches. These regional tectonic constraints are consistent with our seismic-stratigraphic correlations, which suggest that the fault system in Erdek Bay underwent deformation during the Pliocene, potentially associated with the development of the regional NAF-related strike-slip tectonic regime. The existence of large separations across the acoustic basement and the onlap of H3 onto its irregular surface suggest that an earlier basin architecture may have existed before the formation of the base-Pliocene horizon. This interpretation is compatible with the possibility that basin development began before the establishment of the modern NAF-related tectonic regime in the region (~5 Ma). Subsequent fault activity affected the Pliocene and Quaternary successions, as indicated by the vertical separation of H3 and H2.
CHIRP and Sparker data further reveal deformation affecting the ~9 ka transgressive unconformity and locally younger sediments (Figure 5b, Figure 6b,c and Figure 9a). However, Holocene deformation is not uniformly observed along all mapped fault strands. In some seismic profiles, a fault offsets H1, whereas in nearby profiles the same horizon shows no clearly resolved displacement (Figure 5 and Figure 6). This spatial variability is consistent with differences in the activity histories of individual fault strands, although the available data do not establish whether activity migrated between segments through time. These observations indicate Holocene activity along several fault strands. Previous studies have proposed contrasting interpretations of recent fault activity in Erdek Bay. Study [12] described faults in Erdek Bay as NWW–SEE-trending normal faults and suggested that they did not affect sedimentary units younger than ~30 ka, implying a relatively passive basin configuration. In contrast, Ref. [11] documented vertical displacement across the H1 transgressive unconformity and younger sediments using high-resolution CHIRP profiles. Some of these faults were interpreted to intersect the NE-SW-striking, active KES fault near the southeastern shore of Erdek Bay. Our observations of deformation affecting H1 along selected fault strands are consistent with the Holocene activity documented by [11] and extend the structural interpretation to deeper stratigraphic horizons. Vertical separation across H2 and H3, together with deformation of the acoustic basement, provides evidence of cumulative fault displacement over a longer geological interval. Thus, our results support the interpretation of recent fault activity proposed by [11] while extending the stratigraphic framework of deformation back to the early Pliocene.
Historical earthquakes reported in the Erdek Bay region [19] provide additional context for regional seismic activity, although they cannot be attributed to individual mapped offshore faults. Together, the seismic-stratigraphic observations indicate a prolonged history of fault-system development, with deformation recorded from the Pliocene through the Quaternary and locally into the Holocene.
5.2.4. Scenario-Based Earthquake Magnitude Estimates
The mapped fault segments in Erdek Bay provide a basis for estimating scenario earthquake magnitudes using their mapped lengths and assumed down-dip rupture widths. Four fault segments with interpreted offsets of the ~9 ka (H1) horizon were selected for this assessment: Gf1, Gf2, and shorter segments of Gf7 and Nf (Figure 4a,b). Their mapped lengths were used to estimate moment magnitudes (Mw) under individual, complete-segment rupture assumptions. For Gf1 and Gf2, the scenarios consider the entire mapped fault length, whereas the scenarios for Gf7 and Nf consider shorter portions of their mapped lengths. Because the fault kinematics cannot be uniquely determined from the available seismic reflection data, we used the empirical magnitude–rupture area relationship of [50], derived from earthquakes involving different faulting mechanisms:
where (A) is the rupture area in km2. The rupture area was estimated from the fault segment length (L) and the down-dip segment width (W):
where D represents the assumed lower limit of the seismogenic depth range and δ is the fault dip. A seismogenic depth of approximately 12.5 km was adopted based on the regional seismicity distribution reported in [48]. The ~80° apparent dip was calculated for Gf4 from the seismic profile (Figure 5) and used as a representative dip for the selected segments. Its applicability to each segment, together with the adopted seismogenic depth of ~12.5 km, introduces uncertainty into the estimated rupture areas and corresponding magnitudes. The adopted depth and representative dip are scenario inputs rather than rupture parameters independently constrained for each fault segment.
Mw = 0.98log10(A) + 4.07
The estimated rupture areas and moment magnitudes are presented in Table 3. The calculated Mw values range from 5.80 to 6.23, with Gf2 yielding the largest magnitude. To assess the sensitivity of these estimates to the choice of scaling relationship, we also applied the magnitude–surface rupture length relationship of [50] for all faulting types:
Mw = 1.16 log10(SRL) + 5.08
Table 3.
Mapped fault segment lengths, estimated rupture areas, and scenario moment magnitudes calculated using the rupture-area (Equation (1)) and surface rupture length (Equation (3)) relationships for segments with interpreted H1 offsets.
Here, SRL is the surface rupture length in km, approximated by the mapped segment length. This relationship yields Mw values of 5.85–6.36 (Table 3), differing from the rupture-area-based estimates by 0.05–0.13 magnitude units. The similar results provide a comparison independent of the assumed rupture width, although they do not validate the adopted seismogenic depth. The rupture areas and lengths of the selected segments fall within the data ranges of both relationships [50].
These estimates assume complete rupture of individual mapped segments and should not be interpreted as definitive maximum earthquake magnitudes. Larger rupture scenarios, potentially involving multiple segments, may be considered where the Gönen faults converge toward the Edincik Fault; however, their deeper connectivity remains unresolved. For shorter segments, assuming rupture across the full adopted seismogenic thickness may overestimate rupture area. Uncertainties in rupture dimensions and empirical scaling relationships mean that these values should be regarded as approximate scenario estimates rather than precise predictions.
Vertical separation of the ~9 ka (H1) horizon along Gf2 is consistently ~7–8 ms TWT on several CHIRP profiles. Along Gf1, Gf7 and Nf, apparent vertical separations of H1 are smaller (~0.5–1 ms TWT), at or below the vertical resolution of the CHIRP data; therefore, vertical separation rates are not reported for these faults. Assuming a sediment velocity of ~1500 m/s, the separation along Gf2 corresponds to ~5.3–6.0 m and yields an apparent vertical separation rate of ~0.6–0.7 mm/yr over 9 kyr. This estimate depends on the assumed sediment velocity and horizon age. Using an age of 10 ka, within the ~9–10 ka range proposed for Erdek Bay [11], would yield ~0.5–0.6 mm/yr. Because H1 is a transgressive surface that may preserve relief predating marine flooding, the measured separation may not entirely represent post-transgression fault displacement. The calculated rate is therefore approximate and should not be interpreted as a fault slip rate. Reliable total slip rates and earthquake recurrence intervals cannot be determined from the available data.
5.3. Distributed Deformation Architecture
The North Anatolian Fault (NAF) comprises numerous fault strands, extending from the well-defined Karlıova Basin in the east [5,51] to the more diffuse transtensional zone of the Northern Aegean in the west. Distributed deformation across multiple fault strands is a characteristic feature of complex plate-boundary fault systems. Distributed faulting is also observed in other major tectonic systems, including the Sunda subduction arc and across the San Andreas Fault system in northern and southern California [52]. Although these systems occur at substantially larger spatial scales than Erdek Bay, they provide examples of deformation accommodated across multiple fault strands. The presence of a weak lower-crustal layer has been proposed as one possible explanation for distributed fault geometries in some tectonic settings [53], although this mechanism cannot be evaluated from the available seismic data in Erdek Bay. The fault architecture mapped in Erdek Bay is broadly consistent with distributed deformation at a much smaller spatial scale.
The distributed fault architecture in Erdek Bay may reflect the influence of pre-existing structural features on the propagation and development of the Central Branch of the North Anatolian Fault (NAF-C). A comparable mechanism was proposed by [8], who suggested that the westward propagation of the northern NAF in the Marmara region was guided by a pre-existing, deep-seated fault zone, leading to fault bifurcation. Similarly, the development of multiple discontinuous fault strands in Erdek Bay may have been influenced by inherited structural features rather than the formation of a single throughgoing fault. However, the existence and geometry of such inherited structures beneath Erdek Bay cannot be directly established from the available seismic data. The northward onlap of sediments onto the acoustic basement suggests that the northern part of Erdek Bay remained relatively elevated compared with the subsided southern part during sediment accumulation. The mapped faults bordering the southern basin are associated with the structural configuration of the acoustic basement (Figure 11a), suggesting that fault-controlled subsidence contributed to basin development. This configuration may reflect an inherited basin architecture subsequently influenced by NAF-related deformation. However, the available seismic data do not constrain the timing or tectonic origin of the initial basin development. The mapped faults predominantly appear as separate steeply dipping structures, and their deeper connectivity remains unresolved. Diagnostic flower structures that would support a common strike-slip fault system at depth are not observed. Consequently, the available MCS data cannot establish whether these faults merge downward into a single master fault or remain separate structures at depth. Deeper-penetration seismic reflection data or 3D seismic surveys would be required to evaluate these alternative structural models.
6. Conclusions
The integration of high-resolution multichannel seismic reflection, Sparker, and CHIRP datasets enabled the investigation of fault geometries from the acoustic basement to the seafloor across four interpreted stratigraphic levels (acoustic basement, base Pliocene, near-base Quaternary, and ~9 ka). By linking shallow and deep seismic observations, this multi-resolution approach provides new constraints on fault geometry, segmentation, and vertical separation patterns, including variations in apparent fault dip.
The integrated seismic observations reveal a distributed and segmented fault system within the regional strike-slip tectonic regime of the Central Branch of the North Anatolian Fault. Vertical separation generally decreases toward younger horizons in most seismic profiles and varies irregularly along strike on the acoustic basement, consistent with fault segmentation and cumulative deformation through time, although it does not constrain total displacement or fault kinematics (Section 5.2.1). The observed structural characteristics, together with regional stress-tensor inversions and earthquake focal mechanisms, are compatible with possible strike-slip to oblique-slip components on some fault strands. However, the available 2D seismic reflection data do not uniquely constrain the kinematics of individual offshore faults, and predominantly dip-slip motion cannot be excluded.
Based on the seismic-stratigraphic relationships and mapped fault geometries, we propose a two-stage model for the tectonic evolution of the fault system in Erdek Bay.
Stage 1-Pliocene Fault-System Development
The observed syn-sedimentary deformation within the Pliocene succession suggests fault activity during this period. The development of the fault system is considered within the regional tectonic framework of the westward propagation of the North Anatolian Fault system. However, the available stratigraphic constraints do not establish whether deformation was continuous throughout the Pliocene or when the present distributed fault configuration became established.
Stage 2-Quaternary Fault Activity and Development
The mapped faults offset both the H3 and H2 horizons where these horizons are imaged, whereas only some fault strands displace the H1 transgressive unconformity. This pattern indicates that deformation continued during the Quaternary and, along selected fault strands, into the Holocene. The uneven distribution of younger offsets is consistent with spatial and temporal variations in fault activity within the distributed and segmented fault system.
The integrated seismic observations confirm Holocene fault activity in Erdek Bay, consistent with previous findings [11], and highlight the seismic potential of this distributed fault system. Single-segment rupture scenarios for four faults with interpreted H1 offsets yield estimated magnitudes of Mw 5.80–6.23. These estimates provide a preliminary indication of the earthquake-generating potential of the selected segments but do not represent definitive maximum magnitudes for the fault system. By linking shallow Holocene deformation identified in CHIRP and Sparker data to deeper fault structures imaged by multichannel seismic reflection profiles, this study provides new constraints on fault geometry and longer-term structural evolution. More broadly, these results highlight the importance of integrating seismic datasets with complementary resolution and penetration capabilities when evaluating offshore fault systems and their potential seismic hazards.
Author Contributions
Conceptualization, S.O.G.; Methodology, S.O.G. and A.D.; Formal Analysis, A.D.; Investigation, S.O.G. and A.D.; Data Curation, A.D.; Writing—Original Draft Preparation, S.O.G. and A.D.; Writing—Review and Editing, S.O.G.; Visualization, S.O.G. and A.D.; Supervision, S.O.G.; Project Administration, S.O.G.; Funding Acquisition, S.O.G. All authors have read and agreed to the published version of the manuscript.
Funding
This research was funded by the Scientific and Technological Research Council of Turkey (TÜB˙ITAK grants 112Y026) and the National Science Foundation (grants OCE 12-33248, OCE 12-34428, OCE 12-34178, OCE 15-37614).
Institutional Review Board Statement
Not applicable.
Informed Consent Statement
Not applicable.
Data Availability Statement
Data available on request due to restrictions. The data are available from the corresponding author upon reasonable request, as the data are part of ongoing research.
Acknowledgments
We would like to thank captains and crews, and scientific parties of expeditions TAMAM 2010 PirMarmara, SoMar 2013, and SoMar 2014. Data acquisition, processing and interpretation of SoMAr 2013-2014 data are performed under TÜBİTAK Project in SeisLab laboratory in Institute of Marine Sciences and Technology. Data acquisition, processing and interpretation of TAMAM 2010 data is performed under ESONET-Marmara DM Project in Seislab Laboratory. We are also grateful to the State Planning Organization Project (Project Code: 2003K120360) for supporting the establishment of SeisLab. We thank Christopher C. Sorlien of the Earth Research Institute, University of California, Santa Barbara, and Leonardo Seeber of the Lamont-Doherty Earth Observatory, Columbia University, for their valuable suggestions, which helped improve the manuscript. We also thank Sorlien for his contributions to the stratigraphic correlations, Marie-Helene Cormier of the University of Rhode Island for her contributions during data acquisition, and Michael S. Steckler for his collaboration in securing funding for this bilateral project. We thank Günay Çifci for providing access to the SeisLab facilities during data acquisition, processing, and interpretation, and for granting permission to use the PirMarmara profiles for stratigraphic correlation and seismic interpretation. We also thank the SoMar and PirMarmara project and cruise participants for their support during data acquisition and processing, and the SeisLab researchers for their contributions to data processing. We thank Hydroscience Technologies, Inc. for its support with the seismic systems aboard R/V K. Piri Reis, and acknowledge the use of ProMAX (Halliburton) for data processing. We also thank IHS for donating Kingdom Suite software to all five participating universities; the software was used extensively for seismic interpretation and graphics. We thank the reviewers for their constructive comments and valuable suggestions, which helped improve the quality and clarity of the manuscript.
Conflicts of Interest
The authors declare no conflicts of interest. The funders had no role in the design of the study; in the collection, analyses, or interpretation of data; in the writing of the manuscript; or in the decision to publish the results.
References
- Ambraseys, N.N.; Jackson, J.A. Seismicity of the Sea of Marmara (Turkey) since 1500. Geophys. J. Int. 2000, 141, F1–F6. [Google Scholar] [CrossRef] [Scilit]
- Altınok, Y.; Ersoy, Ş. Tsunamis Observed on and Near the Turkish Coast. Nat. Hazards 2000, 21, 185–205. [Google Scholar] [CrossRef] [Scilit]
- Armijo, R.; Meyer, B.; Navarro, S.; King, G.; Barka, A. Asymmetric slip partitioning in the Sea of Marmara pull-apart: A clue to propagation processes of the North Anatolian Fault? Terra Nova 2002, 14, 80–86. [Google Scholar] [CrossRef] [Scilit]
- Le Pichon, X.; İmren, C.; Rangin, C.; Şengör, A.M.C.; Siyako, M. The South Marmara Fault. Int. J. Earth Sci. 2014, 103, 219–231. [Google Scholar] [CrossRef] [Scilit]
- Şengör, A.M.C. The North Anatolian transform fault: Its age, offset and tectonic significance. J. Geol. Soc. Lond. 1979, 136, 269–282. [Google Scholar] [CrossRef] [Scilit]
- Barka, A.A. The North Anatolian fault zone. Ann. Tecton. 1992, 6, 164–195. [Google Scholar]
- Armijo, R.; Meyer, B.; Hubert, A.; Barka, A. Westward propagation of the North Anatolian fault into the northern Aegean: Timing and kinematics. Geology 1999, 27, 267–270. [Google Scholar] [CrossRef] [Scilit]
- Okay, A.I.; Kaşlılar Özcan, A.; Imren, C.; Boztepe-Güney, A.; Demirbağ, E.; Kuşçu, I. Active faults and evolving strike-slip basins in the Sea of Marmara, northwest Turkey: A multichannel seismic reflection study. Tectonophysics 2000, 321, 189–218. [Google Scholar] [CrossRef] [Scilit]
- Rodriguez, M.; Sakellariou, D.; Gorini, C.; Janin, A.; d’Acremont, E.; Pourhiet, L.L.; Chamot-Rooke, N.; Tsampouraki-Kraounaki, K.; Morfis, I.; Rousakis, G.; et al. Evolution of the North Anatolian Fault from a diffuse to a localized shear zone in the North Aegean Sea during the Plio-Pleistocene. Geophys. J. Int. 2023, 235, 2614–2639. [Google Scholar] [CrossRef] [Scilit]
- Berio, L.R.; Dantas, E.L.; Kylander-Clark, A.; Muniz, R.L.; Pizzati, M.; Storti, F.; Viola, G.; Balsamo, F. From Extension to Strike-Slip Faulting Along the Western Continuation of the North Anatolian Fault in the Northern Aegean Sea: Structural, Geochronological and Geochemical Constraints. Tectonics 2026, 45, e2025TC009337. [Google Scholar] [CrossRef] [Scilit]
- Okay Günaydın, S.; Sorlien, C.C.; Cormier, M.H.; Barın, B.; Seeber, L.; Steckler, M.S.; Çifci, G.; Dondurur, D.; Kurt, H.; Küçük, H.M.; et al. Post-500 ka and Holocene activity on distributed faults of the North Anatolian Fault system along the southern shelf of Marmara Sea, Turkey. Tectonophysics 2022, 840, 229547. [Google Scholar] [CrossRef] [Scilit]
- Vardar, D.; Öztürk, K.; Yaltırak, C.; Alpar, B.; Tur, H. Late Pleistocene–Holo- cene evolution of the southern Marmara shelf and sub-basins: Middle strand of the North Anatolian fault, southern Marmara Sea, Turkey. Mar. Geophys. Res. 2014, 35, 69–85. [Google Scholar] [CrossRef] [Scilit]
- Kolawole, F.; Turko, M.S.; Carpenter, B.M. Basement-controlled deformation of sedimentary sequences, Anadarko Shelf, Oklahoma. Basin Res. 2020, 32, 1365–1387. [Google Scholar] [CrossRef] [Scilit]
- Okay, A.I.; Demirbağ, E.; Kurt, H.; Okay, N.; Kuşçu, İ. An active, deep marine strike slip basin along the North Anatolian fault in Turkey. Tectonics 1999, 18, 129–148. [Google Scholar] [CrossRef] [Scilit]
- GeoMapApp. Available online: https://www.geomapapp.org/ (accessed on 25 September 2026).
- Emre, Ö.; Duman, T.Y.; Özalp, S.; Elmacı, H.; Şaroğlu, F. Active Fault Map of Turkey, Special Publication Series 30. General Directorate of Mineral Research and Exploration (MTA) 2013, Ankara. Available online: https://www.mta.gov.tr/en/maps/active-fault (accessed on 27 May 2026).
- Cormier, M.H.; Seeber, L.; Mchugh, C.M.G.; Polonia, A.; Çağatay, N.; Emre, Ö.; Gasperini, L.; Görür, N.; Bortoluzzi, G.; Bonatti, E.; et al. North Anatolian Fault in the Gulf of Izmit (Turkey): Rapid vertical motion in response to minor bends of a non vertical continental transform. J. Geophys. Res. 2006, 111, B04102. [Google Scholar] [CrossRef] [Scilit]
- Sorlien, C.C.; Akhun, S.D.; Seeber, L.; Steckler, M.S.; Shillington, D.J.; Kurt, H.; Çifçi, G.; Poyraz, D.T.; Gürçay, S.; Dondurur, D.; et al. Uniform basin growth over the last 500 ka, North Anatolian Fault, Marmara Sea, Turkey. Tectonophysics 2012, 518, 1–16. [Google Scholar] [CrossRef] [Scilit]
- Altınok, Y.; Alpar, B. Marmara Island earthquakes of 1265 and 1935. Turkey. Nat. Hazards Earth Syst. Sci. 2006, 6, 999–1006. [Google Scholar] [CrossRef] [Scilit]
- Taymaz, T.; Jackson, J.; Mckenzie, D. Active tectonics of the north and central Aegean Sea. Geophys. J. Int. 1991, 106, 433–490. [Google Scholar] [CrossRef] [Scilit]
- Nakano, M.; Çıtak, S.; Kalafat, D. Focal mechanism determinations of earthquakes along the North Anatolian fault. Planets Space 2015, 667, 159. [Google Scholar] [CrossRef] [Scilit]
- Yaltırak, C. Tectonic evolution of the Marmara Sea and its surroundings. Mar. Geol. 2002, 190, 493–529. [Google Scholar] [CrossRef] [Scilit]
- Vardar, D. Examining The Plio-Quaternary Structures of Southern Marmara (Between Marmara Karabiga and Gemlik) Shoreface Area with Seismic Reflection Data. Ph D. Thesis, İstanbul University, Institute of Marine Sciences and Management, İstanbul, Türkiye, 2013. [Google Scholar]
- Özalp, S.; Kürçer, A.; Özdemir, E.; Duman, T.Y. The Bekten Fault: The palaeoseismic behavior and kinematic characteristics of an intervening segment of the North Anatolian Fault Zone, Southern Marmara Region, Turkey. Geodin. Acta 2016, 28, 347–362. [Google Scholar] [CrossRef] [Scilit]
- Hiscott, R.N.; Aksu, A.E. Late Quaternary history of the Marmara Sea and Black Sea from high-resolution seismic and gravity-core studies. Mar. Geol. 2002, 190, 261–282. [Google Scholar] [CrossRef] [Scilit]
- Çağatay, M.N.; Eriş, K.; Ryan, W.B.F.; Sancar, Ü.; Polonia, A.; Akçer, S.; Biltekin, D.; Gasperini, L.; Görür, N.; Lericolais, G.; et al. Late Pleistocene–Holocene evolution of the northern shelf of the Sea of Marmara. Mar. Geol. 2009, 265, 87–100. [Google Scholar] [CrossRef] [Scilit]
- Emre, Ö.; Erkal, T.; Tchepalyga, A.; Kazancı, N.; Keçer, M.; Ünay, E. Neogene-Quaternary evolution of the eastern Marmara region, northwest Turkey. Bull. Miner. Res. Explor. 1998, 120, 119–145. Available online: https://izlik.org/JA66NT78JL (accessed on 27 June 2026).
- Okay, S.; Çifci, G.; Dondurur, D.; Özel, E.; Kurt, H. Collaborative Research: The North Anatolian Fault System in the Marmara Sea, Turkey—Insights from the Quaternary Evolution of a Multi-Stranded Transform; TÜBİTAK Report; TÜBİTAK: Ankara, Türkiye, 2015. [Google Scholar]
- Kazancı, N.; Emre, Ö.; Erkal, T.; İleri, M.; Ergin, M.; Görür, G. Morphology and Sedimentary Facies of Actual Kocasu and Gönen River Deltas, Marmara Sea, Northwestern Anatolia. Miner. Res. Explor. Bull. 1999, 121, 1–18. Available online: https://dergi.mta.gov.tr/files/articles/319/eng/20150522143256_319_227264ca.pdf (accessed on 27 June 2026).
- Şaroğlu, F.; Emre, Ö.; Boray, A. Active Faults and Seismicity of Turkey; MTA Report No. 8174; General Directorate of Mineral Research and Exploration (MTA): Ankara, Türkiye, 1987; (In Turkish, Unpublished Technical Report). [Google Scholar]
- Adatepe, F.; Demirel, S.; Alpar, B. Tectonic setting of the southern Marmara Sea region: Based on seismic reflection data and gravity modeling. Mar. Geol. 2002, 190, 383–395. [Google Scholar] [CrossRef] [Scilit]
- Barka, A.A.; Kadinsky-Cade, K. Strike-slip fault geometry in Turkey and its influence on earthquake activity. Tectonics 1988, 7, 663–684. [Google Scholar] [CrossRef] [Scilit]
- Şengör, A.M.C.; Tuysuz, O.; Imren, C.; Sakinc, M.; Eyidogan, H.; Gorur, N.; Le Pichon, X.; Rangin, C. The North Anatolian Fault: A new look. Ann. Rev. Earth Planet Sci. 2005, 33, 37–112. [Google Scholar] [CrossRef] [Scilit]
- Le Pichon, X.; Şengör, A.M.C.; Demirbağ, E.; Rangin, C.; İmren, C.; Armijo, R.; Görür, N.; Çağatay, N.; Mercier de Lepinay, B.; Meyer, B.; et al. The active main Marmara Fault. Earth Planet. Sci. Lett. 2001, 192, 595–616. [Google Scholar] [CrossRef] [Scilit]
- Okay, A.I.; Tuysuz, O.; Kaya, S. From transpression to transtension: Changes in morphology and structure around a bend on the North Anatolian Fault in the Marmara region. Tectonophysics 2004, 391, 259–282. [Google Scholar] [CrossRef] [Scilit]
- Seeber, L.; Cormier, M.H.; McHugh, C.; Emre, Ö.; Polonia, A.; Sorlien, C. Rapid subsidence and sedimentation from oblique slip near a bend on the North Anatolian Transform in the Marmara Sea, Turkey. Geology 2006, 34, 933–936. [Google Scholar] [CrossRef] [Scilit]
- Kurt, H.; Sorlien, C.C.; Seeber, L.; Steckler, M.S.; Shillington, D.J.; Çifci, G.; Cormier, M.-H.; Dessa, J.-X.; Atgın, O.; Dondurur, D.; et al. Steady late quaternary slip rate on the Çınarcık section of the North Anatolian Fault near Istanbul, Turkey. Geophys. Res. Lett. 2013, 40, 4555–4559. [Google Scholar] [CrossRef] [Scilit]
- Grall, C.; Henry, P.; Thomas, Y.; Westbrook, G.K.; Çağatay, M.N.; Marsset, B.; Sarıtaş, G.; Çifci, G.; Geli, L. Slip rate estimation along the western segment of the Main Marmara Fault over the last 405–490 ka by correlating mass transport deposits. Tectonics 2013, 32, 1587–1601. [Google Scholar] [CrossRef] [Scilit]
- Şengör, A.M.C.; Grall, C.; İmren, C.; Le Pichon, X.; Görür, N.; Henry, P.; Karabulut, H.; Siyako, M. The geometry of the North Anatolian transform fault in the Sea of Marmara and its temporal evolution: Implications for the development of intracontinental transform faults. Can. J. Earth Sci. 2014, 51, 222–242. [Google Scholar] [CrossRef] [Scilit]
- Öztürk, K.; Yaltırak, C.; Alpar, B. The relationship between the tectonic setting of the Lake Iznik Basin and the Middle Strand of the North Anatolian Fault. Turk. J. Earth Sci. 2009, 18, 209–224. [Google Scholar] [CrossRef] [Scilit]
- Okay, S.; Sorlien, C.; Çifci, G.; Steckler, M.; Seeber, L.; Shillington, D.; Cormier, M.H.; Barın, B.; Dondurur, D.; Gürçay, S.; et al. The Evolution and Activity of Strands of the Central Branch of the North Anatolian Fault in Marmara Sea. In Proceedings of the International Earth Science Colloquium on the Aegean Region 2012, İzmir, Türkiye, 1–5 October 2012. [Google Scholar]
- Parke, J.R.; White, R.S.; McKenzie, D.; Minshull, T.A.; Bull, J.; Kuşçu, İ.; Görür, N.; Şengör, A.M.C. The Sea of Marmara: A two-dimensional seismic reflection data archive. Geochem. Geophys. Geosyst. 2003, 4, 1084. [Google Scholar] [CrossRef] [Scilit]
- Doğan, A. Investigation of Tectonic Structure of the South Marmara Island and Erdek Bay by Multichannel Seismic Reflection Method. Mcs Thesis, Dokuz Eylül University, Institute of Marine Sciences and Technology, İzmir, Türkiye, 2024. [Google Scholar]
- Zalán, P.V. Identification of strike-slip faults in seismic sections. In Proceedings of the 57th Annual International Meeting and Exposition of the Society of Exploration Geophysicists, New Orleans, LA, USA, 11–15 October 1987. [Google Scholar]
- Wesnousky, S. Seismological and structural evolution of strike-slip faults. Nature 1988, 335, 340–343. [Google Scholar] [CrossRef] [Scilit]
- Çan, T.; Olgun, S.; Kop, A.; Yavuzoglu, A.; Sönmez, Ö.; Duman, T.Y. Geomorphometric and palaeoseismologic preliminary evaluations related with the activity of Sinekçi Fault. In Proceedings of the 18th Workshop of the Active Tectonics Research Group (ATAG18); Muğla Sıtkı Koçman University: Muğla, Türkiye, 2014; Abstracts; 61p. (In Turkish) [Google Scholar]
- Wollin, C.; Bonhof, M.; Vavrycuk, V.; Martinez-Garzon, P. Stress Inversion of Regional Seismicity in the Sea of Marmara Region, Turkey. Pure Appl. Geophys. 2019, 176, 1269–1291. [Google Scholar] [CrossRef] [Scilit]
- Wollin, C.; Bohnhoff, M.; Martínez-Garzón, P.; Küperkoch, L.; Raub, C. A Unified Earthquake Catalogue for the Sea of Marmara Region, Turkey, Based on Automatized Phase Picking and Travel-Time Inversion: Seismotectonic Implications. Tectonophysics 2018, 747–748, 416–444. [Google Scholar] [CrossRef] [Scilit]
- Cürebal, İ. Coastal Use and Planning of the Area Between Gönen Stream (Tahirova) and Edincik (Balıkesir). Unpublished Master’s Thesis, İstanbul University Institute of Social Sciences, İstanbul, Turkiye, 1999. [Google Scholar]
- Wells, D.L.; Coppersmith, K.J. New empirical relationships among magnitude, rupture length, rupture width, rupture area, and surface displacement. Bull. Seismol. Soc. Am. 1994, 84, 974–1002. [Google Scholar] [CrossRef] [Scilit]
- Şaroğlu, F. Geological and Structural Evolution of Eastern Anatolia in the Neotectonic Period. Unpublished PhD Thesis, Istanbul University, İstanbul, Türkiye, 1985. [Google Scholar]
- Scharer, K.; Streig, A. The San Andreas fault system: Complexities along a major transform fault system and relation to earthquake hazards. In Transform Plate Boundaries and Fracture Zones; Elsevier: Amsterdam, The Netherlands, 2019; pp. 249–269. [Google Scholar] [CrossRef] [Scilit]
- Roy, M. Evolution of fault systems at a strike-slip plate boundary: A viscoelastic model. Geophys. Res. Lett. 1998, 25, 2881–2884. [Google Scholar] [CrossRef] [Scilit]
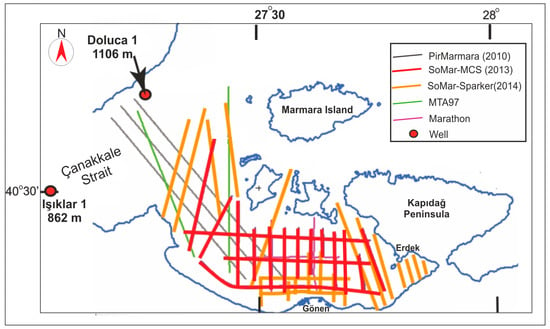
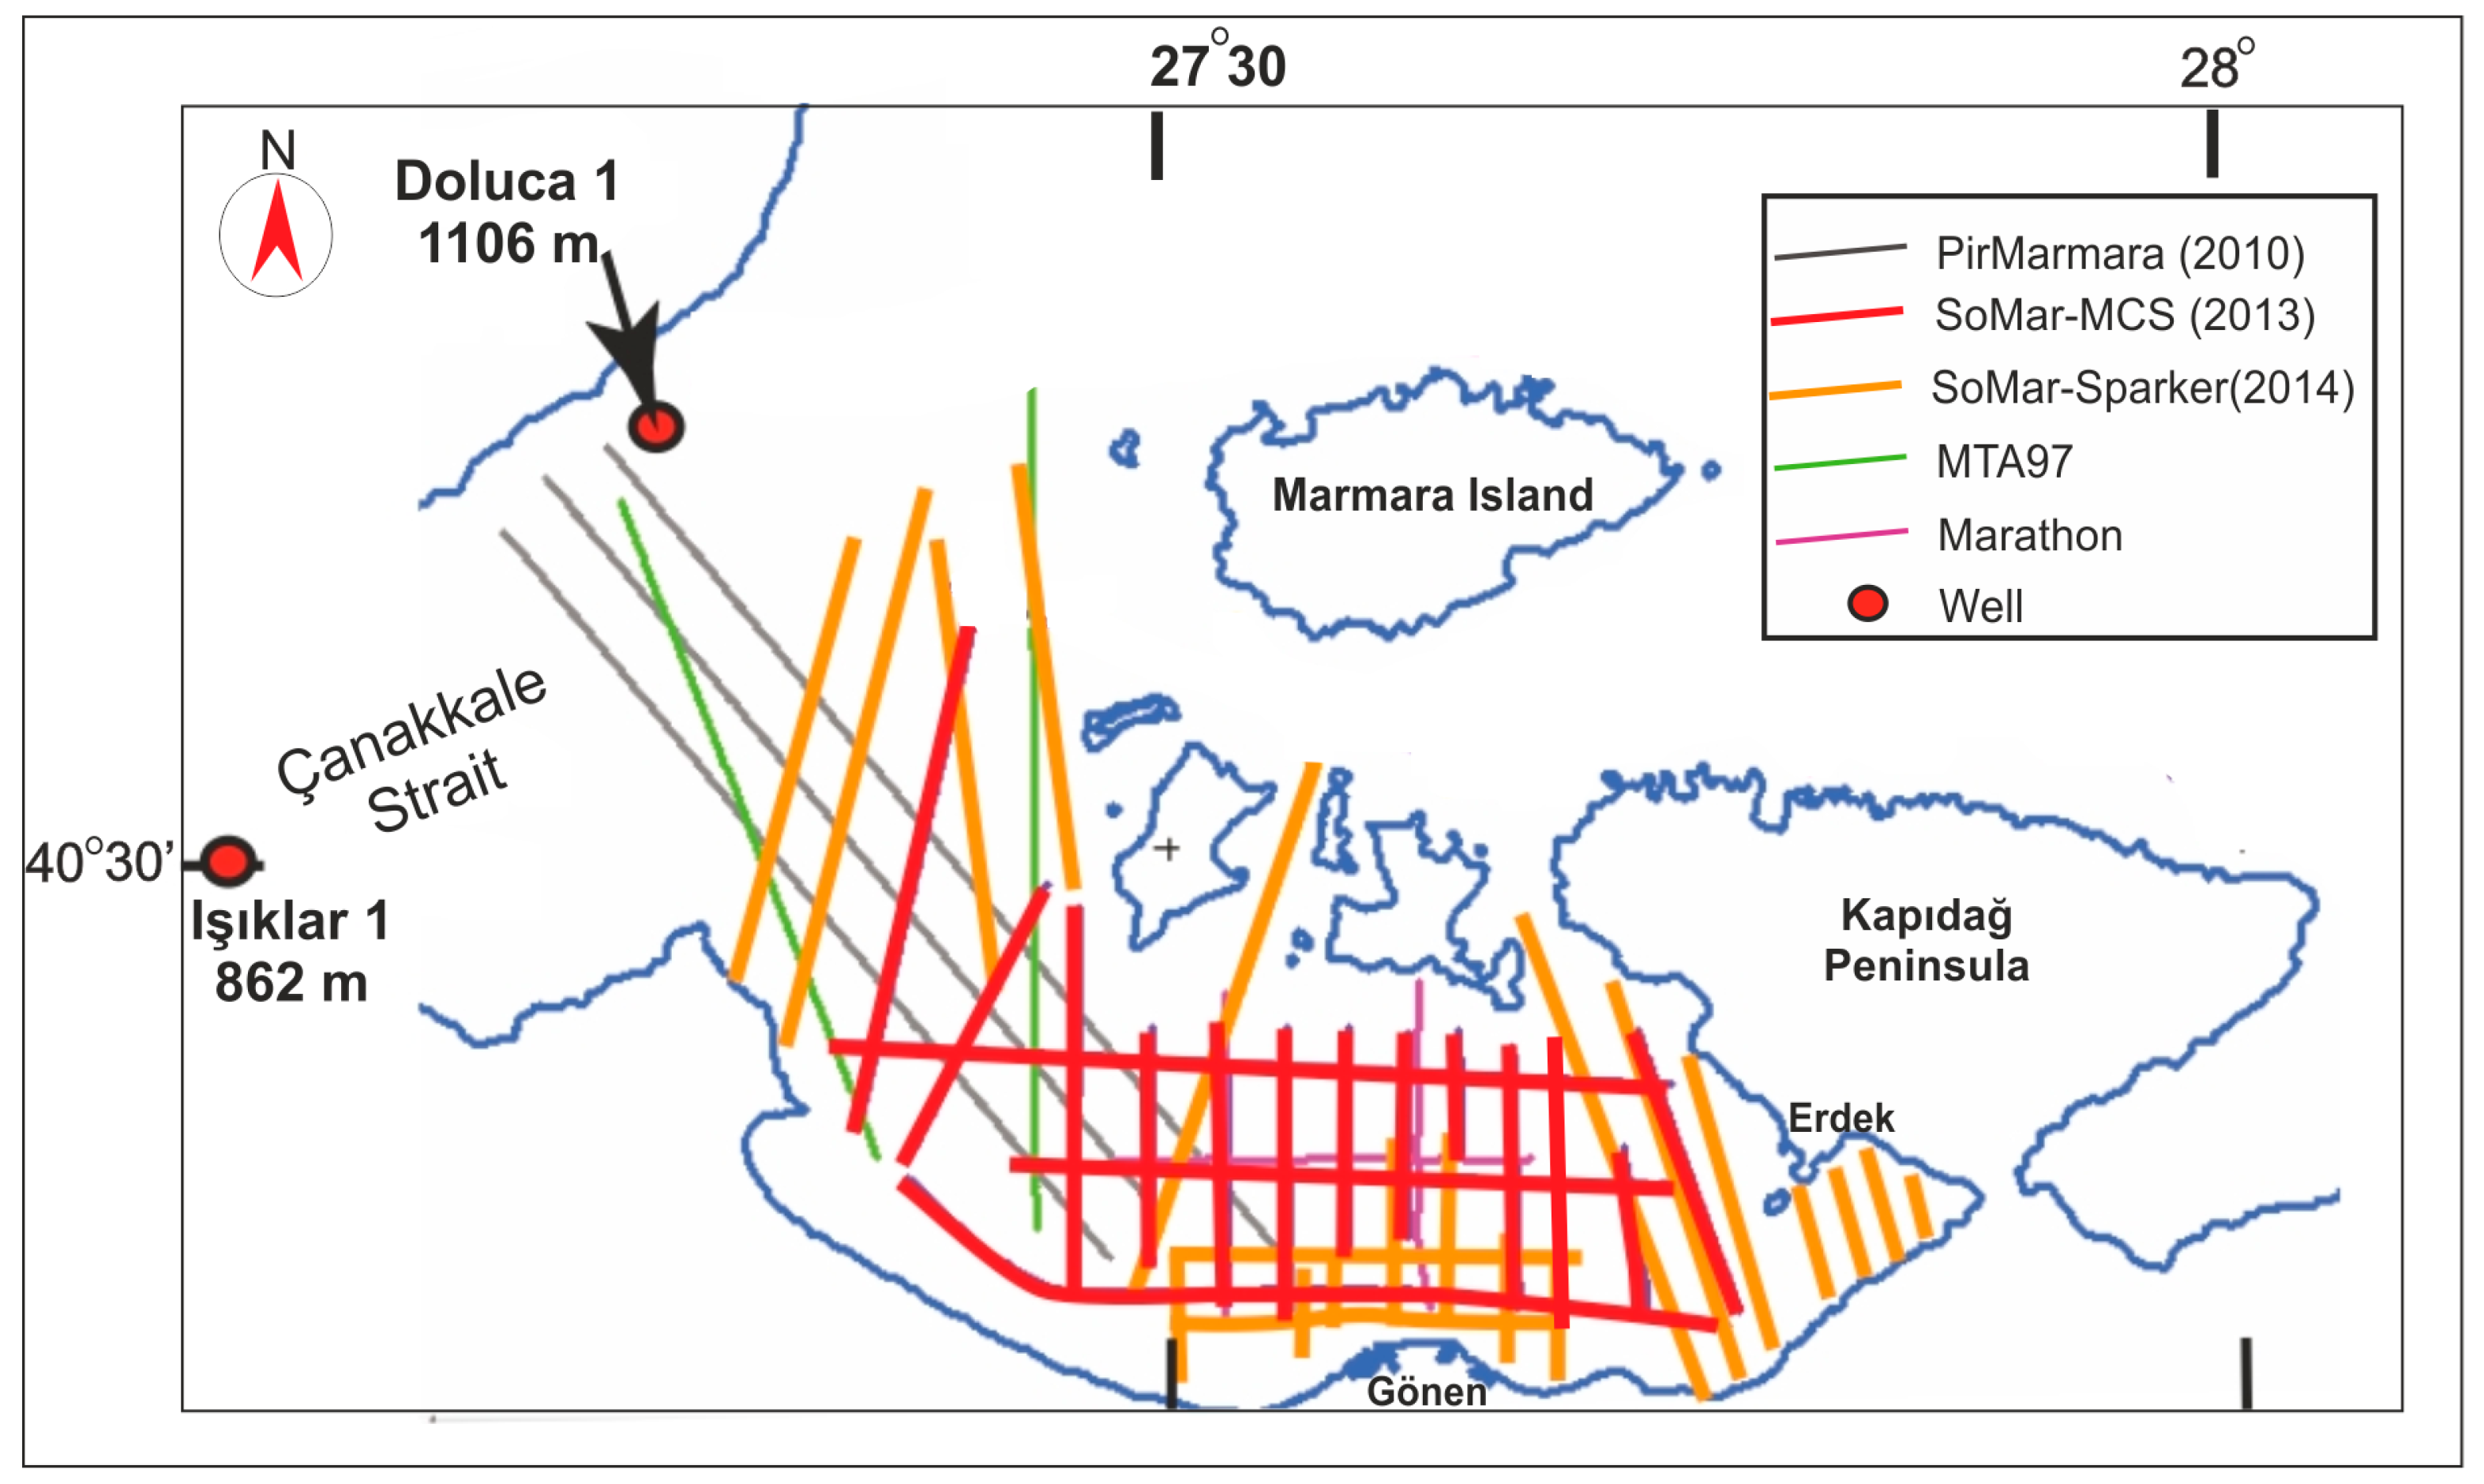
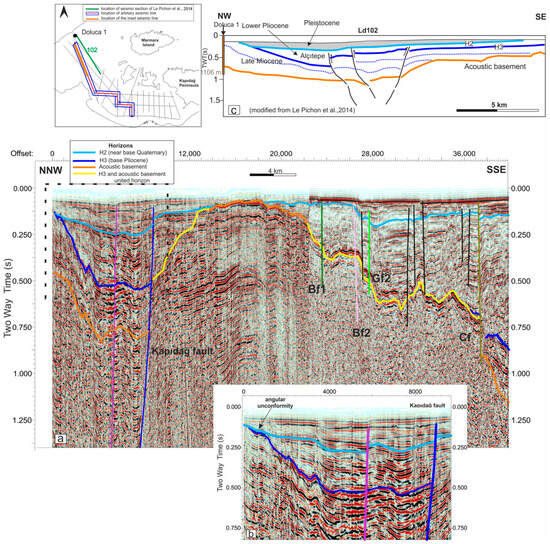
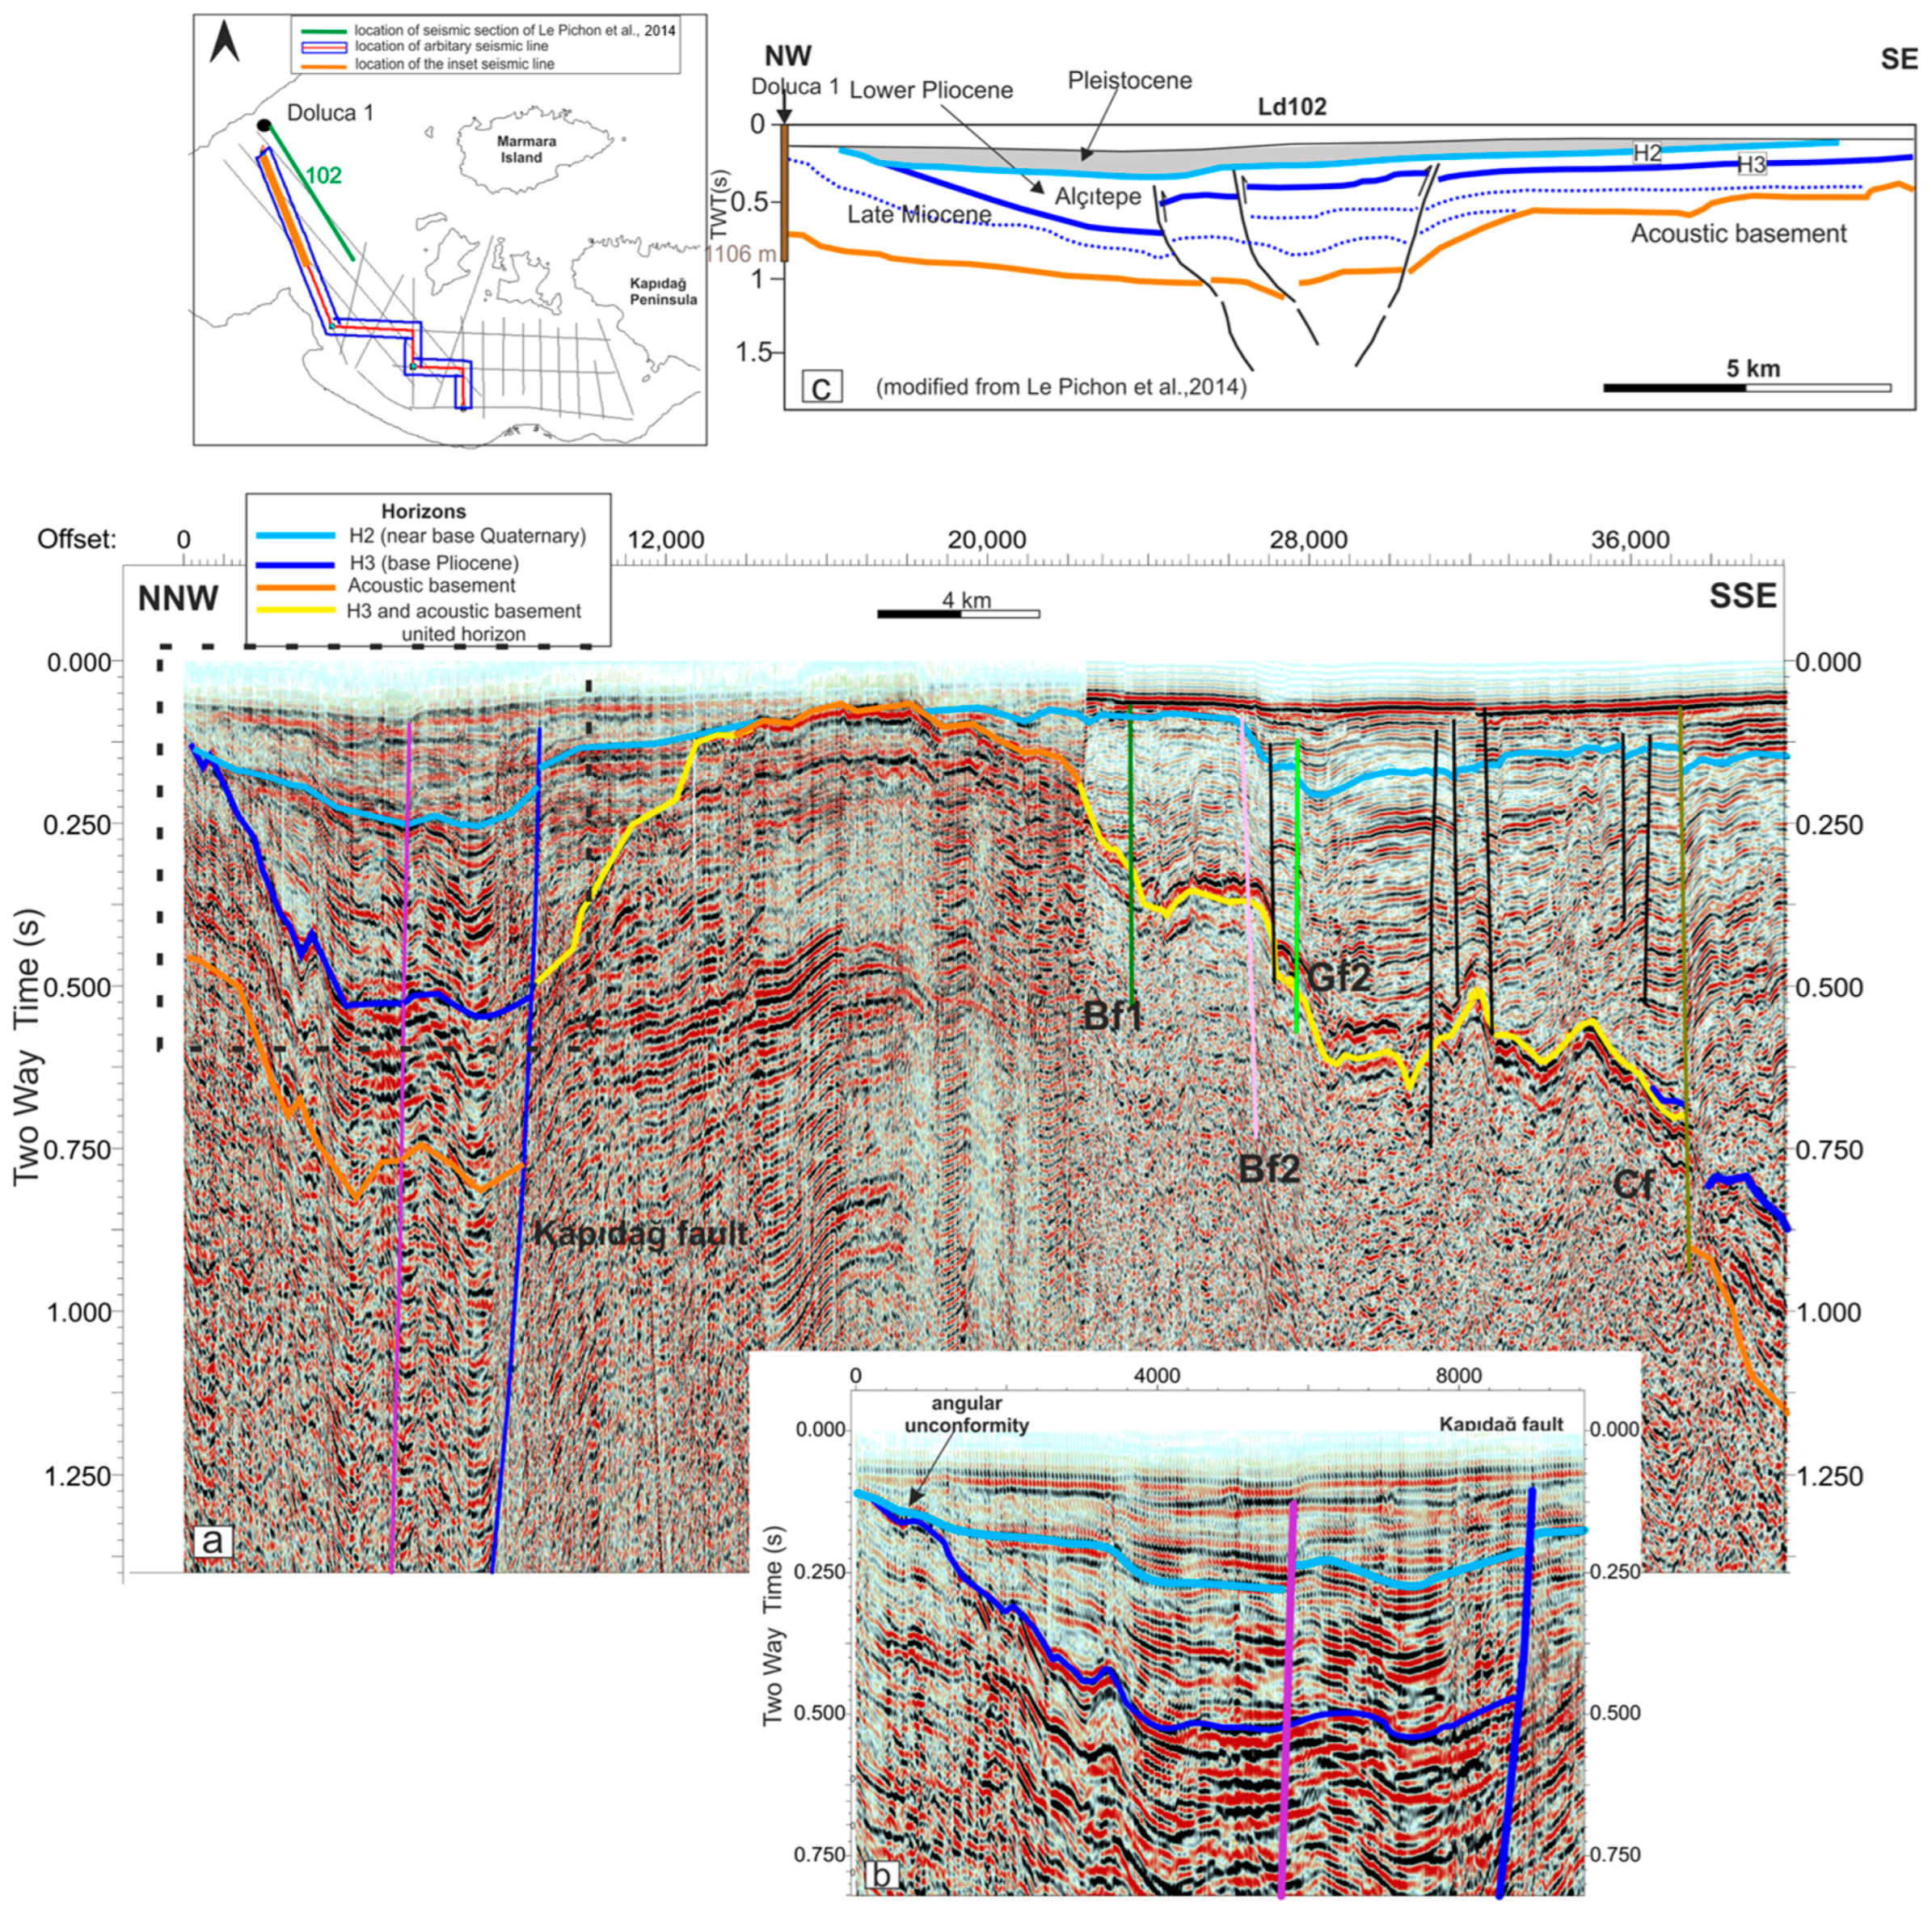
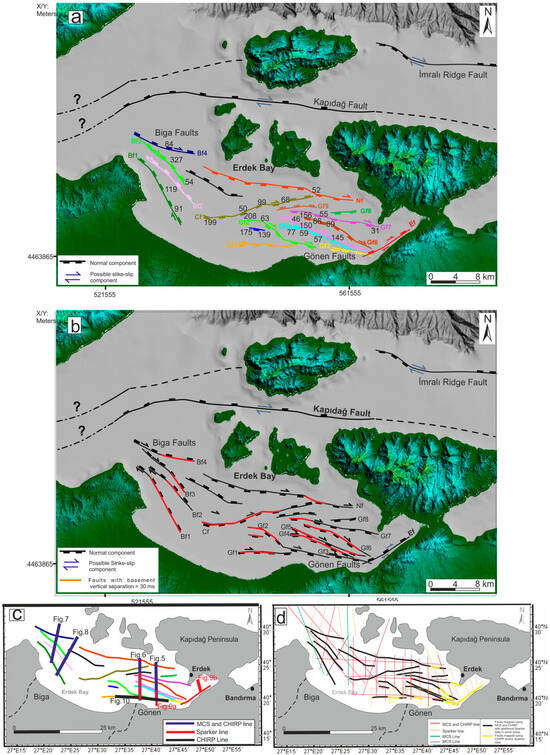
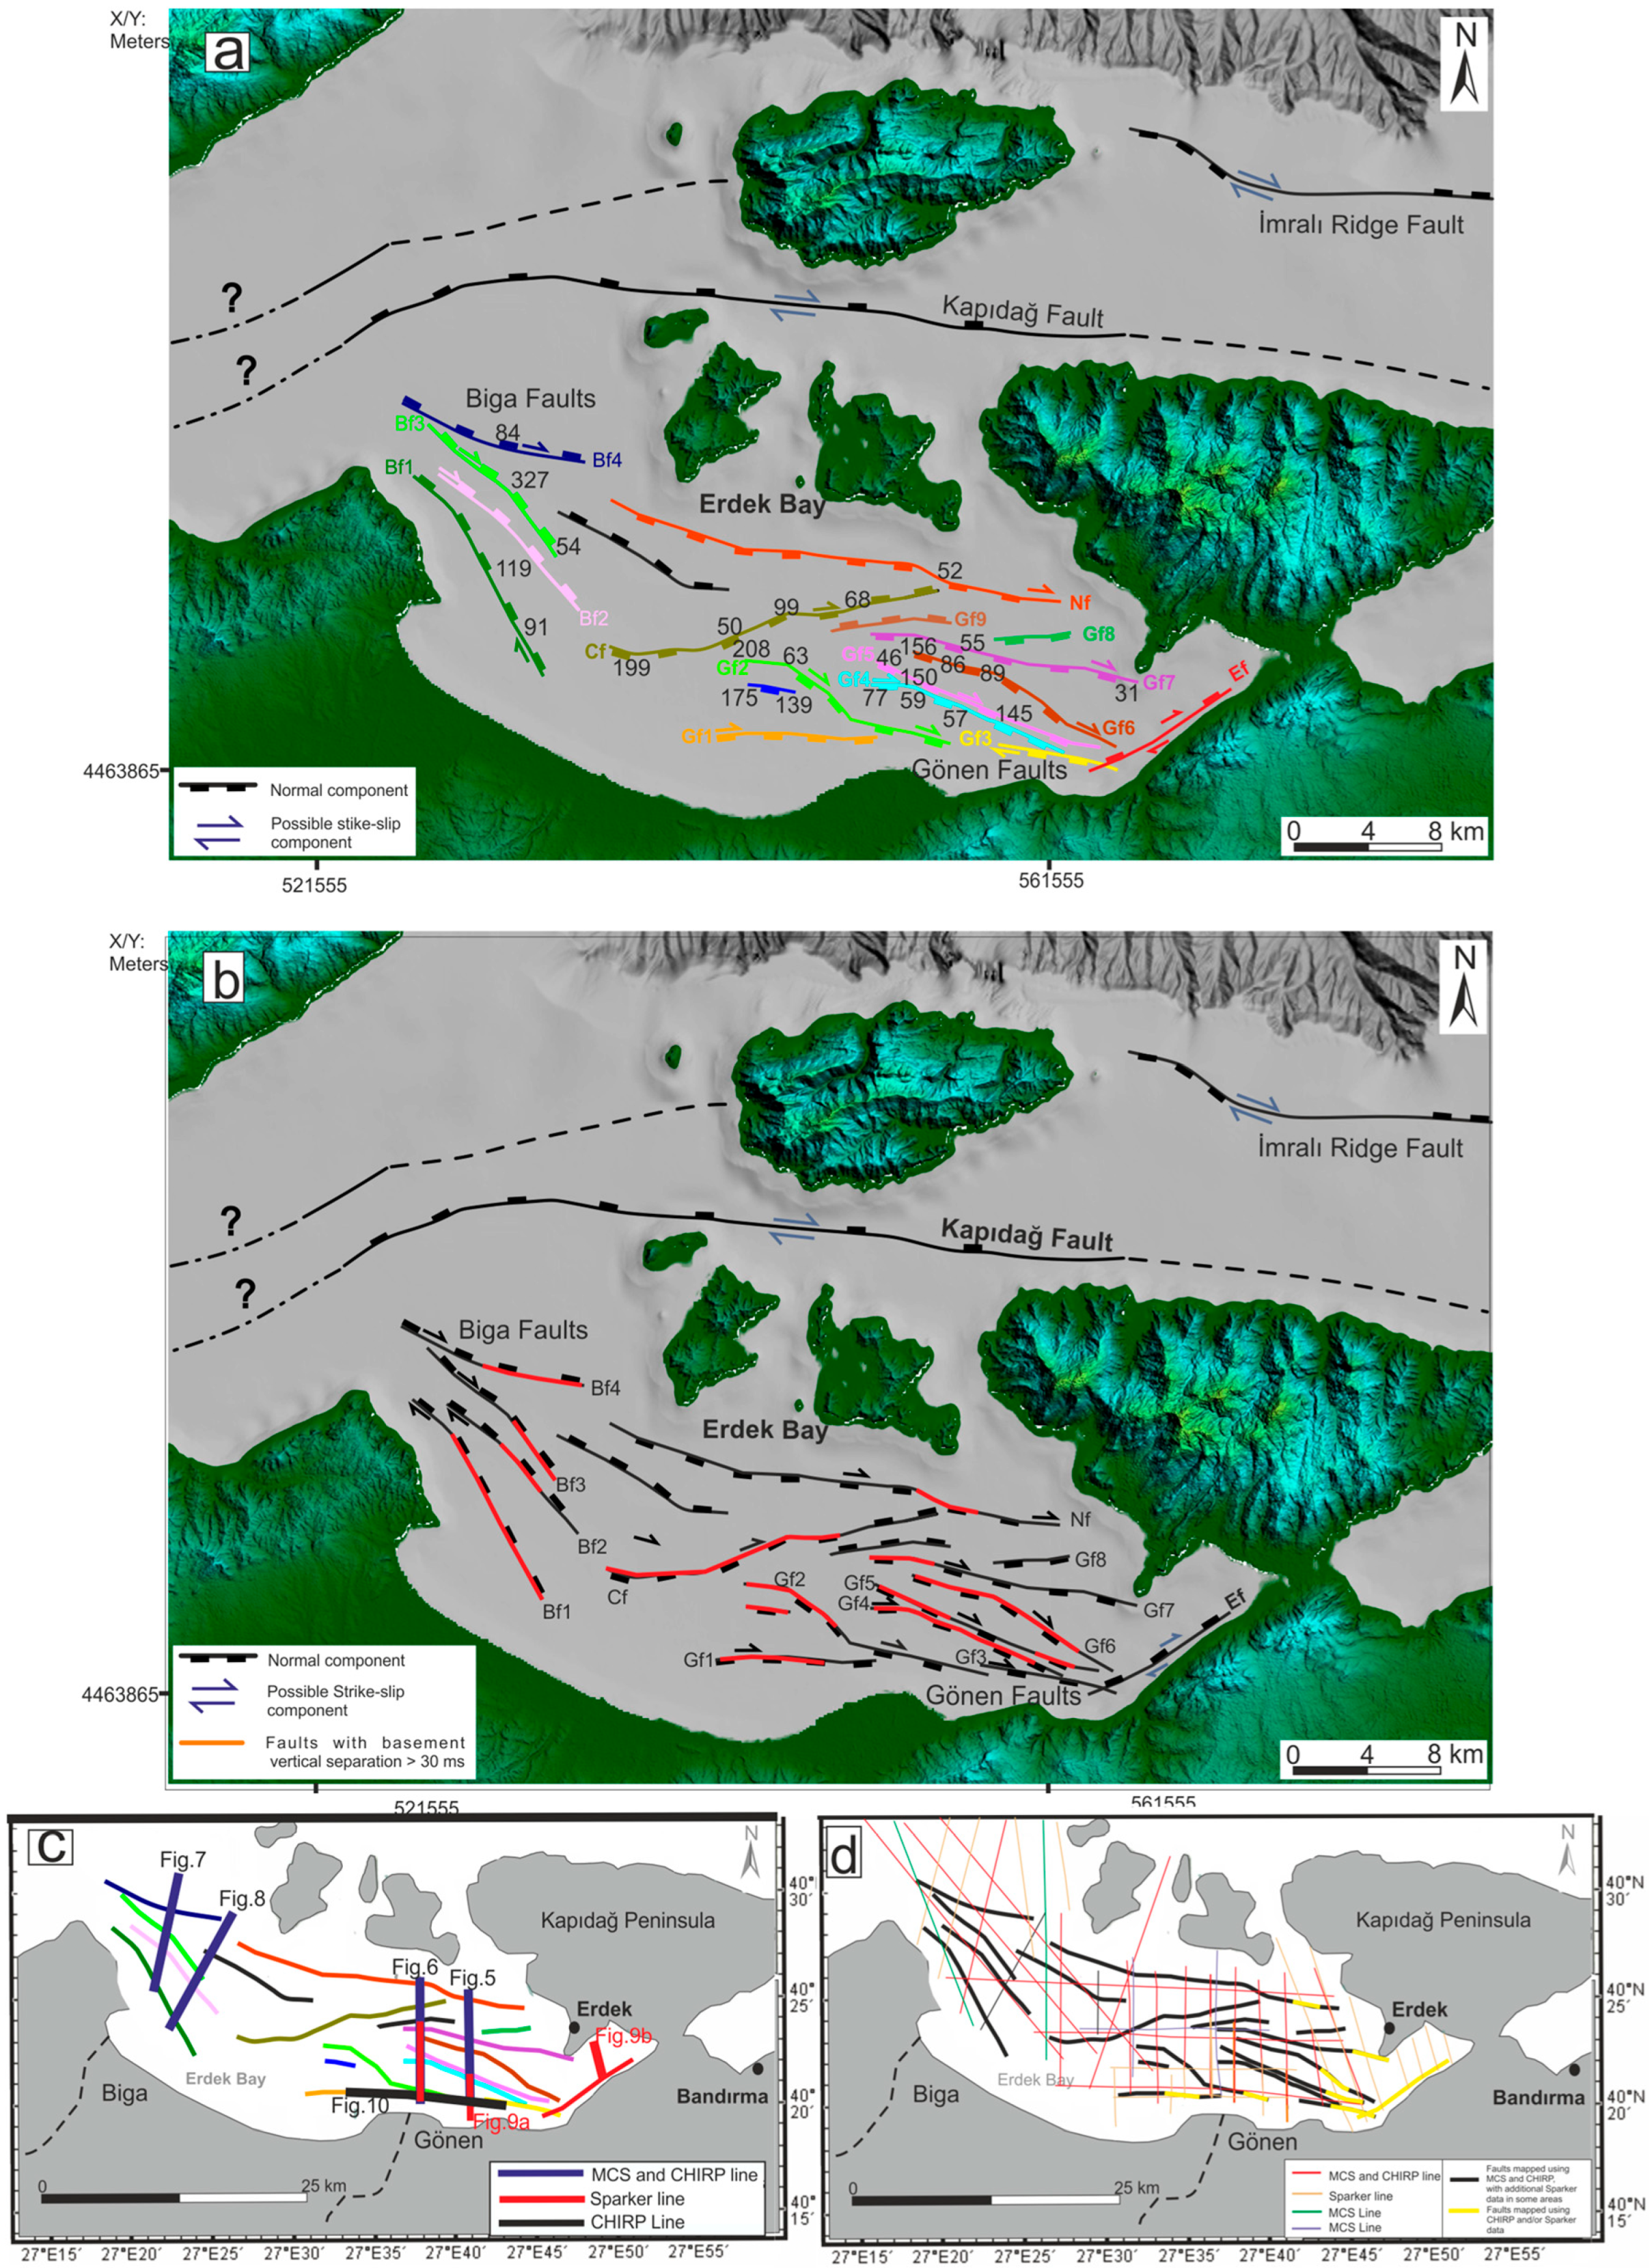
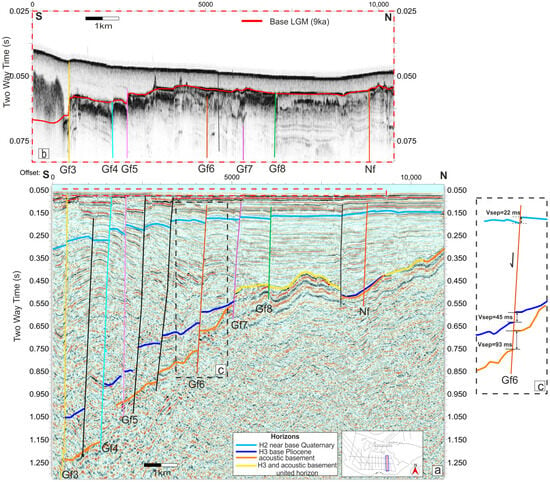
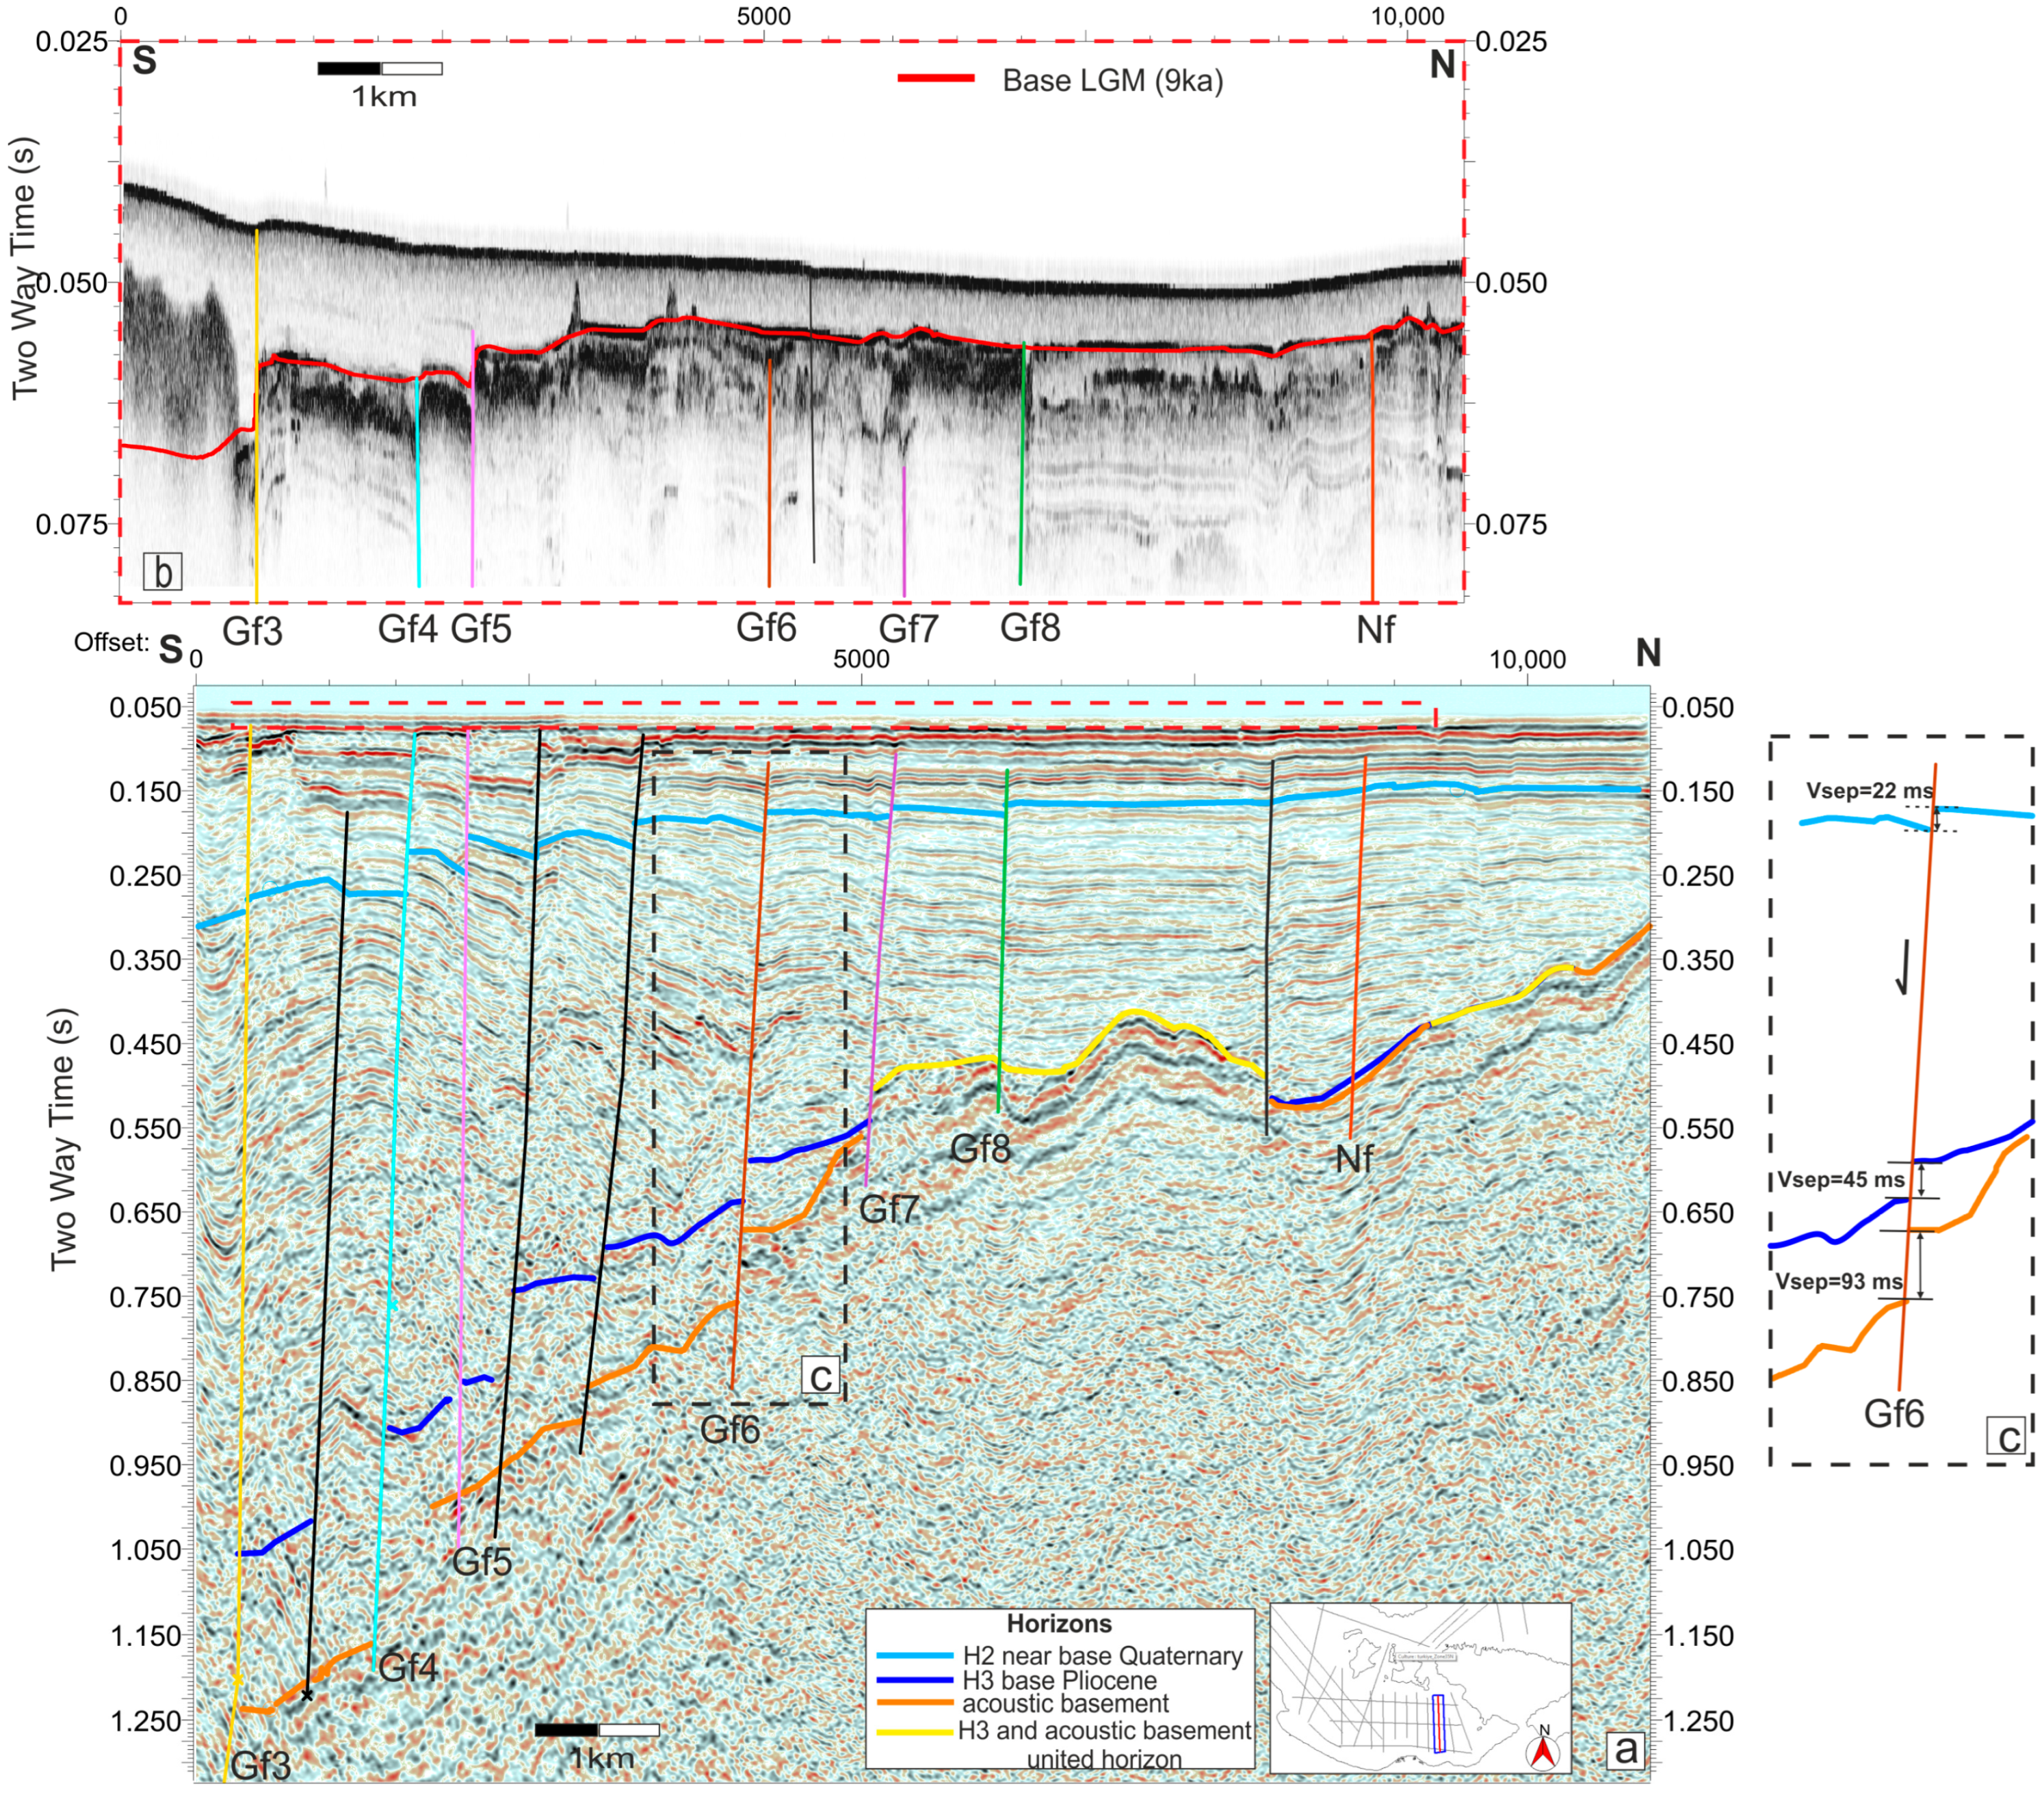
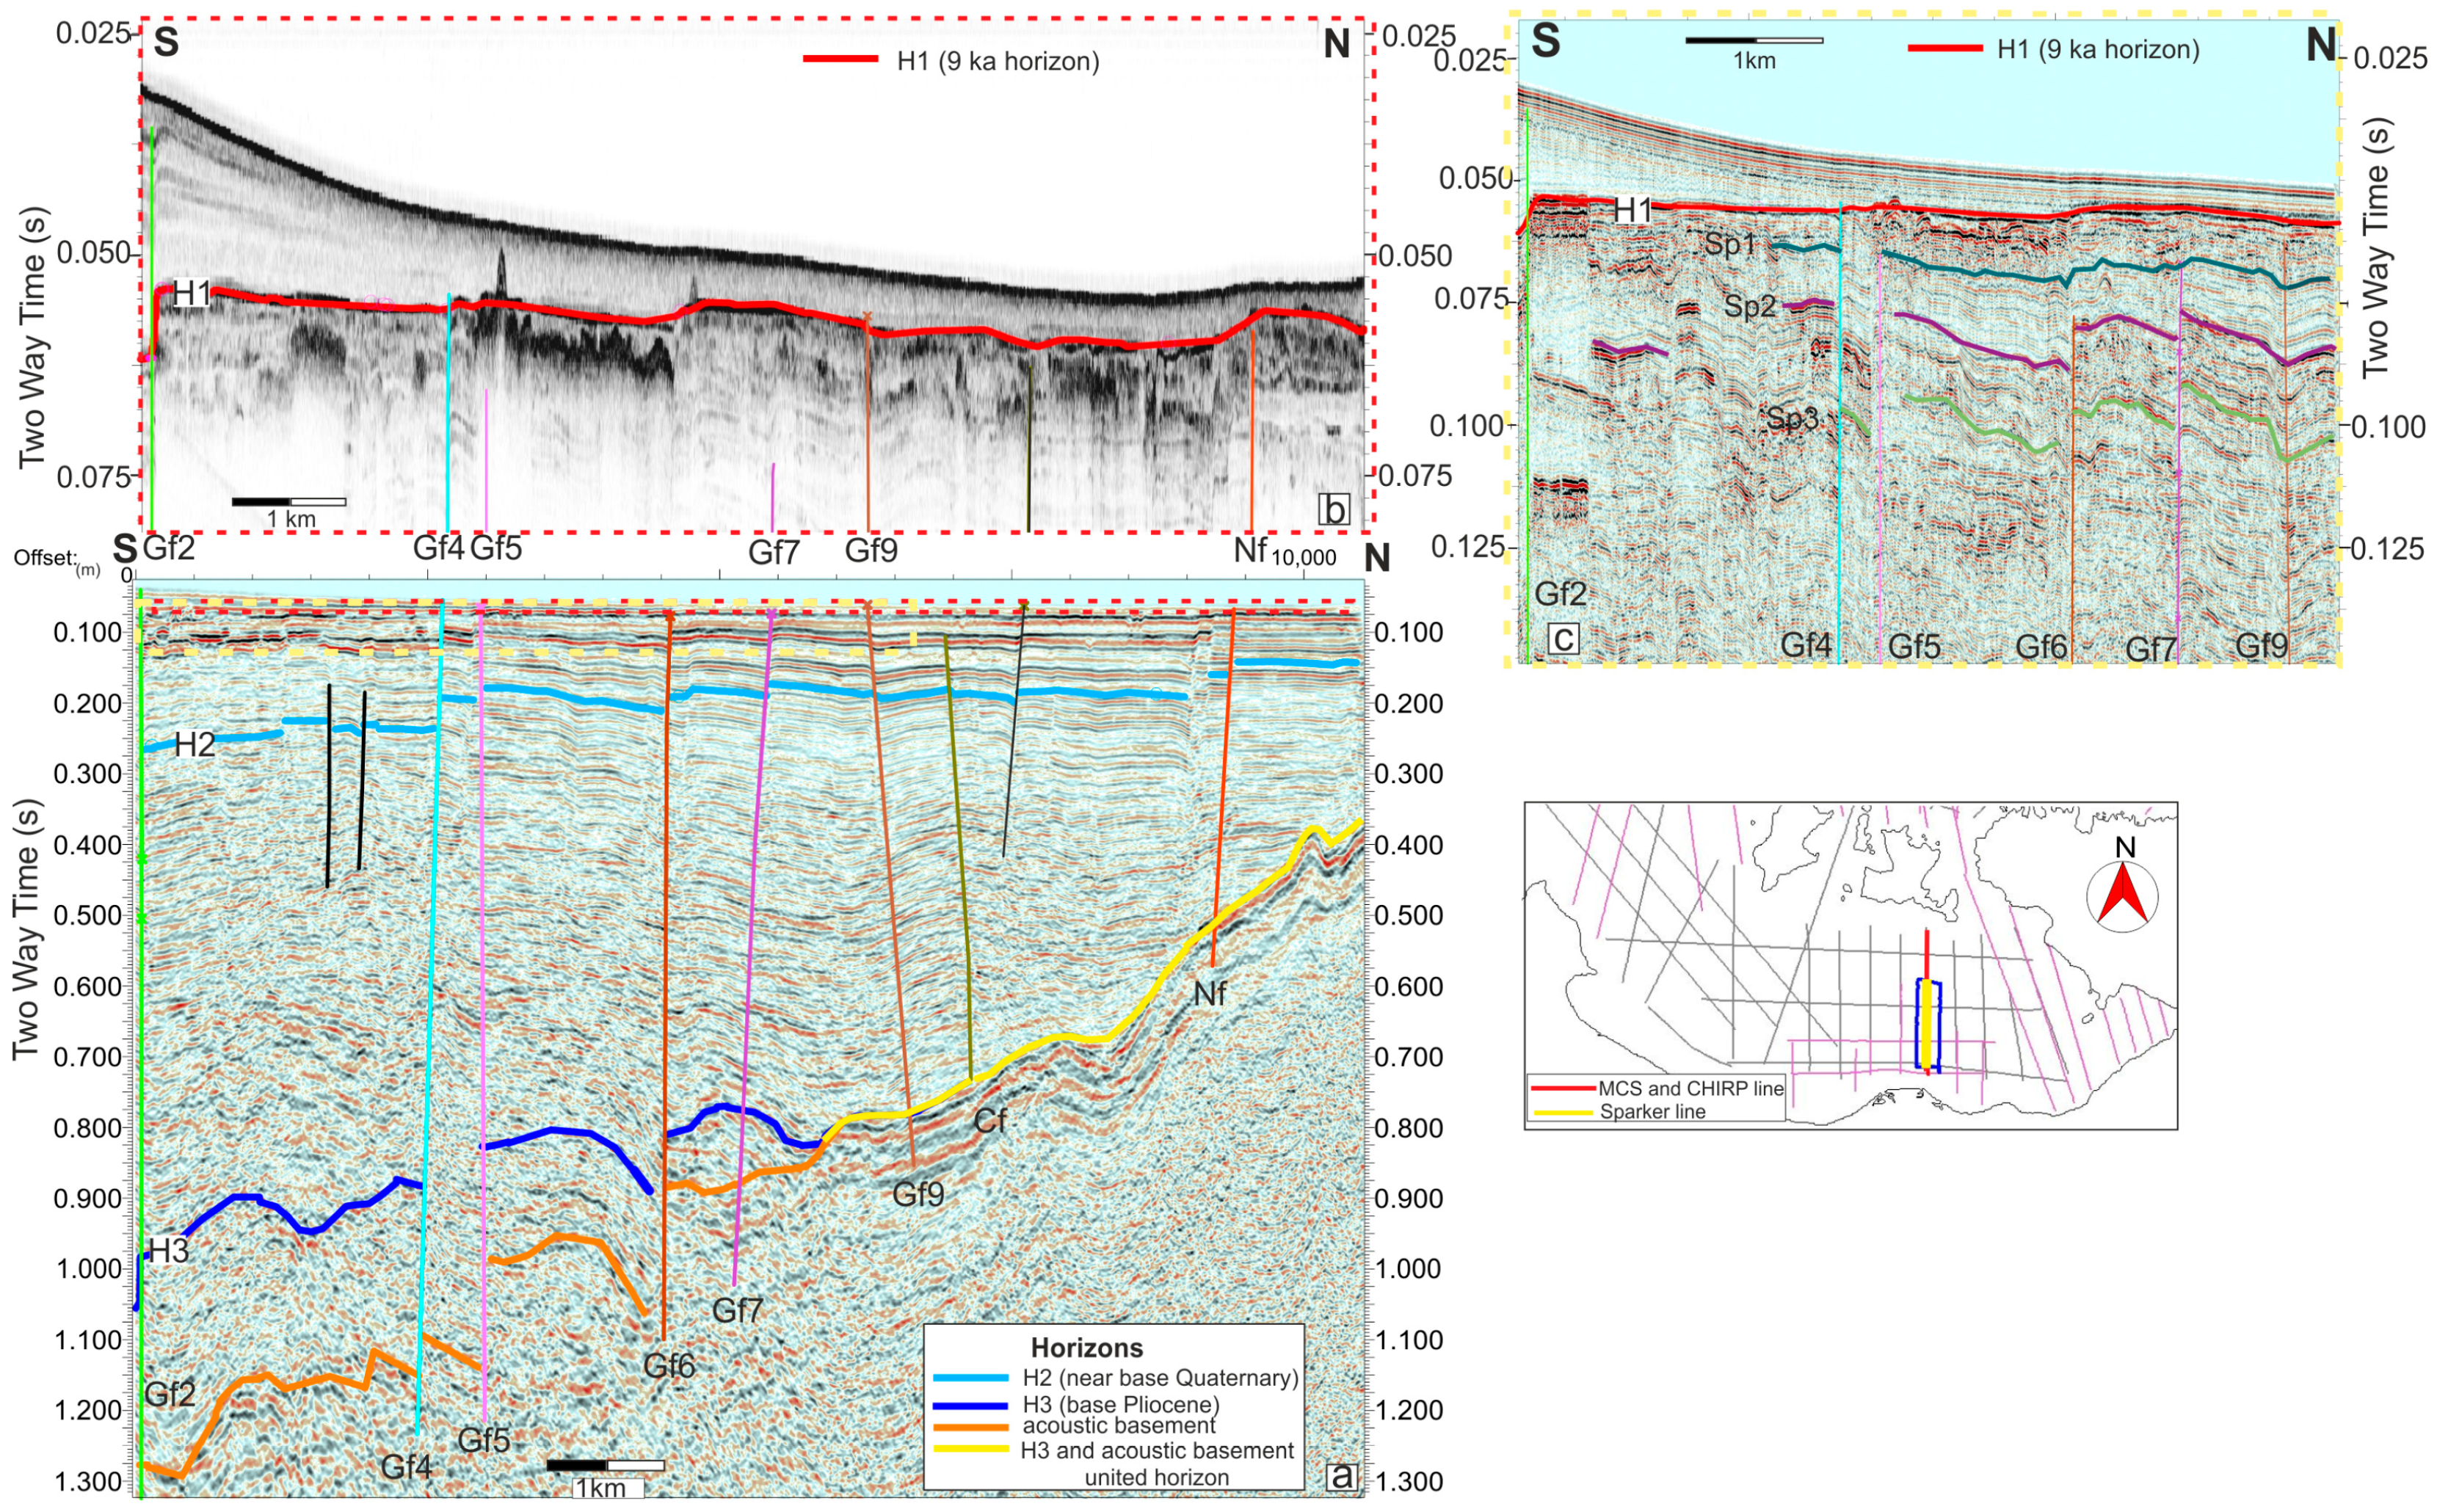
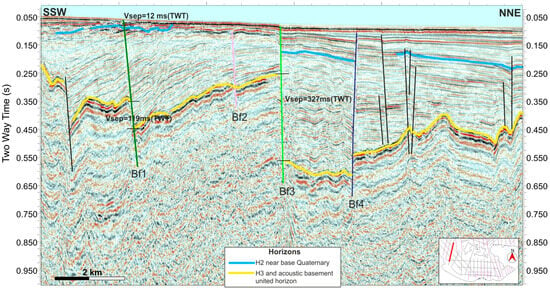
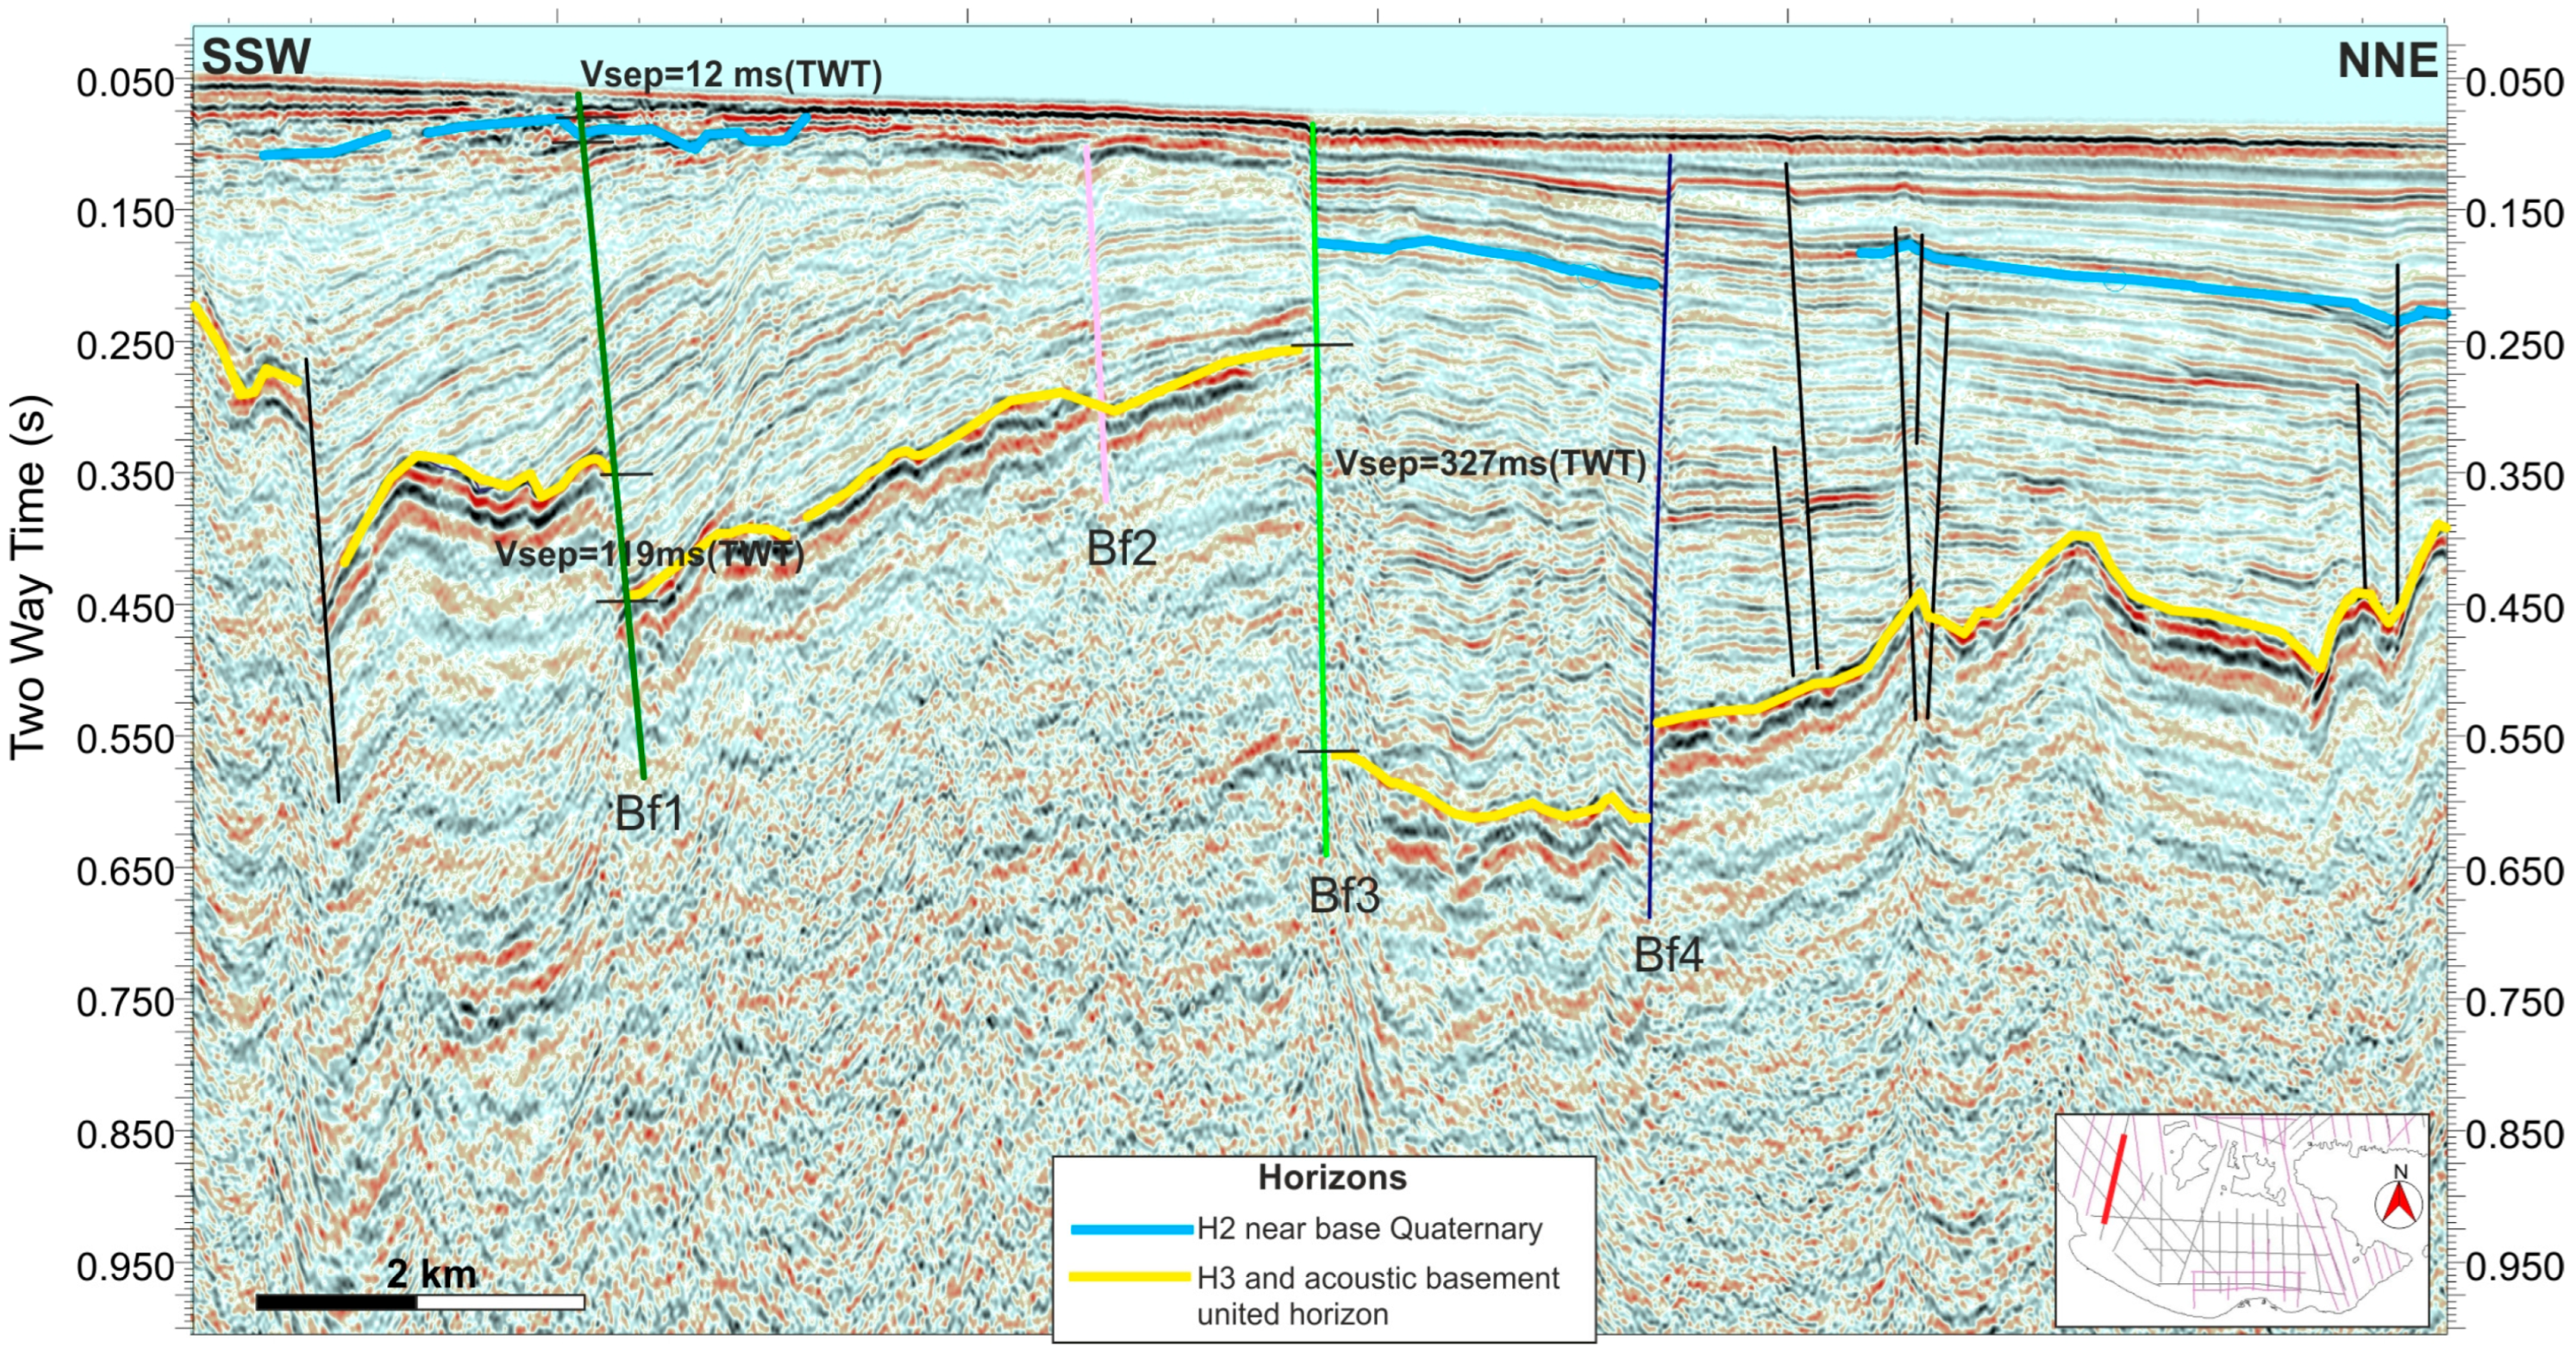
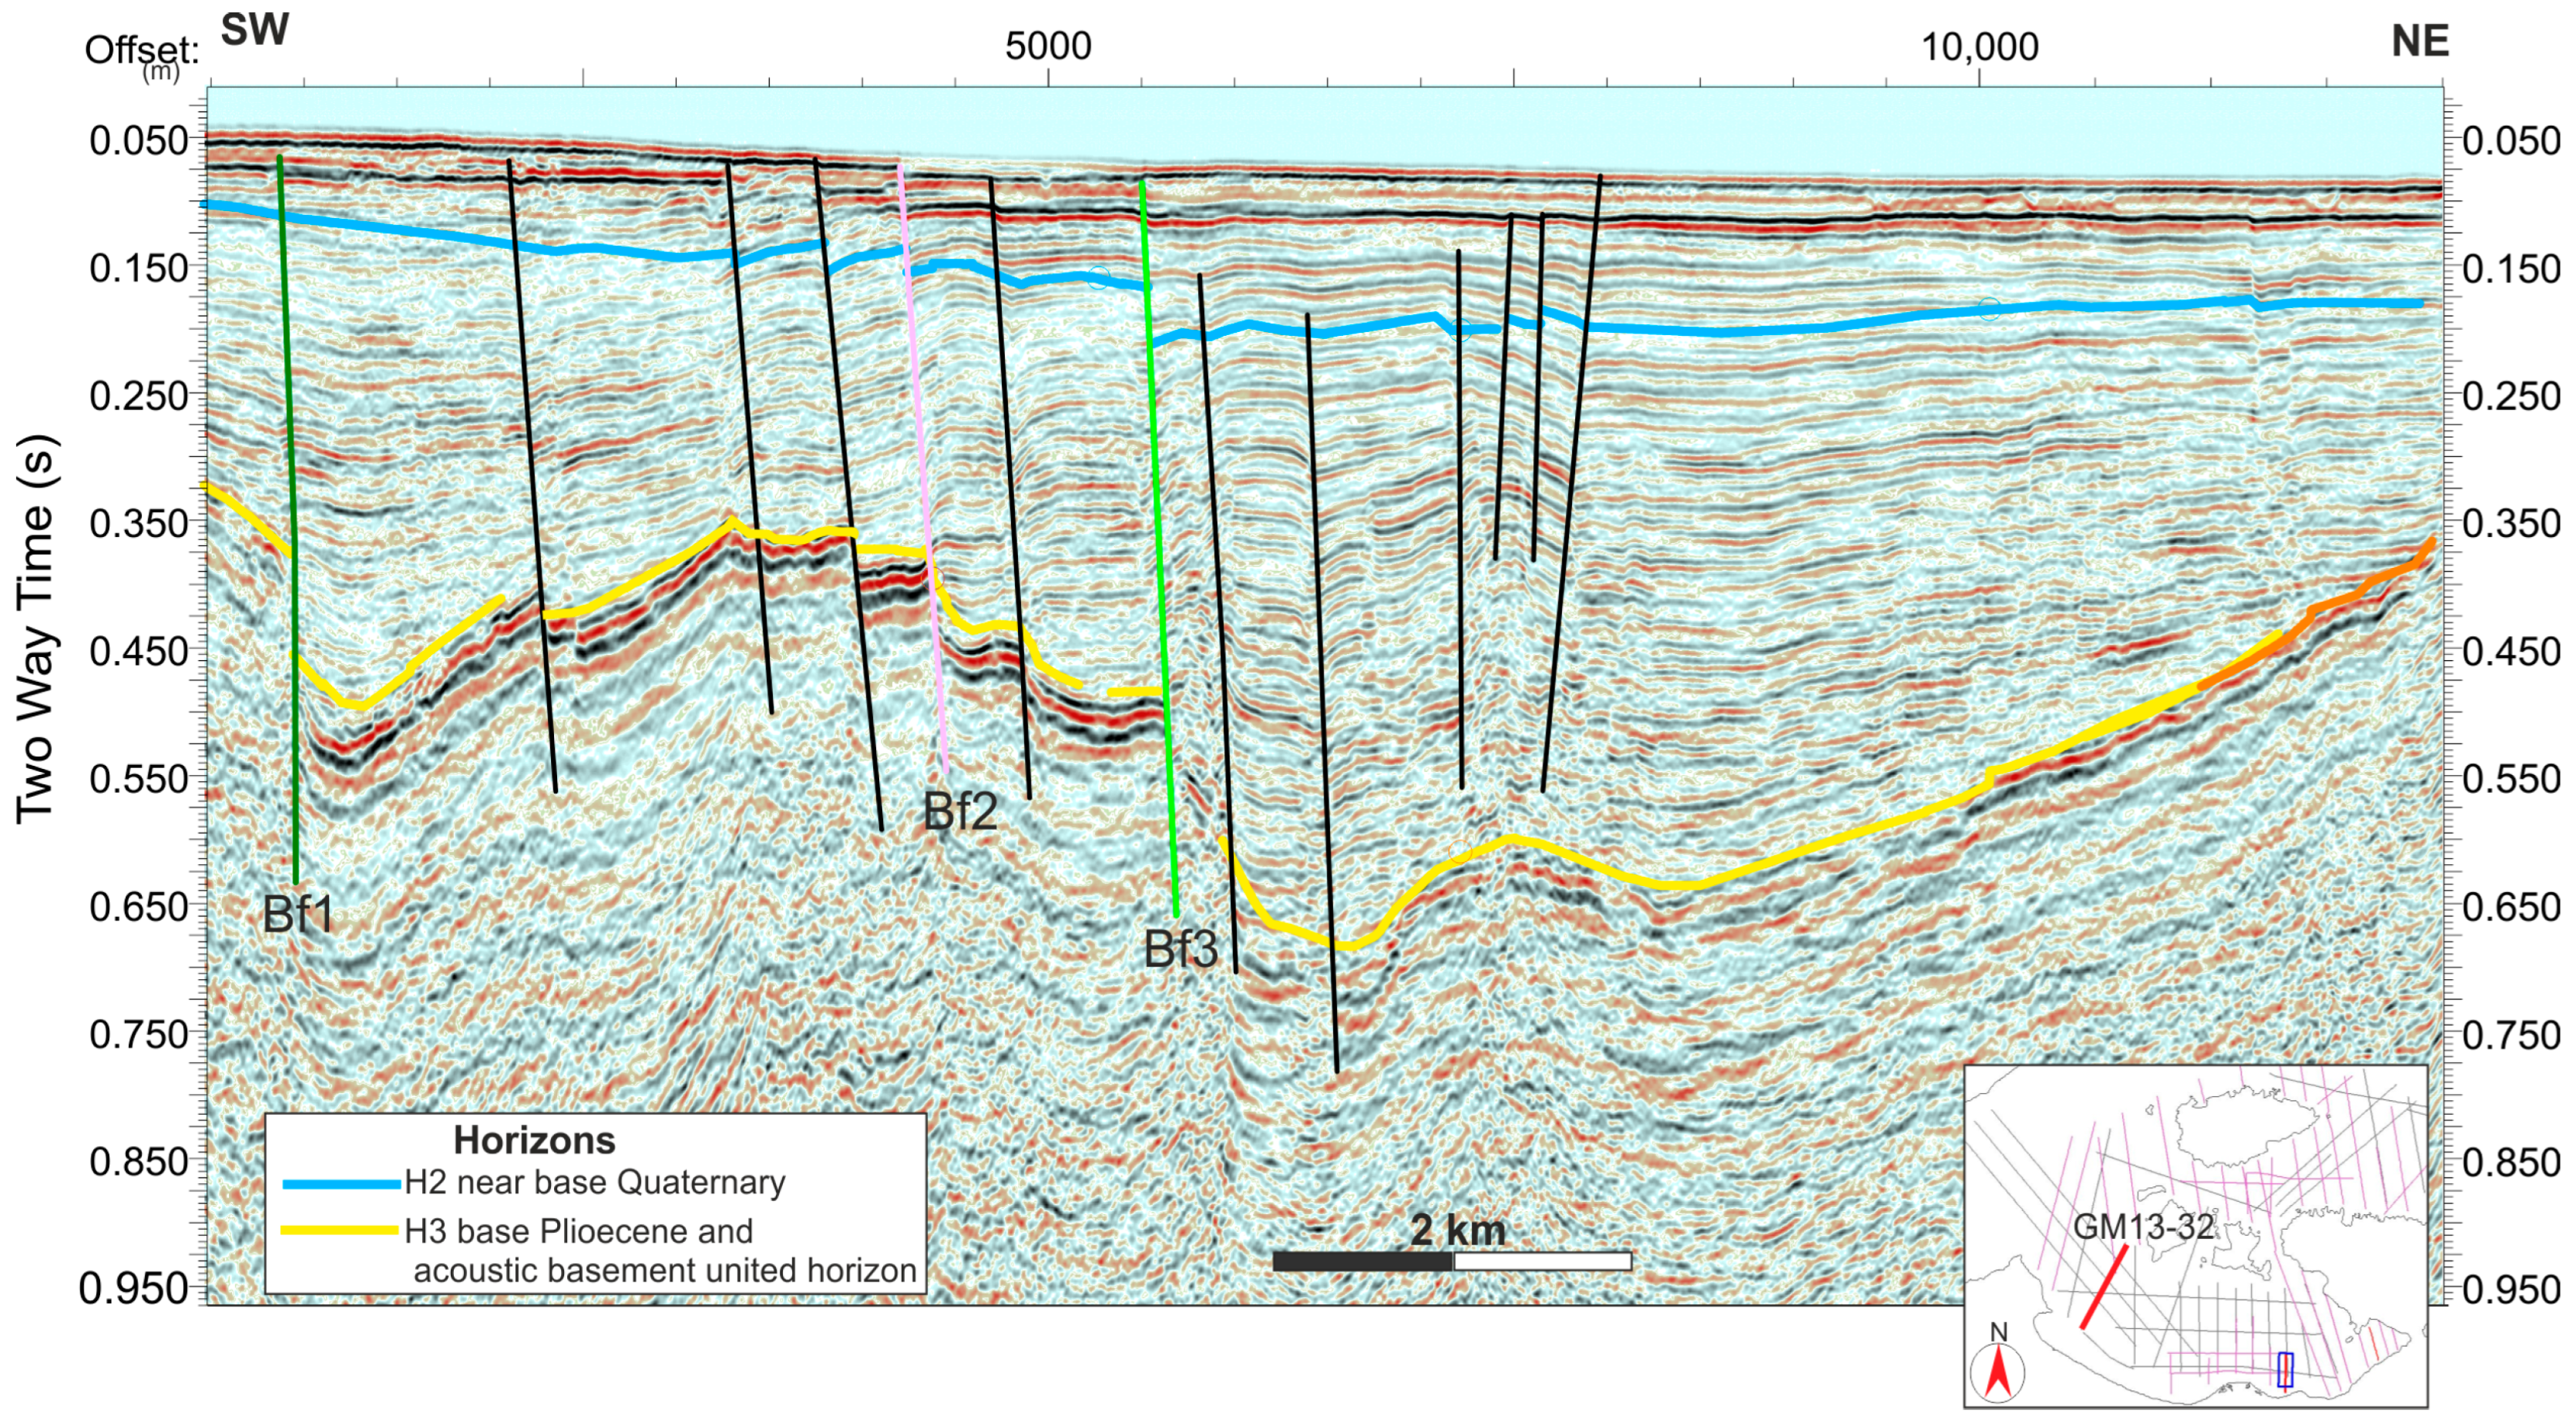
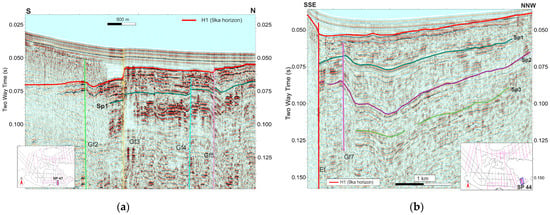
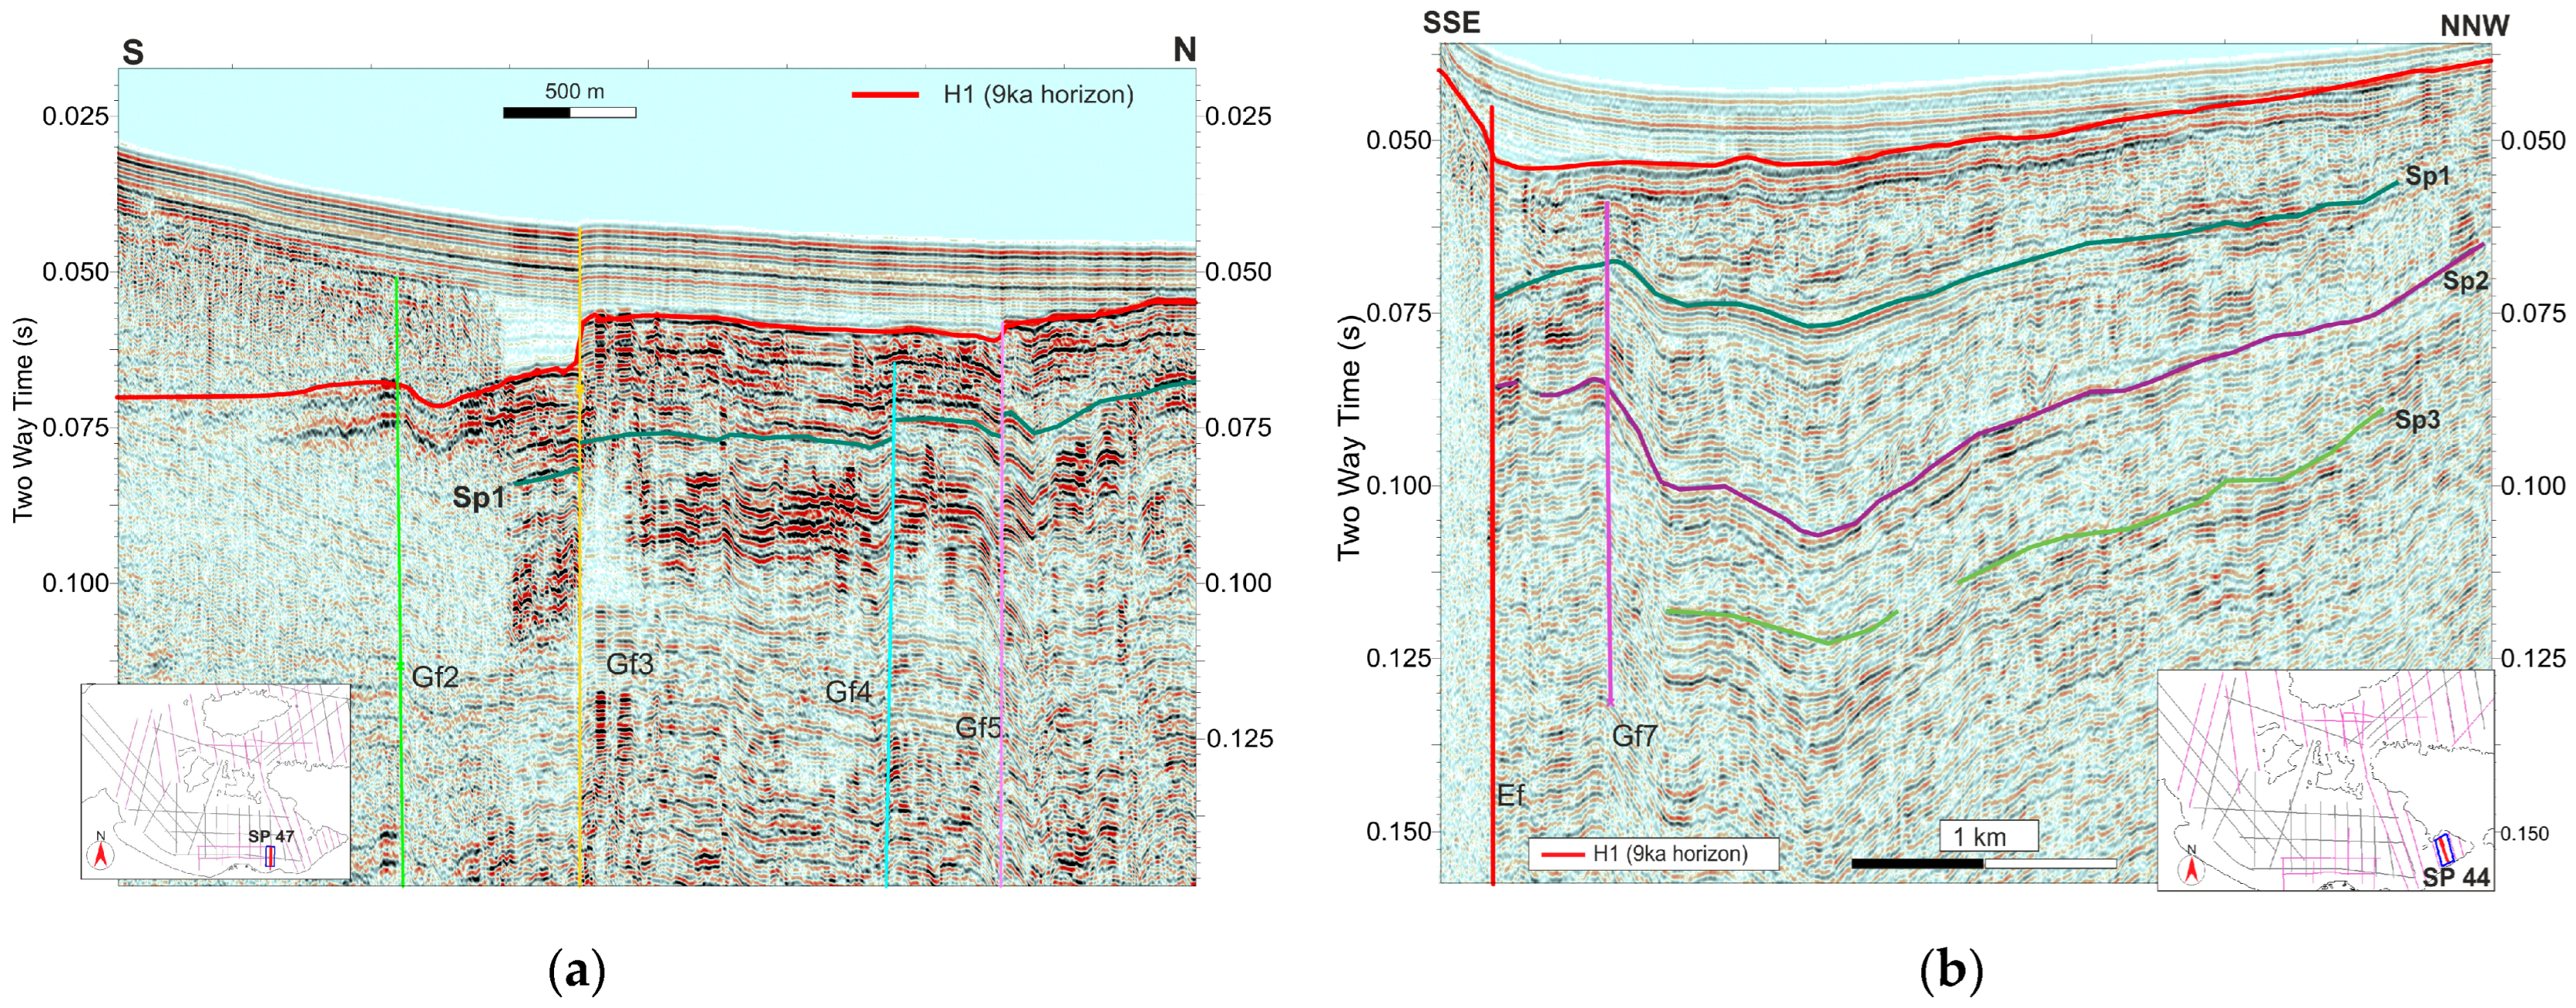
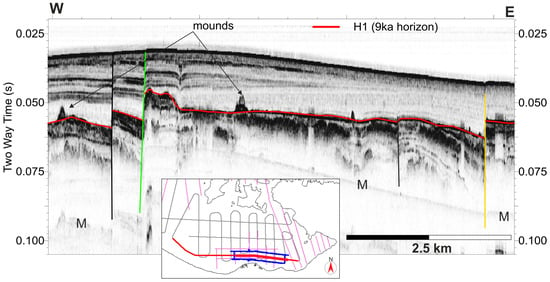
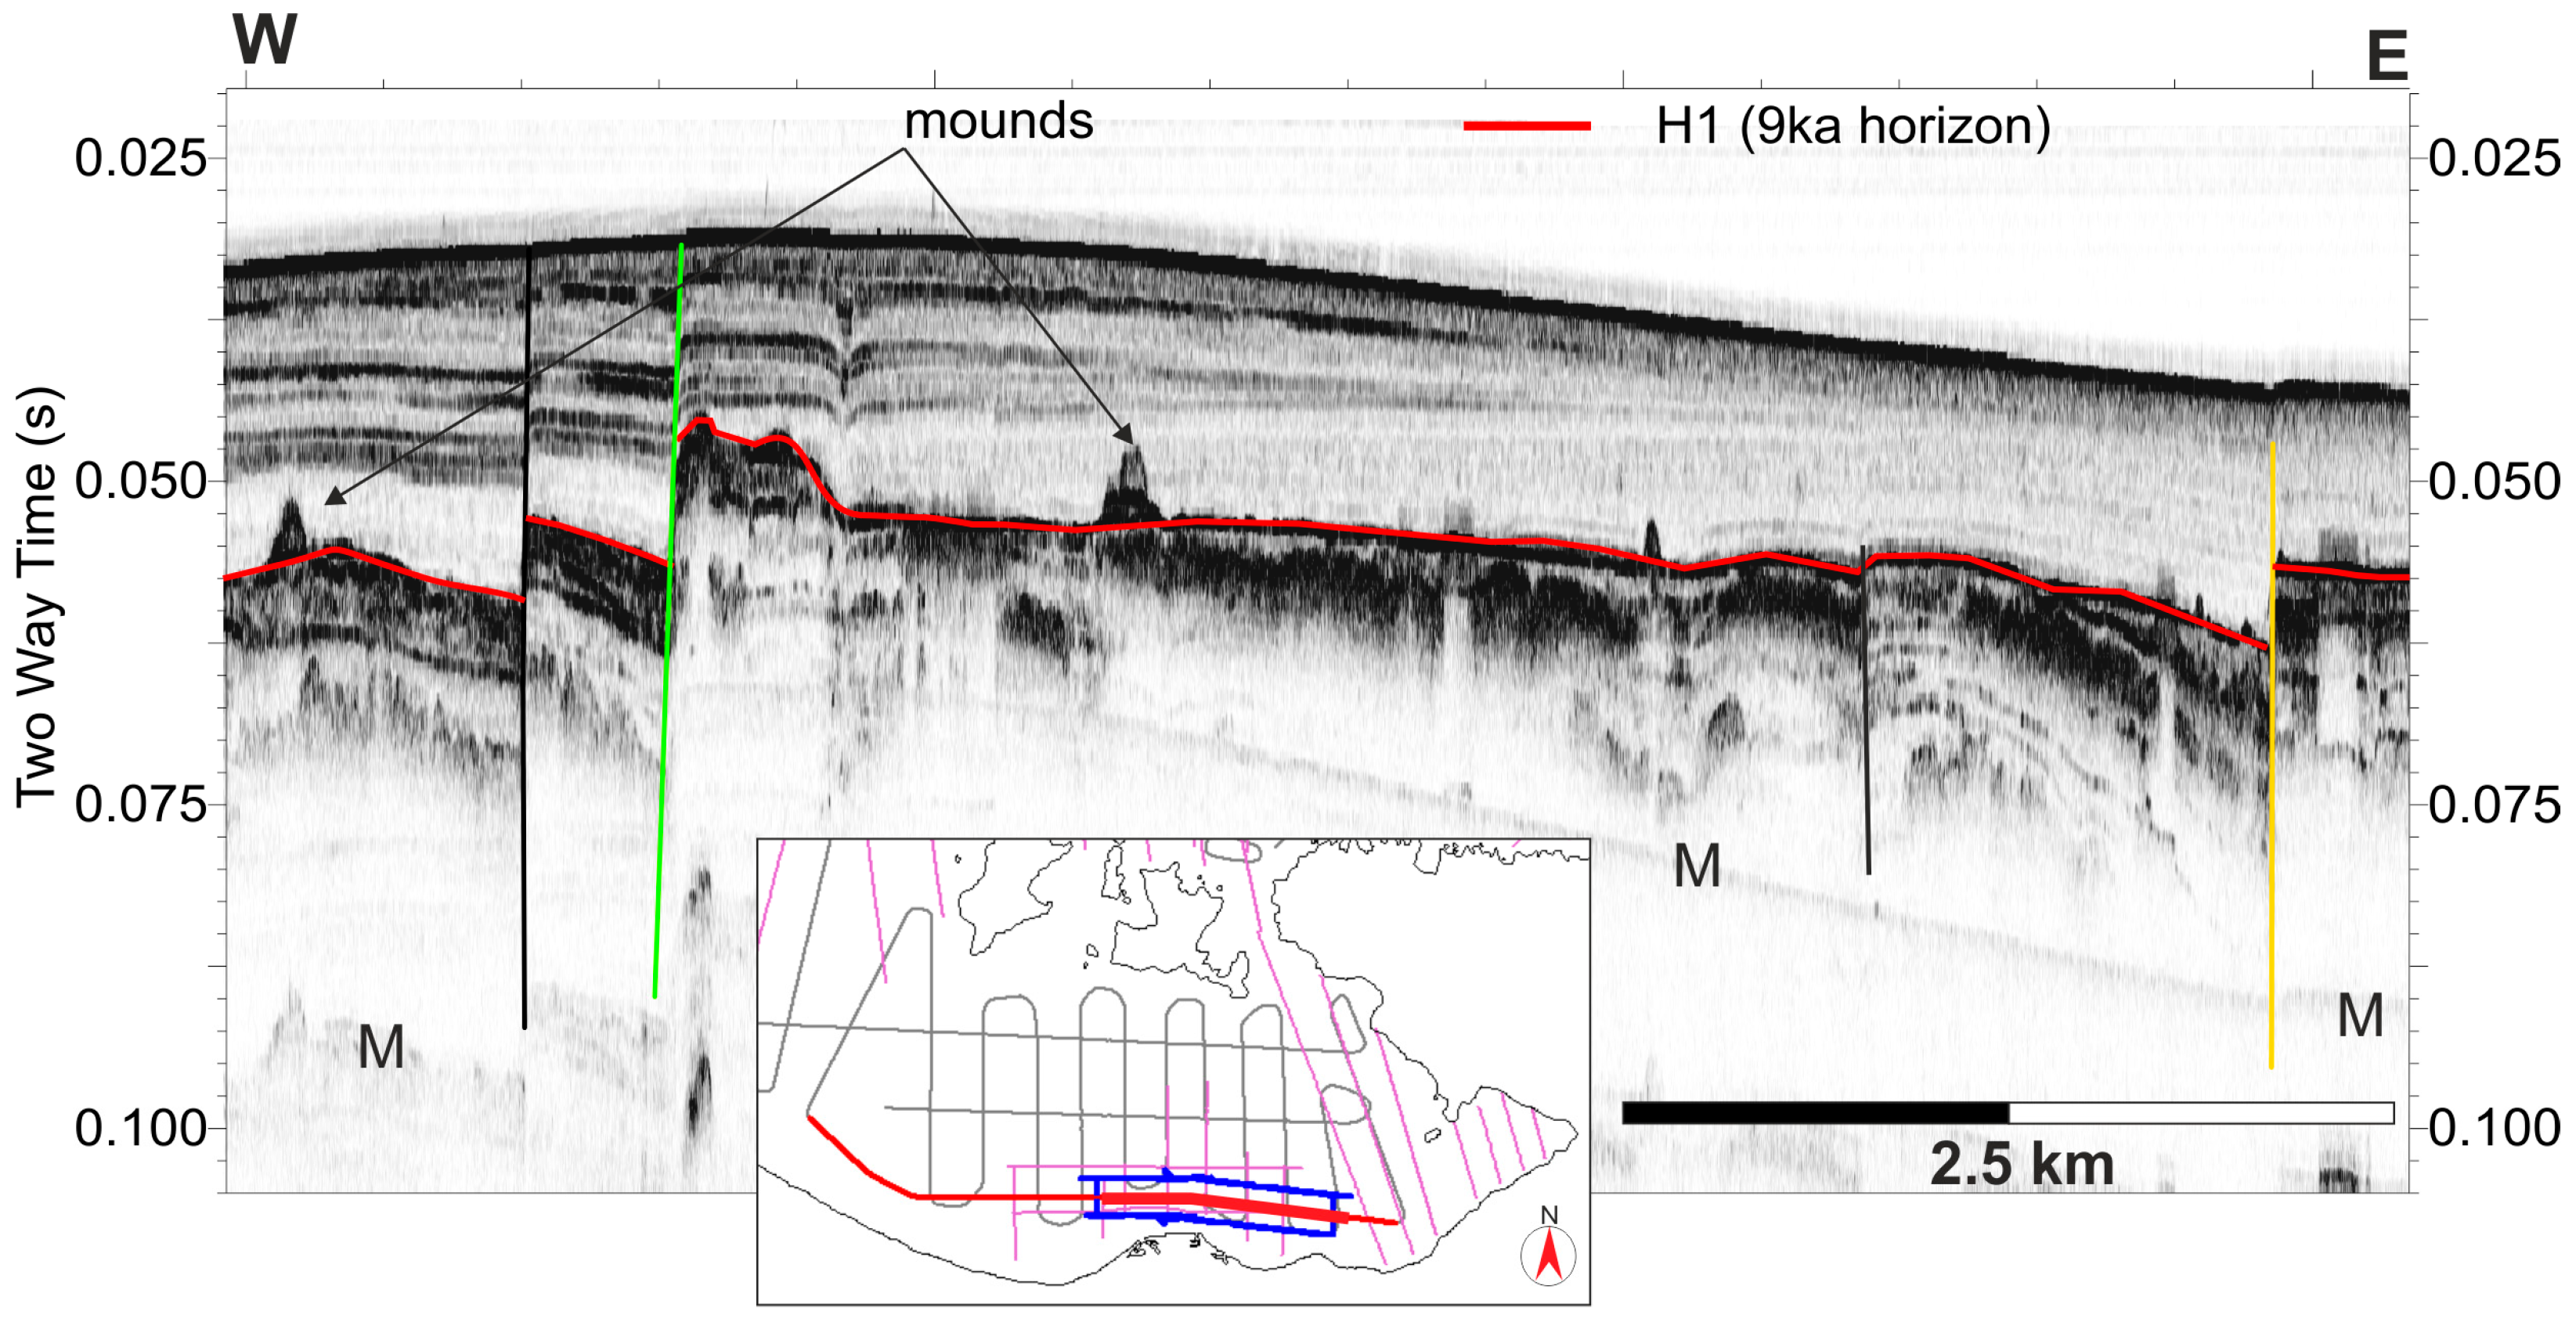
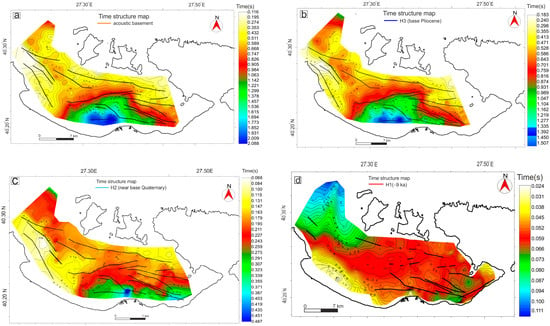
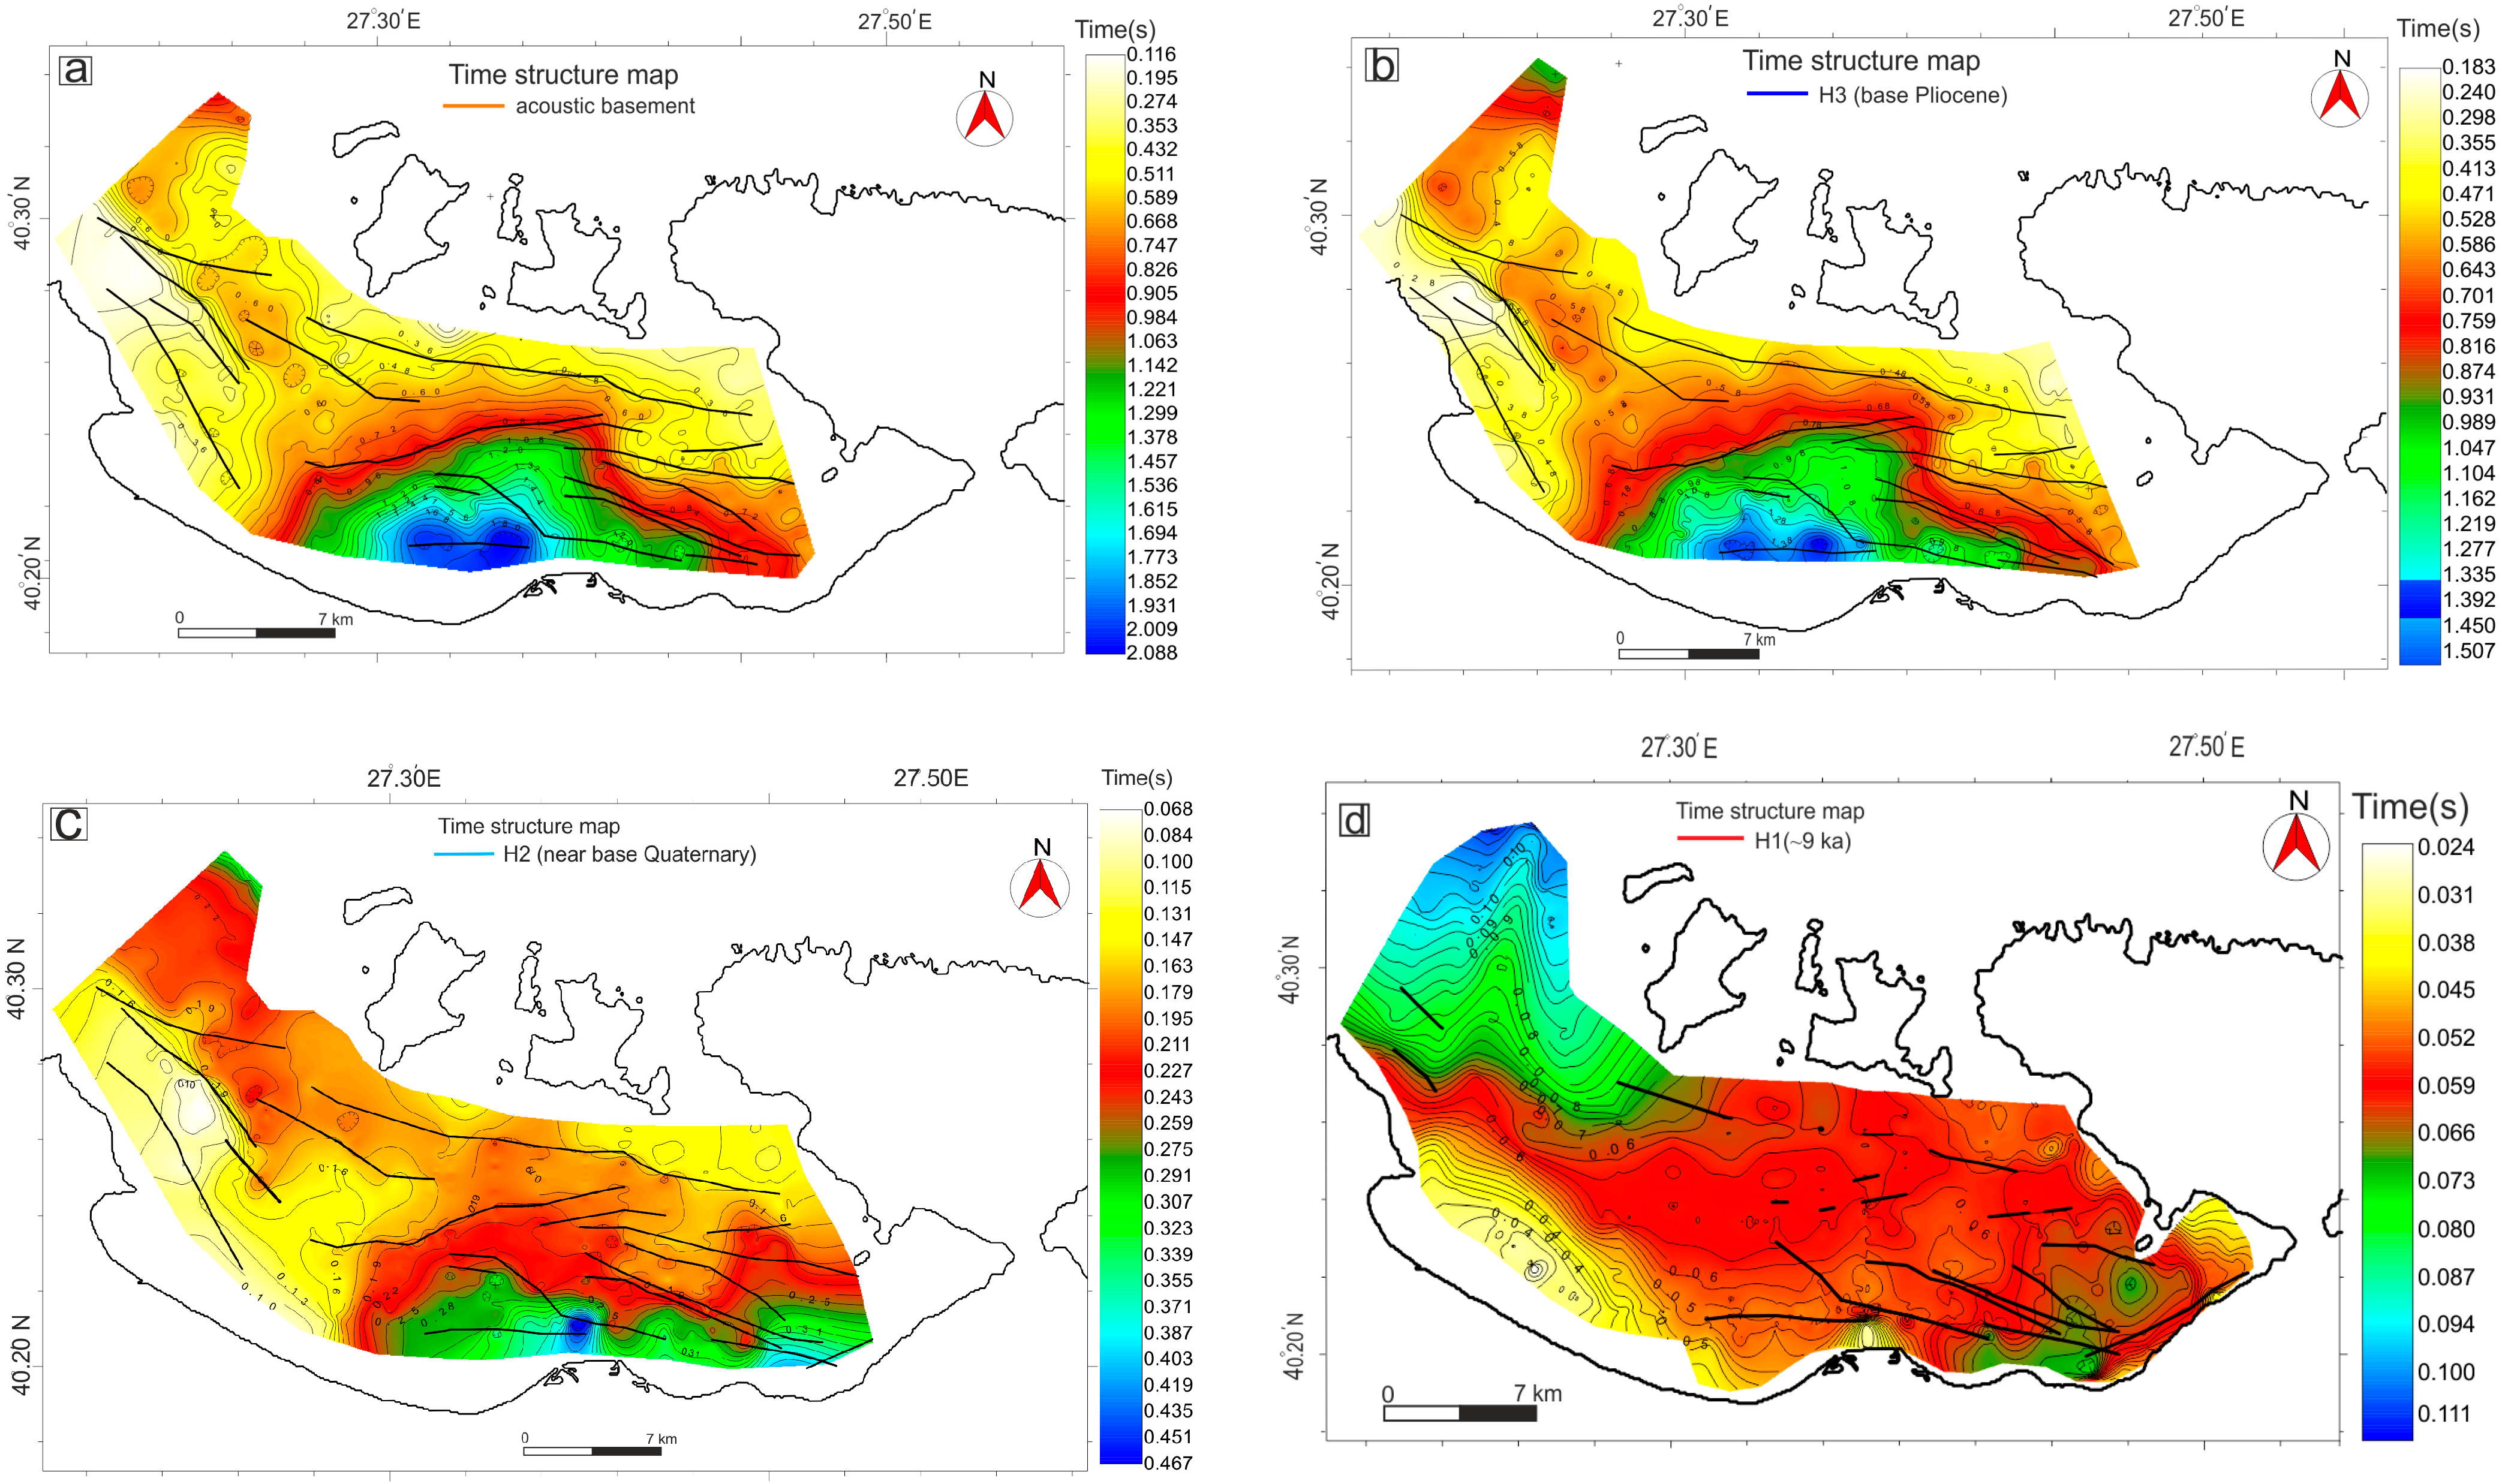
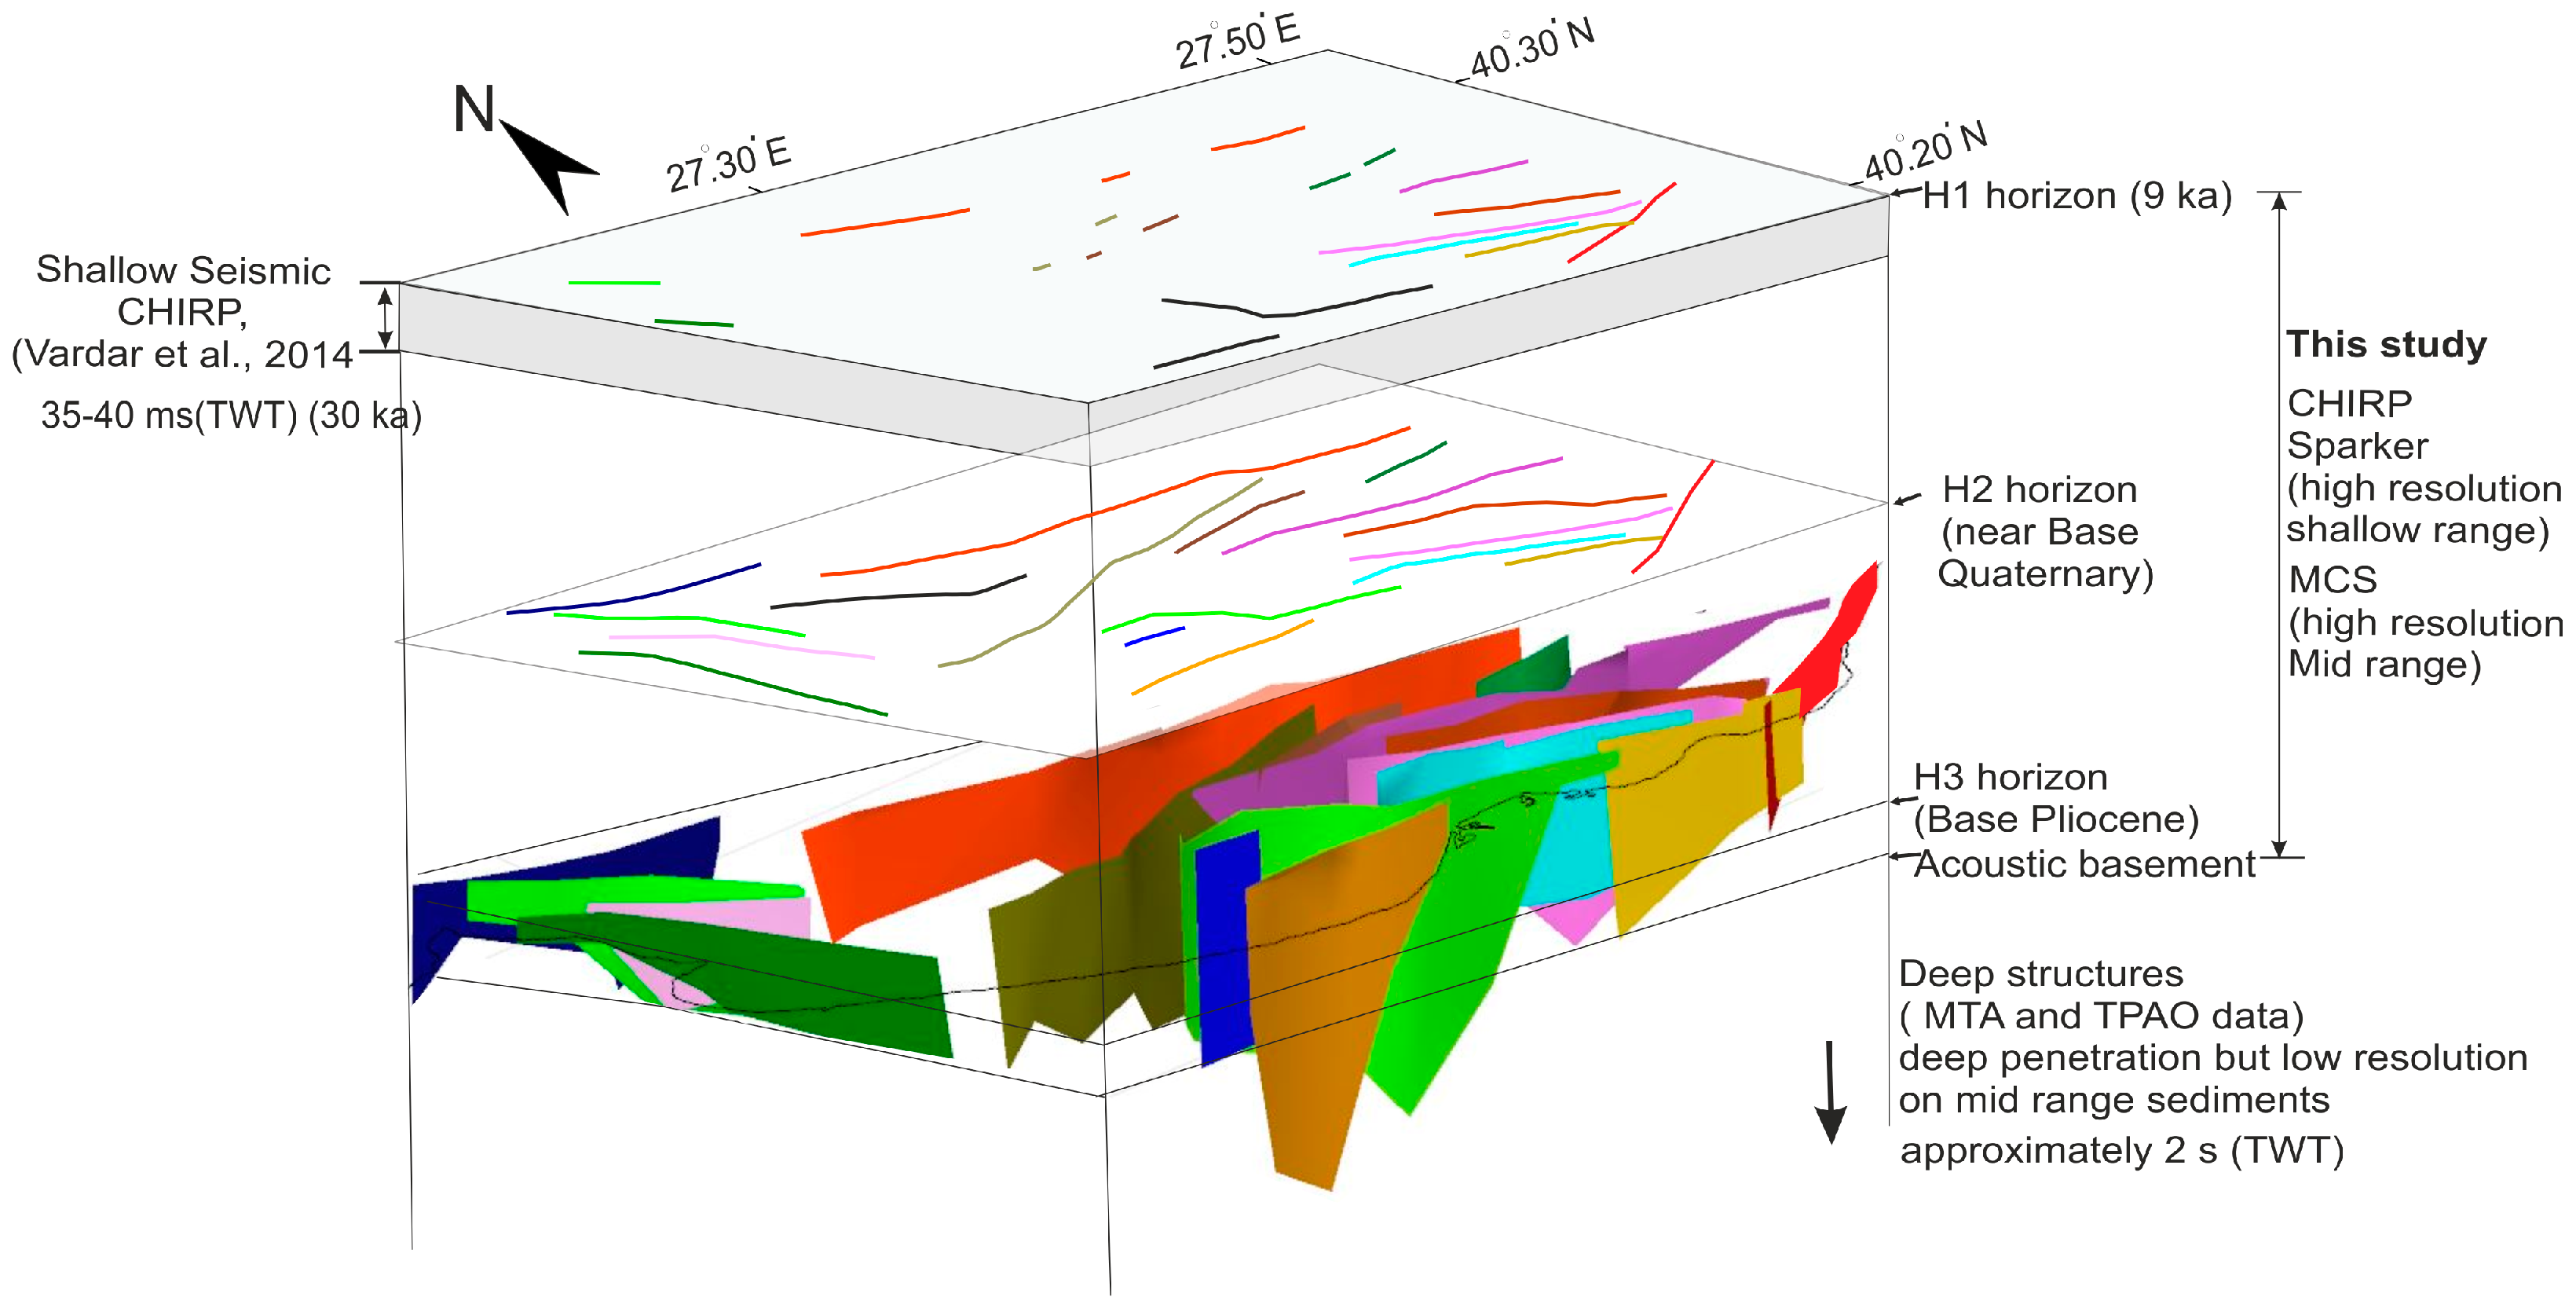

Disclaimer/Publisher’s Note: The statements, opinions and data contained in all publications are solely those of the individual author(s) and contributor(s) and not of MDPI and/or the editor(s). MDPI and/or the editor(s) disclaim responsibility for any injury to people or property resulting from any ideas, methods, instructions or products referred to in the content. |
© 2026 by the authors. Licensee MDPI, Basel, Switzerland. This article is an open access article distributed under the terms and conditions of the Creative Commons Attribution (CC BY) license.