


Abstract
Metal rubber (MR) exhibits excellent environmental adaptability and nonlinear damping characteristics, making it a promising material for multi-directional vibration isolation in aerospace and marine applications. However, the hysteresis behavior of MR-based isolators strongly depends on loading direction due to different structural layouts and load paths. This paper proposes a direction-specific modeling strategy for a composite MR-spring vibration isolator that shows pronounced hysteresis asymmetry under vertical loading and nearly symmetric hysteresis under lateral loading. An asymmetric model (including quadratic and cubic stiffness plus linear and quadratic velocity damping) is established for the vertical direction, and a symmetric model (cubic stiffness and power-law damping) for the lateral direction. Model parameters are identified from dynamic tests (2–4 Hz, amplitude ranges: vertical 0.6–1.0 mm, lateral 0.2–0.6 mm) using hysteresis loop decomposition and nonlinear least-squares fitting. The identified stiffness parameters are expressed as polynomial functions of excitation amplitude, and damping parameters as bivariate quadratic functions of amplitude and frequency. Model validation demonstrates that the proposed models achieve goodness-of-fit (GFI) values above 0.97, with normalized root-mean-square errors (NRMSE) and relative dissipated-energy errors (εΔW) below 5.3% and 3.4%, respectively, under the investigated interpolation and extrapolation conditions. Compared with the classical Bouc–Wen model, the proposed models exhibit higher overall predictive accuracy in reproducing the vertical and lateral hysteresis responses, highlighting the effectiveness of the direction-specific modeling approach. The model parameters are further interpreted in relation to the structural characteristics of the central spring, tubular MR, and annular MR. The direction-specific modeling approach provides a practical framework for characterizing the nonlinear hysteresis behavior of the investigated composite isolator.
1. Introduction
Metal rubber (MR) is a porous metallic material fabricated by winding and pressing metal wires. It offers wide-temperature stability, corrosion resistance and vacuum adaptability, and has been successfully used in aerospace and marine vibration control [1,2,3]. Internal wire contacts provide load-carrying capacity via skeleton deformation and dissipate energy through dry friction and micro-slip, resulting in pronounced nonlinear hysteresis [4,5]. This hysteresis directly determines the stiffness, damping and energy dissipation capacity of MR isolators [6,7].
Various hysteresis models have been developed for MR, including bi-linear models, trace methods, and the Bouc-Wen model [8,9,10]. Garcia et al. [11] characterized metal mesh isolators. Wang et al. [12] studied nonlinear static and dynamic properties of MR dampers. Wang et al. [13] compared stiffness characteristics of metal-rubber and rubber isolators. Ren et al. [14] investigated damping energy dissipation of cylindrical MR in non-forming direction. Xia et al. [15] proposed a hysteresis model for MR bridge bearings. Similar friction-induced hysteretic mechanisms have also been observed in other metallic vibration damping structures, such as shell-type friction dampers and open shell shock absorbers. These structures generate hysteretic responses through the combined effects of elastic deformation, contact interaction, and frictional sliding. Velychkovych et al. [16] investigated an adaptive shell-type elastic element for drilling shock absorbers and demonstrated that nonlinear stiffness evolution and hysteresis behavior were associated with contact transition and dry friction under increasing load amplitude. Moisyshyn and Slabyi [17] developed a vibroprotective device based on elastic deformation and frictional interaction, highlighting the effectiveness of shell structures for vibration attenuation. Furthermore, Dutkiewicz et al. [18] established a dry friction damper model involving an open shell structure, revealing the influence of contact interaction and friction mechanisms on energy dissipation. These studies indicate that friction-driven hysteresis is a common mechanism in metallic damping systems. However, most existing studies on MR isolators and related friction-based damping structures mainly assume symmetric hysteresis behavior and focus on single loading directions. For MR-based isolators, the influence of structural configuration and load path on direction-specific hysteresis behavior remains insufficiently understood. Experimental studies have shown that the mechanical response of MR isolators is influenced by loading direction, pre-compression and contact evolution [14]. Applying a single symmetric model to all directions would lead to inaccurate force predictions. Unlike existing asymmetric or loading-mode-specific hysteresis models, this study develops a structure-informed, direction-specific modeling strategy for a composite MR-spring isolator. Separate models are established to describe the asymmetric vertical response and nearly symmetric lateral response, with stiffness and damping parameters expressed as functions of excitation amplitude and frequency within the investigated range. The contribution lies in adapting the model formulations and parameter identification to the specific structural configuration and loading characteristics of the isolator, rather than proposing a new general hysteresis theory.
This paper addresses a composite MR-spring isolator integrating a central spring, a lower tubular MR and an upper annular MR. The design and parameter matching were detailed in previous work [19,20]. Under vertical loading, the spring and tubular MR work in parallel, while the annular MR buffers the unloading path, causing pronounced asymmetric hysteresis. Under lateral loading, the spring and annular MR work in parallel with symmetric load paths, producing nearly symmetric hysteresis.
To address this gap, a direction-specific modeling strategy is proposed. Therefore, this study aims to address the limitations of existing hysteresis models for MR-based isolators by developing a direction-specific nonlinear hysteresis model considering both stiffness nonlinearity and damping characteristics. The proposed model is established based on the asymmetric hysteresis responses under vertical and lateral loading conditions, and its applicability is evaluated through interpolation and extrapolation validations. This study provides a more comprehensive understanding of the direction-specific hysteretic behavior of MR isolators and offers a modeling approach for predicting their nonlinear dynamic responses.
The remainder of this paper is organized as follows. Section 2 describes dynamic tests and observed direction-specific hysteresis. Section 3 presents the asymmetric and symmetric models. Section 4 gives parameter identification results and physical interpretation. Section 5 validates the models and applies them to response prediction. Section 6 concludes the paper.
2. Dynamic Tests and Observed Hysteresis Characteristics
2.1. Test Setup and Procedure
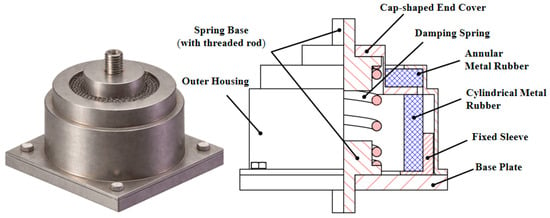
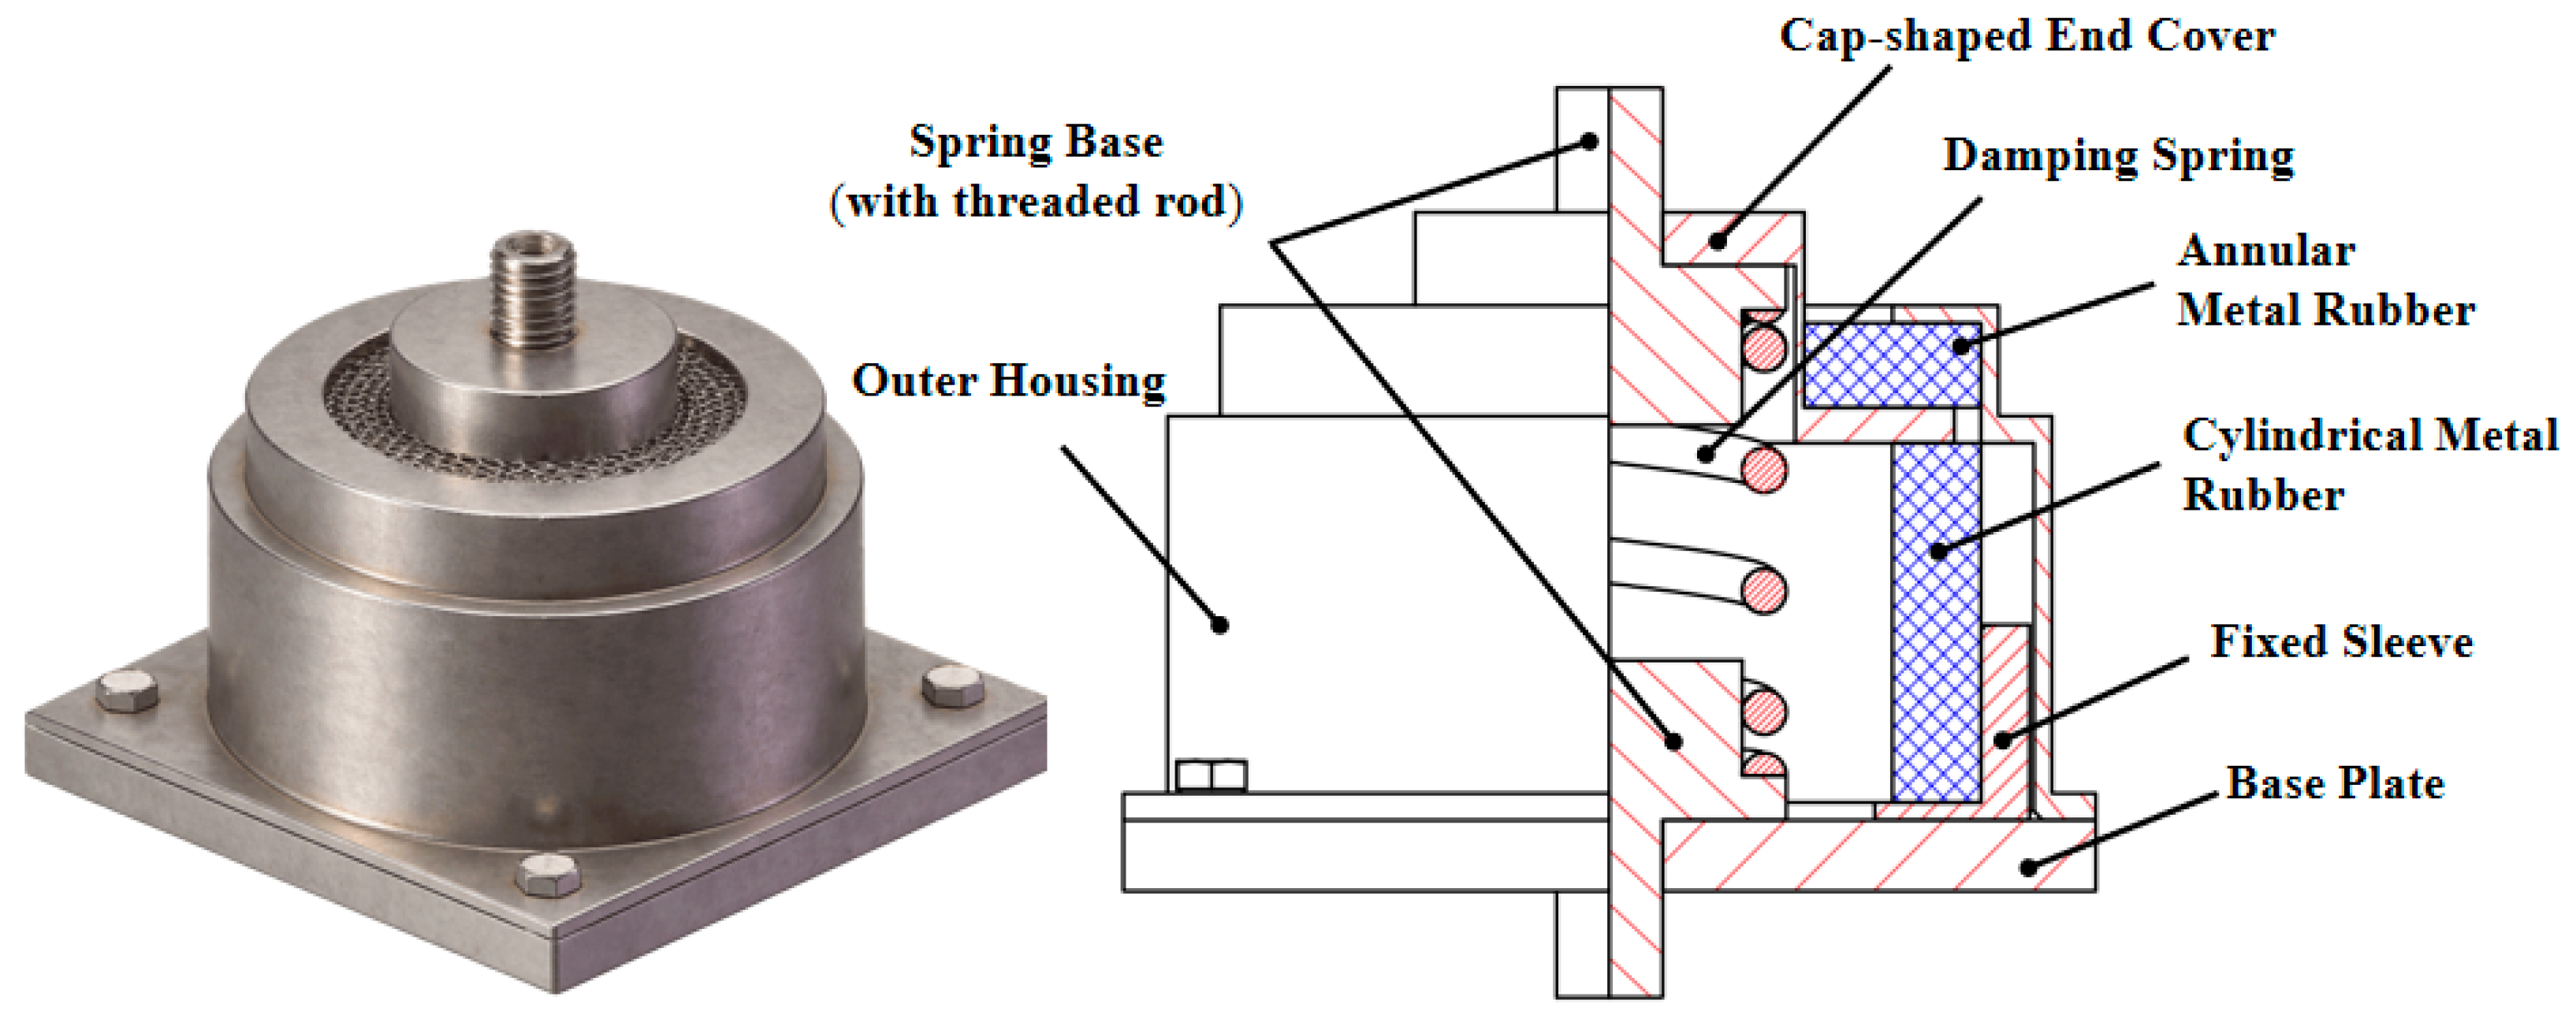
The composite MR-spring vibration isolator (Figure 1) consists of a housing, a base plate, a cap, an upper annular MR, a lower tubular MR, and a central cylindrical spring [19,20], Both the annular and tubular metal rubber components were independently fabricated in our laboratory. The density matching scheme of the two MR components was determined through a series of preliminary experiments involving different density combinations. Based on the comparative results, the configuration adopted in this work was identified as the selected configuration. Subsequently, dynamic tests were conducted on this selected isolator configuration, and the hysteresis model developed in this study was established based on its experimentally measured dynamic responses.
Figure 1.
3D prototype drawing and 2D structural schematic diagram of the vibration isolator.
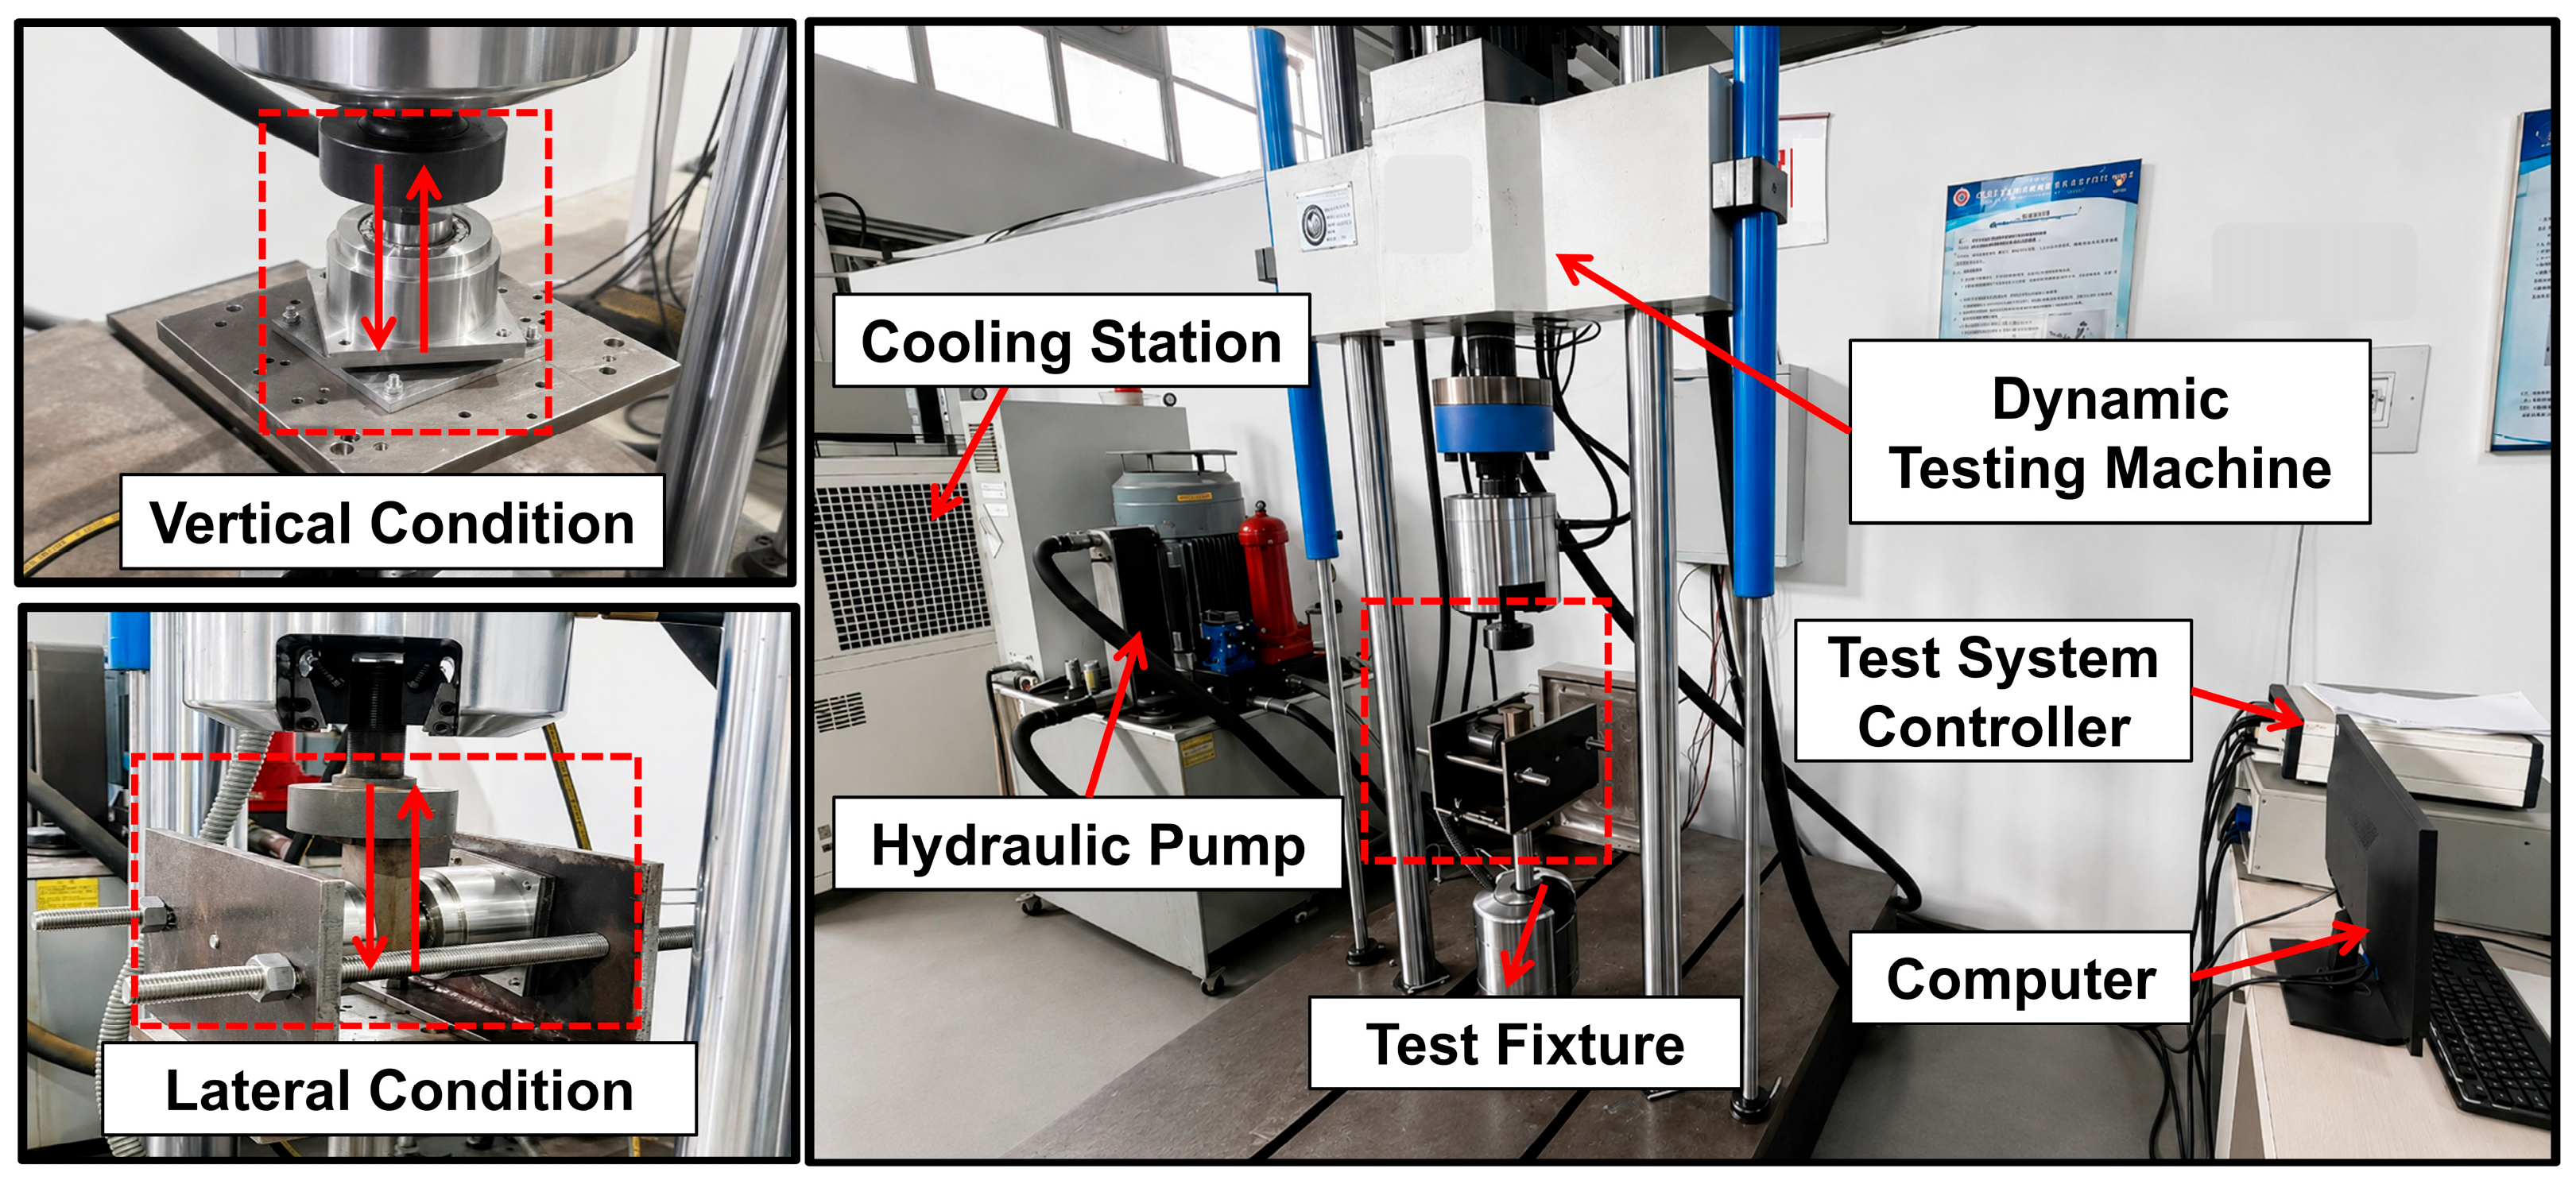
Dynamic tests were conducted under displacement control using an SDS200 electro-hydraulic testing machine (maximum force ±200 kN, dynamic stroke ±50 mm, frequency 0.1~40 Hz, Changchun Research Institute for Mechanical Science Co., Ltd., Changchun, China). Harmonic displacement excitation generated by the testing machine was applied to the MR isolator under different fixture configurations. The fixtures were used to achieve different loading directions of the MR isolator, including axial compression and lateral shear deformation. The excitation frequency range was 2~4 Hz. The excitation amplitudes were 0.6~1.0 mm for vertical loading and 0.2~0.6 mm for lateral loading (this 0.6 mm value is the conservatively selected upper bound for parameter identification, rather than the physical radial deformation limit of the annular MR). The excitation frequencies (2~4 Hz) and displacement amplitudes were selected to systematically investigate the effects of excitation frequency and amplitude on the dynamic characteristics of the specific MR-spring composite isolator. By varying these two factors under controlled cyclic loading, their influences on the hysteresis response and the associated model parameters could be characterized. These ranges were selected for dynamic characterization rather than to represent the complete service conditions of the isolator. Accordingly, the identified parameter relationships are applicable within the investigated range, while their applicability to specific service conditions requires further validation.
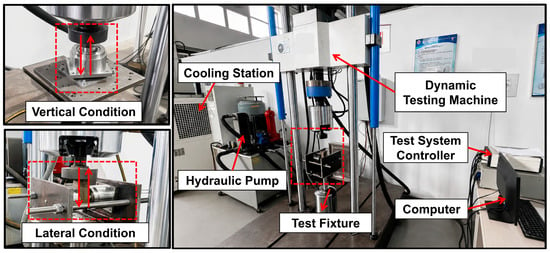
To illustrate the influence of excitation amplitude on the hysteresis response, three representative amplitude levels with distinct gradients were selected (0.6, 0.8, and 1.0 mm for vertical loading; 0.2, 0.4, and 0.6 mm for lateral loading) These representative cases demonstrate the evolution of hysteresis characteristics under increasing excitation amplitudes. The complete amplitude datasets were retained for parameter identification and amplitude-dependent fitting in Section 4. The test system is shown in Figure 2, the red arrows indicate the loading directions under vertical and lateral loading conditions. The central spring was uncompressed initially under vertical loading, while its initial pre-compression was kept constant across all lateral loading conditions. Force-displacement data were recorded synchronously [21].
Figure 2.
Dynamic Test System.
The dissipated energy per cycle ΔW represents the energy dissipated by the MR isolator during one complete force–displacement hysteresis loop. Here, one cycle refers to one complete sinusoidal loading period, including both loading and unloading processes. The dissipated energy was calculated from the enclosed area of the hysteresis loop through numerical integration:
where is load cycle, X0 is the displacement amplitude, represents the number of discrete sampling points within one excitation cycle (fs): sampling frequency, (f): excitation frequency), Fi the restoring force at the i-th point, θ the initial phase of displacement [22].
The equivalent dynamic stiffness of the MR isolator under harmonic excitation was calculated as the ratio of the force to the displacement:
where Fmax and Fmin denote the maximum and minimum forces during one loading cycle.
The maximum elastic potential energy U and loss factor η are then given by:
2.2. Direction-Specific Hysteresis Characteristics
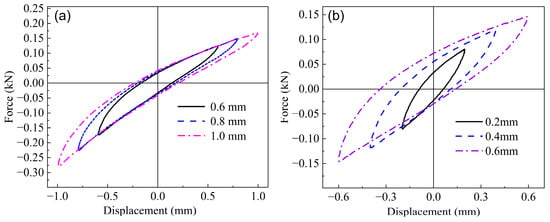
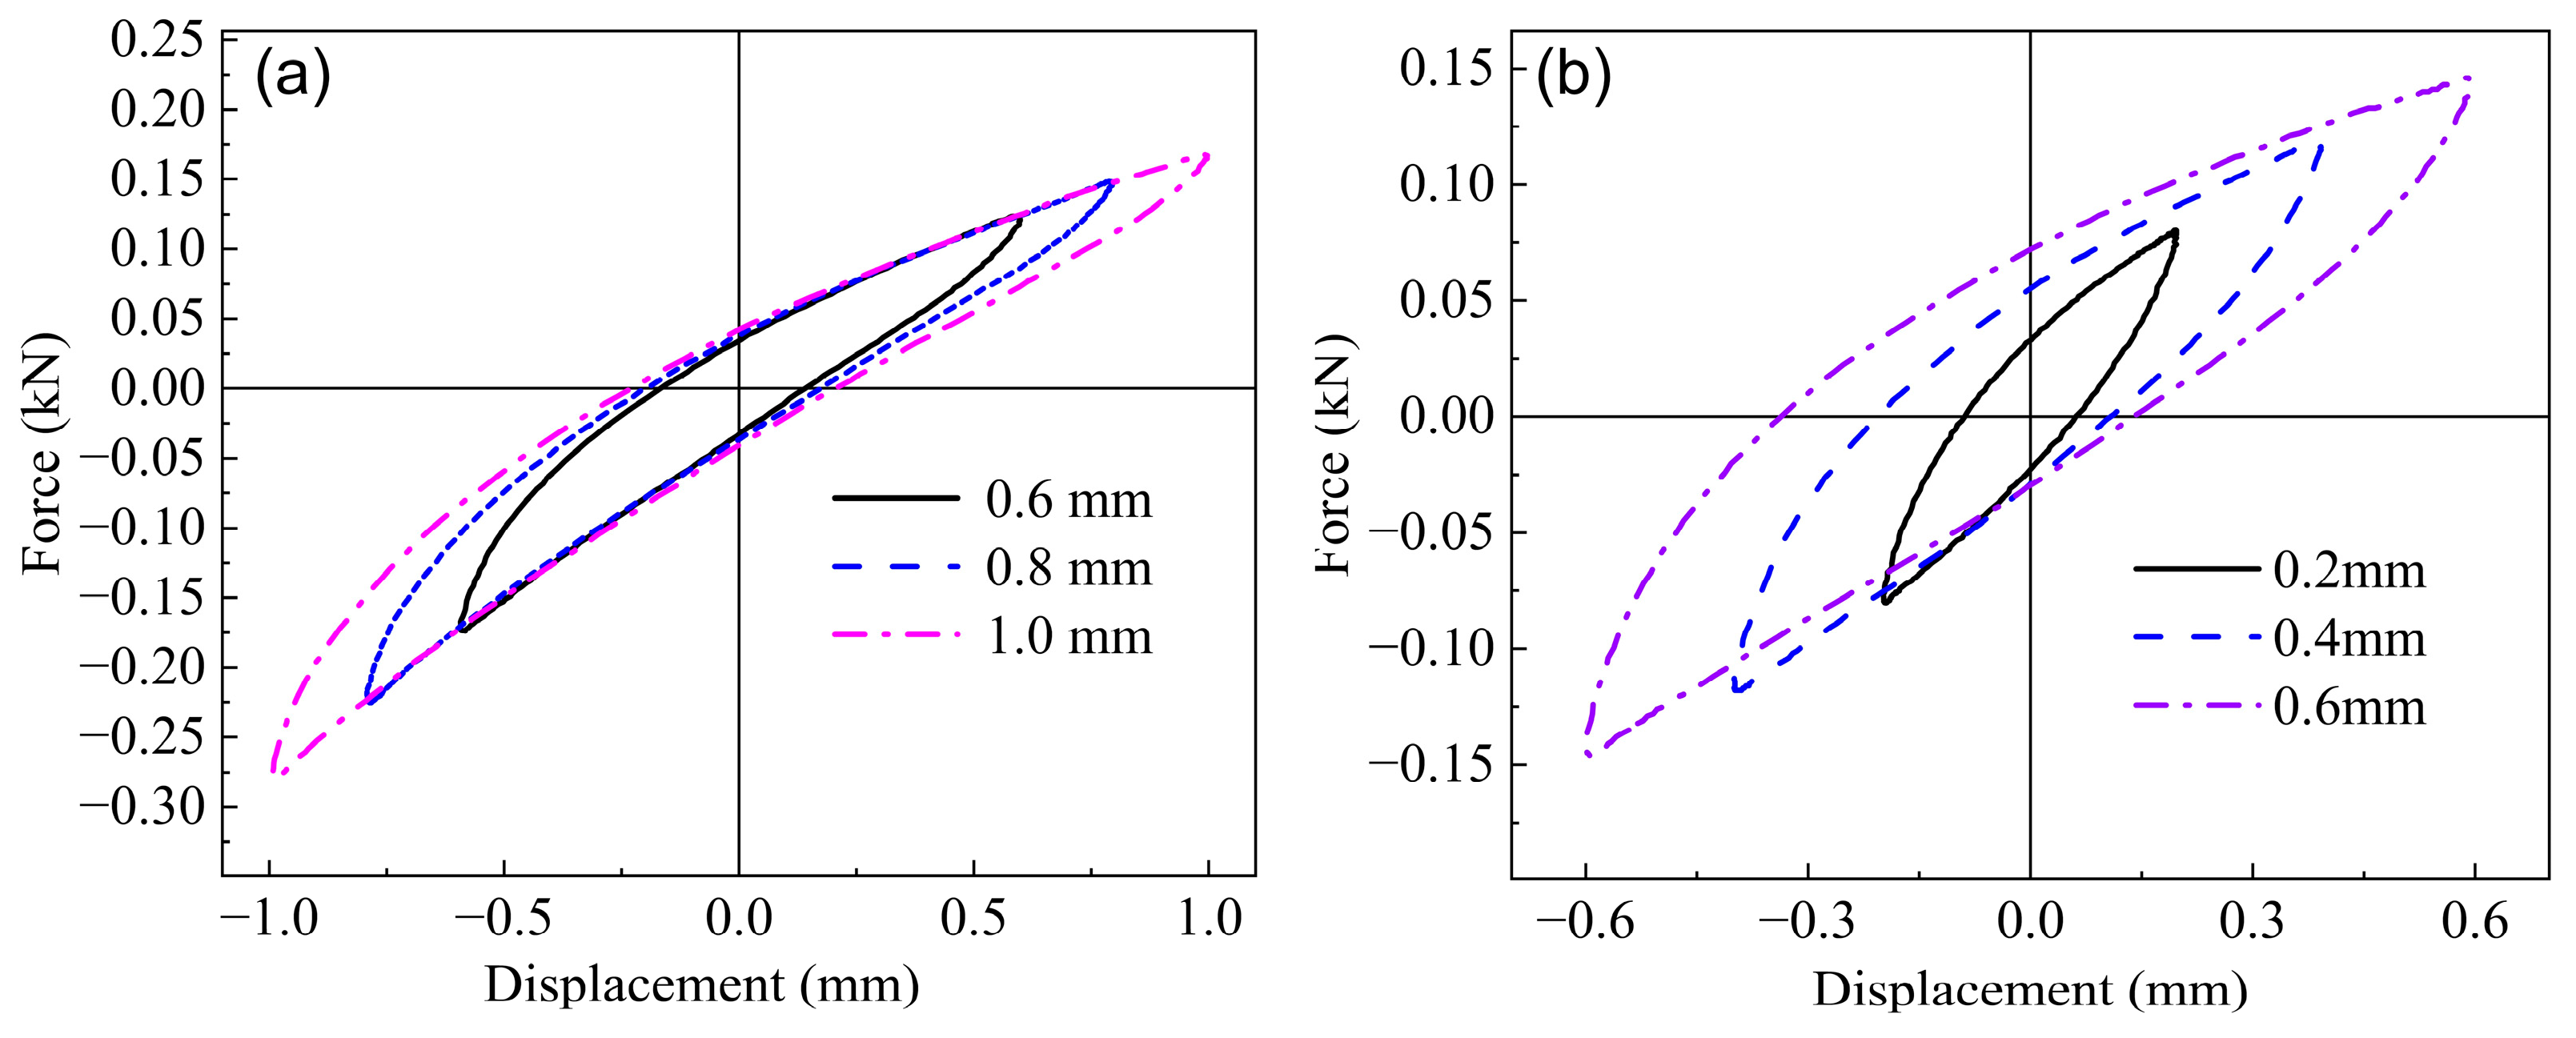
Figure 3 compares representative hysteresis loops selected from different excitation amplitude levels under vertical and lateral loading at an excitation frequency 2 Hz, illustrating the evolution trend of hysteresis behavior with increasing amplitude. For each excitation condition, one independent test run was conducted using the same MR-spring composite isolator. After 20 conditioning cycles, the relative variation in hysteresis-loop area between consecutive cycles was monitored. A stabilized response was defined as a relative variation of less than 1% for five consecutive cycles. Once this criterion was satisfied, a stabilized hysteresis loop was selected for subsequent parameter identification and model validation. The horizontal axis represents the instantaneous displacement of the MR isolator during cyclic loading, while the vertical axis represents the corresponding restoring force generated by the MR isolator. The same definitions apply to the subsequent force–displacement hysteresis curves. The vertical loops (Figure 3a) are clearly asymmetric: the restoring force is not anti-symmetric with respect to zero displacement. This asymmetry arises because the annular MR, though not directly participating in vertical compression, hinders the recovery during unloading, causing different loading and unloading paths [23]. In contrast, the lateral loops (Figure 3b) are nearly symmetric, as the load paths are identical in positive and negative directions (the spring and annular MR work in parallel without directional bias).
Figure 3.
Hysteresis loops under vertical and lateral conditions with different excitation amplitudes; (a) vertical loading condition, (b) lateral loading condition.
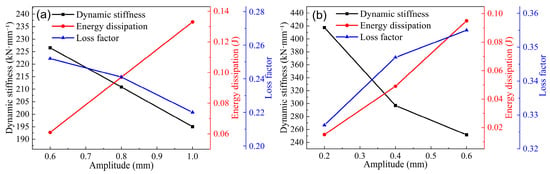
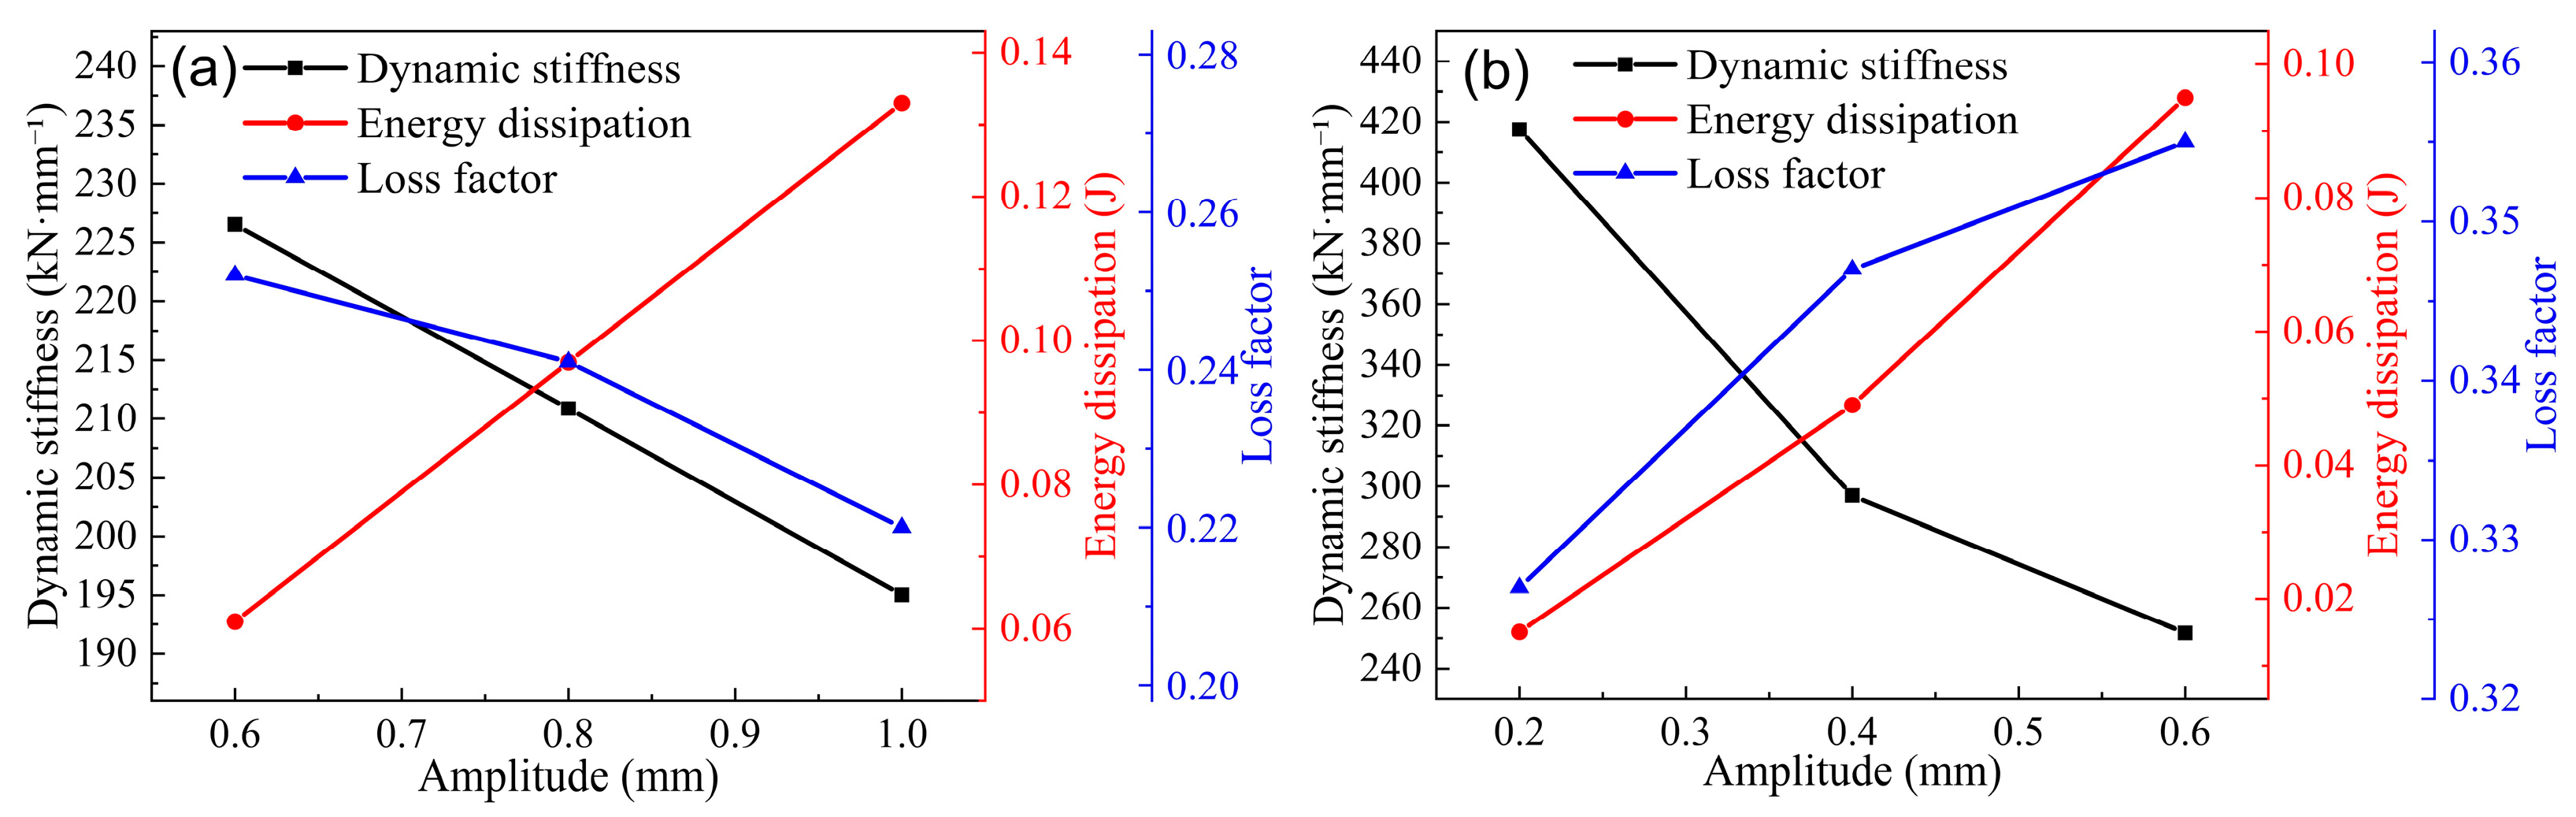
The influence of excitation amplitude is summarized in Figure 4 (fixed frequency 4 Hz). For both directions, increasing amplitude reduces the dynamic stiffness—a consequence of activated micro-slip and contact weakening within the MR wire networks. The dissipated energy per cycle increases with amplitude because larger deformation induces longer sliding distances at wire contacts. Interestingly, the loss factor exhibits opposite trends: it decreases with amplitude in the vertical direction but increases in the lateral direction. This difference may be attributed to the distinct structural configurations and load-transfer mechanisms in the two directions. Under vertical loading, the elastic energy storage of the spring–tubular MR system may increase more rapidly than the dissipated energy as the excitation amplitude increases, resulting in a decreasing loss factor. Under lateral loading, the interaction between the pre-compressed spring and annular MR may lead to a relatively greater increase in energy dissipation, contributing to the observed increase in the loss factor [24].
Figure 4.
Variation in dynamic mechanical properties with excitation amplitude; (a) vertical loading condition, (b) lateral loading condition.
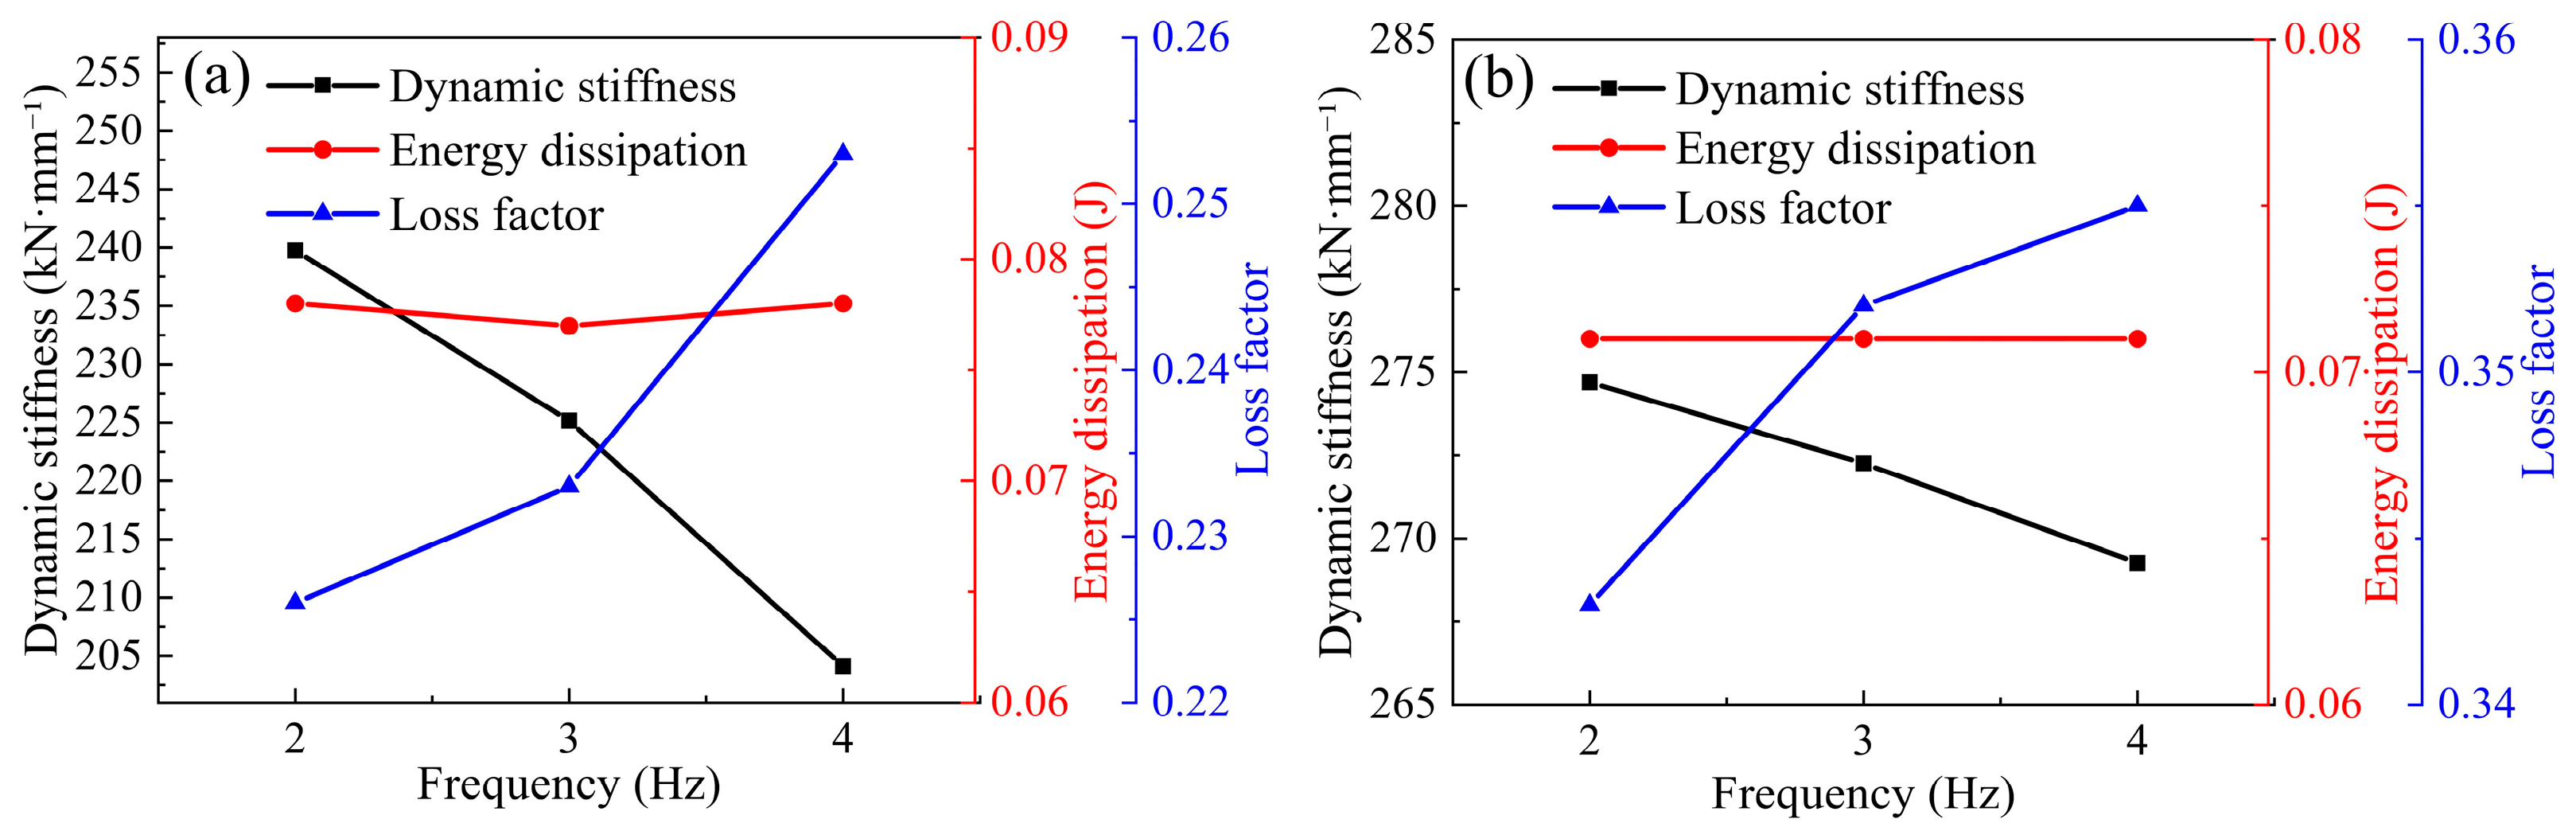
Figure 5 shows the effect of excitation frequency (2–4 Hz) at fixed amplitudes (vertical 0.7 mm, lateral 0.5 mm). Over this narrow range, the dynamic stiffness decreases slightly with frequency—attributed to increased contact-weakening cycles per unit time [25]. The dissipated energy per cycle remains nearly constant, indicating that the friction-induced dissipation per cycle is amplitude-governed rather than frequency-governed within this range. Consequently, the loss factor increases with frequency, driven by the reduction in maximum elastic energy (due to lower stiffness) while dissipation stays unchanged [26].
Figure 5.
Variation law of dynamic mechanical performance parameters with excitation; (a) vertical loading condition, (b) lateral loading condition.
3. Nonlinear Hysteresis Modeling
3.1. General Decomposition Principle
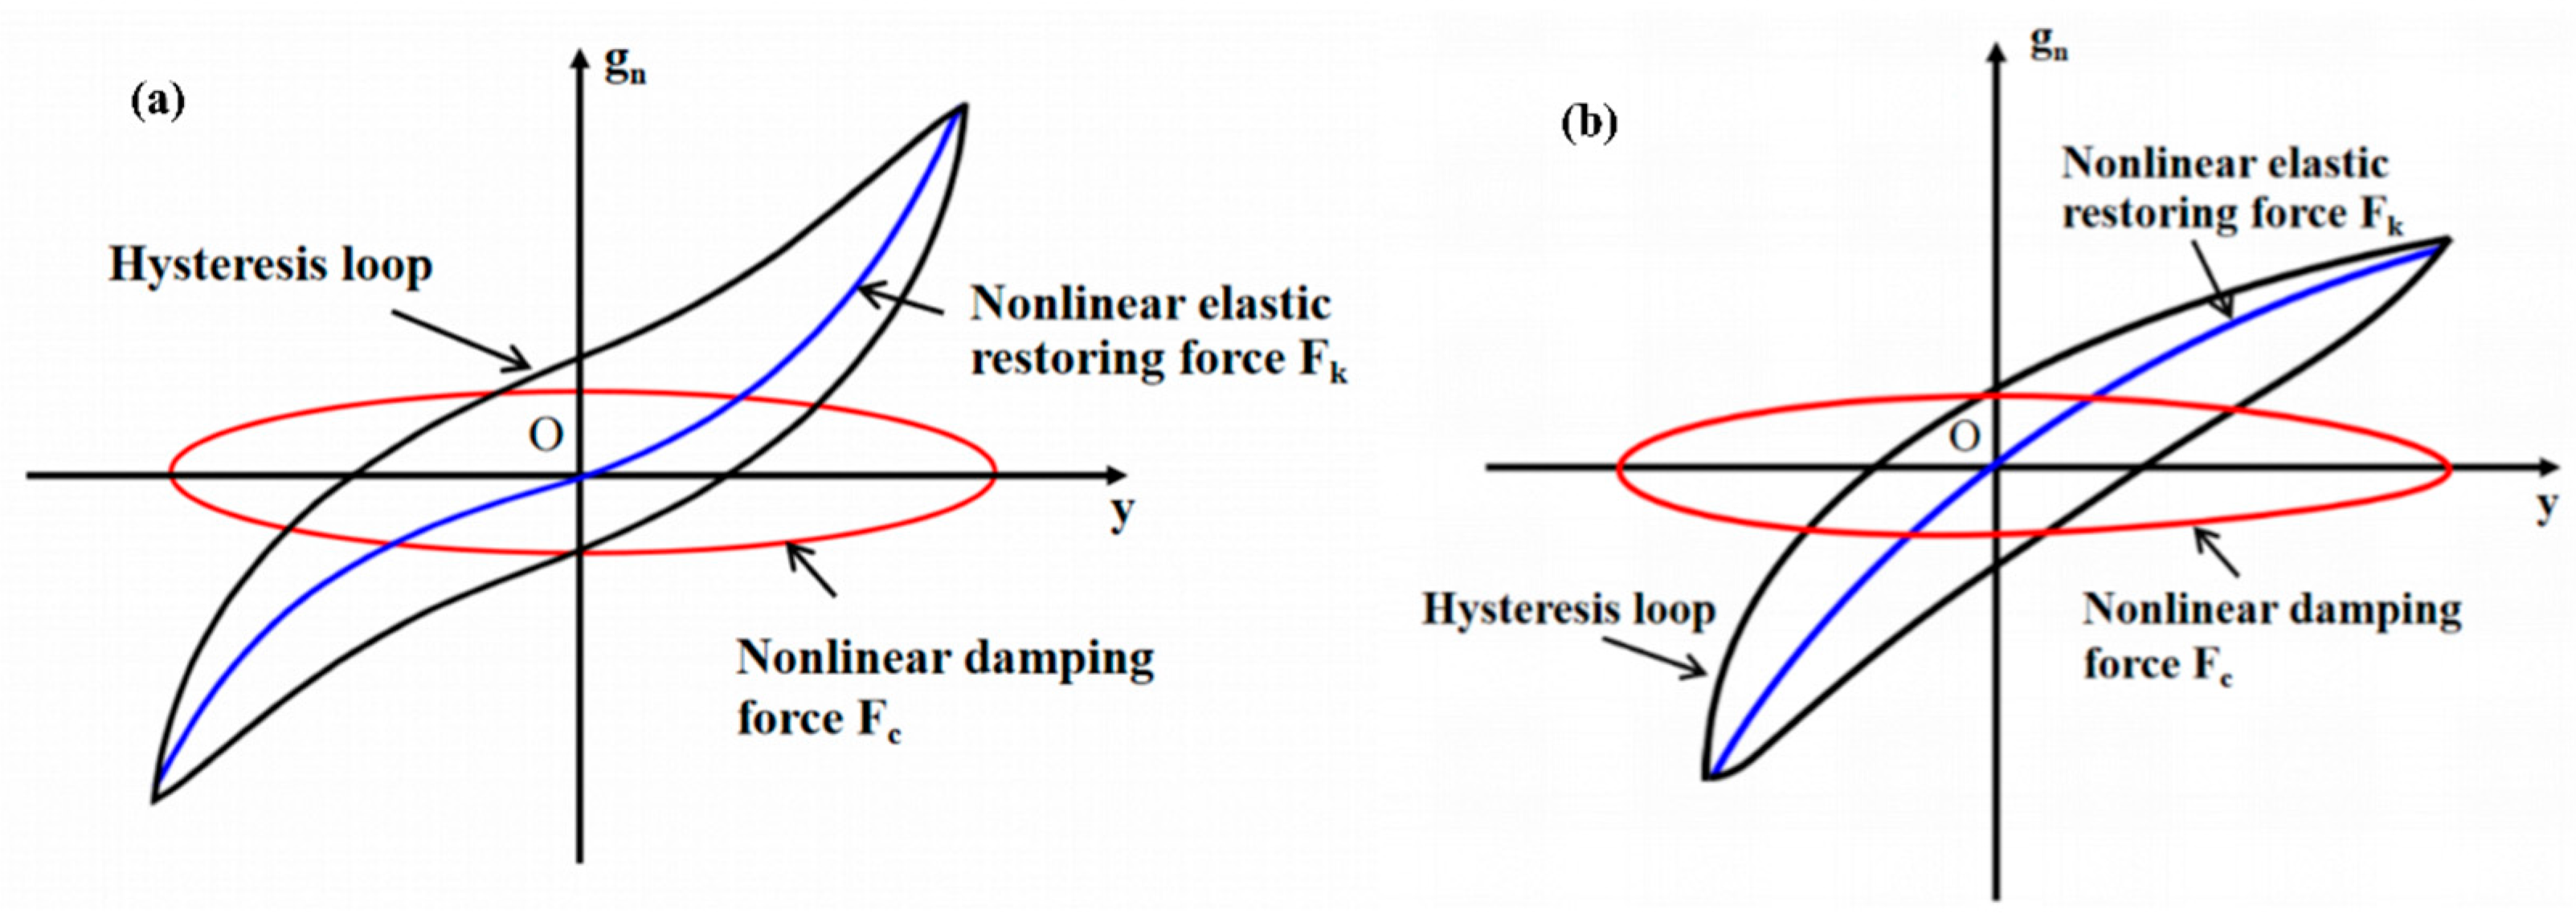
Under dynamic loading, the restoring force of the MR-spring composite isolator comes from both elastic energy storage and frictional energy dissipation. The total restoring force gn can therefore be decomposed into a nonlinear elastic part Fk and a nonlinear damping part Fc. The elastic part depends on displacement and represents energy storage. The damping part depends on velocity and represents dry friction dissipation from wire contacts [14].
where y represents the deformation displacement of the MR-spring composite isolator, represents the corresponding deformation velocity, and t denotes time. This decomposition is illustrated in Figure 6. The elastic part Fk is obtained as the backbone curve, the mean of the loading and unloading branches of a hysteresis loop. The damping part Fc is then the difference between the total force and the elastic force.
Figure 6.
Schematic diagram of accurate decomposition of hysteresis loop; (a) Symmetric hysteresis loop, (b) Asymmetric hysteresis loop.
3.2. Symmetric Hysteresis Model for the Lateral Direction
Under lateral loading, the hysteresis loops are approximately center-symmetric (Figure 3b). The elastic restoring force must therefore be an odd function of displacement. Only the first- and third-order stiffness terms are retained; higher-order terms are neglected to avoid over-fitting and parameter coupling [27,28]:
Here A represents the peak amplitude of the sinusoidal displacement excitation applied to the MR isolator; k1 and k3 are the first- and third-order stiffness coefficients, both depending on excitation amplitude A.
The damping force originates from dry friction at the numerous wire-contact interfaces inside the metal rubber. These interfaces undergo micro-slip and contact separation, producing a nonlinear damping characteristic. A power-law form effectively describes such friction-dominated damping [29]:
The damping coefficient c and exponent α depend on excitation amplitude A and frequency f. The coefficient c characterizes the magnitude of the damping force, while α governs its nonlinear dependence on deformation velocity: α = 1 corresponds to linear viscous damping, whereas 0 < α < 1 represents a sub-linear velocity-dependent behavior associated with friction-dominated energy dissipation. Since the dimensional form of c depends on the value of α, the coefficient c should be interpreted together with the corresponding exponent α [27].
Combining Equations (4)–(6) yields the symmetric dynamic model for the lateral direction:
3.3. Asymmetric Hysteresis Model for the Vertical Direction
Vertical hysteresis loops are clearly asymmetric (Figure 3a). This asymmetry arises from different load paths in positive and negative displacement directions. In the negative direction (compression), the spring and the lower tubular metal rubber work in parallel. In the positive direction (unloading), the upper annular metal rubber hinders recovery, altering the force response [24]. Consequently, the elastic restoring force is not an odd function. A quadratic term must be introduced:
where k2 is the quadratic stiffness coefficient that quantifies the asymmetry.
For the damping force, fitting trials on the separated damping data showed that a single linear term cannot capture the nonlinear friction behavior. Adding a quadratic velocity term significantly improves fitting accuracy, by about 16 percent on average [30]. Thus:
Here, c1 and c2 represent the linear and quadratic velocity-dependent damping coefficients of the vertical asymmetric model, respectively. The coefficient c1 characterizes the linear contribution of deformation velocity to the damping force, while c2 accounts for the additional nonlinear velocity-dependent contribution. The total asymmetric model for the vertical direction is
3.4. Parameter Identification Method
Step 1—Backbone curve extraction and stiffness parameter identification.
For each measured hysteresis loop under steady-state sinusoidal excitation, the nonlinear elastic restoring force was determined by averaging the loading and unloading branches at corresponding displacement values. The resulting backbone curve was then fitted using a low-order polynomial by the least-squares method [31]. To maintain computational efficiency and reduce parameter coupling, polynomial terms up to the third order were considered.
For the lateral symmetric model, only the first- and third-order terms were retained, as expressed in Equation (5). The stiffness coefficients k1 and k3 were directly obtained as the coefficients of the linear and cubic displacement terms in the fitted polynomial, respectively. For the vertical asymmetric model, an additional quadratic term was introduced, as expressed in Equation (8). Accordingly, the stiffness coefficients k1, k2, and k3 were determined from the coefficients of the linear, quadratic, and cubic displacement terms, respectively.
Step 2—Damping force separation and parameter identification.
The nonlinear elastic restoring force was reconstructed using the identified stiffness coefficients and subtracted from the experimentally measured total restoring force to obtain the damping force component, as expressed in Equation (11).
The damping parameters were subsequently identified using nonlinear least-squares fitting. For the lateral symmetric model, the power-law damping coefficient c and exponent α were identified according to Equation (6). For the vertical asymmetric model, the linear and quadratic velocity-dependent damping coefficients c1 and c2 were identified according to Equation (9). Since nonlinear least-squares optimization may be sensitive to the initial parameter values, multiple initial guesses were considered within physically reasonable parameter ranges. The identification procedure was repeated using different initial values, and the solution with the smallest fitting residual was selected as the final parameter set.
During parameter identification, displacement, velocity, and restoring force were expressed in mm, mm/s, and kN, respectively. Accordingly, the units of the vertical damping coefficients (c1) and (c2) are kN·s/mm and kN·s2/mm2, respectively, while the unit of the lateral power-law damping coefficient (c) is kN·(s/mm)^(α).
3.5. Classical Bouc–Wen Model for Comparison
To further evaluate the predictive capability of the proposed direction-dependent hysteresis models, the classical Bouc–Wen model was introduced as a benchmark. To maintain consistency with the notation adopted in the preceding sections, the restoring force is expressed as
where (gn(t)) denotes the total restoring force, y(t) and represent the displacement and velocity, respectively; kBW is the linear stiffness coefficient, cBW is the viscous damping coefficient, and hBW determines the contribution of the hysteretic component. The internal hysteretic variable z(t) is governed by
where A0 controls the initial evolution of the hysteretic variable, βBW and γBW govern the hysteresis-loop shape, and n controls the smoothness of the transition between loading and unloading.
In this study, A0 = 1 and n = 2 were fixed, while the five parameters kBW, cBW, hBW, βBW, and γBW were identified from the experimental force–displacement hysteresis loops.
To ensure a fair comparison, the Bouc–Wen model and the proposed models were established using the same training datasets for each loading direction and evaluated under identical validation conditions. The identified Bouc–Wen parameters were subsequently represented as functions of excitation frequency and displacement amplitude, allowing predictions under interpolation and extrapolation conditions without further parameter optimization. The predictive performance of the two modeling approaches is compared in Section 5.
4. Parameter Identification Results and Physical Interpretation
The dynamic test data cover frequencies from 2 to 4 Hz and amplitudes as given in Section 2. All results below come solely from these experimental data. No simulated or extrapolated data are used except for the validation cases in Section 5.
4.1. Vertical Asymmetric Model
4.1.1. Stiffness Parameters k1, k2 and k3
Table 1 lists the identified stiffness coefficients at 2 Hz for five amplitude levels: 0.6, 0.7, 0.8, 0.9 and 1.0 mm. The quadratic term k2 is negative for all cases. A negative k2 does not indicate negative structural stiffness. Instead, it reflects the asymmetry of the restoring force, meaning the force grows faster in the negative displacement direction than in the positive direction. This is consistent with the buffering effect of the annular metal rubber during unloading [24,29].
Table 1.
Identified stiffness parameters for the vertical model at 2 Hz.
All three stiffness coefficients vary with amplitude. For use in analytical response calculations, they are fitted by cubic polynomials of amplitude A in millimeters. The least-squares fits give:
The coefficients of determination for these fits are all above 0.97.
4.1.2. Damping Parameters c1 and c2
Table 2 and Table 3 list the identified damping coefficients for all combinations of amplitude (0.6–1.0 mm) and frequency (2–4 Hz). Both c1 and c2 depend on amplitude and frequency.
Table 2.
Damping coefficient c1 in kN·s/mm for the vertical model.
Table 3.
Damping coefficient c2 in kN·s2/mm2 for the vertical model.
The negative values of c2 do not imply a physical negative damping. In the tested velocity range, the linear term dominates the dissipation. The quadratic term acts as an empirical correction to improve the representation of the nonlinear hysteresis response. The net energy dissipated over a cycle, computed as , remains positive for all cases (verified by direct integration). Compared with a simplified model using only c1 (i.e., setting c2 = 0), the inclusion of c2 improves the goodness-of-fit by an average of 15.7%, justifying its empirical necessity [30].
To capture the combined amplitude-frequency dependence, c1 and c2 are fitted by bivariate quadratic polynomials:
The coefficients were obtained by least-squares minimization; the residuals are within the experimental scatter.
The instantaneous passivity of the vertical damping model was evaluated using the amplitude- and frequency-dependent coefficients obtained from Equations (17) and (18). According to Equation (9), the instantaneous dissipated power (Pd) is expressed as
Since (c1 > 0) and (c2 < 0), nonnegative energy dissipation requires . For sinusoidal displacement excitation, the maximum velocity is given by . This condition was quantitatively evaluated for all 15 parameter-identification conditions, with maximum excitation velocities ranging from 7.54–25.13 mm/s. The results show that the damping formulation satisfies the instantaneous passivity condition throughout the velocity range of each investigated condition. Furthermore, the three vertical model validation cases, including interpolation, amplitude extrapolation, and frequency extrapolation, were also examined using their corresponding model parameters, and all three satisfied the passivity condition within their respective excitation velocity ranges. Nevertheless, the passivity of the proposed model under more extensive operating conditions requires further verification.
4.1.3. Physical Interpretation of Vertical Model Parameters
The linear stiffness k1 (0.1729–0.2001 kN/mm) is much larger than the isolated spring stiffness (0.04215 kN/mm measured in independent quasi-static tests), suggesting that the tubular MR contributes a significant linear stiffness component [19]. The variation in k1 with amplitude is small, consistent with the nearly linear behavior of the spring and the relatively stable linear part of the tubular MR.
The quadratic stiffness k2 (negative) is a correction term that captures the asymmetry. This asymmetry is associated with the upper annular MR, which does not participate in the initial vertical compression but provides a buffering resistance during unloading, causing the restoring force to be smaller in the positive displacement direction [24,32].
The cubic stiffness k3 reflects the nonlinear compression behavior of the tubular MR. Its decrease with increasing amplitude may reflect the internal micro-slip and contact rearrangement within the MR wire network: at larger deformations, some contacts may transition from sticking to sliding, reducing the incremental stiffness [27,33].
The damping parameters c1 and c2 together describe the dry friction dissipation of the tubular MR. The decrease in c1 and the decreasing absolute value of c2 with amplitude indicate that while the total slip distance increases, the dissipation efficiency per unit slip distance declines, likely due to saturation of frictional contacts [31,34].
4.2. Lateral (Symmetric) Model
4.2.1. Stiffness Parameters k1, k3
Table 4 shows the identified stiffness coefficients at 2 Hz for lateral amplitudes of 0.2–0.6 mm. Both k1 and k3 decrease with increasing amplitude, consistent with the trend observed for the dynamic average stiffness in Section 2.
Table 4.
Identified stiffness parameters (lateral, f = 2 Hz).
A cubic polynomial is used to fit k1(A) (capturing the slight S-shape), and a power law is used for k3(A) (monotonic decay) [32]:
4.2.2. Damping Parameters c, α
Table 5 and Table 6 give the identified damping coefficient c and damping exponent α for all amplitude-frequency combinations. The exponent α is consistently below or near 1 (range 0.641–1.016), indicating sub-linear velocity dependence, which is characteristic of dry friction. Overall, c and α tend to increase with excitation amplitude, reflecting more extensive sliding and higher dissipation efficiency at larger deformations [34,35].
Table 5.
Damping coefficient c for lateral model.
Table 6.
Damping exponent α for lateral model.
The bivariate quadratic fits are:
4.2.3. Physical Interpretation of Lateral Model Parameters
The linear stiffness k1 may be associated with the lateral linear stiffness of the central spring, which was measured independently as 44.16 N/mm [19]. The identified values (172–314 N/mm) are larger because they include the parallel contribution of the annular MR. The decrease in k1 with amplitude is small, consistent with the spring’s linearity.
The cubic stiffness k3 captures the higher-order nonlinearity of the annular MR when loaded in its non-forming direction (radial compression). The rapid decrease in k3 with amplitude may indicate that at larger deformations, the annular MR’s wire network undergoes significant contact relaxation and sliding, reducing its incremental stiffness [33,36].
The damping coefficient c and exponent α describe the dissipation intensity and velocity sensitivity, respectively. Unlike the conventional viscous damping coefficient, the dimensional form of c in the power-law damping model varies with α. Therefore, c should not be considered independently, but should be interpreted together with the corresponding exponent α. The increase in both with amplitude may confirm that larger deformations activate more wire-contact sliding, enhancing the dry friction dissipation [31]. The near-unity value of α at the largest amplitude (0.6 mm, 3 Hz: 1.016) indicates that the damping response gradually approaches linear viscous behavior under this condition. This suggests that the velocity dependence of the dissipative force becomes closer to a linear relationship when the internal wire contacts experience more stable sliding [27].
4.3. Comparison Between Vertical and Lateral Models
The differences in model structure and parameter trends directly reflect the different structural configurations and load paths. The vertical model requires a quadratic stiffness term k2 to account for asymmetry, while the lateral model does not. The vertical damping is represented by , whereas the lateral damping uses a power law . Both representations are empirical but are physically consistent with the respective friction mechanisms (tubular MR vs. annular MR) [24,31]. The parameter trends with excitation amplitude and frequency are generally consistent with the dynamic performance observations in Section 2, suggesting that the proposed models capture the principal characteristics of the direction-specific hysteresis responses.
5. Model Validation and Application
5.1. Interpolation and Extrapolation Validation
The model validation included interpolation and extrapolation cases defined relative to the parameter identification ranges. To ensure a fair and consistent comparison, the proposed direction-specific nonlinear hysteresis model and the classical Bouc–Wen model were developed using the same training datasets and evaluated under identical validation conditions for each loading direction. The model parameters were identified from experimental hysteresis responses and subsequently expressed as functions of excitation amplitude and frequency. For each validation condition, the parameters used to generate the predicted hysteresis loops were calculated from the corresponding regression functions rather than directly obtained by fitting the validation data. The interpolation cases were included in the regression dataset, whereas the extrapolation cases were excluded from regression fitting. Accordingly, the interpolation cases were used to assess the reconstruction accuracy within the identification ranges, while the extrapolation cases were used to evaluate the predictive capability of the models beyond these ranges [37].
5.1.1. Vertical Model Validation
For the vertical direction, three representative conditions were selected to compare the hysteresis responses predicted by the proposed vertical model and the classical Bouc–Wen model:
- Interpolation case, 3 Hz/0.8 mm (excitation frequency 3 Hz, amplitude 0.8 mm). This condition lies within the identification ranges (frequency 2–4 Hz, amplitude 0.6–1.0 mm).
- Extrapolation case 1 (lower amplitude), 2 Hz/0.4 mm. The amplitude (0.4 mm) is below the identification range (0.6–1.0 mm).
- Extrapolation case 2 (higher frequency), 5 Hz/0.6 mm. The frequency (5 Hz) is above the identification range (2–4 Hz).
For the proposed vertical model, the parameters corresponding to each validation condition were calculated using the fitted polynomial functions presented in Section 4.1, as summarized in Table 7. For the classical Bouc–Wen model, the corresponding parameters were determined using the frequency- and amplitude-dependent regression functions established from the same training dataset.
Table 7.
Model parameters for vertical validation conditions.
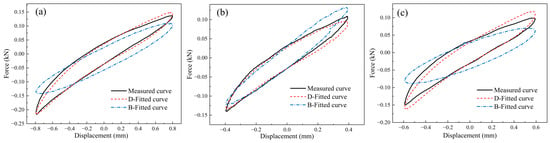
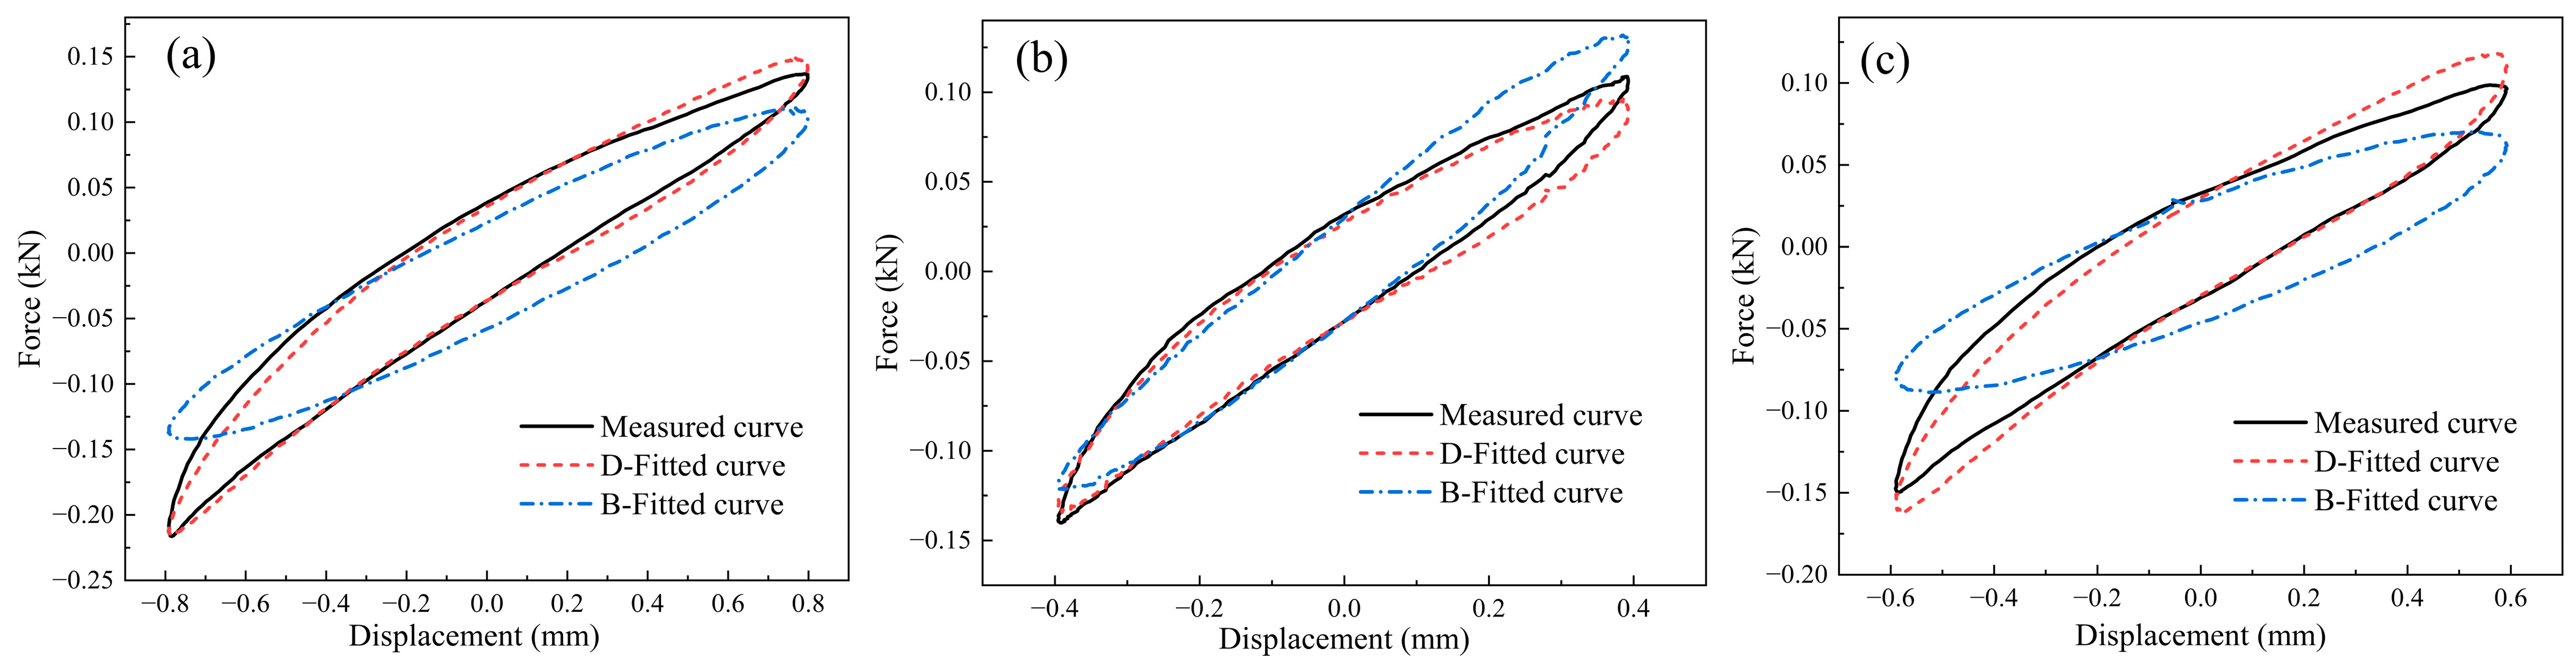
Figure 7 compares the experimentally measured hysteresis loops with those predicted by the proposed vertical nonlinear hysteresis model and the classical Bouc–Wen model under the three vertical validation conditions. In each subfigure, the black solid line (Measured curve) represents the experimental response, while the red dashed line (D-Fitted curve) and blue dash-dotted line (B-Fitted curve) represent the predictions of the proposed model and the classical Bouc–Wen model, respectively.
Figure 7.
Comparison of experimentally measured hysteresis loops with predictions from the proposed vertical model and the classical Bouc–Wen model under different excitation conditions: (a) 3 Hz/0.8 mm (interpolation); (b) 2 Hz/0.4 mm (extrapolation lower amplitude); (c) 5 Hz/0.6 mm (extrapolation higher frequency).
To comprehensively evaluate the agreement between the experimental and predicted hysteresis curves, three quantitative indices, namely the goodness-of-fit index (GFI), normalized root-mean-square error (NRMSE), and dissipated-energy error (), are employed. The GFI is calculated as follows:
The NRMSE is introduced to quantify the overall deviation between the experimental and predicted force values, as expressed in Equation (25), where N denotes the number of sampling points, yi are the experimental force values, Yi are predicted values, and ȳ is the mean of the experimental data, respectively, and ymax and ymin denote the maximum and minimum experimental force values. A smaller NRMSE indicates better overall agreement.
The relative dissipated-energy error () is defined by Equation (26), where and denote the dissipated energies of the predicted and experimental hysteresis loops, respectively, calculated using Equation (1). A smaller relative dissipated-energy error indicates a more accurate prediction of the hysteretic energy dissipation.
Based on the three evaluation indices defined above, the GFI, NRMSE, and were calculated for the three validation conditions, and the corresponding results are summarized in Table 8.
Table 8.
Quantitative comparison of the proposed vertical model and the classical Bouc–Wen model under three validation conditions.
The quantitative evaluation results for the three vertical validation conditions are summarized in Table 8. For the interpolation case (3 Hz/0.8 mm), the proposed vertical model achieves a GFI of 0.997, an NRMSE of 2.425%, and an of 0.350%, outperforming the classical Bouc–Wen model (0.958, 9.644%, and 9.078%, respectively).
For the lower-amplitude extrapolation case (2 Hz/0.4 mm), the proposed model achieves a higher GFI (0.994 vs. 0.984) and a lower NRMSE (3.640% vs. 6.034%), although the Bouc–Wen model exhibits a slightly lower (0.226% vs. 0.668%). For the higher-frequency extrapolation case (5 Hz/0.6 mm), the proposed model maintains good predictive accuracy, with a GFI of 0.989, an NRMSE of 4.877%, and an of 2.409%, compared with 0.924, 12.843%, and 13.269% for the Bouc–Wen model [33].
Overall, the proposed vertical model demonstrates superior accuracy in reproducing the experimental hysteresis loops. The relatively larger deviations of the classical Bouc–Wen model may be partly attributed to its inherent tendency to produce centrosymmetric hysteresis loops under symmetric periodic excitation, which limits its ability to capture the asymmetric vertical response. These results support the effectiveness of the proposed model under both interpolation and extrapolation conditions [32].
5.1.2. Lateral Model Validation
For the lateral direction, three representative conditions were selected to compare the hysteresis responses predicted by the proposed lateral nonlinear hysteresis model and the classical Bouc–Wen model:
- Interpolation case: 3 Hz/0.4 mm (frequency and amplitude both within the identification ranges: 2–4 Hz, 0.2–0.6 mm).
- Extrapolation case 1: 2 Hz/0.7 mm (amplitude above the upper limit of 0.6 mm, but frequency within range). This working condition slightly exceeds the parameter identification dataset but remains within the allowable radial deformation limit of the annular MR specimen; post-test inspection confirmed no structural damage or performance degradation after this test.
- Extrapolation case 2: 5 Hz/0.6 mm (frequency above the 2–4 Hz range, amplitude at the upper limit).
For the proposed lateral nonlinear hysteresis model, the parameters corresponding to each validation condition were calculated using the fitted polynomial functions presented in Section 4.2, as summarized in Table 9. For the classical Bouc–Wen model, the corresponding parameters were determined using the frequency- and amplitude-dependent regression functions established from the same training dataset.
Table 9.
Model parameters for lateral validation conditions.
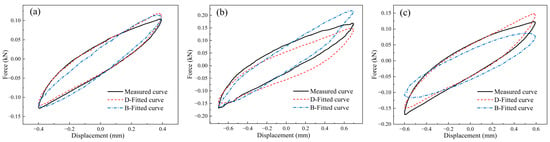
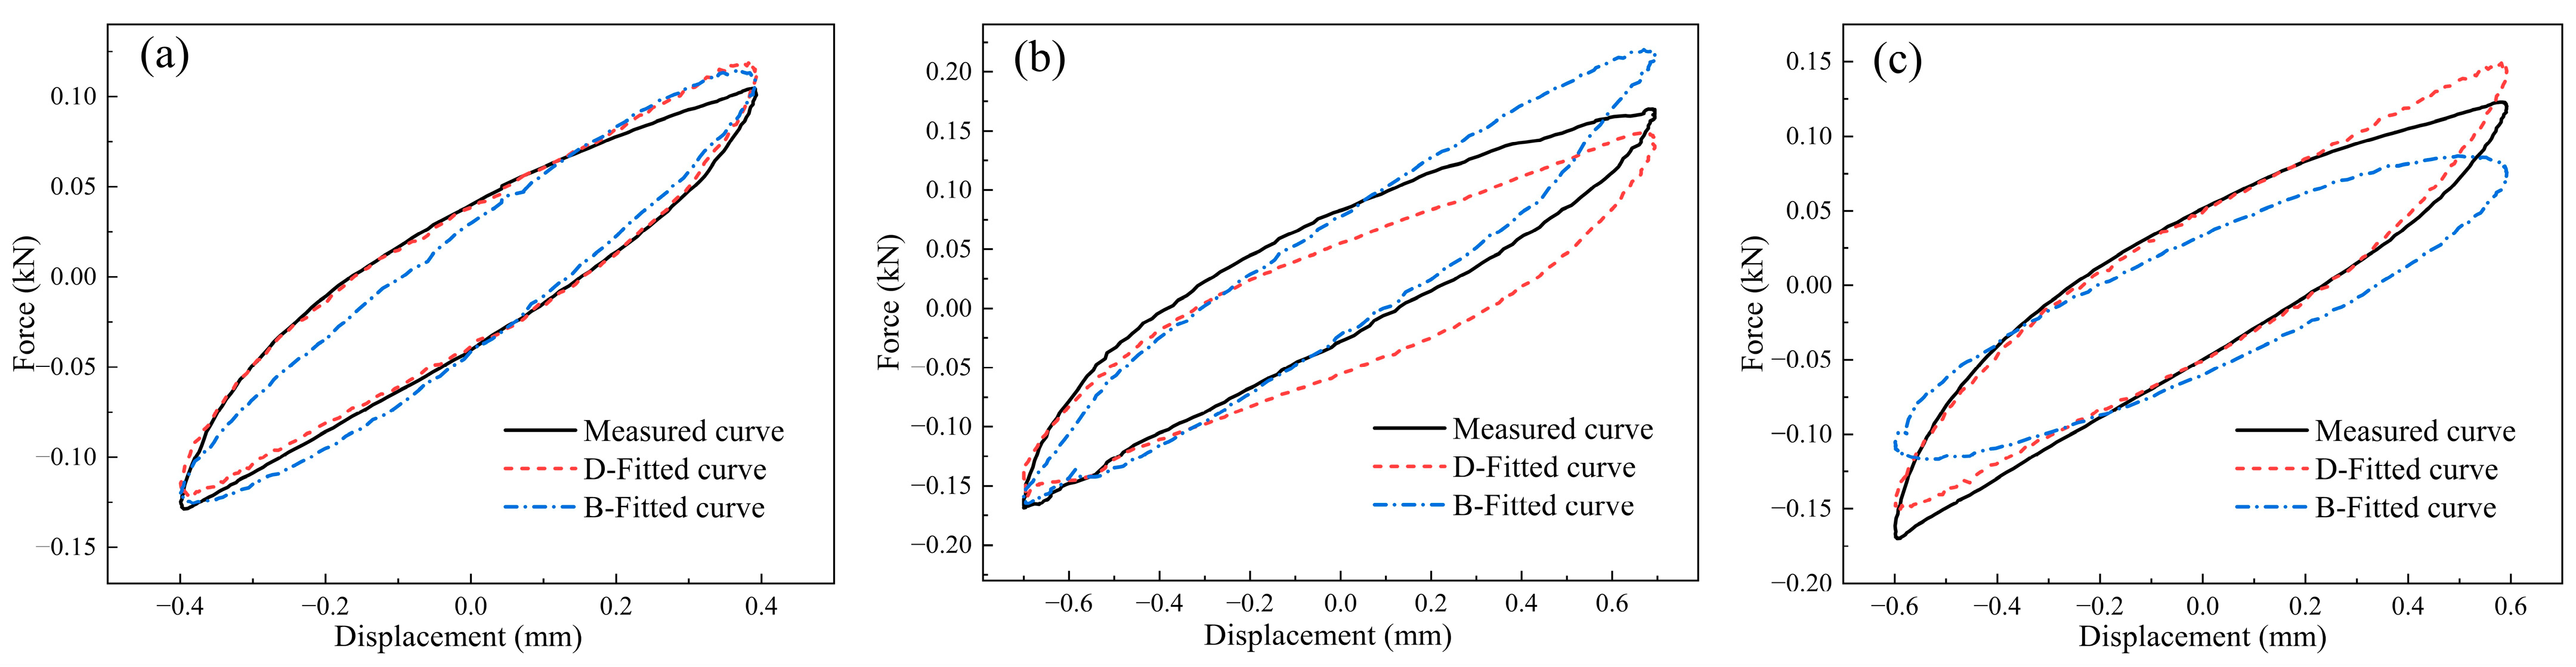
Figure 8 compares the experimentally measured hysteresis loops with those predicted by the proposed lateral nonlinear hysteresis model and the classical Bouc–Wen model under the three lateral validation conditions. The line styles and colors are consistent with those used in Figure 7.
Figure 8.
Comparison of experimentally measured hysteresis loops with predictions from the proposed lateral nonlinear hysteresis model and the classical Bouc–Wen model: (a) 3 Hz/0.4 mm (interpolation); (b) 2 Hz/0.7 mm (extrapolation higher amplitude); (c) 5 Hz/0.6 mm (extrapolation higher frequency).
The predictive performance of the two models was quantitatively evaluated using GFI, NRMSE, and under the three lateral validation conditions, as summarized in Table 10.
Table 10.
Quantitative comparison of the proposed lateral model and the classical Bouc–Wen model under three validation conditions.
For the interpolation case (3 Hz/0.4 mm), the proposed lateral model achieves a GFI of 0.994, an NRMSE of 3.481%, and an of 0.305%, outperforming the classical Bouc–Wen model (0.992, 4.306%, and 3.217%, respectively). For the higher-amplitude extrapolation case (2 Hz/0.7 mm), the proposed model achieves a higher GFI (0.979 vs. 0.970), a lower NRMSE (5.237% vs. 8.237%), and a smaller (1.266% vs. 2.211%). For the higher-frequency extrapolation case (5 Hz/0.6 mm), the proposed model maintains good predictive accuracy, with a GFI of 0.990, an NRMSE of 4.737%, and an of 3.320%, compared with 0.951, 10.591%, and 3.935% for the Bouc–Wen model [34,37].
For the 2 Hz/0.7 mm high-amplitude extrapolation case, the damping coefficient c and exponent α are 3.265 and 1.037, respectively. As shown in Figure 8b, although some local discrepancies remain in the loop width, curvature, and reversal regions, the model captures the overall hysteresis behavior. The GFI, NRMSE, and are 0.979, 5.237%, and 1.266%, respectively. These quantitative results indicate that, despite the visible local differences between the predicted and measured curves, the model maintains good overall agreement in terms of hysteresis response and energy dissipation under this high-amplitude extrapolation condition [37].
Overall, the proposed lateral nonlinear hysteresis model consistently provides more accurate predictions of the experimental hysteresis responses across all three conditions. Although the lateral hysteresis loops exhibit approximately centrosymmetric characteristics that can be represented by the classical Bouc–Wen model, the proposed model achieves better agreement in both restoring-force response and energy dissipation. These results further support the effectiveness of the proposed direction-specific nonlinear hysteresis modeling approach under interpolation and extrapolation conditions.
6. Conclusions
- A direction-specific modeling strategy is proposed for a composite MR-spring isolator that exhibits asymmetric hysteresis under vertical loading and symmetric hysteresis under lateral loading. This approach overcomes the limitation of using a single conventional model for multiple directions.
- An asymmetric model (cubic stiffness with quadratic term, plus linear and quadratic velocity damping) is established for the vertical direction, and a symmetric model (cubic stiffness with power-law damping) for the lateral direction. Parameter identification from dynamic tests (2–4 Hz, amplitudes 0.2–1.0 mm) is performed, and explicit empirical polynomial functions of amplitude (and frequency) are established for all stiffness and damping parameters within the investigated excitation range.
- The model parameters can be plausibly associated with specific structural components and deformation mechanisms: the linear stiffness (k1) may reflect the contribution of the central spring and the approximately linear response of the MR components; the quadratic stiffness (k2) may be related to the asymmetry associated with the annular MR; and the cubic stiffness (k3) may reflect the nonlinear response of the tubular and annular MR components. The damping parameters may be associated with dry friction at wire contacts. The variation in these parameters with excitation conditions may reflect changes in microslip and contact interactions within the MR wire network. These interpretations are based on the structural configuration and observed hysteretic responses, and have not been independently confirmed by component-level tests.
- Model validation demonstrates that the proposed direction-specific nonlinear hysteresis models achieve GFI values above 0.97, with NRMSE and relative dissipated-energy errors below 5.3% and 3.4%, respectively, under the investigated interpolation and extrapolation conditions. Compared with the classical Bouc–Wen model, the proposed models generally provide higher GFI values and lower NRMSE and relative dissipated-energy errors, demonstrating improved accuracy in capturing the vertical and lateral hysteresis responses of the composite isolator.
- The direction-specific mechanical characteristics provide practical guidance for the design of the composite MR-spring isolator. The stiffness and damping properties should be matched according to the expected loading directions and excitation amplitudes, considering the different contributions of the central spring, tubular MR, and annular MR. However, the proposed models were established within limited excitation ranges (2–4 Hz), and their applicability to broader operating conditions requires further validation. The physical interpretation of the negative quadratic damping coefficient c2 also requires further investigation. Future studies should focus on multi-directional coupling effects and lateral force transmissibility to evaluate the practical vibration isolation performance of the isolator.
Author Contributions
Conceptualization, Y.W. and Z.R.; methodology, Y.W. and H.W.; software, Y.W. and H.W.; validation, Y.W. and D.W.; formal analysis, Y.W. and H.W.; investigation, Y.W. and D.W.; resources, Z.R.; data curation, H.W. and D.W.; writing—original draft preparation, Y.W.; writing—review and editing, Y.W. and Z.R.; visualization, Y.W. and H.W.; supervision, Z.R.; project administration, Z.R.; funding acquisition, Z.R. All authors have read and agreed to the published version of the manuscript.
Funding
The authors would like to acknowledge the National Natural Science Foundation of China-NSAF (Grant No. U2330202) for providing financial support for conducting the experiments.
Institutional Review Board Statement
Not applicable.
Informed Consent Statement
Not applicable.
Data Availability Statement
The data used to support the findings of this study are available from the corresponding author upon request.
Conflicts of Interest
The authors declare no conflicts of interest.
References
- Xu, Z.; Chen, Z.; Huang, X.; Zhou, C.; Hu, Z.; Yang, Q.; Gai, P. Recent advances in multi-dimensional vibration mitigation materials and devices. Front. Mater. 2019, 6, 143. [Google Scholar] [CrossRef] [Scilit]
- Li, L.; Wang, L.; Yuan, L.; Zheng, R.; Wu, Y.; Sui, J.; Zhong, J. Micro-vibration suppression methods and key technologies for high-precision space optical instruments. Acta Astronaut. 2021, 180, 417–428. [Google Scholar] [CrossRef] [Scilit]
- Park, Y.H.; Kwon, S.C.; Koo, K.R.; Oh, H.U. High damping passive launch vibration isolation system using superelastic SMA with multilayered viscous lamina. Aerospace 2021, 8, 201. [Google Scholar] [CrossRef] [Scilit]
- Xue, X.; Yang, P.; Shao, Y.; Bai, H. Manufacture technology and anisotropic behaviour of elastic-porous metal rubber. Int. J. Lightweight Mater. Manuf. 2020, 3, 88–99. [Google Scholar] [CrossRef] [Scilit]
- Xiao, K.; Bai, H.; Xue, X.; Wu, Y. Damping characteristics of metal rubber in the pipeline coating system. Shock Vib. 2018, 2018, 3974381. [Google Scholar] [CrossRef] [Scilit]
- Zheng, X.; Wang, W.; Wu, Y.; Bai, H. Study of the dynamic model and vibration performance of pot-shaped metal rubber. Materials 2022, 15, 5878. [Google Scholar] [CrossRef] [Scilit] [PubMed]
- Zou, Y.; Xiong, C.; Yin, J.; Cui, K.; Zhu, X.; Deng, H.; Song, S. Experimental and constitutive model study on dynamic mechanical behavior of metal rubber under high-speed impact loading. Shock Vib. 2021, 2021, 8845375. [Google Scholar] [CrossRef] [Scilit]
- Xiao, J.; Zhu, T.; Li, L.; Shen, L.; Ren, Z.; Xu, J. Design and biomechanical properties of symmetrical lumbar fusion cage based on lightweight titanium alloy flexible microporous metal rubber. Symmetry 2023, 15, 1938. [Google Scholar] [CrossRef] [Scilit]
- Shen, L.; Ren, Z.; Xu, J.; Pan, L.; Lin, Y.; Bai, H. Dry friction damping mechanism of flexible microporous metal rubber based on cell group energy dissipation mechanism. Friction 2023, 11, 259–279. [Google Scholar] [CrossRef] [Scilit]
- Zhang, B.; Lang, Z.Q.; Billings, S.A.; Tomlinson, G.R.; Rongong, J.A. System identification methods for metal rubber devices. Mech. Syst. Signal Process. 2013, 39, 207–226. [Google Scholar] [CrossRef] [Scilit]
- Garcia, P.; De-Juan, A.; Ríos, D.; Herráez, M.; Viadero, F. Contribution to the characterization of vibration isolators based on metal mesh. Machines 2023, 11, 856. [Google Scholar] [CrossRef] [Scilit]
- Wang, H.; Rongong, J.A.; Tomlinson, G.R.; Hong, J. Nonlinear static and dynamic properties of metal rubber dampers. In Proceedings of the ISMA 2010—International conference on noise and vibration engineering, Leuven, Belgium, 20–22 September 2010; pp. 1301–1315. [Google Scholar]
- Yu, W.; Li, Z.; Liu, B.; Gao, M. Stiffness characteristic comparison between metal-rubber and rubber isolator under sonic vibration. J. Vibroeng. 2014, 16, 645–655. [Google Scholar] [CrossRef] [Scilit]
- Ren, Z.Y.; Chen, Q.; Bai, H.; Wu, Y. Study on damping energy dissipation characteristics of cylindrical metal rubber in nonforming direction. Adv. Mater. Sci. Eng. 2018, 2018, 5014789. [Google Scholar] [CrossRef] [Scilit]
- Xia, X.; Huang, Y.; Li, D.; Xu, F. Hysteresis model of metal rubber bridge bearings. Soil Dyn. Earthq. Eng. 2025, 194, 109245. [Google Scholar] [CrossRef] [Scilit]
- Velychkovych, A.; Mykhailiuk, V.; Andrusyak, A. Evaluation of the Adaptive Behavior of a Shell-Type Elastic Element of a Drilling Shock Absorber with Increasing External Load Amplitude. Vibration 2025, 8, 60. [Google Scholar] [CrossRef] [Scilit]
- Moisyshyn, M.V.; Slabyi, O.O. Creation of the Vibroprotective Device for Adjustment of Dynamics of a Column of Steel Drill Pipes and a Bit. Metallofiz. Noveishie Tekhnol. 2018, 40, 541–550. [Google Scholar] [CrossRef] [Scilit]
- Maciej, D.; Andrii, V.; Ivan, S. Efficient Model of the Interaction of Elastomeric Filler with an Open Shell and a Chrome-Plated Shaft in a Dry Friction Damper. Materials 2022, 15, 4671. [Google Scholar] [CrossRef] [Scilit] [PubMed]
- Zhao, X. Design and Experimental Research of Metal Rubber and Spring Combined Three-Direction Vibration Isolator. Master’s Thesis, Fuzhou University, Fuzhou, China, 2020. [Google Scholar] [CrossRef]
- Ren, Z. Design and Performance Analysis of Hat-Shaped Metal Rubber-Spring Composite Three-Direction Equal Stiffness Vibration Isolator. Master’s Thesis, Fuzhou University, Fuzhou, China, 2022. [Google Scholar] [CrossRef]
- GB/T 15168-2013; Static and Dynamic Performance Test Methods for Vibration and Shock Isolators. Standards Press of China: Beijing, China, 2013.
- Zou, G.; Zhang, B.; Chang, Z.; Liu, S. Hysteresis mechanical model and experimental study of spring-metal mesh rubber combined vibration isolator. Chin. J. Theor. Appl. Mech. 2018, 50, 1125–1134. [Google Scholar] [CrossRef]
- Zhu, W.; Liu, X.; Ren, Z.; Bai, H.; Zhang, Y.J.; Zhen, X.Y. Vibration reduction performance of non-forming direction metal rubber vibration absorber. J. Fuzhou Univ. (Nat. Sci. Ed.) 2020, 48, 747–754. [Google Scholar] [CrossRef]
- Xiao, K.; Bai, H.; Xue, X.; Wu, Y. Vibration damping performance of metal rubber coated pipeline damping structure. J. Vib. Shock 2019, 38, 239–245. [Google Scholar] [CrossRef]
- Du, Y.; Wang, D.; Jin, Y.; Fan, X. An asymmetric hysteresis model for metal-rubber isolators under dynamic loading and its application to nonlinear vibration simulation. J. Sound Vib. 2024. [Google Scholar] [CrossRef] [Scilit]
- Liang, Y.; Ren, Z.; Li, C.; Zhu, W.; Bai, H. Damping energy dissipation characteristics of large-load pipeline vibration absorber using non-forming direction metal rubber. J. Fuzhou Univ. (Nat. Sci. Ed.) 2022, 50, 89–96. [Google Scholar] [CrossRef]
- Chen, Y.; Zhu, Z. Performance study of thin metal rubber vibration isolator for pipelines. J. Aerosp. Power 2001, 16, 175–178. [Google Scholar] [CrossRef]
- Bai, H.; Zhan, Z.; Ren, Z. Research progress and prospect of acoustic performance of metal rubber. J. Vib. Shock 2020, 39, 242–254. [Google Scholar] [CrossRef]
- Liang, R.; Hao, W.; Chen, W. Research progress on mechanical properties and application of metal rubber. J. Cent. South Univ. (Sci. Technol.) 2023, 54, 36–52. [Google Scholar] [CrossRef]
- Wu, Y.; Cheng, H.; Bai, H.; Zi, B.; Tang, Y. Damping characteristics and parameter identification of an asymmetric hysteresis model of entangled metallic wire materials/disc springs laminated composite dampers. J. Vib. Shock 2022, 41, 270–276. [Google Scholar] [CrossRef]
- Zhou, Y.; Qu, W. Several practical approaches for nonlinear dynamic modeling of metal rubber. Noise Vib. Control 2013, 31–36. [Google Scholar] [CrossRef]
- Jiang, F.; Ding, Z.; Wu, Y.; Bai, H.; Shao, Y.; Zi, B. Energy dissipation characteristics and parameter identification of symmetrically coated damping structure of pipelines under different temperature environment. Symmetry 2020, 12, 1283. [Google Scholar] [CrossRef] [Scilit]
- Zou, L.; Zheng, C.; Ren, Z.; Zhao, X.; Xue, X. Mechanical properties and environmental effects of metal rubber damping three-dimensional vibration isolator. Mech. Sci. Technol. Aerosp. Eng. 2024, 43, 1323–1332. [Google Scholar] [CrossRef]
- Ren, Z.; Zhao, X.; Xue, X.; Bai, H. Shear mechanical characteristics and density dependence of annular metal rubber damper. Mater. Mech. Eng. 2021, 45, 55–61. [Google Scholar] [CrossRef]
- Shi, L.; Ren, Z.; Huang, Z.; Du, P.; Liu, T. Research progress of metal rubber as new basic component for equipment vibration reduction. J. Mech. Eng. 2024, 60, 104–126. [Google Scholar] [CrossRef]
- Xiao, Y.; Gao, J.; Lin, J.; Wang, H.; Xue, X. Dynamic analysis of a symmetrical frustum-shaped metal rubber isolator under random vibration. Symmetry 2026, 18, 99. [Google Scholar] [CrossRef] [Scilit]
- Xia, X.; Wu, S.; Sun, S.; Du, Q.; Long, F. Lateral hysteretic behavior of a novel metal rubber bridge bearing. Eng. Struct. 2022, 256, 114051. [Google Scholar] [CrossRef] [Scilit]

Disclaimer/Publisher’s Note: The statements, opinions and data contained in all publications are solely those of the individual author(s) and contributor(s) and not of MDPI and/or the editor(s). MDPI and/or the editor(s) disclaim responsibility for any injury to people or property resulting from any ideas, methods, instructions or products referred to in the content. |
© 2026 by the authors. Licensee MDPI, Basel, Switzerland. This article is an open access article distributed under the terms and conditions of the Creative Commons Attribution (CC BY) license.