


Abstract
Activated carbon monoliths require both methane adsorption capacity and mechanical strength for gas storage. In this study, monoliths were prepared from fine, medium and coarse activated carbon particles to examine the effect of particle-size combination on these properties. Single fractions and binary mixtures at a volume ratio of 3:7 were molded under the same conditions. The pore structure, density and compressive strength were analyzed and methane adsorption was evaluated. The coarse-particle monolith had the largest micropore volume of 1.03 cm3/g and the highest methane uptake per unit mass of 3.735 mmol/g at an absolute pressure of 10 bar. The fine–coarse monolith showed a lower uptake of 3.590 mmol/g but a higher density of 0.480 g/cm3. Its calculated uptake per unit volume was the highest at 1.72 mmol/cm3, slightly above the 1.70 mmol/cm3 of the coarse-particle monolith. The higher density therefore compensated for the lower uptake per unit mass. The medium–coarse monolith showed the highest compressive strength of 7.83 MPa. These results indicate that the particle-size combination should be selected by considering monolith density and compressive strength together with methane uptake per unit mass.
1. Introduction
Natural gas emits less carbon dioxide per unit of energy than coal and petroleum-based fuels during combustion [1,2]. Methane is its main component, and natural gas is commonly stored as compressed natural gas (CNG) or liquefied natural gas (LNG). CNG is stored at about 20–25 MPa, while LNG requires cryogenic temperatures [3,4,5]. The energy consumption and equipment required for these storage methods have led to studies on adsorbed natural gas (ANG) storage, which uses porous adsorbents at moderate pressures and near-ambient temperatures [6,7,8].
Activated carbon has been investigated for ANG storage along with zeolites and metal–organic frameworks [9,10,11]. Its high specific surface area and pore volume provide sites for methane adsorption, and its chemical stability and relatively low cost are advantageous for adsorbent preparation [12,13,14]. Activated carbon can be prepared from coal, coconut shells, polymers and pitch, with different pore structures depending on the raw material and activation conditions. Methane adsorption mainly occurs through physical interactions, so the micropore volume and pore size distribution are important in determining the adsorption capacity [15,16,17]. However, activated carbon with a high adsorption capacity is often obtained as a powder. Powder handling can cause particle loss, and fine particles can produce a high pressure drop during gas flow through a packed bed [18,19]. To facilitate handling, activated carbon powder can be mixed with a binder and formed into a monolith [20,21,22]. The binder holds the particles together but can also cover the carbon surface and block pore entrances. The specific surface area and pore volume per unit mass of the monolith may therefore decrease through both pore blockage and a reduction in the activated carbon mass fraction [23,24]. These changes can lower methane uptake per unit mass even when the mechanical strength of the monolith is improved.
The properties of a monolith also depend on the size and arrangement of the activated carbon particles. Fine particles can occupy spaces between coarse particles when different size fractions are mixed, although the resulting packing density depends on the particle-size ratio and the proportion of each fraction [25,26]. Saeidi and Lotfollahi [25] reported that screening activated carbon to smaller particle sizes improved the surface area and mechanical strength of extruded monoliths. Reljic et al. [24] showed that an increase in monolith density could compensate for lower methane uptake per unit mass after binder addition. Our previous study examined the effects of blending ratio and binder content using activated carbon fractions of 26–53 and 212–250 μm [27]. Among the tested formulations, M50ML had a structural density of 0.544 g/cm3 and a compressive strength of 27.5 MPa. That comparison concerned one fine–coarse pair and did not establish whether other particle-size pairings would give the same relation between density, strength and methane adsorption.
Comparing different particle-size pairings at a fixed blending ratio and binder content allows this relationship to be examined without varying these preparation factors. Binder content can affect particle bonding as well as the activated carbon mass fraction and pore accessibility. Different particle-size combinations may still change particle contacts and binder distribution under the same molding conditions. An increase in powder packing density may therefore not produce a corresponding increase in monolith strength. Methane uptake per unit volume also depends on both uptake per unit mass and monolith density [28]. A combination that gives higher packing density cannot therefore be assumed to give higher strength and methane uptake per unit volume.
In this study, activated carbon was classified into fine, medium and coarse fractions. Monoliths were prepared from the individual fractions and their binary mixtures. All three binary combinations were examined at a volume ratio of 3:7 with the binder content and molding conditions kept constant across all samples. The objective was to examine whether the particle-size combinations that increased powder packing density also gave higher compressive strength and methane uptake per unit volume after molding. The pore characteristics and monolith density were compared to examine their contributions to methane uptake on mass and volume bases.
2. Materials and Methods
2.1. Materials
Coconut-shell-based granular activated carbon (POSCO Future M, Pohang, Republic of Korea) with a specific surface area of approximately 2000 m2/g was used as the raw material. This commercial activated carbon was selected because of its availability and high specific surface area. Coconut-shell activated carbon from the same supplier had also been used in our previous monolith study [27]. All particle-size fractions were prepared from one commercial material to keep the carbon source unchanged. A styrene acrylic binder (SBA) and carboxymethyl cellulose (CMC) were supplied by Unisol Chemicals (Yongin-si, Republic of Korea). SBA was used as the liquid binder and CMC as the dispersant. Distilled water was used to prepare the mixture.
2.2. Preparation of Activated Carbon Monoliths
Granular activated carbon was pulverized using a grinder and sieved for 24 h through a 75 μm sieve mounted on a sieve shaker. The passing powder was further classified using 26 and 53 μm sieves. AC-F passed through the 26 μm sieve. AC-M passed through the 53 μm sieve and was retained on the 26 μm sieve. AC-C passed through the 75 μm sieve and was retained on the 53 μm sieve. All powders were dried in an oven at 80 °C before use.
Monoliths were prepared from the individual fractions and binary mixtures of AC-F/AC-M, AC-F/AC-C and AC-M/AC-C. The smaller and larger particle fractions in each binary mixture were blended at a volume ratio of 3:7. This ratio retained the larger fraction as the main component and was kept constant across the three pairings to compare the effects of particle-size combination. For each 1.0 g of activated carbon, 1.65 g of distilled water, 0.242 g of SBA and 0.024 g of CMC were used. SBA and CMC were stirred in distilled water at 60 °C using a mechanical stirrer until the binder was uniformly dispersed. The resulting mixture was then kneaded with the activated carbon powder. A 7.5 g portion of the mixture was placed in a cylindrical mold with a diameter of 30 mm and compressed at 20 MPa for 2 min using a hydraulic press. A pressure of 20 MPa was used as a fixed forming condition for comparing the particle-size combinations. Monoliths suitable for subsequent characterization were obtained from all six formulations at this pressure. The reported trends apply to the present material and binder composition under these forming conditions. The molded samples were dried at room temperature for 24 h and then in an oven at 80 °C for 24 h.
The monoliths prepared from AC-F, AC-M and AC-C were named M-F, M-M and M-C, respectively. Those prepared from the binary mixtures were named M-FM-37, M-FC-37 and M-MC-37. The suffix 37 denotes the volume ratio of the two activated carbon fractions.
2.3. Characterization
The particle size distributions of the activated carbon powders were measured using a particle size analyzer (Bettersize 2000, Dandong Bettersize Instruments Ltd., Dandong, China). Repeated sieving and particle-size analysis were carried out to obtain stable particle-size distributions for the classified fractions. Bulk and tapped densities were determined using a graduated cylinder. The mass of powder occupying an initial volume of 10 mL was measured and divided by this volume to obtain the bulk density. The cylinder was then tapped 200 times on a rigid surface. Tapped density was calculated by dividing the same powder mass by the volume recorded after tapping. Bulk and tapped density measurements were each repeated five times for each sample.
The morphology of the activated carbon powders and monoliths was observed using a scanning electron microscope (SEM; VEGA3, TESCAN, Brno, Czech Republic). One monolith was examined for each composition. The top, fracture and side surfaces were observed and images showing typical surface features were selected for qualitative comparison. Fragments from one monolith per formulation were used for nitrogen adsorption measurements without further grinding. The pore structures of the activated carbon monoliths were analyzed by nitrogen adsorption–desorption at −196 °C using a Brunauer–Emmett–Teller (BET) adsorption analyzer (TriStar 3020, Micromeritics, Norcross, GA, USA). The samples were degassed at 150 °C for 8 h before measurement. The specific surface area was calculated using the BET method. Fragments taken from the monoliths were used for nitrogen adsorption measurements without further grinding. The total pore volume was determined from the nitrogen adsorption data. The micropore volume and pore size distributions were calculated using non-local density functional theory (NLDFT).
The mass of each monolith was measured using an electronic balance (FX-300i, A&D, Tokyo, Japan) with a readability of 0.001 g. The diameter and thickness of the same monolith were each measured five times using a digital caliper (Mitutoyo, Kawasaki, Japan) with a resolution of 0.01 mm. The mean diameter and thickness were used to calculate the cylindrical volume. Monolith density was calculated by dividing the measured mass by this volume. The compressive strength of the monoliths was measured using a universal testing machine (AG-X, Shimadzu, Kyoto, Japan). The dried cylindrical specimens had a diameter of 30 mm, and a thickness of approximately 10 mm. Compression was applied perpendicular to the flat circular faces at a crosshead speed of 1 mm/min. Maximum compressive strength was calculated by dividing the maximum recorded load by the initial cross-sectional area of each specimen. Three separate monoliths were tested for each composition, and the meaning of the three strength values was reported.
2.4. Methane Adsorption Measurements
Methane adsorption was measured using fragments from one monolith per formulation. The adsorption isotherms were measured at 25 °C using a volumetric gas adsorption analyzer (iSorb HP1 100, Anton Paar, Graz, Austria) up to an absolute pressure of approximately 10 bar. Methane uptake per unit mass was calculated based on the mass of the fragments used for the measurement. Methane uptake per unit volume was calculated using Equation (1).
where qv is the methane uptake per unit volume (mmol/cm3) and qm is the methane uptake per unit mass (mmol/g). The monolith density (g/cm3) was determined from the mass and external dimensions of the corresponding monolith.
qv = qm × monolith density
3. Results and Discussion
3.1. Particle Size and Packing Properties of Activated Carbon Powders
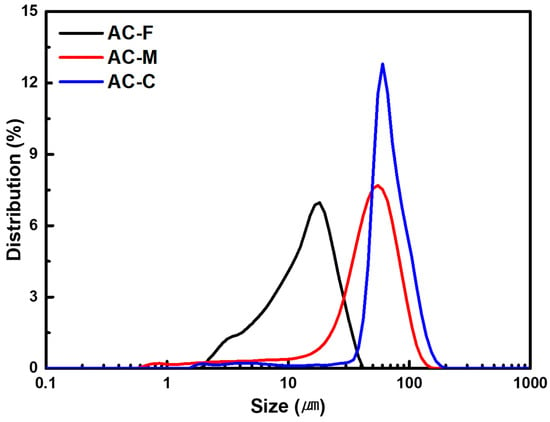
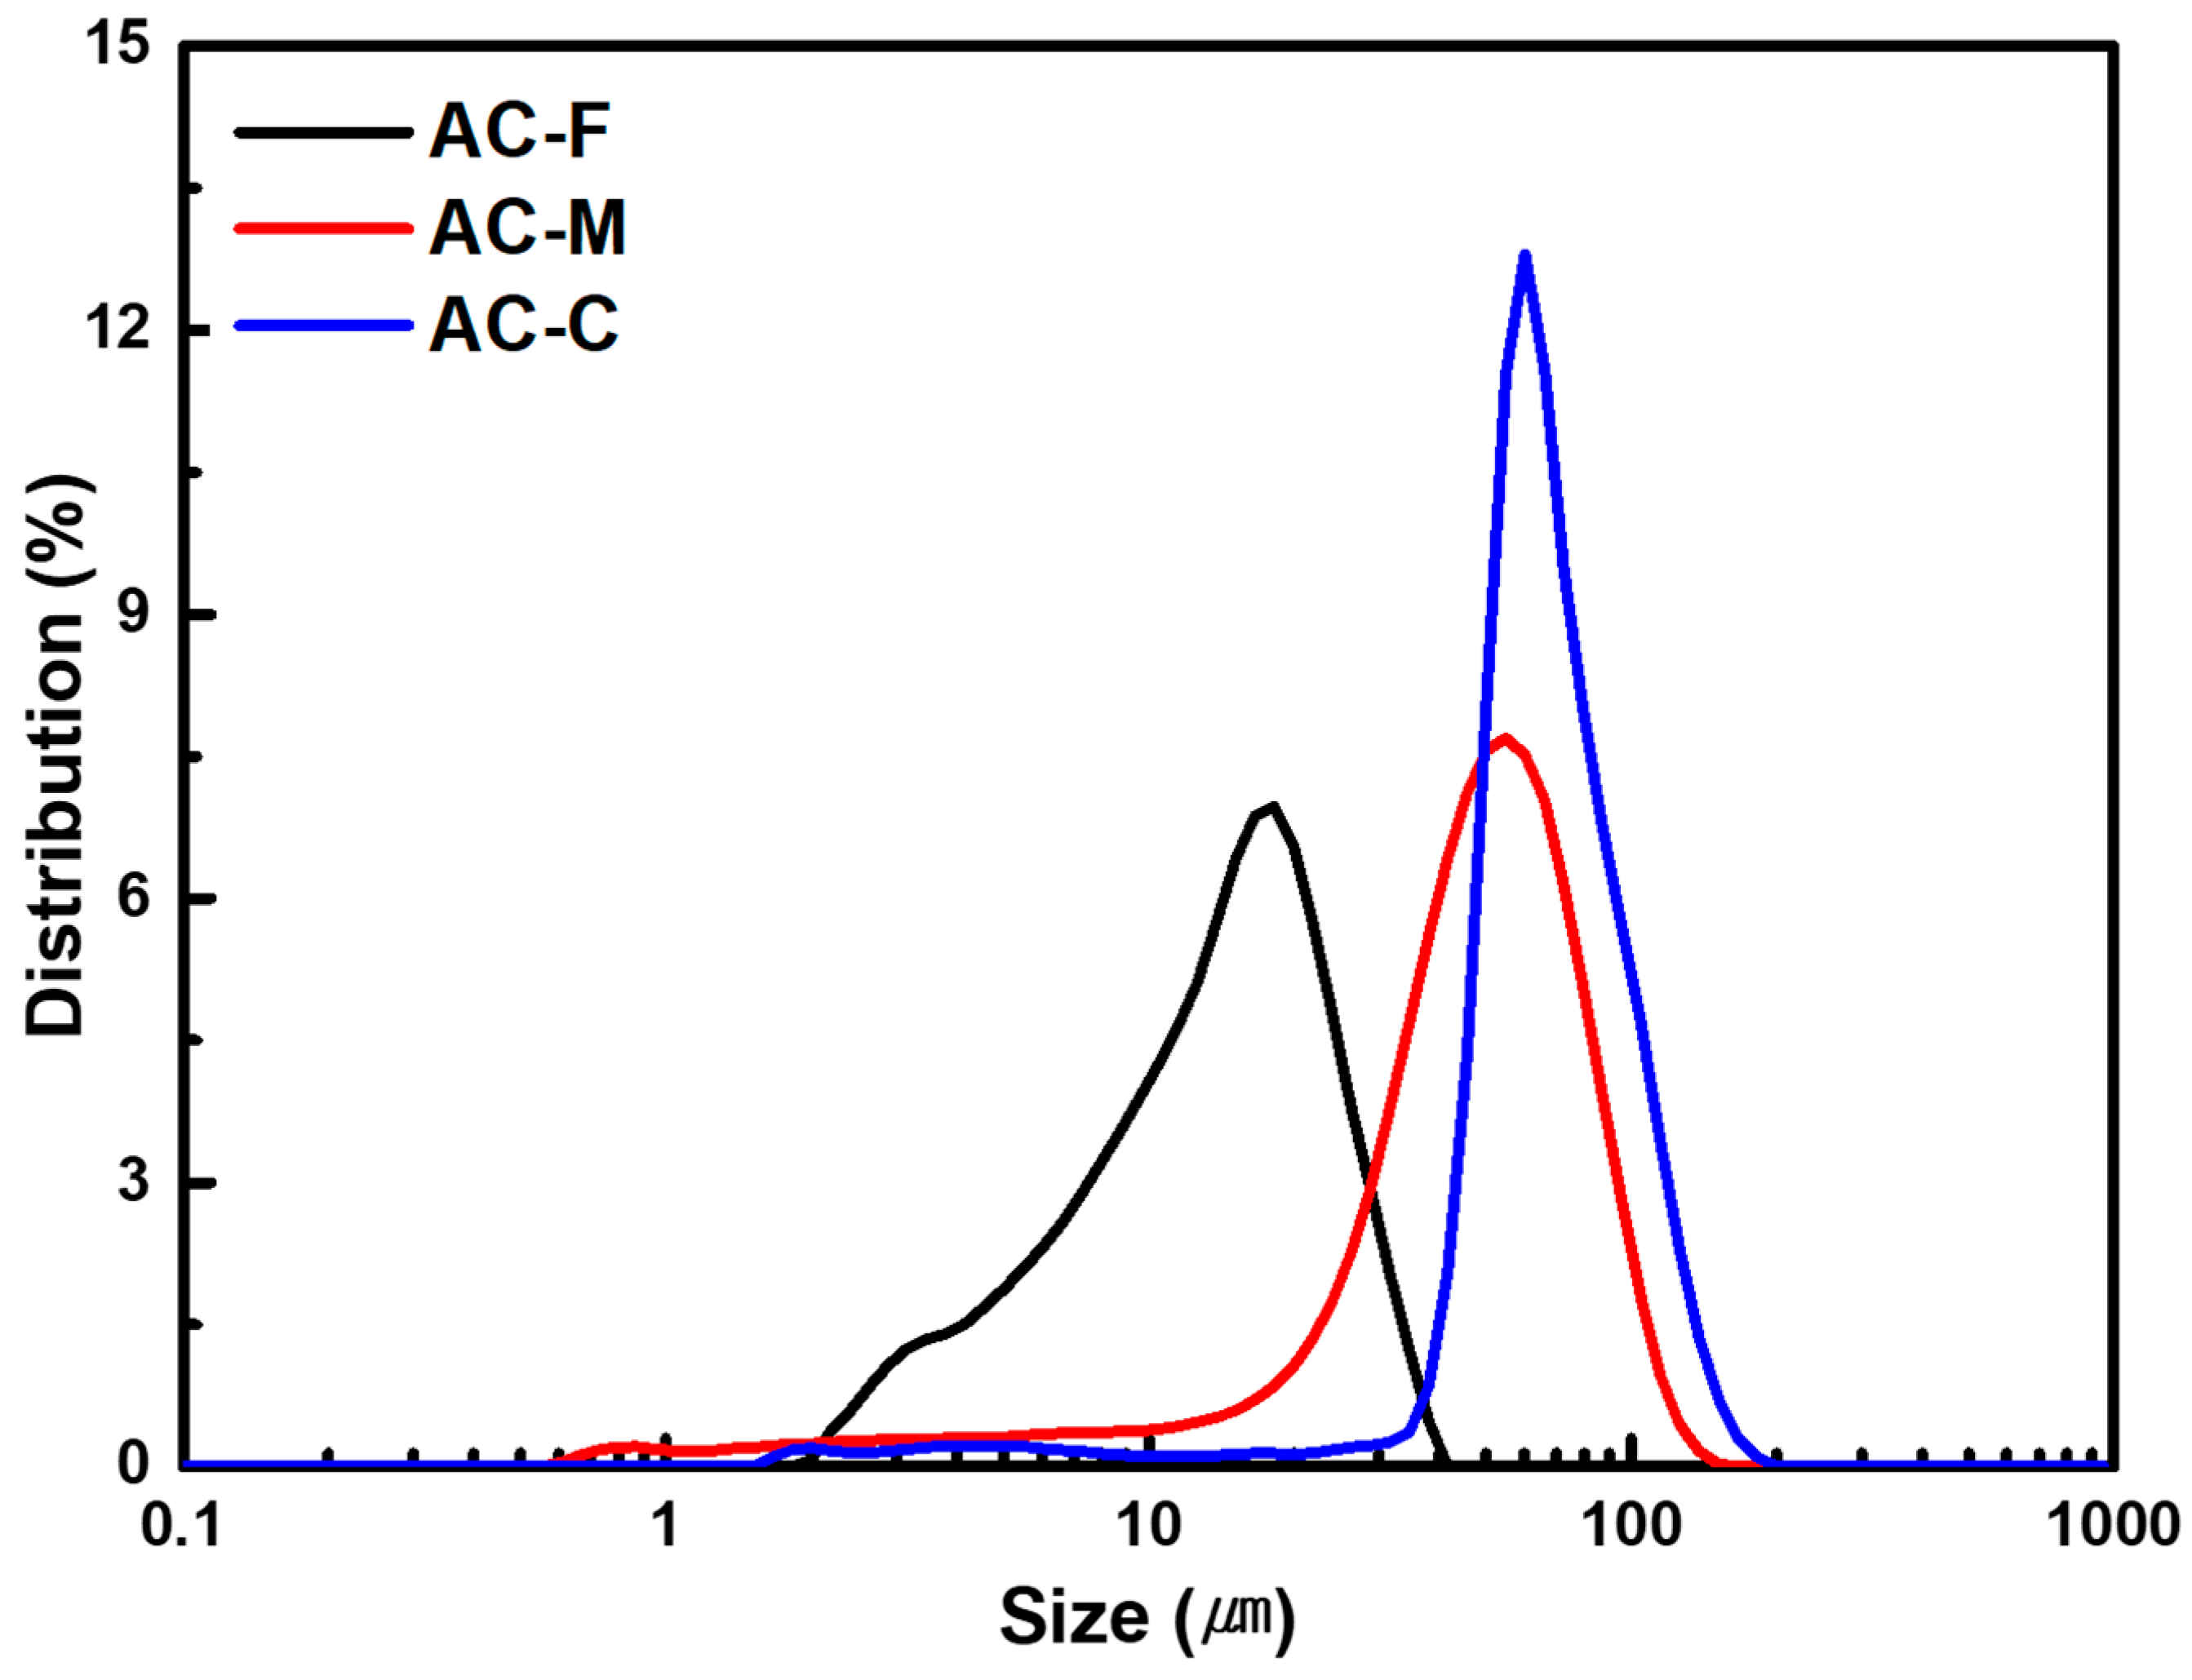
The particle size distributions of the activated carbon powders are shown in Figure 1, and the corresponding particle size parameters are summarized in Table 1. The median particle diameters (D50) of AC-F, AC-M and AC-C were 8.64, 50.57 and 79.52 μm, respectively. The distributions shifted toward larger particle sizes in the order of AC-F, AC-M and AC-C. However, the distributions of AC-M and AC-C showed substantial overlap. The D90 of AC-M was 87.21 μm and exceeded the D50 of AC-C at 79.52 μm. The particle-size contrast was smaller in the medium–coarse mixture than in the mixtures containing AC-F.
Figure 1.
Particle size distributions of activated carbon powders.
Table 1.
Particle size parameters of activated carbon powders.
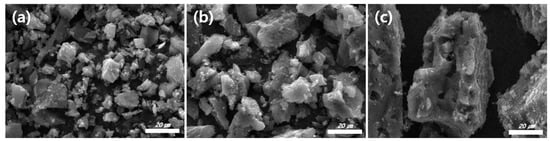
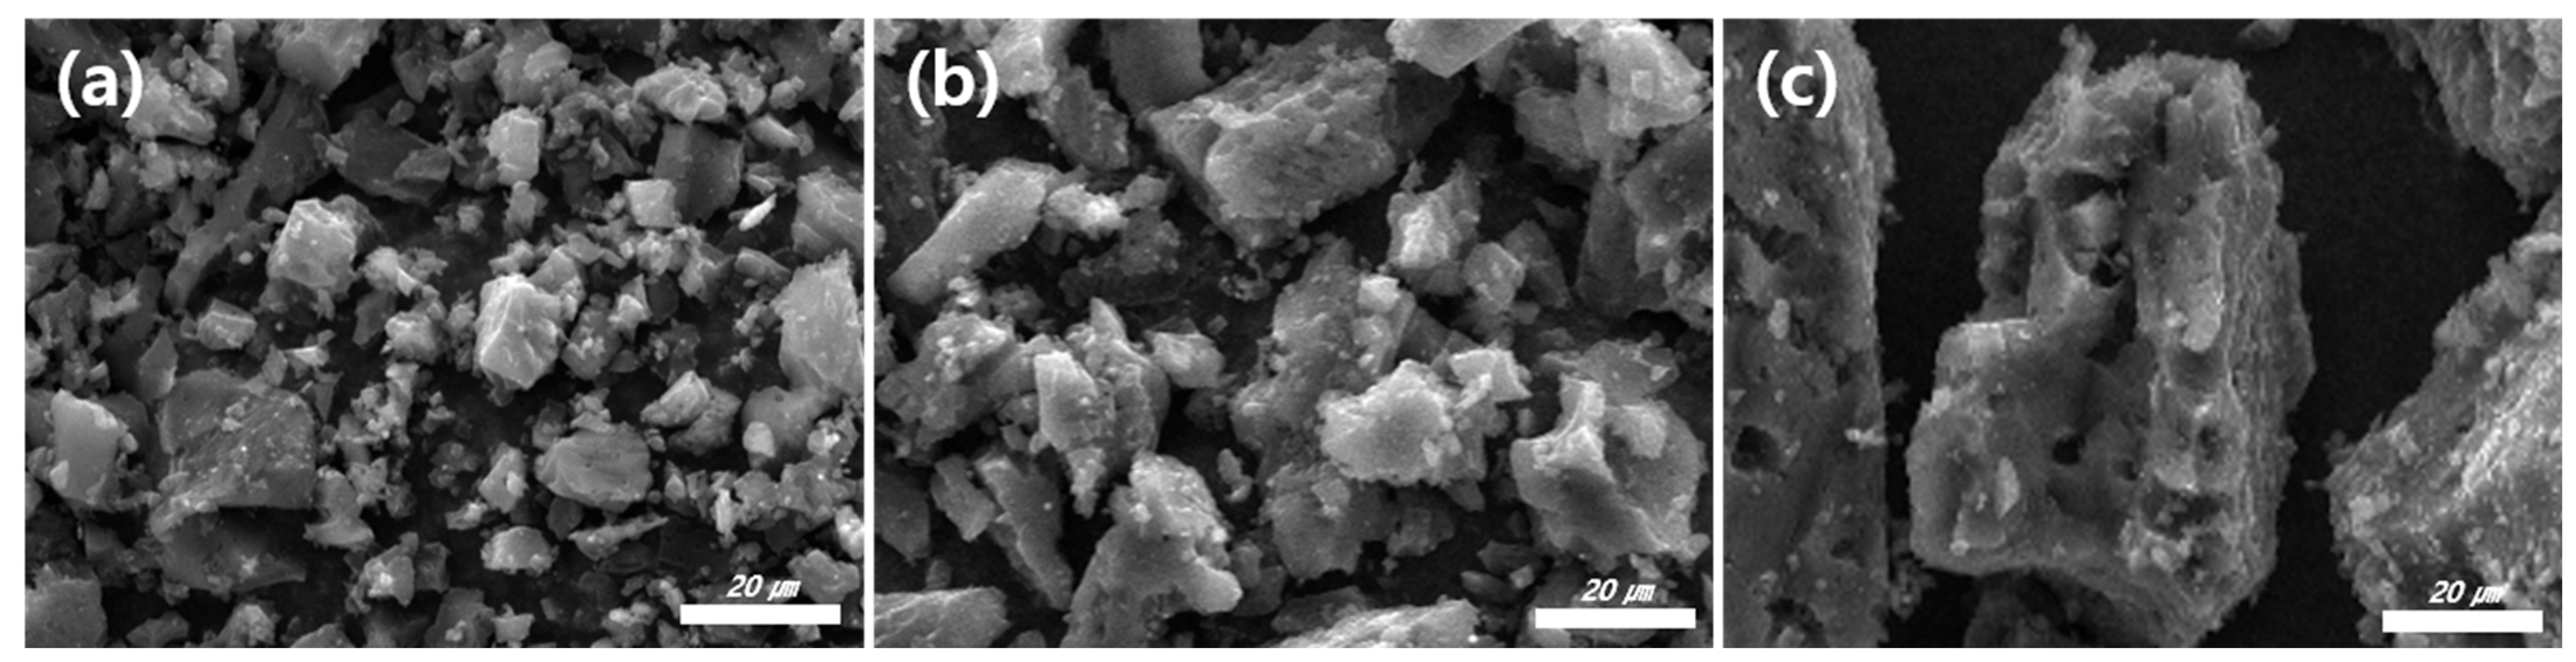
Figure 2 shows the SEM images of the activated carbon powders. All three fractions consisted of irregular particles with angular edges. Smaller fragments were observed together with larger particles, and fine particles were also present on the surfaces of some larger fragments. The differences in particle dimensions were consistent with the particle size analysis.
Figure 2.
SEM images of activated carbon powders: (a) AC-F, (b) AC-M and (c) AC-C.
The bulk and tapped densities of the powders are presented in Table 2. For the individual fractions, the bulk density increased from 0.160 g/mL for AC-F to 0.196 g/mL for AC-M and 0.245 g/mL for AC-C. The tapped densities followed the same order and were 0.213, 0.261 and 0.350 g/mL, respectively. The low density of AC-F may be related to interparticle cohesion and friction that restrict the rearrangement of fine particles. These interactions can affect the bulk behavior of powders together with their particle size and shape [29]. Tapping increased the density of all samples, indicating a reduction in the volume occupied by the powder bed.
Table 2.
Bulk and tapped densities of activated carbon powders according to particle-size combination.
The binary mixtures showed different changes in bulk and tapped densities depending on the particle-size combination. AC-FM-37 had a bulk density of 0.190 g/mL, which was between those of AC-F and AC-M. Its tapped density increased to 0.281 g/mL and exceeded those of both individual fractions. The measured tapped density of AC-FM-37 was 0.020 g/mL higher than that of AC-M, corresponding to a relative difference of approximately 7.7%. Smaller particles can occupy spaces between larger particles in a binary mixture, although the resulting packing depends on the particle size ratio and the proportion of each fraction [26]. The increase observed for AC-FM-37 is consistent with more effective rearrangement of the two fractions during tapping. AC-FC-37 and AC-MC-37 both had a bulk density of 0.245 g/mL, equal to that of AC-C. AC-FC-37 had a tapped density of 0.313 g/mL. The values for AC-MC-37 and AC-C were numerically close at 0.349 and 0.350 g/mL, respectively. At the mixing ratio examined in this study, an increase in tapped density above those of both constituent fractions was therefore observed only for AC-FM-37.
3.2. Morphology of Activated Carbon Monoliths
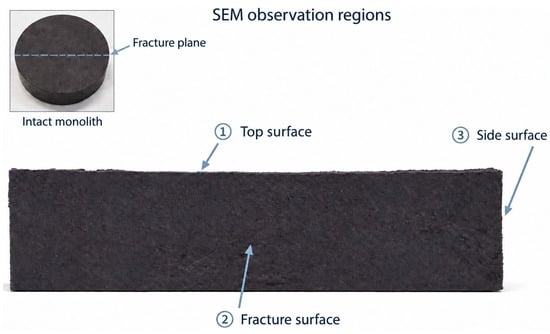
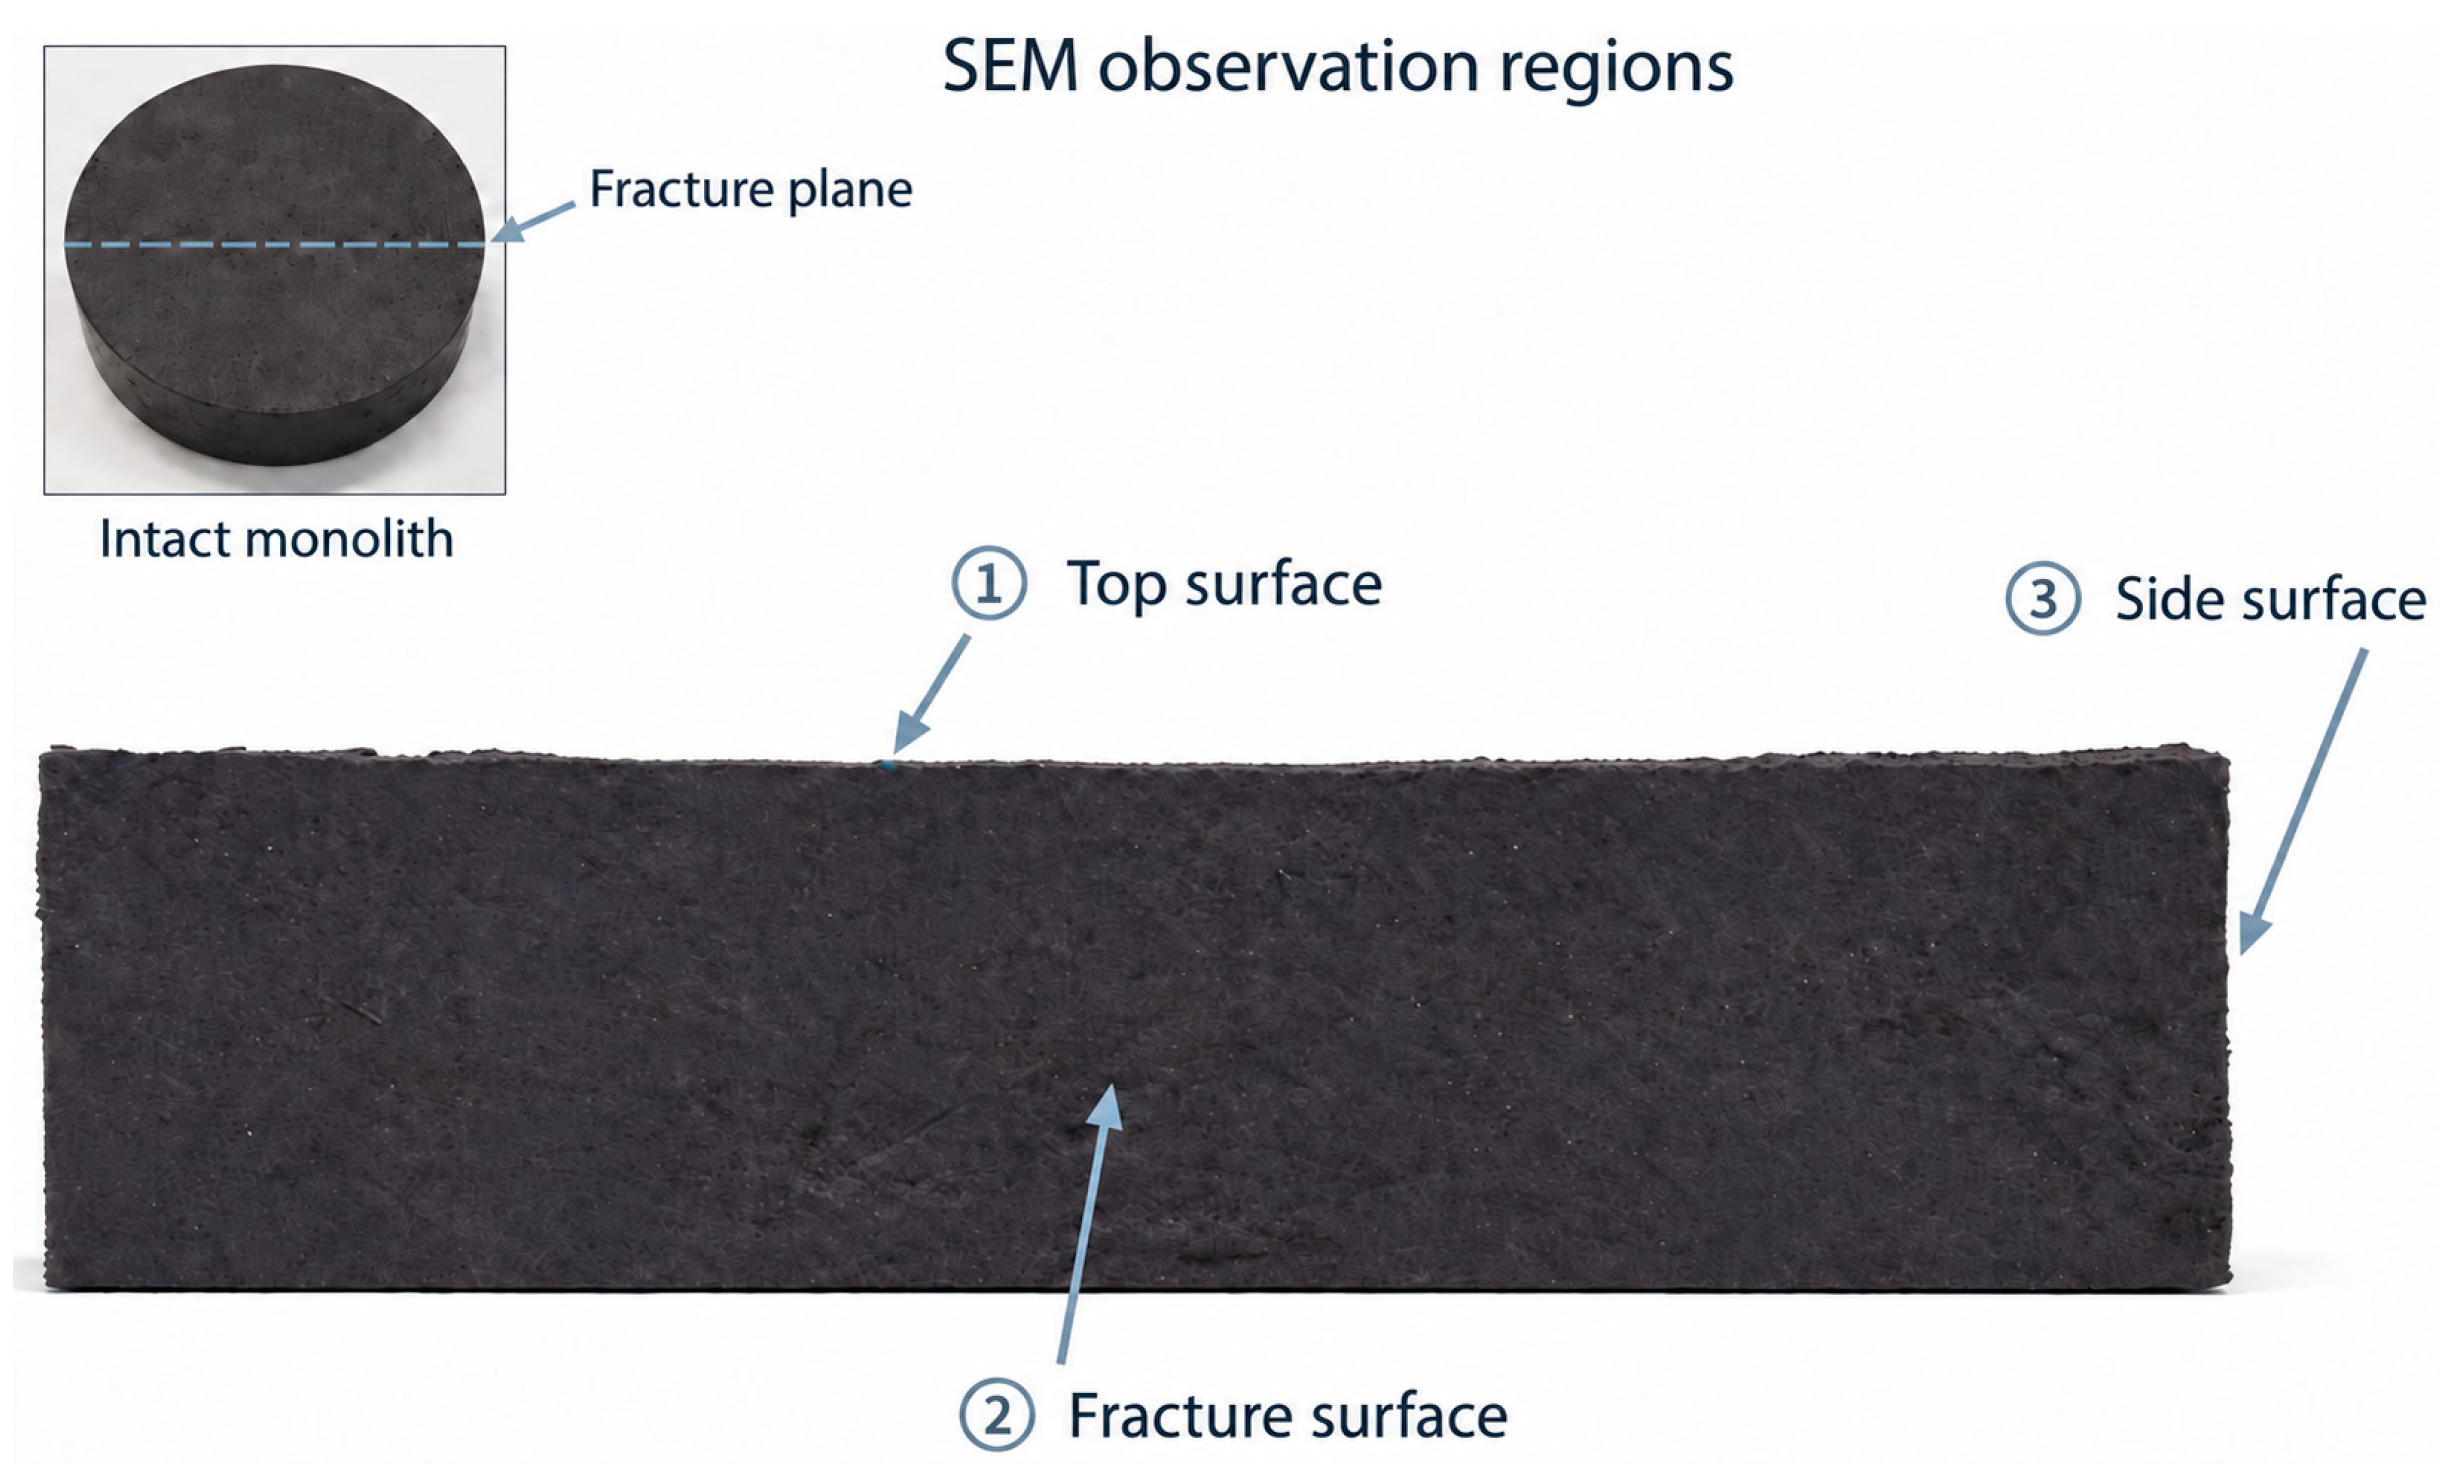
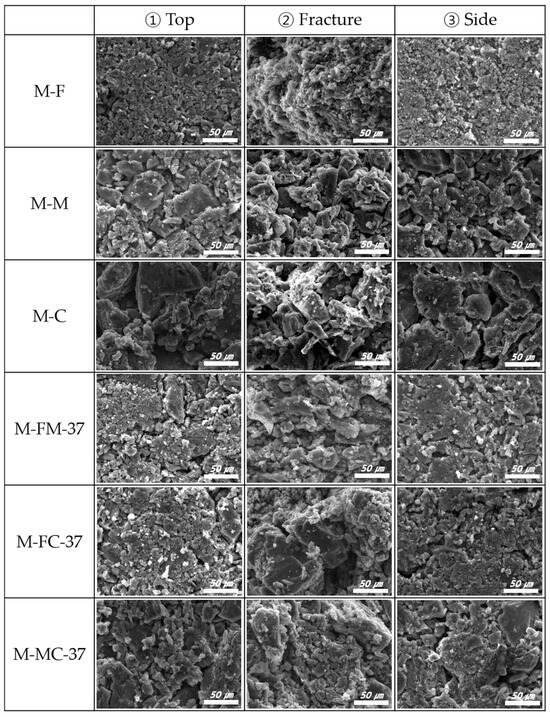
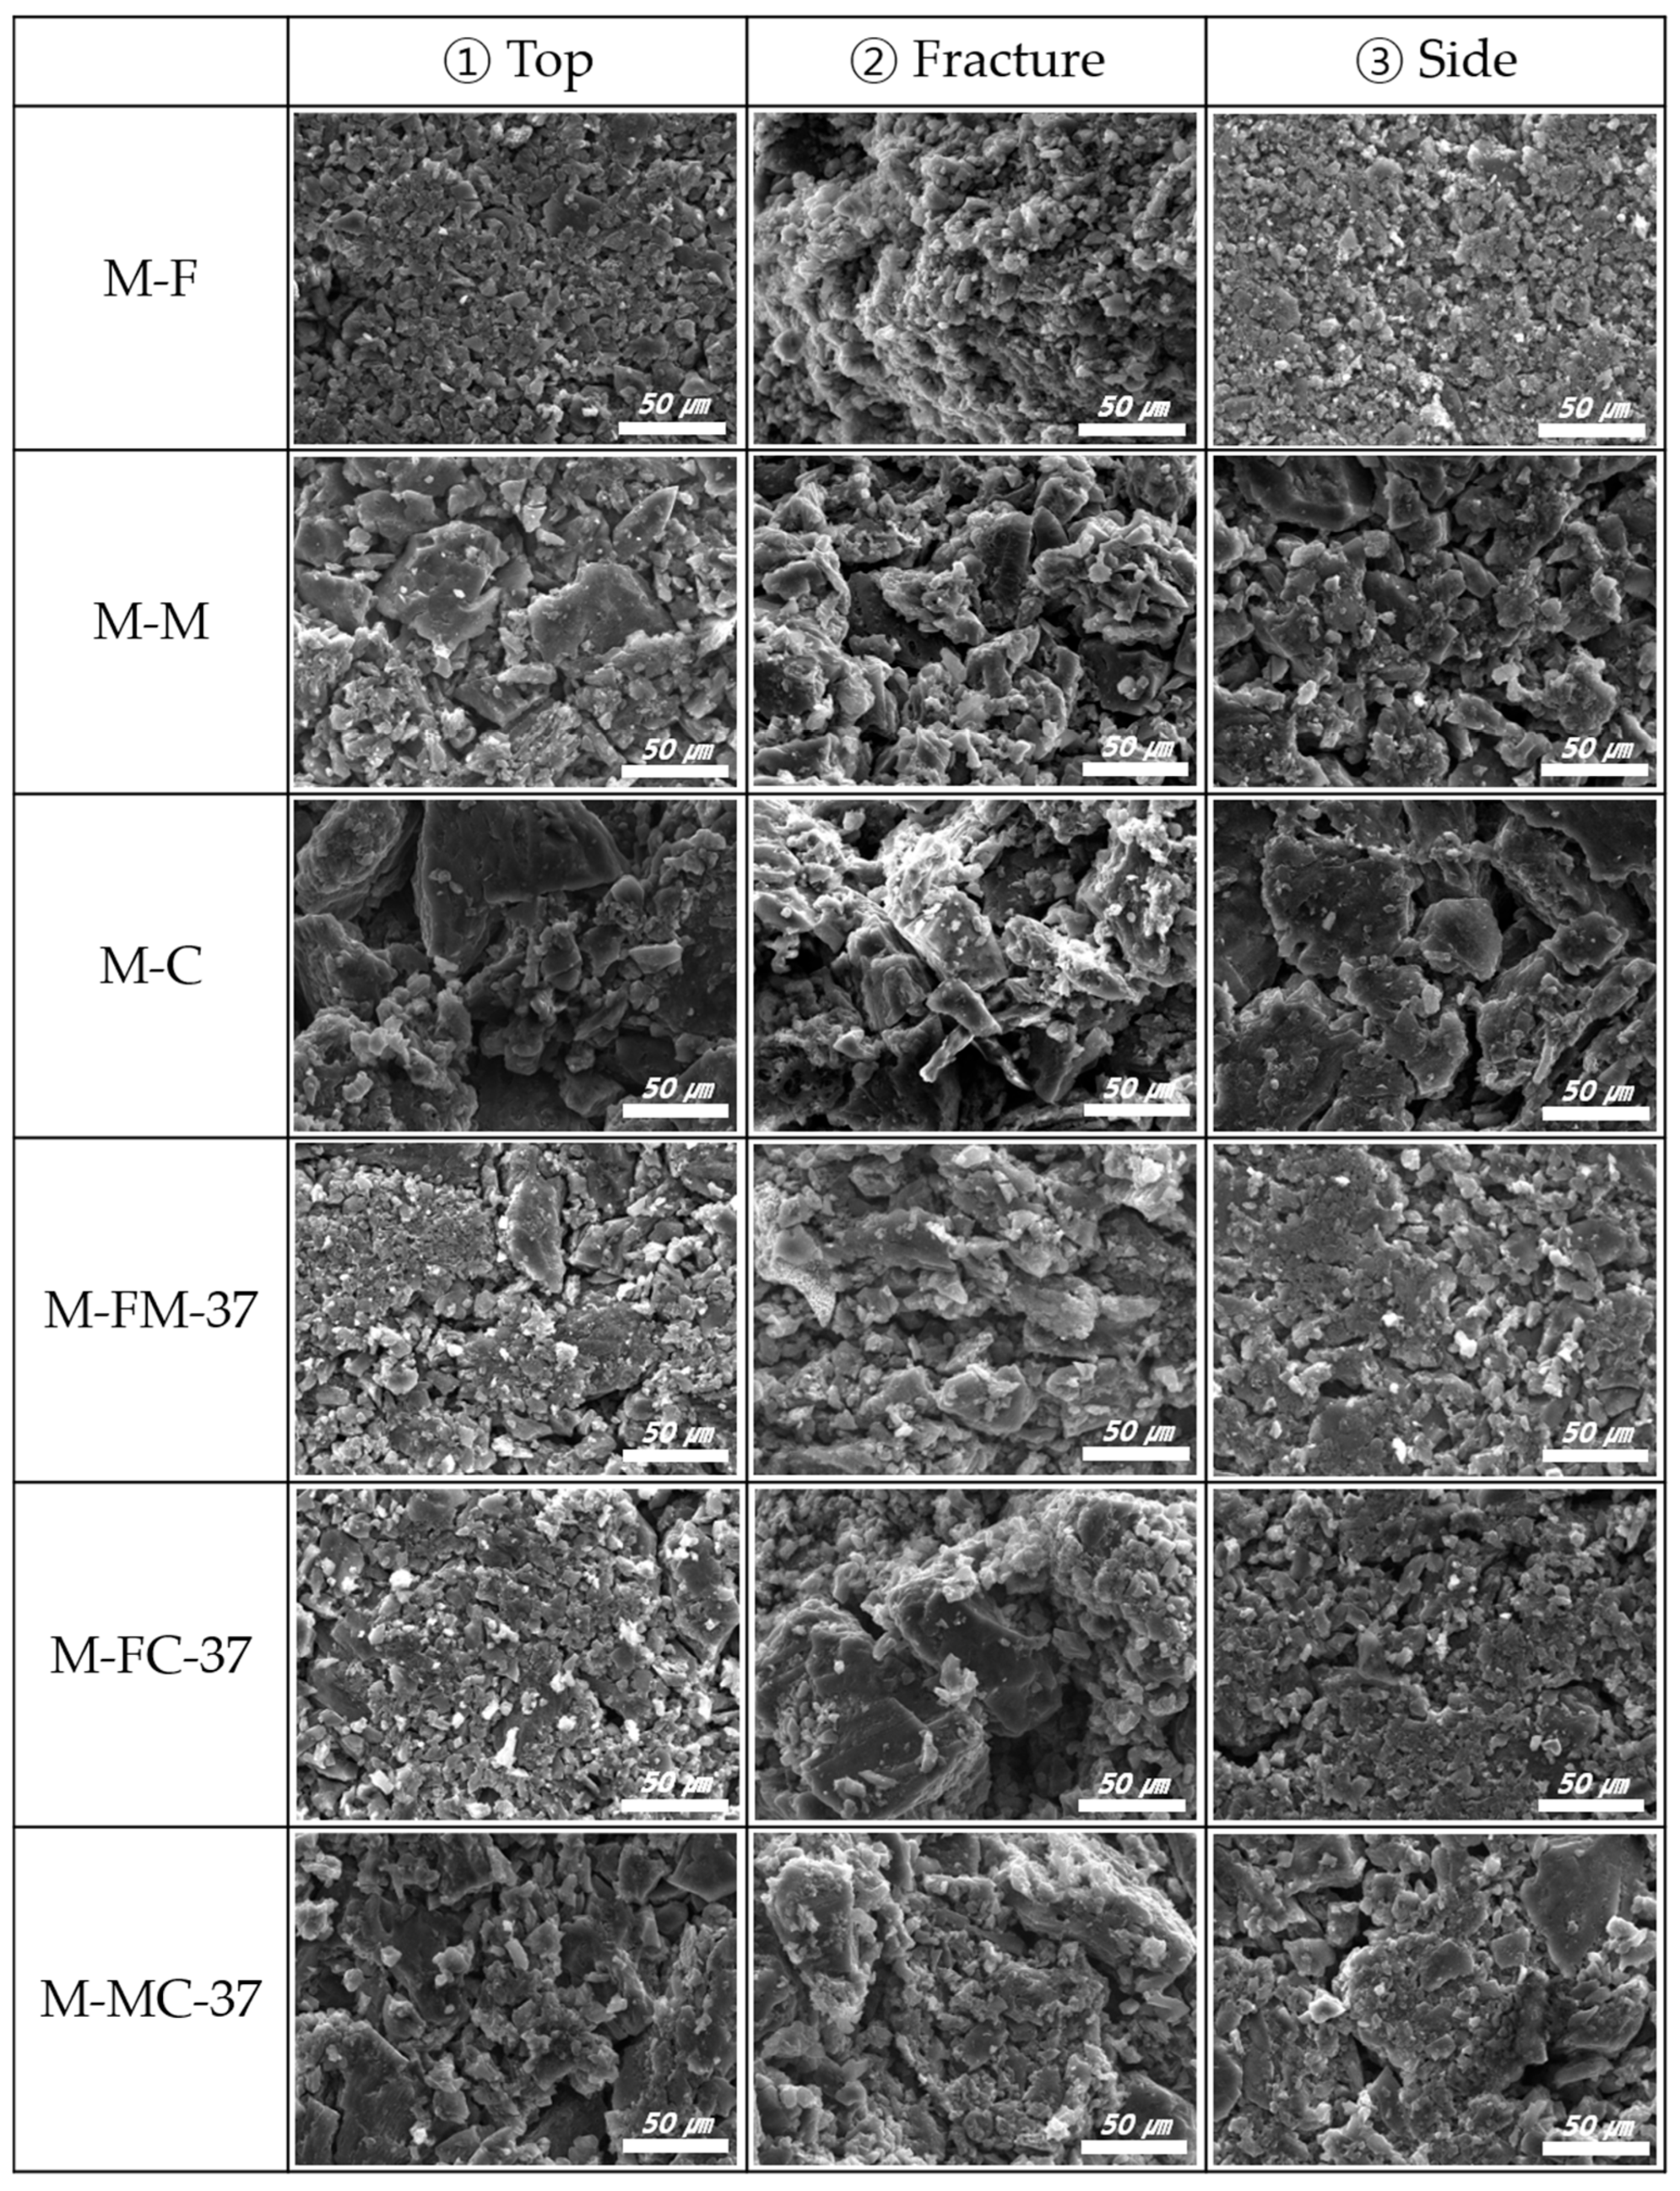
The morphology of the activated carbon monoliths was examined at the three regions indicated in Figure 3. Figure 4 shows the SEM images of the top, fracture and side surfaces. M-F consisted of small angular particles with fine fragments gathered between neighboring particles. Individual particle boundaries remained visible, and irregular spaces were observed between the aggregates. M-M showed larger fragments with relatively broad faces, while coarse plate-like particles were more apparent in M-C. Small fragments were also present on the surfaces of these larger particles. The particle-size differences observed in the activated carbon powders were therefore still apparent after monolith preparation.
Figure 3.
SEM observation regions of the activated carbon monolith: (1) top surface, (2) fracture surface and (3) side surface.
Figure 4.
SEM images of activated carbon monoliths. Rows from top to bottom show M-F, M-M, M-C, M-FM-37, M-FC-37 and M-MC-37. Columns from left to right show the top, fracture and side surfaces.
The surface morphology also differed according to the observation region. Relatively flat particle faces were exposed on the top and side surfaces, whereas the fracture surfaces showed protruding particles and irregular cavities. These differences were particularly apparent in M-M and M-C. Particle arrangement can change during uniaxial molding, as reported for carbon molded bodies [30]. Contact with the mold and punch may have contributed to the appearance of the external surfaces. However, the greater relief of the fracture surfaces does not by itself indicate a lower local density.
In M-FM-37, fine particles were observed around the medium-sized fragments and on their exposed faces. Some formed small clusters, while gaps remained between adjacent fragments. M-FC-37 showed a more distinct contrast between the coarse particles and the surrounding fine particles. On the top surface, numerous small particles were distributed over the broad faces and around the edges of larger fragments. The fracture surface also showed coarse particles with visible gaps between adjacent fragments. M-MC-37 contained medium and coarse fragments with less pronounced differences in their dimensions. Based on the median particle sizes in Table 1, the ratios of the larger to smaller particle sizes were 5.85, 9.20 and 1.57 for the FM, FC and MC combinations, respectively. The smaller size contrast in the MC combination is consistent with the appearance of the particles in M-MC-37.
The packing fraction of binary particle systems depends on both the particle-size ratio and the proportion of each fraction [31]. Particle shape also affects particle orientation and the surrounding void structure [32]. The SEM images provide a qualitative comparison of particle morphology and visible interparticle gaps in the observed regions. These observations do not establish differences in packing density throughout the monoliths.
3.3. Pore Characteristics of Activated Carbon Monoliths
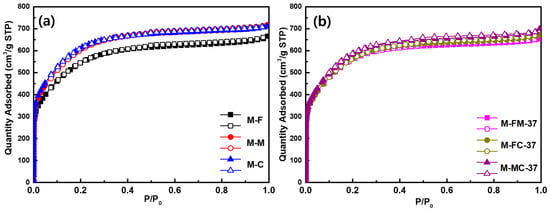
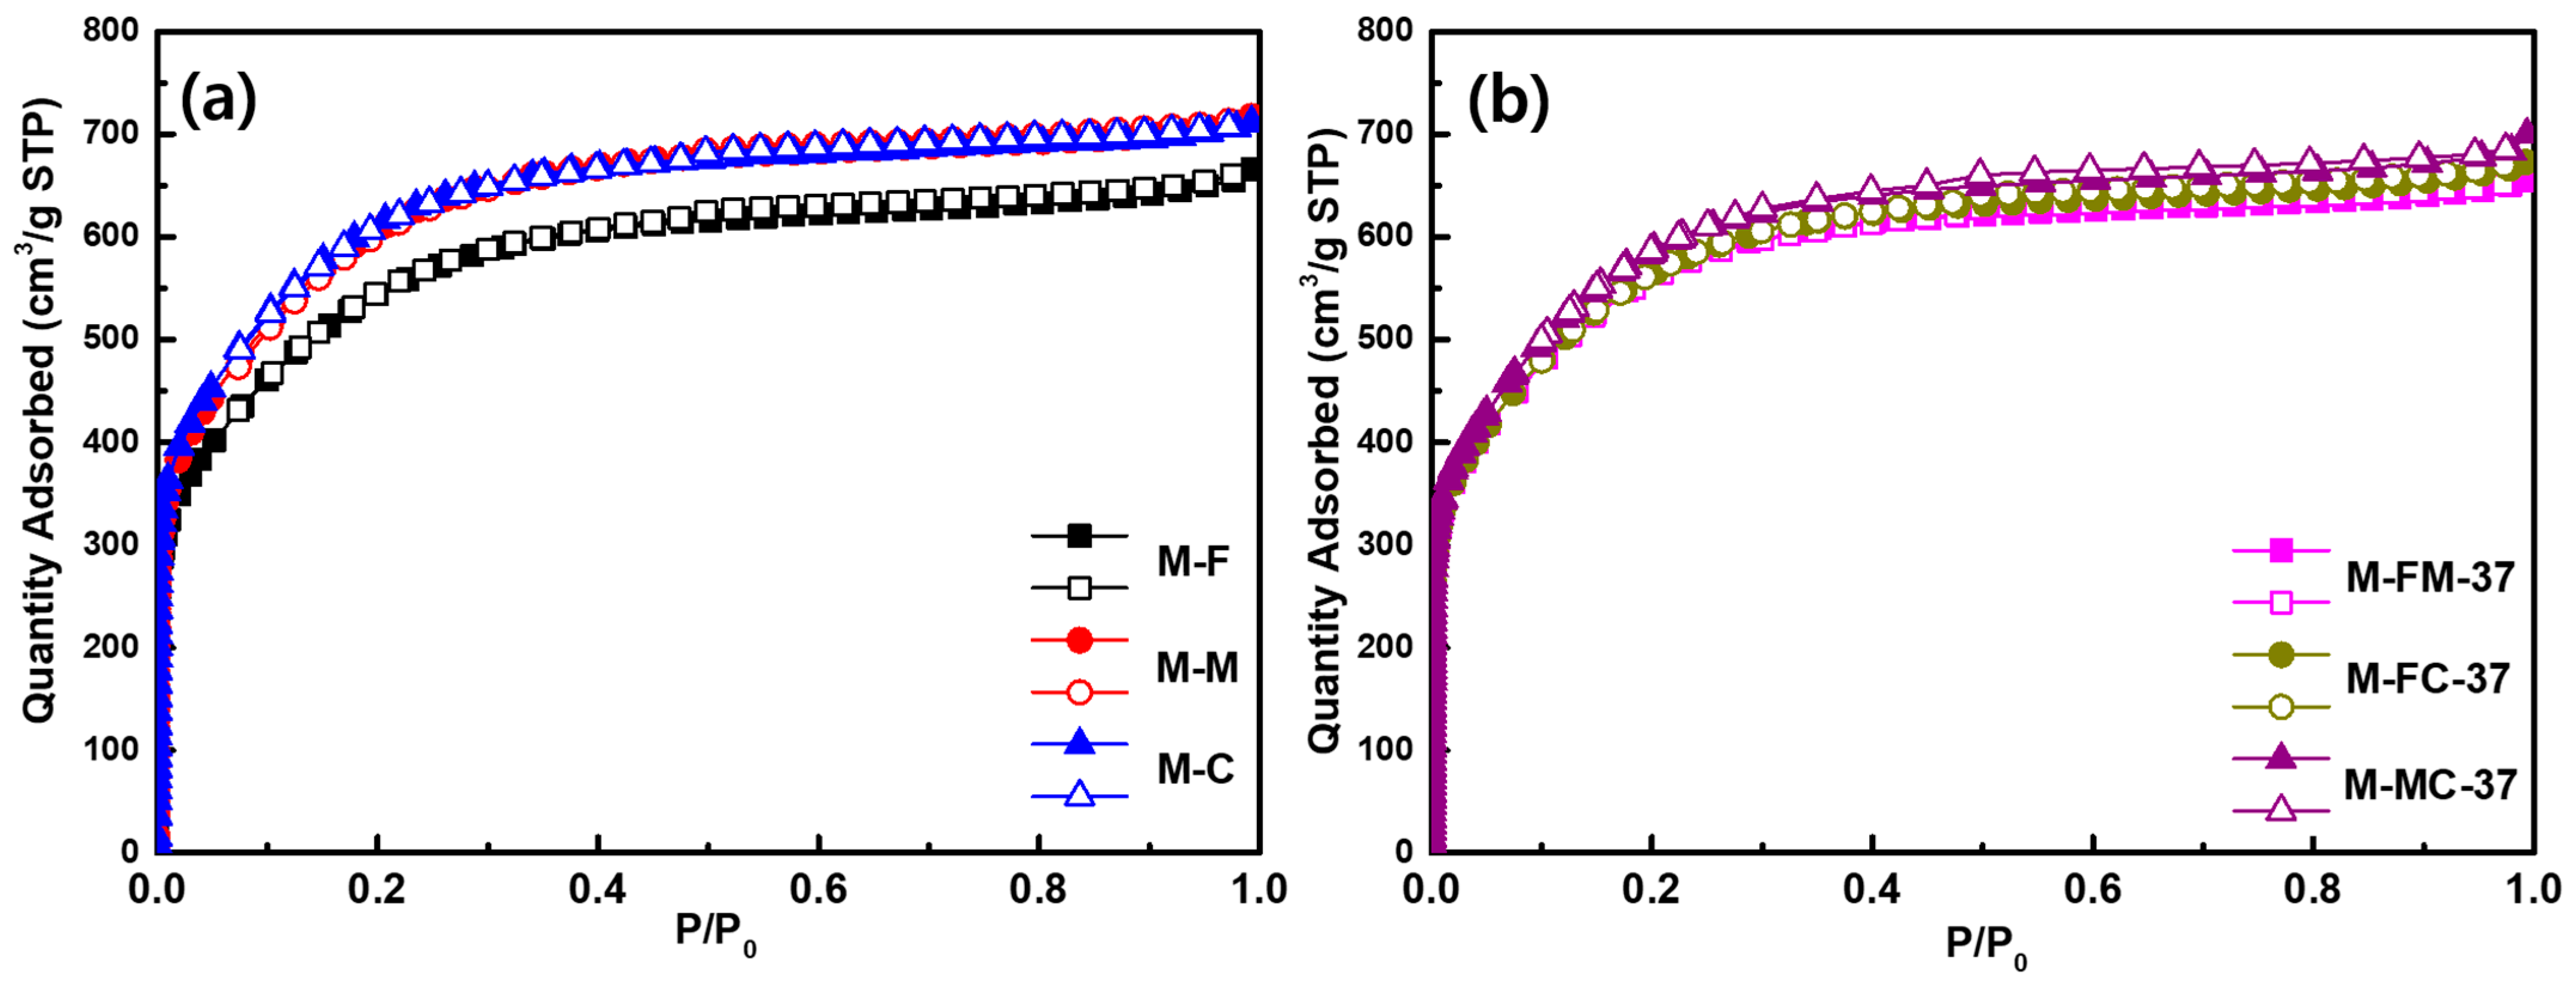
Figure 5 shows the nitrogen adsorption–desorption isotherms of the activated carbon monoliths prepared with different particle-size combinations. All samples showed a steep increase in nitrogen uptake at low relative pressures followed by a more gradual increase. The rapid uptake in the low-pressure region is characteristic of micropore filling [33]. A small separation between the adsorption and desorption branches was also observed at intermediate and high relative pressures. M-F showed lower nitrogen uptake than M-M and M-C over most of the measured pressure range. Among the binary mixtures, M-MC-37 showed higher uptake than M-FM-37 and M-FC-37.
Figure 5.
Nitrogen adsorption–desorption isotherms of activated carbon monoliths prepared from (a) single particle-size fractions and (b) binary particle-size mixtures.
The BET specific surface areas and pore volumes are summarized in Table 3. The specific surface areas of M-F, M-M and M-C were 2010.0, 2180.0 and 2210.0 m2/g, respectively. The total pore volume increased from 1.040 cm3/g for M-F to 1.150 cm3/g for M-C. The micropore volume showed the same trend and increased from 0.930 to 1.030 cm3/g. Compared with M-F, M-C had approximately 10.0% higher specific surface area and 10.8% higher micropore volume. Thus, the monolith prepared from the fine fraction did not show the largest accessible surface area despite its smaller particle size. The BET surface area of these porous carbons depends strongly on the internal pore structure and cannot be explained by the external particle size alone [33].
Table 3.
BET specific surface area and pore characteristics of activated carbon monoliths.
The specific surface area of M-FM-37 was 2086.4 m2/g. Higher values of 2128.5 and 2135.0 m2/g were obtained for M-FC-37 and M-MC-37, respectively. The total pore volume of M-FM-37 was 1.074 cm3/g, while those of M-FC-37 and M-MC-37 were nearly the same at 1.106 and 1.107 cm3/g. Their micropore volumes were also close at 0.990 and 0.993 cm3/g. M-FM-37 and M-FC-37 showed specific surface areas and pore volumes between those of the corresponding single-fraction monoliths. However, M-MC-37 showed lower values than both M-M and M-C. M-FC-37 and M-MC-37 had numerically similar specific surface areas and pore volumes. These small differences alone do not establish a difference in pore development between the two compositions.
The micropore volume fractions remained within a narrow range of approximately 89.4–90.2% for all samples. The differences between total and micropore volumes were 0.108–0.120 cm3/g. These results indicate that micropores accounted for most of the pore volume regardless of particle-size combination. The changes in absolute pore volume were therefore accompanied by relatively small changes in the micropore fraction.
Binder addition can reduce the specific surface area per unit mass by introducing material with a low surface area and limiting access to carbon pores [34]. Grinding and sieving may also separate carbon fragments with different internal pore characteristics. The effect of grinding on BET surface area depends on the carbon structure and grinding method [35]. A smaller particle size therefore does not necessarily give a higher BET surface area. The binder content and preparation conditions were the same for all monoliths in this study. However, differences in particle contacts and local binder coverage may affect nitrogen access to internal pores. The lower BET surface area of M-F may therefore reflect differences among the fractions obtained by grinding and differences in pore accessibility after molding. Filling the spaces between particles does not directly increase the micropore volume within the carbon particles.
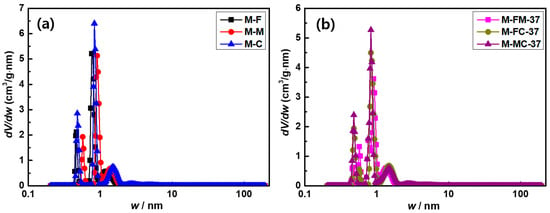
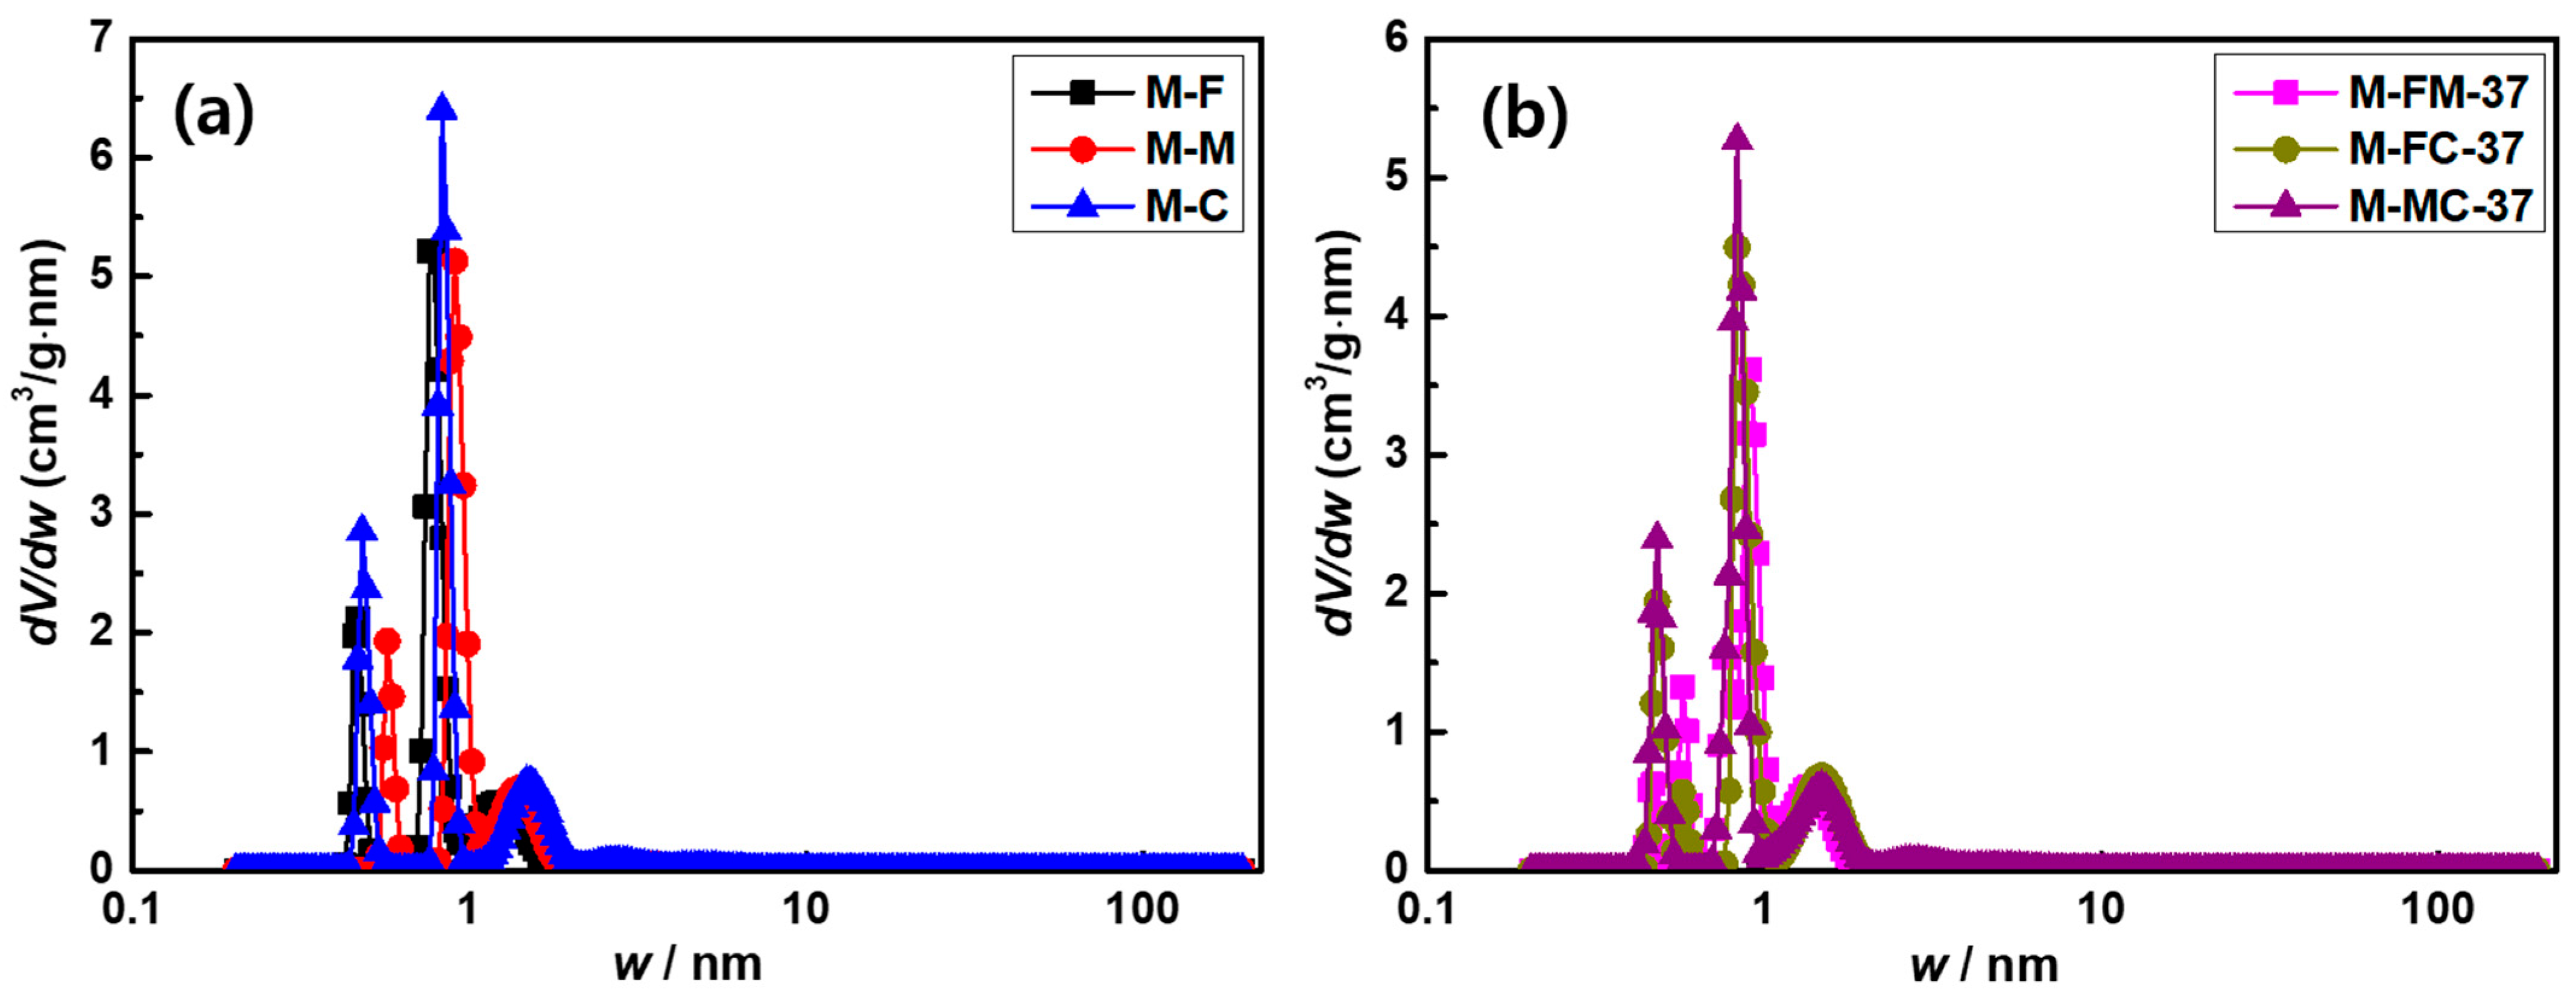
The pore size distributions are shown in Figure 6. All samples exhibited prominent peaks below 1 nm and a smaller broad contribution between 1 and 2 nm. M-C showed the highest main peak among the single-fraction monoliths. In the binary mixtures, the main peak below 1 nm was highest for M-MC-37, followed by M-FC-37 and M-FM-37. The main pore-size regions were similar in the single and binary systems. The difference in peak height between M-MC-37 and M-FC-37 should be distinguished from their nearly identical total pore volumes. Peak height represents the differential pore volume at a particular pore width, whereas pore volume depends on the distribution integrated over the relevant size range. Narrow features in calculated distributions can also depend on the pore model and the treatment of surface heterogeneity [36]. The PSD results therefore indicate differences in the distribution within the micropore region rather than a proportional change in total pore volume.
Figure 6.
Pore size distributions of activated carbon monoliths prepared from (a) single particle-size fractions and (b) binary particle-size mixtures.
3.4. Density and Compressive Strength of Activated Carbon Monoliths
The monolith densities and maximum compressive strengths are summarized in Table 4. The densities of M-F, M-M and M-C were 0.457, 0.436 and 0.455 g/cm3, respectively. M-F and M-C had nearly the same density despite the difference in particle size. Among the binary mixtures, M-FC-37 showed the highest density of 0.480 g/cm3. This value was approximately 5.0% higher than that of M-F and 5.5% higher than that of M-C. The densities of M-FM-37 and M-MC-37 were 0.442 and 0.451 g/cm3, respectively. Both values were between those of the corresponding single-fraction monoliths. Thus, an increase in density above both single-fraction values was observed only for the fine–coarse combination.
Table 4.
Monolith density and maximum compressive strength of activated carbon monoliths.
The higher density of M-FC-37 may be associated with the occupation of spaces between coarse particles by fine particles. This packing effect depends on the size ratio and proportion of the component particles [31]. This remains a proposed explanation because the extent of interparticle void filling was not quantified. However, the monolith density did not follow the same order as the tapped density of the powders. AC-FC-37 had a tapped density of 0.313 g/mL, which was lower than the 0.349 g/mL of AC-MC-37. The density order was reversed after monolith preparation. The packing measured by tapping therefore did not directly determine the final monolith density. Particle rearrangement during mixing and molding may contribute to this difference. Changes in particle contacts and pore geometry during compression molding have also been reported for coke–pitch carbon blocks [37].
M-F had a compressive strength of 4.84 MPa, while M-M and M-C showed higher values of 7.62 and 7.50 MPa, respectively. The densities of M-F and M-C differed by only 0.002 g/cm3. The compressive strength of M-C was approximately 55.0% higher than that of M-F. M-M also showed a high compressive strength despite having the lowest monolith density. These results indicate that the amount of material per unit volume alone did not determine resistance to compression.
The binary mixtures showed different mechanical responses depending on the particle-size combination. M-FM-37 had the lowest compressive strength of 3.73 MPa. This value was approximately 22.9% lower than that of M-F and 51.0% lower than that of M-M. Mixing the fine and medium fractions therefore reduced the measured strength below that of either single-fraction monolith. M-FC-37 showed a higher strength of 7.09 MPa, although this remained below that of M-C. M-MC-37 had the highest measured strength of 7.83 MPa. The differences from M-M and M-C were relatively small at 0.21 and 0.33 MPa, respectively. The medium–coarse mixture consequently maintained a strength close to those of the two single-fraction monoliths.
The SEM images in Figure 4 showed differences in particle arrangement between the fine-containing monoliths and those prepared from medium and coarse particles. The presence of fine particles between larger particles can contribute to packing, but these particles must also form bonded contacts that resist the applied load. The low strength of M-FM-37 suggests that its particle arrangement was less effective in providing mechanical support under compression. Differences in local binder distribution may also contribute even when the overall binder content is fixed. The influence of binder dispersion on density and strength has been reported for graphite blocks [38]. In the present samples, the comparison between M-FC-37 and M-MC-37 supports the need to consider particle bonding together with density. M-FC-37 contained more material per unit volume but failed at a lower compressive stress.
M-FC-37 and M-MC-37 had nearly identical total pore volumes of 1.106 and 1.107 cm3/g, respectively. M-FC-37 had a higher monolith density but a lower compressive strength than M-MC-37. The pore volume measured by nitrogen adsorption describes accessible porosity within the analyzed size range. It does not fully describe the arrangement of particles or the distribution of larger spaces between them. The density and strength results therefore suggest that particle-size blending affected the structure of the monolith beyond the differences captured by the nitrogen adsorption measurements.
3.5. Effects of Particle Size and Blending on Methane Adsorption
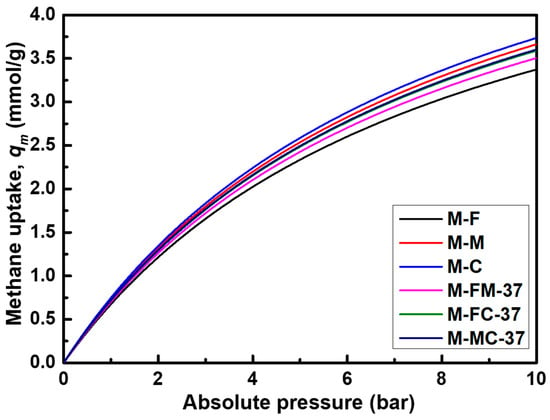
Figure 7 shows the methane adsorption isotherms of the activated carbon monoliths. Methane uptake increased with increasing pressure for all samples. The slope gradually decreased, although a clear plateau was not observed within the measured pressure range. At an absolute pressure of 10 bar, the methane uptake per unit mass of M-F, M-M and M-C was 3.373, 3.663 and 3.735 mmol/g, respectively (Table 5). M-C showed the highest uptake among the single-fraction monoliths, with a value approximately 10.7% higher than that of M-F.
Figure 7.
Methane adsorption isotherms of activated carbon monoliths with different particle-size combinations.
Table 5.
Monolith density and methane uptake per unit mass and volume of activated carbon monoliths.
The higher methane uptake of M-C was consistent with its larger micropore volume of 1.030 cm3/g compared with 0.930 cm3/g for M-F (Table 3). The contribution of micropore development to methane adsorption has also been reported for coal-based activated carbons [39]. The micropore volume fraction remained within a relatively narrow range of approximately 89.4–90.2%. The difference in uptake was therefore more closely associated with the micropore volume per unit mass than with the micropore volume fraction.
The binary mixtures did not show a higher methane uptake per unit mass than M-C. The values of M-FM-37, M-FC-37 and M-MC-37 were 3.504, 3.590 and 3.602 mmol/g, respectively. M-FM-37 and M-FC-37 showed values between those of the corresponding single-fraction monoliths. M-MC-37 had the highest uptake among the mixtures, but its value was lower than those of both M-M and M-C. This result agreed with its lower specific surface area and micropore volume. The small difference between M-FC-37 and M-MC-37 was also consistent with their similar micropore volumes of 0.990 and 0.993 cm3/g. Across the six samples, the order of methane uptake per unit mass was the same as that of the specific surface area and micropore volume.
The sample order changed when methane uptake was expressed per unit volume. This value was calculated by multiplying the uptake per unit mass by the monolith density. The use of monolith density in evaluating volumetric methane storage has been discussed by Romanos et al. [28]. A higher density increases the mass of adsorbent contained within a given monolith volume, but the resulting uptake also depends on the adsorption properties retained after shaping.
M-FC-37 showed the highest calculated methane uptake per unit volume of 1.723 mmol/cm3, followed by M-C at 1.699 mmol/cm3. Although the uptake per unit mass of M-FC-37 was approximately 3.9% lower than that of M-C, its density was approximately 5.5% higher. The higher density compensated for the lower uptake per unit mass, resulting in a modest increase of approximately 1.4% on a volume basis. This numerical difference alone does not demonstrate a reproducible improvement in volumetric methane uptake. M-FC-37 and M-MC-37 had nearly the same methane uptake per unit mass. The density of M-FC-37 was higher at 0.480 g/cm3 compared with 0.451 g/cm3 for M-MC-37. Its calculated methane uptake per unit volume was therefore approximately 6.0% higher than the value of 1.625 mmol/cm3 for M-MC-37.
An increase in density did not improve the uptake per unit volume for every particle-size combination. M-FM-37 had a slightly higher density than M-M, but its lower uptake per unit mass resulted in a lower uptake per unit volume of 1.549 mmol/cm3 compared with 1.597 mmol/cm3 for M-M. The adsorption results also differed from the compressive strength results. M-MC-37 showed the highest compressive strength of 7.83 MPa, while M-FC-37 had a strength of 7.09 MPa and the highest calculated uptake per unit volume. The measured results suggest a trade-off between compressive strength and calculated volumetric methane uptake among the tested formulations. The choice of particle-size combination should therefore consider the strength required for handling and use together with methane uptake per unit monolith volume. Under the present preparation and measurement conditions, the benefit of fine–coarse blending was associated with the higher monolith density, while M-C retained the highest methane uptake per unit mass.
The calculated volumetric methane uptake of M-FC-37 was 1.723 mmol/cm3 at 25 °C and approximately 10 bar. Arami-Niya et al. [17] reported a methane uptake of 5.049 mmol/g at approximately 25 °C and 35 bar for a monolith prepared from tar pitch and coal. Multiplying this uptake by the reported apparent density of 0.42 g/cm3 gives a volumetric uptake of approximately 2.12 mmol/cm3. Reljic et al. [24] reported an excess volumetric methane capacity of 104 V/V at approximately 25 °C and 40 bar for a pitch-based carbon monolith containing 10 wt% CMC. Their results also showed that increased monolith density could compensate for reduced uptake per unit mass after binder addition. Romanos et al. [28] used apparent intragranular density to calculate volumetric storage capacity, excluding the spaces between particles. The present values were calculated using the external monolith volume. Although these differences limit direct comparison, the present results show that higher monolith density can compensate for lower methane uptake per unit mass. The different sample orders for calculated volumetric uptake and compressive strength also indicate that both properties should be considered when selecting particle-size combinations.
The small increase in calculated volumetric methane uptake does not by itself justify the additional processing required for binary blending. Both single-fraction and binary monoliths required grinding and classification. Binary preparation also required separate handling and dosing of two fractions followed by blending. M-C therefore remains a simpler preparation option among the tested formulations. At larger production scales, classification throughput and the recovery yield of each fraction would affect material use and processing cost. Particle segregation during handling and uniform binder distribution would need to be controlled. Possible density gradients in larger monoliths formed by uniaxial pressing would also require assessment. The present comparison identifies differences among particle-size combinations under laboratory conditions. Its practical application would require verification of monolith properties across larger production batches.
4. Conclusions
In this study, activated carbon monoliths were prepared from single particle-size fractions and binary mixtures under the same preparation conditions. The monoliths showed predominantly microporous structures, while their density and compressive strength varied with the particle-size combination. Although AC-FM-37 had a higher tapped density than AC-F and AC-M, the corresponding monolith M-FM-37 showed the lowest compressive strength of 3.73 MPa. The highest compressive strength of 7.83 MPa was obtained for M-MC-37. These results indicate that a higher powder packing density does not necessarily lead to a higher monolith strength. At an absolute pressure of 10 bar, M-C showed the highest methane uptake per unit mass of 3.735 mmol/g. M-FC-37 had a lower uptake of 3.590 mmol/g but the highest monolith density of 0.480 g/cm3. M-FC-37 gave the highest calculated methane uptake per unit monolith volume of 1.72 mmol/cm3, close to 1.70 mmol/cm3 for M-C. The higher density of M-FC-37 compensated for its lower uptake per unit mass. However, this small numerical difference alone does not establish a reproducible advantage over M-C. The selection of particle-size combinations should consider monolith density and compressive strength together with methane uptake per unit mass. Any practical benefit of binary blending should also be weighed against the additional fraction handling and blending required. Further work is needed to optimize particle-size combinations and blending ratios for practical methane storage.
Author Contributions
Conceptualization, B.C.B.; methodology, M.S.H.; validation, M.S.H. and B.C.B.; formal analysis, M.S.H. and B.C.B.; investigation, M.S.H.; resources, B.C.B.; data curation, M.S.H.; writing—original draft preparation, M.S.H.; writing—review and editing, B.C.B.; visualization, M.S.H. and B.C.B.; supervision, B.C.B.; project administration, B.C.B.; funding acquisition, B.C.B. All authors have read and agreed to the published version of the manuscript.
Funding
This work was supported by the Material Parts Technology Development Project (RS-2024-00434503), funded by the Ministry of Trade, Industry and Energy (MOTIE, Republic of Korea).
Data Availability Statement
The original contributions presented in this study are included in the article. Further inquiries can be directed to the corresponding author.
Acknowledgments
Following are results of a study on the “Gyeonggi Regional Growth Talent Development System (ANCHOR) project” supported by the Ministry of Education and Gyeonggi Province.
Conflicts of Interest
Author Min Seong Han is employed by Wintec Glovis Co., Ltd. The authors declare no other conflicts of interest.
References
- Annamalai, K.; Thanapal, S.S.; Ranjan, D. Ranking renewable and fossil fuels on global warming potential using respiratory quotient concept. J. Combust. 2018, 2018, 1270708. [Google Scholar] [CrossRef] [Scilit]
- Zakirova, G.; Krapivsky, E.; Berezovskaya, A.; Borisov, A. Storage of compressed natural gases. Energies 2023, 16, 7208. [Google Scholar] [CrossRef] [Scilit]
- Huang, B.; Li, J.; Fu, C.; Guo, T.; Feng, S. A comprehensive review of stratification and rollover behavior of liquefied natural gas in storage tanks. Processes 2022, 10, 1360. [Google Scholar] [CrossRef] [Scilit]
- Nie, Z.; Lin, Y.; Jin, X. Research on the theory and application of adsorbed natural gas used in new energy vehicles: A review. Front. Mech. Eng. 2016, 11, 258–274. [Google Scholar] [CrossRef] [Scilit]
- Strizhenov, E.M.; Chugaev, S.S.; Men’shchikov, I.E.; Shkolin, A.V.; Zherdev, A.A. Heat and mass transfer in an adsorbed natural gas storage system filled with monolithic carbon adsorbent during circulating gas charging. Nanomaterials 2021, 11, 3274. [Google Scholar] [CrossRef] [Scilit]
- Strizhenov, E.M.; Shkolin, A.V.; Chugaev, S.S.; Men’shchikov, I.E.; Solovtsova, O.V.; Shiryaev, A.A.; Nickolsky, M.S. Adsorbed natural gas storage facility based on activated carbon of wood waste origin. Adsorption 2023, 29, 291–307. [Google Scholar] [CrossRef] [Scilit]
- Alali, I.; Shehu, A.U.; Mokaya, R. Porous carbon composites as clean energy materials with extraordinary methane storage capacity. Energy Environ. Sci. 2024, 17, 5024–5038. [Google Scholar] [CrossRef] [Scilit]
- Nguyen, H.G.T.; Sims, C.M.; Toman, B.; Horn, J.; van Zee, R.D.; Thommes, M.; Ahmad, R.; Denayer, J.F.M.; Baron, G.V.; Napolitano, E.; et al. A reference high-pressure CH4 adsorption isotherm for zeolite Y: Results of an interlaboratory study. Adsorption 2020, 26, 1253–1266. [Google Scholar] [CrossRef] [Scilit]
- Xie, W.; Fu, Q.; Yang, L.-Z.; Yan, L.; Zhang, J.; Zhao, X. Methane storage and purification of natural gas in metal-organic frameworks. ChemSusChem 2025, 18, e202401382. [Google Scholar] [CrossRef] [Scilit]
- Carney, J.B.; Mahurin, S.M.; Zhang, Y.; Wang, Y.; Poirier, G.; Zhao, Y.; Chen, G.; Austin, D.; Michaelis, E.; Yue, Y. Highly porous biocarbon monoliths for methane storage. Microporous Mesoporous Mater. 2024, 370, 112921. [Google Scholar] [CrossRef] [Scilit]
- Heidarinejad, Z.; Dehghani, M.H.; Heidari, M.; Javedan, G.; Ali, I.; Sillanpää, M. Methods for preparation and activation of activated carbon: A review. Environ. Chem. Lett. 2020, 18, 393–415. [Google Scholar] [CrossRef] [Scilit]
- Park, J.C.; Kim, D.M.; Lee, J.D. Preparation of high specific surface area activated carbon using residual oil and waste PET. Carbon Lett. 2024, 34, 1941–1947. [Google Scholar] [CrossRef] [Scilit]
- Choi, J.; Yi, H.; Kato, T.; Saito, K.; Watanabe, H.; Ideta, K.; Shimohara, T.; Miyawaki, J.; Yoon, S.-H.; Kim, Y.A.; et al. Enhanced porosity in marine biomass-derived activated carbon via two-step CO2 activation and acidic decontamination. Carbon Lett. 2025, 35, 825–837. [Google Scholar] [CrossRef] [Scilit]
- Lee, B.-H.; Kim, Y.-J.; Lee, H.-M.; Kim, B.-J. Preparation and characterization of pitch-derived activated carbon pellet for butane adsorption. Carbon Lett. 2024, 34, 691–701. [Google Scholar] [CrossRef] [Scilit]
- Hu, W.; Duan, S.; Chen, Y.; Zhang, Y.; Xie, Y.; Li, G. Adsorption characteristics of methane on microporous carbon prepared from bitumite: Equilibrium, thermodynamics and site energy distribution studies. J. Ind. Eng. Chem. 2025, 148, 701–723. [Google Scholar] [CrossRef] [Scilit]
- Zaini, M.S.M.; Arshad, M.; Syed-Hassan, S.S.A. Adsorption isotherm and kinetic study of methane on palm kernel shell-derived activated carbon. J. Bioresour. Bioprod. 2023, 8, 66–77. [Google Scholar] [CrossRef] [Scilit]
- Arami-Niya, A.; Rufford, T.E.; Zhu, Z. Activated carbon monoliths with hierarchical pore structure from tar pitch and coal powder for the adsorption of CO2, CH4 and N2. Carbon 2016, 103, 115–124. [Google Scholar] [CrossRef] [Scilit]
- Wu, J.; Zhu, X.; Yang, F.; Wang, R.; Ge, T. Shaping techniques of adsorbents and their applications in gas separation: A review. J. Mater. Chem. A 2022, 10, 22853–22895. [Google Scholar] [CrossRef] [Scilit]
- Abubakar, A.J.A.; Canevesi, R.L.S.; Sanchez, D.A.L.; Grande, C.A. Monoliths for gas storage manufactured with precision pore engineering using 3D-printed templates. Chem. Eng. J. 2024, 489, 151450. [Google Scholar] [CrossRef] [Scilit]
- Saeidi, N.; Lotfollahi, M.N. A procedure to form powder activated carbon into activated carbon monolith. Int. J. Adv. Manuf. Technol. 2015, 81, 1281–1288. [Google Scholar] [CrossRef] [Scilit]
- Liu, H.; Miao, Y.; Tian, H.; Chen, Y.; Wang, E.; Huang, J.; Zhang, W. Preparation of moso bamboo columnar activated carbon with high adsorption property via polyacrylamide@asphalt adhesives and steam activation. Carbon Lett. 2024, 34, 1723–1736. [Google Scholar] [CrossRef] [Scilit]
- Rangel-Sequeda, J.F.; Loredo-Cancino, M.; Águeda Maté, V.I.; De Haro-Del Rio, D.A.; Dávila-Guzmán, N.E. 3D printing of powdered activated carbon monoliths: Effect of structuring on physicochemical and mechanical properties and its influence on the adsorption performance. Mater. Today Commun. 2022, 33, 104758. [Google Scholar] [CrossRef] [Scilit]
- Li, D.; Zhou, J.; Zhang, Z.; Tian, Y.; Qiao, Y.; Li, J.; Wen, L.; Wei, L. Shaping powdered active carbons into monoliths without decreasing mesoporosity by using silica sol as binder. Mater. Lett. 2017, 190, 127–130. [Google Scholar] [CrossRef] [Scilit]
- Reljic, S.; Cuadrado-Collados, C.; Farrando-Perez, J.; Jardim, E.O.; Martinez-Escandell, M.; Silvestre-Albero, J. Carbon-based monoliths with improved thermal and mechanical properties for methane storage. Fuel 2022, 324, 124753. [Google Scholar] [CrossRef] [Scilit]
- Saeidi, N.; Lotfollahi, M.N. Effects of powder activated carbon particle size on activated carbon monolith’s properties. Mater. Manuf. Process. 2016, 31, 1634–1638. [Google Scholar] [CrossRef] [Scilit]
- Liu, Q.; Guo, L.; Miao, J.; Jia, D. A novel nonlinear model for estimating ideal packing density of mixtures. Sci. Rep. 2025, 15, 5950. [Google Scholar] [CrossRef] [Scilit]
- Jho, J.H.; Lee, H.K.; Han, M.S.; Bai, B.C. Optimization of particle size blending and binder content in coconut shell-based activated carbon monoliths for methane adsorption. Processes 2026, 14, 1029. [Google Scholar] [CrossRef] [Scilit]
- Romanos, J.; Abou Dargham, S.; Prosniewski, M.; Roukos, R.; Barakat, F.; Pfeifer, P. Structure–function relations for gravimetric and volumetric methane storage capacities in activated carbon. ACS Omega 2018, 3, 15119–15124. [Google Scholar] [CrossRef] [Scilit]
- Manokaran, M.; Morgeneyer, M.; Weis, D. Effect of microscopic properties on flow behavior of industrial cohesive powder. Powders 2024, 3, 324–337. [Google Scholar] [CrossRef] [Scilit]
- Cho, J.H.; Im, J.S.; Bai, B.C. Effect of particle orientation and porosity on thermal conductivity of petroleum pitch polymer-based carbon molded body. Appl. Sci. 2020, 10, 7281. [Google Scholar] [CrossRef] [Scilit]
- Brouwers, H.J.H. Random packing fraction of binary similar particles: Onsager’s excluded volume model revisited. Phys. Usp. 2024, 67, 510–529. [Google Scholar] [CrossRef] [Scilit]
- Jaeggi, A.; Eckel, A.-M.; Pini, R.; Rajagopalan, A.K.; Mazzotti, M. Exploring disordered packing of non-equant particles: Insights from computed tomography and Monte Carlo simulations. Powder Technol. 2025, 452, 120468. [Google Scholar] [CrossRef] [Scilit]
- Thommes, M.; Kaneko, K.; Neimark, A.V.; Olivier, J.P.; Rodriguez-Reinoso, F.; Rouquerol, J.; Sing, K.S.W. Physisorption of gases, with special reference to the evaluation of surface area and pore size distribution (IUPAC Technical Report). Pure Appl. Chem. 2015, 87, 1051–1069. [Google Scholar] [CrossRef] [Scilit]
- Sutens, B.; De Vos, Y.; Verougstraete, B.; Denayer, J.F.M.; Rombouts, M. Potassium silicate as low-temperature binder in 3D-printed porous structures for CO2 separation. ACS Omega 2023, 8, 4116–4126. [Google Scholar] [CrossRef] [Scilit]
- Abulikemu, G.; Wahman, D.G.; Sorial, G.A.; Nadagouda, M.; Stebel, E.K.; Womack, E.A.; Smith, S.J.; Kleiner, E.J.; Gray, B.N.; Taylor, R.D.; et al. Role of grinding method on granular activated carbon characteristics. Carbon Trends 2023, 11, 100261. [Google Scholar] [CrossRef] [Scilit]
- Kwiatkowski, M. An analysis of the textural properties of activated carbons obtained from biomass via the LBET, NLDFT and QSDFT methods. Sci. Rep. 2024, 14, 26472. [Google Scholar] [CrossRef] [Scilit]
- Gwon, S.-U.; Lee, S.-H.; Youn, U.-S.; Roh, J.-S. Effect of pressure and holding time during compression molding on mechanical properties and microstructure of coke-pitch carbon blocks. Appl. Sci. 2024, 14, 772. [Google Scholar] [CrossRef] [Scilit]
- Kim, J.H. Control of the properties of a binder pitch to enhance the density and strength of graphite blocks. Carbon Lett. 2023, 33, 1757–1766. [Google Scholar] [CrossRef] [Scilit]
- Huan, X.; Guo, X.; Chen, X.; Guo, X. Influence of tectonically deformed coal-based activated carbon and its surface modification on methane adsorption. ACS Omega 2024, 9, 33510–33521. [Google Scholar] [CrossRef] [Scilit]

Disclaimer/Publisher’s Note: The statements, opinions and data contained in all publications are solely those of the individual author(s) and contributor(s) and not of MDPI and/or the editor(s). MDPI and/or the editor(s) disclaim responsibility for any injury to people or property resulting from any ideas, methods, instructions or products referred to in the content. |
© 2026 by the authors. Licensee MDPI, Basel, Switzerland. This article is an open access article distributed under the terms and conditions of the Creative Commons Attribution (CC BY) license.