


Featured Application
The proposed LoRaWAN environmental monitoring system can be deployed in wireless sensor networks (WSNs) for precision agriculture applications, particularly for frost risk monitoring in potato crops. Its low-cost architecture and long-range communication capabilities make it suitable for rural and mountainous areas with limited connectivity infrastructure.
Abstract
The monitoring of agroclimatic variables is one of the fundamental pillars for anticipating and mitigating frost phenomena in potato crops, especially in the rural mountain area located in the municipality of La Calera (Colombia). Low-power, long-range communication technologies such as LoRa and LoRaWAN allow the creation of low-cost solutions for the acquisition and remote transmission of environmental data in agricultural production. This work presents the design and validation of a wireless sensor node and a LoRaWAN network oriented towards climate monitoring in a real agricultural production environment. This study aimed to design and validate a low-cost environmental monitoring system based on LoRa and LoRaWAN technology for measuring temperature and relative humidity as the most relevant variables for the early detection of frost in potato crops in the municipality of La Calera. A sensor node was developed using the Heltec LoRa 32 V3 microcontroller and the AM2305B sensor. The node was configured to transmit data through LoRaWAN technology in the US-915 MHz band, using an SX1302 Gateway integrated into The Things Network, where the devices and data reception were managed. A total of 70 measurements were carried out over three days in a controlled environment, covering a temperature range from 20 °C to 50 °C and from 70% to 20% RH, and the measurements were compared with a PeakTech-5035 reference instrument through statistical analysis. The statistical analysis confirmed that the developed node presents an accuracy of ±0.7 °C in temperature and ±5% RH in relative humidity, with a Pearson correlation coefficient of r = 0.99 for temperature and r = 0.96 for relative humidity compared with the reference sensors. Additionally, the root mean square error (RMSE) was 0.82 °C for temperature and 4.6% RH for relative humidity, supporting the quality of the generated data. Furthermore, urban and rural propagation tests were conducted to evaluate the communication performance of the LoRaWAN infrastructure through RSSI and SNR measurements under real deployment conditions. The communication analysis demonstrated stable connectivity in both dense urban and rural agricultural environments, maintaining operational wireless communication at distances approaching 1 km under low power conditions. The results demonstrate that the prototype offers performance comparable to commercial sensors at an approximately 50% lower cost, establishing it as a viable alternative for building wireless sensor networks (WSN) based on LPWAN technology. In this way, the proposed solution facilitates access to climate monitoring technologies in rural areas and strengthens farmers’ ability to anticipate frost events in potato crops.
1. Introduction
Agriculture in high-altitude regions such as La Calera, located in the Bogotá Sabana region of Colombia, is constantly affected by frost events, a meteorological phenomenon that has historically threatened agricultural productivity and negatively impacted potato crops, one of the most important staple products in the country. Frost episodes are particularly critical in mountainous rural environments, where temperatures may approach or fall below 0 °C during the early morning hours, generating severe physiological damage to crops and significant economic losses for local farmers [1,2,3].
La Calera, located in the Bogotá Sabana region, presents climatic characteristics that favor the occurrence of frost “helada”, particularly during the early morning hours. According to IDEAM, frost events are defined as situations in which the temperature drops to or below 0 °C at a height of 2 m above ground level [1,3]. Relative humidity conditions below 50% increase water and thermal stress in potato plants, leaving them more vulnerable to damage during cold nights [4].
Different types of frost can occur depending on atmospheric humidity conditions. White frost is produced under relatively high humidity levels, where water vapor condenses and freezes over plant surfaces, generating a visible layer of ice crystals known as hoarfrost. In contrast, black frost occurs under low humidity conditions, where plant tissues freeze directly without visible ice formation, producing more severe physiological damage due to cellular dehydration and tissue necrosis [3]. Black frost is considered particularly harmful for potato crops because it can rapidly damage leaves, stems, and plant sap circulation systems.
Potato crops require relatively stable environmental conditions to achieve proper physiological development. Optimal growth is generally obtained within temperature ranges between 15 °C and 20 °C, combined with adequate soil moisture retention and moderate relative humidity levels [4]. Frost events not only affect the foliage of potato plants but can also damage internal vascular tissues, generating partial or total crop loss during critical agricultural seasons [2]. In some cases, agricultural losses associated with frost events may exceed 30% of total production in vulnerable rural regions [2].
Environmental variables such as relative humidity and wind speed play an important role in frost formation and crop vulnerability. Relative humidity levels below 50% increase thermal and hydric stress in potato plants, making them more susceptible to freezing damage during cold nights [4]. Additionally, wind speeds below 2 m/s favor the development of radiation frost due to reduced atmospheric mixing and stronger thermal inversion near the soil surface. Conversely, stronger winds contribute to dissipating accumulated cold air and reduce frost probability [5].
To mitigate frost-related damage, several protection techniques have been implemented in agricultural environments. These strategies are commonly classified into passive and active methods [2]. Passive methods correspond to preventive long-term measures aimed at increasing crop resistance against low temperatures. Among them, biological passive methods include the application of biological cryoprotectants capable of reducing ice crystal formation within plant tissues, as well as genetic improvement and the selection of frost-resistant crop varieties [2].
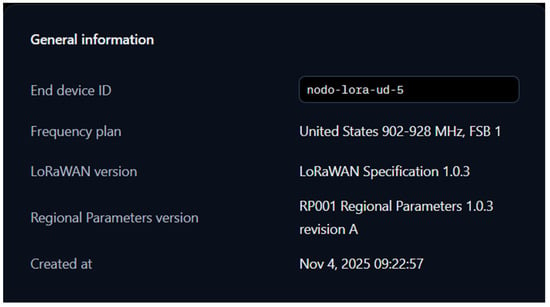
Ecological passive methods include the use of thermal blankets or protective covers capable of generating localized microclimates around crops, increasing foliage temperature by approximately 3 °C to 5 °C above ambient conditions [2]. Additional practices such as weed control, adequate fertilization, optimized planting dates, and the selection of less frost-sensitive cultivation areas also contribute to reducing frost-related agricultural risk in the Bogotá Sabana region.
Active protection methods are generally temporary techniques that require energy, infrastructure, and continuous operation during frost events. Among them, sprinkler irrigation systems represent one of the most widely used approaches for frost protection in potato crops [2]. This method operates by exploiting the latent heat released during water freezing, maintaining plant tissue temperatures near 0 °C and preventing more severe thermal damage. However, these systems require adequate water availability and irrigation infrastructure, making them economically demanding for many small-scale rural farmers.
According to local farmers, traditional measures used to protect crops against frost consisted mainly of lighting bonfires or burning tires during the night, as they were unaware of alternative methods. However, these practices are currently prohibited and may result in penalties under Law 599 of 2000 [6]. In this context, a low-cost environmental monitoring system based on LoRa technology for smart agriculture applications emerges as an alternative solution to mitigate and predict this phenomenon, which has both economic and social impacts on agriculture in the municipality of La Calera.
In this context, wireless sensor networks (WSNs) based on LPWAN (Low Power Wide Area Network) technologies emerge as a viable alternative for agricultural monitoring applications. LPWAN technologies enable long-range communication with low energy consumption, making them especially suitable for rural agricultural environments with limited connectivity infrastructure [7]. The implementation of LPWAN-based WSNs allows the continuous monitoring of meteorological variables, the generation of early warnings, and improved decision-making processes, contributing to the sustainability and productivity of potato crops in La Calera.
A related study conducted by the Universidad Piloto de Colombia on the design and implementation of a wireless sensor network for temperature and humidity monitoring in hydroponic lettuce crops [8] highlights the important role that WSNs can play in real-time agricultural data collection. For the present work, this research supports the use of low-power consumption technologies for the early detection of critical temperature variations in crops, enabling the generation of alerts to reduce agricultural risk [9].
Recent studies have demonstrated the growing relevance of LPWAN and IoT technologies in precision agriculture applications. Ahmad et al. [10] proposed an IoT-based wireless sensor network for precision agriculture focused on real-time environmental monitoring, highlighting the importance of continuous data acquisition for improving agricultural decision-making. Similarly, Islam et al. [11] evaluated the suitability of LPWAN technologies for smart farming applications, emphasizing the advantages of LoRaWAN in terms of long-range communication and low power consumption in rural environments.
More recent contributions, such as the work of Al-Najar et al. [12], integrated LoRaWAN communication with IoT-based smart irrigation systems, demonstrating the feasibility of deploying wireless monitoring infrastructures in agricultural areas with limited connectivity. Likewise, Bhat et al. [13] analyzed the impact of environmental variables on LoRa network performance in agricultural sensing environments, showing that factors such as temperature, humidity, and terrain conditions directly influence communication quality metrics such as RSSI and SNR.
Although these studies demonstrate the potential of LPWAN technologies for smart agriculture, most implementations focus on irrigation systems, greenhouse environments, or communication performance evaluation in isolation. In contrast, fewer works address low-cost environmental monitoring systems specifically oriented toward frost detection in high-altitude potato crops under real rural deployment conditions, integrating sensor characterization, network validation, and end-to-end data visualization within a single experimental framework.
To address this gap, this work presents the design, experimental characterization, and field validation of a low-cost LoRaWAN-based environmental monitoring system for frost-related variables in potato crops located in the rural mountainous region of La Calera, Colombia. The main contributions of this work are:
- (1)
- The design and experimental characterization of a low-cost LoRaWAN sensor node (Heltec WiFi LoRa 32 V3 + AM2305B) validated under controlled conditions across three independent testing sessions, quantifying sensor agreement through RMSE and Pearson correlation metrics.
- (2)
- The evaluation of sensor suitability specifically for frost-risk monitoring variables (temperature and relative humidity) in high-altitude potato crops, a context underrepresented in the existing LPWAN precision agriculture literature.
- (3)
- The deployment and experimental communication performance analysis of a LoRaWAN network under both dense urban and rural mountainous conditions relevant to frost-prone agricultural regions, reporting RSSI and SNR metrics at distances up to 1.7 km.
- (4)
- The end-to-end integration of the monitoring system with a community-oriented visualization platform (Predicampo), oriented toward reducing the rural digital divide and improving frost early warning capabilities for small-scale farmers in La Calera.
This work focuses on the design of a low-cost environmental sensor node implemented using LoRa technology for smart agriculture applications in La Calera. The system is centered on measuring temperature and relative humidity, which are key variables for the early detection of frost events, with the aim of providing an accurate and accessible solution for farmers, thereby contributing to the sustainability and productivity of potato crops.
2. Materials and Methods
2.1. Study Area and Deployment Context
The study was conducted in the municipality of La Calera, located in the Bogotá Sabana region of Cundinamarca, Colombia, an area characterized by high-altitude mountainous terrain prone to frost events that significantly affect potato crop production. The monitored agricultural area covered approximately 2.15 hectares, where sensor nodes were distributed according to coverage, accessibility, and terrain conditions.
The installation of the sensor nodes considered agronomic and meteorological criteria associated with frost monitoring applications. Based on meteorological standards established by IDEAM, air temperature measurements for frost monitoring are conventionally performed at a height of approximately 2 m above ground level [1,3]. Therefore, one sensor node was installed at this height in order to obtain standardized environmental measurements. Additional nodes were positioned near crop level (between 0.10 m and 0.50 m above ground level), allowing the evaluation of thermal variations occurring close to the crop canopy and in the surrounding atmosphere.
The implemented network architecture follows a star topology characteristic of LoRaWAN systems, where multiple sensor nodes transmit information directly to a central gateway connected to The Things Network (TTN) infrastructure for data management and processing. This approach reduces energy consumption, simplifies the network architecture, and improves scalability in rural deployments [14].
Prior to the final deployment in La Calera, preliminary rural propagation tests were conducted in Turmequé, Boyacá, in order to evaluate signal propagation, elevation effects, and communication stability in open-field agricultural environments under controlled distance conditions.
2.2. Sensor Node Design and Assembly
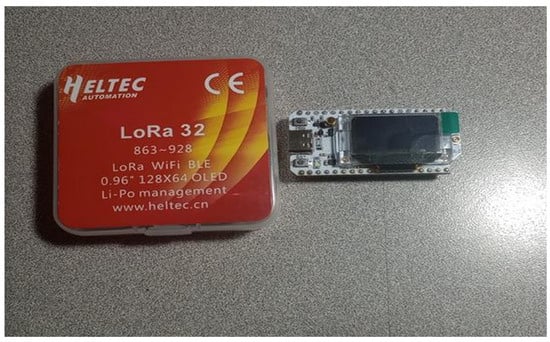
The first experimental node was developed through the integration of the Heltec WiFi LoRa 32 V3 board (Heltec Automation, Chengdu, China) with an AM2305B temperature and humidity sensor (Aosong Electronics Co., Ltd., Guangzhou, China). This sensor was selected due to its robust structure, outdoor-protected encapsulation, low power consumption, and good long-term stability. The AM2305B provides simultaneous temperature and humidity readings, which are transmitted to the Heltec microcontroller for processing. The data are displayed on the integrated OLED screen and can also be monitored through the serial port. In addition, the system allows the sampling interval to be configured according to the experimental requirements.
The selection of the Heltec WiFi LoRa 32 V3 development board was based on its native integration of LoRa communication capabilities, compatibility with LoRaWAN protocols, low power consumption, and sufficient computational capacity for environmental data acquisition and wireless transmission. The board integrates the ESP32-S3FN8 dual-core microcontroller, providing WiFi, Bluetooth, and LoRa connectivity within a single platform, which makes it suitable for IoT and precision agriculture applications [15]. Additionally, the integrated OLED display facilitated preliminary field validation and real-time visualization of environmental variables during the experimental stage. Its programming flexibility and compatibility with LPWAN infrastructures reduced firmware development complexity and improved system scalability for future rural deployments.
Figure 1 shows the Heltec WiFi LoRa 32 V3 development board used as the core platform for the sensor nodes.
Figure 1.
Heltec WiFi LoRa 32 V3 development board. Source: Author(s).
From a technical perspective, the AM2305B sensor was selected due to its outdoor-protected encapsulation, improved long-term stability, and higher precision compared to low-cost alternatives such as the DHT11. According to the manufacturer’s specifications, the sensor provides a typical temperature accuracy of ±0.3 °C and a relative humidity accuracy close to ±2% RH under normal operating conditions [16]. Its selection was further supported by preliminary experimental validations conducted by the LIDER research group, where the sensor demonstrated stable behavior under controlled thermal variations and acceptable agreement with reference instrumentation. These characteristics make the AM2305B suitable for agricultural monitoring applications associated with frost detection and environmental characterization in rural areas.
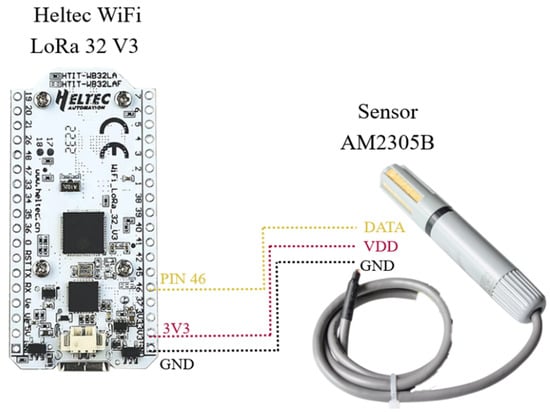
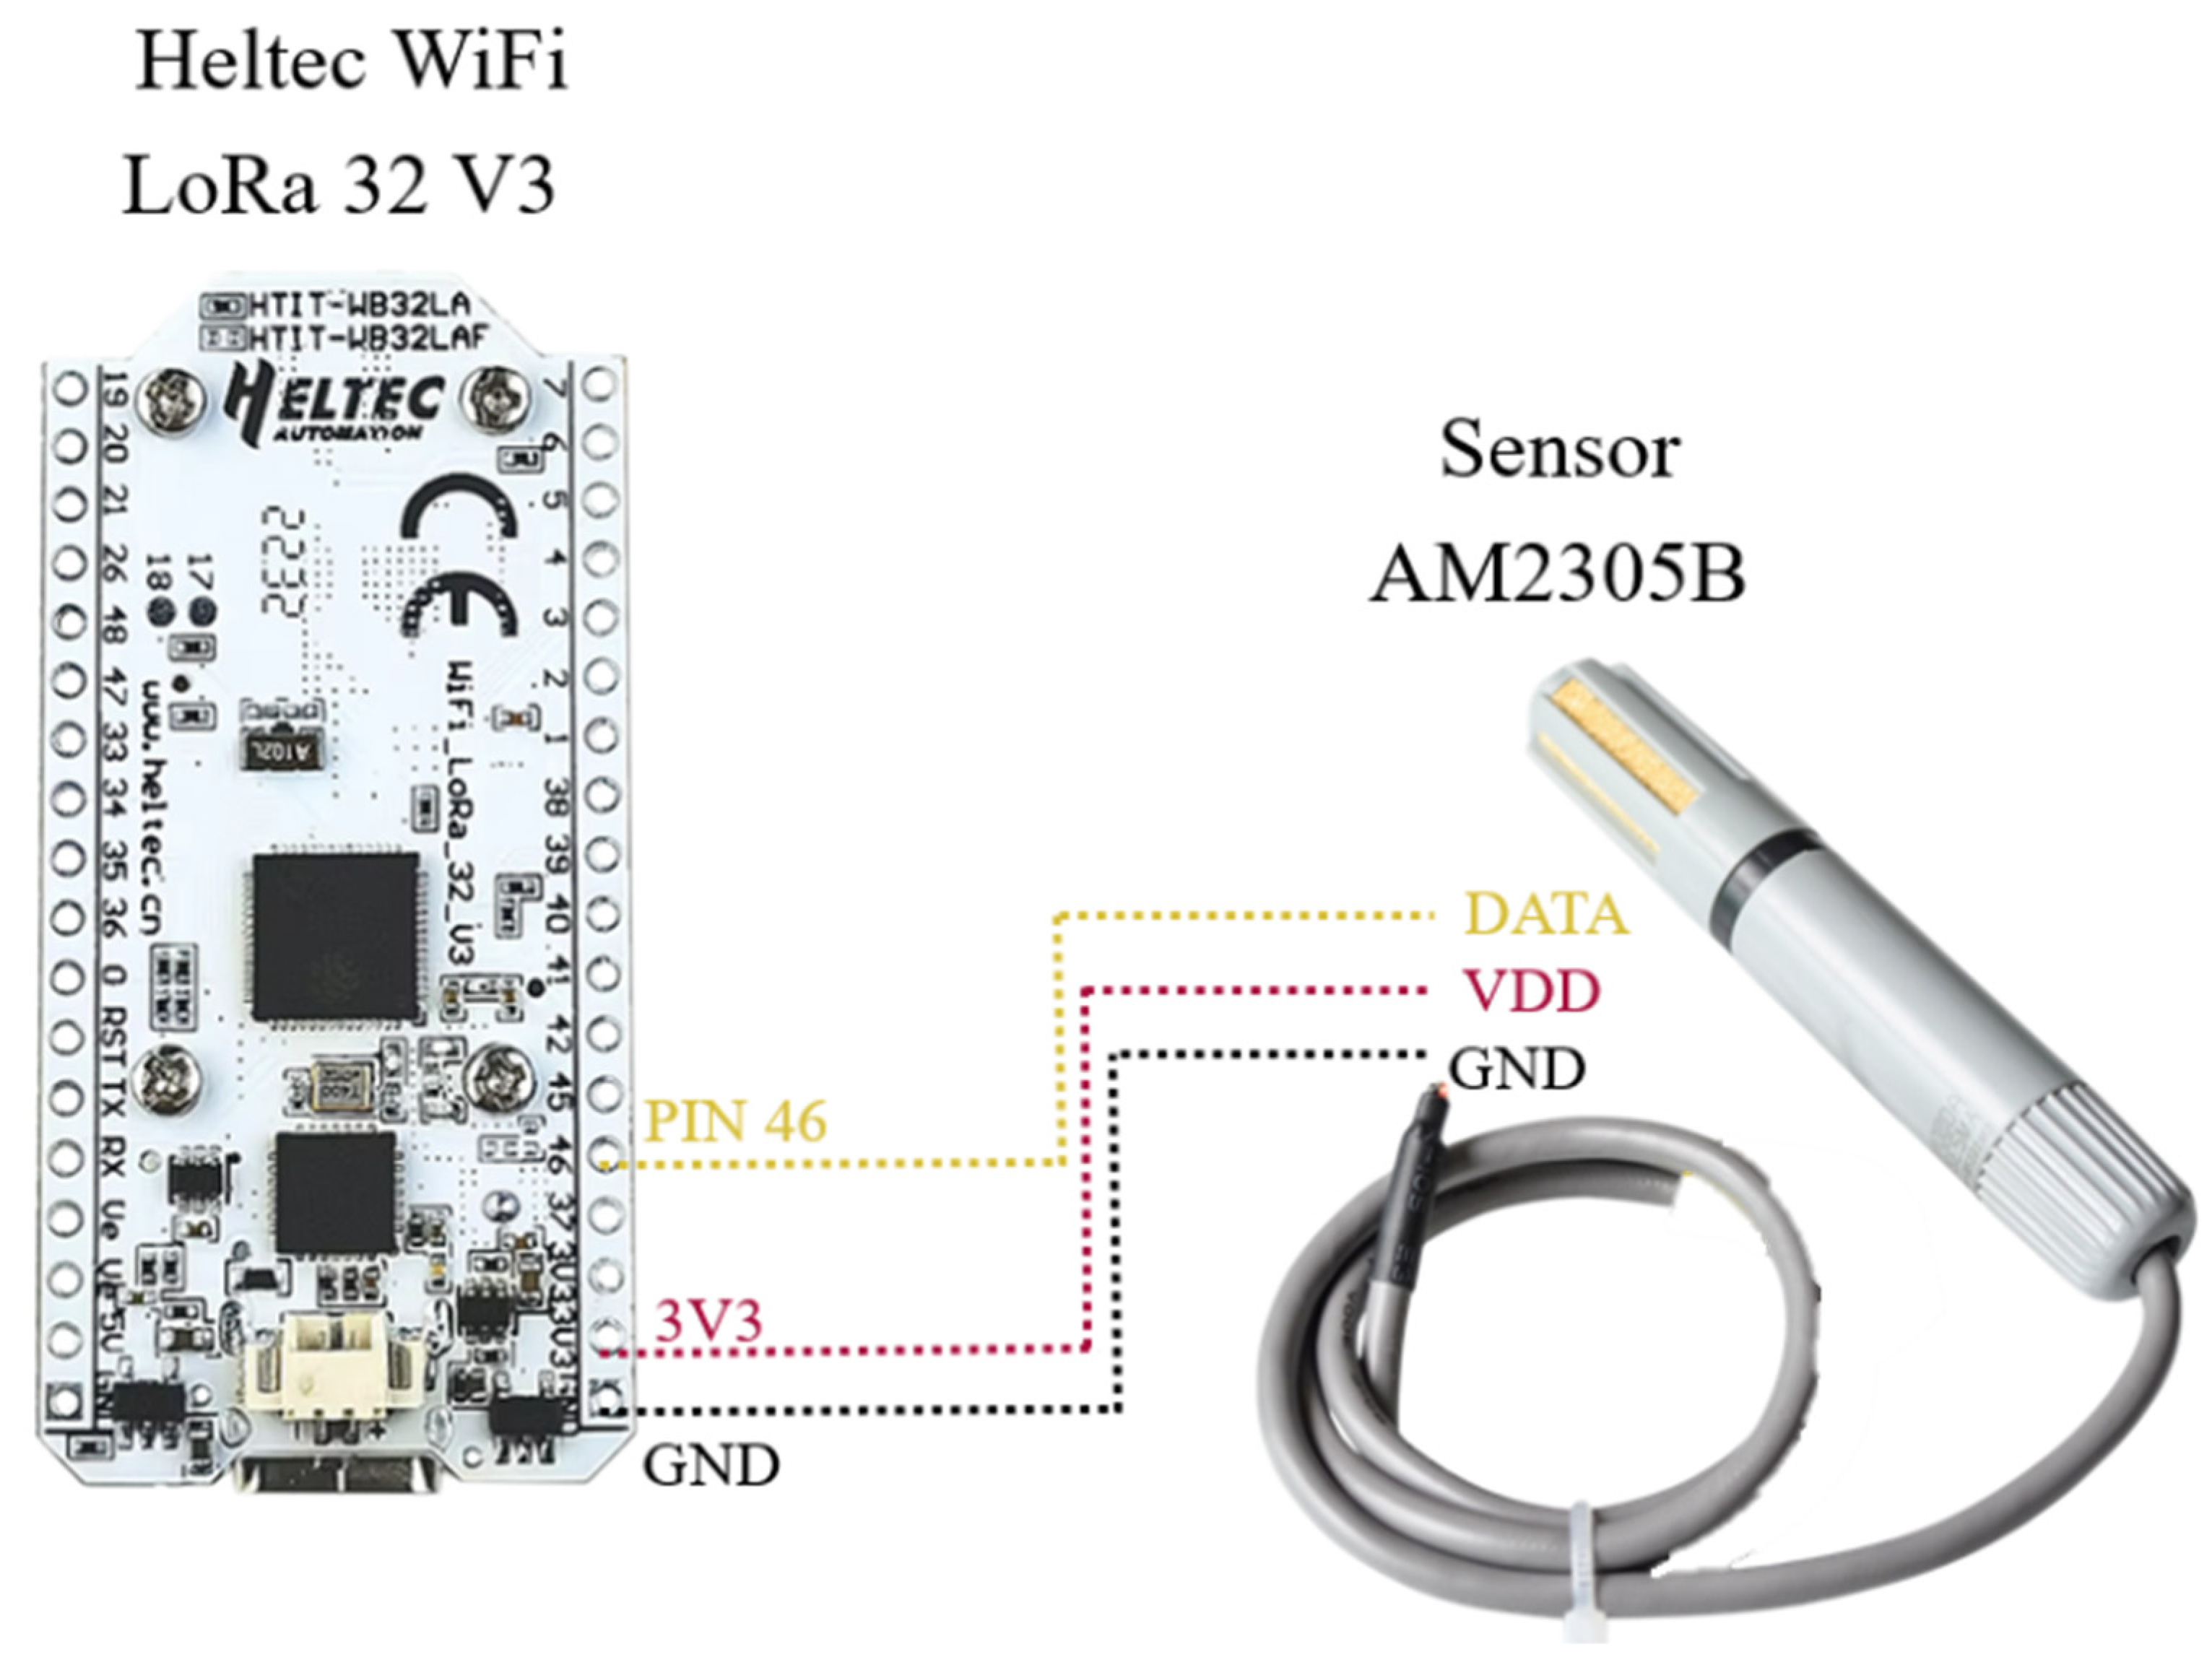
Figure 2 presents the circuit schematic illustrating the electrical connection between the AM2305B sensor and the Heltec WiFi LoRa 32 V3 board, detailing the power supply and data communication pins used for sensor integration.
Figure 2.
Circuit diagram of the connection between the Heltec WiFi LoRa 32 V3 board and the AM2305B sensor. Source: Author(s).
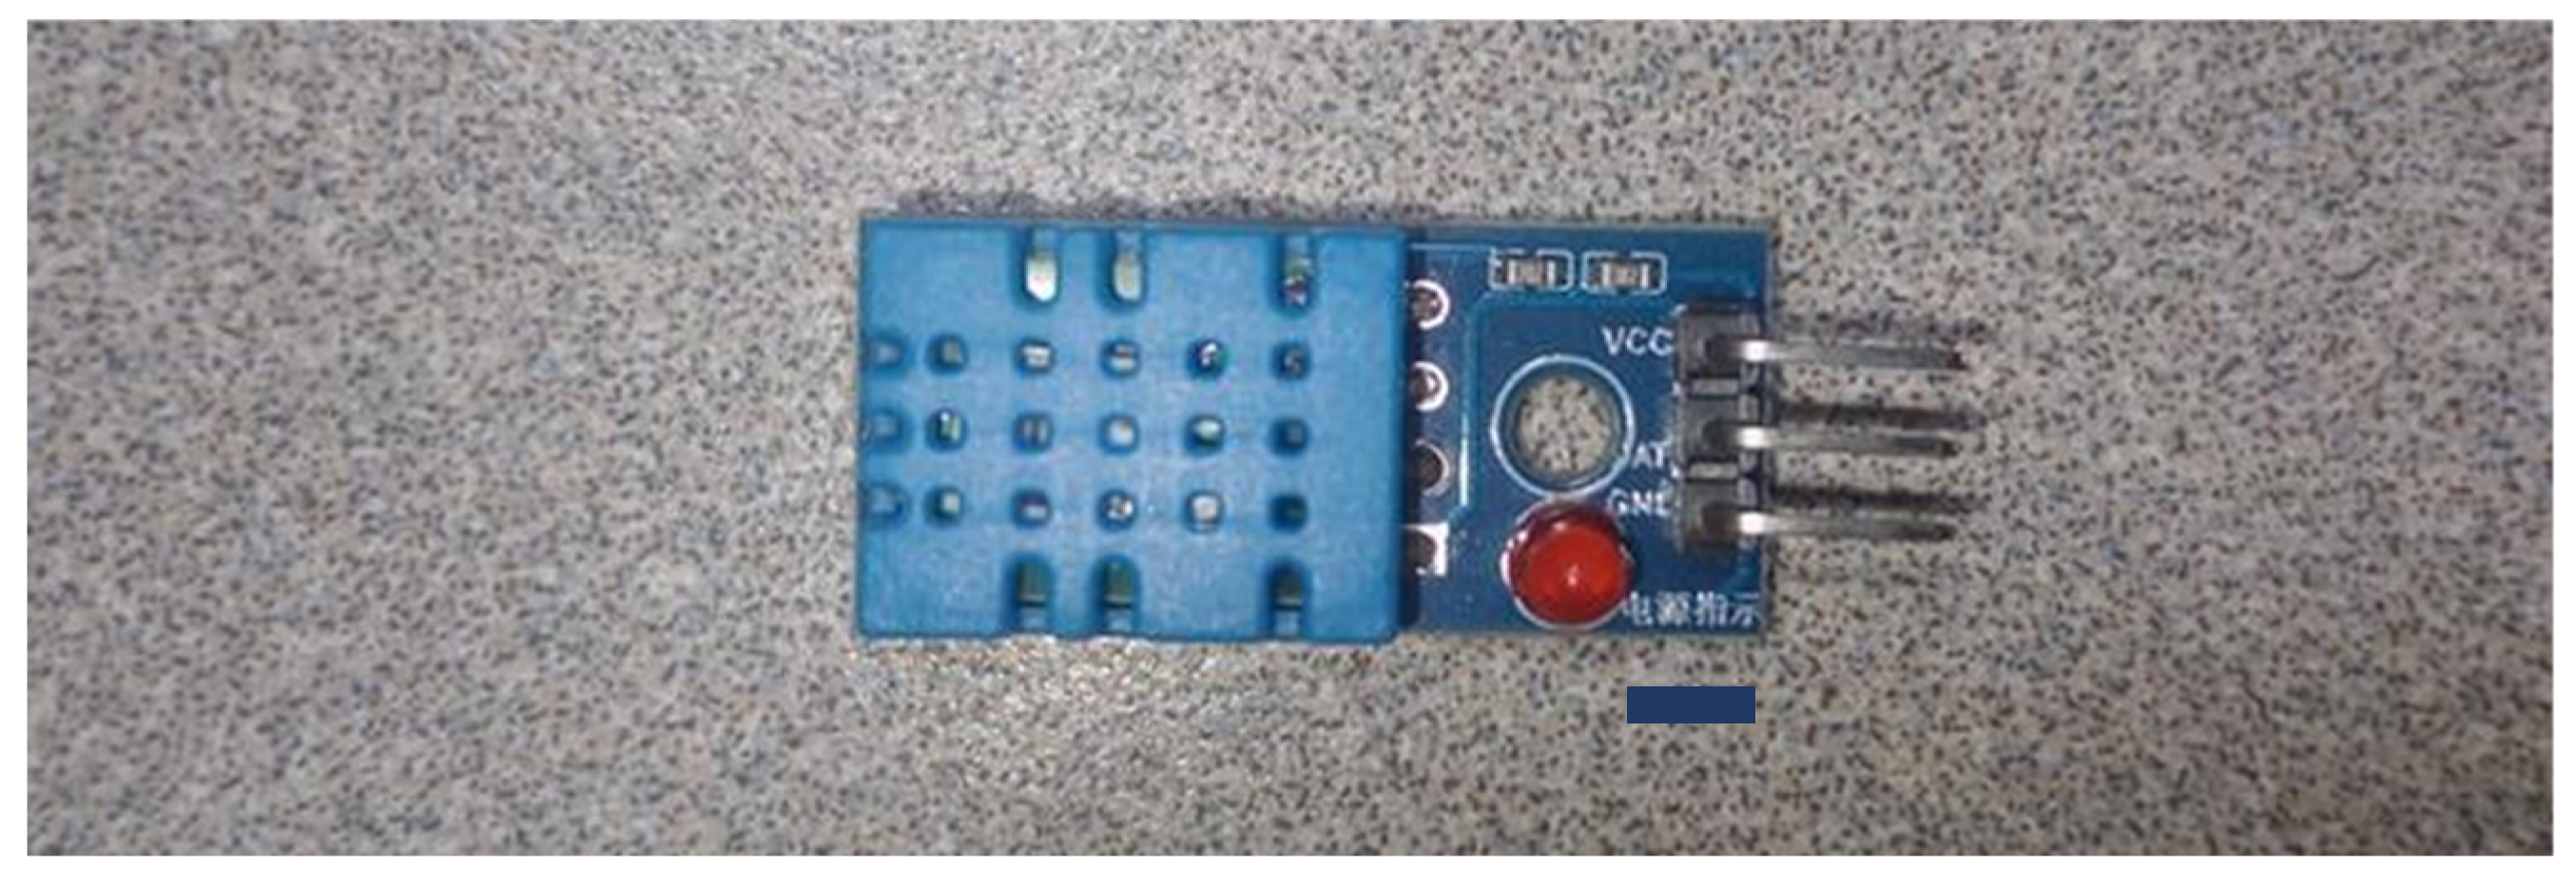
As a low-cost alternative, a second node was implemented using the same Heltec WiFi LoRa 32 V3 board, but incorporating a DHT11 sensor (Aosong Electronics Co., Ltd., Guangzhou, China). This sensor exhibits lower performance and accuracy compared to the AM2305B. Unlike the latter, the DHT11 lacks protective encapsulation against external environmental conditions, which limits its use in real agricultural environments. However, it shares library compatibility with the AM2305B, which facilitated its integration into the same measurement and visualization system. Figure 3 shows the DHT11 sensor used to implement the low-cost node.
Figure 3.
DHT11 temperature and humidity sensor. Source: Author(s).
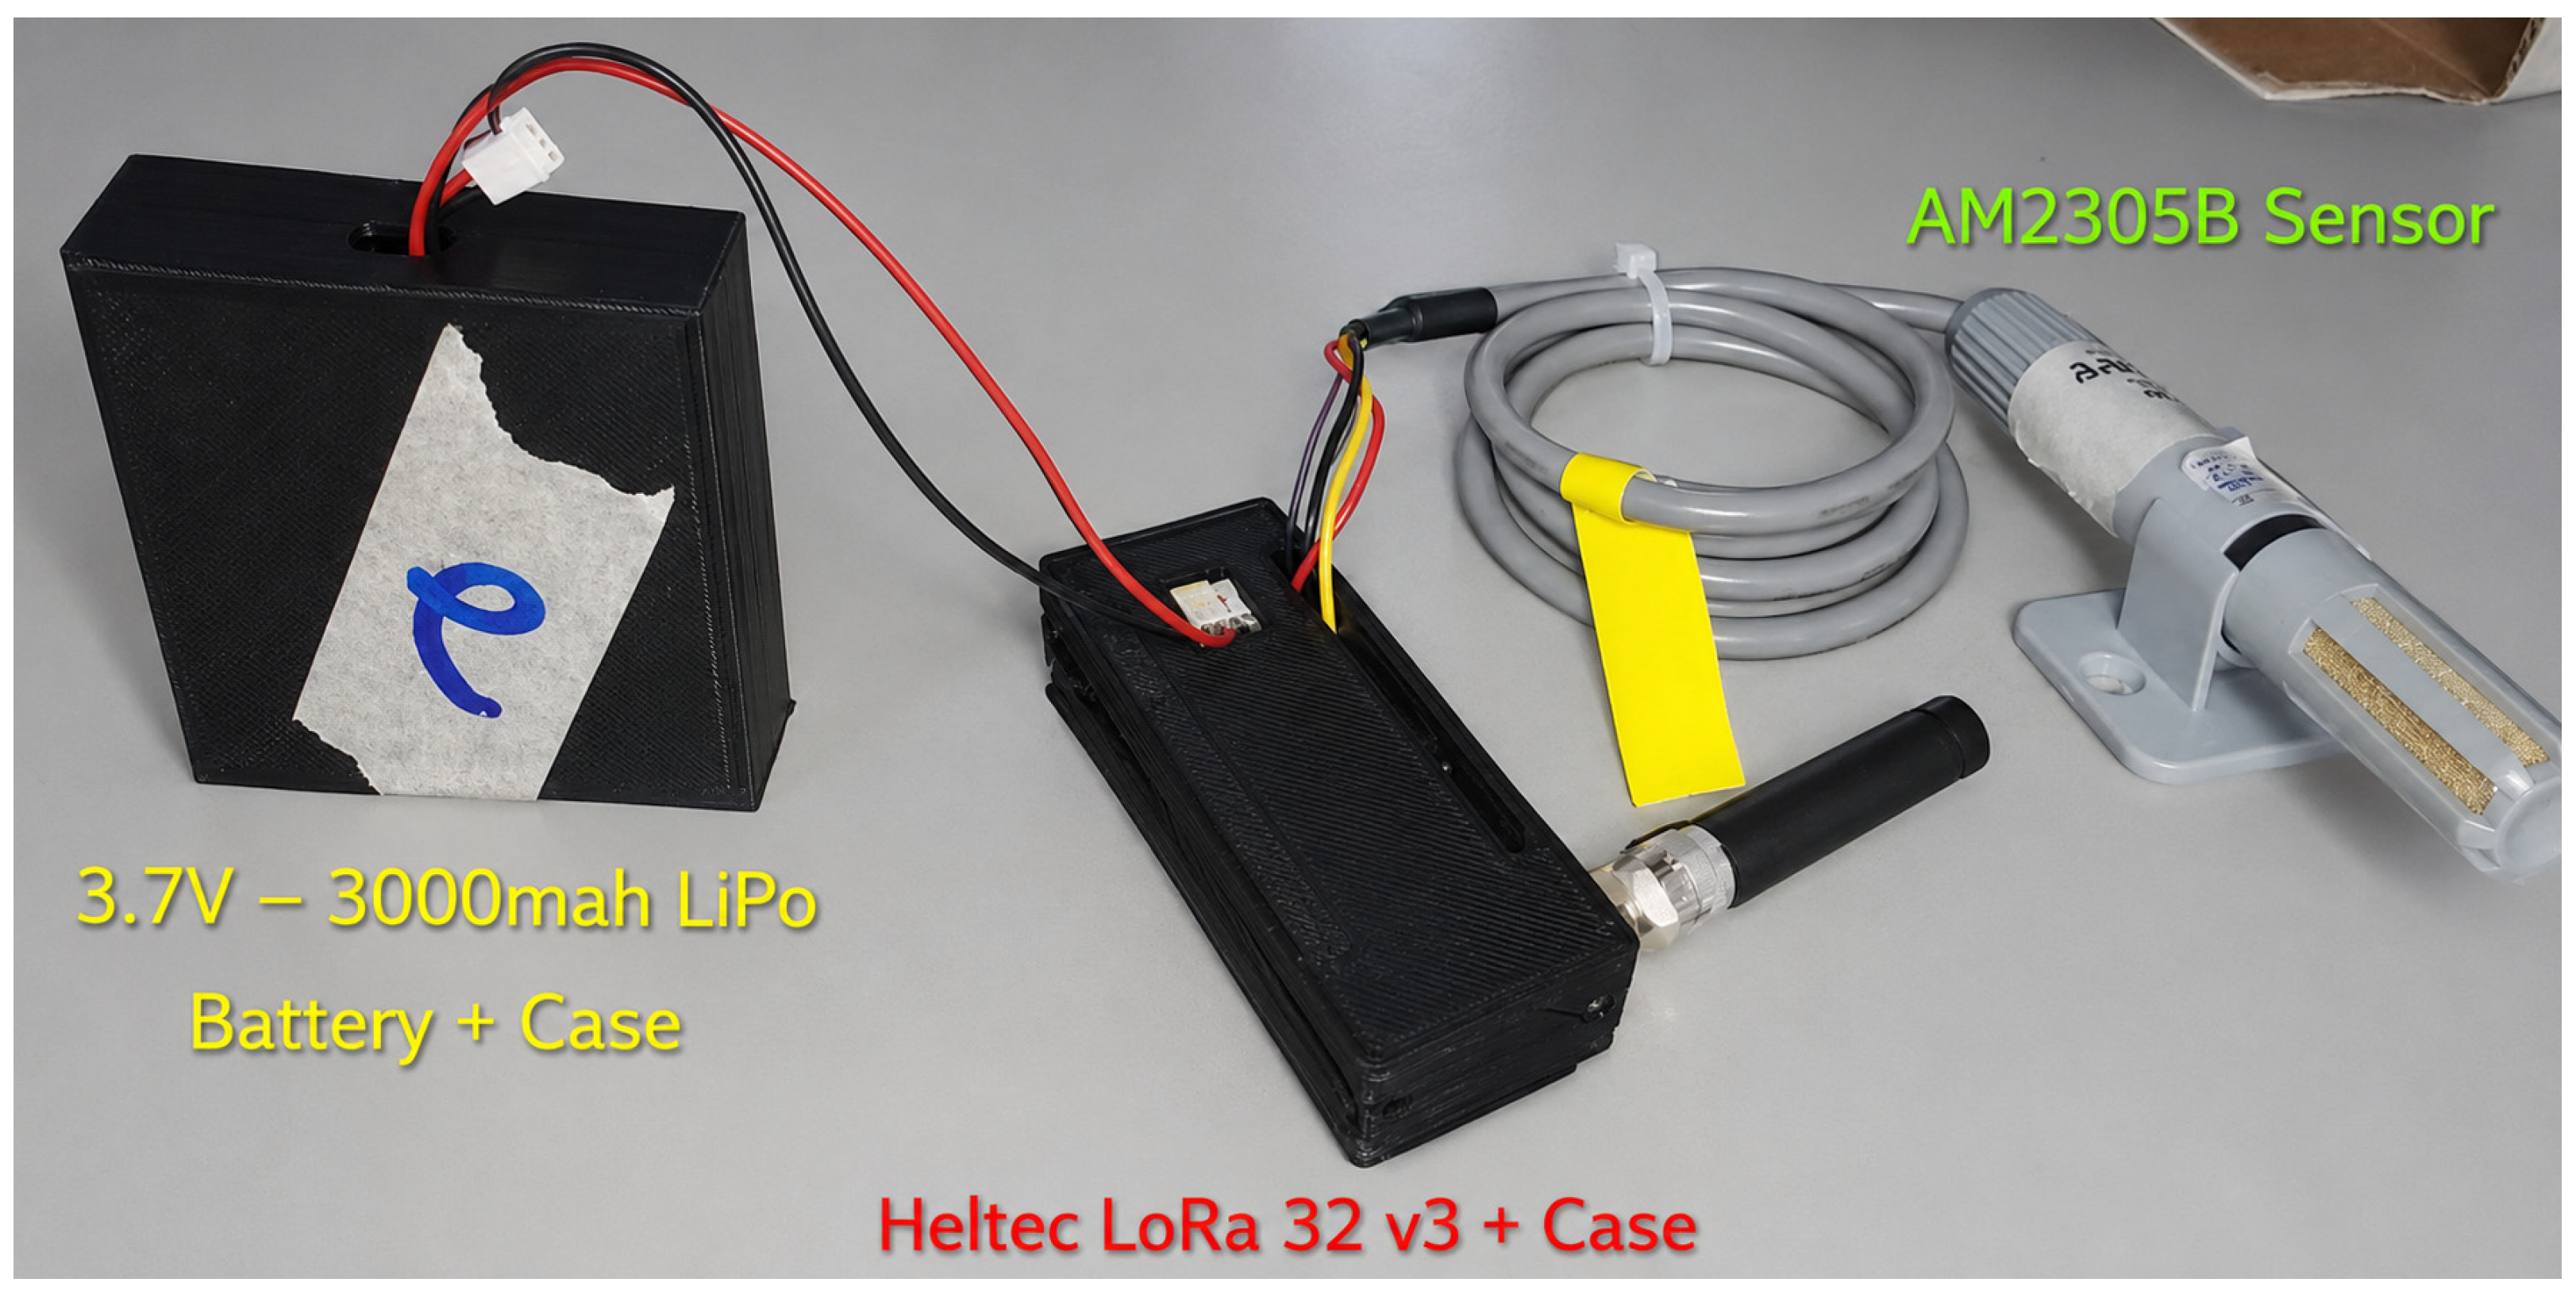
To improve field deployment conditions and provide additional protection against environmental exposure, a 3D-printed enclosure was incorporated into the final node design. The enclosure model was adapted from an open-source Heltec WiFi LoRa 32 protective case available on the Thingiverse platform [17]. Figure 4 shows the fully assembled sensor node with the 3D-printed protective enclosure.
Figure 4.
Fully assembled environmental sensor node incorporating a 3D-printed enclosure for electronic protection and battery compartment integration. Source: Author(s).
2.3. Reference Instrument
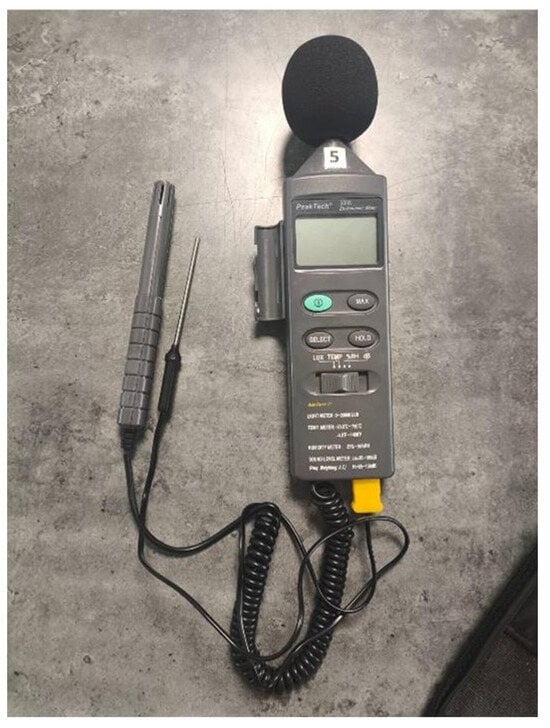
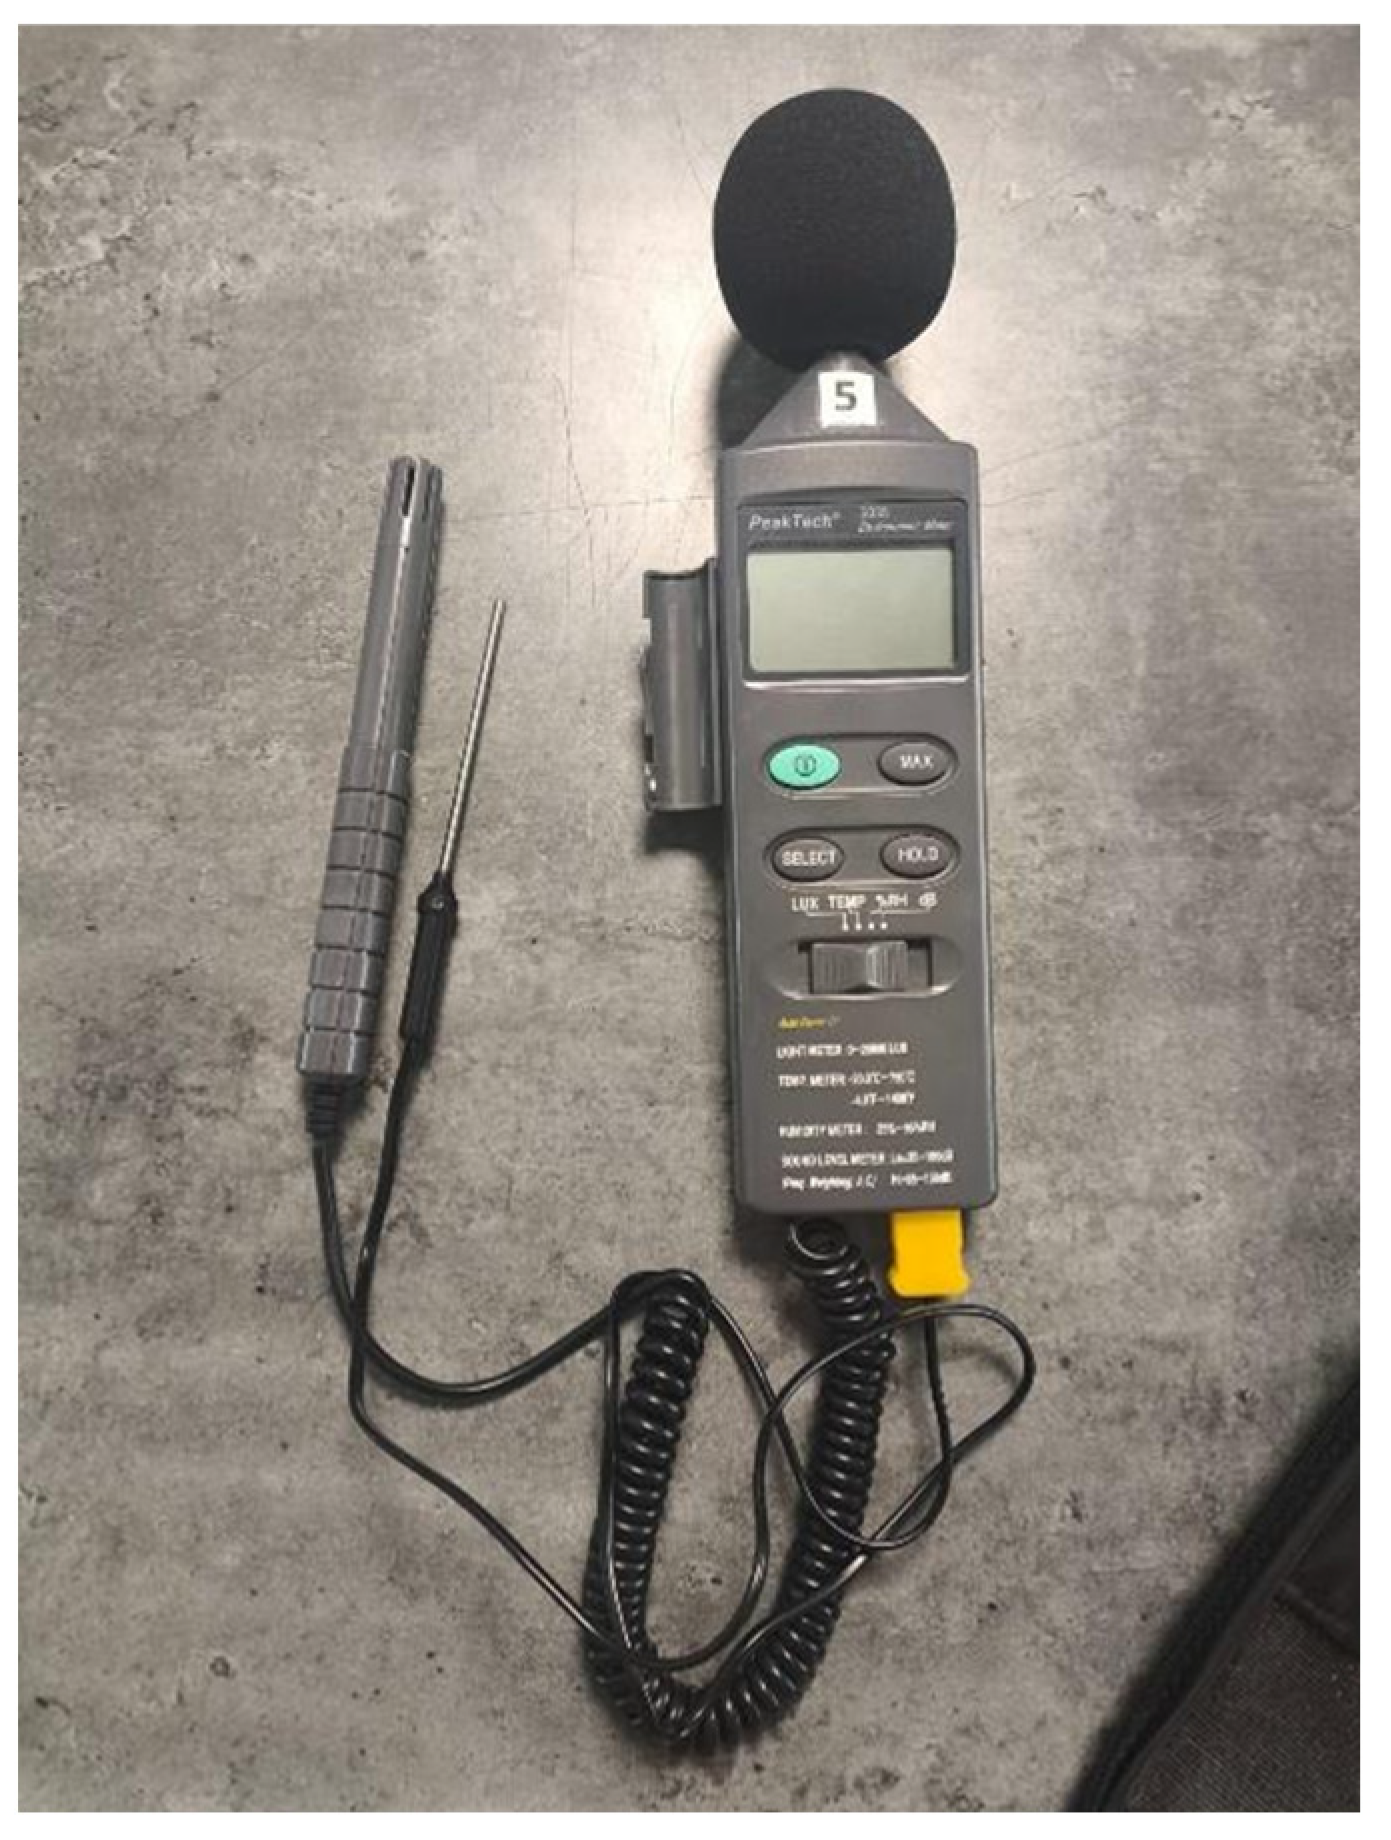
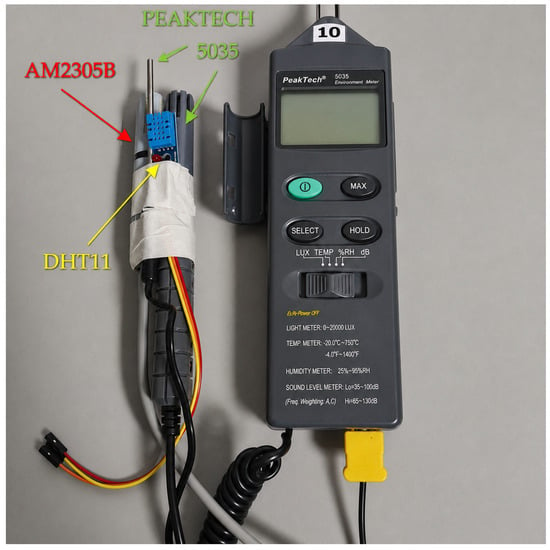
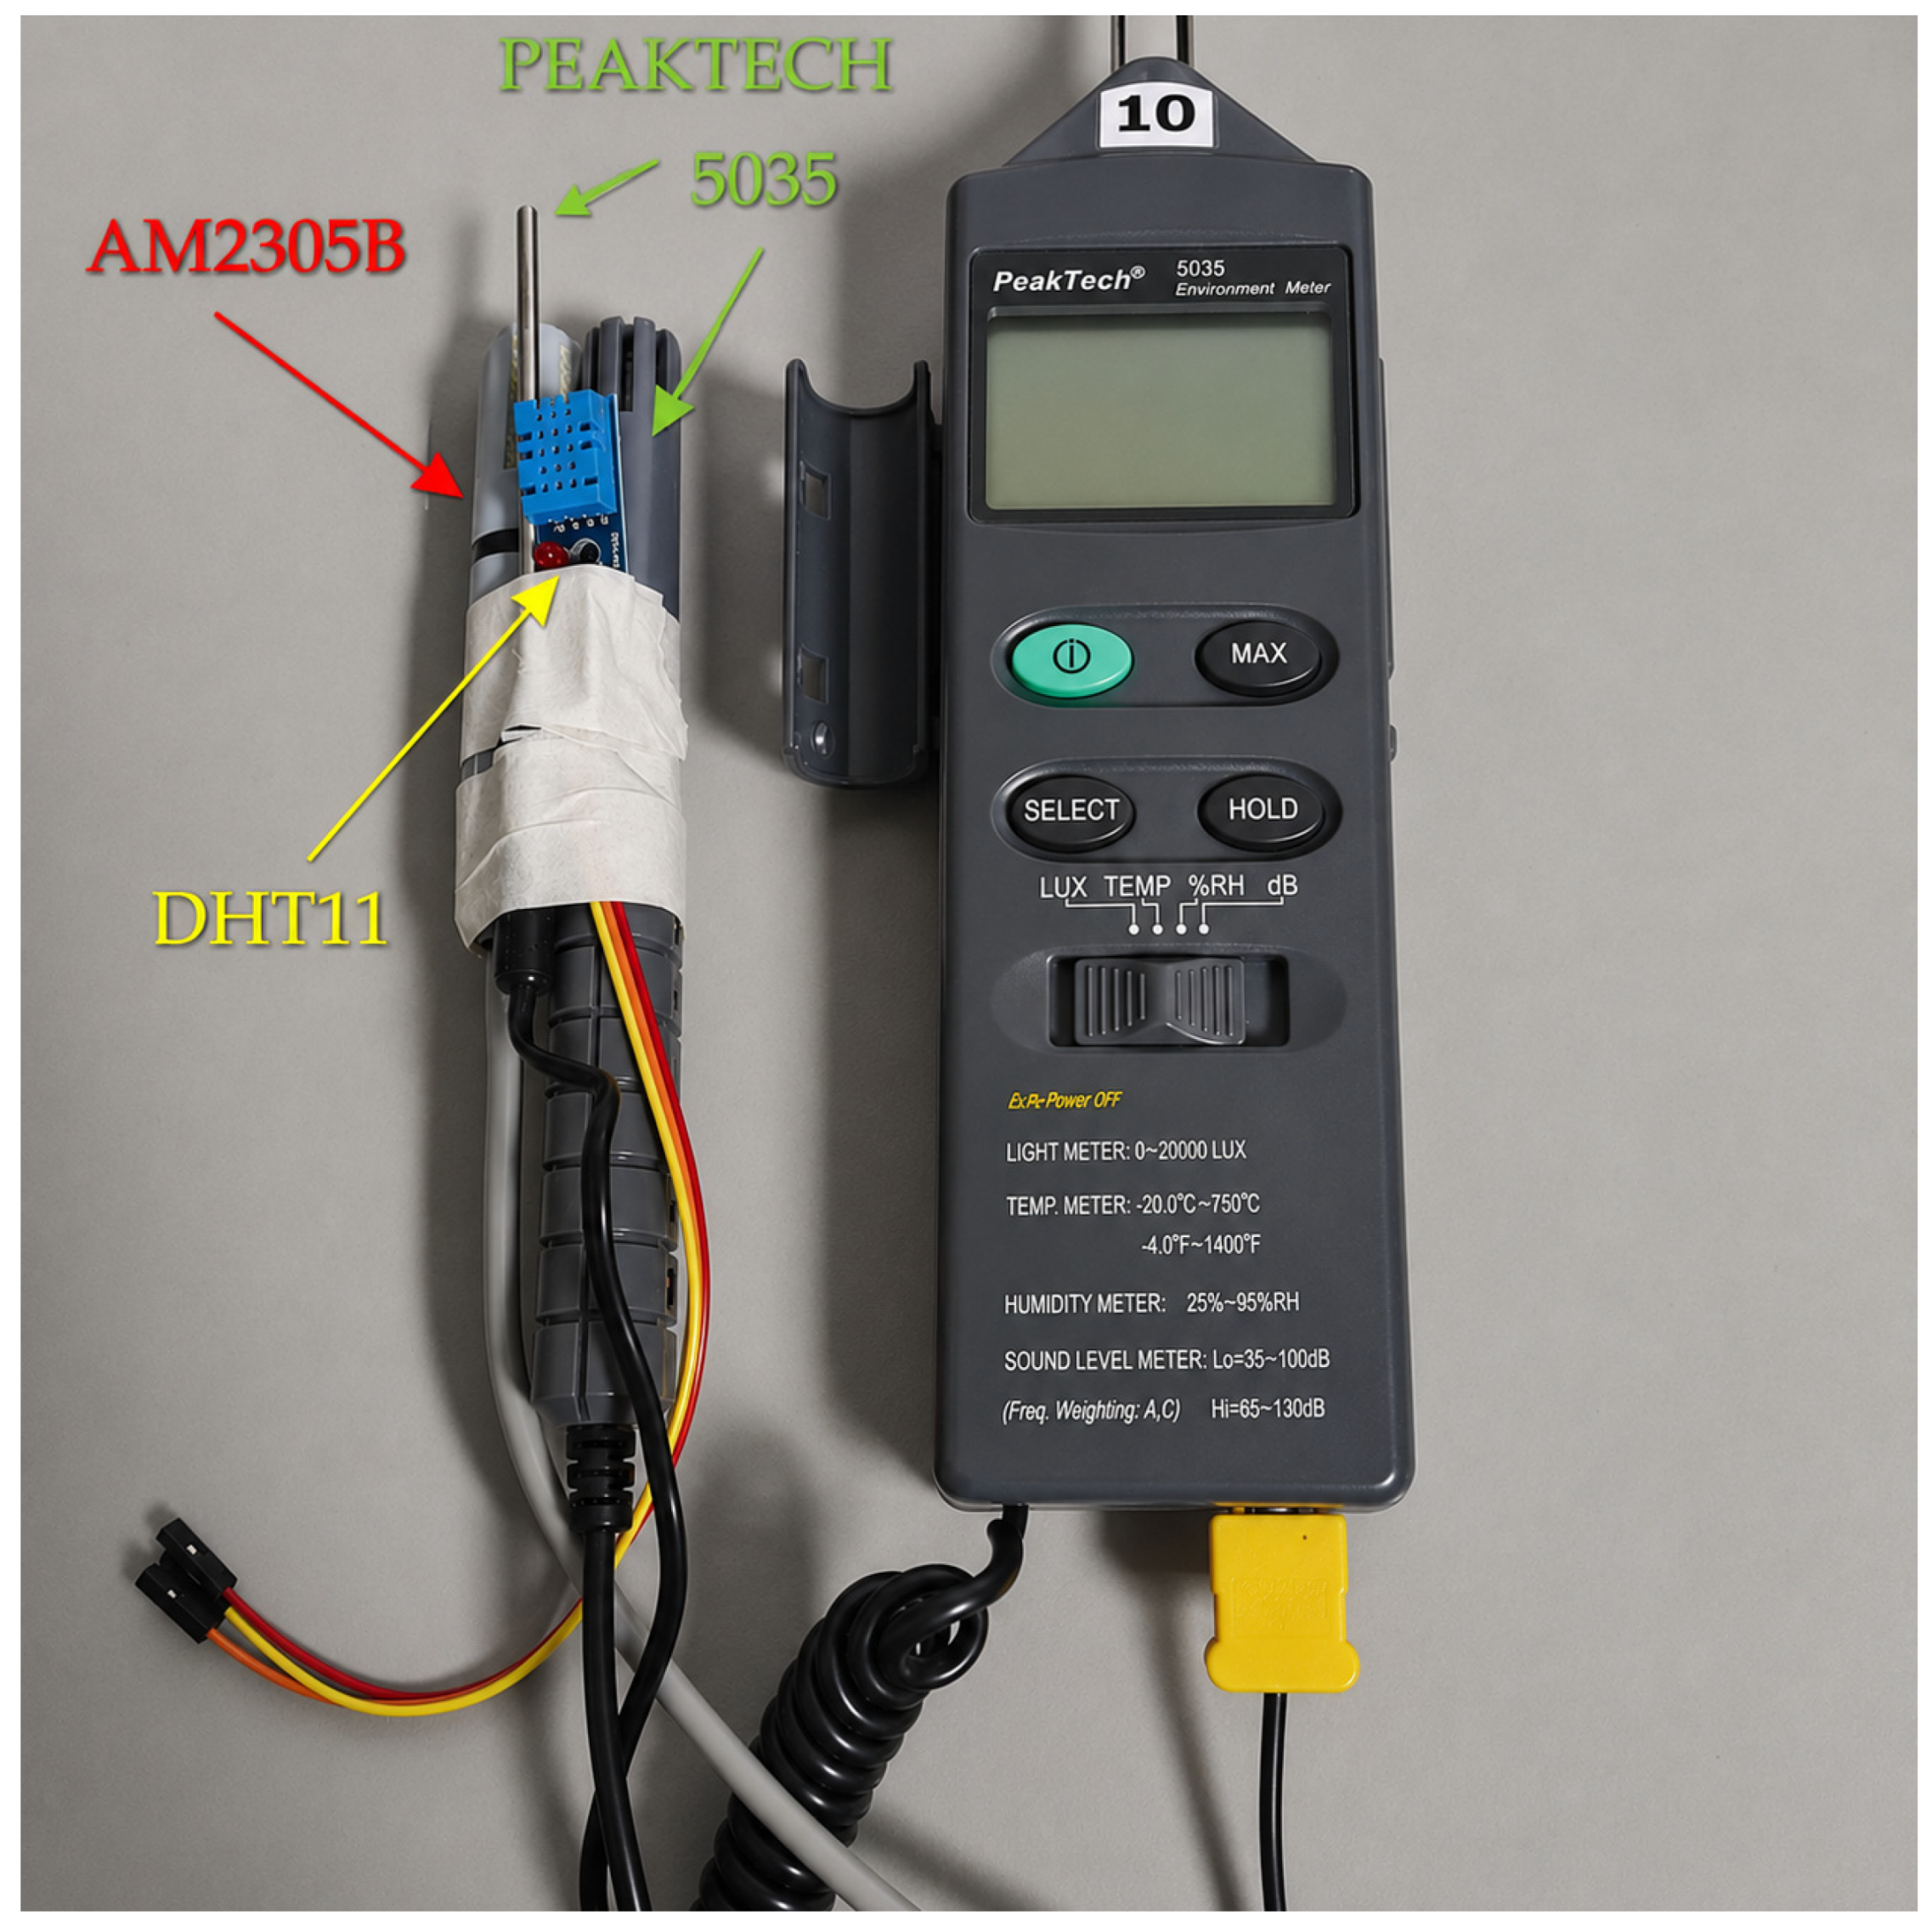
The reference instrument selected for validation was the PeakTech-5035 (PeakTech Prüf- und Messtechnik GmbH, Ahrensburg, Germany), a portable environmental meter capable of measuring temperature, relative humidity, noise level, and light intensity. For this study, only its temperature and relative humidity functions were used. The instrument provides a temperature measurement resolution of 0.1 °C, with an accuracy of ±3% of the reading within a range of −20 °C to +200 °C. For relative humidity measurements, it offers a resolution of 0.1% RH and an accuracy of ±5% under conditions of 25 °C and between 35% and 95% RH [18].
The device displays measurements on its LCD screen, allowing parameter selection through a switch. For relative humidity testing, the instrument uses an internal semiconductor sensor, while a type-K probe was employed for temperature measurements. Its robustness and ease of field use make it a practical comparison instrument for the AM2305B and DHT11 sensors. It is important to note that the PeakTech 5035 was not intended to provide metrological calibration but to serve as a practical field reference instrument commonly employed for environmental measurements. Given that its specified accuracy (±3% of reading for temperature and ±5% RH) is of a similar order of magnitude to that of the AM2305B sensor, the PeakTech 5035 should be regarded as a practical benchmark for relative agreement rather than as a metrological ground truth. Figure 5 shows the PeakTech-5035 reference instrument used for comparison purposes.
Figure 5.
PeakTech-5035 reference instrument. Source: Author(s).
2.4. Controlled Laboratory Testing
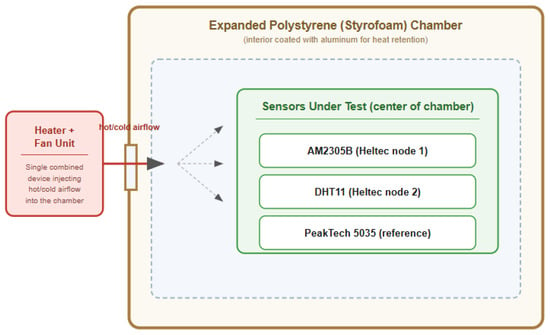
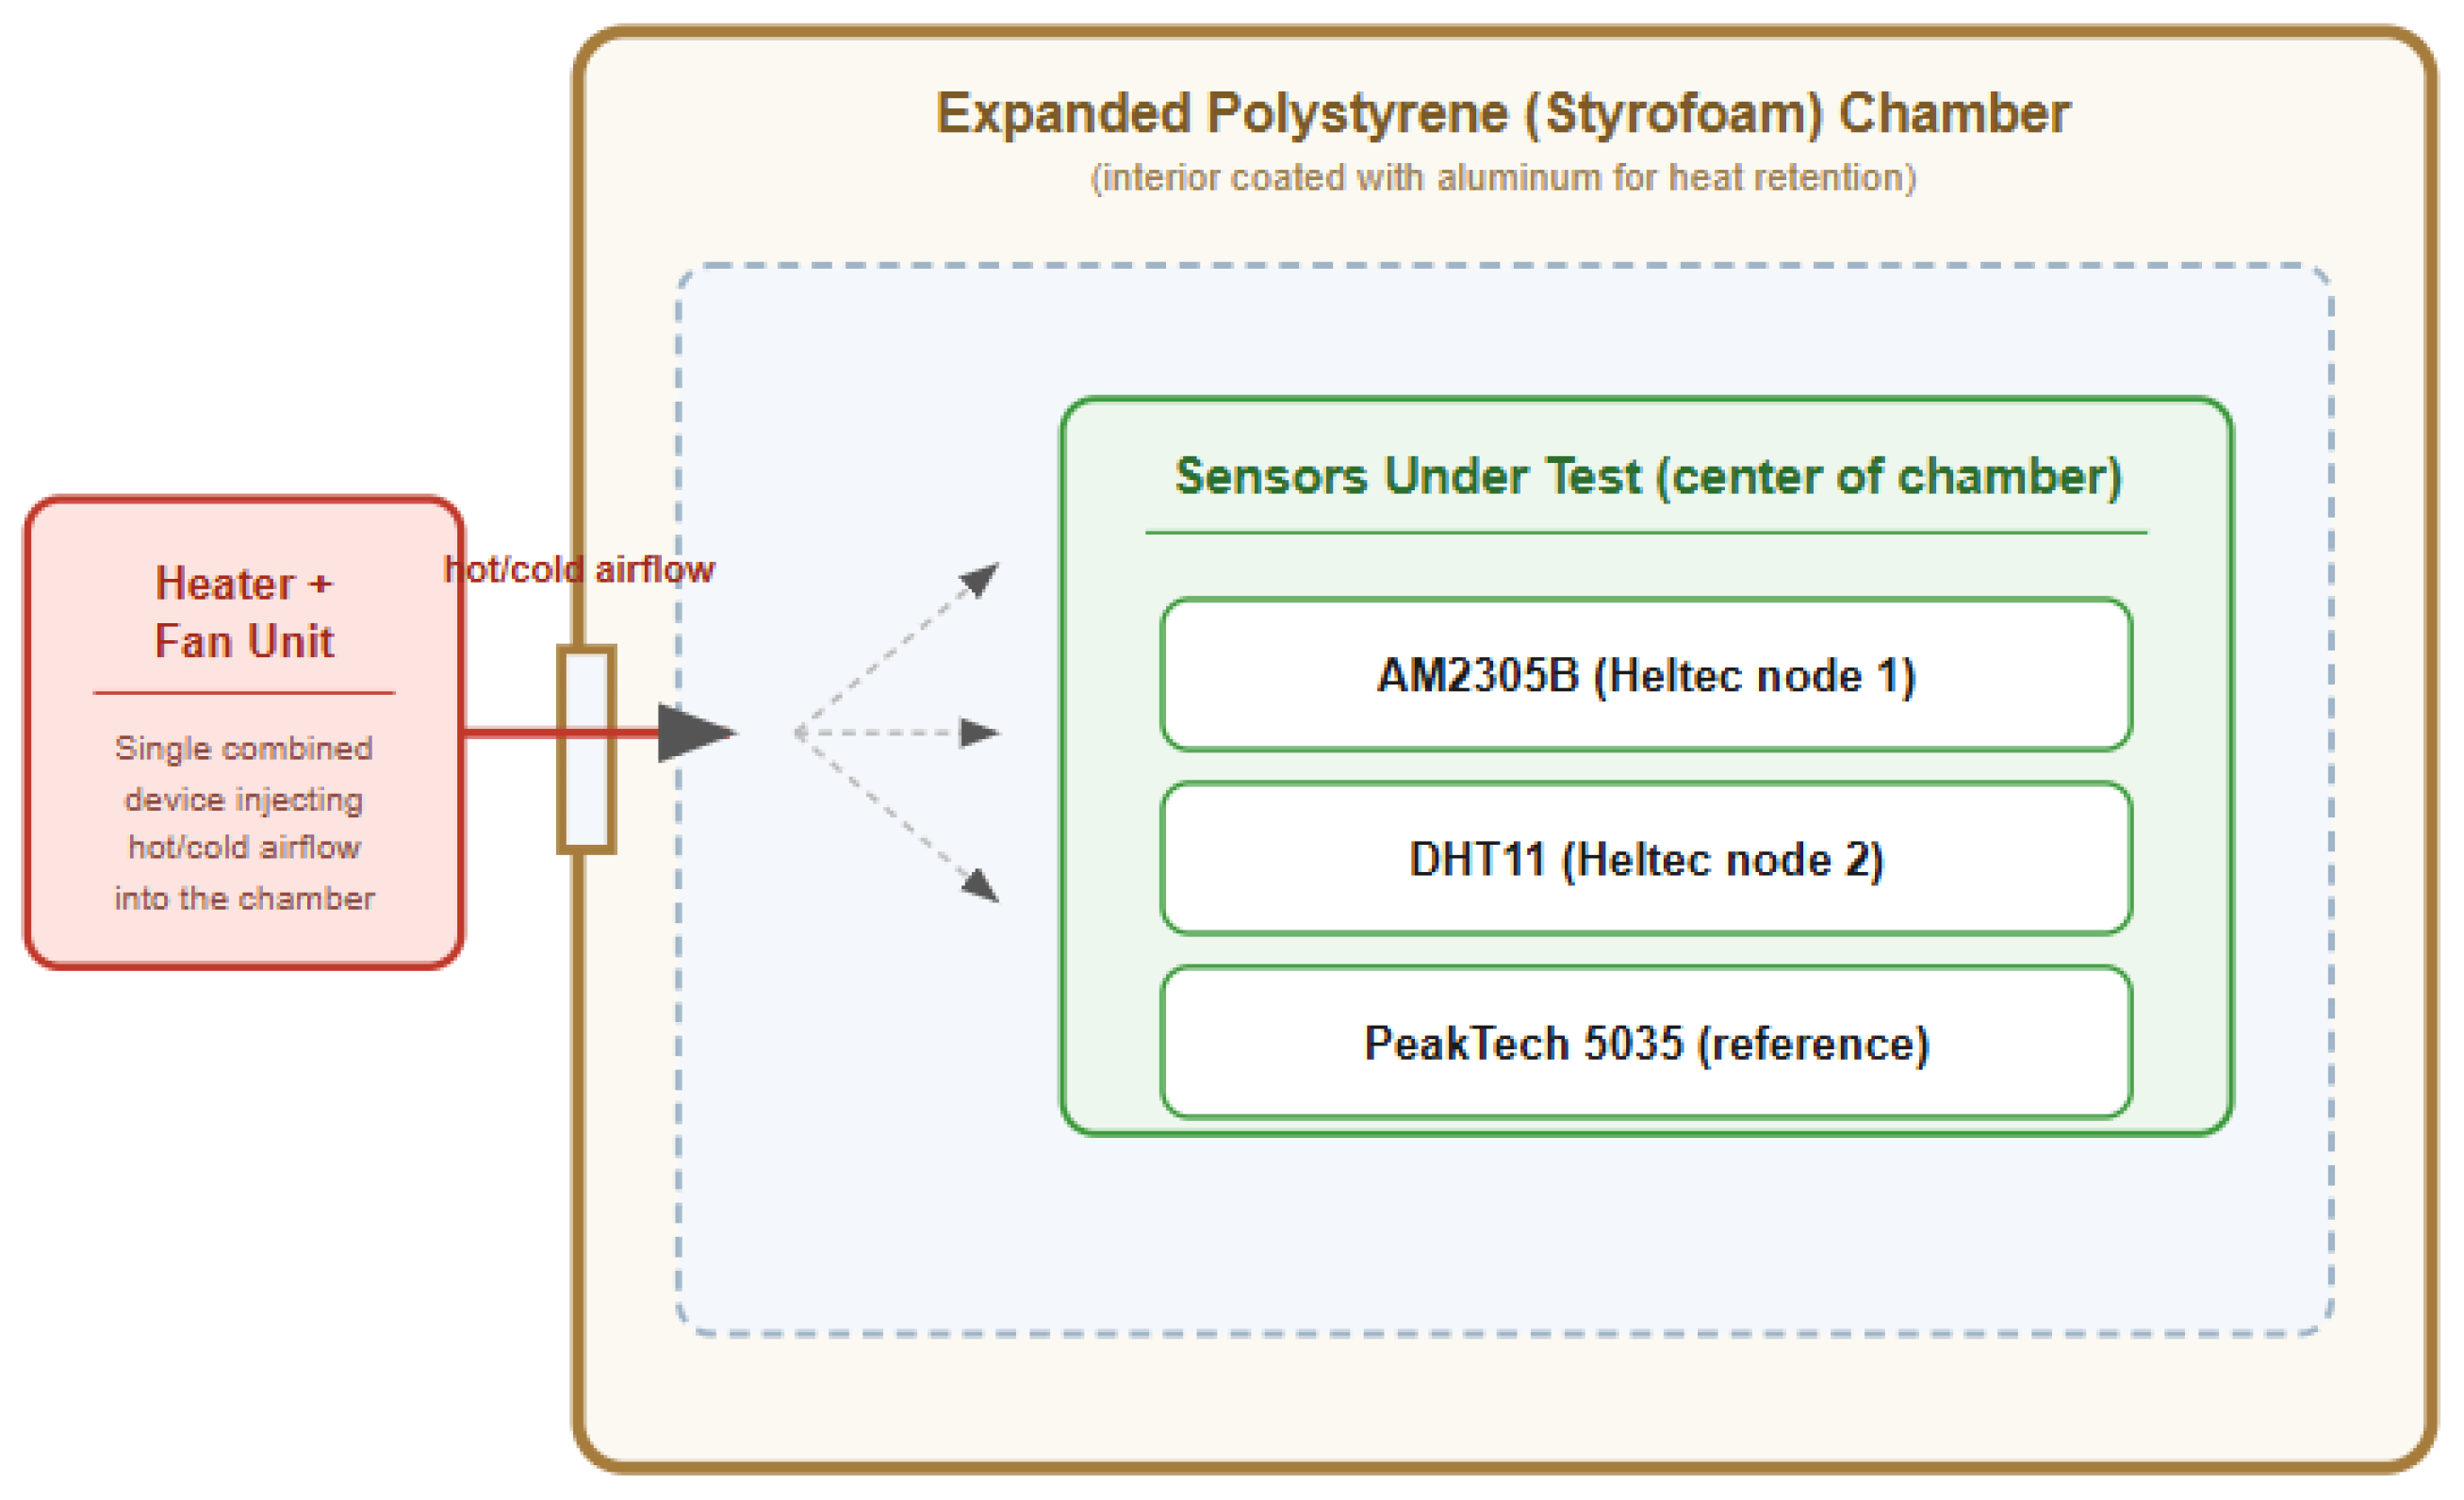
To evaluate and compare the accuracy of the sensors described in Section 2.2 and Section 2.3, a controlled environment was conditioned to simulate changes in environmental conditions similar to those found in agricultural settings. The experimental system consisted of a chamber made of expanded polystyrene (Styrofoam), as shown in Figure 6. Expanded polystyrene is a material with thermal insulation properties, and its interior was coated with aluminum to optimize heat retention and reduce rapid temperature variations. A combined heater–fan unit was installed on one side of the chamber to inject controlled airflow, generating gradual temperature increases and variations in relative humidity, reproducing dynamic scenarios similar to those encountered in open-field conditions. This experimental environment was essential to ensure that the measurements obtained from the different sensors were carried out under the same physical conditions, thereby avoiding bias and enabling an objective comparison of the results.
Figure 6.
Schematic diagram of the experimental environment. Source: Author(s).
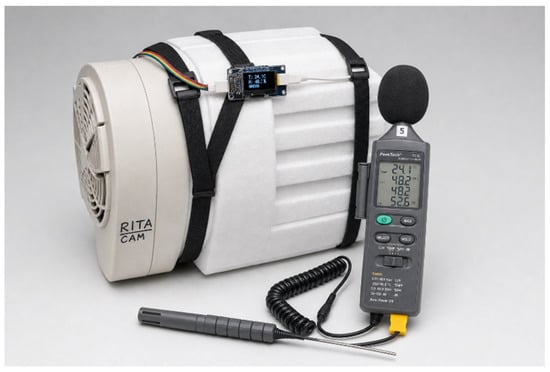
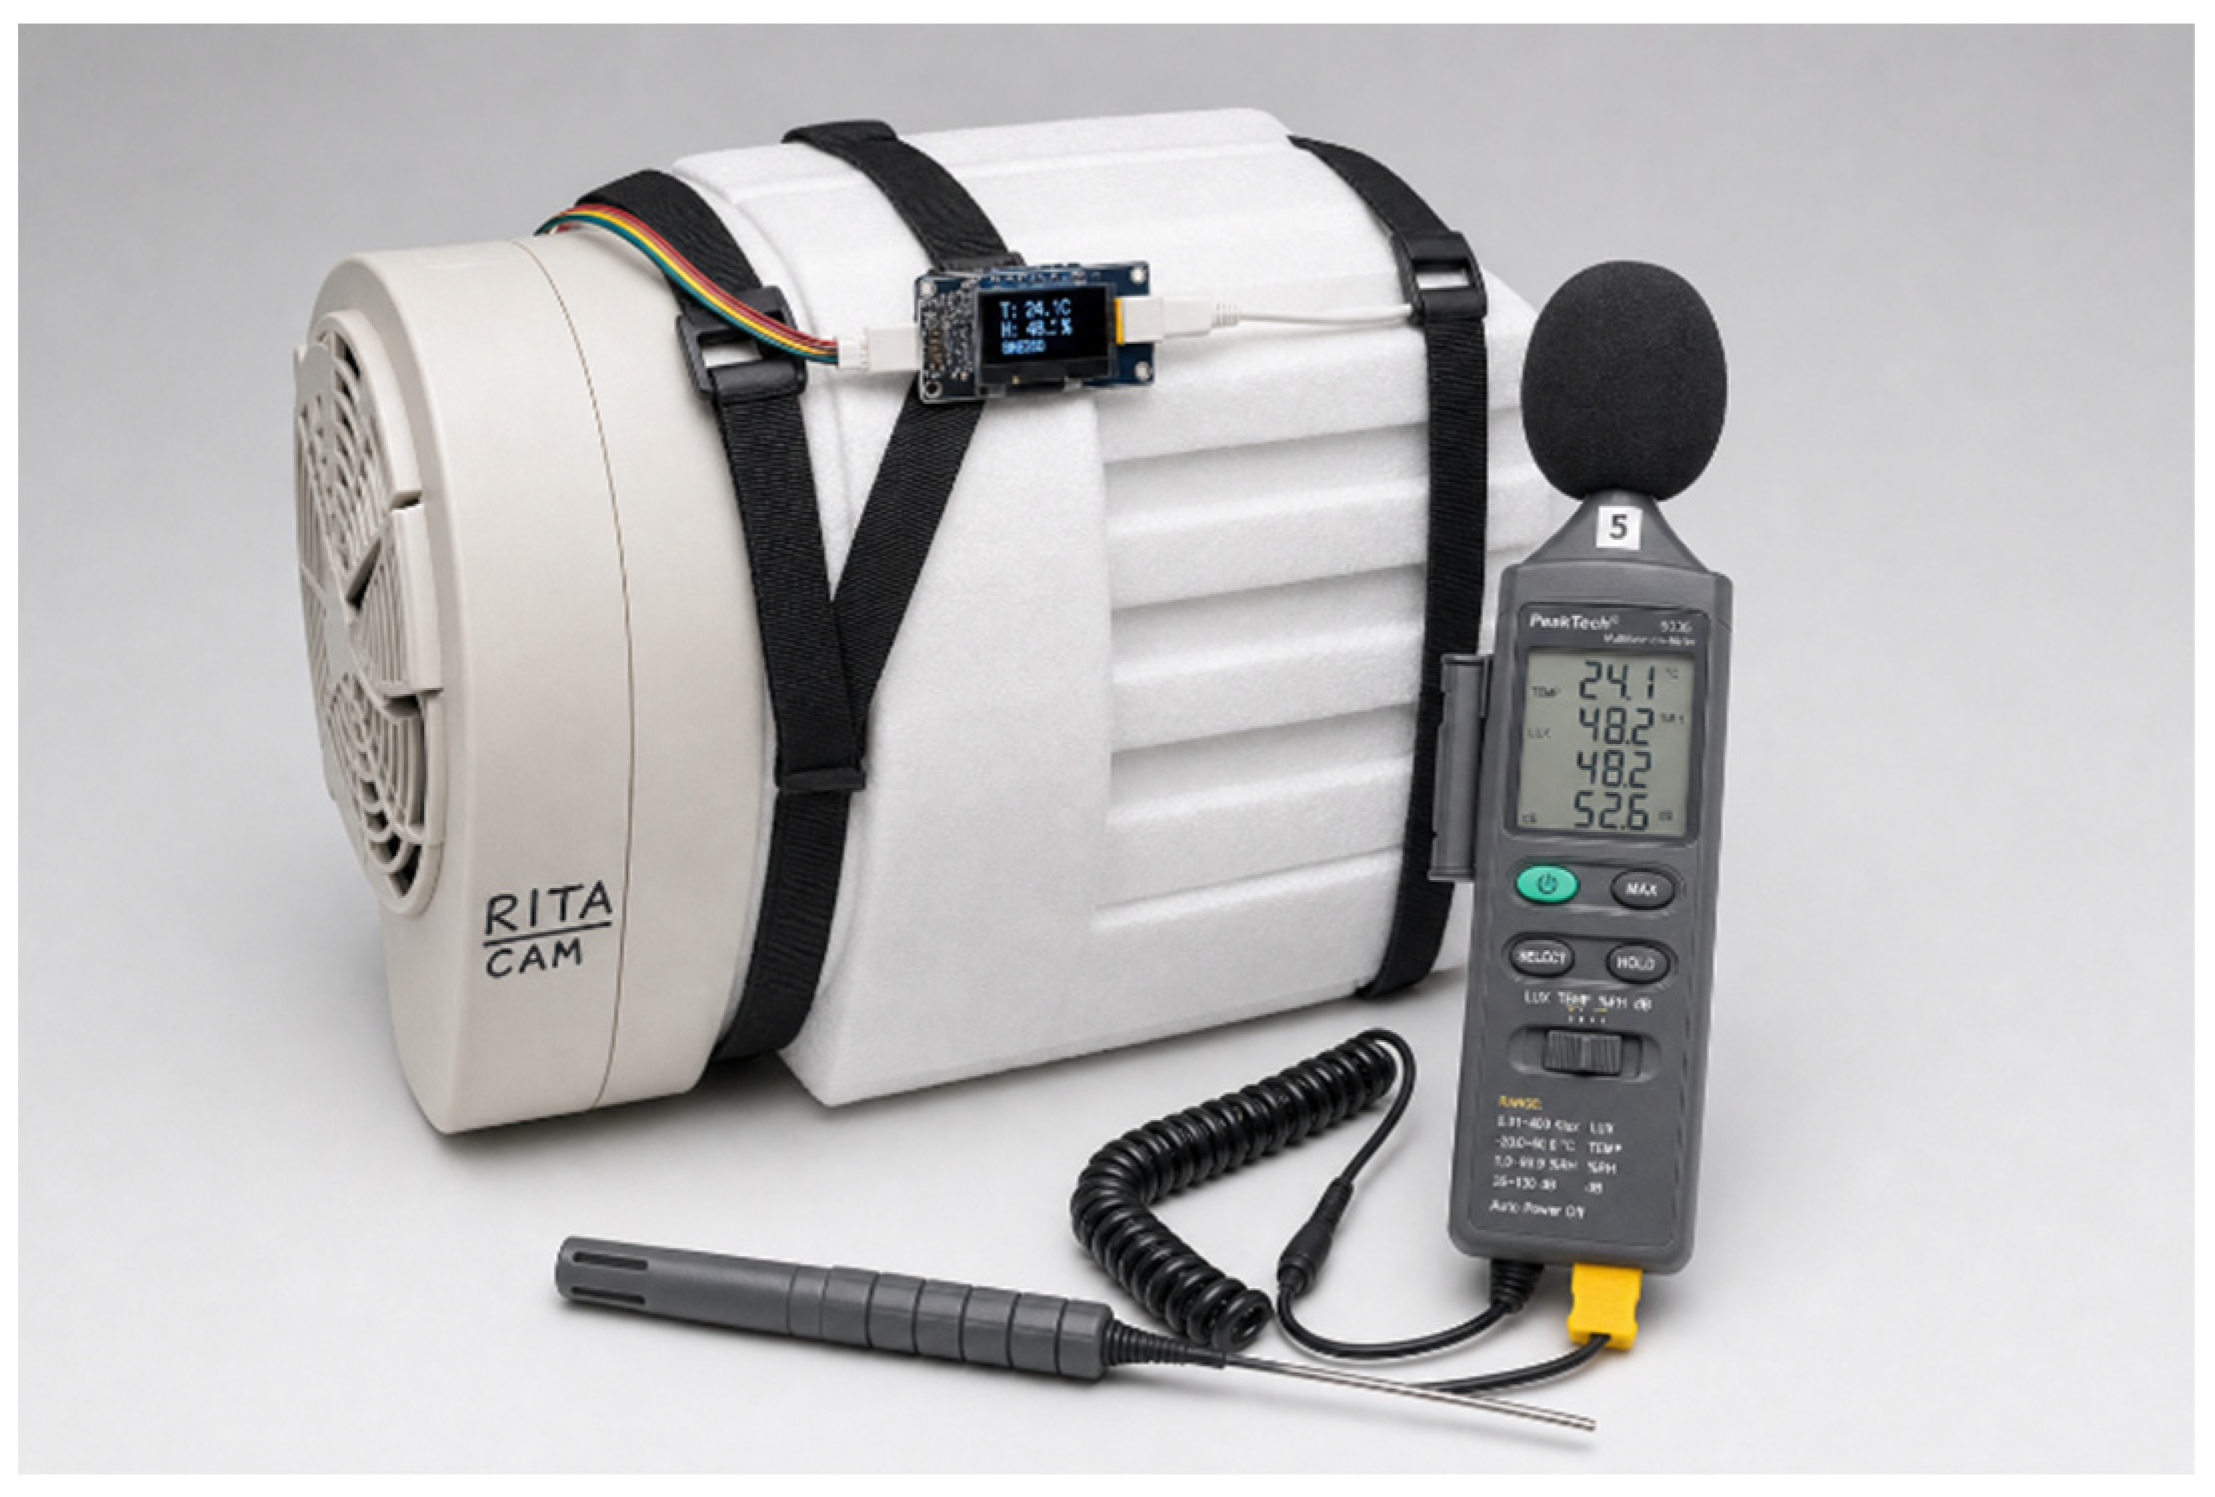
For data acquisition, the three devices were simultaneously positioned at the center of the experimental environment, as shown in Figure 7. The first measurement was taken at 20 °C, corresponding to the initial system temperature at the beginning of each session. Subsequently, the temperature gradually increased until reaching approximately 50 °C, using the combined heater–fan unit to homogenize the conditions inside the chamber.
Figure 7.
Sensor arrangement within the experimental environment. Source: Author(s).
Approximately 30 temperature and relative humidity measurements were recorded from each sensor, covering a temperature range between 20 °C and 50 °C. This procedure was repeated over three different days, while maintaining a constant sensor arrangement and consistent temperature variation ranges. Figure 8 shows the functional experimental environment during the data acquisition process.
Figure 8.
Functional experimental environment. Source: Author(s).
The acquired data were tabulated for subsequent comparative analysis, evaluating the performance and accuracy of each sensor in comparison with the PeakTech-5035 reference instrument within the controlled environment.
2.5. LoRaWAN Network Configuration
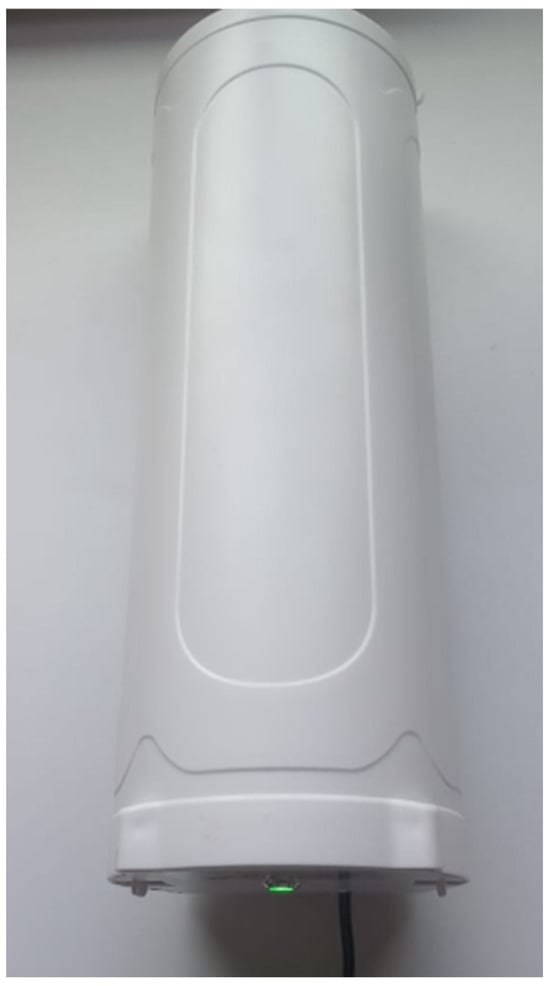
For wireless communication and data transmission, a DRAGINO DLOS8N-EC25 SX1302 gateway (Dragino Technology Co., Ltd., Shenzhen, China) was employed, provided by the research group as part of its infrastructure for rural connectivity projects. The selection of this gateway was based on its high reception sensitivity, support for multiple simultaneous channels, and compatibility with LoRa technology and LoRaWAN networks. Figure 9 shows the DRAGINO DLOS8N-EC25 SX1302 gateway used for wireless communication.
Figure 9.
DRAGINO DLOS8N-EC25 SX1302 gateway. Source: Author(s).
The implemented sensor nodes employed the Heltec WiFi LoRa 32 V3 development board, which integrates the SX1262 LoRa transceiver. According to the manufacturer specifications, the device supports transmission powers up to 21 ± 3 dBm and receiver sensitivities up to −137 dBm under high spreading factor configurations. The system operates in the US-915 MHz sub-GHz frequency band optimized for long-range low-power communication. The DRAGINO DLOS8N-EC25 SX1302 gateway supports multi-channel simultaneous reception and provides receiver sensitivities up to −139 dBm, enabling stable communication under low signal conditions and irregular terrain environments.
Table 1 summarizes the LoRa radio configuration parameters used during the propagation and deployment tests, including spreading factor (SF), bandwidth (BW), coding rate (CR), and transmission power, in order to ensure the reproducibility of the communication results presented in this work.
Table 1.
Lorawan Network configuration on TTN server.
The gateway was integrated into The Things Network (TTN) infrastructure through the registration of its unique identifiers. The device incorporates a specific Gateway ID (GWID: a84041ff22aac16), which is used by TTN to authenticate and route the LoRaWAN traffic originating from the sensor nodes. A total of seven nodes were configured to transmit information related to battery percentage (%), packet number, relative humidity (%), and temperature (°C), in order to subsequently enable webhook-based data visualization.
Figure 10 illustrates the overall system architecture, showing the data flow from the sensor nodes through the LoRaWAN gateway to The Things Network (TTN) infrastructure and the subsequent webhook integration with the visualization platform.
Figure 10.
Block diagram of the system architecture, illustrating the data flow from the sensor node (Heltec WiFi LoRa 32 V3 + AM2305B) through the LoRaWAN gateway and the TTN server to the webhook integration. Source: Author(s).
Figure 11 shows the OTAA (Over-the-Air Activation) configuration of the sensor nodes within the TTN console.
Figure 11.
OTAA configuration of the sensor nodes within The Things Network (TTN) console. Source: Author(s).
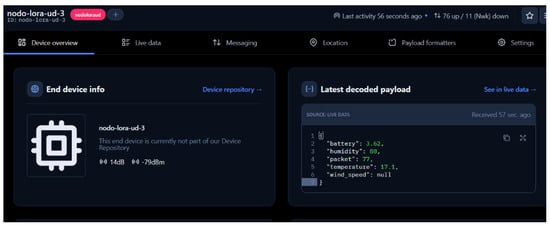
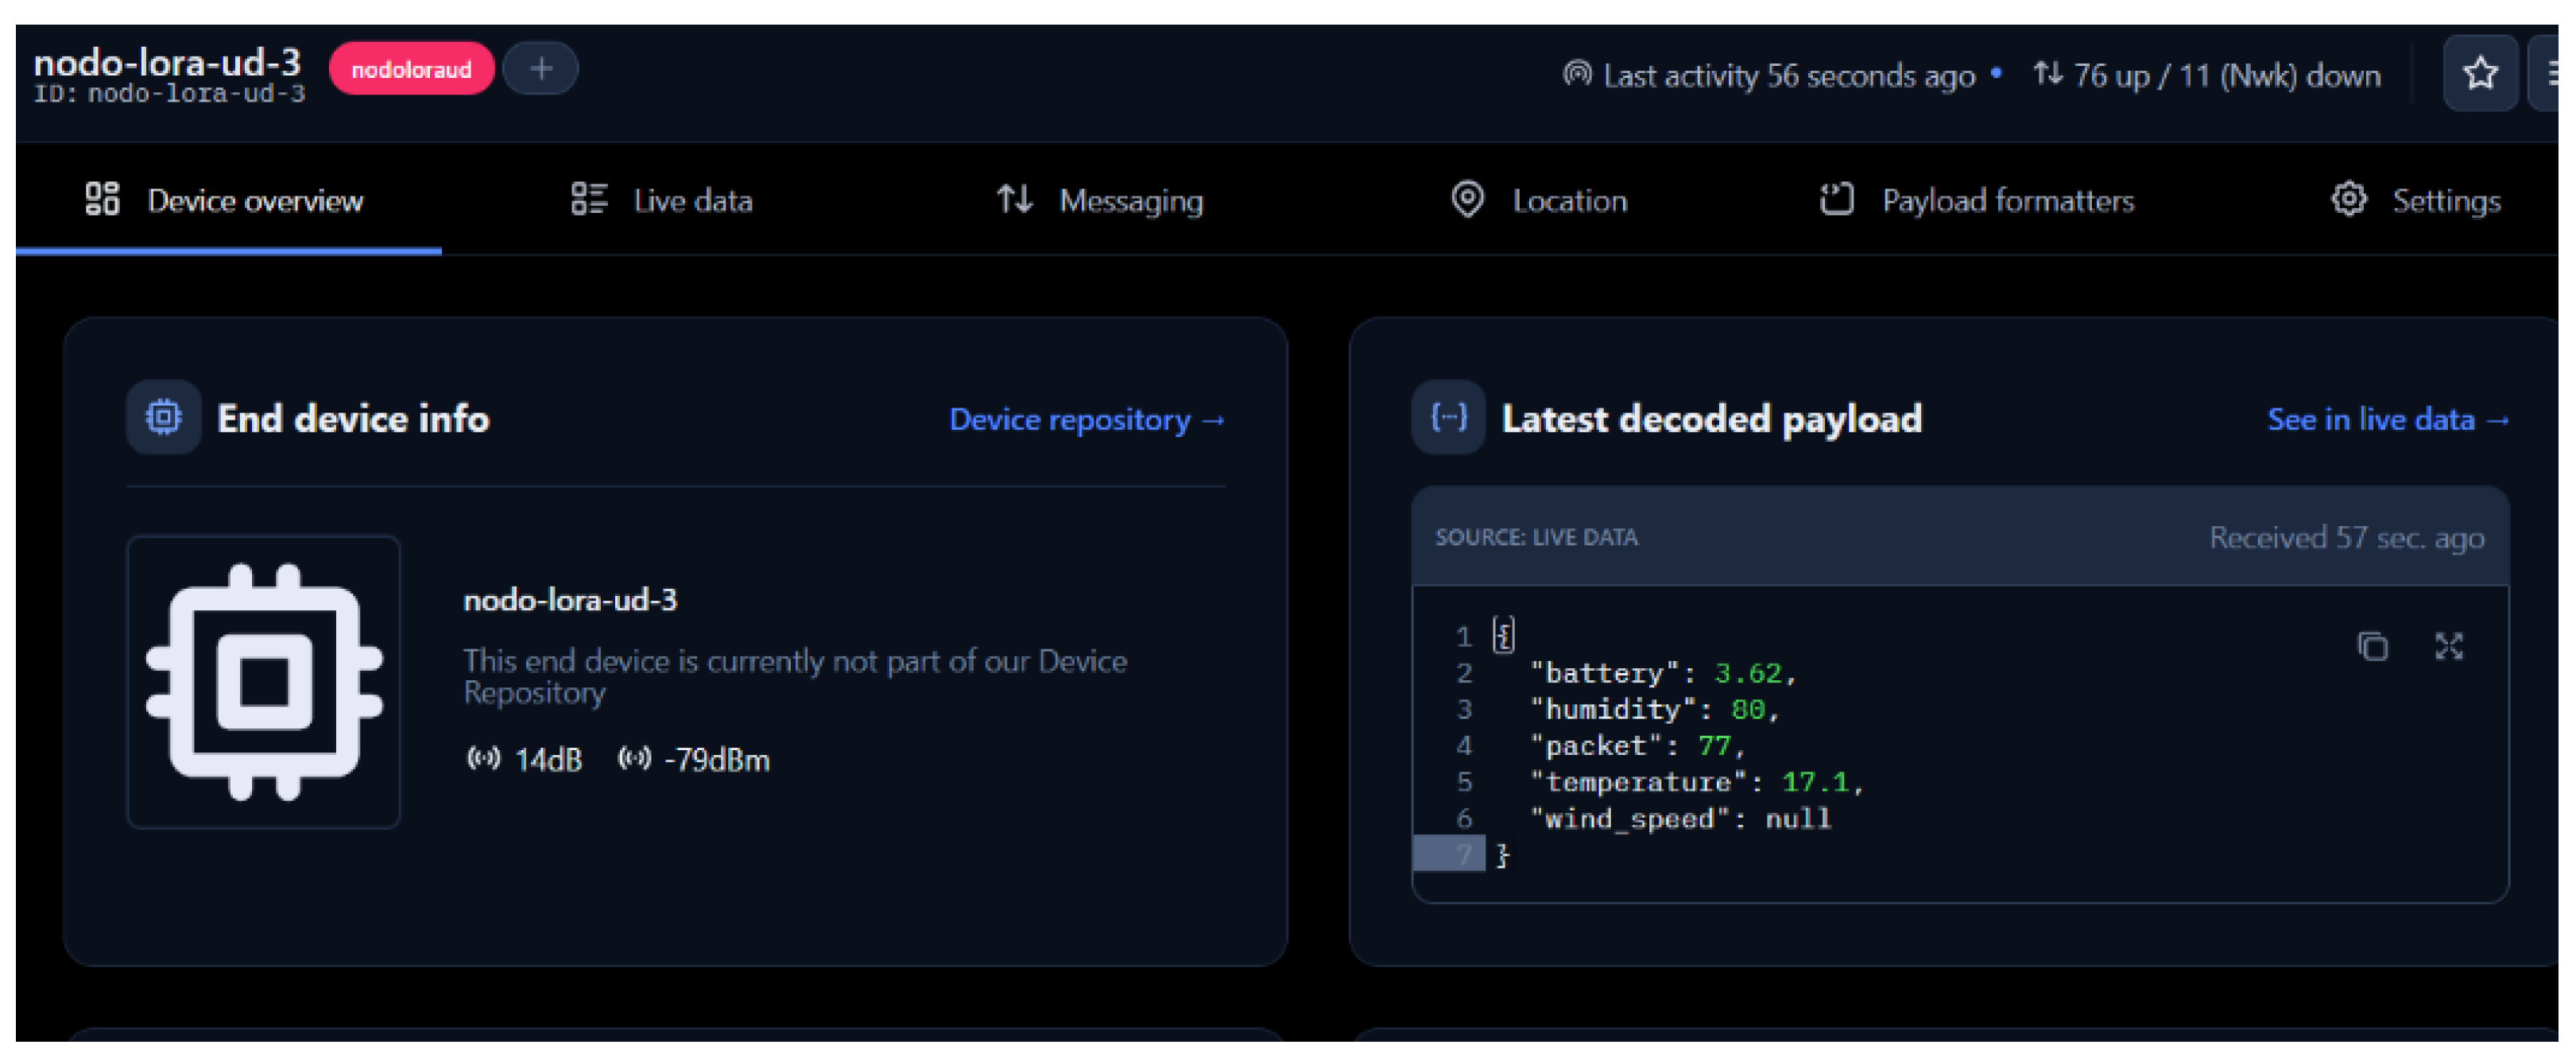
Figure 12 shows the end-device information panel, including node identification, RSSI, and SNR values, together with the latest decoded payload received through TTN.
Figure 12.
End device information panel showing node identification, RSSI, and SNR values, together with the latest decoded payload received through The Things Network (TTN). Source: Author(s).
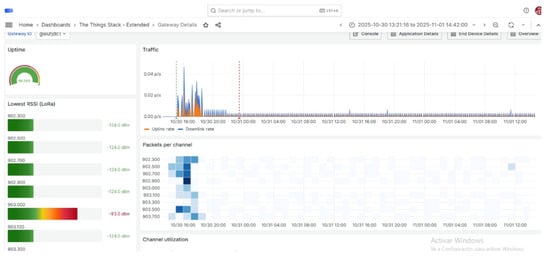
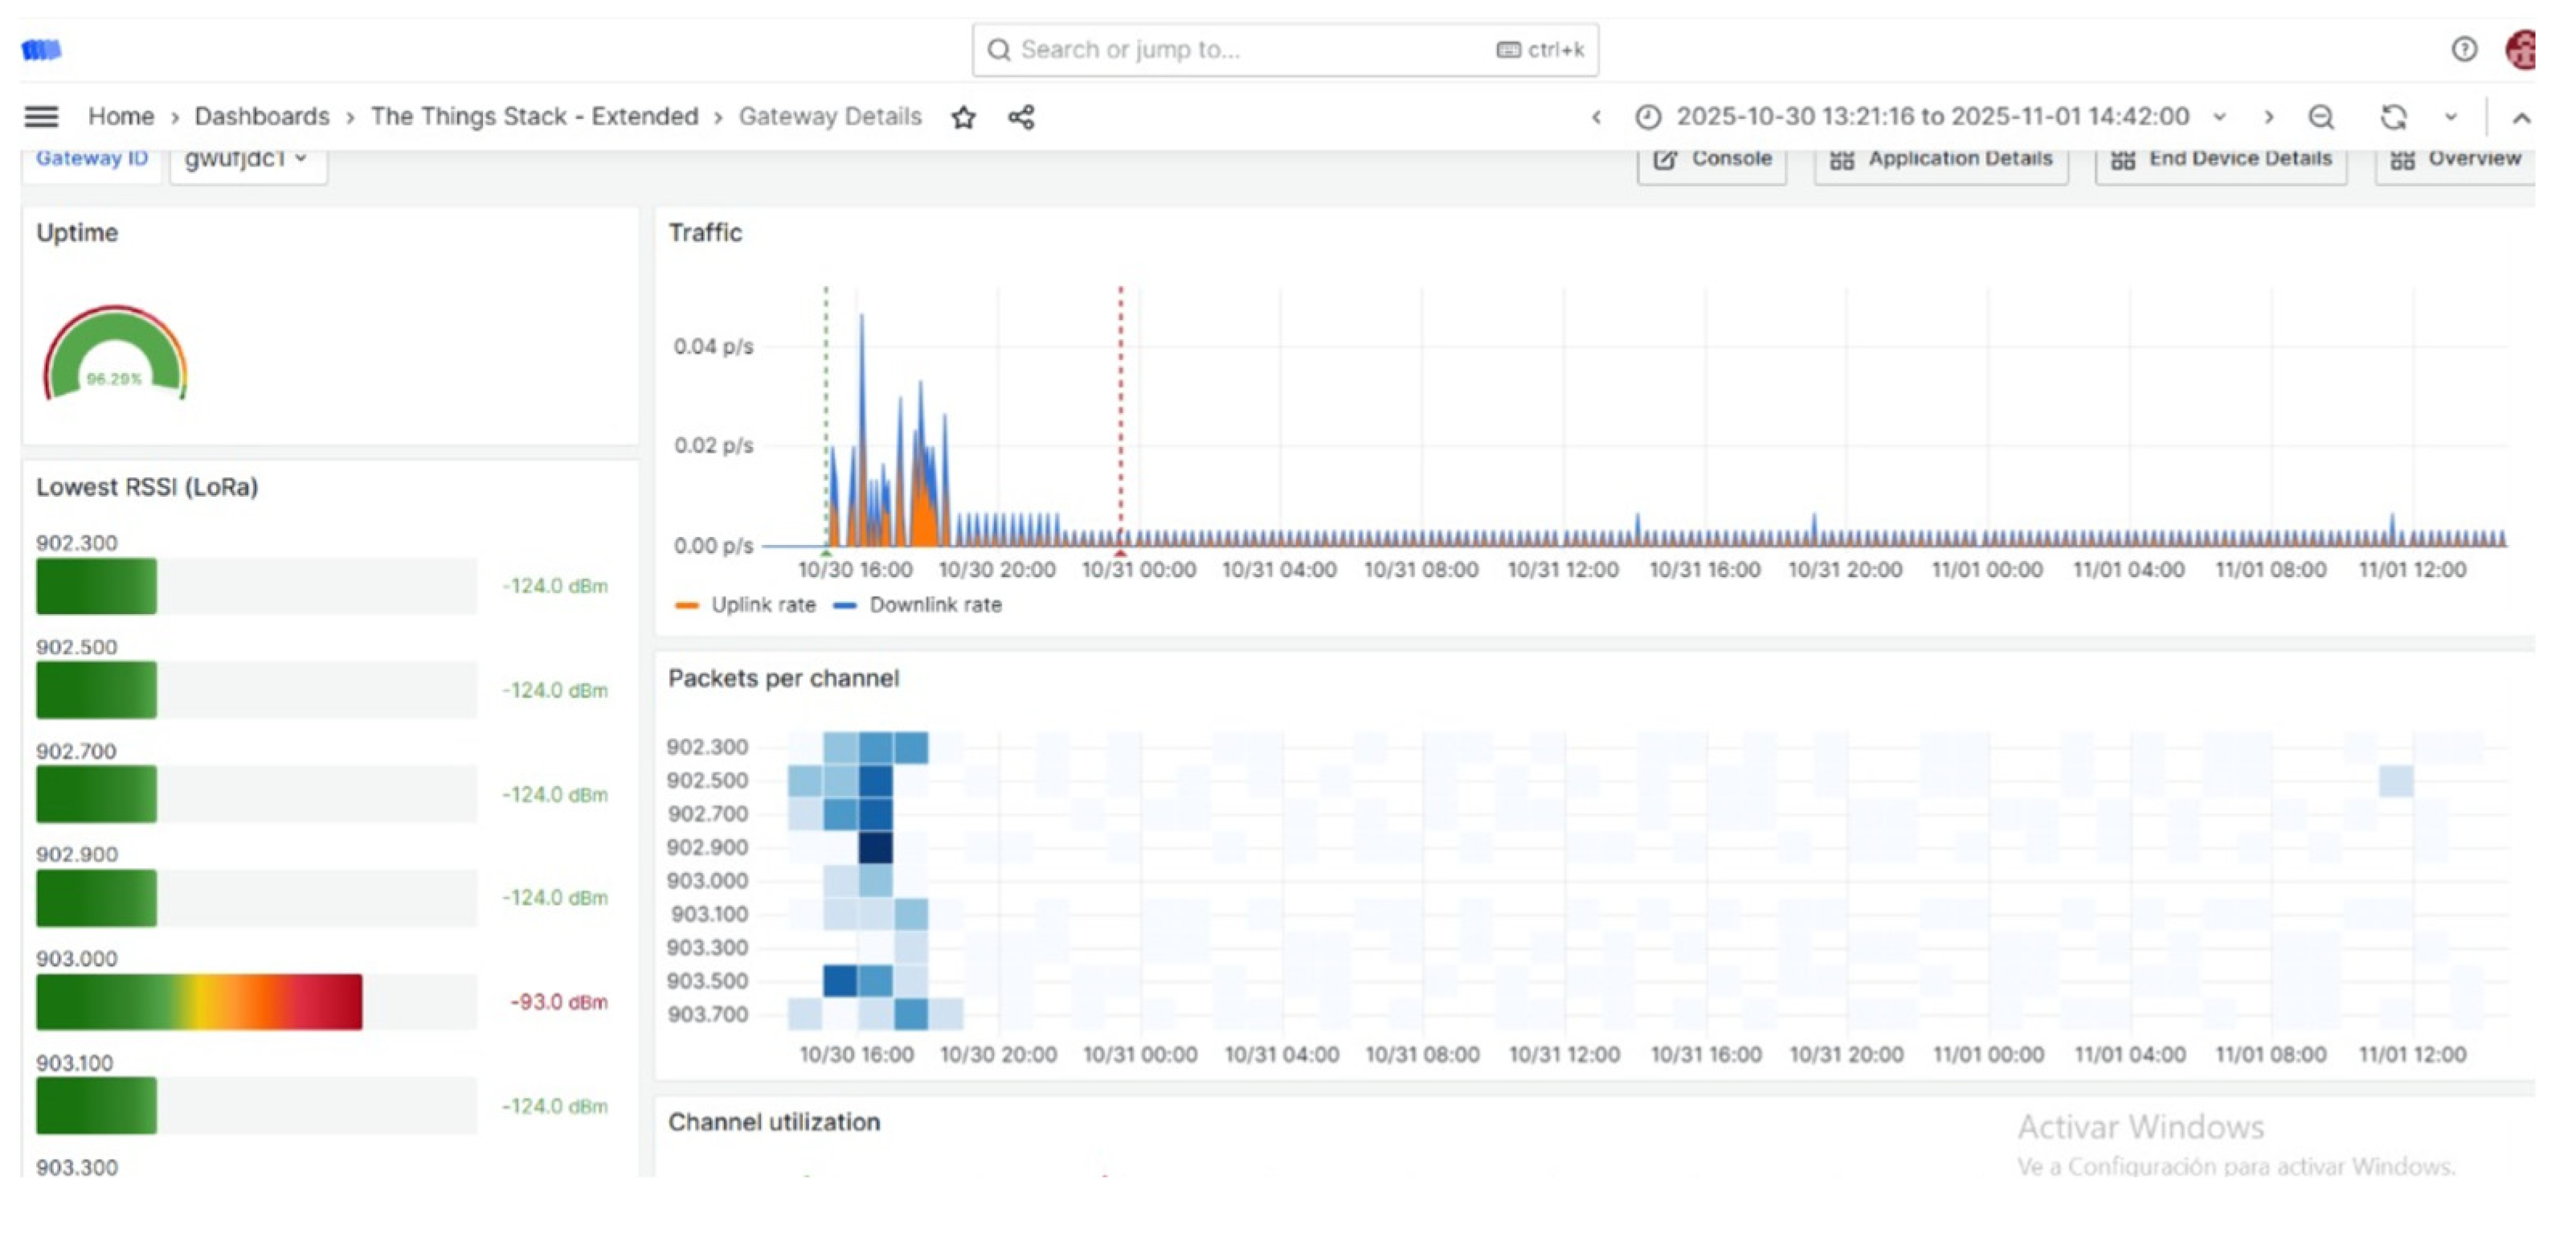
Figure 13 shows an example of successful data transmission received through the TTN webhook integration.
Figure 13.
Gateway dashboard on The Things Stack showing uptime, lowest RSSI per channel, traffic, and packets per channel, confirming successful data transmission.
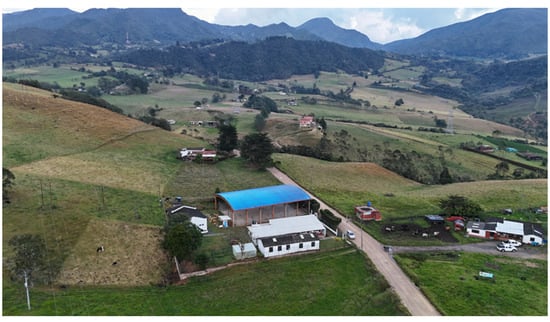
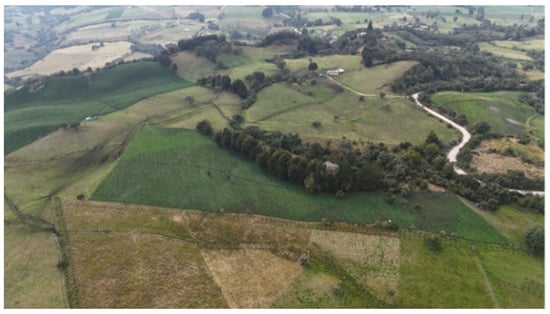
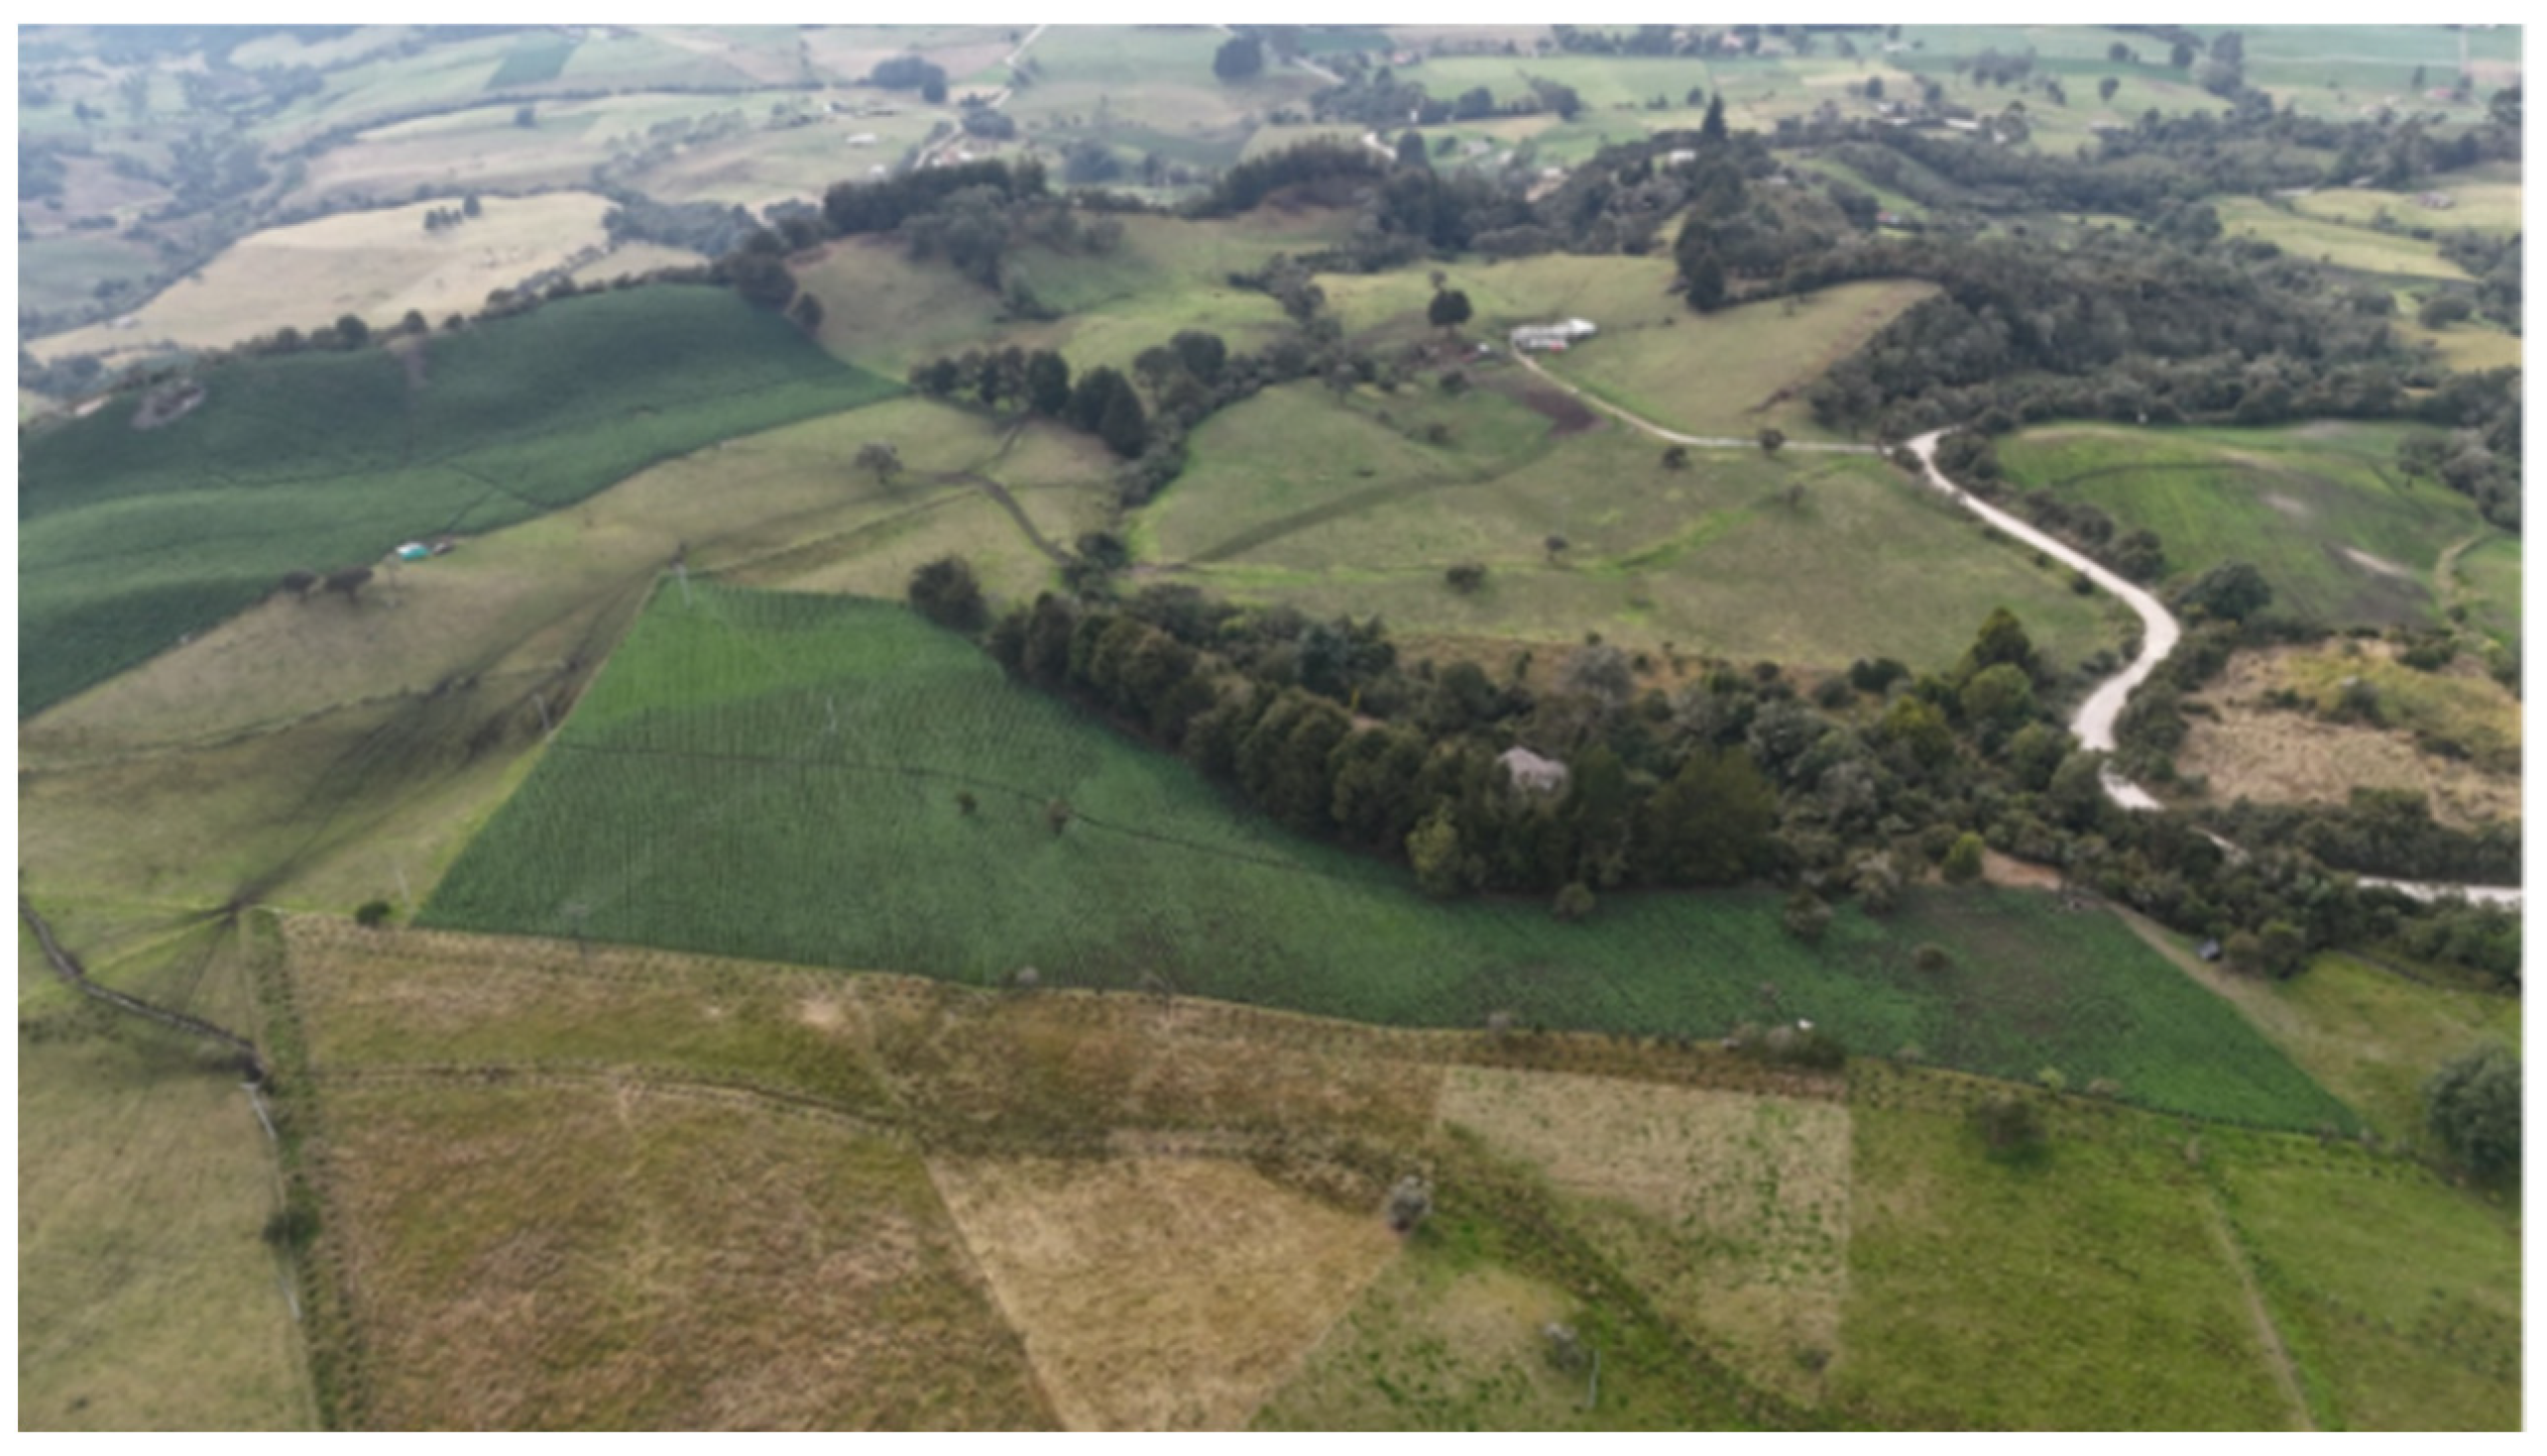
The LoRaWAN infrastructure employed in this work follows the communication principles defined by The Things Network architecture, where gateways operate as transparent bridges between sensor nodes and cloud services [14]. This approach facilitates bidirectional communication, scalable deployment, and interoperability among low-power IoT devices commonly used in smart agriculture applications. Furthermore, the adopted communication scheme is consistent with standard LoRaWAN security and architectural mechanisms described in recent studies focused on LPWAN infrastructures and IoT-based environmental monitoring systems [19]. Figure 14 shows an aerial view of the study area in La Calera, captured using an unmanned aerial vehicle (UAV), indicating the location of the Buenos Aires rural school where the Gateway was installed.
Figure 14.
Aerial view of the study area in La Calera obtained using an unmanned aerial vehicle (UAV), showing the location of the Buenos Aires rural school where the LoRaWAN Gateway was installed. Source: Author(s).
2.6. Field Deployment
The complete deployment of the environmental monitoring system was carried out according to the distribution previously defined during the design stage. Four sensor nodes were installed at different locations within the potato crop located in La Calera, Cundinamarca, while the LoRaWAN Gateway was strategically positioned at the Buenos Aires rural school in order to guarantee wireless coverage over the study area. Each node location was defined using previously established geographic coordinates and validated directly in the field during deployment. Figure 15 shows the geographic distribution of the Gateway in La Calera obtained from satellite imagery.
Figure 15.
Geographic distribution of the Gateway in La Calera obtained from satellite imagery. The figure illustrates coverage distribution and terrain conditions relevant to wireless communication performance. Source: Author(s).
Table 2 presents the geographic coordinates, elevation profile, and distance to the Gateway for each sensor node deployed in La Calera.
Table 2.
Geographic location, elevation profile, and installation characteristics of the deployed sensor nodes in La Calera.
The obtained elevation profiles revealed the presence of irregular terrain conditions and intermediate topographic obstacles between the Gateway and some sensor nodes. A line-of-sight (LoS) analysis was conducted between the deployed sensor nodes and the Gateway considering terrain elevation, separation distance, and the presence of physical obstacles that could affect signal propagation. The study area presented a moderate topographic elevation between the Gateway position and the crop area, introducing partial obstruction conditions along the propagation path. Geographic visualization tools and elevation profile analysis were employed to identify possible attenuation zones and evaluate communication feasibility under real deployment conditions. Despite the presence of terrain irregularities and natural obstacles, the communication tests demonstrated stable connectivity within distances between approximately 1.6 km and 1.7 km, remaining within the operational capabilities of LoRaWAN technology for rural environments. Figure 16 shows the aerial line-of-sight (LoS) analysis between the Gateway and the potato crop deployment area.
Figure 16.
Aerial line-of-sight (LoS) analysis between the LoRaWAN Gateway and the potato crop deployment area. The image allows visualization of terrain elevations and natural obstacles affecting wireless signal propagation. Source: Author(s).
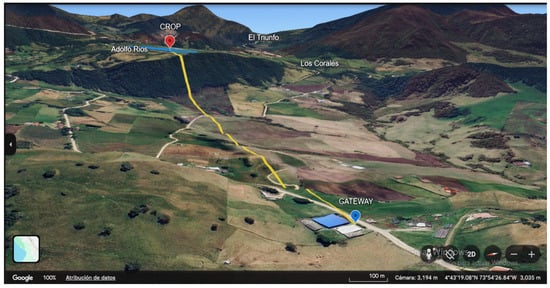
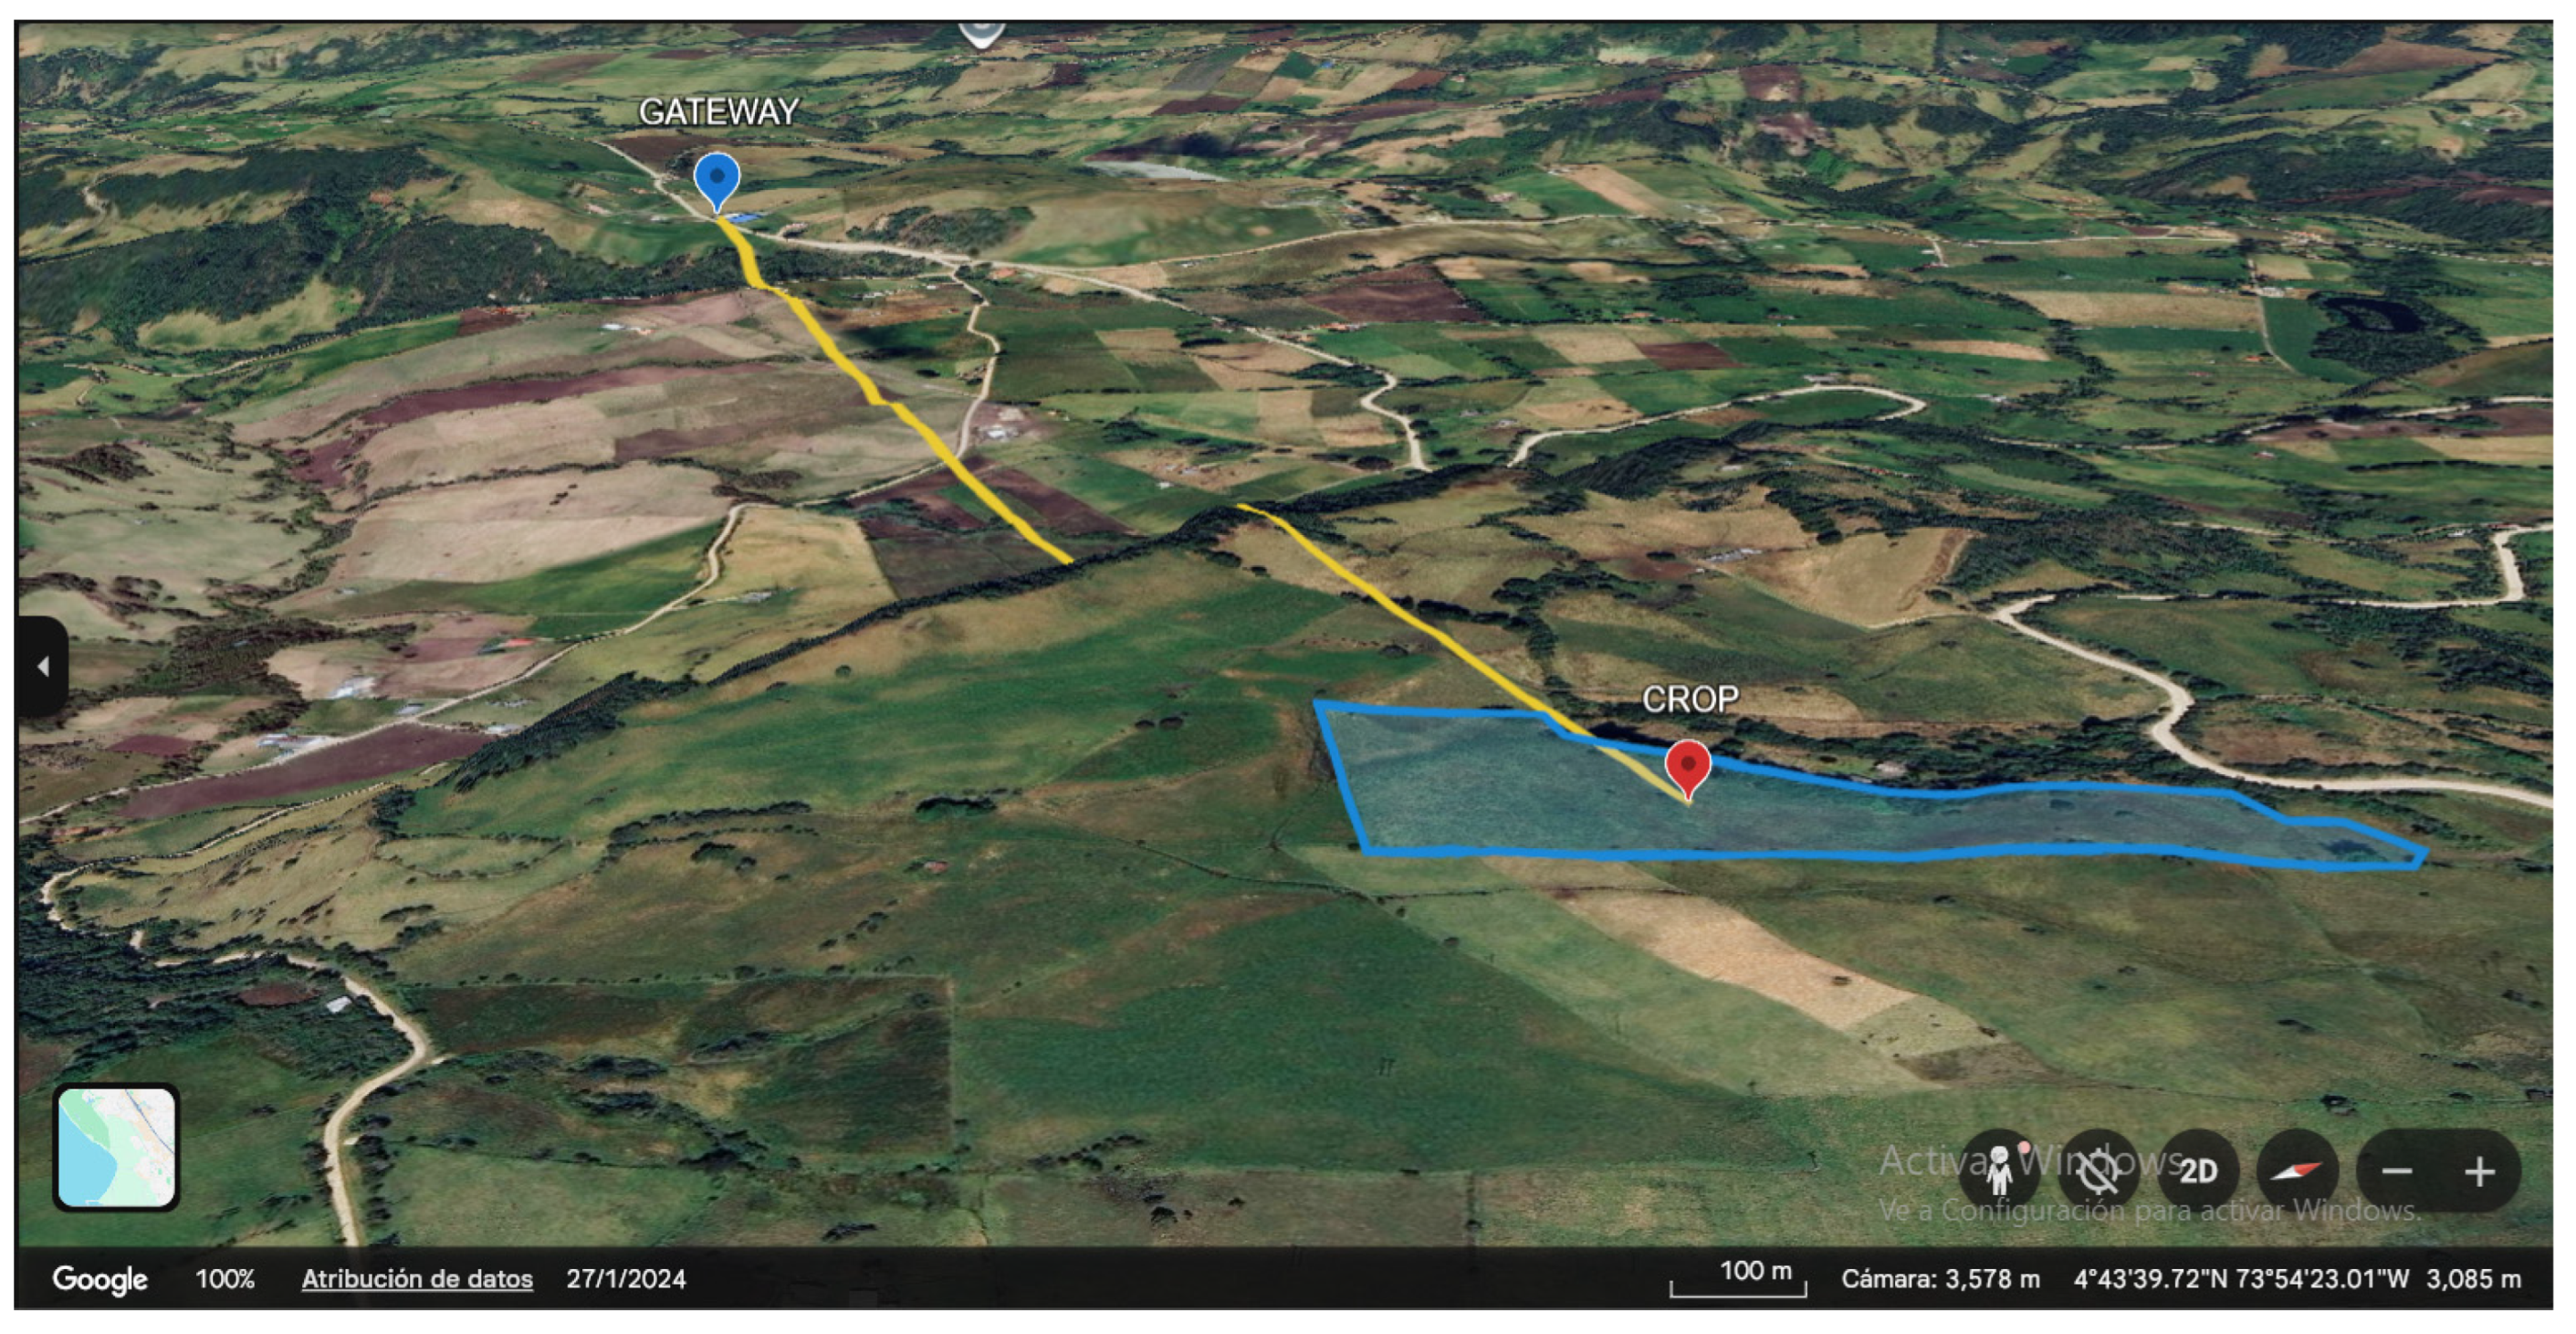
Figure 17 shows a three-dimensional visualization of the LoRaWAN propagation path between the crop area and the Gateway, obtained using Google Earth.
Figure 17.
Three-dimensional visualization of the LoRaWAN propagation path between the crop area and the Gateway obtained using Google Earth. The figure illustrates terrain variations and their potential influence on signal attenuation. Source: Author(s).
Table 3 presents the geographic coordinates, elevation profile, and distance to the Gateway for the sensor nodes deployed in Turmequé, Boyacá.
Table 3.
Geographic location, elevation profile, and installation characteristics of the deployed sensor nodes in Turmequé.
The field tests conducted in Turmequé, Boyacá, allowed the validation of the proposed LoRaWAN communication infrastructure under real rural deployment conditions. Sensor nodes were installed at different locations and distances from the Gateway in order to evaluate signal propagation, elevation effects, and communication stability in open-field agricultural environments. The elevation profile analysis revealed moderate terrain variations between the nodes and the Gateway; however, the measured RSSI and SNR values confirmed the feasibility of reliable long-range wireless communication at distances close to 1 km, demonstrating the suitability of the proposed architecture for precision agriculture scenarios in rural areas with irregular topography.
2.7. Urban Propagation Test
To evaluate signal propagation under dense urban conditions, a complementary test was conducted within the Engineering Faculty facilities of Universidad Distrital Francisco José de Caldas. The gateway was installed on the seventh floor near the spiral staircase area, while a sensor node configured as a test device transmitted LoRaWAN packets while moving through different indoor and outdoor locations around the university campus.
Measurement points were selected to represent a systematic range of propagation conditions: outdoor line-of-sight locations at street level, mixed outdoor/indoor transition zones at building entrances, and fully indoor vertical profiles through stairwells and corridors from floors 2 to 6. This structured selection allows the characterization of signal behavior across three representative environments: open urban, building-entry, and deep indoor, enabling a structured comparison rather than an arbitrary sampling.
Wireless link quality was evaluated through the Received Signal Strength Indicator (RSSI) and Signal-to-Noise Ratio (SNR), parameters commonly used to characterize communication reliability and propagation quality in LPWAN systems [20,21].
3. Results
The measurements obtained from the AM2305B and DHT11 sensors were compared with the PeakTech-5035 reference instrument under controlled environmental conditions. The experiments were conducted over three independent testing days covering a temperature range between 20 °C and 50 °C and relative humidity variations between approximately 70% RH and 20% RH.
Table 4 presents the experimental measurements collected during the first testing day using the PeakTech-5035, AM2305B, and DHT11 sensors.
Table 4.
Experimental records of temperature and relative humidity obtained on day one using the PeakTech-5035, AM2305B, and DHT11 sensors.
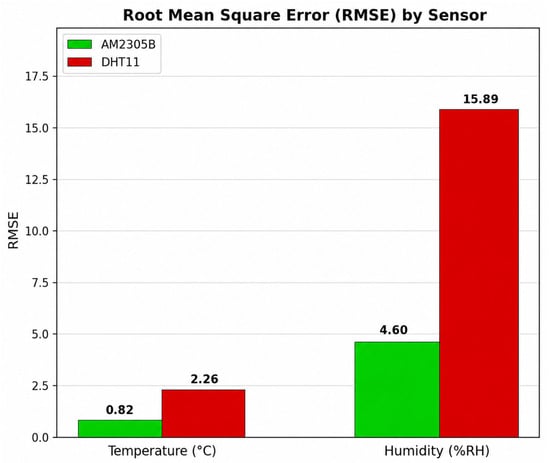
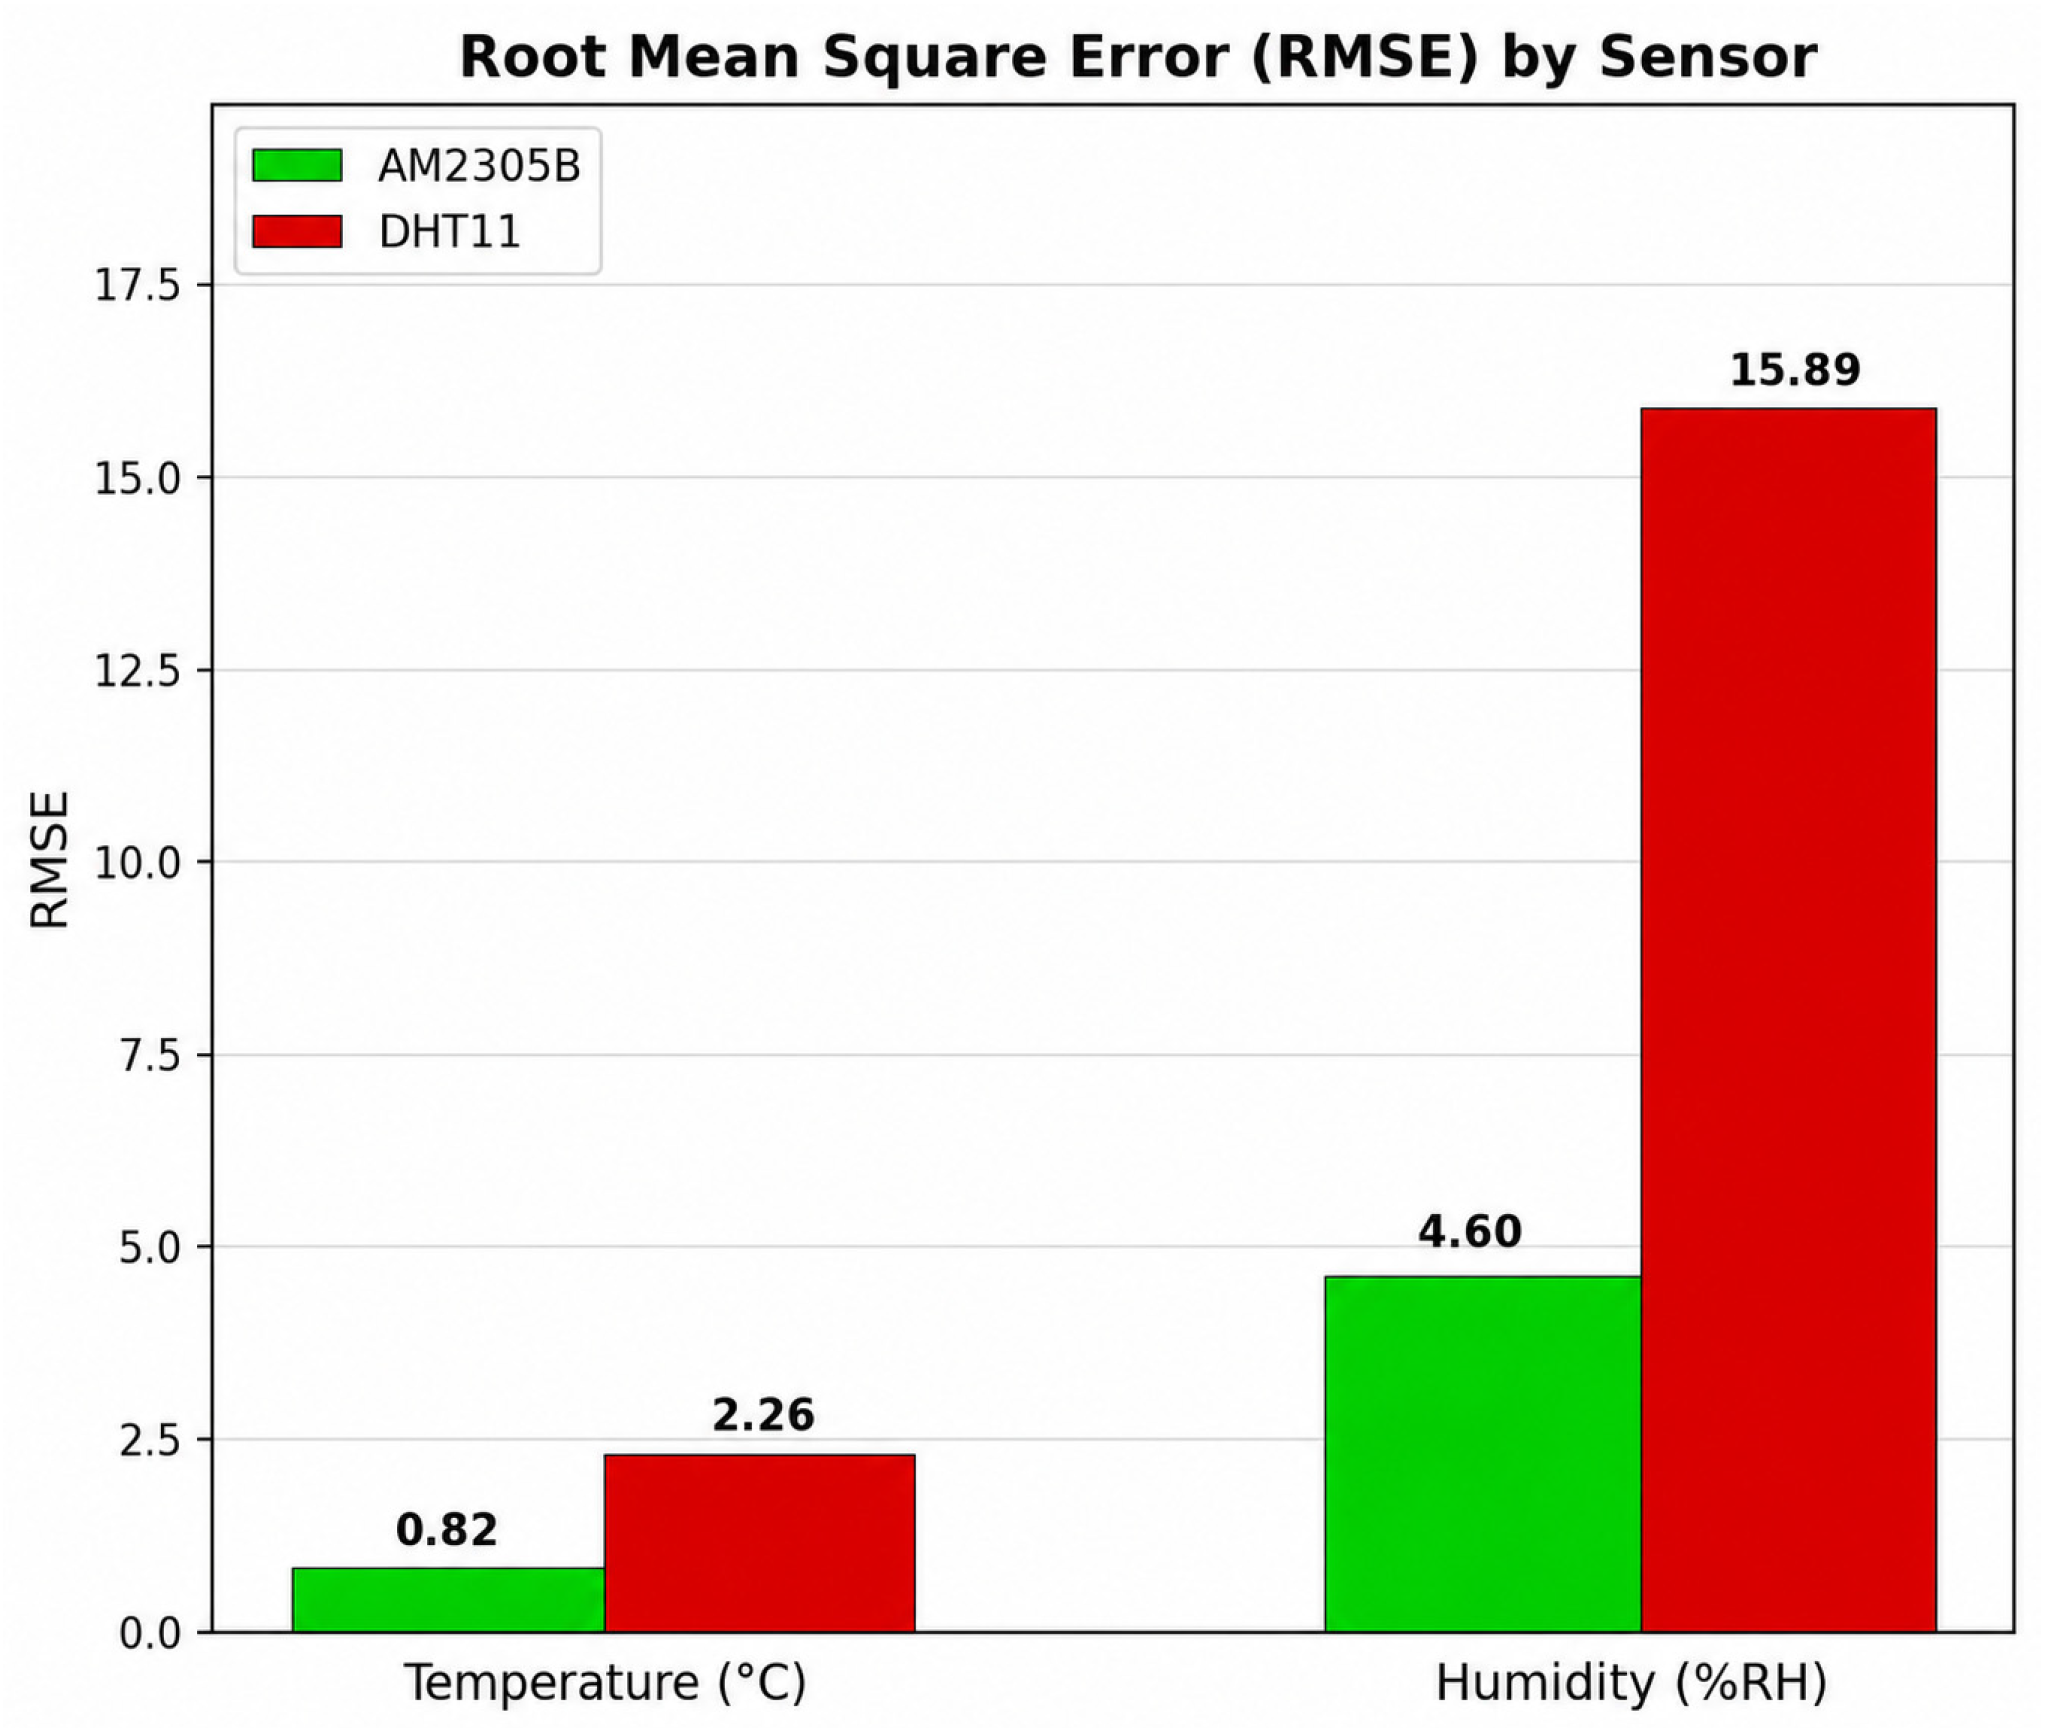
During the first experimental session, the AM2305B sensor exhibited strong agreement with the PeakTech-5035 reference instrument for both temperature and relative humidity measurements. The average deviations remained within ±1 °C and ±5% RH, respectively. Statistical analysis yielded a Pearson correlation coefficient of r = 0.99 for temperature and r = 0.96 for relative humidity. Additionally, the Root Mean Square Error (RMSE) values were 0.82 °C and 4.6% RH.
In contrast, the DHT11 sensor showed lower measurement stability, particularly for relative humidity measurements, where the RMSE reached 15.89% RH. For temperature measurements, the DHT11 presented an RMSE of 2.26 °C under high-temperature conditions, indicating reduced accuracy and slower response under rapid environmental variations.
Table 5 summarizes the measurements obtained during the second experimental session using the AM2305B sensor and the PeakTech-5035 reference instrument.
Table 5.
Experimental records of temperature and relative humidity obtained on day two using the PeakTech-5035 and AM2305B sensors.
The results obtained during the second testing day confirmed the stability and repeatability of the AM2305B sensor. The Pearson correlation coefficient reached r = 0.98 for temperature and r = 0.96 for relative humidity. Furthermore, the RMSE values remained low, with 0.6 °C for temperature and 5.58% RH for humidity measurements.
Table 6 presents the measurements recorded during the third testing day.
Table 6.
Experimental records of temperature and relative humidity obtained on day three using the PeakTech-5035 and AM2305B sensors.
During the third experimental session, the AM2305B sensor once again demonstrated strong agreement with the reference instrument. The Pearson correlation coefficients were r = 0.99 for temperature and r = 0.978 for relative humidity. The obtained RMSE values were 0.48 °C and 6.87% RH, respectively, confirming the sensor’s stability and measurement consistency under thermal variations between 20 °C and 50 °C.
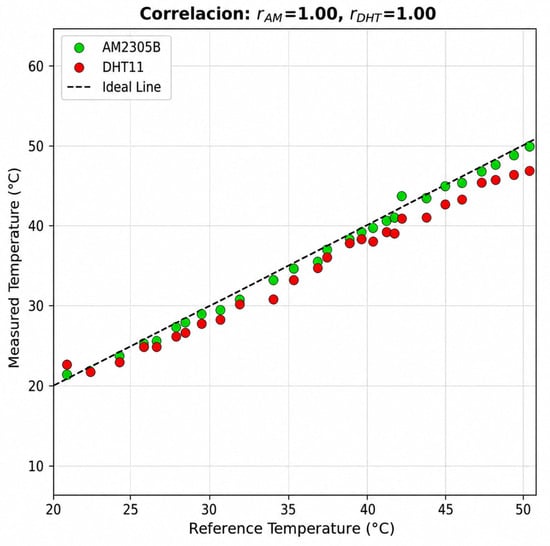
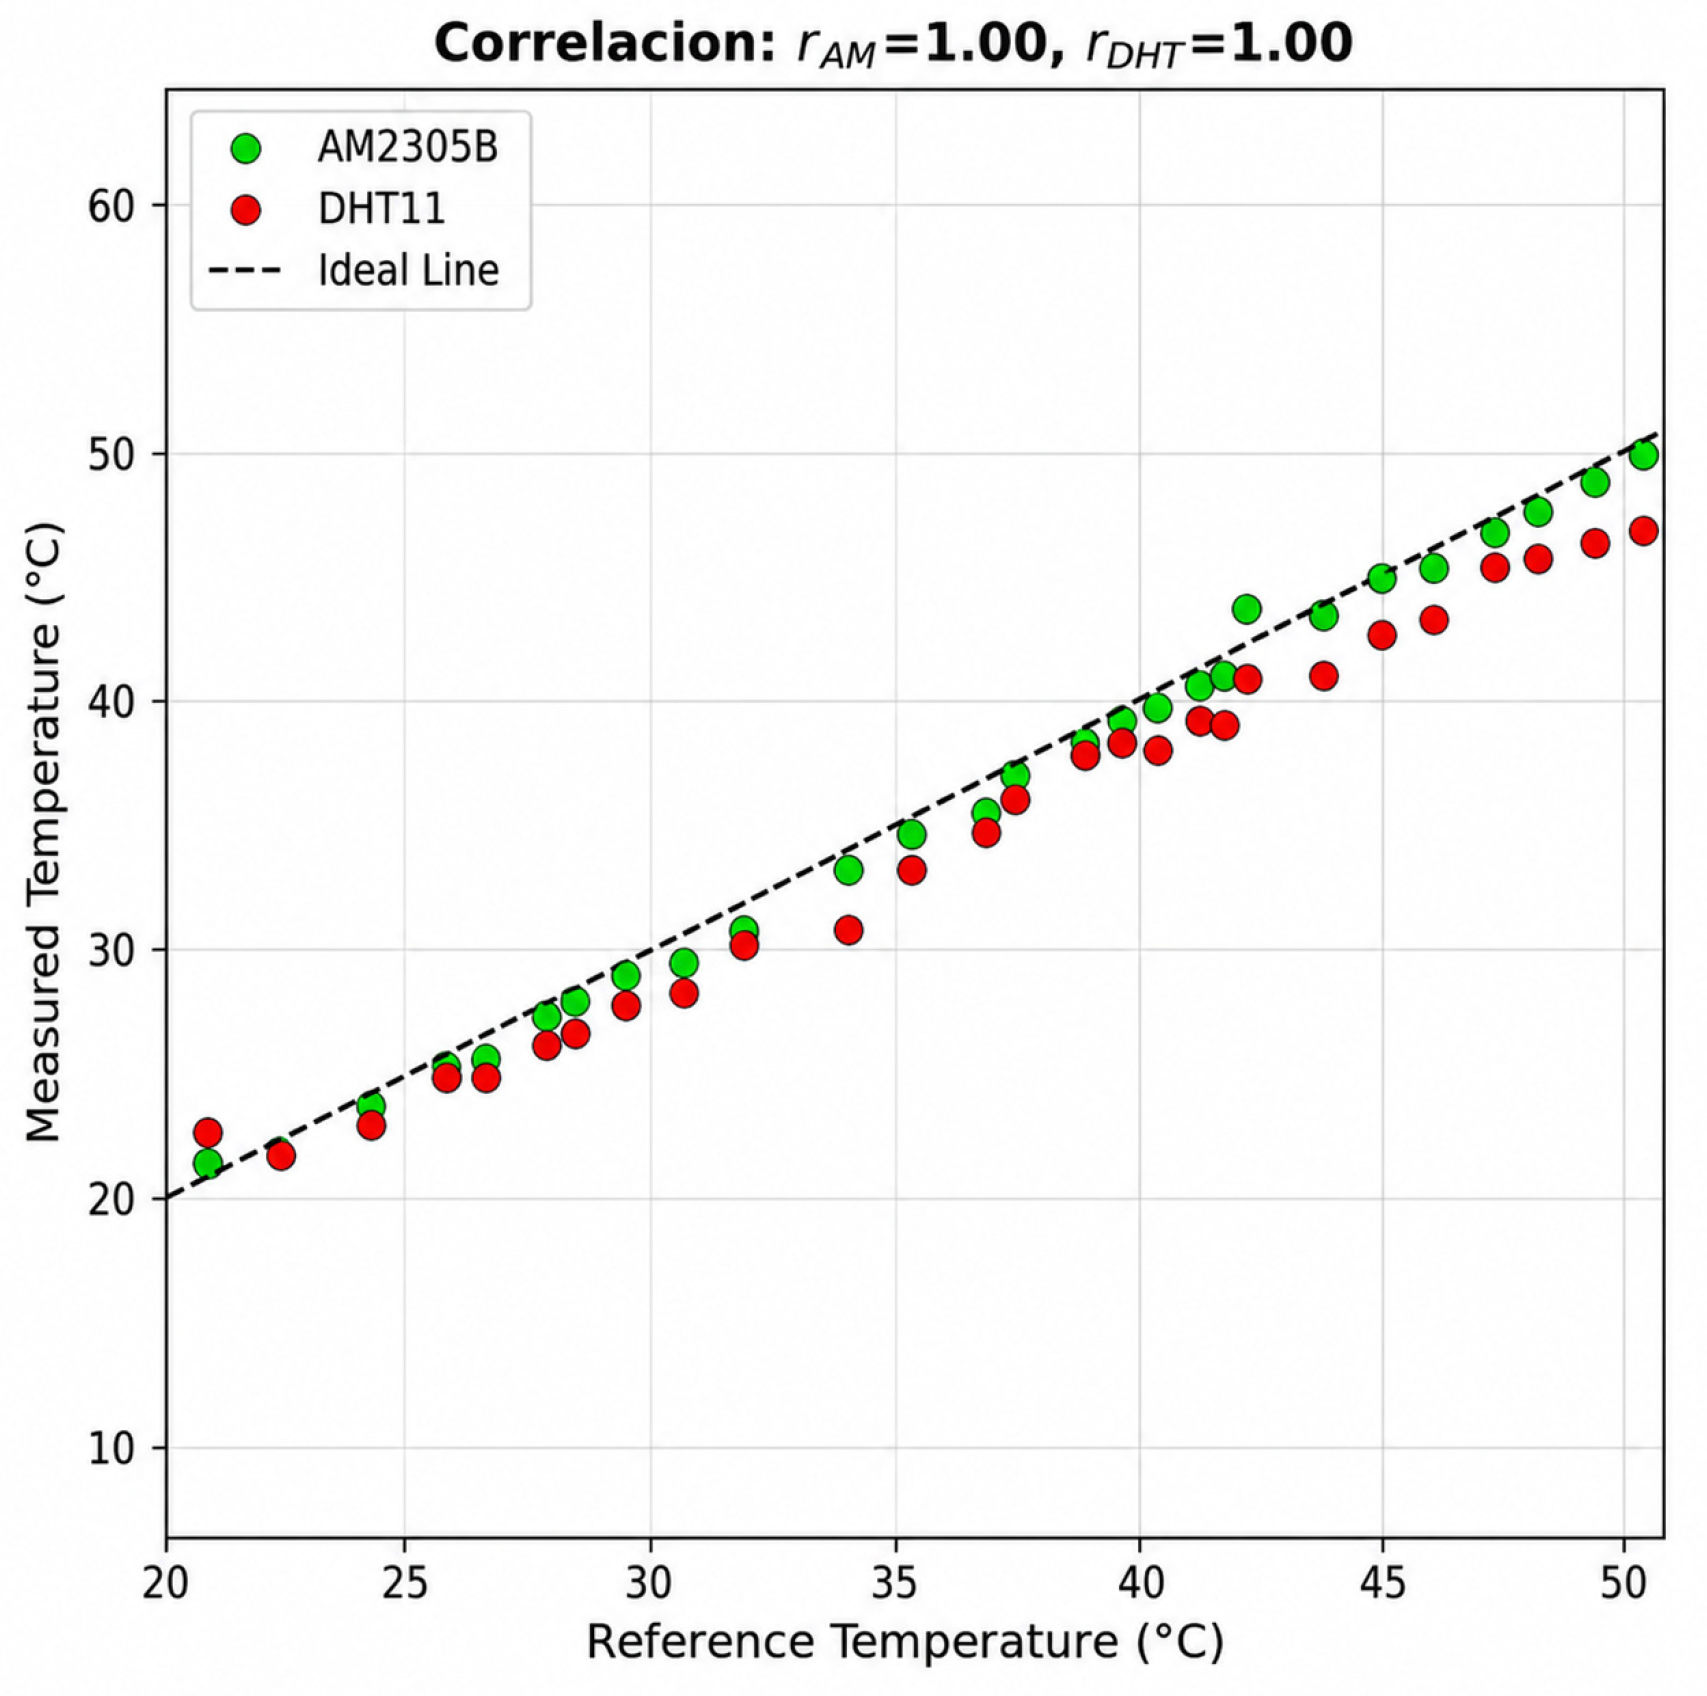
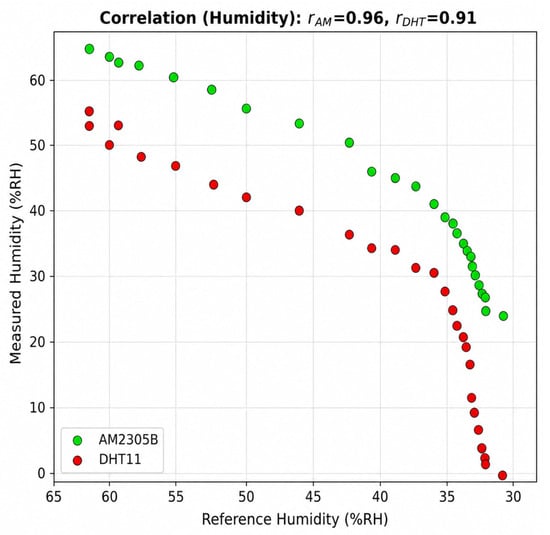
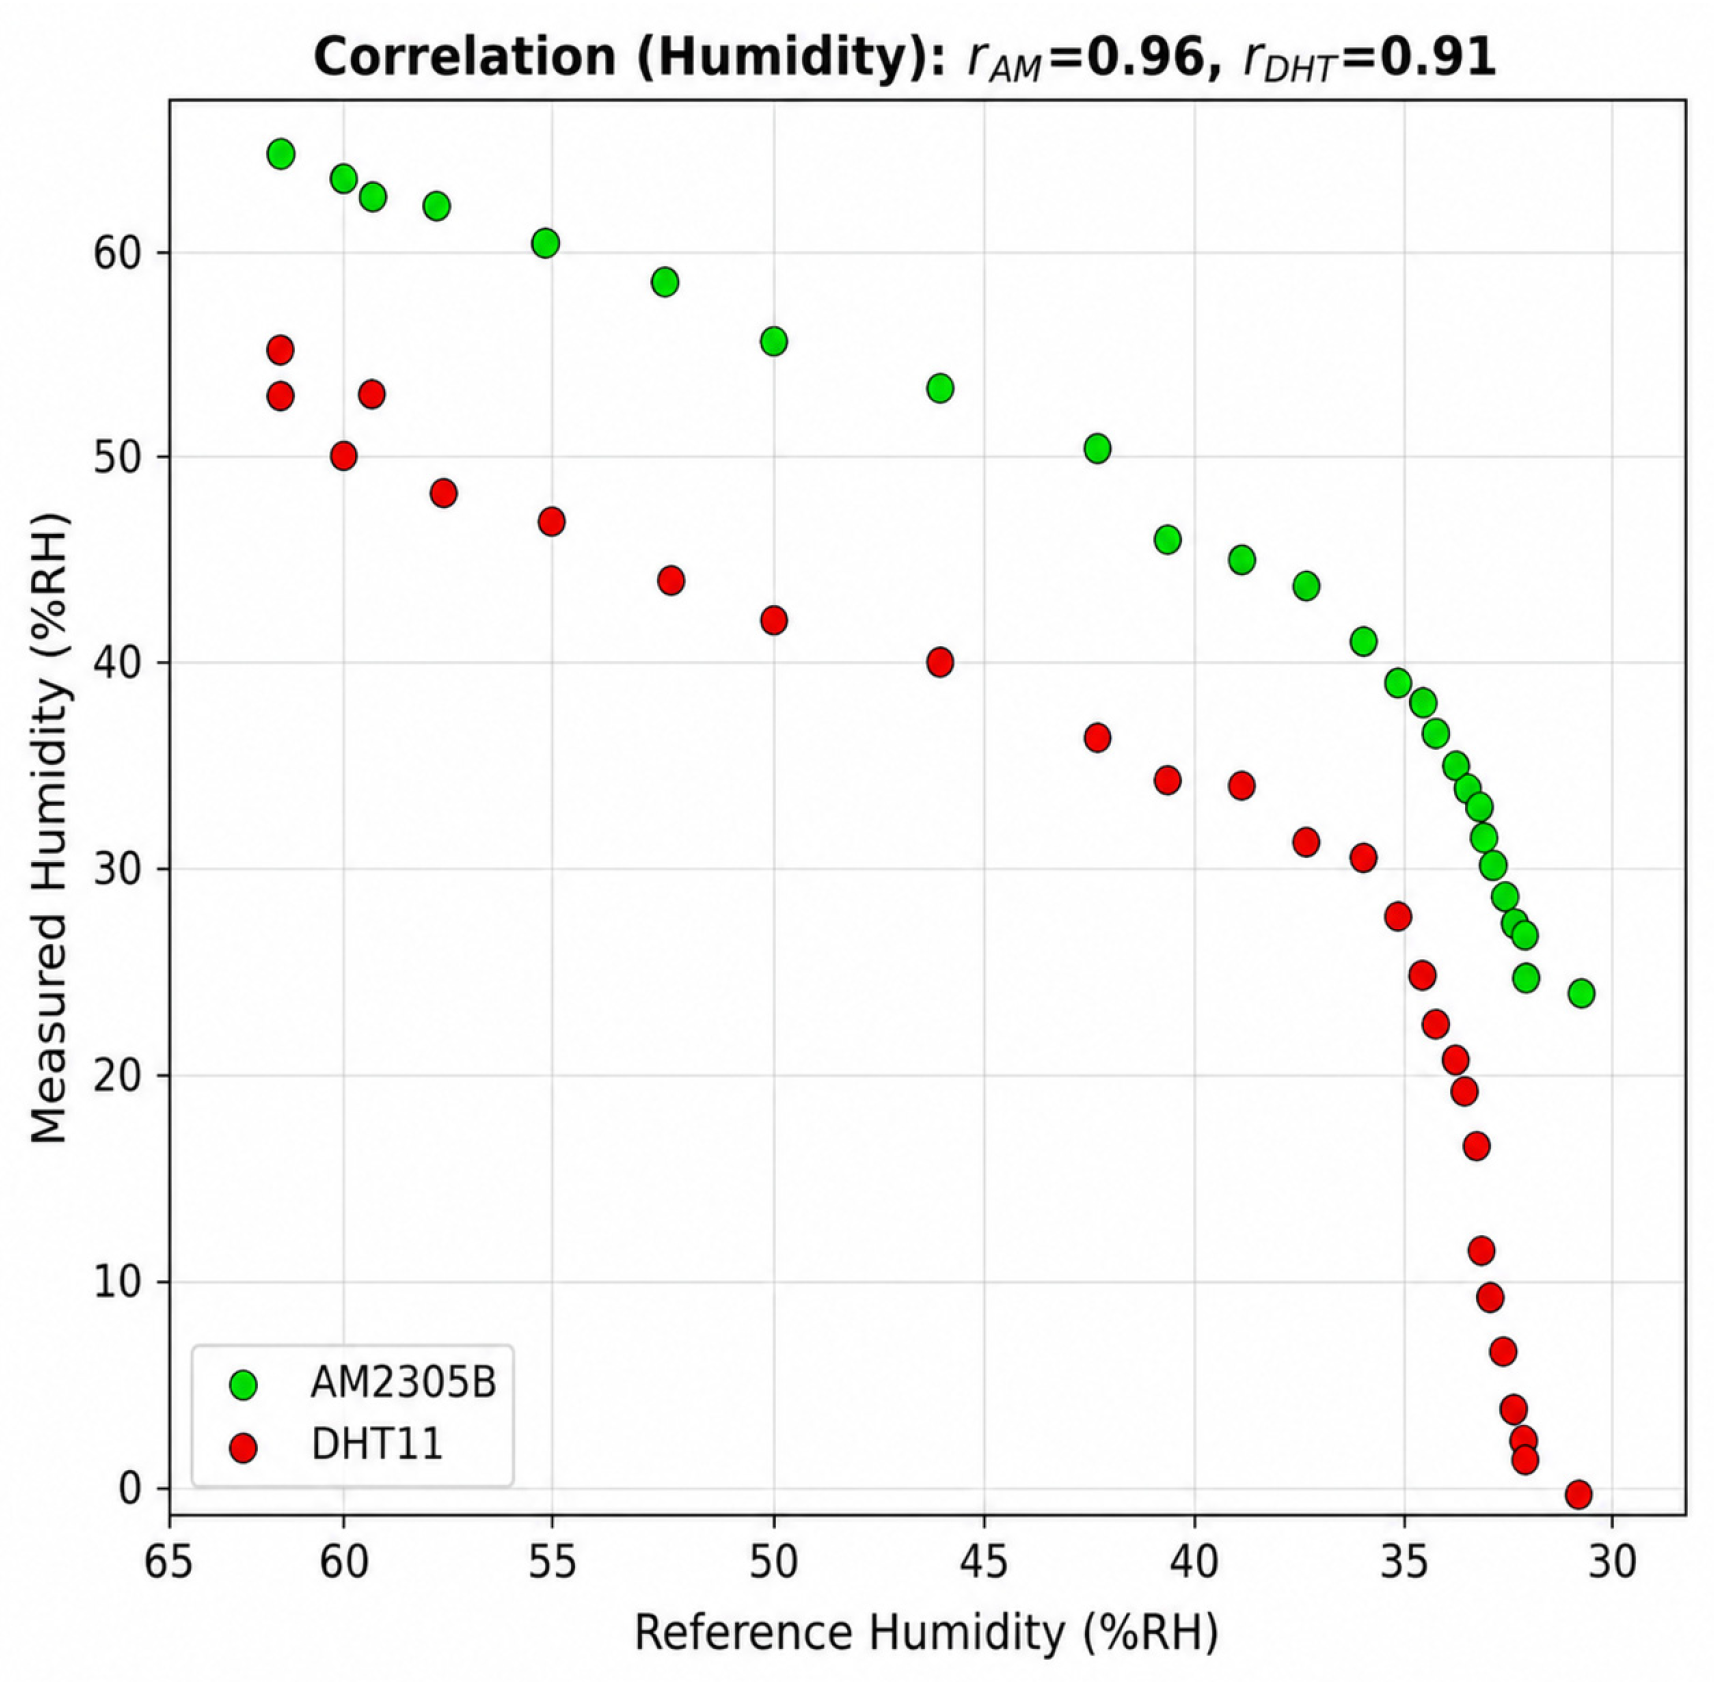
Figure 18, Figure 19 and Figure 20 summarize the statistical performance of the evaluated sensors in terms of RMSE and Pearson correlation coefficient.
Figure 18.
Root Mean Square Error (RMSE) of the sensors. Source: Author(s).
Figure 19.
Temperature Pearson correlation coefficient. Source: Author(s).
Figure 20.
Humidity Pearson correlation coefficient. Source: Author(s).
Overall, the AM2305B sensor demonstrated significantly better performance than the DHT11 sensor in both temperature and relative humidity measurements. The obtained results indicate that the AM2305B provides higher accuracy, lower measurement deviation, and greater stability under dynamic environmental conditions, making it more suitable for deployment in agricultural environmental monitoring applications based on LoRaWAN networks.
Additionally, a custom webhook was implemented to integrate The Things Network (TTN) with the web-based visualization platform developed for this project. The webhook enabled the automatic reception, storage, and processing of the data packets transmitted by the LoRaWAN sensor nodes.
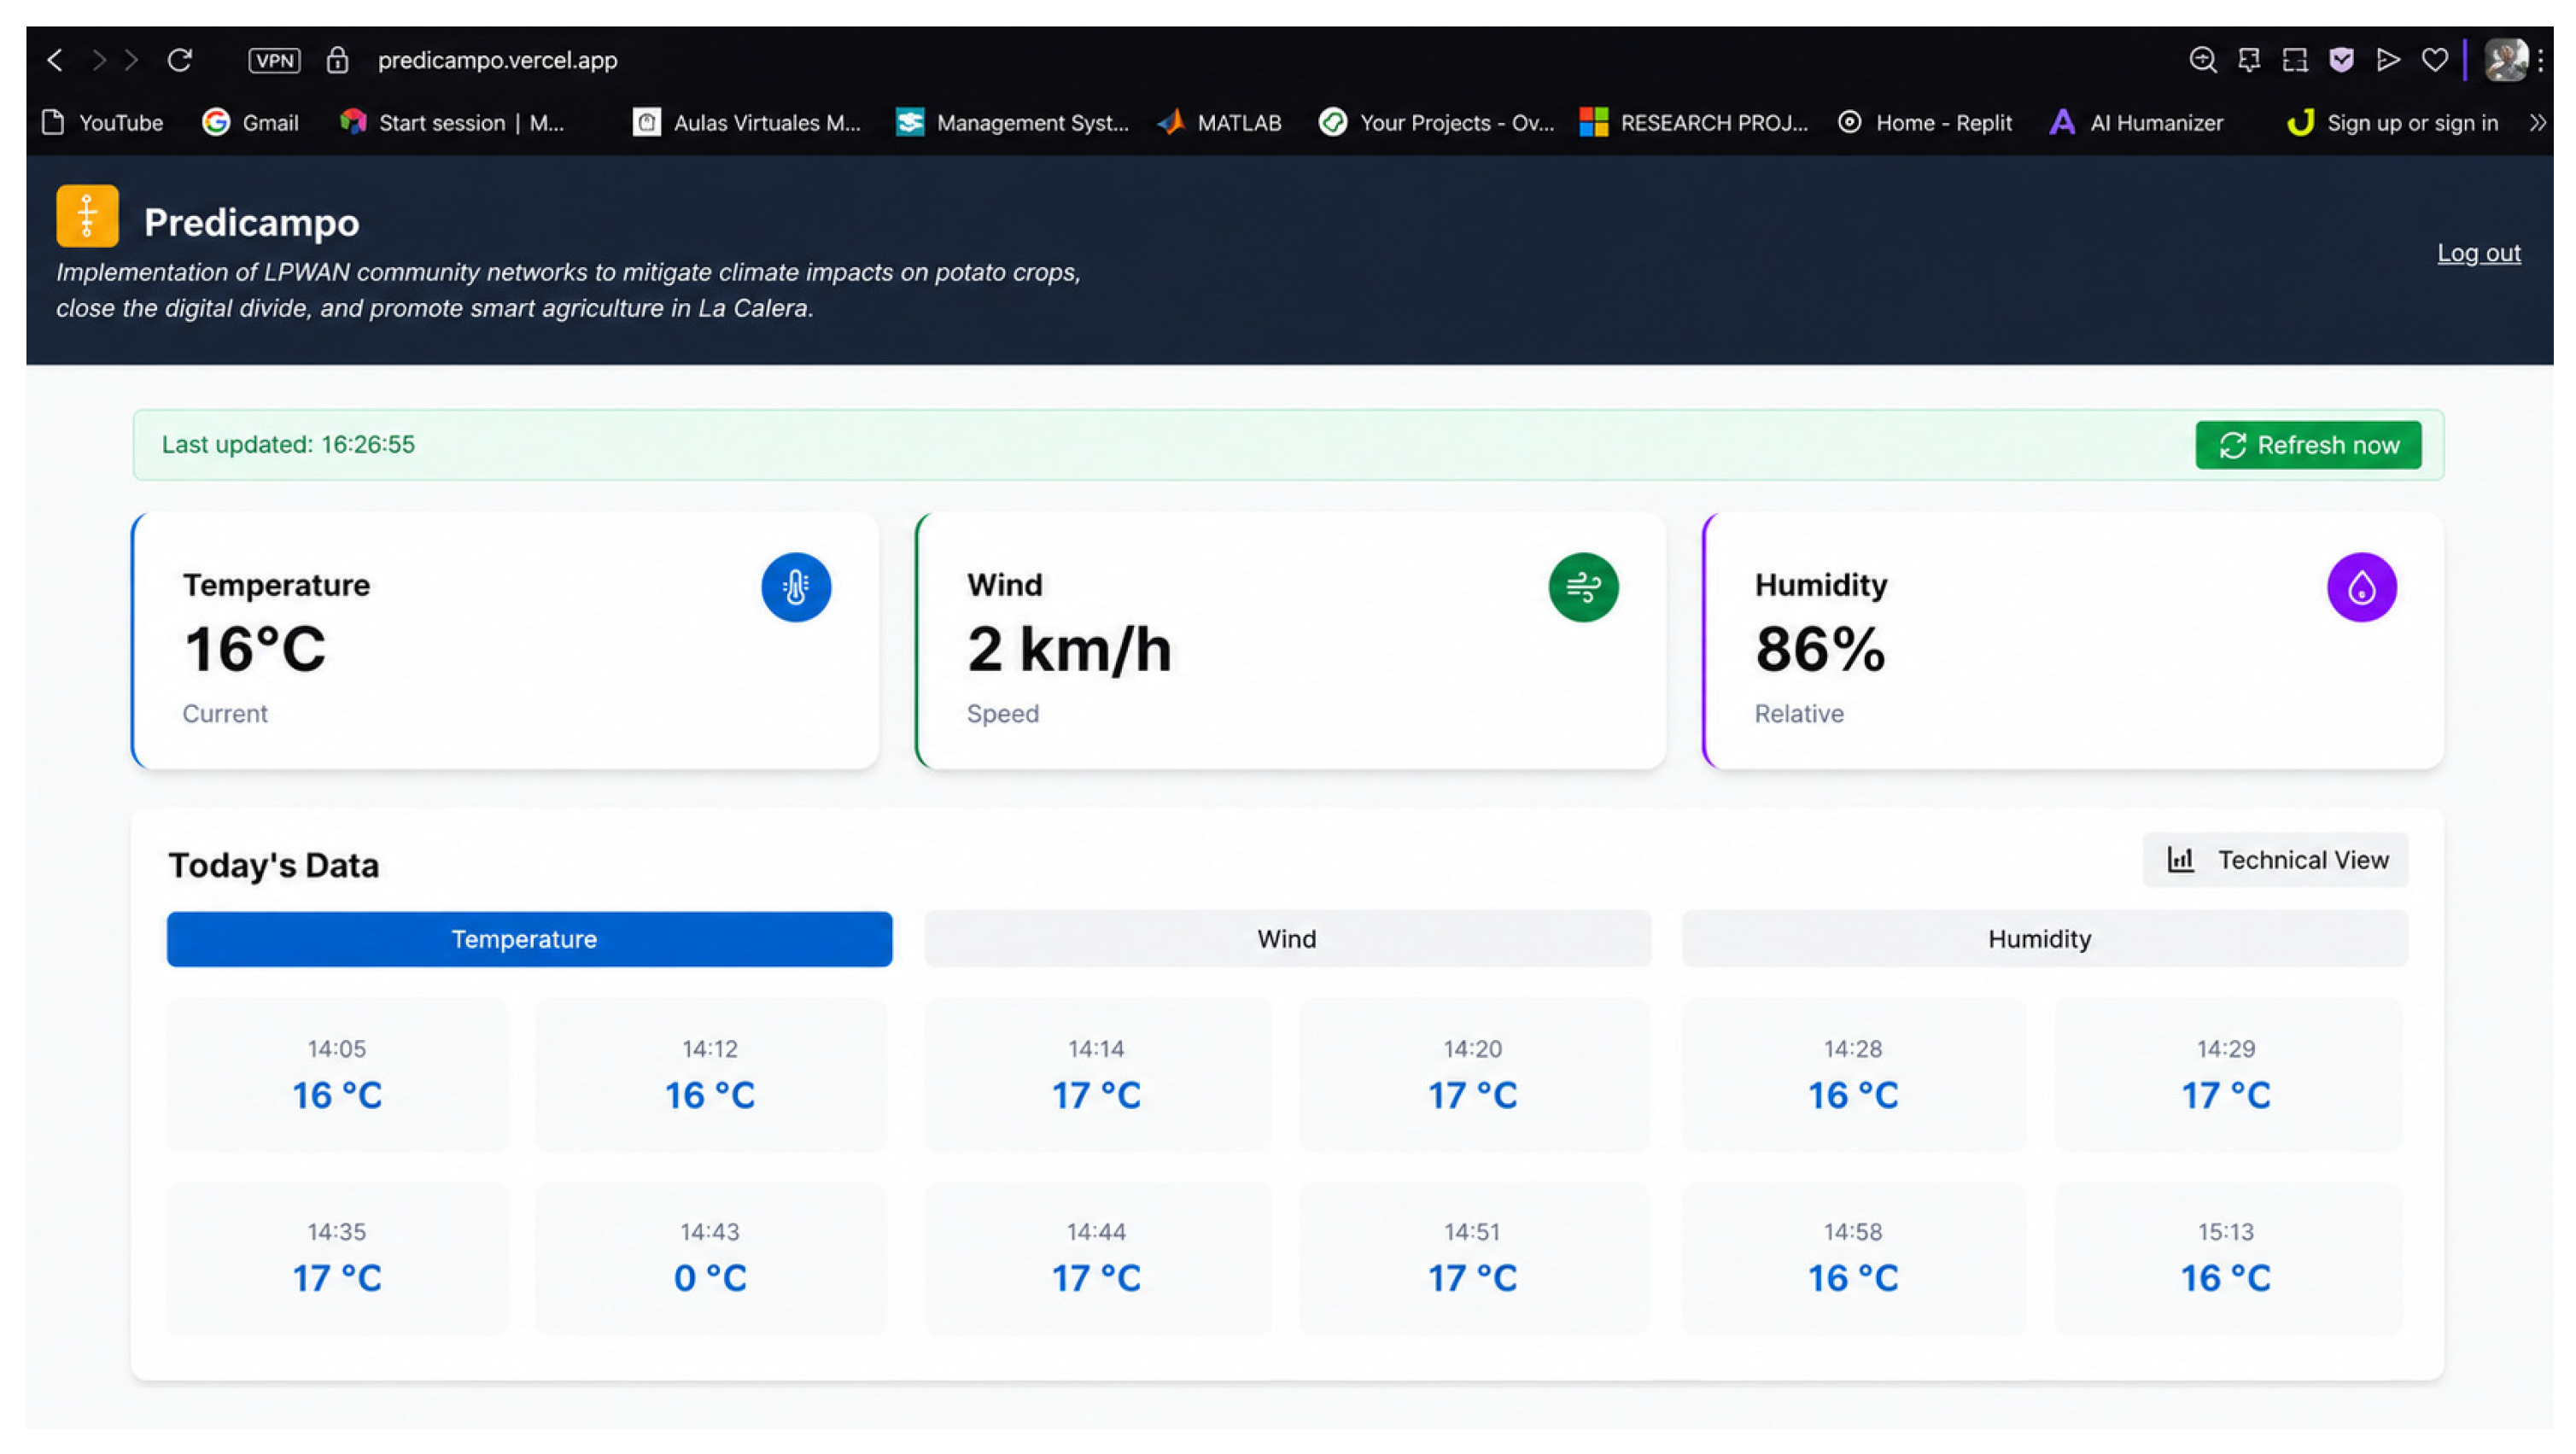
The implemented integration demonstrated reliable and continuous data transmission, enabling real-time visualization of temperature and relative humidity measurements through the Predicampo platform. This platform constitutes a community-oriented LPWAN-based solution designed to support climate monitoring in potato crops, reduce the rural digital divide, and promote smart agriculture applications in La Calera, Colombia. Figure 21 shows the end-user visualization of temperature and relative humidity data on the Predicampo platform.
Figure 21.
End-user visualization in the Predicampo webhook. Source: Author(s).
An urban propagation test was conducted within the Engineering Faculty facilities of Universidad Distrital Francisco José de Caldas. During the experiment, a sensor node configured as a test node transmitted LoRaWAN packets while moving through different indoor and outdoor locations around the university campus.
The gateway was installed on the seventh floor near the spiral staircase area in order to evaluate signal propagation under dense urban conditions with multiple structural obstacles such as walls, floors, corridors, and internal metallic structures.
During the tests, RSSI and SNR measurements were collected at different locations to evaluate communication quality and coverage stability under realistic deployment conditions.
For analysis purposes, SNR values were classified into four qualitative categories:
- Very good signal: SNR > 12 dB
- Good signal: 8 dB ≤ SNR ≤ 12 dB
- Moderate signal: 0 dB ≤ SNR < 8 dB
- Low signal: SNR < 0 dB
Table 7 presents the SNR measurements and qualitative signal classification obtained at different urban locations around Universidad Distrital.
Table 7.
SNR measurements and qualitative signal classification at different urban locations around Universidad Distrital.
Additionally, an open-field rural propagation test was conducted in Turmequé, Boyacá, prior to the final deployment in La Calera, Cundinamarca. During the experiment, communication quality parameters were recorded at different distances between the sensor node and the gateway.
The tests evaluated the behavior of RSSI and SNR under rural line-of-sight conditions in order to estimate the effective communication range of the proposed LoRaWAN infrastructure. Table 8 presents the SNR, RSSI, and distance measurements recorded during the rural open-field propagation tests conducted in Turmequé, Boyacá.
Table 8.
LoRaWAN link quality measurements as a function of distance during rural open-field propagation tests in Turmequé, Boyacá.
The rural propagation tests demonstrated that the proposed LoRaWAN system maintained stable communication under open-field conditions at distances approaching 1 km. Positive SNR values and acceptable RSSI levels were observed up to approximately 300–450 m, indicating reliable communication quality for environmental monitoring applications.
At greater distances, the wireless link quality progressively degraded due to propagation losses, resulting in negative SNR values and RSSI measurements below −110 dBm. Nevertheless, communication remained operational even at distances close to 945 m, demonstrating the long-range capabilities of LoRa technology in rural agricultural environments.
4. Discussion
The experimental results demonstrated that the AM2305B sensor provides significantly better performance than the DHT11 sensor for environmental monitoring applications in agricultural scenarios. The obtained RMSE values below 1 °C for temperature and close to 5% RH for relative humidity indicate that the proposed prototype achieves sufficient accuracy for frost-related environmental monitoring in potato crops.
The strong Pearson correlation coefficients obtained during the three experimental sessions (r ≥ 0.98) confirm the consistency and stability of the measurements acquired by the AM2305B sensor with respect to the PeakTech-5035 reference instrument. In contrast, the DHT11 sensor exhibited greater deviations, particularly under low humidity and high-temperature conditions, which are common during rapid environmental transitions associated with frost events. These findings suggest that low-cost sensors can present important differences in performance depending on environmental conditions and sensor encapsulation characteristics.
Additionally, the communication tests carried out using The Things Network (TTN) and the DRAGINO SX1302 gateway demonstrated stable and reliable data transmission between the sensor nodes and the visualization platform. These results are aligned with the findings reported by Al-Najar et al. [12], who validated the applicability of LoRaWAN networks for agricultural monitoring systems operating under rural conditions. Furthermore, the environmental influence on communication quality discussed by Bhat et al. [13] supports the importance of considering climatic and topographical factors when deploying LPWAN infrastructures in agricultural sensing environments.
Regarding the specific contributions of this work in relation to the existing literature, the following aspects are highlighted. First, unlike most previous studies focused on irrigation systems or greenhouse environments [10,11,12], this work targets frost detection variables—temperature and relative humidity—in open-field high-altitude potato crops, a context that remains underrepresented in the LPWAN precision agriculture literature. Second, the experimental validation integrates sensor characterization, LoRaWAN communication performance, and end-to-end data visualization within a single deployment framework, rather than evaluating these components in isolation. Third, the rural deployment in La Calera at elevations above 3000 m a.s.l., combined with the urban propagation test at Universidad Distrital [22], provides a dual-environment characterization of LoRaWAN performance not commonly reported in comparable studies. Finally, the integration with the Predicampo platform adds a community-oriented dimension oriented toward reducing the rural digital divide, which extends the scope of this work beyond a purely technical contribution.
From an economic perspective, the developed prototype represents an accessible alternative for small-scale farmers. The Heltec LoRa 32 V3 + AM2305B node (approximately USD 47) is considerably less expensive than the PeakTech-5035 handheld reference instrument (USD 127.89); however, this comparison should be interpreted with caution, as it contrasts a continuously deployable IoT sensor node against a portable benchtop measurement instrument designed for spot-check field readings rather than permanent installation. These two device categories serve different operational purposes, and the cost difference reflects this distinction rather than a direct equivalence in functionality. A more representative comparison can be drawn against commercially available LoRaWAN sensor nodes designed for continuous agricultural deployment, such as the Dragino LHT65N temperature and humidity sensor, which is commercially available at approximately USD 47–49 (44.90 €, excluding VAT and shipping). In this context, the proposed node remains cost-competitive with commercially available IoT sensor nodes while offering comparable measurement accuracy (±0.7 °C, ±5% RH), demonstrating that the developed solution constitutes a viable low-cost alternative not only relative to professional handheld instruments but also relative to commercial LoRaWAN sensor nodes oriented toward similar agricultural monitoring applications. This cost-effectiveness is particularly relevant for small-scale farmers in rural and mountainous regions such as La Calera, where budget constraints often limit access to continuous environmental monitoring technologies.
Despite the favorable results, some limitations must be considered. The experiments were conducted under controlled environmental conditions, which may differ from the variability present in open-field agricultural environments. In particular, validation was performed within a temperature range of 20 °C to 50 °C, since reproducing sub-zero conditions (e.g., −5 °C to 5 °C) was not feasible within the available laboratory infrastructure. As frost events occur near 0 °C, future work should prioritize sensor validation under low-temperature conditions, either through specialized cooling chambers or extended field measurements during natural frost events, in order to confirm the accuracy of the proposed node under the specific thermal range relevant to frost detection. Factors such as wind speed and terrain irregularities may influence both sensor measurements and LoRaWAN communication performance. Therefore, future work should include long-term field deployments under real frost conditions, as well as the incorporation of additional environmental variables and predictive models based on machine learning techniques.
Overall, the obtained results confirm that the proposed system constitutes a viable technological alternative for environmental monitoring and early frost risk detection in potato crops located in high-altitude rural regions.
5. Conclusions
The joint analysis of the experimental data obtained during the three measurement days made it possible to evaluate the accuracy and stability of the AM2305B and DHT11 sensors against the PeakTech-5035 reference instrument within a temperature range of 20 °C to 50 °C and a relative humidity range between 70% and 20%.
Overall, the AM2305B sensor exhibited highly consistent behavior with respect to the reference instrument. The average Pearson correlation coefficient was r = 0.99 for temperature and r = 0.96 for relative humidity, demonstrating a strong relationship between the prototype measurements and those of the reference device. The average Root Mean Square Error (RMSE) was 0.82 °C for temperature and 4.6% RH for relative humidity, values that remain within the acceptable tolerance margins for agricultural applications. These results confirm that the proposed node provides performance comparable to that of higher-cost commercial sensors.
In contrast, the DHT11 sensor presented more significant deviations with respect to the reference pattern, with an average RMSE of 2.26 °C for temperature and 15.89% RH for relative humidity, while the average Pearson correlation coefficient was r = 0.99 for temperature and r = 0.91 for relative humidity. This translates into lower accuracy and a slower response to environmental changes, especially under conditions of high temperature and low humidity, which limits its applicability in real agricultural environments.
The average behavior observed throughout the three testing days also revealed a consistent trend between temperature increase and the progressive decrease in relative air humidity, confirming both the correct thermal dynamics of the experimental environment and the reliability of the collected data.
From a functional and applicability perspective, the AM2305B sensor integrated with the Heltec WiFi LoRa 32 V3 board satisfies the technical and operational requirements for deployment in environmental monitoring networks based on LoRaWAN technology. Its stability, low power consumption, and accuracy of ±0.7 °C and ±5% RH position it as a viable solution for frost monitoring in potato crops in La Calera, Colombia, where highly variable climatic conditions demand reliable and fast-response systems.
In terms of cost, the proposed prototype offers an accessible alternative both to professional handheld instruments and to commercial IoT environmental sensor nodes. The Heltec LoRa 32 V3 + AM2305B node (USD 47) represents a substantially lower cost than the PeakTech-5035 (USD 127.89), while remaining cost-competitive with commercial LoRaWAN sensor nodes such as the Dragino LHT65N (approximately USD 47–49), positioning the proposed solution as a viable alternative within the current commercial IoT sensor landscape for agricultural applications.
The wireless communication and propagation tests demonstrated the feasibility of implementing LoRaWAN technology for environmental monitoring applications in both urban and rural agricultural scenarios. The urban coverage analysis conducted at Universidad Distrital revealed that the communication link remained stable across multiple indoor and outdoor locations despite the presence of structural obstacles such as walls, floors, and corridors. High SNR values were predominantly observed in open vertical areas, while lower values appeared in highly obstructed indoor environments, confirming the strong influence of propagation conditions on LoRaWAN link quality.
The rural open field experiments carried out in Turmequé, Boyacá, demonstrated that the proposed system maintained reliable communication over distances approaching 1 km under low power operation conditions. Although signal quality progressively decreased with distance, communication remained operational even under negative SNR conditions and RSSI levels below −110 dBm. These results validate the suitability of LoRaWAN technology for long-range agricultural monitoring deployments in mountainous rural regions such as La Calera, where conventional communication infrastructure is limited.
In conclusion, the experimental validation confirms that the node developed using the Heltec LoRa 32 V3 board together with the AM2305B sensor constitutes a reliable, cost-effective, and functional tool for the implementation of wireless sensor networks for smart agriculture applications.
Author Contributions
Conceptualization, R.F.-E. and C.A.M.-A.; methodology, P.M.M.-P. and D.N.M.-N.; software, P.M.M.-P. and D.N.M.-N.; validation, R.F.-E., C.A.M.-A., P.M.M.-P. and D.N.M.-N.; formal analysis, P.M.M.-P. and D.N.M.-N.; investigation, P.M.M.-P. and D.N.M.-N.; resources, R.F.-E. and C.A.M.-A.; data curation, P.M.M.-P. and D.N.M.-N.; writing—original draft preparation, P.M.M.-P. and D.N.M.-N.; writing—review and editing, R.F.-E. and C.A.M.-A.; visualization, P.M.M.-P. and D.N.M.-N.; supervision, R.F.-E. and C.A.M.-A.; project administration, R.F.-E.; funding acquisition, R.F.-E. and C.A.M.-A. All authors have read and agreed to the published version of the manuscript.
Funding
This scientific research article is derived from the research project entitled “Design and Implementation of a WSN Based on LPWAN Technology for Monitoring and Generating Alerts to Mitigate the Impact of Frost on Potato Crops in La Calera Using the PPDIOO Methodology.” The project was funded by the Universidad Distrital Francisco José de Caldas, the Research Office (ODI) through the PR1 2025 second-call funding program, and the LIDER research group of the Universidad Distrital Francisco José de Caldas. Project start year: 2025; completion year: 2026.
Institutional Review Board Statement
Not applicable.
Informed Consent Statement
Not applicable.
Data Availability Statement
The datasets, source code, and implementation resources generated and analyzed during the current study are available in the GitHub repository: https://github.com/muri0620/Software_LoRaWAN_Heladas (accessed on 21 July 2026).
Acknowledgments
The authors express their gratitude to the Universidad Distrital Francisco José de Caldas and the Electronic Engineering Curriculum Project for the academic support and technical resources provided throughout the development of this research. The authors also acknowledge the support of the Research Office (ODI) and the LIDER Research Group for their guidance and contributions during the experimental and validation stages of the project. During the preparation of this manuscript, the authors used OpenAI ChatGPT (GPT-4.0) for language improvement, grammar correction, and academic writing assistance. The authors reviewed and edited all generated content and take full responsibility for the final published version of the manuscript.
Conflicts of Interest
The authors declare no conflicts of interest.
References
- Instituto de Hidrología, Meteorología y Estudios Ambientales (IDEAM). Manual del Observador Meteorológico; IDEAM: Bogotá, Colombia, 2019. Available online: http://roble.cdmb.gov.co/cgi-bin/koha/opac-detail.pl?biblionumber=7944 (accessed on 21 July 2026).
- Ojeda Farías, N.; Martínez Aguilar, C. Efecto de las Heladas en el Cultivo de Papas en Magallanes y Posibles Métodos de Control; INIA Kampenaike, Ministerio de Agricultura de Chile: Punta Arenas, Chile, 2020; Available online: https://biblioteca.inia.cl/server/api/core/bitstreams/b0a3236a-9a76-4cd8-84e7-004d3b6e0745/content (accessed on 21 July 2026).
- Robledo, A.J. Clima Andino y Café en Colombia. Available online: https://biblioteca.cenicafe.org/bitstream/10778/859/18/16.%20Heladas.pdf (accessed on 21 July 2026).
- Zhang, P.; Yang, X.; Manevski, K.; Li, S.; Wei, Z.; Andersen, M.N.; Liu, F. Physiological and growth responses of potato (Solanum tuberosum L.) to air temperature and relative humidity under soil water deficits. Plants 2022, 11, 1126. [Google Scholar] [CrossRef] [Scilit] [PubMed]
- Heusinkveld, V.W.J.; van Hooft, J.A.; Schilperoort, B.; Baas, P.; Veldhuis, M.T.; van de Wiel, B.J.H. Towards a physics-based understanding of fruit frost protection using wind machines. Agric. For. Meteorol. 2020, 280, 107868. [Google Scholar] [CrossRef] [Scilit]
- de Colombia, C. Ley 599 de 2000. Código Penal, Artículo 350: Incendio. 2000. Available online: https://www.funcionpublica.gov.co/eva/gestornormativo/norma.php?i=6388#350 (accessed on 21 July 2026).
- Ordoñez, C.Y.B. Implementación de una Red de Sensores Inalámbricos LPWAN Mediante Módulos LoRa Para el Monitoreo de la Calidad del Agua en 2 Ríos. Undergraduate Thesis, Universidad Distrital Francisco José de Caldas, Bogotá, Colombia, 2017. Available online: https://repository.udistrital.edu.co/items/c6b6c007-5f00-42bf-8c93-c5d7fa22be08 (accessed on 21 July 2026).
- Niño Camelo, J.E.; Pineda Cadena, E.; Gaitán Giraldo, F.A. Diseño e Implementación de una Red Inalámbrica de Sensores para el Monitoreo de Temperatura y Humedad en un Sistema de Cultivo Hidropónico de Lechuga. Undergraduate Thesis, Universidad Piloto de Colombia, Bogotá, Colombia, 2023. Available online: https://repository.unipiloto.edu.co/bitstream/handle/20.500.12277/13620/ArticuloIEEE.pdf?sequence=8&isAllowed=y (accessed on 21 July 2026).
- Ferro Escobar, R.; Aguirre, E.; Martínez-Alayón, C.A. Investigación y Desarrollo de Una Propuesta Para la Implementación de Agricultura Inteligente en Colombia, 1st ed.; Universidad Distrital Francisco José de Caldas: Bogotá, Colombia, 2024; Volume 1, Available online: https://doctoradoingenieria.udistrital.edu.co/wp-content/uploads/2025/02/Investigacion-y-desarrollo-Digital.pdf (accessed on 21 July 2026).
- Ahmad, N.; Hussain, A.; Ullah, I.; Zaidi, B.H. IoT based wireless sensor network for precision agriculture. In 2019 7th International Electrical Engineering Congress (iEECON); IEEE: New York, NY, USA, 2019. [Google Scholar]
- Islam, N.; Ray, B.; Pasandideh, F. IoT based smart farming: Are the LPWAN technologies suitable for remote communication? In 2020 IEEE International Conference on Smart Internet of Things (SmartIoT); IEEE: New York, NY, USA, 2020. [Google Scholar]
- Al-Najar, M.F.; Elshatshat, M.A.; Raas, A.T.A. An intelligent IoT and machine learning-based smart irrigation system using LoRaWAN. Gharyan Univ. J. Eng. Sci. GUJES 2026, 2, 24–37. [Google Scholar] [CrossRef] [Scilit]
- Bhat, S.A.; Sofi, I.B.; Chen, M.-C.; Huang, N.-F. RF-driven adaptive surrogate models for LoRaDisC network performance prediction in smart agriculture and field sensing environments. AgriEngineering 2026, 8, 27. [Google Scholar] [CrossRef] [Scilit]
- The Things Network. LoRaWAN Architecture. 2023. Available online: https://www.thethingsnetwork.org/docs/lorawan/architecture/ (accessed on 21 July 2026).
- Heltec Automation. WiFi LoRa 32 (V3)—ESP32-S3 + SX1262 LoRa Node. 2024. Available online: https://heltec.org/project/wifi-lora-32-v3/ (accessed on 21 July 2026).
- Aosong Electronics Co., Ltd. AM2305B Temperature and Humidity Sensor Datasheet. 2021. Available online: https://electropeak.com/am2305b-temperature-and-humidity-module (accessed on 21 July 2026).
- Carbone, G. Heltec WiFi LoRa 32 Case. Thingiverse. 2026. Available online: https://www.thingiverse.com/thing:3783207 (accessed on 21 July 2026).
- PeakTech Prüf- und Messtechnik GmbH. PeakTech 5035 Operation Manual. 2023. Available online: https://www.peaktech.de/es (accessed on 21 July 2026).
- Loukil, S.; Fourati, L.C.; Nayyar, A.; Chee, K.-W.-A. Analysis of LoRaWAN 1.0 and 1.1 protocols security mechanisms. Sensors 2022, 22, 3717. [Google Scholar] [CrossRef] [Scilit] [PubMed]
- Lorincz, J.; Levarda, K.; Čagalj, M.; Kukuruzović, A. A comprehensive analysis of LoRa network wireless signal quality in indoor propagation environments. J. Sens. Actuator Netw. 2025, 14, 111. [Google Scholar] [CrossRef] [Scilit]
- Azevedo, J.A.; Mendonça, F. A critical review of the propagation models employed in LoRa systems. Sensors 2025, 24, 3877. [Google Scholar] [CrossRef] [Scilit] [PubMed]
- Rivero, A.J.L.; Martínez-Alayón, C.A.; Ferro, R.; de la Iglesia, D.H.; Secades, V.A. Network traffic modeling in a Wi-Fi system with intelligent soil moisture sensors (WSN) using IoT applications for potato crops and ARIMA and SARIMA time series. Appl. Sci. 2020, 10, 7702. [Google Scholar] [CrossRef] [Scilit]



Disclaimer/Publisher’s Note: The statements, opinions and data contained in all publications are solely those of the individual author(s) and contributor(s) and not of MDPI and/or the editor(s). MDPI and/or the editor(s) disclaim responsibility for any injury to people or property resulting from any ideas, methods, instructions or products referred to in the content. |
© 2026 by the authors. Licensee MDPI, Basel, Switzerland. This article is an open access article distributed under the terms and conditions of the Creative Commons Attribution (CC BY) license.