


Featured Application
The proposed technique detects supply voltage unbalance by analyzing the frequency-domain signatures of the three-phase voltages and currents supplying an induction motor. The innovative method is implemented using a digital circuit breaker, originally installed for motor protection, thereby requiring no additional sensing hardware. It can be integrated into induction motor condition monitoring systems to identify voltage unbalance, facilitate fault localization, and reduce false-positive diagnoses caused by supply-related disturbances.
Abstract
Supply voltage unbalance is one of the most common power-quality disturbances affecting electrically driven actuators and rotating machines; yet its interaction with the harmonic indicators used for drive condition monitoring is often overlooked. As an innovative contribution, this article investigates the effects of supply voltage unbalance on Motor Current Signature Analysis indicators in a three-phase induction motor drive, using a digital molded-case circuit breaker as a combined protection and diagnostic sensing device. A dedicated test bench including a three-phase induction motor, a rheostat on the supply line, and a magnetic powder brake is used for testing at various load and supply voltage-unbalance conditions. A preliminary time-domain and phase-angle analysis of the three-phase signals is presented, revealing relevant diagnostic patterns. The proposed method then detects supply voltage unbalance through direct analysis of the frequency-domain signatures. Both voltage and current spectra are examined, with particular focus on their harmonic and interharmonic components, to identify their similarities and differences. Along with the usual 3rd harmonic indicator (already recognized in the literature), the 5th and 7th harmonics are monitored in both current and line-to-line voltage spectra. In the voltage spectra, distinctive interharmonic components are observed around the fundamental components. These interharmonic components also enable localization of the affected phase by exploiting the relationships among the three-phase signals.
1. Introduction
Despite the widespread adoption of variable frequency drives (VFDs), grid-connected induction motors continue to represent the dominant technology for industrial electromechanical energy conversion owing to their robustness, simple construction, high reliability, cost-effectiveness, and low maintenance requirements [1,2]. Nevertheless, their performance is highly dependent on the quality of the electrical power supply. Among the various power-quality disturbances, supply voltage unbalance is particularly critical because it occurs frequently in industrial distribution systems and directly affects motor operation. It arises when the three-phase voltages at the motor terminals differ in magnitude and/or are not phase-displaced by exactly 120°. Even relatively small voltage-unbalance levels generate negative-sequence voltage components that produce negative-sequence currents, leading to increased copper losses, excessive winding temperature rise, torque pulsations, mechanical vibrations, and reduced efficiency [3,4,5]. Over prolonged operation, these effects accelerate insulation aging and consequently shorten the motor service life [6,7,8,9].
Condition monitoring and fault diagnosis of electric drives have progressively evolved from offline, intrusive inspections to non-invasive techniques based on the analysis of electromagnetic signals [10]. Among these, Motor Current Signature Analysis (MCSA) has become one of the most established diagnostic approaches. By analyzing the frequency spectrum of the stator current, MCSA enables the detection of broken rotor bars, stator inter-turn short circuits, air-gap eccentricity, load anomalies, torque oscillations, and, under specific operating conditions, bearing defects through characteristic harmonic and sideband components [10,11,12,13,14,15,16]. Its non-invasive nature, relatively low implementation cost, and compatibility with current sensors already installed for protection or control purposes make MCSA particularly attractive for industrial condition monitoring, especially where direct access to the machine is difficult or impractical.
Although MCSA specifically refers to current-signal analysis, similar frequency-domain signature-analysis techniques can be applied to other physical quantities to provide complementary diagnostic information. Experimental studies have demonstrated their effectiveness when applied to mechanical vibrations measured on the motor frame or bearings [17], voltage signals [18], and external stray magnetic flux [19,20,21,22]. In particular, combined vibration and current analysis has been investigated for static eccentricity detection in induction motors [17], whereas combined current and voltage analysis has been employed to detect and discriminate static eccentricity and turn-to-turn short-circuit faults in permanent-magnet synchronous machines [18]. External stray-flux analysis has also been investigated for bearing-fault detection [19], simultaneous stator short-circuits and bearing-fault diagnosis [20], and broken-rotor-bar detection [21], while a comprehensive review of magnetic-flux-based condition monitoring, including different sensor arrangements and measurement locations, is provided in [22].
Despite these advantages, an important limitation of MCSA is that its spectral indicators are not exclusively affected by machine faults. External operating conditions, particularly power-quality disturbances, may significantly alter the current spectrum and compromise diagnostic reliability. Among them, supply voltage unbalance is especially critical because it introduces a negative-sequence voltage component that produces a disproportionately large negative-sequence current owing to the inherently low negative-sequence impedance of induction machines [6,9]. Although this current does not contribute to electromagnetic torque production, it increases copper losses, generates torque pulsations at twice the supply frequency, and modifies the amplitude of several spectral components, including the third harmonic, as experimentally demonstrated in previous studies [7]. Consequently, voltage-unbalance-induced spectral signatures may be erroneously interpreted as fault-related components, leading to false-positive diagnoses [23,24].
Beyond the diagnostic algorithm itself, the monitoring framework can be enhanced by leveraging equipment already installed for protection purposes. In modern low-voltage installations, digital molded-case circuit breakers (MCCBs) equipped with electronic trip units provide accurate, time-stamped, multi-phase electrical measurements as part of their normal protective function. Besides ensuring motor and downstream equipment protection, these devices can also serve as low-cost diagnostic sensing nodes, complementing dedicated data-acquisition systems [13]. Their ability to simultaneously perform protection and condition monitoring makes them particularly attractive for industrial applications, as it enables advanced diagnostic functions without requiring additional sensors or dedicated measurement hardware.
Against this background, the objectives and contributions of this work are twofold. First, controlled laboratory experiments are conducted to systematically investigate the influence of supply voltage unbalance and load level on the spectral indicators conventionally employed in MCSA for three-phase induction motor drives. In addition to assessing established harmonic indicators, the analysis identifies diagnostic signatures in the line-to-line voltage spectra and investigates the complementary information provided by voltage and current measurements for detecting supply voltage unbalance and localizing the affected phase. Second, the study demonstrates that a digital molded-case circuit breaker, originally installed for motor protection, can be effectively repurposed as a diagnostic sensing device to synchronously acquire current and line-to-line voltage signals and extract the relevant diagnostic indicators. This approach enables additional condition-monitoring capabilities to be implemented using existing protection hardware, without requiring dedicated diagnostic sensors or data-acquisition equipment.
Accordingly, the novelty of the work lies in the combination of two complementary aspects: (i) the use of a commercial digital MCCB as an integrated protection and diagnostic acquisition platform for MCSA-based condition monitoring; and (ii) the combined analysis of current and line-to-line voltage spectra, which reveals diagnostic signatures capable of detecting supply voltage unbalance and providing information for affected-phase localization. Although the experimental validation is carried out on an induction motor drive, the proposed methodology can potentially be extended to condition-monitoring systems in which synchronized voltage and current measurements are available from digital protection devices.
The paper is organized as follows. Section 2 describes the experimental setup, the digital circuit breaker used for data acquisition, and the methodology adopted to generate the different combinations of load and voltage-unbalance conditions. Section 3 presents the time-domain and phase-angle analyses of the measured electrical quantities. Section 4 discusses the frequency-domain results, focusing on the diagnostic information provided by the current and voltage harmonic indicators. Finally, Section 5 summarizes the main findings and outlines future research directions.
2. Experimental Setup and Methodology
2.1. Experimental Test Bench and Equipment
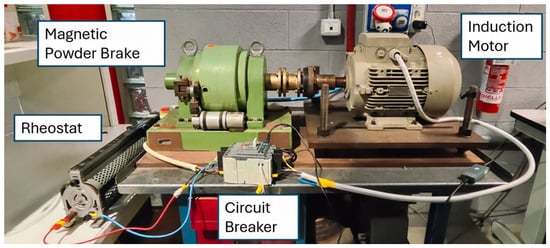
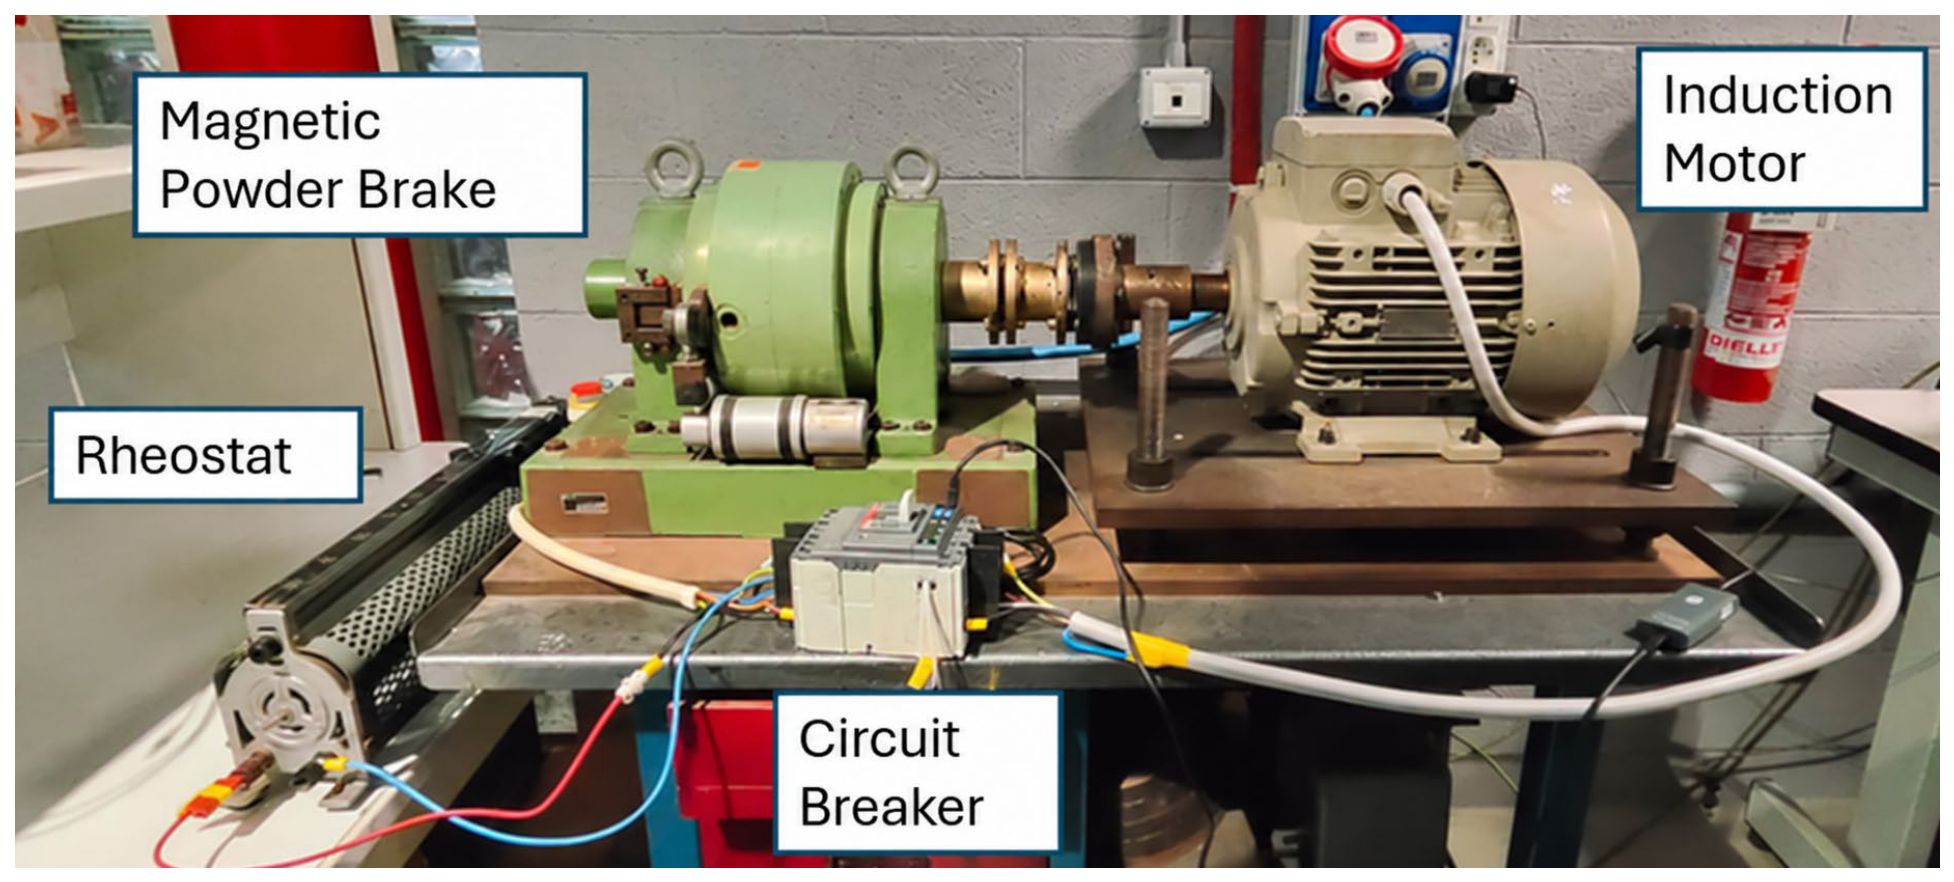
A dedicated experimental setup, shown in Figure 1, is employed to reproduce controlled combinations of mechanical load and supply voltage unbalance on a three-phase squirrel-cage induction motor used as the machine under test (MUT). Its main specifications are summarized in Table 1.
Figure 1.
Test bench layout, showing the main components and the rheostat used to introduce supply voltage unbalance.
Table 1.
Specifications of the induction motor under test.
Mechanical loading is provided by a magnetic powder brake (VIBRO-METER Model 1 PB 115), which delivers a smooth, electromagnetically controllable braking torque without introducing the grid harmonic distortion typically associated with generator-based loading systems [24]. The brake provides a maximum constant torque of 100 Nm up to approximately 480 rpm and operates in a constant-power region (5 kW) at higher speeds. At the motor’s rated speed of 1455 rpm, the maximum available braking torque is approximately 32 Nm, slightly lower than the motor’s rated torque of 36.1 Nm. The brake stator is mounted on bearings, allowing limited rotational movement. The reaction torque exerted on the grounded frame is measured by a load cell, from which the braking torque is determined [25]. In addition, a digital optical encoder mounted on the brake shaft provides direct measurement of the rotational speed, enabling the motor slip to be calculated [15,16,23,24].
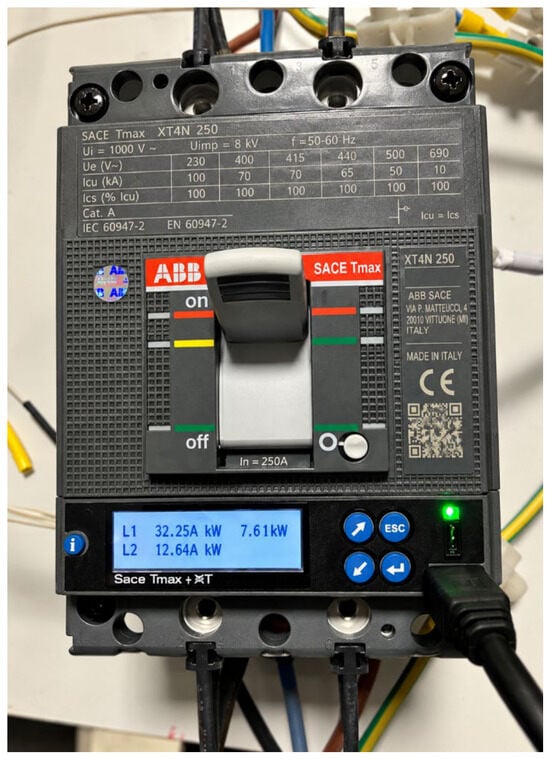
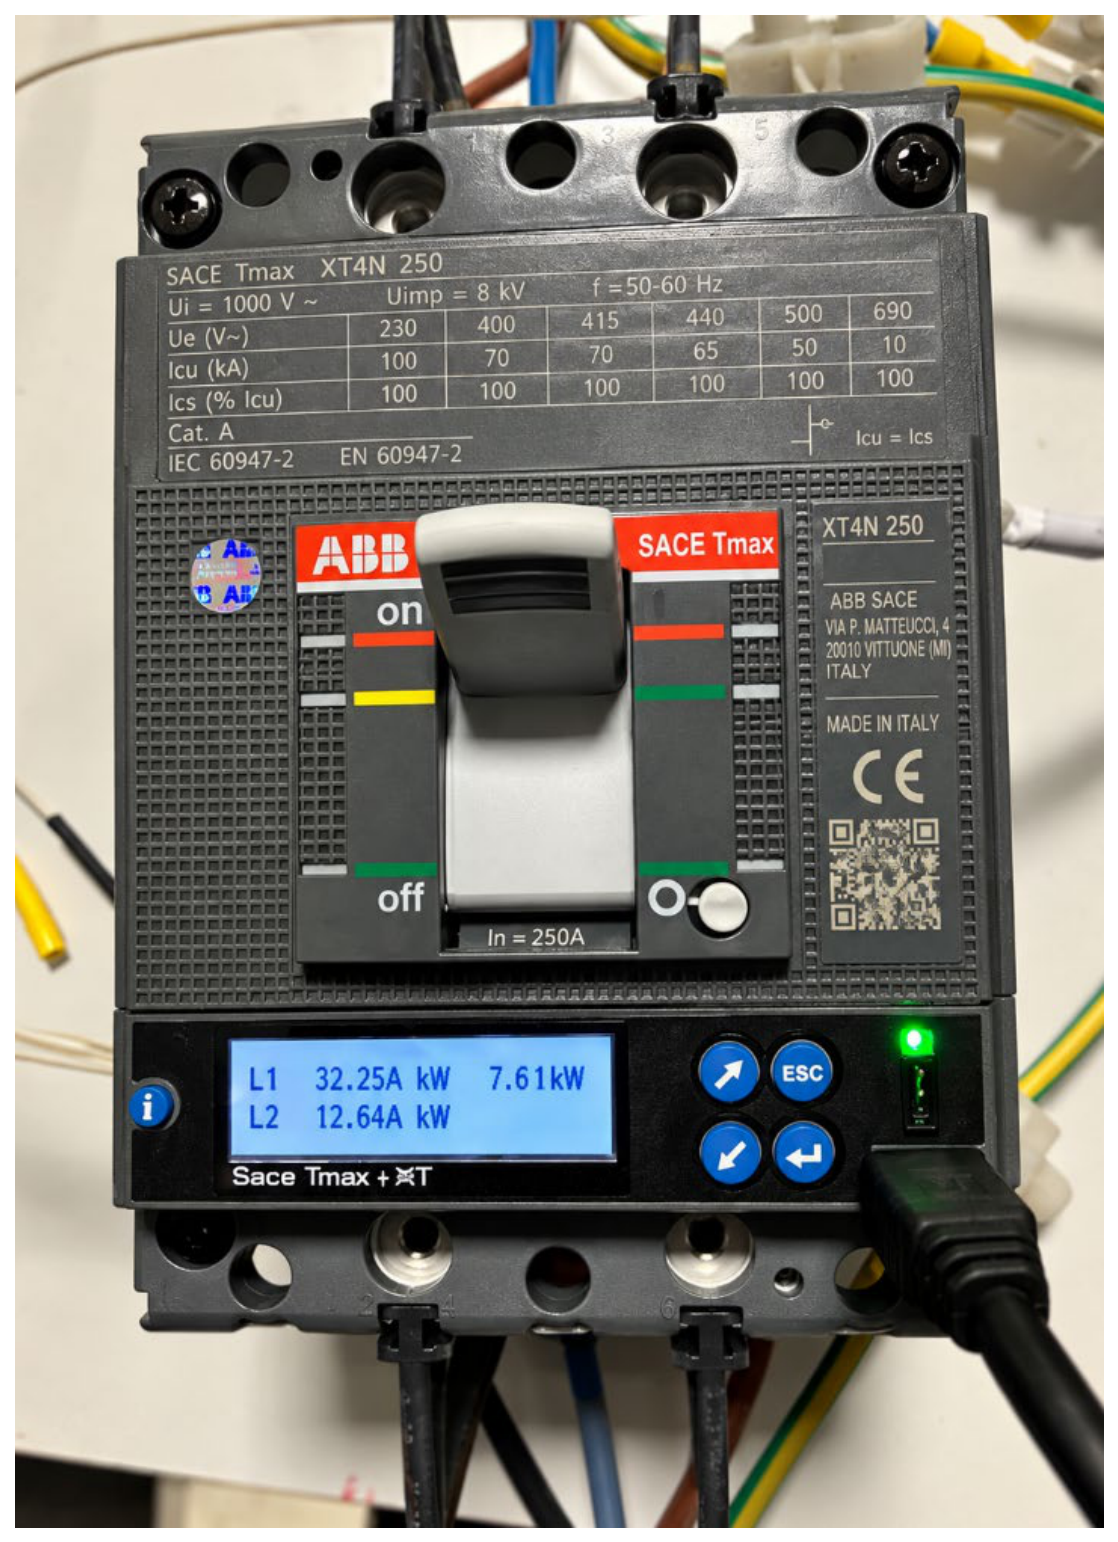
Electrical protection and diagnostic data acquisition are provided by an ABB SACE Tmax XT2N 160 molded-case circuit breaker (MCCB) equipped with an Ekip Connect electronic trip unit, compliant with IEC 60947-2 [26], as shown in Figure 2. Besides its primary protection function, the trip unit provides real-time monitoring and logging of three-phase true RMS currents, line-to-line voltages, active and reactive power, power factor, and current unbalance. It also enables the acquisition of time-domain current and voltage waveforms at configurable sampling frequencies through the Ekip T&P USB communication module and the Ekip Connect 3 software.
Figure 2.
ABB SACE Tmax XT2N 160.
In this work, a sampling frequency of 2.4 kHz is selected. Each acquisition contains 16,320 samples, corresponding to an acquisition duration of 6.8 s. The entire acquired record is used for the FFT analysis, resulting in an FFT length of 16,320 samples and a frequency resolution of approximately 0.147 Hz (2400/16,320). According to the Nyquist criterion, this sampling frequency provides a theoretical bandwidth of 1.2 kHz, which is well above the highest-frequency component specifically investigated in this study (the 7th harmonic at 350 Hz). Although the device supports sampling frequencies up to 9.6 kHz, a lower sampling rate is deliberately adopted because the limited onboard memory of the trip unit imposes a trade-off between sampling frequency and acquisition duration. Increasing the sampling frequency would shorten the acquisition window and consequently reduce the frequency resolution for a fixed number of acquired samples. The selected sampling frequency therefore provides sufficient bandwidth for the investigated harmonic components while ensuring the frequency resolution required to distinguish the closely spaced slip-frequency sidebands around the fundamental frequency and its lower-order harmonics.
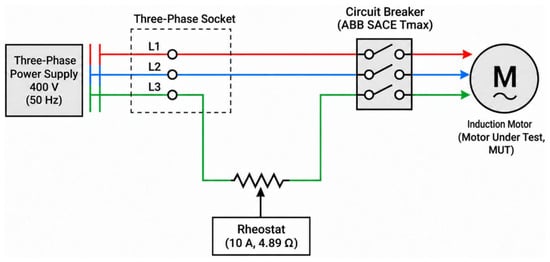
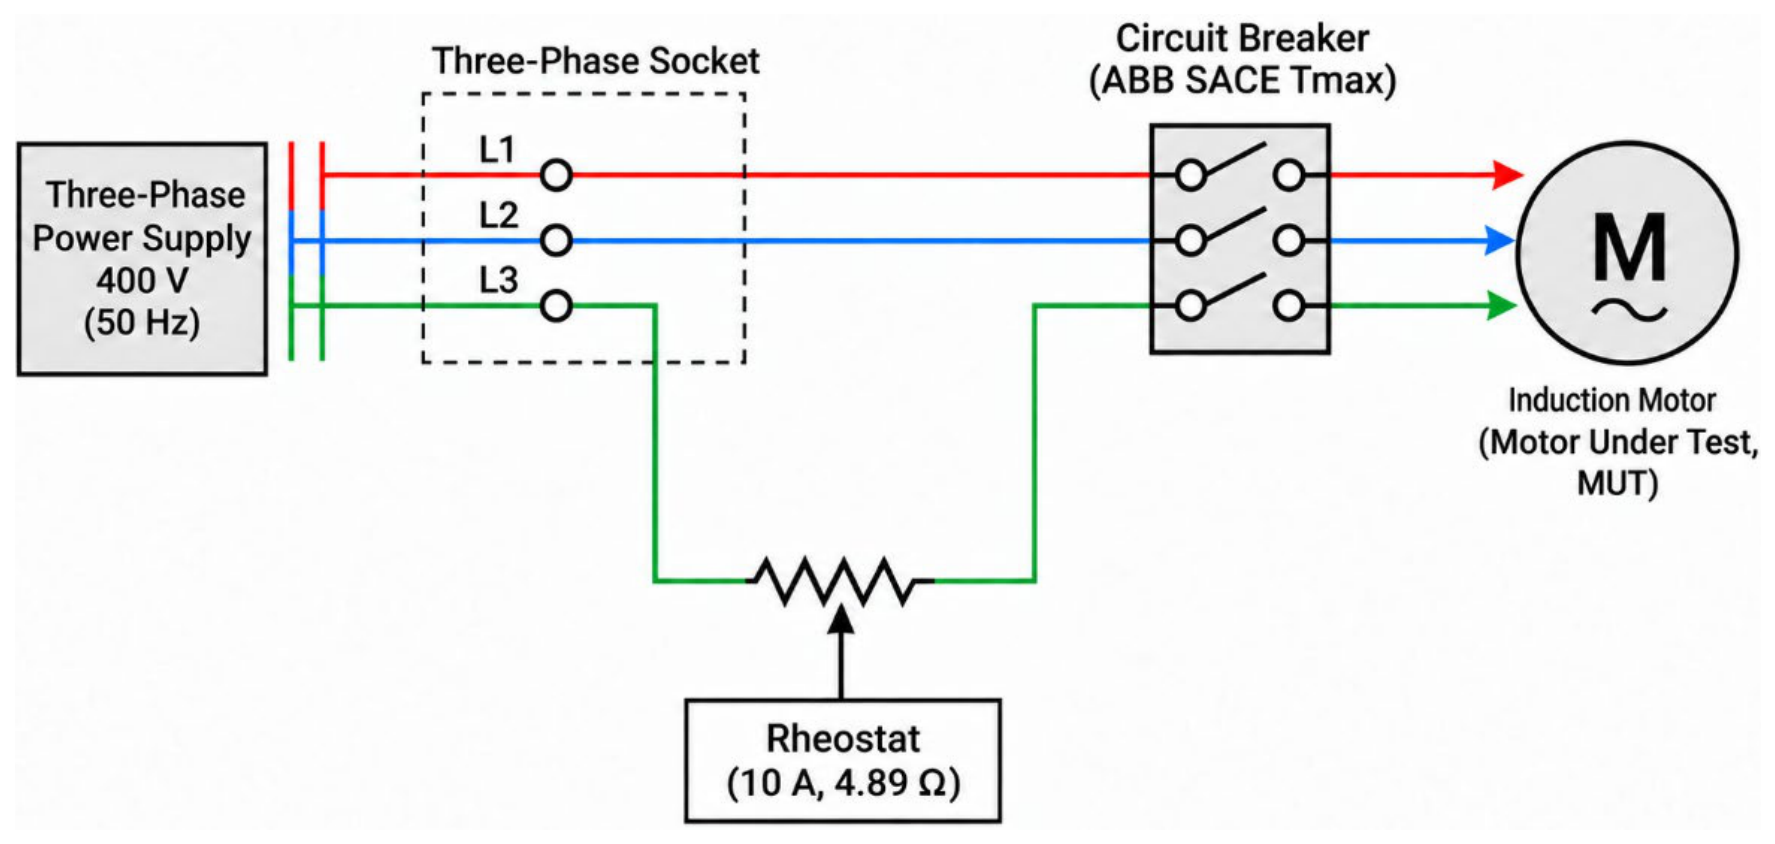
Controlled supply voltage unbalance is introduced by means of an adjustable rheostat rated at 4.89 Ω and 10 A. The rheostat is connected in series with one phase of the three-phase supply, upstream of the circuit breaker, so that the imposed voltage unbalance is directly measured by the protection device. According to the circuit breaker phase numbering, the rheostat is connected to Phase 3. This configuration is relevant for the interpretation of the experimental results, as the three-phase current and voltage measurements exhibit different behaviors depending on the affected phase. The electrical configuration of the experimental setup is given in Figure 3.
Figure 3.
Electrical configuration of the experimental setup, with the rheostat connected in series with Phase 3 to introduce supply voltage unbalance.
2.2. Experimental Test Conditions
Three rheostat settings, corresponding to 0% R (balanced supply), 50% R (2.44 Ω), and 90% R (4.40 Ω) of the rated rheostat resistance, are adopted to generate progressively increasing levels of supply voltage unbalance. The selected settings span a wide range of operating conditions, from nearly balanced operation to severe voltage-unbalance levels, allowing the robustness of the proposed diagnostic indicators to be thoroughly assessed.
These voltage-unbalance conditions are combined with two mechanical load levels, corresponding to 30% and 80% of the rated torque. These load levels are chosen to represent typical light-load and near-rated operating conditions while accounting for the influence of motor slip on the investigated harmonic indicators [4,5,15,16,23,24]. In addition, a baseline test under no-load and balanced-supply conditions (0% R) is included for completeness. Overall, seven operating conditions are investigated, as summarized in Table 2.
Table 2.
Experimental operating conditions: load level and rheostat insertion.
2.3. Data Processing Methodology
For each operating condition listed in Table 2, the acquired current and voltage waveforms are processed in MATLAB R2024b to perform: (i) time-domain analysis of the three-phase currents and line-to-line voltages; (ii) calculation of voltage unbalance according to the NEMA (National Electrical Manufacturers Association) definition and of current unbalance using the maximum-deviation-from-average formulation described in Section 3.2; (iii) extraction of the fundamental-frequency phase angle of each voltage and current signal to characterize the imposed unbalance; (iv) frequency-domain analysis based on the Fast Fourier Transform (FFT), following DC-offset removal and Hann windowing to reduce spectral leakage; and (v) calculation of the Total Harmonic Distortion (THD) of each voltage and current signal up to the 20th harmonic.
All spectra are normalized with respect to the fundamental-frequency component and expressed in decibels (dB), allowing direct comparison of harmonic magnitudes among the seven operating conditions. Consequently, the fundamental component is fixed at 0 dB in all normalized spectra.
Different families of harmonic indicators commonly employed in MCSA-based fault diagnosis are evaluated for all operating conditions. The selected indicators are extracted from both the three-phase current and the line-to-line voltage spectra, enabling a direct comparison between the diagnostic information provided by the two signal types and among the individual phases. The analyzed indicators are:
- the 3rd, 5th, and 7th harmonics of the supply frequency, which have been associated with stator winding asymmetry, magnetic saturation, and supply voltage unbalance in previous MCSA studies [7,11];
- the twice-slip-frequency sidebands (see (1)), widely adopted for the diagnosis of rotor asymmetries, particularly broken rotor bars [10,11,12,13];
- the six-times-slip-frequency sidebands (see (2)). Although these components have received limited attention in the literature and have mainly been investigated for broken rotor bar diagnosis using current signals [27], they are evaluated here as indicators of supply voltage unbalance, with particular emphasis on their behavior in the line-to-line voltage spectra.
The twice-slip-frequency sidebands f2s are calculated using (1):
while the six-times-slip-frequency sidebands f6s are obtained by (2):
where f1 represents the supply frequency (50 Hz), and s is the relative slip of the motor in the considered operating condition (in per unit). The expressions in (1) and (2) are particular cases of the general formulation given in (3) [10,12,13,27]:
with k being an integer, usually not greater than 3.
f2s = f1 · (1 ± 2 · s)
f6s = f1 · (1 ± 6 · s)
fbrb = f1 · (1 ± 2 · k · s)
3. Time-Domain and Phase Analysis
3.1. Time-Domain Waveform Analysis
The acquired waveforms were first analyzed in the time domain to verify the quality of the measurements and to identify the most evident effects of supply voltage unbalance.
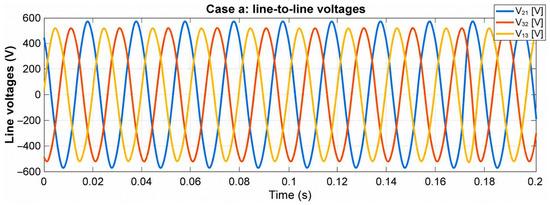
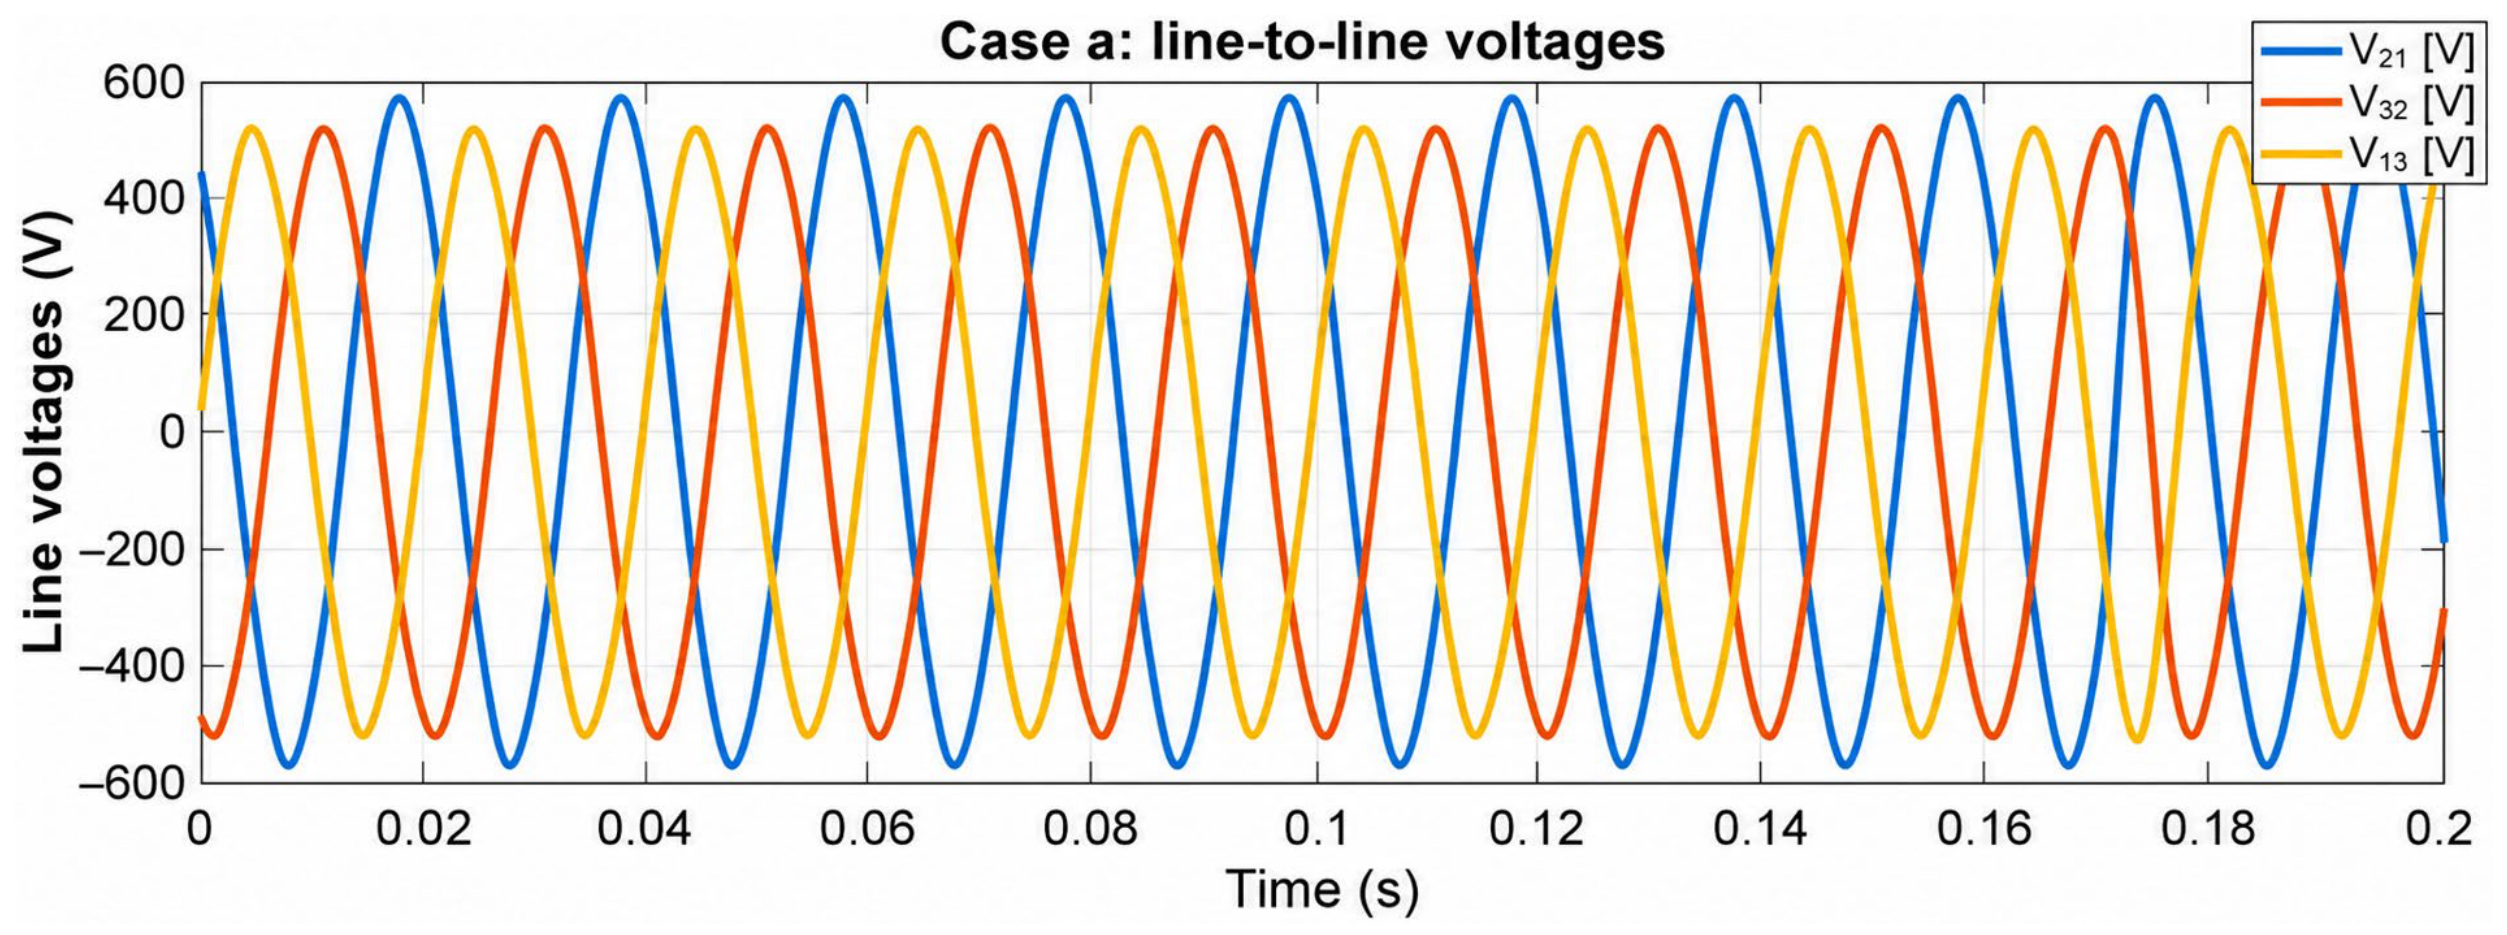
Figure 4 shows the three line-to-line voltages for the most severe operating condition (case a), corresponding to high load and high voltage unbalance, over the first 0.3 s of the acquisition. Only small differences in voltage magnitude (voltage drop) can be observed, especially in V32 and V13, while the waveforms remain nearly phase-shifted by 120°, making the imposed unbalance difficult to identify by visual inspection alone. Note that the presented image represents the most severe unbalance condition among the analyzed cases.
Figure 4.
Three-phase line voltages versus time (unbalanced case a).
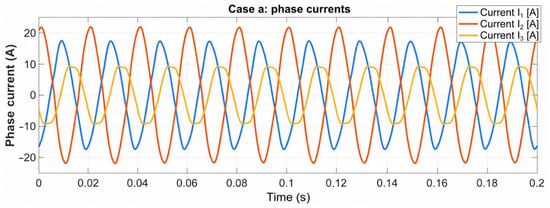
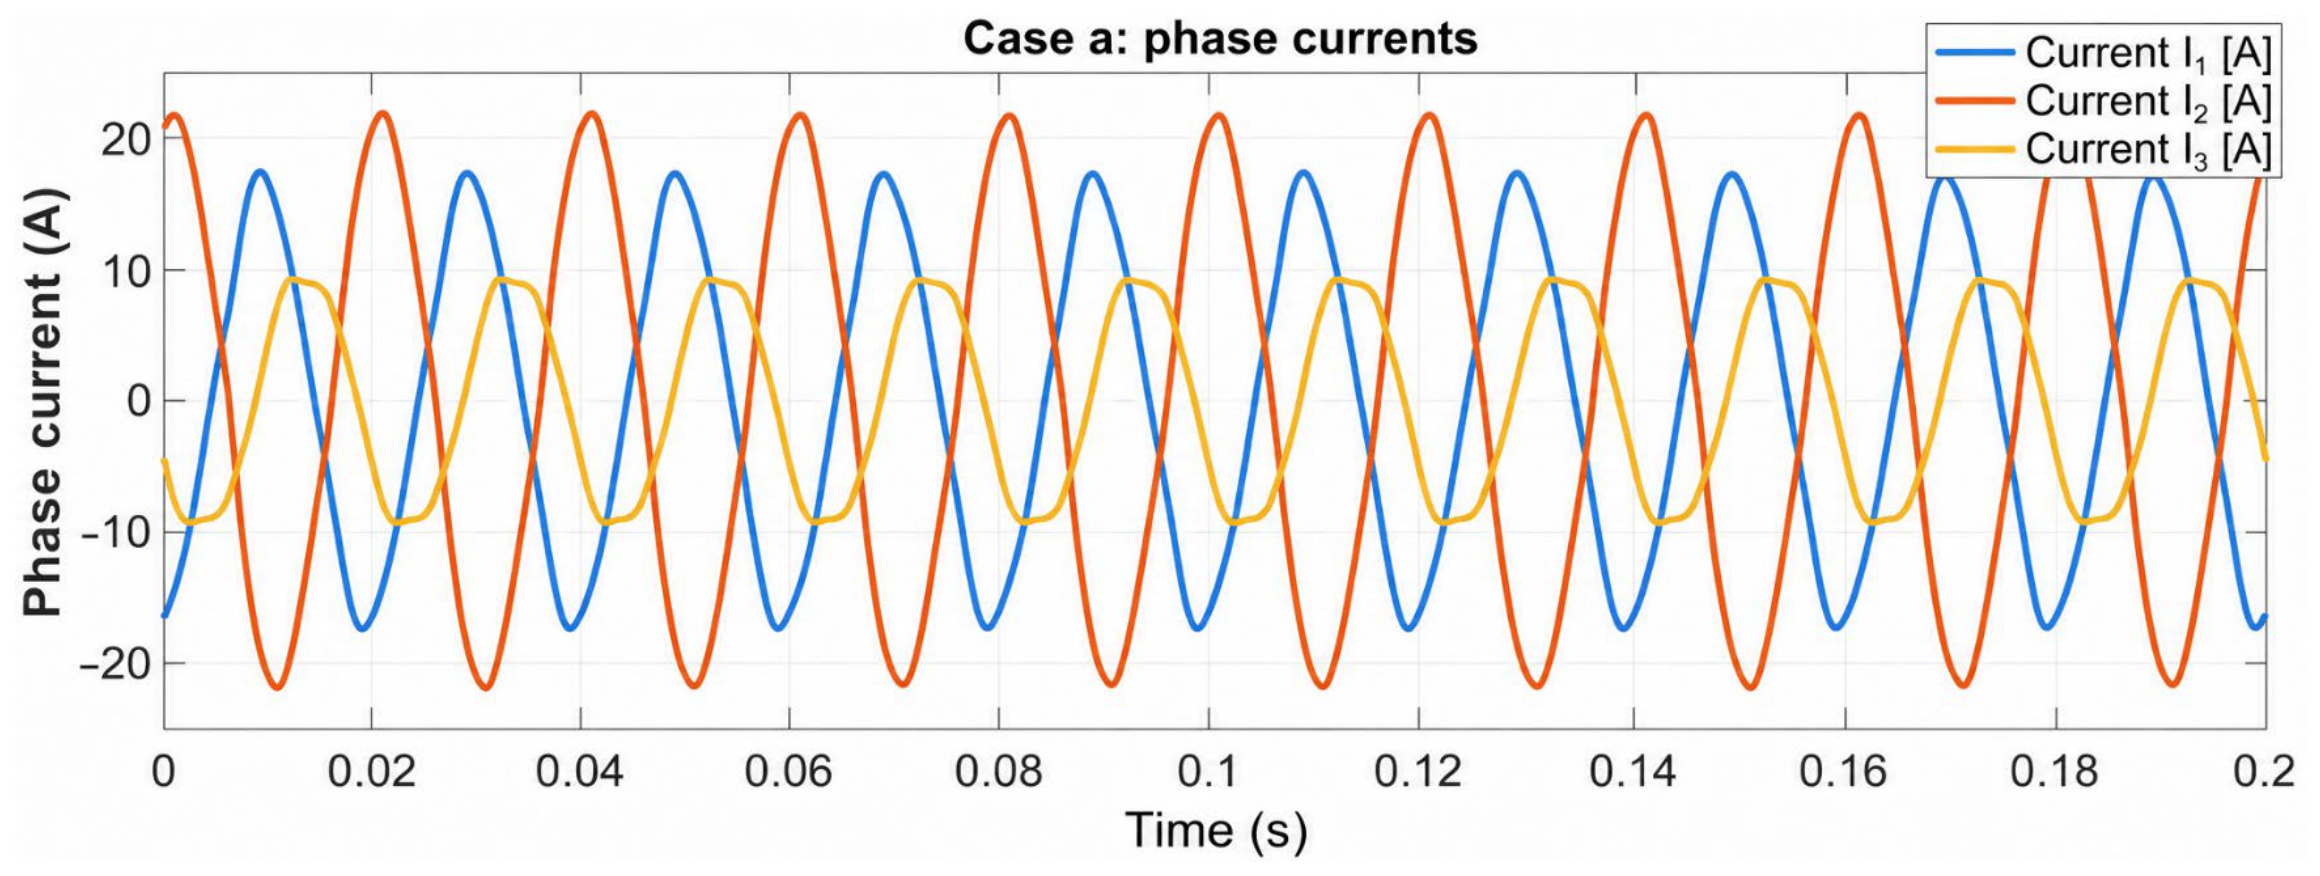
Unlike the line-to-line voltage waveforms, the three-phase current waveforms shown in Figure 5 exhibit clear amplitude differences among the three phases. In addition, waveform distortion is readily observable in Phases 1 and 3, whereas Phase 2 remains comparatively less affected. With sufficient magnification, slight differences in the phase angles can also be identified. A quantitative assessment of the current amplitudes and phase angles is presented in Section 3.2 and Section 3.3 using dedicated indicators. Likewise, although a detailed harmonic analysis is reported in Section 4, the Total Harmonic Distortion (THD) [7,8,9] is introduced here to provide an initial quantitative assessment of waveform distortion.
Figure 5.
Three-phase currents versus time (unbalanced case a).
The THD values of the measured line-to-line voltages and phase currents are summarized in Table 3 and Table 4, respectively. As observed from the waveform inspection, the current signals exhibit significantly greater variability than the voltage signals. The highest THD values generally occur under the most severe voltage-unbalance conditions. Moreover, the quantities associated with Phase 3, namely the current I3 and the line-to-line voltage V13, consistently exhibit higher THD values than the corresponding quantities of the remaining phases.
Table 3.
THD of the line-to-line voltages.
Table 4.
THD of the line currents.
3.2. Voltage and Current Unbalance Evaluation
According to IEC 60034-26 [28], voltage unbalance is defined in terms of the symmetrical components of the three line-to-line voltage phasors Vab, Vbc, and Vca. In particular, it is expressed as the ratio between the magnitudes of the negative- and positive-sequence voltage components, as given in (4) [6]:
where Vpos and Vneg are the positive- and negative-sequence voltage components, obtained from (5) and (6), respectively.
while α and α2 are the complex operators defined in (7).
For practical purposes, the NEMA definition is commonly adopted [29,30] because it requires only the RMS values of the three line-to-line voltages, avoiding the use of symmetrical components and complex phasors. According to this definition, the voltage unbalance is calculated as in (8).
where Vi (i = 1, 2, 3) represents the RMS value of each line-to-line voltage, and Vavg denotes their arithmetic mean.
In the present work, the same maximum-deviation-from-average formulation is analogously applied to the RMS values of the three-phase currents to define a magnitude-based current-unbalance index. Specifically, the voltage quantities in (8) are replaced by the corresponding phase-current RMS values and their arithmetic mean. This definition has previously been adopted for current-unbalance assessment [31,32,33], and accounts for current-magnitude unbalance, whereas phase-angle asymmetry is evaluated separately in Section 3.3.
As shown in [6], for moderate levels of voltage unbalance, the IEC and NEMA definitions given by (4) and (8), respectively, provide nearly equivalent results, with negligible differences for practical applications such as induction motor derating. For this reason, the NEMA definition given by (8) is adopted throughout this work to evaluate voltage unbalance, while the analogous magnitude-based formulation described above is used to quantify current unbalance. Nevertheless, the phase relationships among the three-phase quantities are further analyzed in the following section. The calculated voltage and current-unbalance values are summarized in Table 5.
Table 5.
Measured voltage unbalance and magnitude-based current-unbalance index.
As expected, even relatively small voltage-unbalance levels produced substantially larger current unbalance owing to the low negative-sequence impedance of the induction motor [6,8,9]. In the most severe operating condition (case a), corresponding to 80% load and 6.50% voltage unbalance, the measured current unbalance reached 37.87%, corresponding to a current-to-voltage unbalance ratio of approximately 5.8. This ratio is consistent with the amplification factors reported in the literature for induction motors operating under unbalanced supply conditions [9,30]. At lower load levels, the same rheostat setting (case d) produced a smaller voltage unbalance while resulting in a comparable current unbalance. This behavior is associated with the phase-angle unbalance introduced by the supply asymmetry, as discussed in the following section.
According to NEMA recommendations, continuous operation with voltage-unbalance levels exceeding approximately 2% is generally discouraged because of the associated increase in winding temperature and insulation thermal stress [8,9]. Moreover, although variable frequency drives (VFDs) provide balanced output voltages to the motor regardless of the input supply conditions, they also require a reasonably balanced three-phase supply, since excessive voltage unbalance adversely affects the operation of the front-end rectifier [8,9].
3.3. Phase-Angle Analysis
Besides the magnitude of the harmonic components, the phase angles of the fundamental-frequency component (50 Hz) provide valuable information on the symmetry of the three-phase system and the operating power factor under both balanced and unbalanced supply conditions. In an ideal balanced three-phase system, the phase quantities have equal magnitudes and are phase-displaced by exactly 120°. Any deviation from these conditions results in voltage unbalance, which may arise from several causes, including single-phase undervoltage, two-phase undervoltage, single-phase overvoltage, or unequal phase-angle displacement [9].
For each of the seven operating conditions, the phase angles of the three line-to-line voltages (V21, V32, V13) and the three-phase currents (I1, I2, I3) are extracted from the complex FFT coefficients corresponding to the frequency bin closest to the 50 Hz fundamental component. The resulting phase angles are then converted from radians to degrees and unwrapped over the range from −180° to +180°. To facilitate comparison among the different operating conditions, the phase angles of V21 and I1 are independently taken as 0° references, and the remaining voltage and current phase angles are expressed relative to these quantities. The relative phase angles of the line-to-line voltages are summarized in Table 6.
Table 6.
Relative phase angles of the line-to-line voltages (V21 as reference).
The results in Table 6 lead to the following observations:
- The balanced operating conditions (cases c, f, and g), corresponding to zero rheostat insertion, exhibit line-to-line voltage phase separations very close to the ideal value of 120°, with deviations below ±0.2°. This confirms that the supply remained effectively balanced in the absence of the introduced voltage unbalance.
- In the unbalanced operating conditions (cases a, b, d, and e), the phase angles of V32 and V13 progressively deviate from the ideal 120°, reaching a maximum deviation of approximately 10° in case b (80% load, 50% rheostat insertion). These results indicate that the imposed asymmetry affects not only the voltage magnitudes but also the phase-angle relationships among the three phases, introducing both magnitude and angular unbalance.
The relative phase angles of the phase currents are reported in Table 7. Compared with the voltages, the phase-angle unbalance is significantly amplified in the current signals because of the low negative-sequence impedance of the induction motor [7,8,9].
Table 7.
Relative phase angles of the phase currents (I1 as reference).
Under balanced operating conditions (cases c, f, and g), the current phase separations remain within ±3° of the ideal 120°. Conversely, under the most severe unbalance conditions (cases a and d, 90% rheostat insertion), the phase-angle deviations increase to approximately ±30°, with the largest deviation observed in Phase 3 current (I3), corresponding to the phase connected to the rheostat.
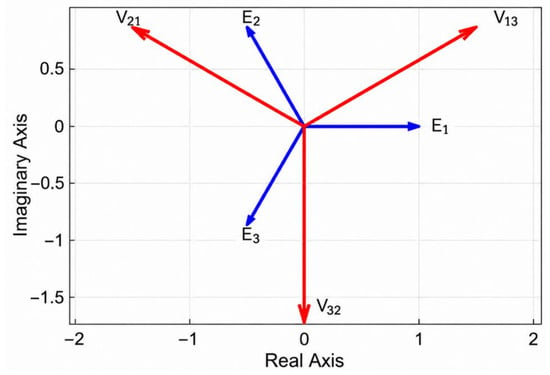
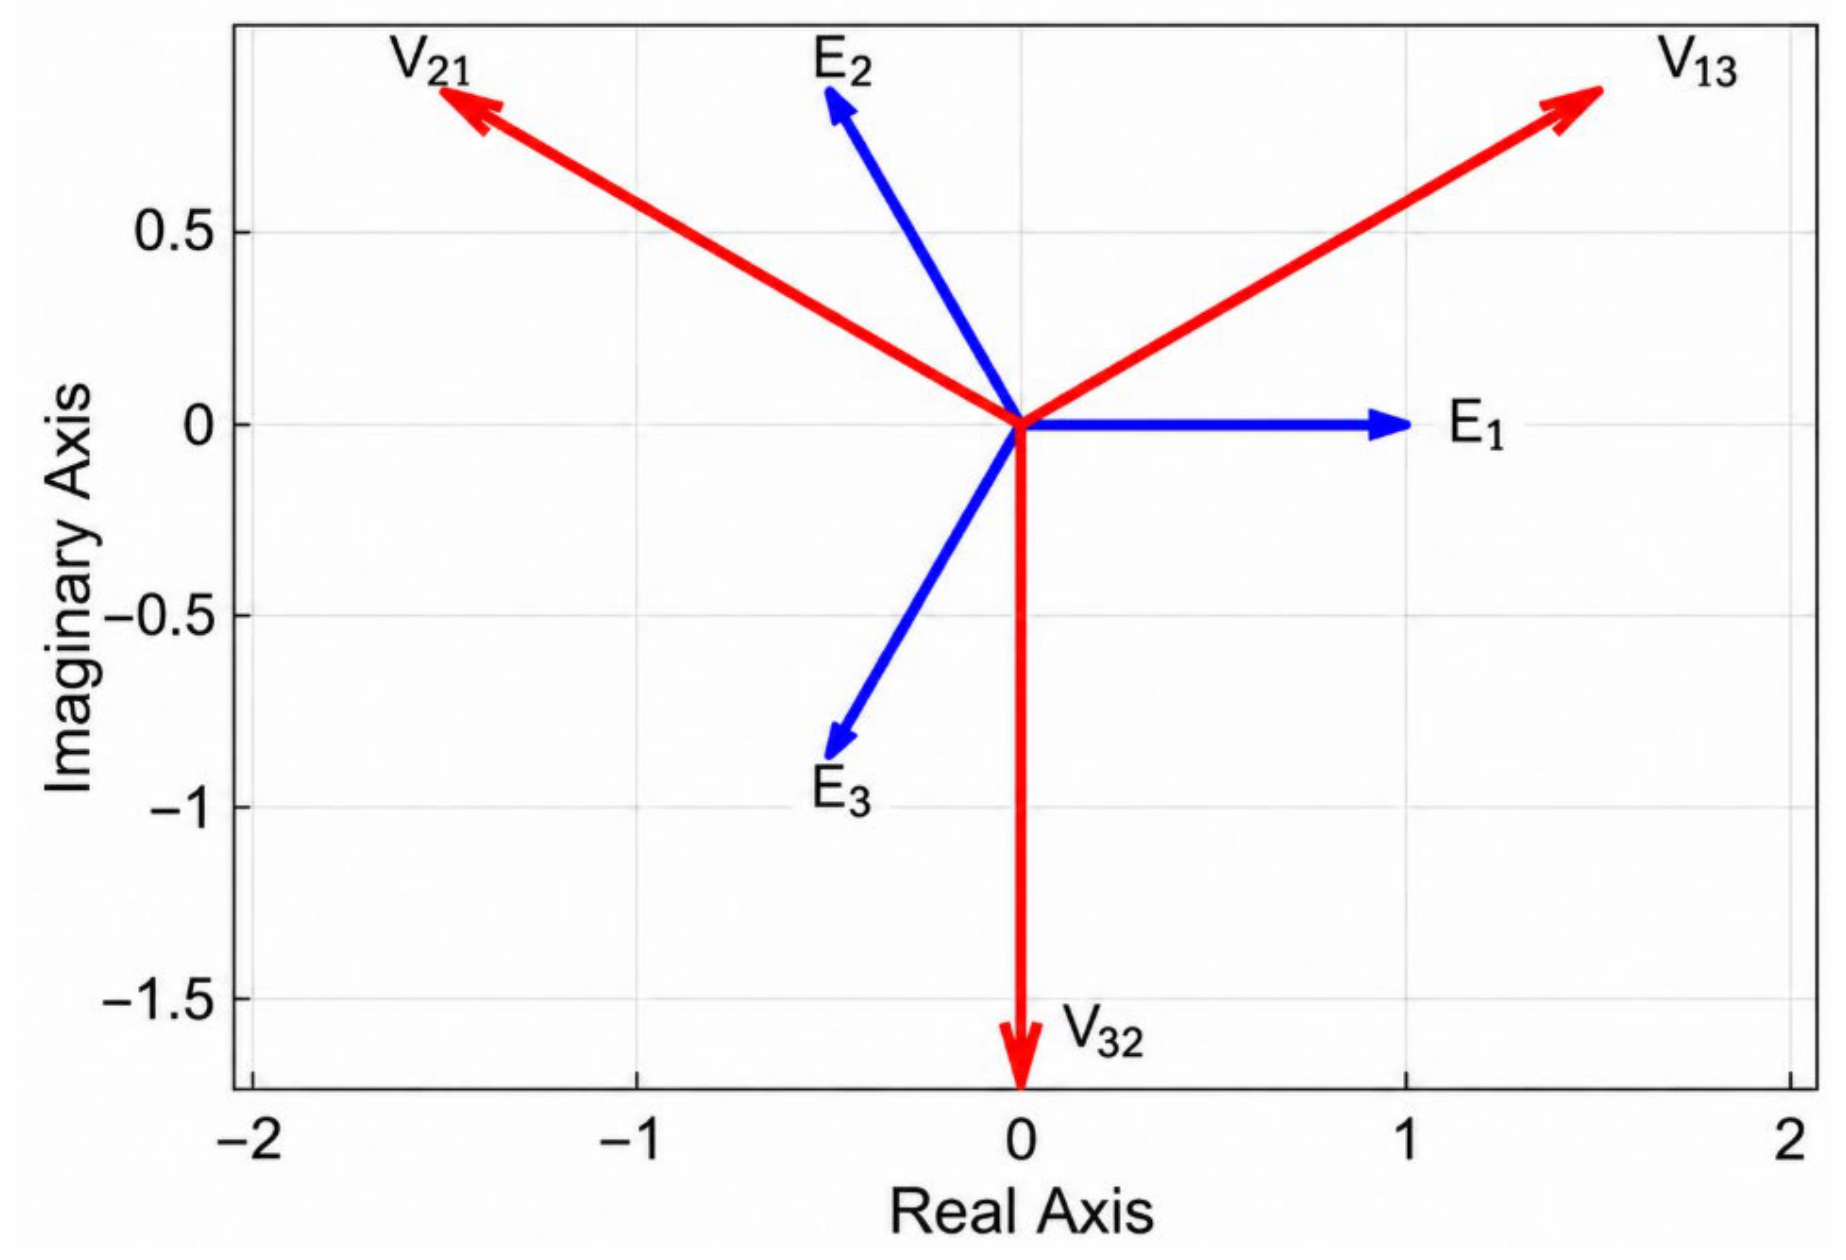
To facilitate visualization of the phase relationships, normalized phasor diagrams were constructed from the extracted phase angles. Owing to the phase connections adopted in the experimental setup, an inverse phase sequence was obtained, in which the phase voltages successively cross a fixed angular reference in the order E1, E3, E2 under counterclockwise rotation. Under balanced operating conditions, the line-to-line voltages lead the corresponding phase voltages by 30°, in agreement with circuit theory. The ideal phasor diagram for a balanced system operating with an inverse phase sequence is illustrated in Figure 6.
Figure 6.
Phasor diagram of the balanced operating condition (case c), illustrating the relationship between the line-to-line (V21, V32, V13) and reconstructed phase voltages (E1, E2, E3).
The consistency of the calculated phase angles is validated against the expected voltage–current phase displacement of the induction motor. For this analysis, both voltage and current phasors are referred to the same angular reference, unlike the relative phase-angle calculations reported in Table 6 and Table 7, thereby allowing direct evaluation of the current lag with respect to the corresponding phase voltage.
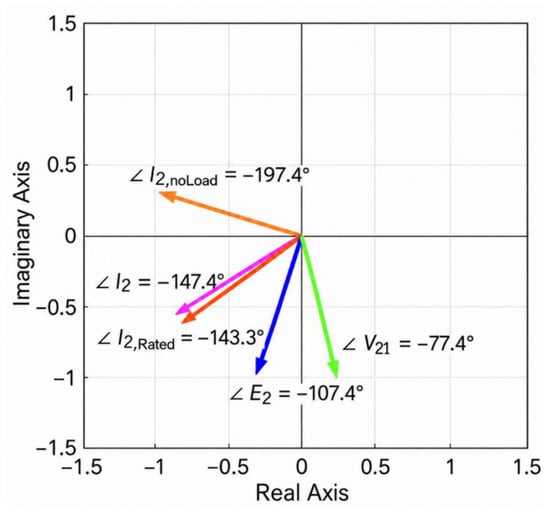
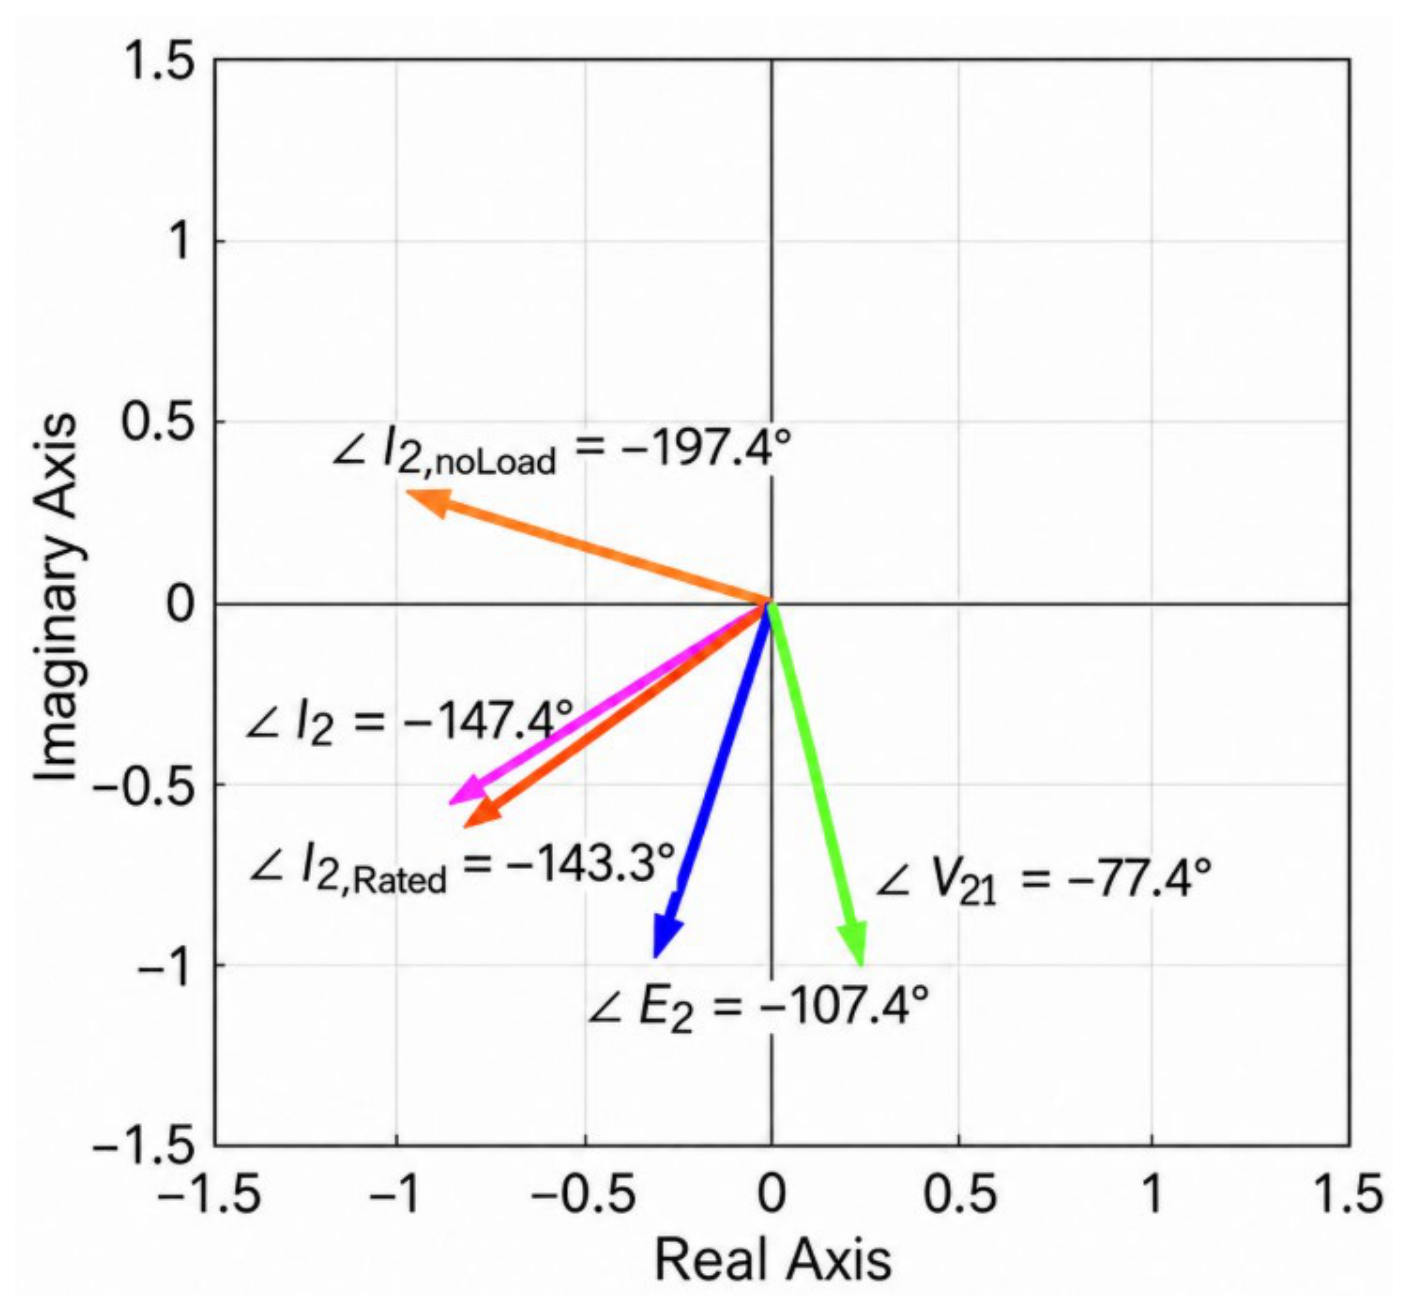
For an inductive load, the current is expected to lag the corresponding phase voltage by an angle ranging from 90° under no-load conditions to φrated = arccos(0.81) ≈ 35.9° at rated load. These values refer to the relative voltage–current phase displacement rather than to the absolute angular position of the phasors. Figure 7 illustrates this validation for the phase current I2 under the balanced 80% load condition (case c). Phase 2 is selected as a representative example, although equivalent results are obtained for the other two phases. Since the phase voltage E2 is located at −107.4°, the expected absolute angular position of I2 ranges from −197.4° (90° lag under no-load conditions) to −143.3° (35.9° lag at rated load). The measured angle of −147.4° lies within this interval and is noticeably closer to the rated-load limit, as expected for the tested operating condition corresponding to 80% of the rated load. Therefore, the measured phase angle not only satisfies the expected physical bounds but also agrees with the actual motor loading, providing additional validation of the phase-angle extraction procedure.
Figure 7.
Detailed phasor diagram for I2 in test case c (80% load, balanced supply). The measured angle (−147.4°) lies between the theoretical no-load (−197.4°) and rated-load (−143.3°) limits, confirming the validity of the phase-angle extraction procedure.
Under unbalanced operating conditions, the three current phasors are no longer symmetrically spaced, and the power factor differs among the phases. This asymmetry in the current phase angles represents an additional diagnostic feature that can be extracted from the same circuit-breaker measurements without requiring additional sensors. The exploitation of phase-angle asymmetry as a quantitative indicator of supply voltage unbalance deserves further investigation and will be the subject of future work.
4. Frequency-Domain Analysis
4.1. Current Harmonic Indicators
In this work, the twice-slip-frequency sidebands and the 3rd, 5th, and 7th current harmonics are investigated as candidate indicators of supply voltage unbalance [21,22]. Their behavior under the different operating conditions is analyzed in the following subsections.
4.1.1. Twice-Slip-Frequency Sideband Analysis
The twice-slip-frequency sidebands (f2s), traditionally associated with rotor asymmetries and predicted by (1), are identified in all loaded operating conditions (cases a–f), whereas they are not detectable under no-load conditions (case g). At no load, the very small slip shifts the sidebands too close to the fundamental component, causing them to fall below the measurement noise floor, as commonly reported in the MCSA literature [10,11,12,13].
The measured sideband magnitudes, together with the slip estimated by rearranging (1), are summarized in Table 8. The slip values reported in the table correspond to the average of the estimates obtained from the three-phase currents.
Table 8.
Measured twice-slip-frequency sideband magnitudes for the three-phase currents and corresponding slip estimates.
Across the loaded operating conditions, the twice-slip-frequency sideband magnitudes range from approximately −57 dB to −49 dB relative to the fundamental component. The highest (least negative) values are observed at 30% load rather than under the most severe voltage-unbalance conditions. Furthermore, under high-load conditions, the sidebands exhibit their largest amplitudes in the balanced case (case c).
These observations lead to two conclusions. First, the tested motor is unlikely to exhibit broken rotor bars, since the characteristic twice-slip-frequency sidebands are known to increase with load in the presence of rotor faults [11]. Second, the sideband magnitude does not exhibit a clear correlation with the imposed voltage-unbalance level, indicating that this feature is not a reliable indicator for supply voltage-unbalance detection.
It is worth noting that, under high-load conditions, the motor slip increases in the unbalanced cases compared with the corresponding balanced case (Table 8). Specifically, the slip increases from 2.19% in the balanced case c to 2.78% and 3.07% in the unbalanced cases a and b, respectively. Since the load torque is maintained approximately constant, this increase in slip corresponds to a reduction in rotational speed and indicates a deterioration in motor operating performance under voltage-unbalance conditions. Although motor temperature and mechanical vibration were not measured in the present experimental campaign, previous studies have shown that voltage unbalance increases motor losses and winding temperature and may also produce additional mechanical vibration [3,4,5,6,7,8,9]. At lower load levels (cases d–f), no clear relationship between slip and voltage unbalance is observed, indicating that the effect on rotational speed is considerably less pronounced under the investigated light-load conditions.
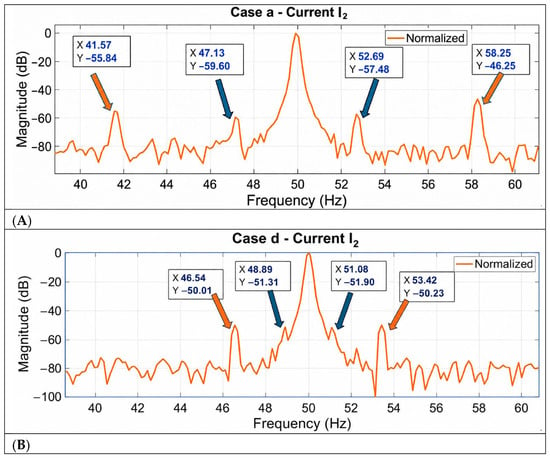
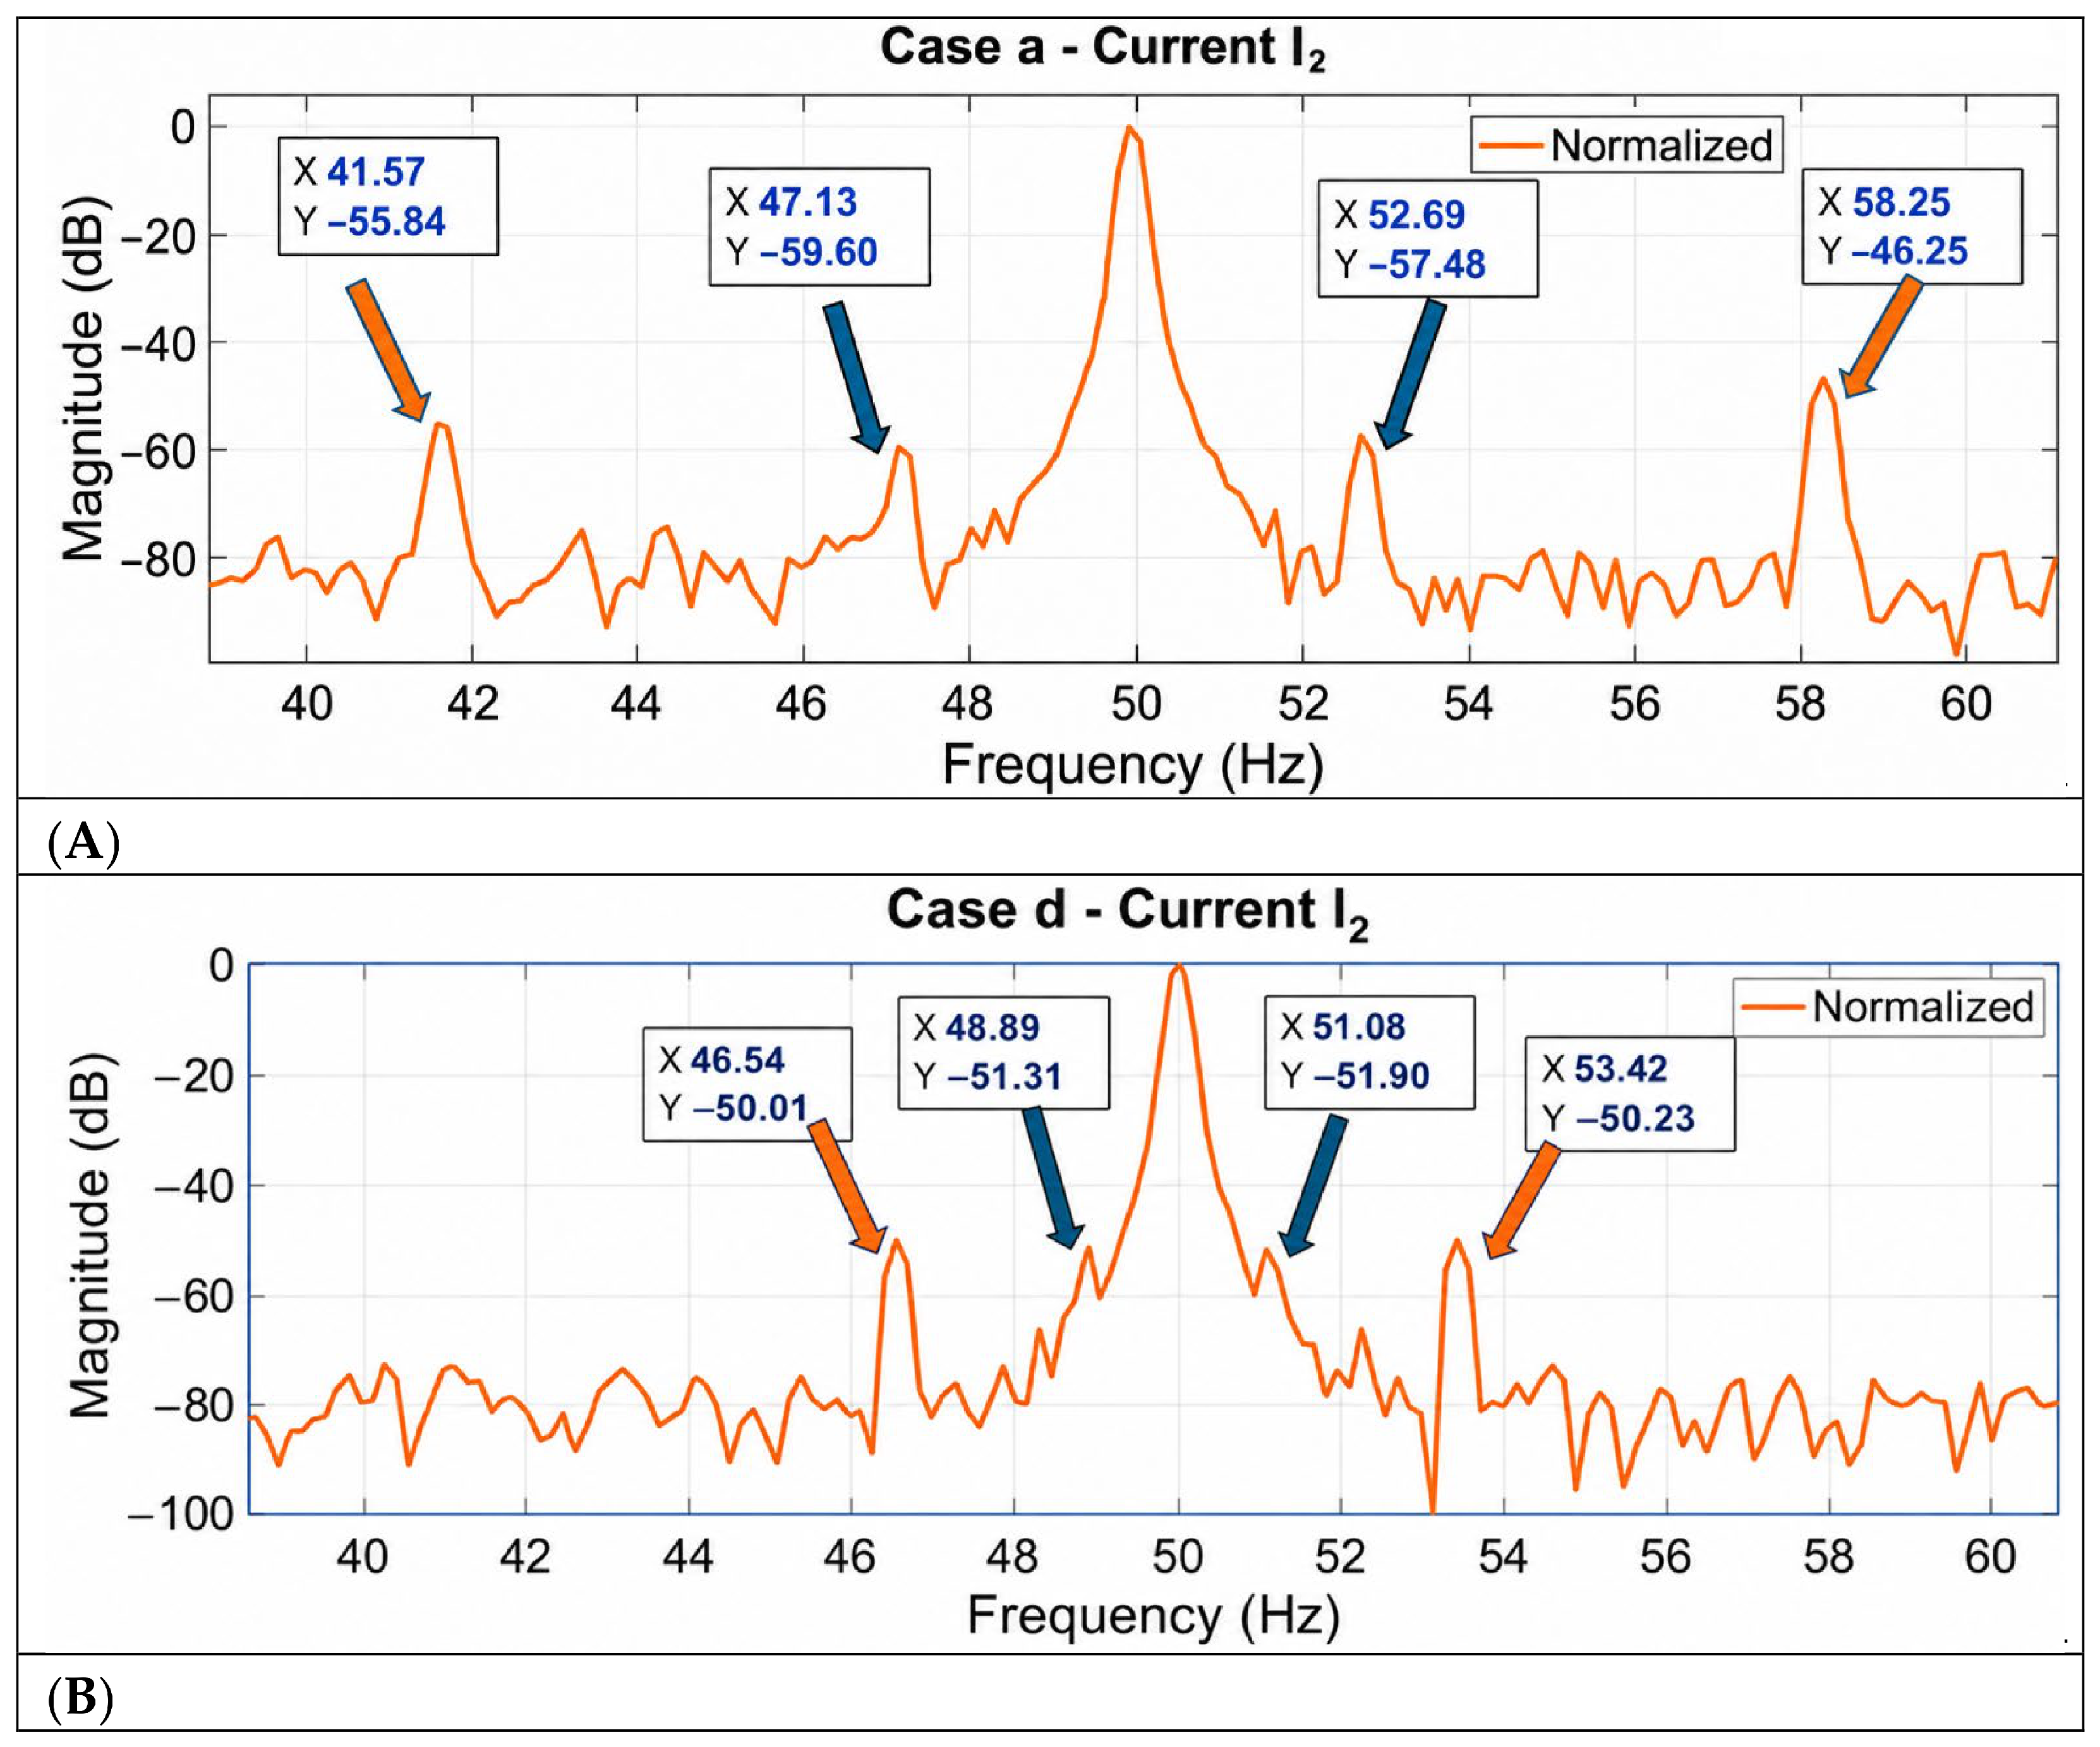
Representative current spectra for cases a and d are shown in Figure 8. For completeness, the figure also highlights the six-times-slip-frequency sidebands, which exhibit relatively high amplitudes in the measured spectra.
Figure 8.
Twice-slip-frequency (blue arrows) and six-times-slip-frequency (orange arrows) sidebands in the current spectra for (A) case a and (B) case d.
4.1.2. Assessment of the 3rd, 5th, and 7th Current Harmonics
In contrast to the twice-slip-frequency sidebands, the 3rd current harmonic exhibits a clear and consistent correlation with the supply voltage-unbalance level. At comparable load conditions, its magnitude increases by approximately 20–30 dB from the balanced cases (c and f) to the most unbalanced cases (a and d), as summarized in Table 9. This behavior is well documented in the literature [6,10,12].
Table 9.
3rd current harmonic magnitudes (150 Hz) for the three-phase currents.
Unlike the 3rd harmonic, the 5th and 7th current harmonics do not exhibit a clear correlation with the imposed voltage-unbalance level. This observation agrees with the findings reported in [7]. Their measured magnitudes are summarized in Table 10 and Table 11 for completeness.
Table 10.
5th current harmonic magnitudes (250 Hz) for the three-phase currents.
Table 11.
7th current harmonic magnitudes (350 Hz) for the three-phase currents.
A further observation is that the 3rd harmonic magnitude of I3 is consistently higher than that of the other two phases, particularly under high-load conditions (cases a and d). This result is expected because the rheostat used to introduce the voltage unbalance—representing, for example, a high-resistance terminal connection—is connected to Phase 3. It is also worth noting that, even under balanced operating conditions (cases c, f, and g), noticeable differences in the 3rd harmonic magnitude are observed among the three-phase currents, with deviations exceeding 10 dB in some cases. This variability should therefore be taken into account when comparing harmonic amplitudes across different phases. Therefore, although the 3rd current harmonic exhibits a large quantitative variation with supply voltage unbalance (approximately 20–30 dB between balanced and strongly unbalanced conditions), its substantial phase-to-phase variability, including under balanced operation, limits its selectivity as an indicator for affected-phase localization.
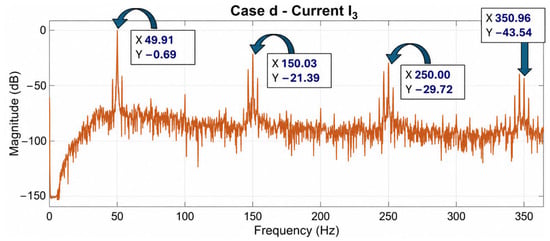
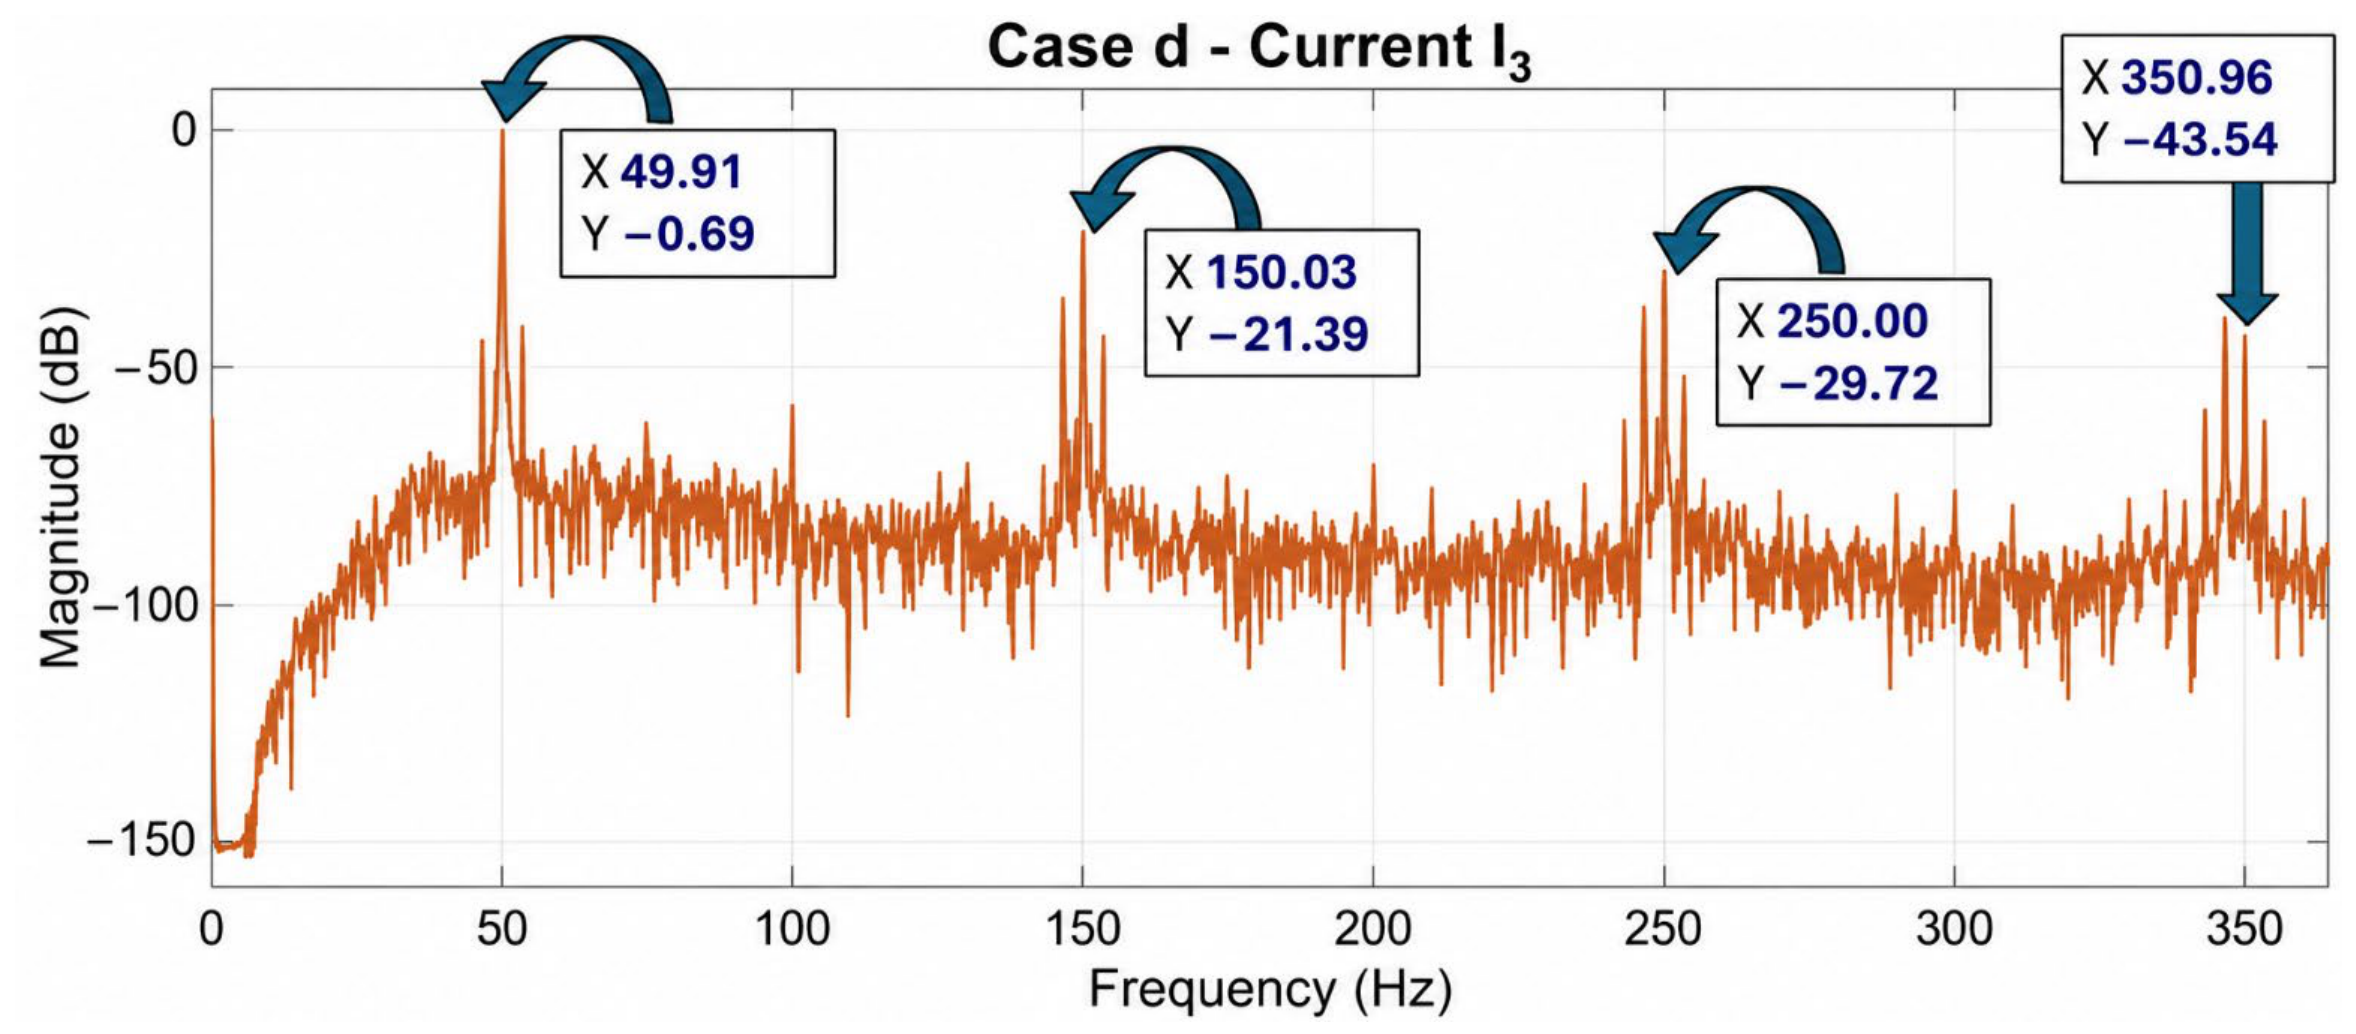
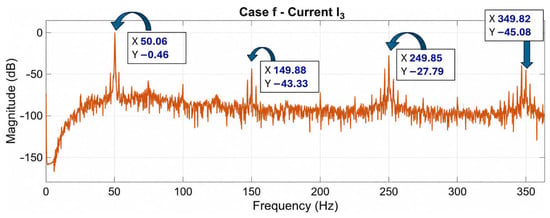
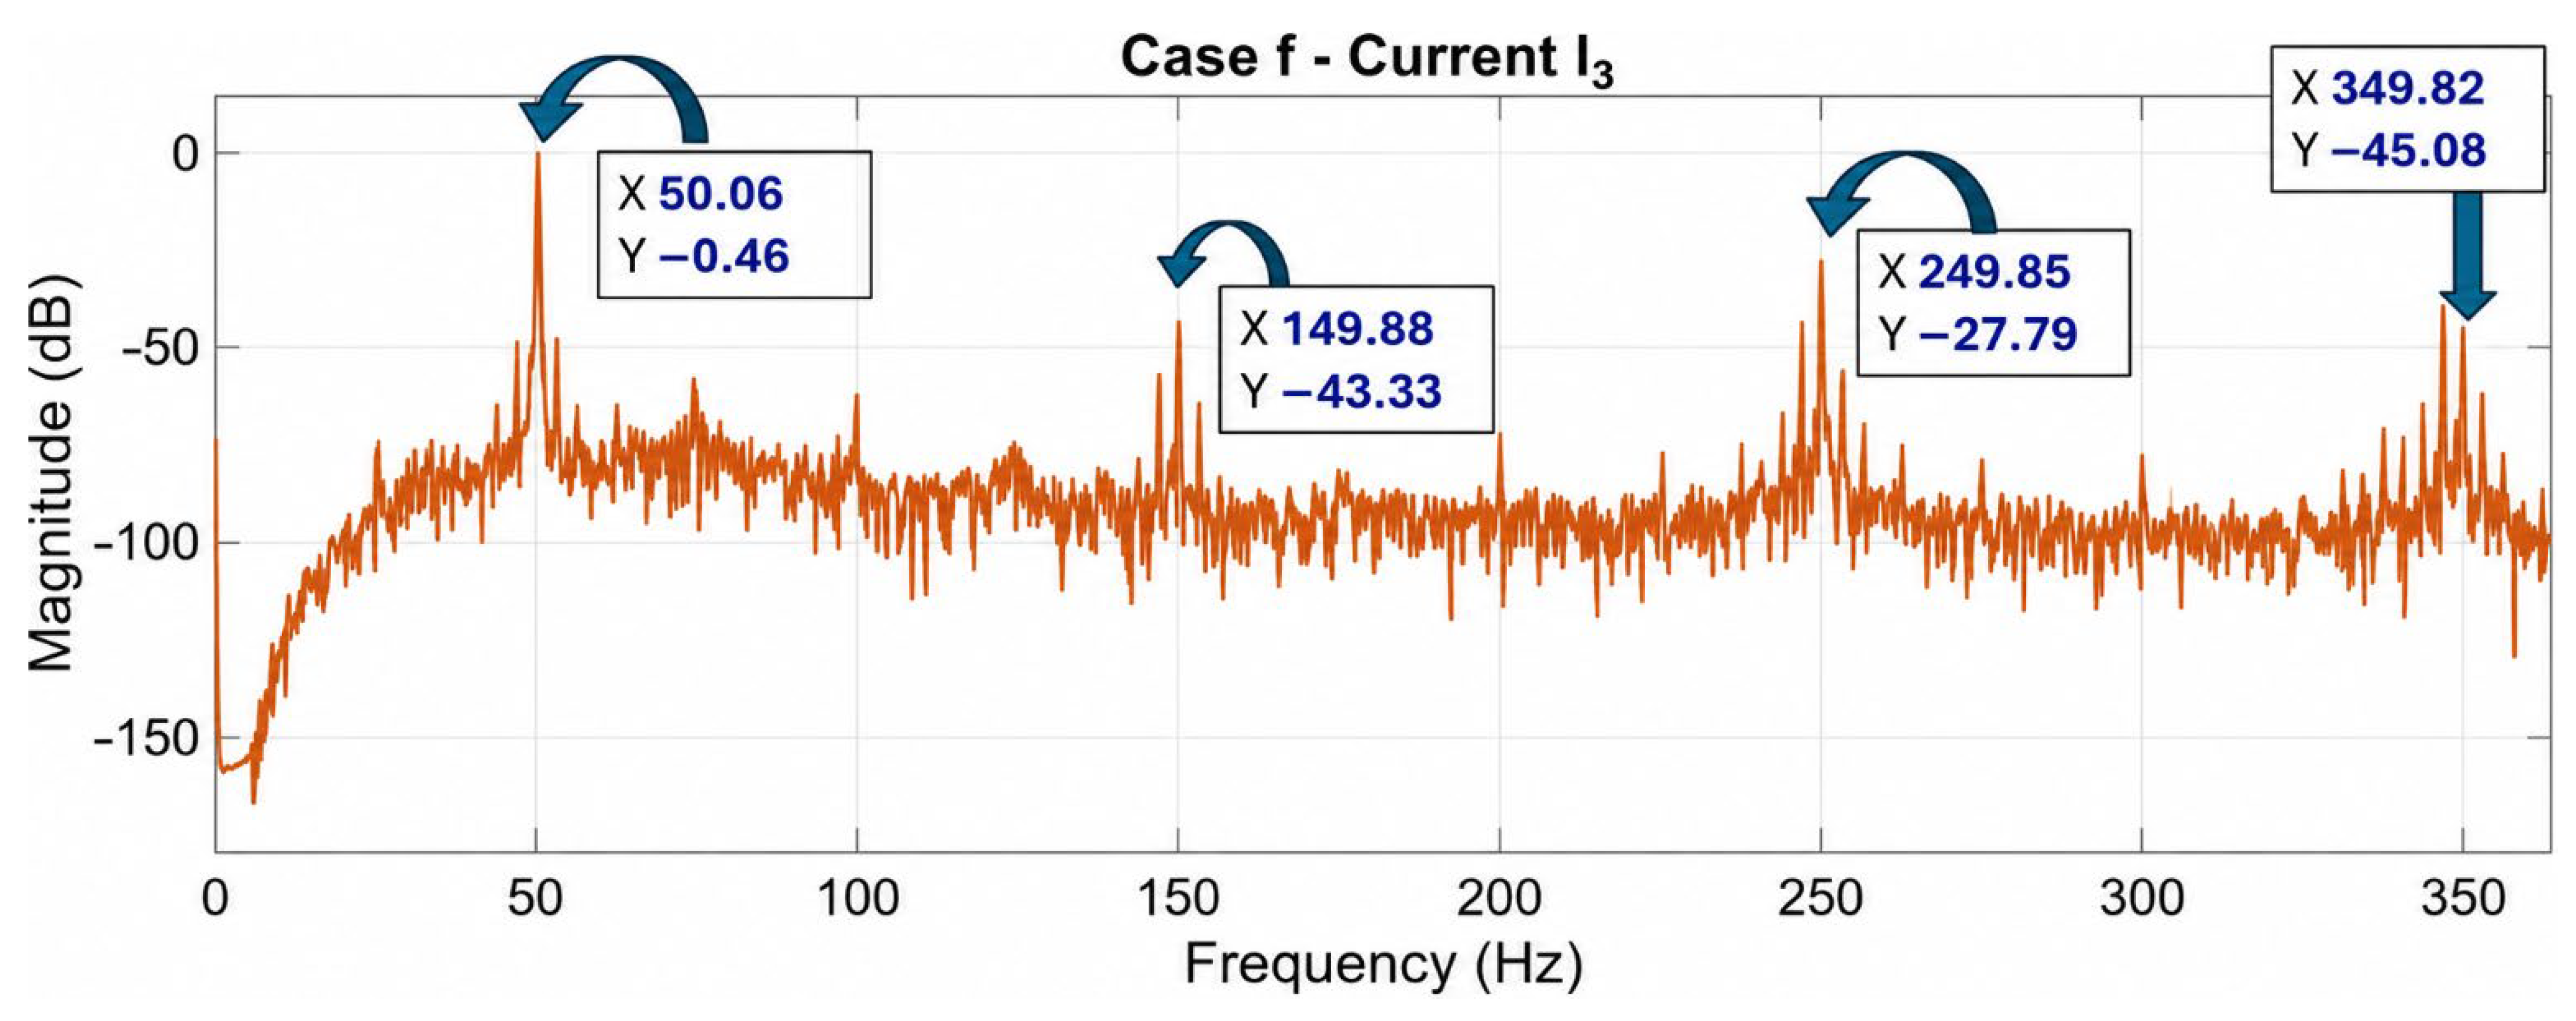
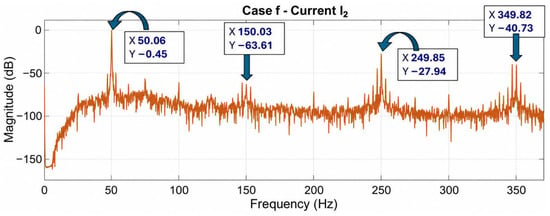
Expanded views of the current spectra, including the 3rd, 5th, and 7th harmonics, are presented in Figure 9, Figure 10 and Figure 11. A comparison between the unbalanced condition (case d, Figure 9) and the corresponding balanced condition at the same load level (case f, Figure 10) clearly highlights the significant increase in the 3rd harmonic under voltage-unbalance conditions. Furthermore, comparing Figure 10 and Figure 11, which correspond to I3 and I2 for the same operating condition (case f), reveals the variability of the harmonic amplitudes among different phases, even under balanced supply conditions.
Figure 9.
Expanded view of the spectrum of current I3 for case d.
Figure 10.
Expanded view of the spectrum of current I3 for case f.
Figure 11.
Expanded view of the spectrum of current I2 for case f.
The spectra also show the presence of several interharmonic components, some of which exhibit amplitudes higher than those of the adjacent harmonic components. For example, the lower sideband around the 7th harmonic exceeds the harmonic itself in several cases. The dominant interharmonic components are the six-times-slip-frequency sidebands.
4.2. Voltage Harmonic Indicators
Following the same approach adopted for the current spectra, three frequency-domain indicators are computed from the line-to-line voltage signals: the twice-slip-frequency sidebands, the 3rd, 5th, and 7th voltage harmonics, and the six-times-slip-frequency sidebands. Their behavior under the different operating conditions is discussed in the following subsections.
4.2.1. Twice-Slip-Frequency Sidebands Analysis
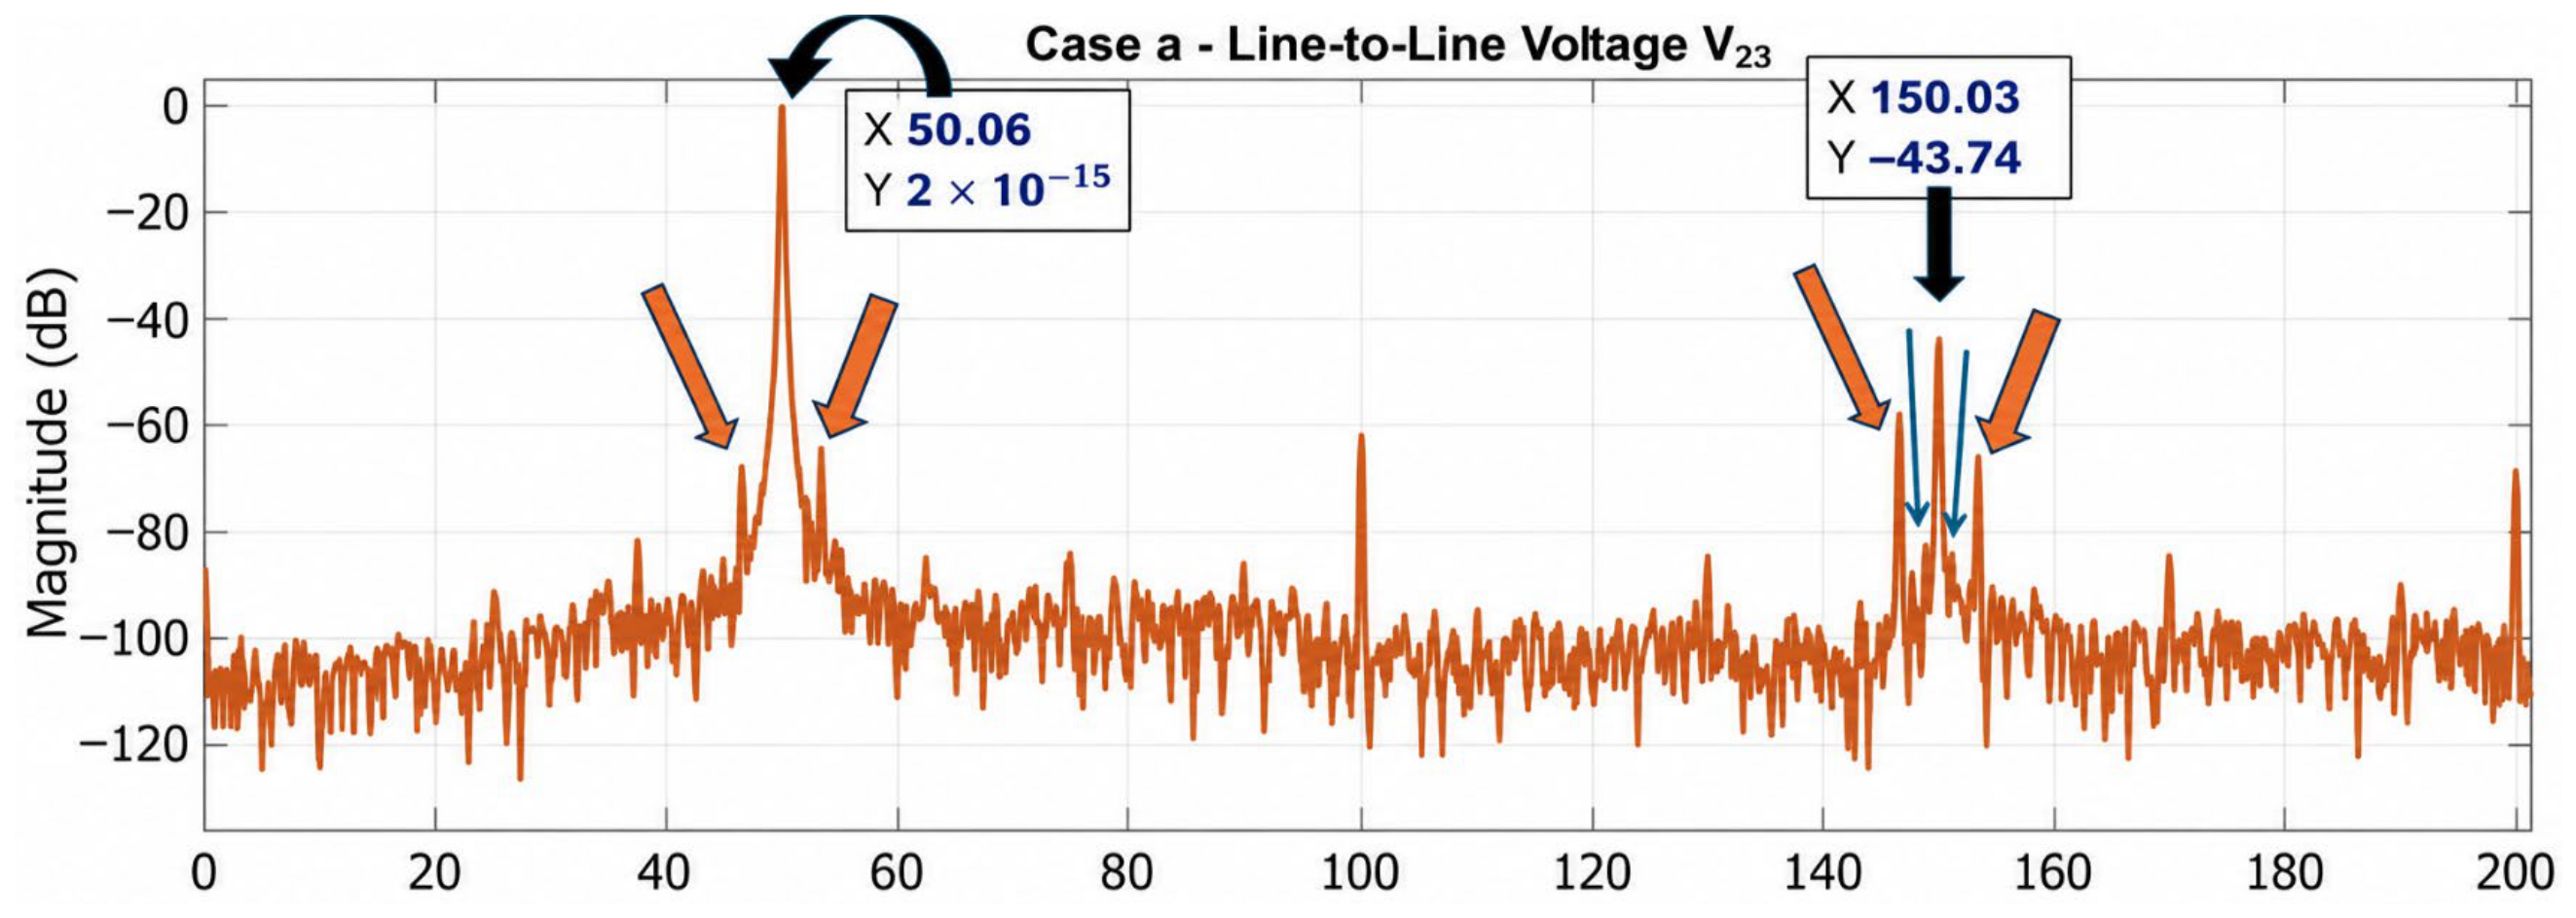
The twice-slip-frequency sidebands are also investigated in the line-to-line voltage spectra to enable a direct comparison with the corresponding current spectra. These components are detected only in the voltages involving phase 3, namely V32 and V13, whereas they are not observable in V21. As for the current spectra, the twice-slip-frequency sidebands are only identifiable under high-load operating conditions (cases a–c).
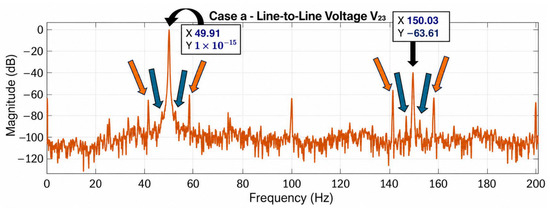
Representative voltage spectra are shown in Figure 12 and Figure 13. Figure 12 reports the V32 spectrum for case a (high load), while Figure 13 shows the corresponding spectrum for case d (low load). Consistent with the previous observations, the twice-slip-frequency sidebands are clearly visible around the fundamental component only under high-load conditions (Figure 12). Under low-load conditions (Figure 13), they are no longer observable around the fundamental, although weak components can still be identified around the 3rd harmonic. In contrast, the six-times-slip-frequency sidebands remain clearly visible in both operating conditions and are addressed in Section 4.2.3.
Figure 12.
Twice-slip-frequency (blue arrows) and six-times-slip-frequency (orange arrows) sidebands in the V32 spectrum for case a (high-load condition).
Figure 13.
Twice-slip-frequency (blue arrows) and six-times-slip-frequency (orange arrows) sidebands in the V32 spectrum for case d (low-load condition).
4.2.2. Assessment of the 3rd, 5th, and 7th Line-to-Line Voltage Harmonics
Compared with the current spectra, the voltage spectra contain far fewer harmonic components. This indicates that the line-to-line voltages are predominantly sinusoidal, with a dominant fundamental component and only limited harmonic content. This observation is consistent with the THD values reported in Table 3, which range from 1.1% to 1.8%, confirming the high quality of the supply voltage. Nevertheless, the 3rd, 5th, and 7th voltage harmonics are clearly identifiable in the spectra. Therefore, these harmonic components are evaluated to assess their correlation with the imposed voltage-unbalance condition. The harmonic magnitudes are summarized in Table 12, Table 13 and Table 14.
Table 12.
3rd voltage harmonic magnitudes (150 Hz) for the three line-to-line voltages.
Table 13.
5th voltage harmonic magnitudes (250 Hz) for the three line-to-line voltages.
Table 14.
7th voltage harmonic magnitudes (350 Hz) for the three line-to-line voltages.
The results in Table 12, Table 13 and Table 14 show that the 5th voltage harmonic does not exhibit any clear correlation with the imposed voltage unbalance, whereas only a weak correlation is observed for the 7th harmonic. In the latter case, the most unbalanced operating conditions (cases a and d) produce harmonic magnitudes only 2–3 dB higher than those measured under the corresponding balanced conditions (cases c and f). A markedly different behavior is observed for the 3rd voltage harmonic (Table 12). For the line-to-line voltages V32 and V13, which involve the affected phase (i.e., Phase 3), the harmonic magnitude increases by approximately 20–25 dB under unbalanced operating conditions. By contrast, for V21, which does not involve the affected phase, the increase is much smaller, amounting to approximately 5 dB under high-load conditions and only about 1 dB under low-load conditions.
This behavior suggests that the 3rd voltage harmonic may be exploited not only to detect the presence of voltage unbalance but also to identify the affected phase, provided that all three line-to-line voltages are available. The affected phase can be identified as the phase common to the two line-to-line voltages exhibiting the largest increase in the 3rd harmonic magnitude. Equivalently, it is the phase not included in the line-to-line voltage exhibiting the smallest increase. In the present experiments, V32 and V13 exhibit the largest increase, whereas V21 shows only a limited variation; therefore, Phase 3, which is common to V32 and V13 and absent from V21, is correctly identified as the affected phase. This localization capability is not observed in the current spectra. As shown in Table 9, the magnitude of the 3rd current harmonic increases by a similar amount in all three-phase currents, typically by 20–30 dB from balanced to unbalanced operating conditions, making it unsuitable for identifying the affected phase. From a quantitative perspective, these results confirm that the 3rd voltage harmonic provides greater phase selectivity than the corresponding current harmonic. The markedly different variation among the three line-to-line voltages therefore provides additional diagnostic information for affected-phase localization.
4.2.3. Six-Times-Slip-Frequency Sidebands Analysis
As anticipated in Section 4.2.1, the six-times-slip-frequency sidebands are considerably more pronounced than the corresponding twice-slip-frequency sidebands in the voltage spectra. Furthermore, similarly to the 3rd voltage harmonic, these sidebands are observed only in the line-to-line voltages involving the affected phase, namely V32 and V13. The present experimental results suggest that these sidebands constitute a previously unreported diagnostic signature in the line-to-line voltage spectra, which have received considerably less attention than current signals in condition-monitoring applications.
From a physical perspective, supply voltage unbalance introduces a negative-sequence component that produces a magnetic field rotating in the direction opposite to the positive-sequence field. The resulting magnetic-field asymmetry may interact with rotor-related, slip-dependent electromagnetic phenomena and contribute to the modulation of the measured electrical quantities, potentially resulting in slip-dependent spectral sidebands. However, the present experimental results do not allow the specific mechanism responsible for the observed six-times-slip-frequency components to be uniquely identified. Therefore, the proposed interpretation should be regarded as a possible physical explanation rather than as a demonstrated generation mechanism. A detailed electromagnetic model and dedicated experimental investigations will be required to establish the physical origin of these components.
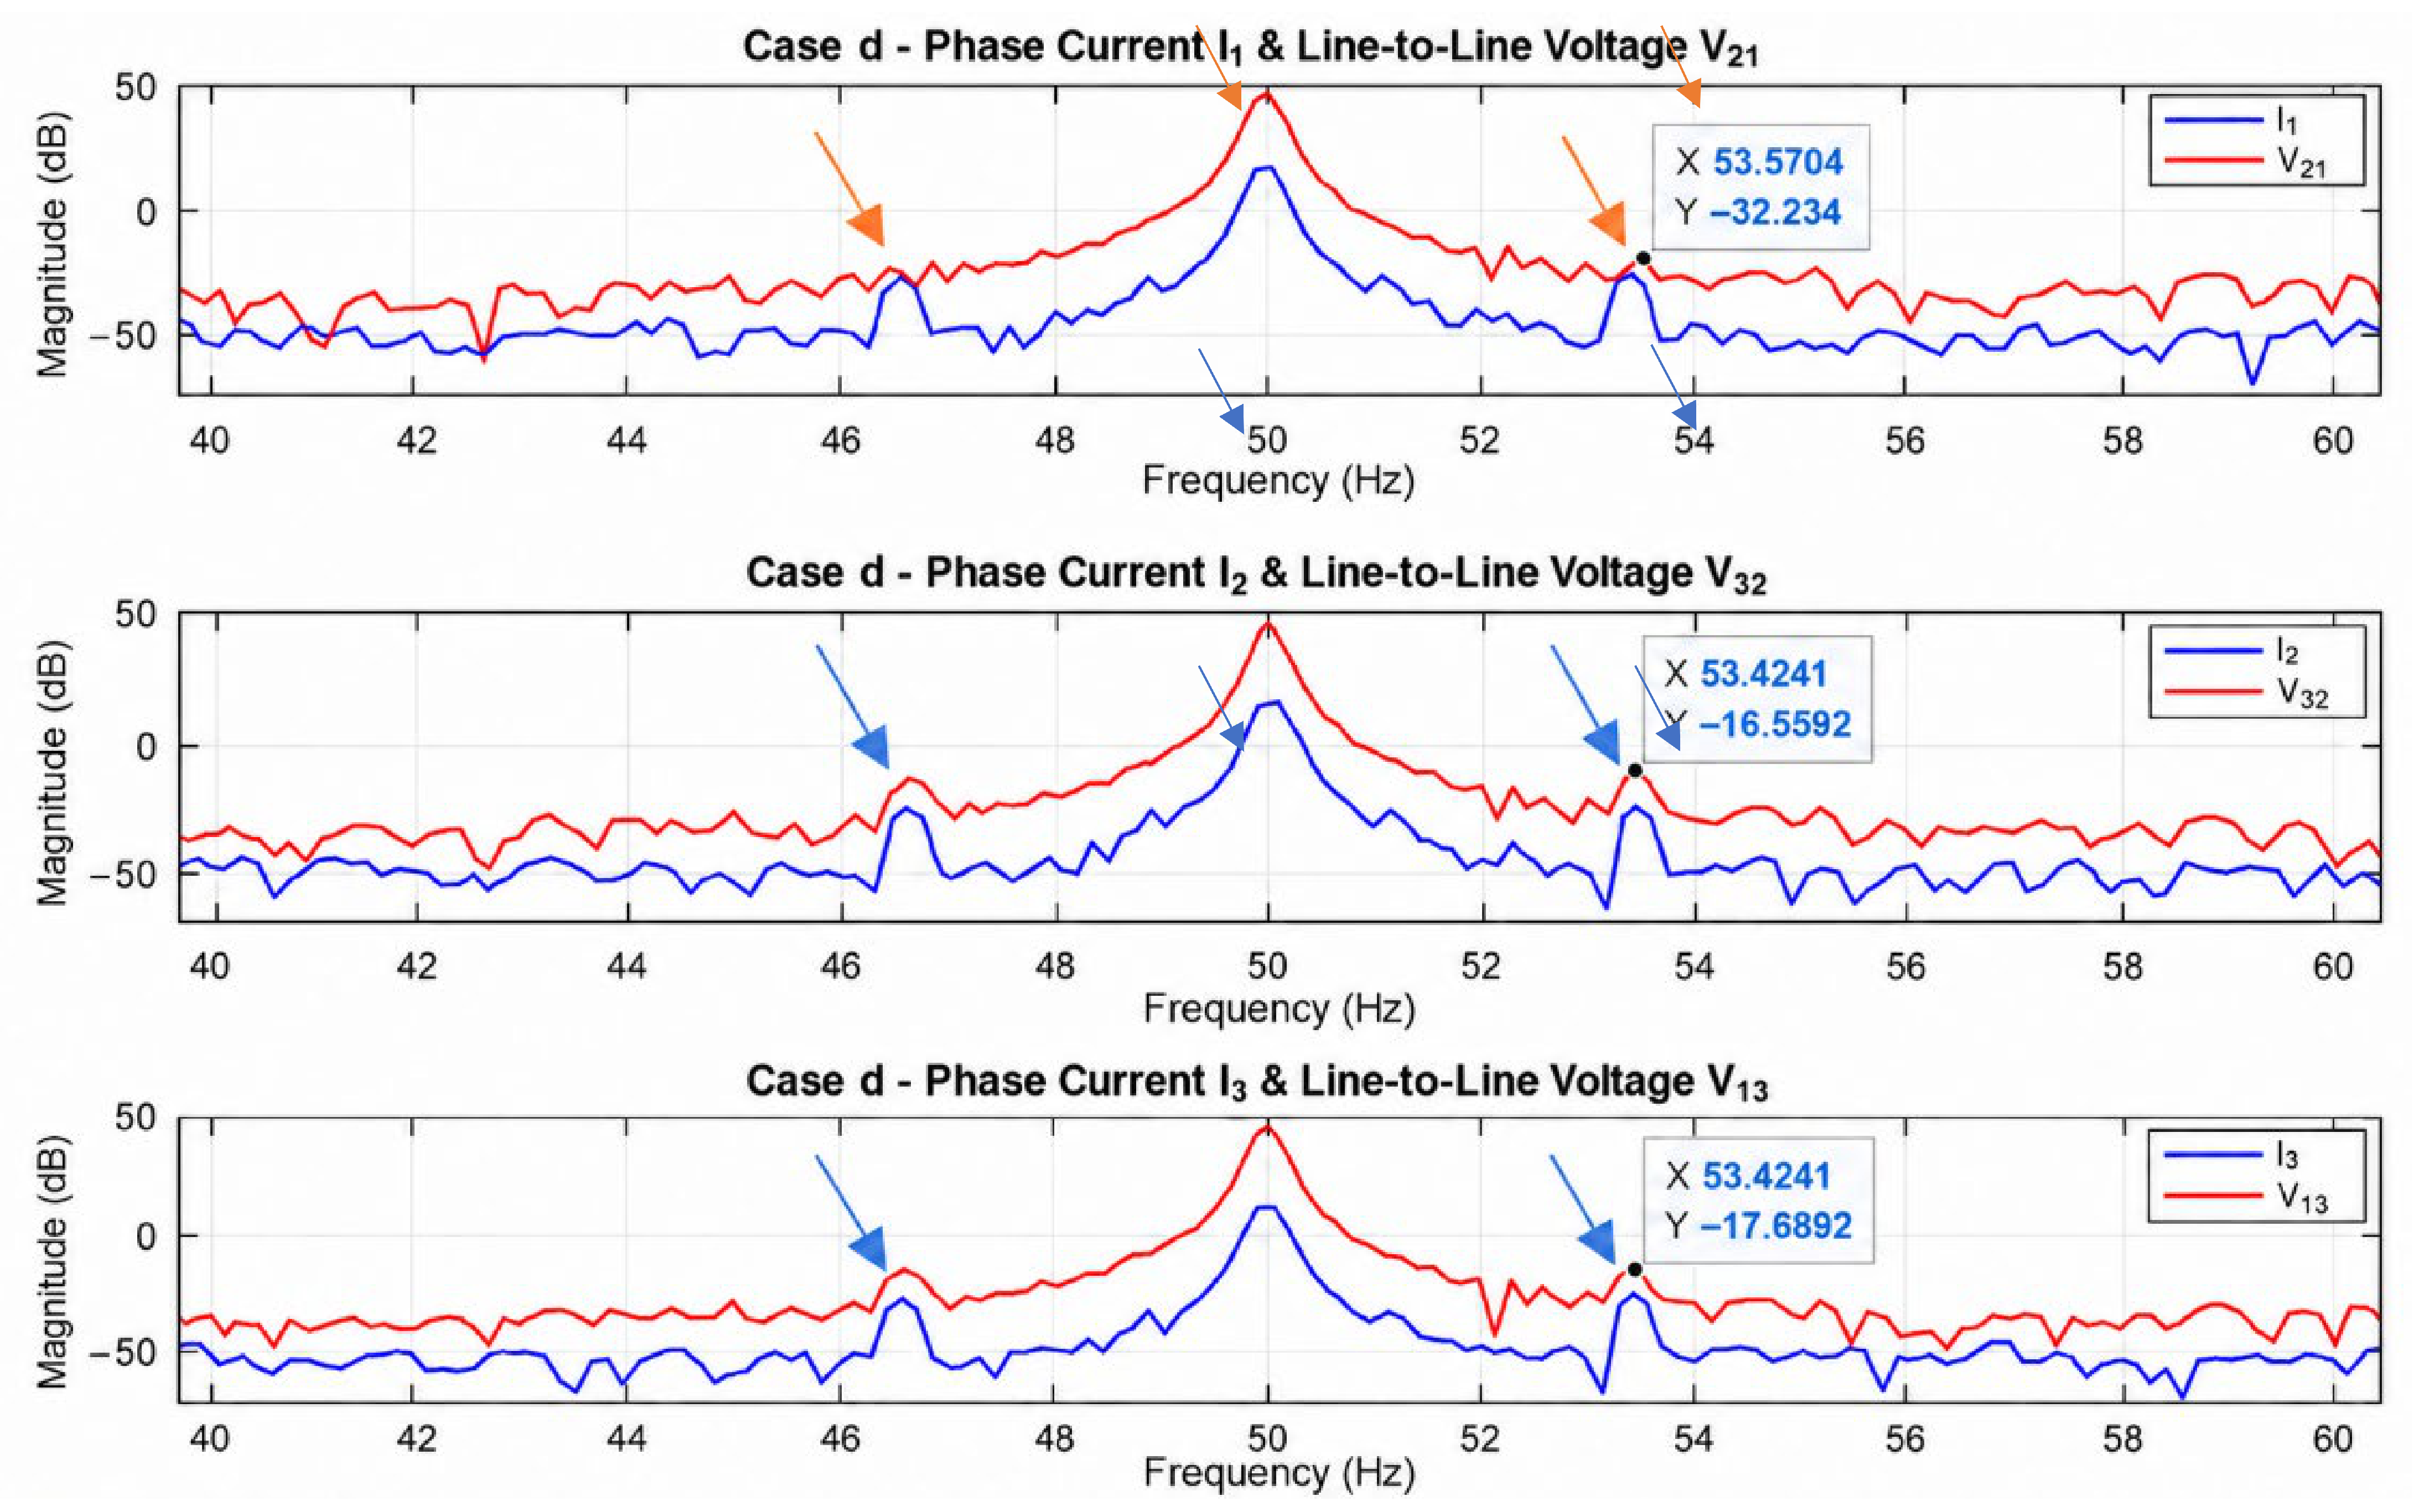
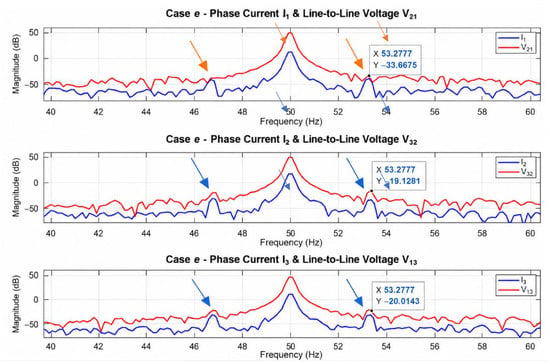
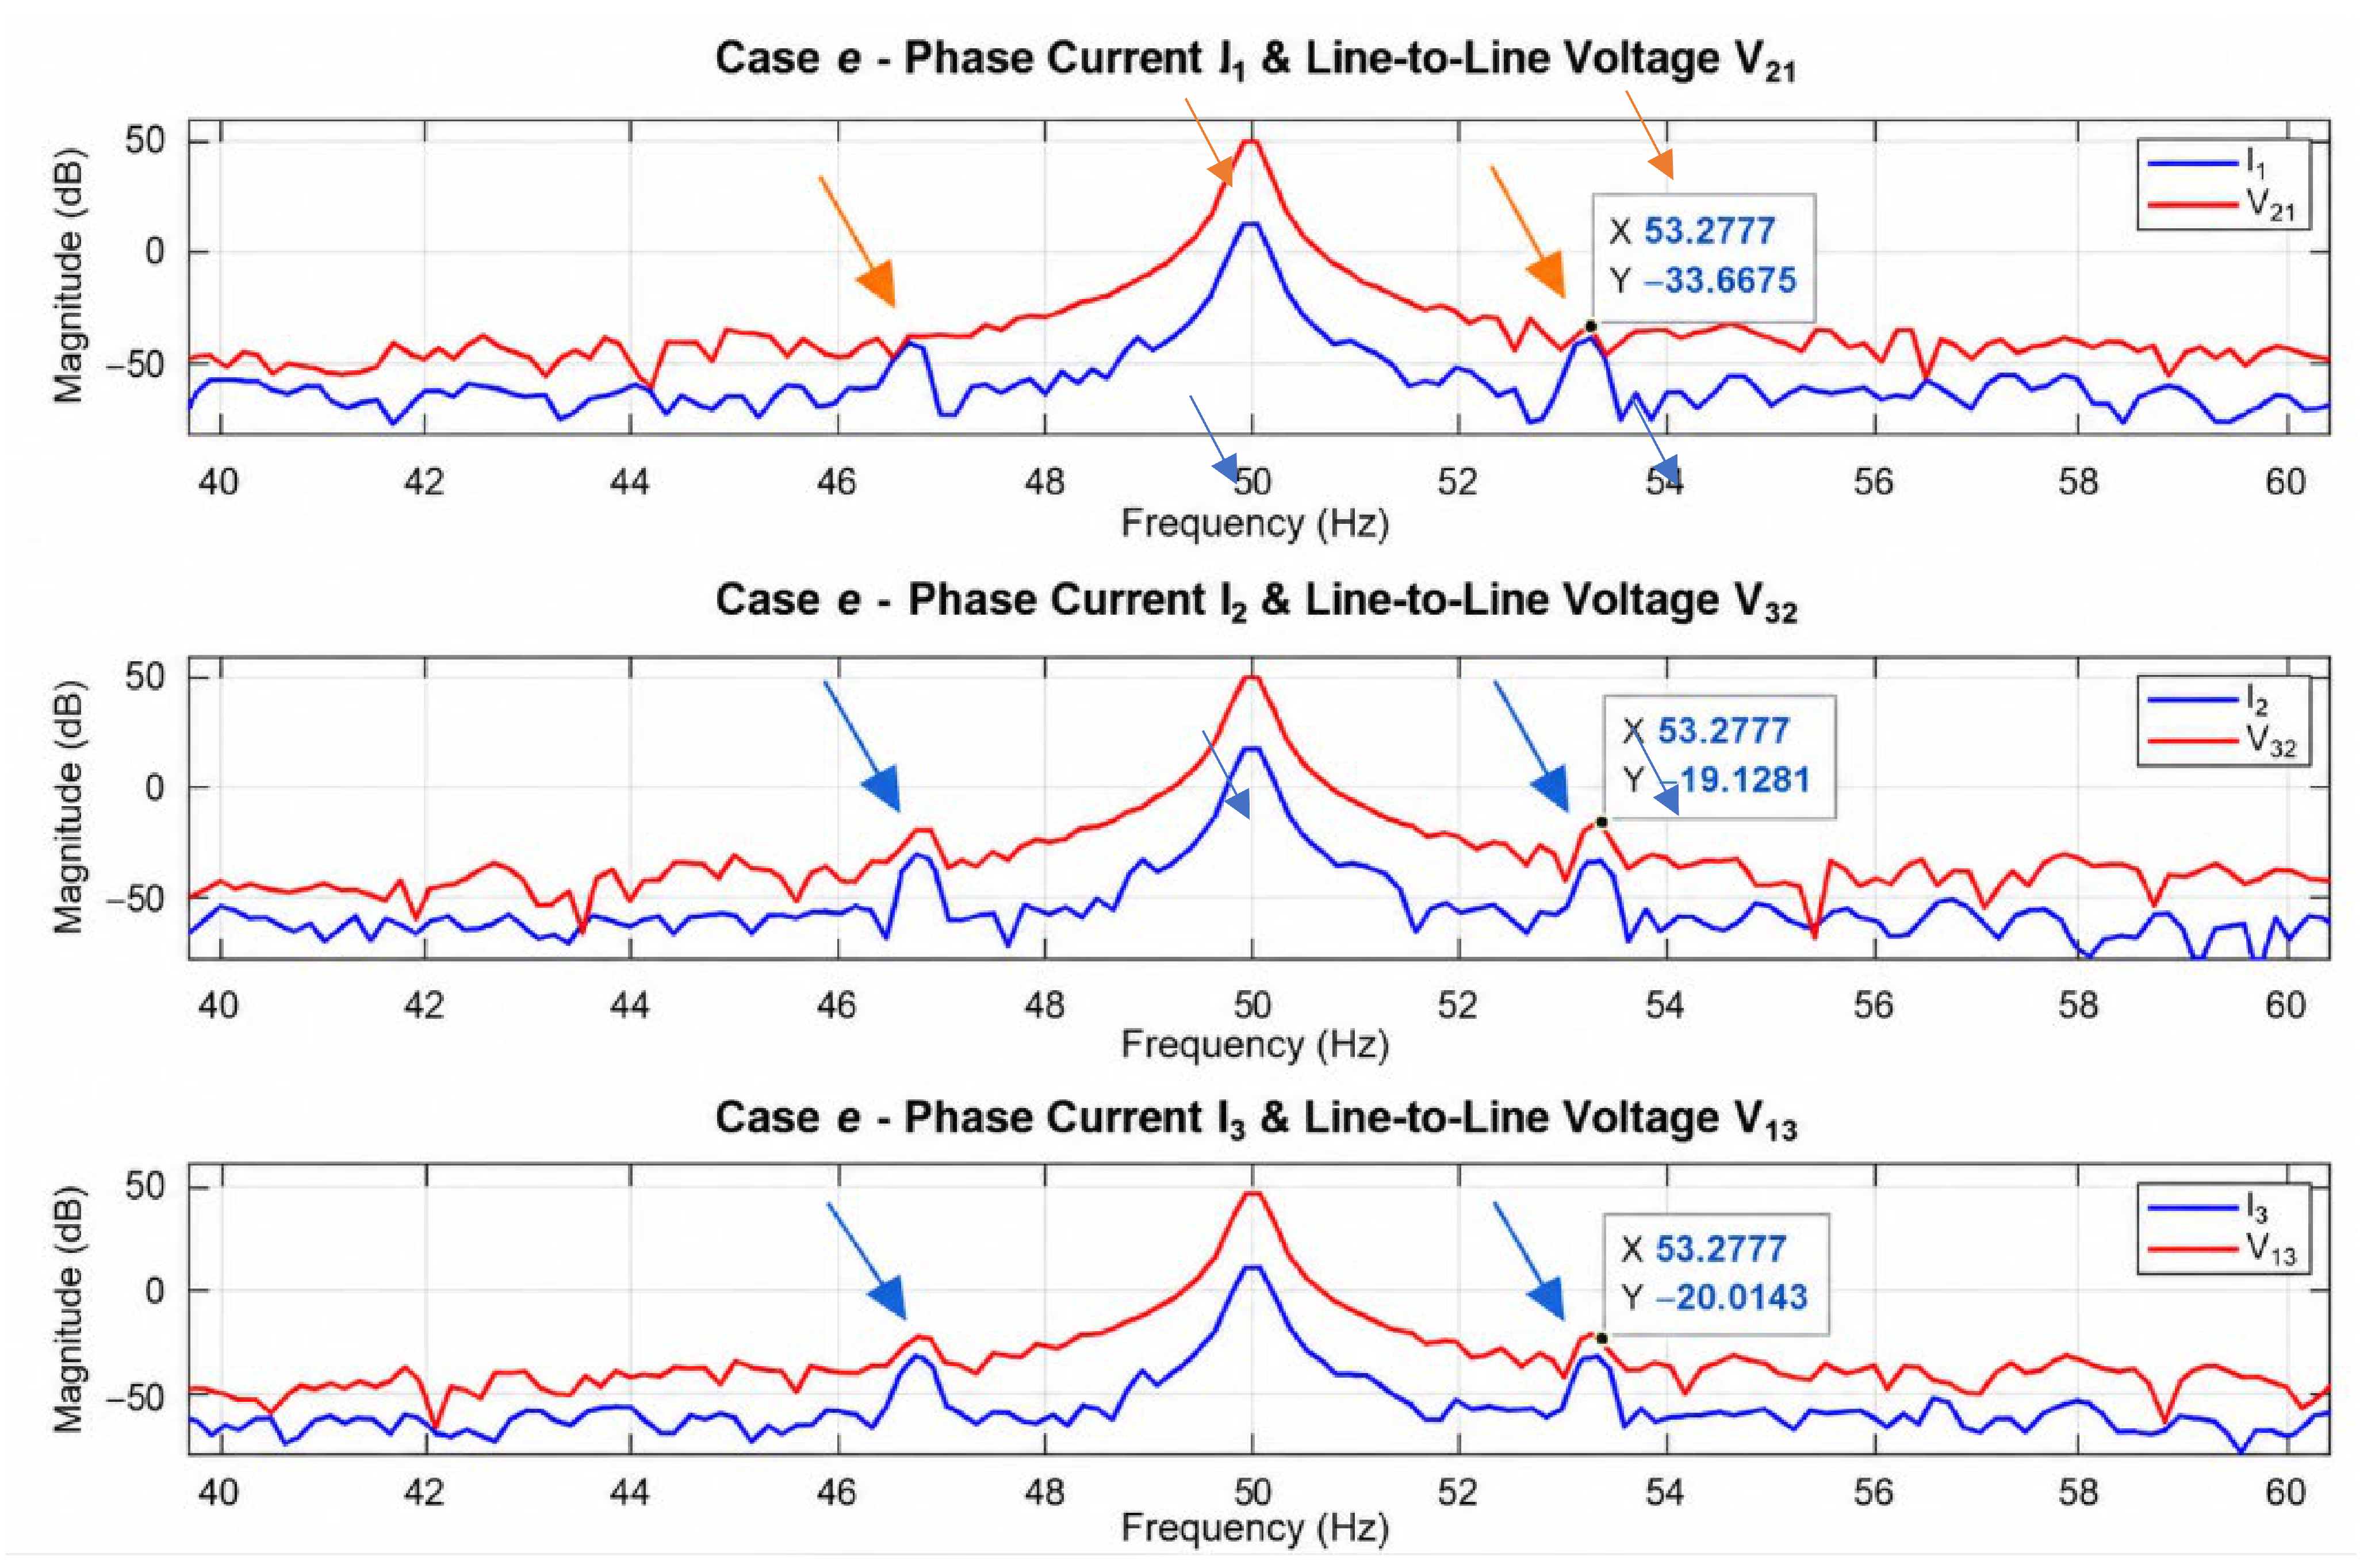
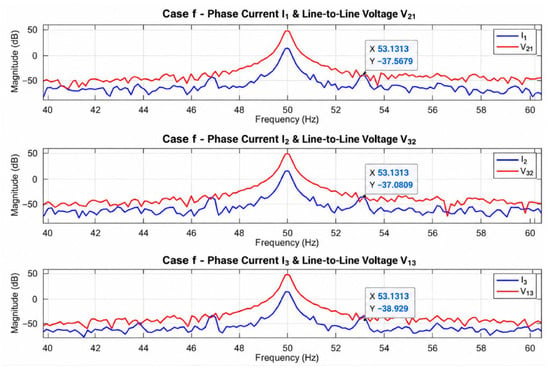
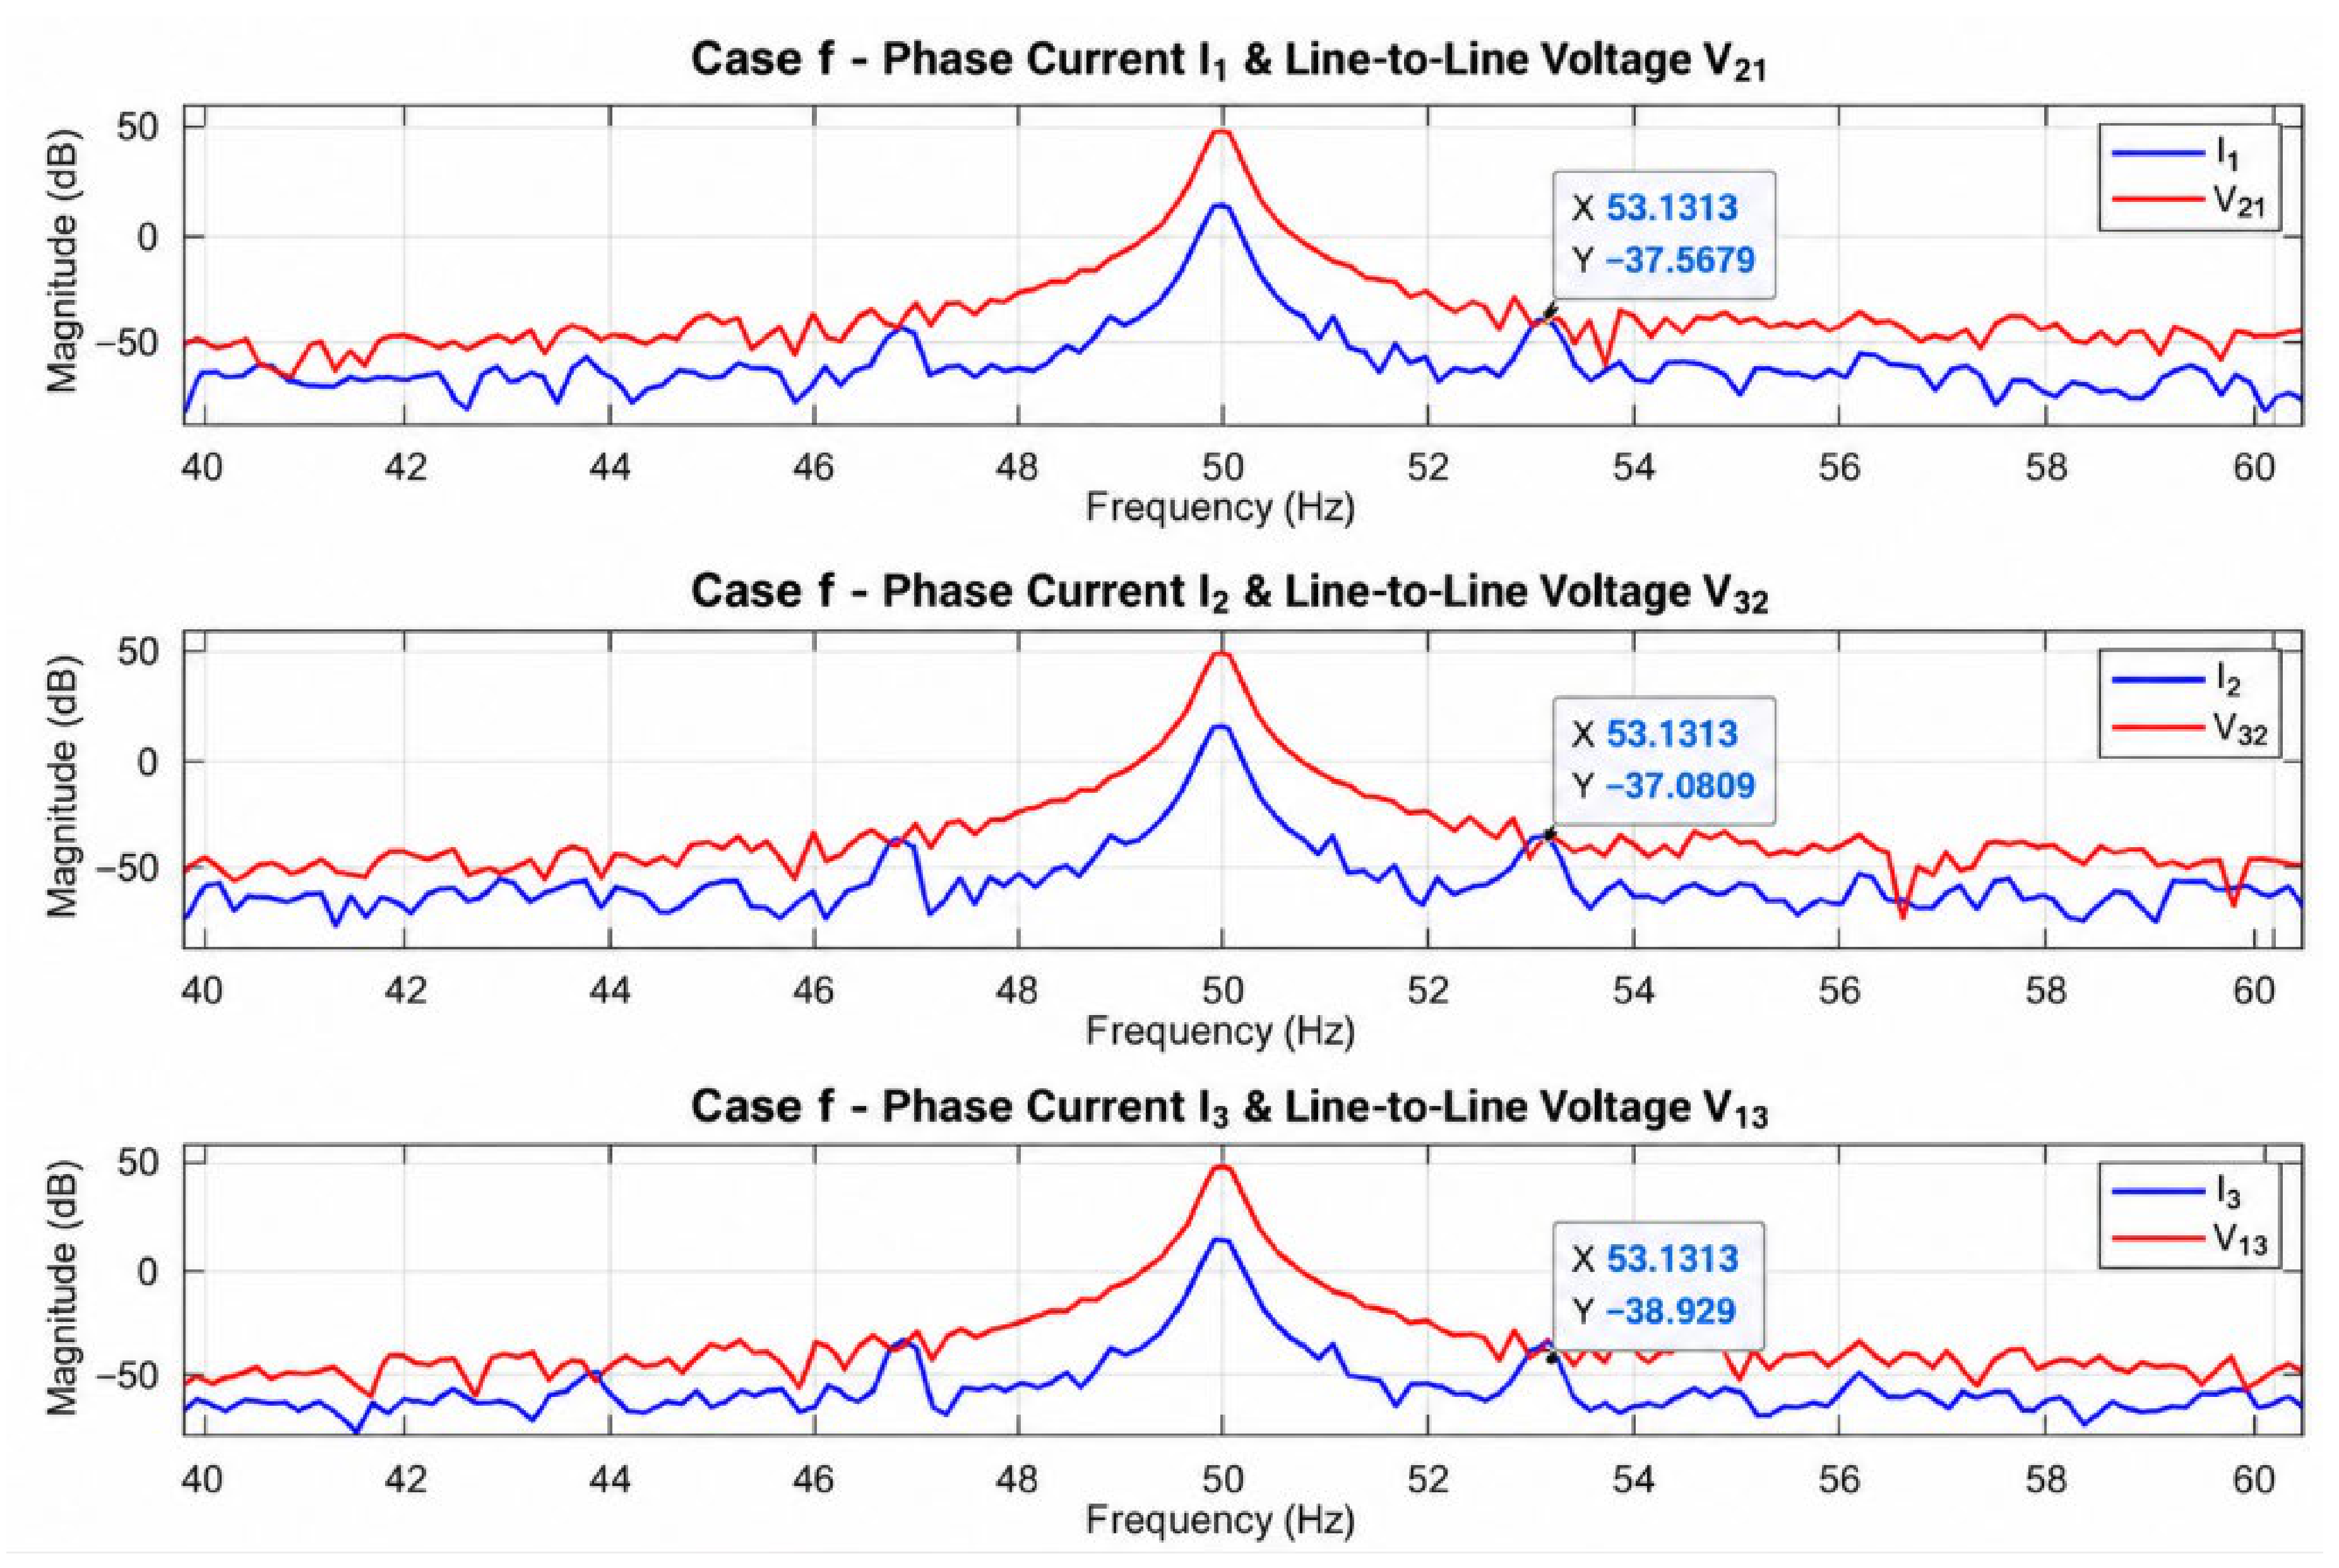
Representative spectra for the low-load operating conditions (cases d–f) are shown in Figure 14, Figure 15 and Figure 16, where both the voltage and current spectra are reported. Although the sidebands are less pronounced than under high-load conditions, they remain clearly identifiable when the supply voltage is unbalanced. As already noted in Section 4.2.1, a similar behavior is also observed for the twice-slip-frequency sidebands around the 3rd voltage harmonic. These observations suggest that both families of sidebands are similarly influenced by the voltage-unbalance condition. However, the twice-slip-frequency sidebands around the fundamental component become difficult to resolve because they are masked by the dominant 50 Hz component. From a diagnostic perspective, the six-times-slip-frequency sidebands remain clearly distinguishable in the line-to-line voltage spectra involving the affected phase under both high- and low-load unbalanced conditions, whereas they are absent from the corresponding balanced voltage spectra. This behavior confirms their sensitivity to supply voltage unbalance and, particularly, their phase-selective nature. A more extensive experimental campaign including additional voltage-unbalance levels will be required to establish a statistically robust quantitative relationship between their magnitude and the voltage-unbalance level.
Figure 14.
Six-times-slip-frequency sidebands (fs ± 6s∙fs) for the unbalanced operating condition (case d). The sidebands are clearly visible in V32 and V13 (blue arrows), whereas they are not observed in V21 (orange arrows).
Figure 15.
Six-times-slip-frequency sidebands (fs ± 6s∙fs) for the unbalanced operating condition (case e). The sidebands are clearly visible in V32 and V13 (blue arrows), whereas they are not observed in V21 (orange arrows).
Figure 16.
Six-times-slip-frequency sidebands (fs ± 6s∙fs) for the balanced operating condition (case f). The sidebands are absent from the line-to-line voltage spectra and remain visible only in the current spectra.
4.3. Summary of the Frequency-Domain Analysis
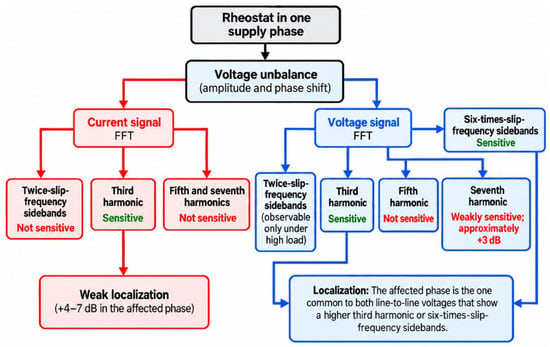
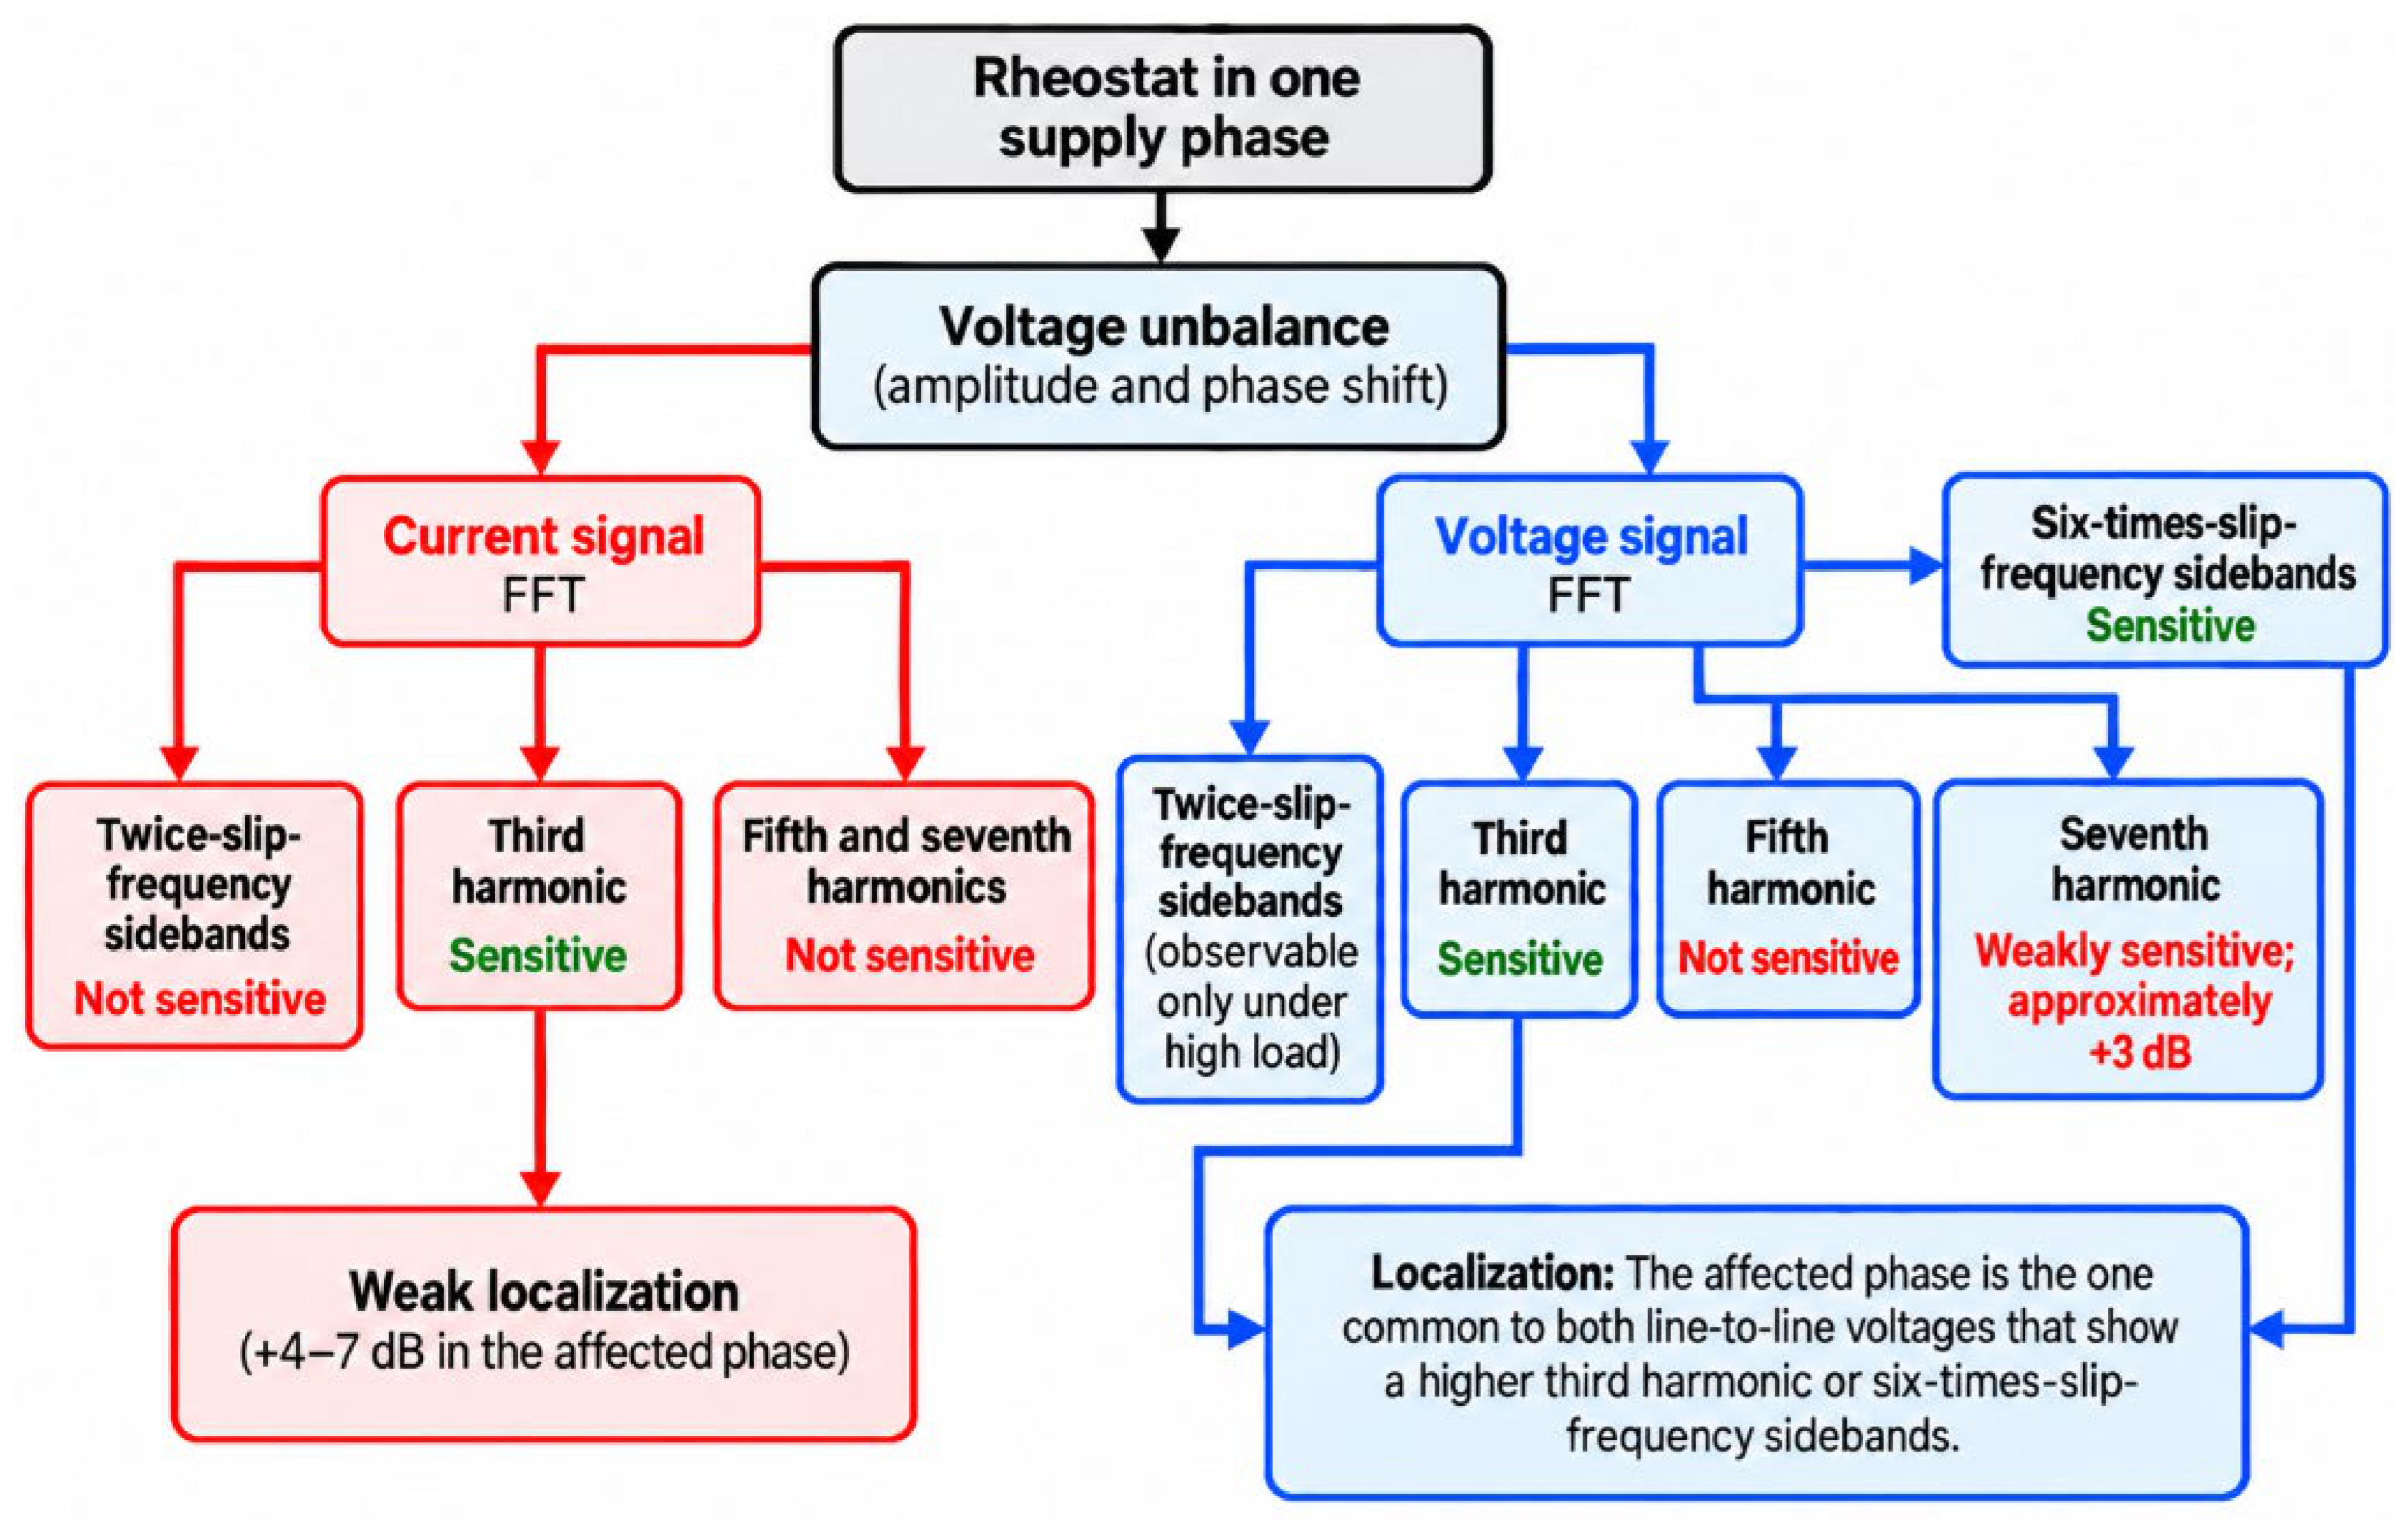
For ease of interpretation, the main findings of the frequency-domain analysis are consolidated in this section. Table 15 compares the diagnostic behavior of the 3rd, 5th, and 7th supply-frequency harmonics in both current and line-to-line voltage signals under high- and low-load conditions. In addition, Figure 17 provides a flowchart illustrating the proposed diagnostic approach and summarizing the main characteristics of all the investigated frequency-domain indicators.
Table 15.
Diagnostic features of the 3rd, 5th, and 7th supply-frequency harmonics under high- and low-load conditions.
Figure 17.
Flowchart summarizing the proposed frequency-domain diagnostic approach and the sensitivity of the investigated indicators to supply voltage unbalance.
5. Conclusions
This work investigated the effects of supply voltage unbalance on an induction motor using a commercial digital motor-protection circuit breaker (ABB SACE Tmax XT2N 160) as the data-acquisition device. Unlike conventional motor condition-monitoring systems, which typically rely on dedicated measurement hardware, the proposed approach exploits a protection device already installed in industrial applications to synchronously acquire the three-phase currents and line-to-line voltages. The results demonstrate that these measurements can provide useful diagnostic information on supply voltage unbalance without requiring additional sensing hardware.
The experimental results confirmed the strong amplification of current unbalance with respect to voltage unbalance: a maximum voltage unbalance of approximately 6.5% produced a current unbalance approaching 38%. Current waveform distortion also increased under unbalanced conditions, particularly in the affected phase, while the phase-angle analysis showed that supply voltage unbalance modifies not only the signal amplitudes but also their relative phase relationships. Moreover, under high-load conditions, an increase in motor slip was observed in the unbalanced cases, indicating a reduction in rotational speed and a deterioration in motor operating performance.
The frequency-domain analysis identified clear differences in the diagnostic effectiveness of the investigated indicators. The twice-slip-frequency current sidebands did not exhibit a clear correlation with voltage unbalance, whereas the 3rd current harmonic showed a significant increase under unbalanced conditions. However, its phase-to-phase variability, also observed under balanced conditions, limits its reliability for affected-phase localization. The 5th and 7th current harmonics showed no significant sensitivity to voltage unbalance.
The line-to-line voltage analysis provided the most relevant diagnostic findings of the study. The 3rd voltage harmonic exhibited a marked increase in the line-to-line voltages involving the affected phase, by approximately 20–25 dB under the most severe unbalanced conditions, while only minor variations were observed in the voltage not involving that phase. This behavior enables not only detection of supply voltage unbalance but also localization of the affected phase. More importantly, the six-times-slip-frequency sidebands were clearly observed in the line-to-line voltage spectra under both high- and low-load unbalanced conditions and exhibited the same phase-selective behavior. These results indicate that the combined evaluation of the 3rd voltage harmonic and six-times-slip-frequency sidebands provides complementary information for voltage-unbalance detection and affected-phase localization.
From a practical perspective, the results support the use of a digital MCCB as an integrated protection and condition-monitoring platform. Since the circuit breaker is permanently installed in the electrical system and already provides the synchronized current and voltage measurements required by the proposed diagnostic procedure, the approach is potentially suitable for online condition monitoring without additional sensing hardware. However, the signal processing and diagnostic analysis in the present study were performed offline in MATLAB R2024b; therefore, a real-time embedded implementation has not yet been experimentally demonstrated. Given the relatively slow evolution of supply voltage unbalance, periodic waveform acquisition and processing could nevertheless provide a practical basis for online monitoring.
The present results should also be interpreted considering the limitations of the experimental campaign. The validation was performed on a single 5.5 kW induction motor, with voltage unbalance introduced through an additional resistance connected to one supply phase and under a limited number of load and supply conditions. Although the proposed affected-phase localization criterion is based on the relative behavior of the three line-to-line voltages and is therefore expected to remain applicable when a different phase is affected, this generalization has not yet been experimentally validated. Further investigations are required to assess the robustness of the identified diagnostic signatures for different affected phases, types and levels of voltage unbalance, motor ratings and winding configurations, and supply conditions. Future work will therefore extend the experimental validation to these conditions, as well as to the simultaneous occurrence of supply voltage unbalance with other fault or non-standard operating conditions, such as torque oscillations and broken rotor bars. Particular attention will also be devoted to implementing and experimentally validating the proposed approach within an online or embedded condition-monitoring framework.
Author Contributions
Conceptualization, M.M., L.F. and P.G.; methodology, M.M., L.M. and M.J.; software, M.M., M.J. and P.G.; validation, M.J. and M.M.; formal analysis, M.J. and L.M.; investigation, M.J.; resources, L.F.; data curation, M.M. and M.J.; writing—original draft preparation, M.M. and M.J.; writing—review and editing, P.G., L.M. and L.F.; visualization, M.M. and P.G.; supervision, M.M., P.G. and L.F. All authors have read and agreed to the published version of the manuscript.
Funding
This research received no external funding.
Data Availability Statement
The minimal dataset supporting the conclusions of this article has been provided during the submission process. The complete raw experimental data consist of synchronized voltage and current waveform acquisitions generated during the experimental campaign and are available from the corresponding author upon reasonable request.
Conflicts of Interest
The authors declare no conflict of interest.
References
- Madonna, V.; Meano, C.M.; Cossu, R.; Pensato, M.; Hansen, K.F. Investigating the Impact of Material Cost Fluctuations on the Total Manufacturing Cost of EV Traction Machines. In Proceedings of the 2023 IEEE Workshop on Electrical Machines Design, Control and Diagnosis (WEMDCD), Newcastle upon Tyne, UK, 13–14 April 2023. [Google Scholar] [CrossRef] [Scilit]
- Bellini, A.; Filippetti, F.; Tassoni, C.; Capolino, G.-A. Advances in diagnostic techniques for induction machines. IEEE Trans. Ind. Electron. 2008, 55, 4109–4126. [Google Scholar] [CrossRef] [Scilit]
- Zhang, D.; An, R.; Wu, T. Effect of voltage unbalance and distortion on the loss characteristics of three-phase cage induction motor. IET Electr. Power Appl. 2017, 12, 264–270. [Google Scholar] [CrossRef] [Scilit]
- Ferreira, F.J.T.E.; Alberto, J.M.; de Almeida, A.T. Induction Motor Tolerance to Supply Voltage Unbalance for Different Dual-Winding Configurations. In Proceedings of the 2022 International Conference on Electrical Machines (ICEM), Valencia, Spain, 5–8 September 2022. [Google Scholar] [CrossRef] [Scilit]
- Gnaciński, P.; Pepliński, M.; Muc, A.; Hallmann, D. Induction motors under voltage unbalance combined with voltage subharmonics. Energies 2024, 17, 6324. [Google Scholar] [CrossRef] [Scilit]
- Pillay, P.; Hofmann, P.; Manyage, M. Derating of induction motors operating with a combination of unbalanced voltages and over or undervoltages. IEEE Trans. Energy Convers. 2002, 17, 485–491. [Google Scholar] [CrossRef] [Scilit]
- Temiz, I.; Akuner, C.; Calik, H. Analysis of balanced three-phase induction motor performance under unbalanced supply using simulation and experimental results. Electron. Electr. Eng. 2011, 109, 41–45. [Google Scholar]
- ABB. White Paper “Unbalanced Voltage Supply—The Damaging Effects on Three-Phase Induction Motors and Rectifiers”. Available online: https://search.abb.com/library/Download.aspx?DocumentID=2UCD401218-P&LanguageCode=en&DocumentPartId=&Action=Launch (accessed on 15 July 2026).
- Von Jouanne, A.; Banerjee, B. Assessment of voltage unbalance. IEEE Trans. Power Del. 2001, 16, 782–790. [Google Scholar] [CrossRef] [Scilit]
- Lee, S.B.; Stone, G.C.; Antonino-Daviu, J.; Gyftakis, K.N.; Strangas, E.G.; Maussion, P.; Platero, C.A. Condition monitoring of industrial electric machines: State of the art and future challenges. IEEE Ind. Electron. Mag. 2020, 14, 158–167. [Google Scholar] [CrossRef] [Scilit]
- Thomson, W.T.; Gilmore, R.J. Motor Current Signature Analysis to Detect Faults in Induction Motor Drives—Fundamentals, Data Interpretation, and Industrial Case Histories. In Proceedings of the Thirty-Second Turbomachinery Symposium; Texas A&M University: College Station, TX, USA, 2003. [Google Scholar]
- Minervini, M.; Huertas-Leyva, P.; Mantione, L.; Frosini, L.; Pellegrini, G.; Zangheri, N.; Savini, N. Condition monitoring of highway tunnel fans motors: Case studies based on experimental data. Electronics 2025, 14, 4809. [Google Scholar] [CrossRef] [Scilit]
- Minervini, M.; Mantione, L.; Frosini, L.; Giangrande, P.; Muzio, F. Induction Motor Low Frequency Torque Oscillation Diagnostics Through Circuit Breaker Acquisitions. In Proceedings of the 2025 IEEE Symposium on Diagnostics for Electric Machines, Power Electronics and Drives (SDEMPED), Dallas, TX, USA, 24–27 August 2025. [Google Scholar] [CrossRef] [Scilit]
- Blodt, M.; Granjon, P.; Raison, B.; Rostaing, G. Models for bearing damage detection in induction motors using stator current monitoring. IEEE Trans. Ind. Electron. 2008, 55, 1813–1822. [Google Scholar] [CrossRef] [Scilit]
- Bonet-Jara, J.; Pons-Llinares, J. A precise, general, non-invasive and automatic speed estimation method for MCSA diagnosis and efficiency estimation of induction motors. IEEE Trans. Energy Convers. 2023, 38, 1257–1267. [Google Scholar] [CrossRef] [Scilit]
- Bonet-Jara, J.; Pons-Llinares, J. Comprehensive analysis of induction motor harmonics for sensorless speed estimation in its application to MCSA. IEEE Trans. Instrum. Meas. 2026, 75, 7504811. [Google Scholar] [CrossRef] [Scilit]
- Bessous, N.; Zouzou, S.E.; Sbaa, S.; Bentrah, W.; Becer, Z.; Ajgou, R. Static Eccentricity Fault Detection of Induction Motors Using MVSA, MCSA and Discrete Wavelet Transform (DWT). In Proceedings of the 2017 5th International Conference on Electrical Engineering-Boumerdes (ICEE-B), Boumerdes, Algeria, 29–31 October 2017; pp. 1–10. [Google Scholar] [CrossRef] [Scilit]
- Haddad, R.Z.; Strangas, E.G. On the accuracy of fault detection and separation in permanent magnet synchronous machines using MCSA/MVSA and LDA. IEEE Trans. Energy Convers. 2016, 31, 924–934. [Google Scholar] [CrossRef] [Scilit]
- Harlişca, C.; Szabó, L.; Frosini, L.; Albini, A. Bearing Faults Detection in Induction Machines Based on Statistical Processing of the Stray Fluxes Measurements. In Proceedings of the 2013 9th IEEE International Symposium on Diagnostics for Electric Machines, Power Electronics and Drives (SDEMPED), Valencia, Spain, 27–30 August 2013; pp. 371–376. [Google Scholar] [CrossRef] [Scilit]
- Frosini, L.; Minervini, M.; Ciceri, L.; Albini, A. Multiple Faults Detection in Low Voltage Inverter-Fed Induction Motors. In Proceedings of the 2019 IEEE 12th International Symposium on Diagnostics for Electrical Machines, Power Electronics and Drives (SDEMPED), Toulouse, France, 27–30 August 2019; pp. 323–329. [Google Scholar] [CrossRef] [Scilit]
- Park, Y.; Choi, H.; Lee, S.B.; Gyftakis, K.N. Search coil-based detection of nonadjacent rotor bar damage in squirrel cage induction motors. IEEE Trans. Ind. Appl. 2020, 56, 4748–4757. [Google Scholar] [CrossRef] [Scilit]
- Zamudio-Ramirez, I.; Osornio-Rios, R.A.; Antonino-Daviu, J.A.; Razik, H.; Romero-Troncoso, R.D.J. Magnetic Flux Analysis for the Condition Monitoring of Electric Machines: A Review. IEEE Trans. Ind. Inform. 2022, 18, 2895–2908. [Google Scholar] [CrossRef] [Scilit]
- Bonet-Jara, J.; Minervini, M.; Frosini, L.; Pons-Llinares, J. Critical Analysis of Inter-Turn Fault Related Harmonics in the Line Current. In Proceedings of the 2024 International Conference on Electrical Machines (ICEM), Torino, Italy, 1–4 September 2024. [Google Scholar] [CrossRef] [Scilit]
- Lee, S.B.; Hyun, D.; Kang, T.; Yang, C.; Shin, S.; Kim, H.; Park, S.; Kong, T.S.; Kim, H.D. Identification of false rotor fault indications produced by online MCSA for medium-voltage induction machines. IEEE Trans. Ind. Appl. 2016, 52, 729–739. [Google Scholar] [CrossRef] [Scilit]
- Available online: https://www.magtrol.com/product/powder-brake-dynamometers-pb-series/ (accessed on 15 July 2026).
- IEC 60947-2:2016; Low-Voltage Switchgear and Controlgear—Part 2: Circuit-Breakers. International Electrotechnical Commission (IEC): Geneva, Switzerland, 2016.
- Mantione, L.; Garcia-Calva, T.; Fernandez-Cavero, V.; Frosini, L.; Moriñigo-Sotelo, D. Broken rotor bar detection in closed loop inverter fed induction motors through time-frequency techniques. IEEE Trans. Ind. Appl. 2025, 61, 209–217. [Google Scholar] [CrossRef] [Scilit]
- IEC 60034-26:2014; Rotating Electrical Machines—Part 26: Effects of Unbalanced Voltages on the Performance of Three-Phase Cage Induction Motors. International Electrotechnical Commission (IEC): Geneva, Switzerland, 2014.
- National Electrical Manufacturers Association (NEMA). NEMA MG 1: Motors and Generators; NEMA: Rosslyn, VA, USA, 2021. [Google Scholar]
- Bonnett, A.H.; Soukup, G.C. NEMA motor-generator standards for three-phase induction motors. IEEE Ind. Appl. Mag. 1999, 5, 49–63. [Google Scholar] [CrossRef] [Scilit]
- Antić, D.; Juhas, A.; Milutinov, M. Power Line Magnetic Field Deviations for Three Different Definitions of Current Unbalance. J. Energy Technol. 2019, 12, 61–70. [Google Scholar]
- Available online: https://industrialmonitordirect.com/it/blogs/knowledgebase/3-phase-motor-current-unbalance-nema-limits-measurement-guide#section-2 (accessed on 13 July 2026).
- Available online: https://voltage-disturbance.com/power-engineering/current-unbalance-causes-effects-and-protection/ (accessed on 11 July 2026).

Disclaimer/Publisher’s Note: The statements, opinions and data contained in all publications are solely those of the individual author(s) and contributor(s) and not of MDPI and/or the editor(s). MDPI and/or the editor(s) disclaim responsibility for any injury to people or property resulting from any ideas, methods, instructions or products referred to in the content. |
© 2026 by the authors. Licensee MDPI, Basel, Switzerland. This article is an open access article distributed under the terms and conditions of the Creative Commons Attribution (CC BY) license.