


Abstract
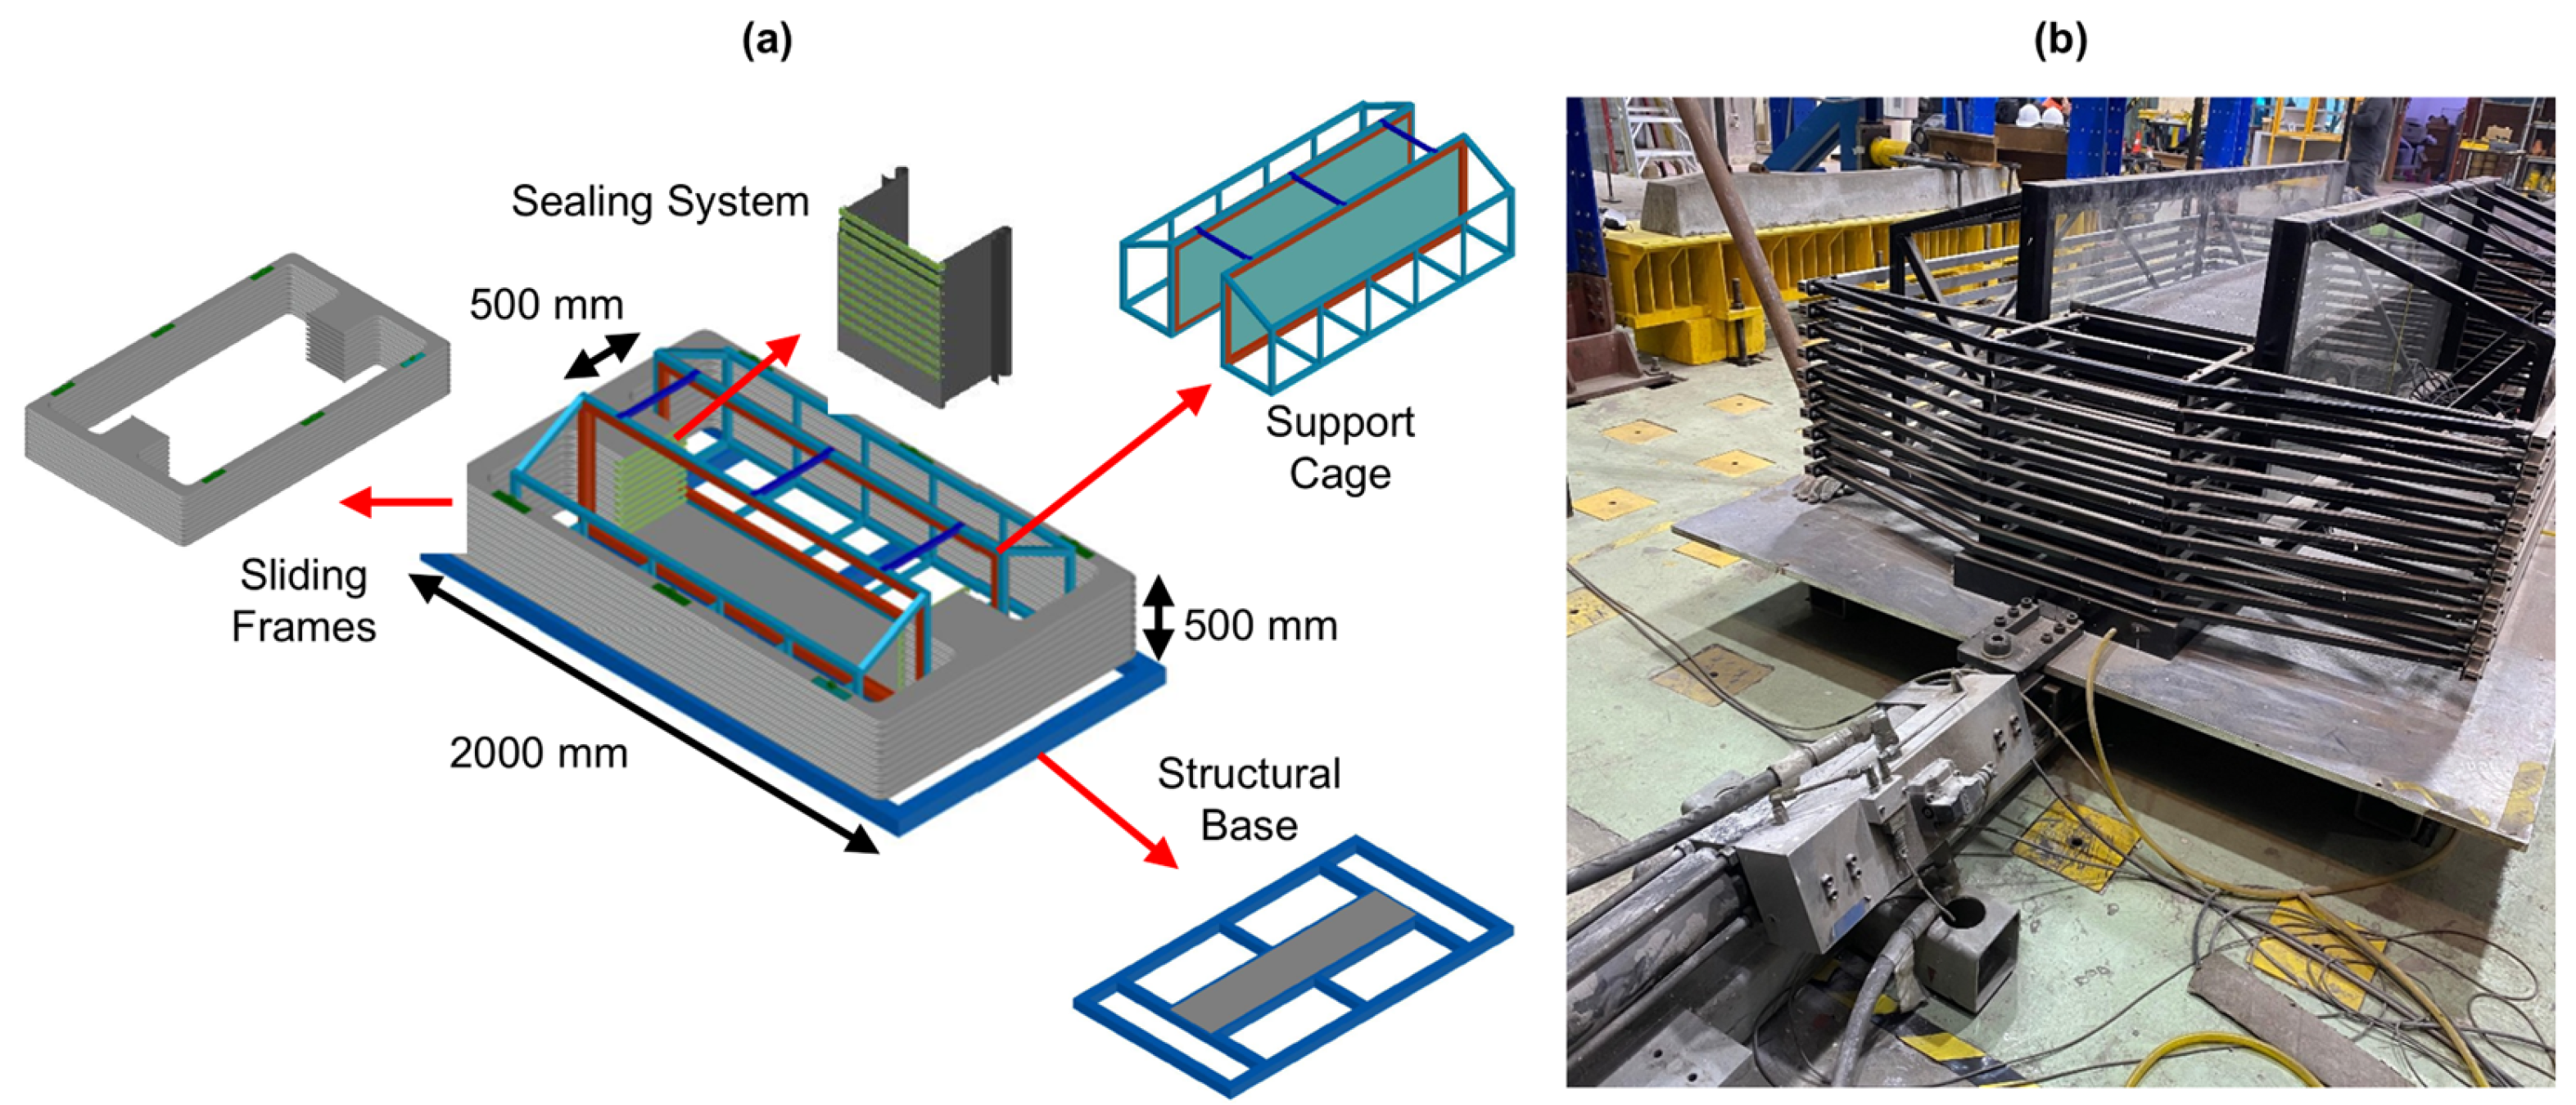
Laminar boxes are widely used for reduced-scale dynamic physical modeling. However, detailed observation of deformation remains limited because most sensors generally provide measurements only at discrete locations. This paper presents the development and experimental validation of a transparent, watertight laminar box that combines conventional instrumentation with optical measurements through Digital Image Correlation (DIC). The experimental characterization showed limited boundary interference at the instrumented locations under the investigated excitation conditions. DIC-derived soil displacements were independently compared with displacements obtained through double integration of embedded accelerometer records, resulting in an overall mean absolute error of 0.54 mm. Representative shaking table tests on loose sand, dense sand, and loose sand improved with granular columns were then used as proof-of-concept applications of the experimental system. The combined measurements consistently distinguished the response of the three ground configurations, with the loose sand exhibiting the largest acceleration amplification and accumulated shear strains, the dense sand the smallest, and the granular-column-improved deposit an intermediate response. Overall, the results demonstrate the capability of the proposed system to combine discrete and optical measurements for reduced-scale investigations of dynamic soil behavior and ground-improvement applications.
1. Introduction
The dynamic response of granular soil deposits, especially during seismic events, represents a critical issue in geotechnical engineering. Sandy soils under low effective confining pressure are particularly susceptible to strain localization, liquefaction, and significant ground deformation, which historically have triggered catastrophic failures in civil infrastructure, facilities, and lifelines [1,2,3,4]. To mitigate these hazards, ground improvement techniques, including the installation of dense granular columns, have been widely adopted to enhance the shear strength, stiffness, and drainage capacity of loose sand deposits [5,6,7].
Evaluating soil response and deformation during dynamic events requires robust experimental frameworks. Reduced-scale physical modeling under 1-g conditions, typically utilizing shaking tables, offers an effective and economically viable alternative to complex centrifuge testing for studying the fundamental mechanisms of soil behavior and soil-structure interaction [8,9,10,11,12,13,14]. To approximately replicate the free-field boundary conditions of a soil deposit of infinite lateral extent, laminar shear boxes are commonly preferred over rigid containers, as they reduce boundary-induced wave reflections and allow the soil profile to deform horizontally in a shear-beam mode [15,16,17]. However, conventional laminar boxes are constructed with opaque aluminum or steel frames. This configuration restricts instrumentation to discrete internal or external sensors, such as accelerometers, pore pressure transducers, pressure cells, and linear variable differential transformers. While these sensors provide high sample-rate point measurements, they cannot capture continuous displacement fields [18], may fail to detect localized shear bands [19], and might risk altering the soil matrix response due to their physical presence and mechanical characteristics [18].
To overcome some of the limitations of discrete monitoring, non-invasive optical methods based on Digital Image Correlation (DIC) have emerged as a useful tool in experimental geomechanics [18,20]. By tracking the motion of natural or artificial speckle patterns through a transparent boundary, DIC enables continuous mapping of displacements and strains without disturbing the soil mass. Despite its advantages, the integration of DIC into dynamic 1-g physical modeling remains relatively scarce in the literature. Recent developments have demonstrated the feasibility of combining transparent laminar containers with DIC to characterize the dynamic response of dry sandy soils [21]. However, extending this experimental approach to other configurations such as saturated and potentially liquefiable soils requires a transparent laminar system capable of maintaining watertight sealing while preserving low inter-laminar friction and minimal boundary interference. Consequently, a high-fidelity, watertight laminar device is still needed to combine discrete instrumentation with DIC analyses under dynamic conditions.
To address these challenges, this paper presents the development and experimental validation of a novel, flexible, and watertight transparent laminar shear box designed for 1-g reduced-scale shaking table tests. The proposed device incorporates tempered glass sidewalls that enable non-intrusive measurements using DIC while preserving conventional instrumentation. The objectives of this study are, first, to calibrate and validate the kinematic performance of the new laminar box under cyclic loading, assessing boundary interference under the investigated conditions; and second, to demonstrate its capabilities through representative dynamic tests conducted on dry sand deposits, including loose sand, dense sand, and loose sand improved with granular columns. These tests serve as case studies for validating the proposed system and demonstrating its capability to capture different dynamic responses across the selected ground conditions, establishing a versatile experimental platform for future investigations of dynamic soil behavior, soil–structure interaction, and ground-improvement techniques under seismic loading.
2. Materials and Methods
2.1. Experimental Device: Transparent Laminar Box
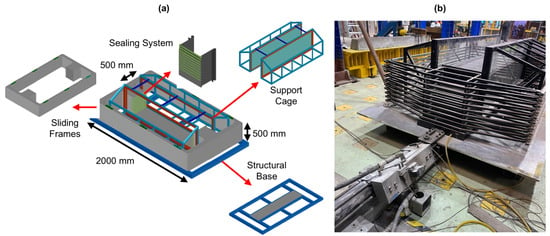
The experimental testing program was carried out using a newly engineered 1-g watertight laminar shear box designed to approximately simulate free-field boundary conditions under dynamic loading (Figure 1). The box was mounted on a unidirectional shaking table driven by a servo-hydraulic actuator developed by ANCO Engineers Inc. (Boulder, CO, USA). The system can generate accelerations of up to 1.5 g, accommodate displacements of ±150 mm, and support a maximum payload of 2000 kg with a peak velocity of 0.2 m/s.
Figure 1.
(a) Isometric view of the transparent laminar shear box; (b) transparent laminar shear box mounted on the ANCO© shaking table.
The device features clear internal dimensions of 2000 mm in length, 500 mm in width, and 500 mm in height, yielding an effective testing volume of 0.5 m3. The structural assembly consists of a series of rectangular sliding rings stacked vertically over a carbon steel base frame measuring 3430 mm by 1950 mm. Each sliding frame is constructed from structural aluminum profiles to achieve an optimal weight-to-stiffness ratio, with an individual ring mass of approximately 15 kg. Inter-laminar horizontal translation is enabled by a series of linear roller bearing systems guiding U-shaped structural rails, allowing a maximum relative displacement of ±10 mm.
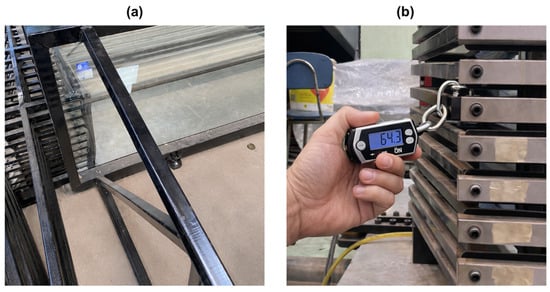
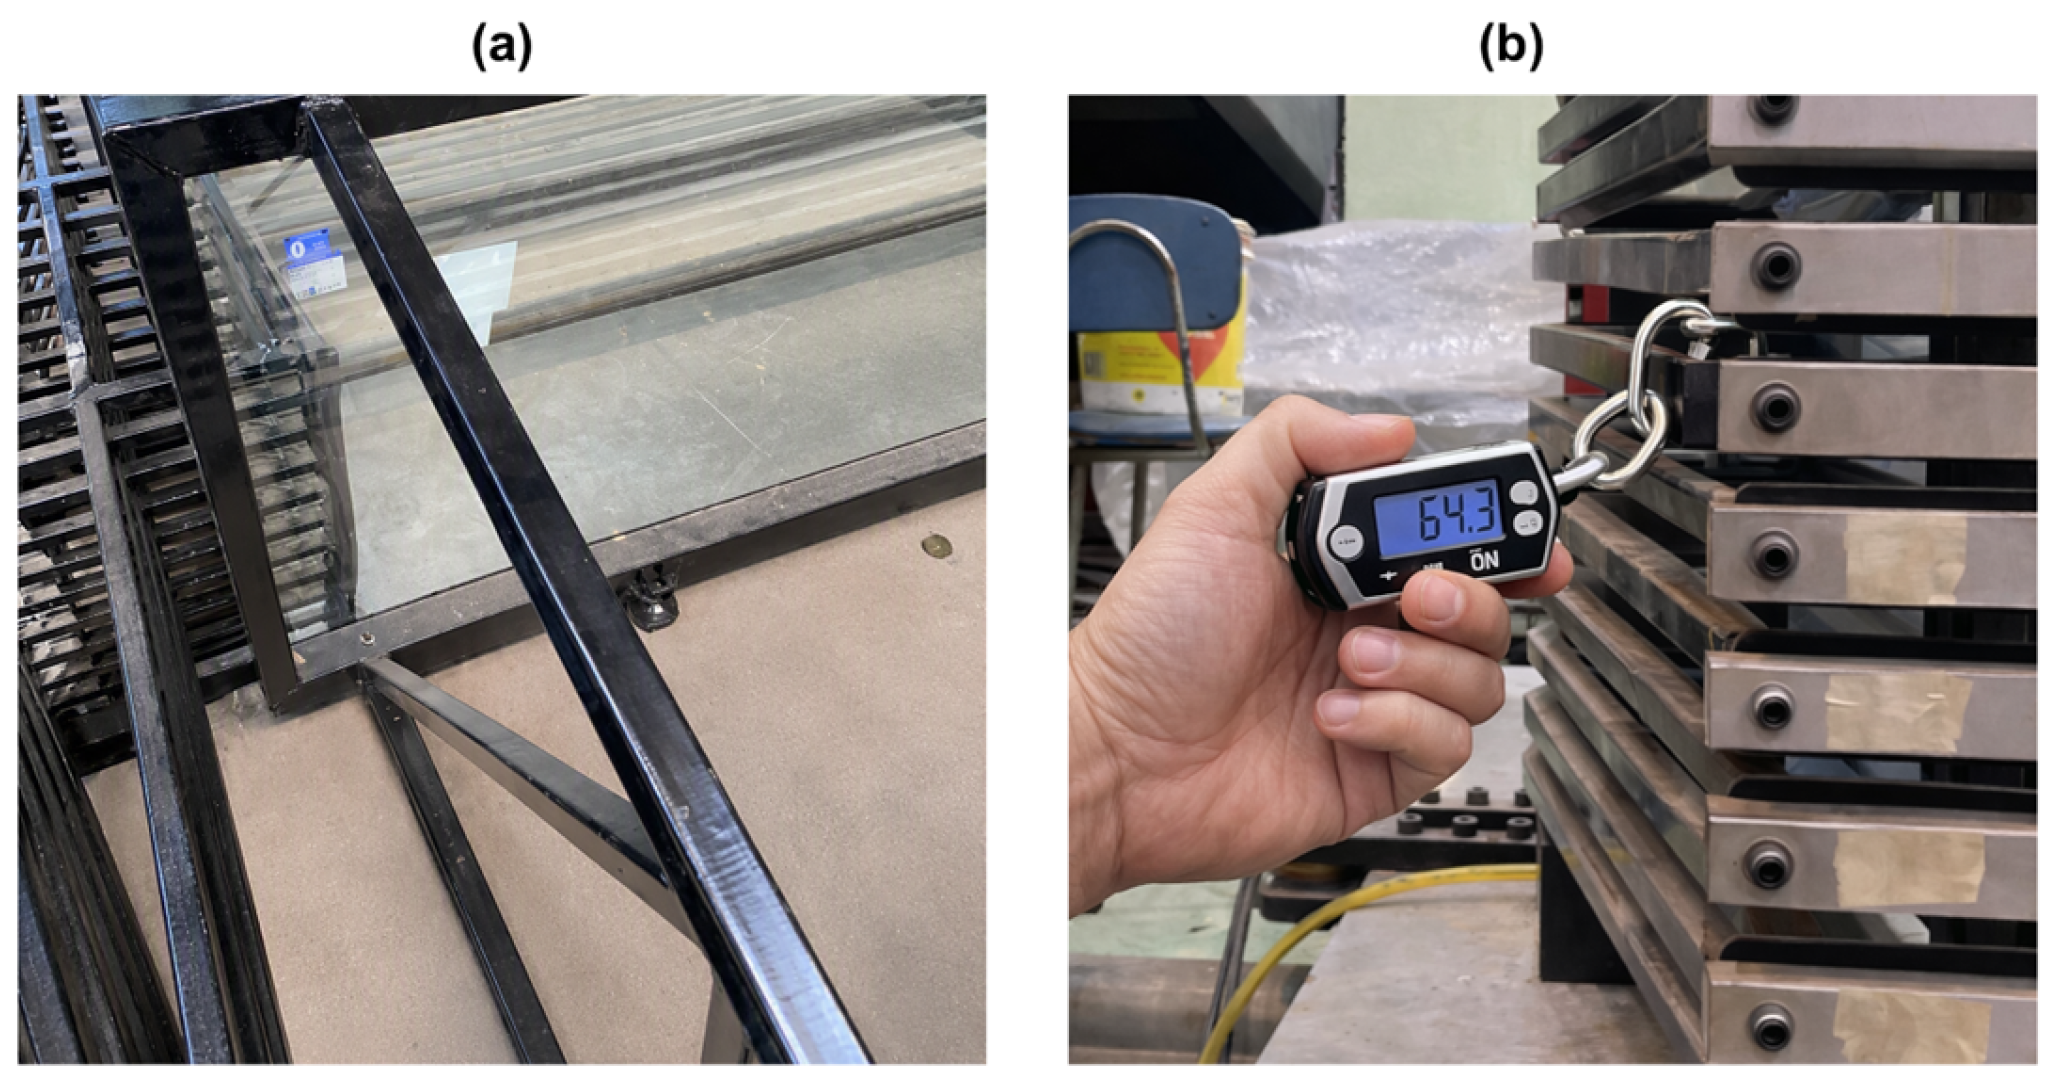
To enable future fluid–soil coupling and liquefaction research, the apparatus incorporates a watertight sealing system consisting of flexible 1.5-mm silicone membranes and lubricated foam rubber gaskets (Figure 2a). The watertight performance of the assembled system was verified during commissioning through water-retention tests conducted at different water levels, with no evidence of leakage. To validate that the sealing system does not introduce excessive parasitic lateral stiffness or constraint, inter-laminar resistance tests were conducted using inline load cell dynamometers (Figure 2b). The lateral force required to mobilize each individual frame was measured and normalized by the corresponding normal force, resulting in equivalent inter-laminar resistance coefficients ranging approximately from 0.07 to 0.12, with a mean value of 0.097. This value is consistent with those reported in the literature [22] for minimizing inter-laminar friction and allowing the model container to approximate free-field shear-beam deformation. These measurements represent the response of the complete inter-laminar assembly and, therefore, may include contributions from both interface friction and restoring forces associated with deformation of the silicone membranes and foam-rubber gaskets.
Figure 2.
(a) Silicone membranes used for watertight sealing between frames; (b) measurement of inter-laminar friction using an inline dynamometer.
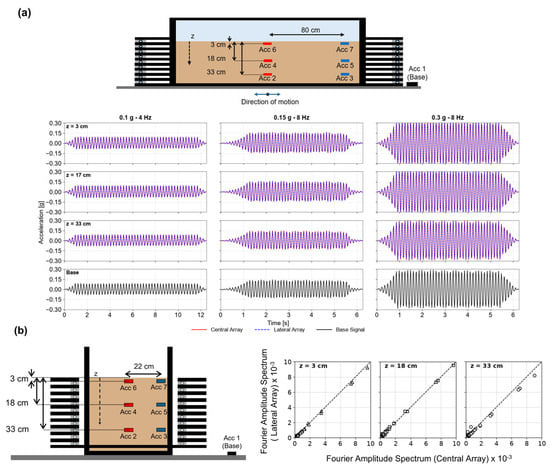
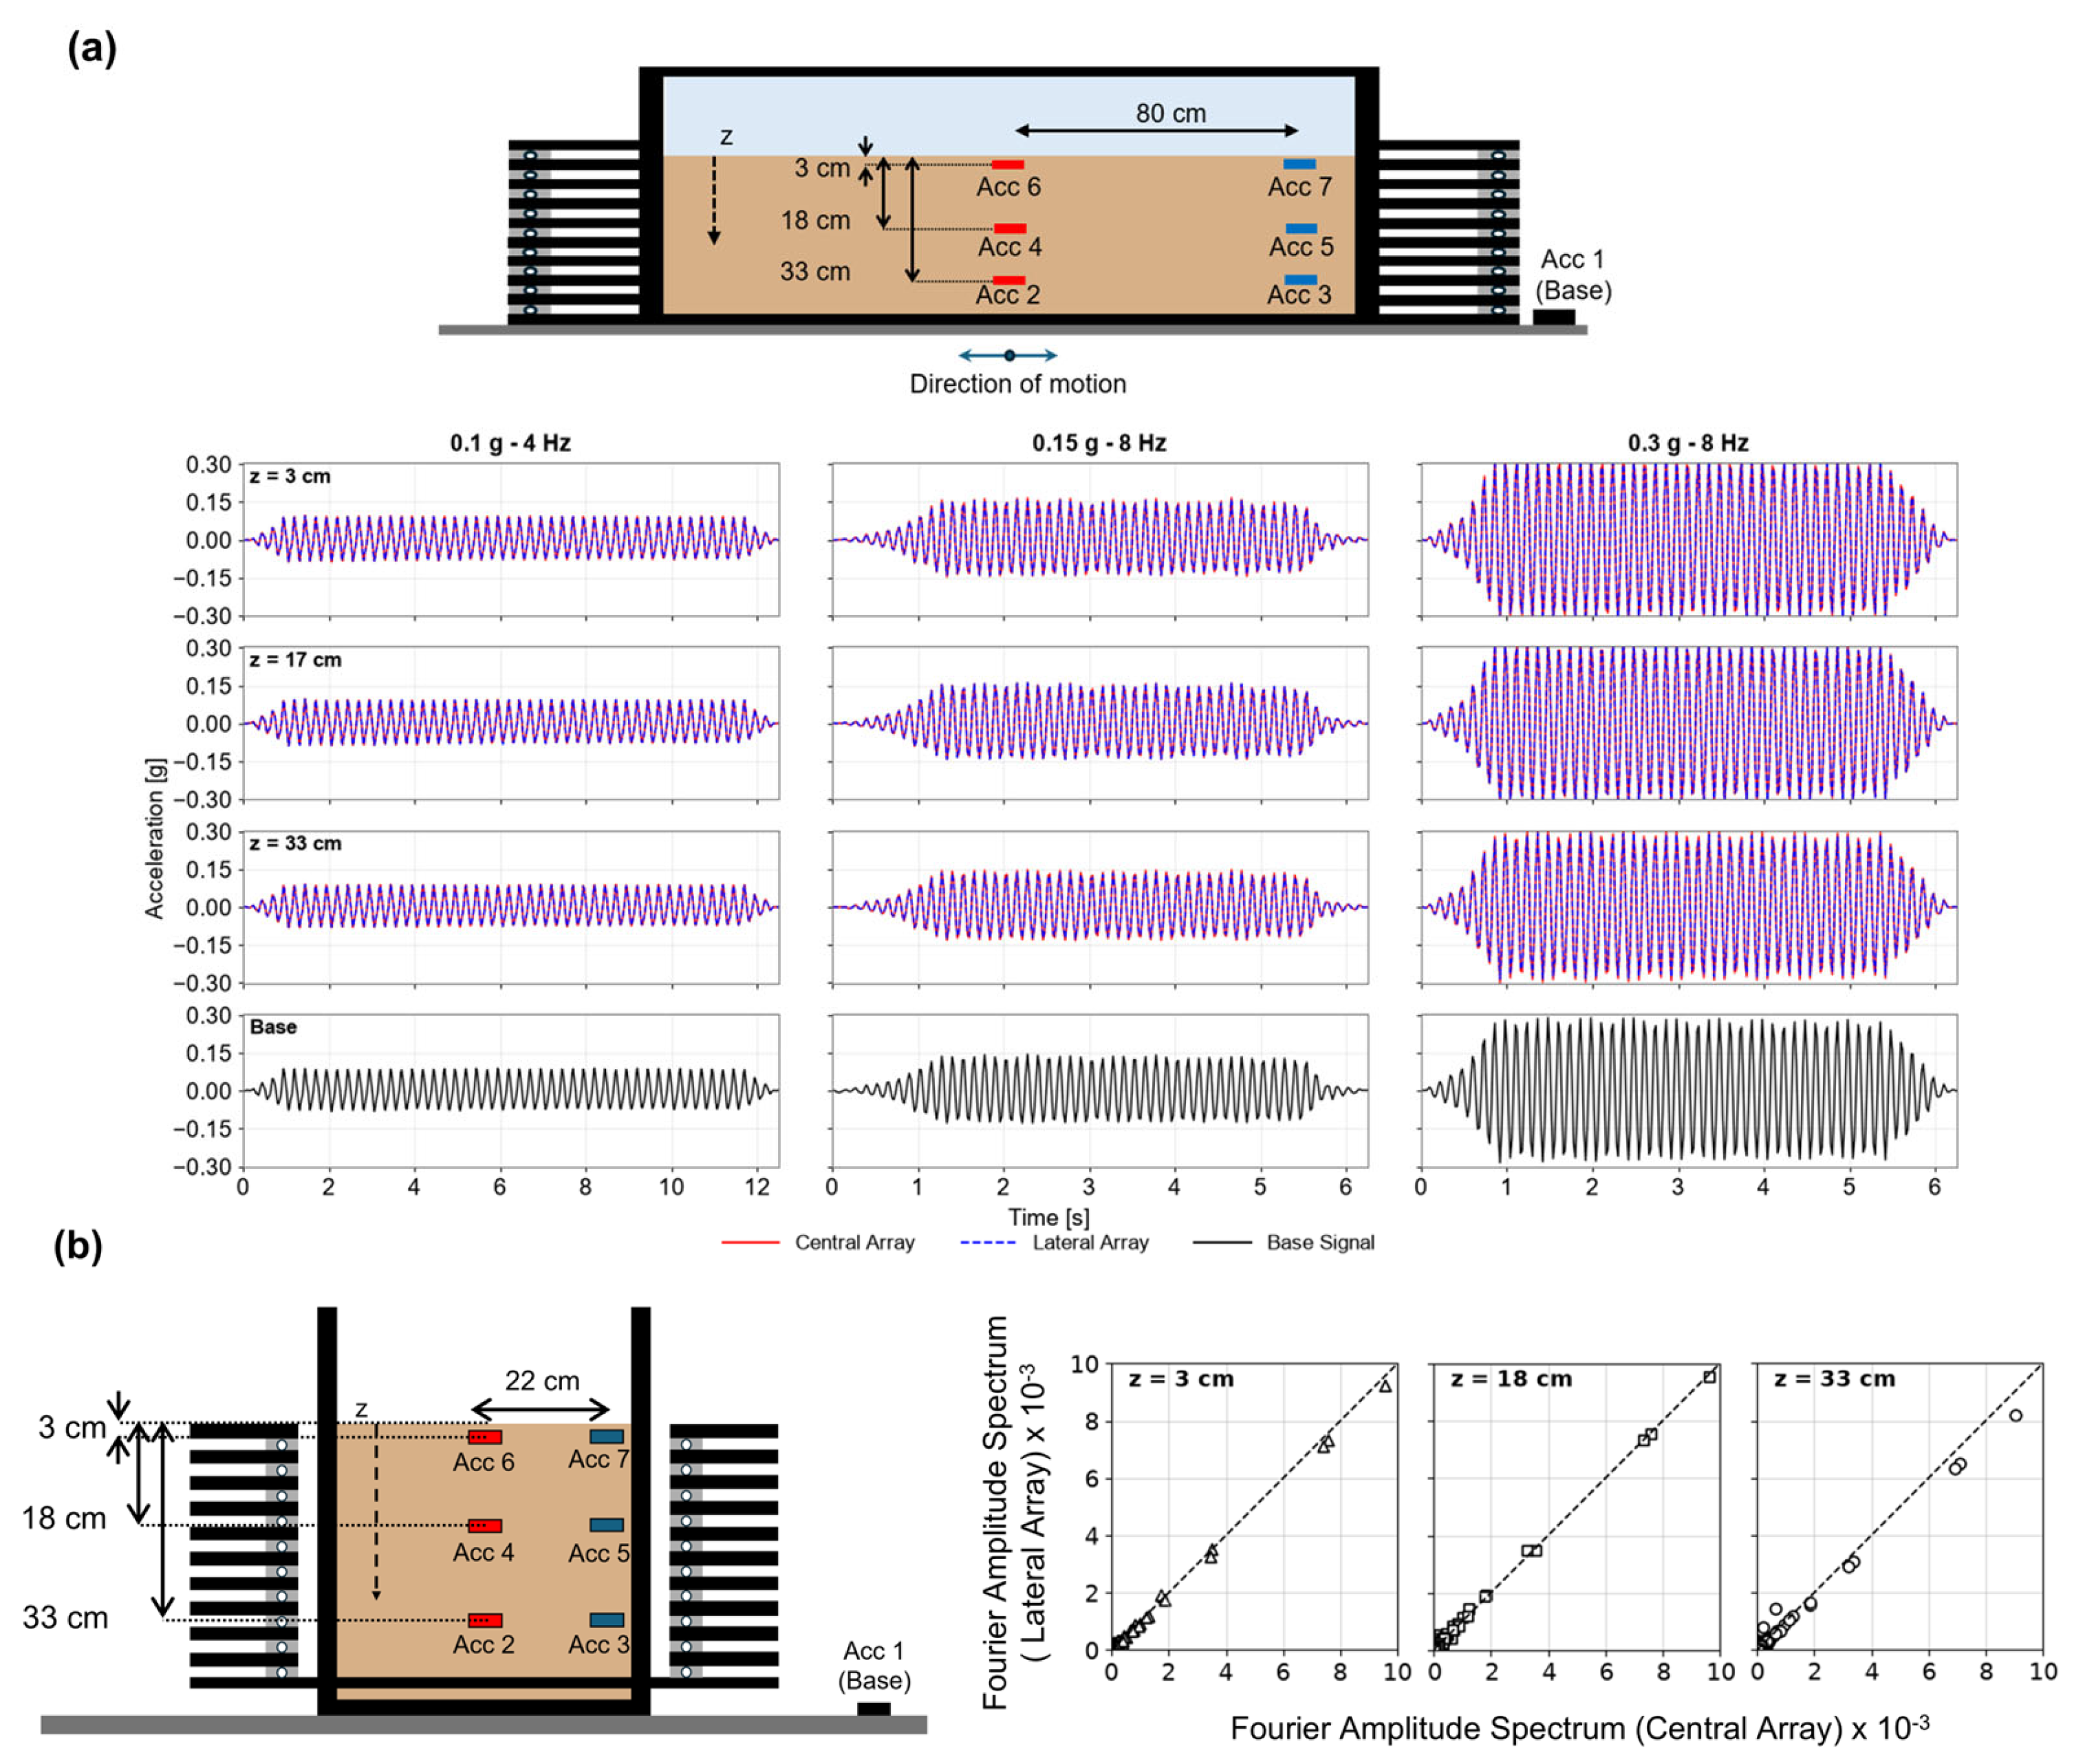
In addition, a series of shaking table tests was conducted to evaluate the influence of the tempered-glass sidewalls on the dynamic response of the laminar box and the consistency of the measured response at different locations within the soil deposit. The assessment used two identical vertical accelerometer arrays containing sensors at the same three elevations. Figure 3a presents representative comparisons for excitations of 0.1 g at 4 Hz, 0.15 g at 8 Hz, and 0.3 g at 8 Hz. In the direction of shaking, acceleration time histories from corresponding sensors in the two arrays show close agreement in amplitude and phase at all three elevations, including under the maximum excitation amplitude of 0.3 g. Results from corresponding sensors located along the perpendicular direction (Figure 3b) show that Fourier spectral amplitudes generally cluster around the 1:1 relationship, with somewhat greater dispersion at the deepest measurement level. Overall, these comparisons indicate that lateral boundary interference remained limited at the instrumented locations and for the excitation conditions investigated.
Figure 3.
Evaluation of boundary effects: (a) comparison of acceleration time histories recorded by accelerometer arrays aligned with the direction of motion at different depths under three excitation conditions (0.1 g at 4 Hz, 0.15 g at 8 Hz, and 0.3 g at 8 Hz); (b) comparison of Fourier amplitude spectra (FAS) between accelerometer arrays arranged perpendicular to the direction of motion at different depths. The dashed line indicates the 1:1 correspondence.
2.2. Test Material and Its Dynamic Characterization at Low Confining Pressure
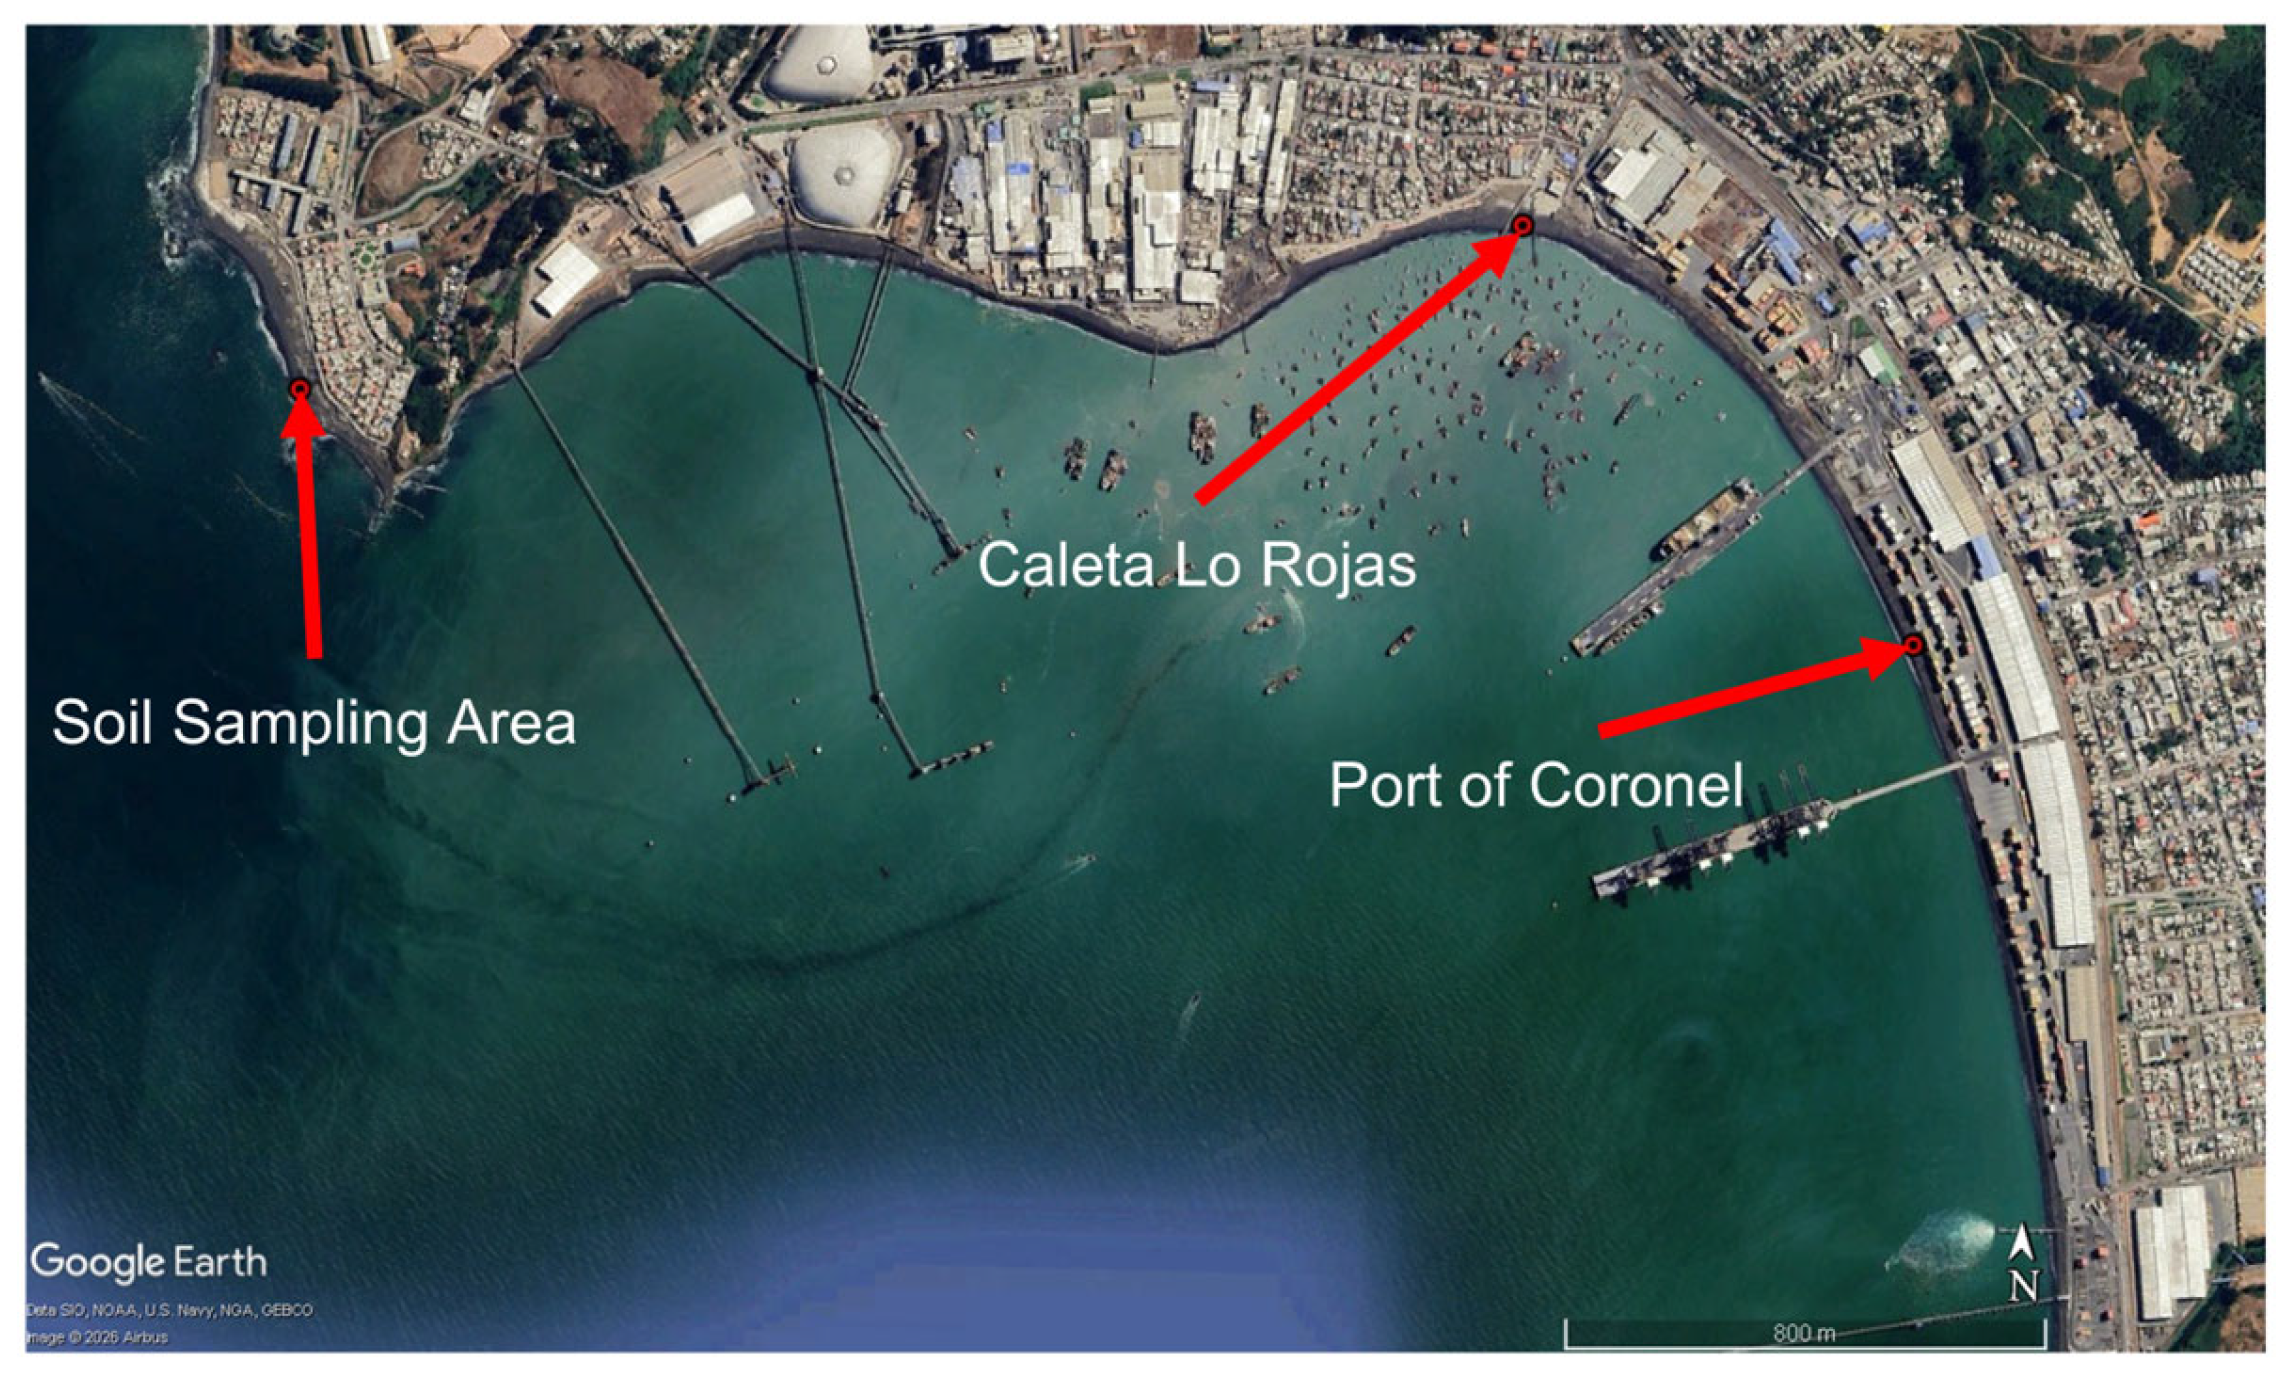
The material selected for the shaking table experiments is a natural coastal sand extracted from Coronel Bay in the Biobío Region, Chile (Figure 4). This sand was chosen due to its regional engineering relevance and documented vulnerability to liquefaction and severe lateral spreading following the Mw 8.8, 2010 Maule earthquake [4,23]. Standard index property characterization was performed according to ASTM standards. Sieve analysis classified Coronel sand as a poorly graded sand (SP) according to the Unified Soil Classification System (USCS), exhibiting a uniform grain size distribution with less than 1% fines content, a uniformity coefficient () of 1.81, and a curvature coefficient () of 0.89. The minimum and maximum dry mass densities were determined to be and , respectively. Direct shear tests under normal stresses of 25, 50, and 100 kPa established a peak internal friction angle and a constant-volume residual friction angle of .
Figure 4.
Location of the Coronel Bay soil sampling area in the Biobío Region, Chile (UTM WGS84 Zone 18S: 663,209 m E; 5,899,434 m N). Satellite imagery obtained from Google Earth; labels and arrows added by the authors.
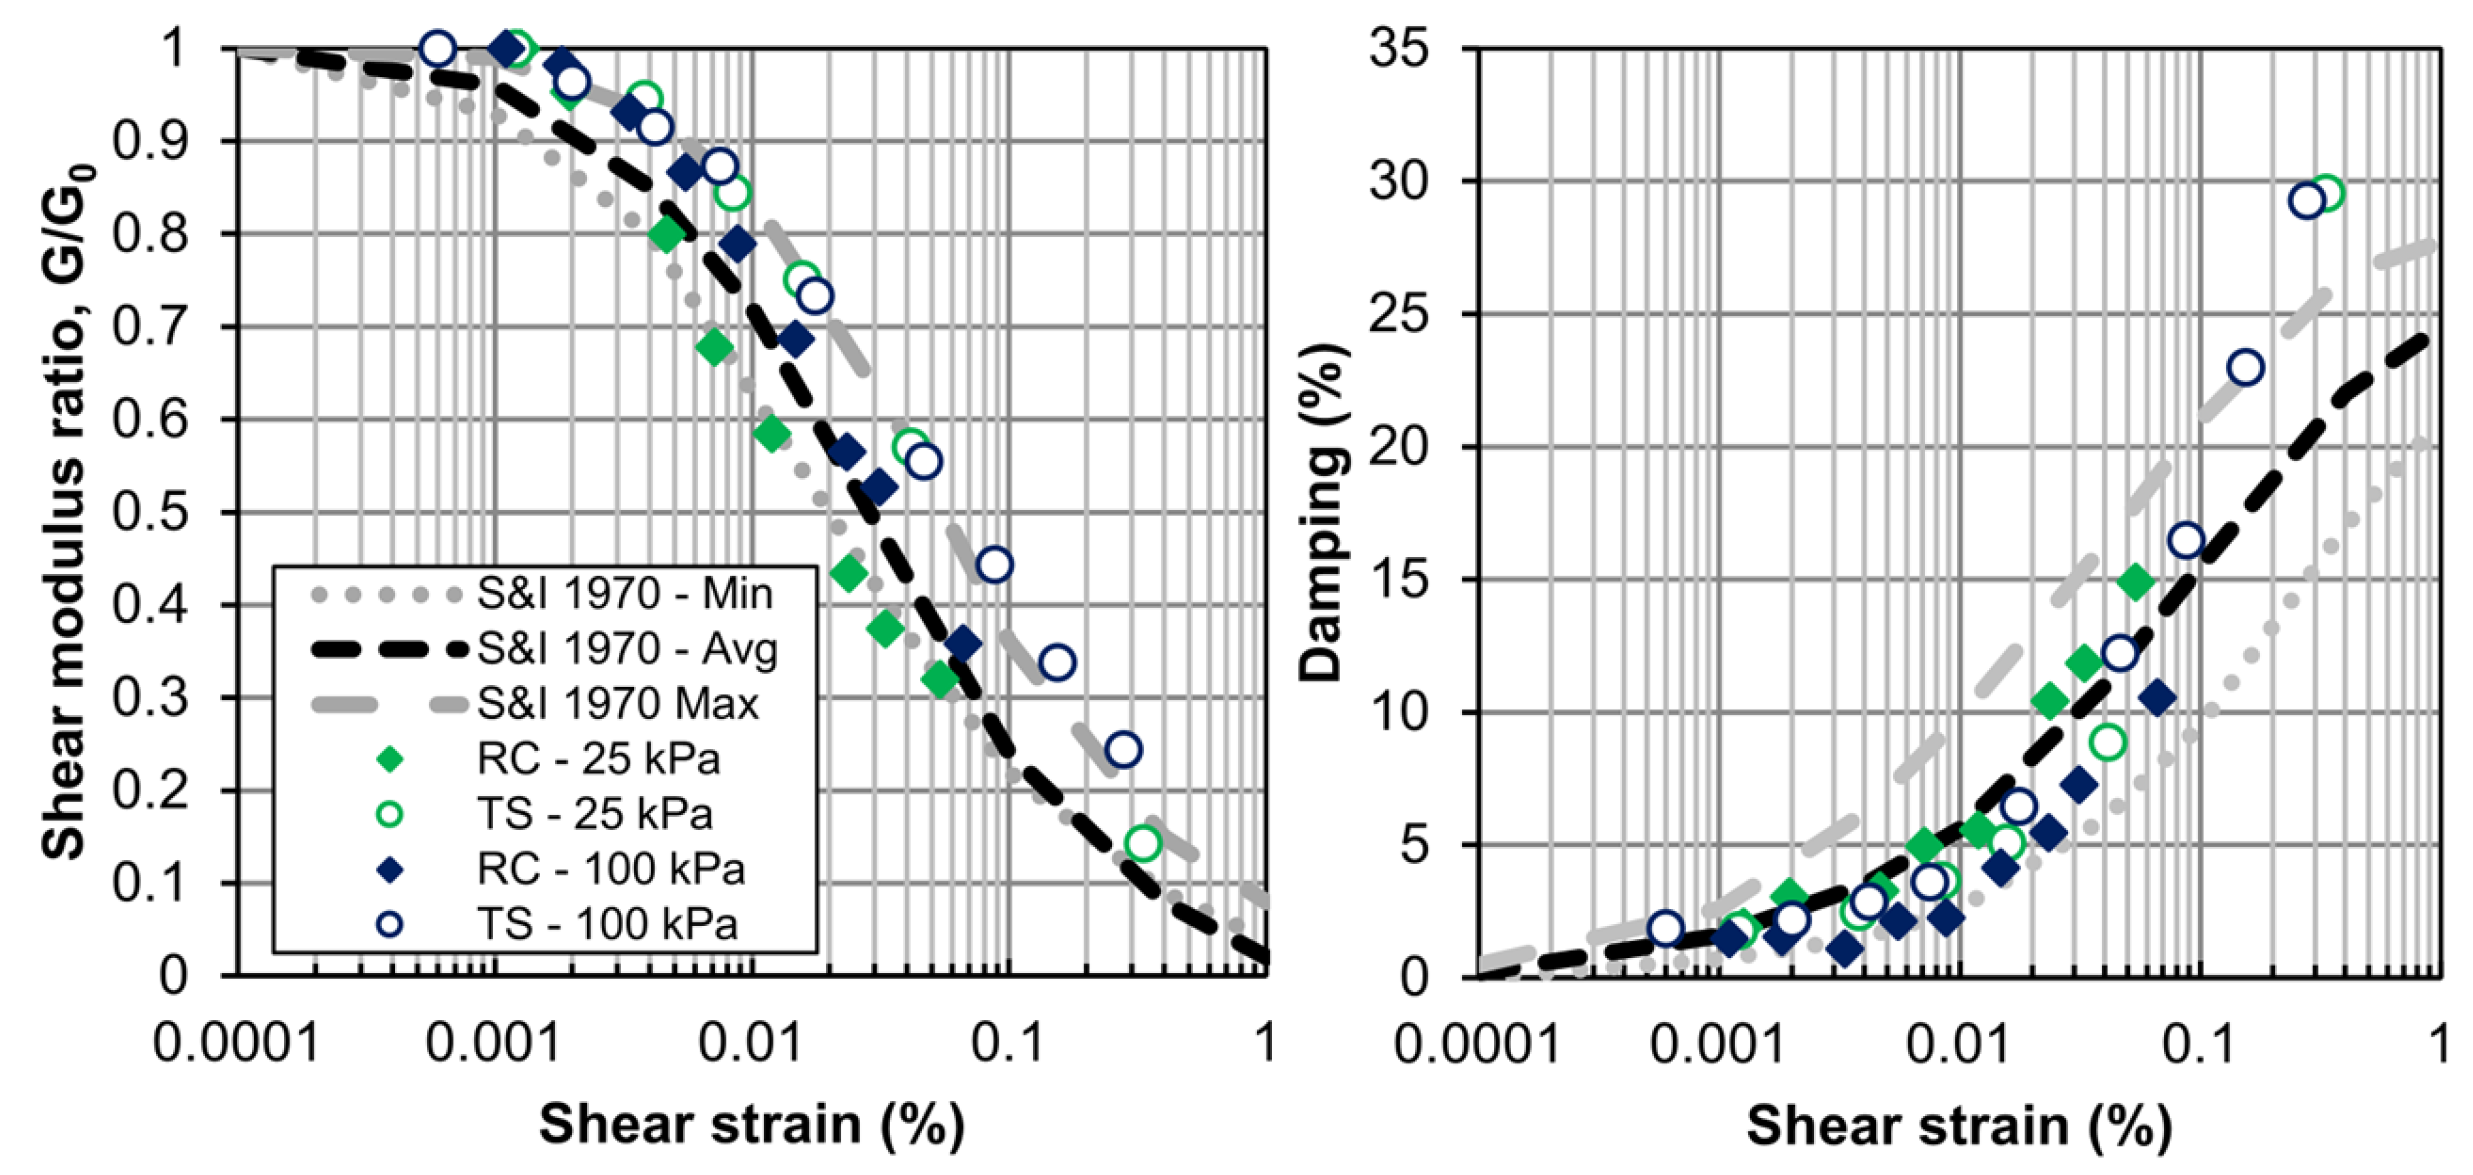
Because 1-g reduced-scale physical models are subjected to relatively low overburden stresses, the dynamic behavior of the sand was characterized under low effective confinement representative of the stress conditions expected in the shaking table tests. To this end, a laboratory testing program comprising combined resonant column (RC) and cyclic torsional shear (TS) tests was performed at a specimen density matching the baseline loose-sand configuration (relative density, , and dry mass density ) under an initial effective confining pressure of 25 kPa (tests at a reference pressure of 100 kPa were also conducted for comparison). These tests characterize the dynamic behavior of the material used in the experiments and show good agreement with the classical Seed and Idriss [24] modulus reduction curves for sand (Figure 5).
Figure 5.
Shear modulus reduction and damping curves obtained from resonant column (RC) and cyclic torsional shear (TS) tests on Coronel sand, compared with the reference curves proposed by Seed and Idriss (S&I) [24].
To estimate a continuous soil shear wave velocity () profile across the laminar box, the following empirical stress-dependency model was calibrated:
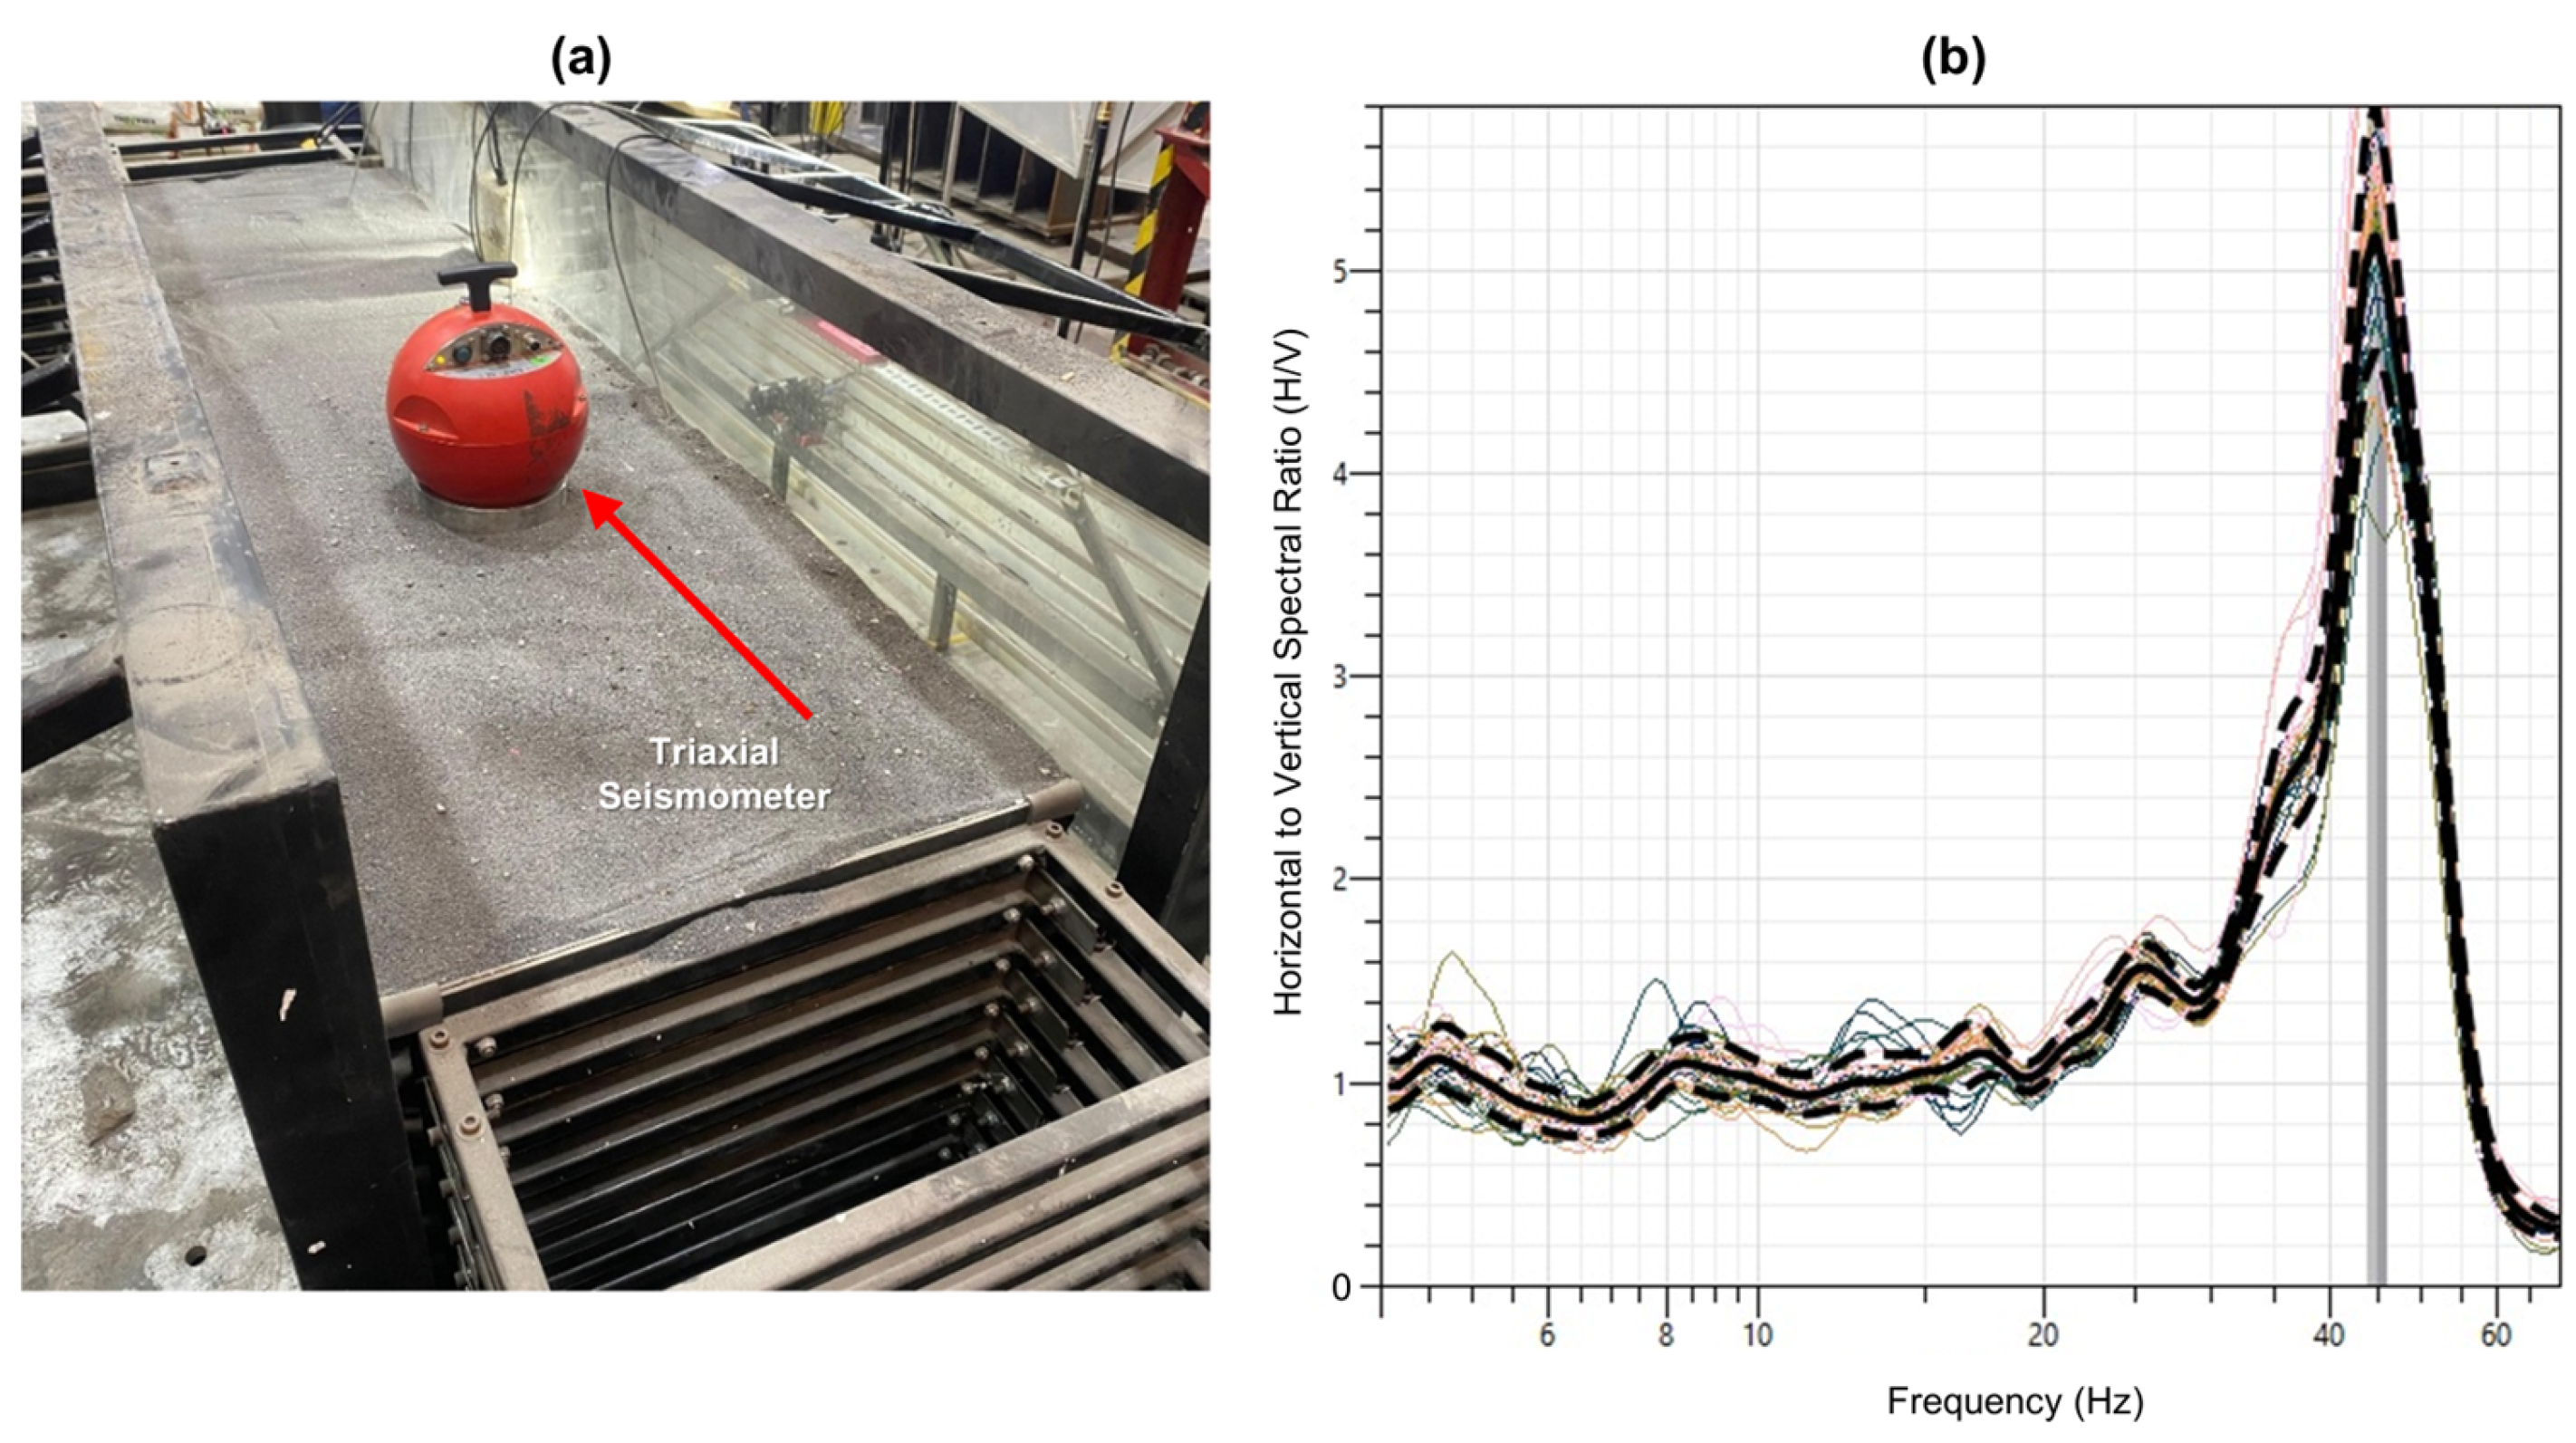
where is the current mean effective stress and and are the reference effective stress and shear wave velocity, respectively. Using the RC test results for 25 and 100 kPa, the fitting exponent was computed at approximately 0.23 (i.e., ). Discretizing the testing layer thickness into sublayers of 5-cm thickness, the harmonic average shear wave velocity of the profile was estimated as . Considering the box filled to its full internal height , the fundamental frequency of the soil inside the box, evaluated via standard linear shear-beam formulation, was . This result is consistent with Horizontal-to-Vertical Spectral Ratio (H/V) analyses using microtremors recorded by a triaxial seismometer with a sample rate of 200 Hz and recording windows of 20 min (Figure 6).
Figure 6.
(a) Triaxial seismometer used for Horizontal-to-Vertical Spectral Ratio (HVSR) measurements; (b) HVSR obtained from ambient-vibration measurements. The colored lines represent individual HVSR curves, the solid black line represents the mean, and the dashed black lines indicate the upper and lower bounds corresponding to one standard deviation from the mean.
2.3. Instrumentation, Data Acquisition, and DIC Analysis Configuration
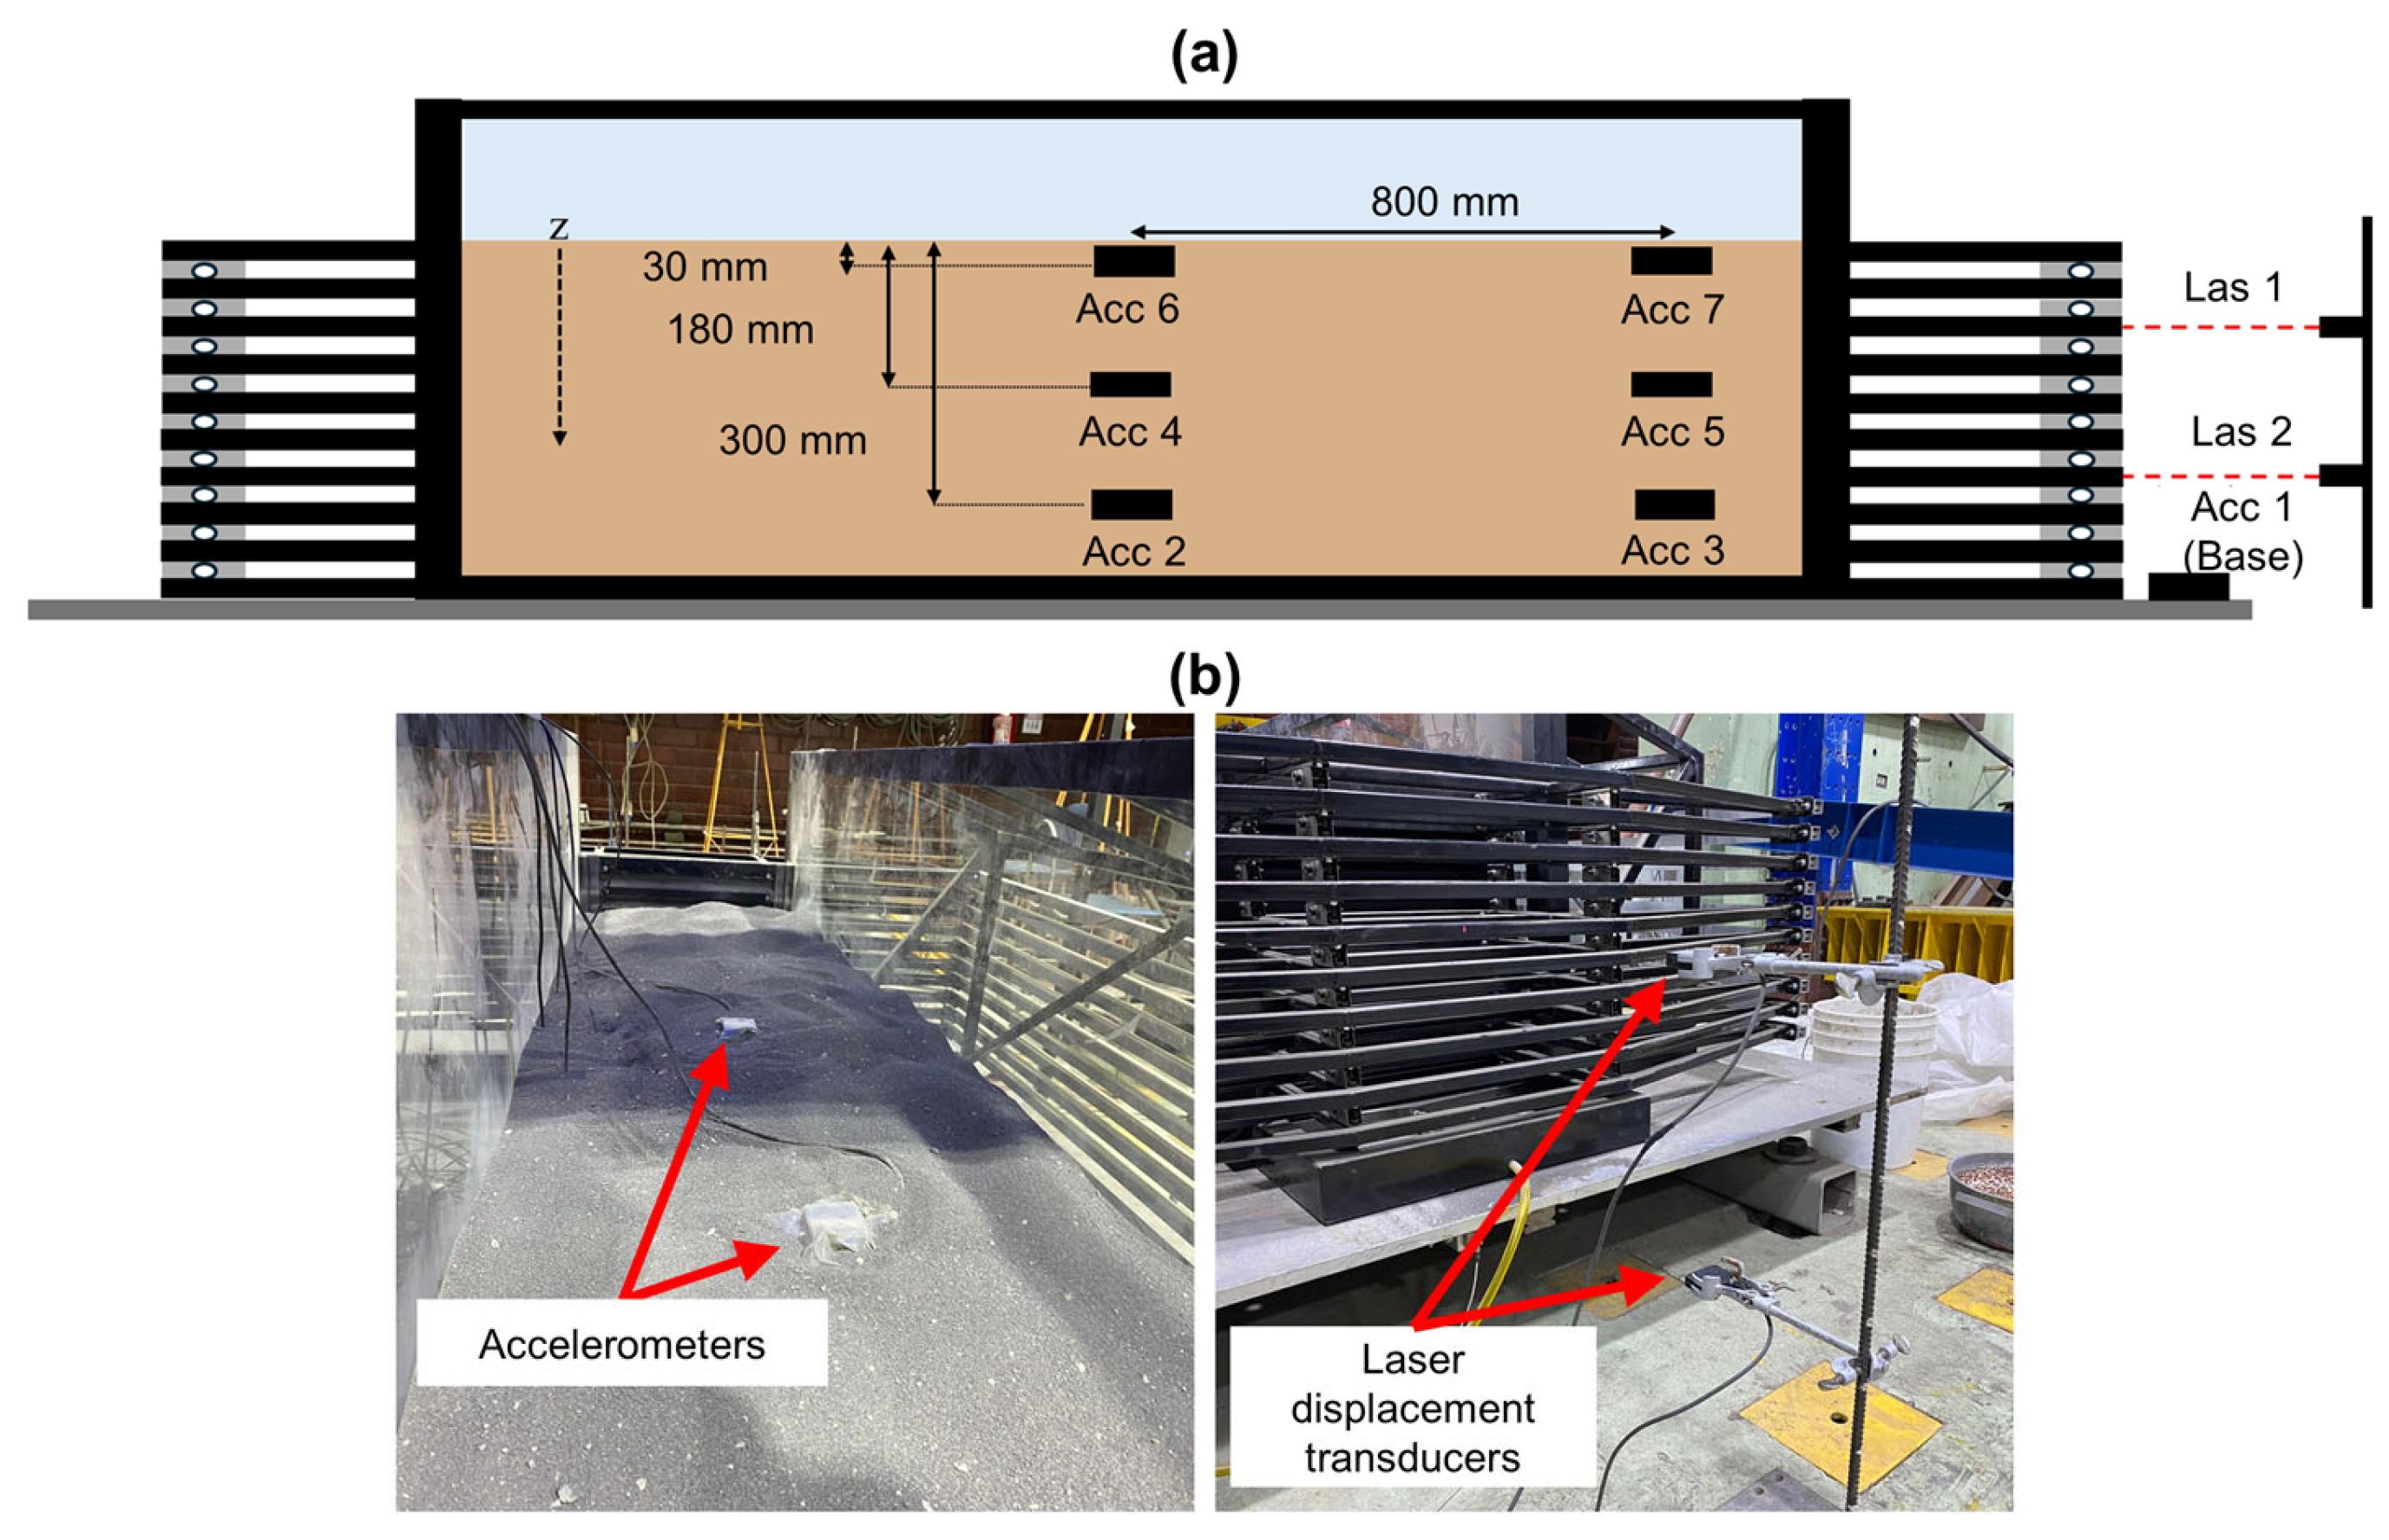
The experimental system combines conventional geotechnical instrumentation with non-intrusive optical measurements to provide complementary information on the dynamic response of the tested soil deposits. Conventional instrumentation consisted of six accelerometers (Acc 2–Acc 7) embedded within the laminar shear box and one accelerometer installed at the base of the shaking table (Acc 1) to record the input motion and ensure signal control. The accelerometers were ADXL units with a measurement range of ±3 g. In addition, two Baumer OM30-L0350.HV.YIN laser displacement transducers (Las 1 and Las 2), with a measuring range of 50–350 mm, repeatability of 2–30 μm, and maximum linearity error of ±0.15% of the measurement range, were used to monitor the relative displacement between adjacent sliding rings of the laminar box (Figure 7).
Figure 7.
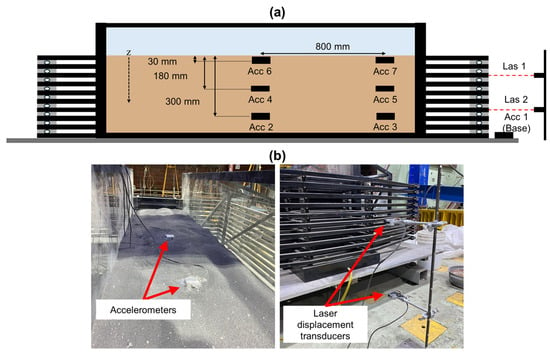
(a) Instrumentation layout in elevation view; (b) accelerometers and laser displacement transducers used for conventional measurements.
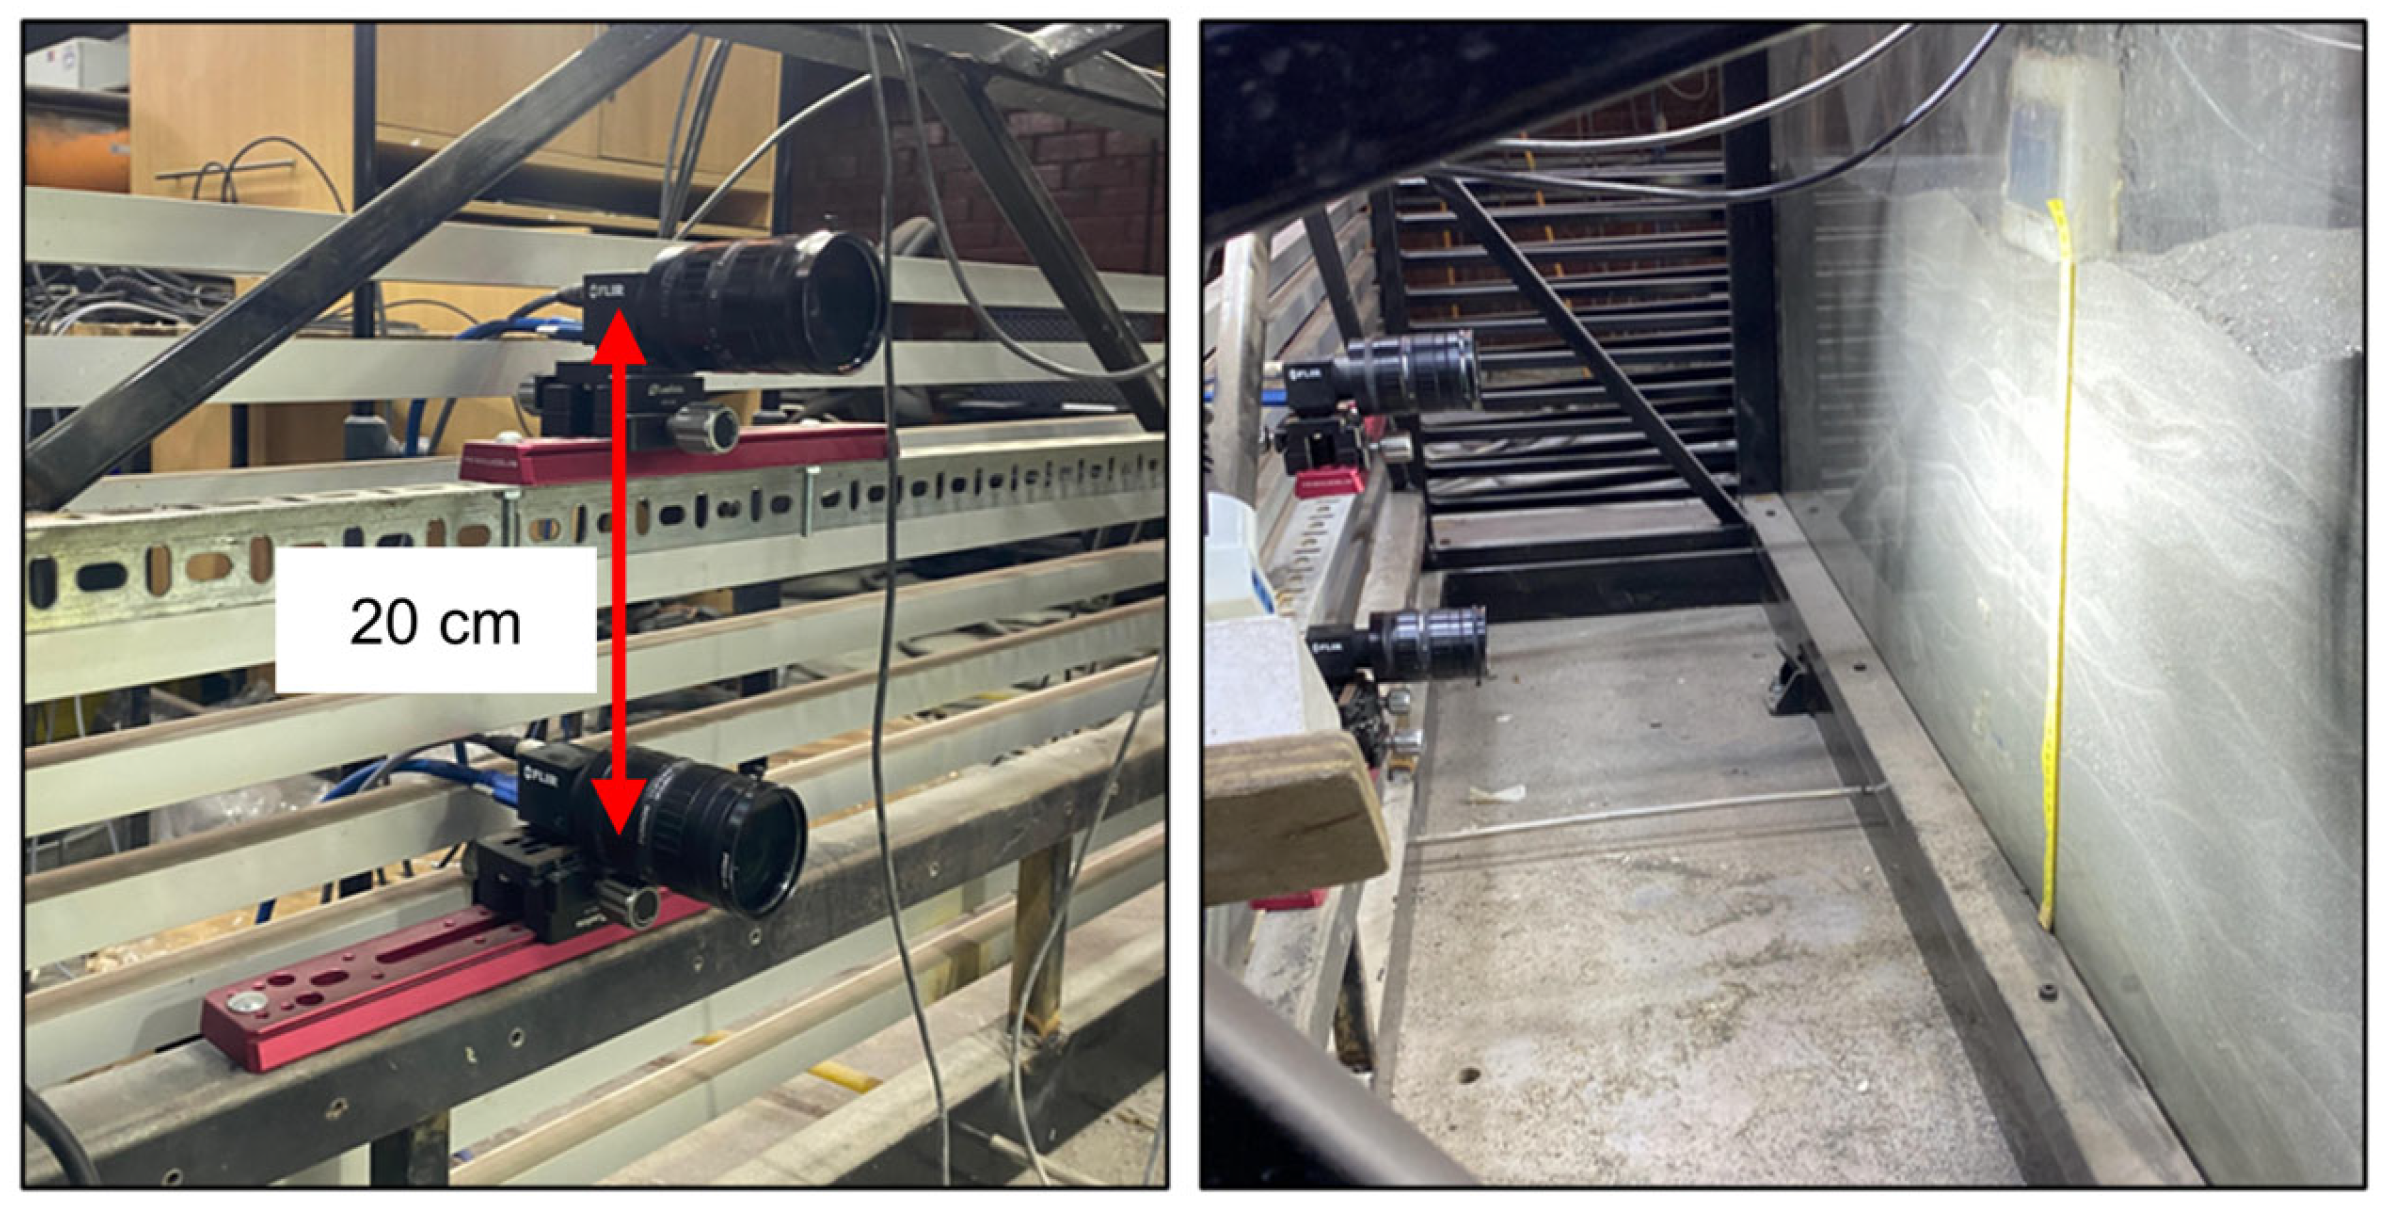
To complement the conventional instrumentation, measurements were obtained using a calibrated DIC system through the transparent glass sidewalls of the laminar box. Optical acquisition was performed using two synchronized FLIR Blackfly S BFS-U3-51S5M machine-vision cameras equipped with Fujinon 12.5-mm, 5-MPx lenses (Figure 8). Images were recorded at 50 frames per second (fps) under stabilized LED illumination, with hardware synchronization provided by a MatchID Trigger Unit (cameras, lenses, and trigger unit sourced from MatchID NV, Ghent, Belgium). Measurements from conventional sensors were acquired simultaneously at 50 Hz, enabling synchronized point and optical measurements throughout each experiment. The 50-fps acquisition rate corresponds to a Nyquist frequency of 25 Hz, which is theoretically adequate to avoid time aliasing of the maximum imposed excitation frequency of 8 Hz. However, at 8 Hz, the temporal resolution is limited to approximately 6.25 image frames per loading cycle, which may prevent the accurate characterization of cyclic shear-strain peaks, phase relationships, and the temporal evolution of localized strains. Consequently, the DIC results are interpreted primarily in terms of spatial deformation patterns, progressive strain accumulation, and residual deformation rather than precise high-frequency phase relationships or individual instantaneous strain peaks.
Figure 8.
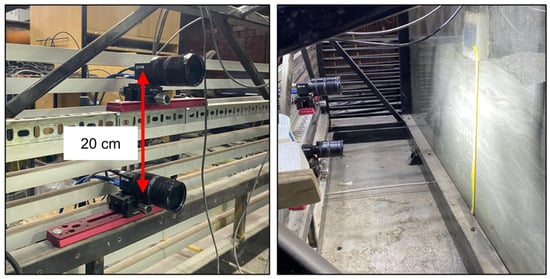
Location of the machine-vision cameras mounted on the steel support frame of the laminar shear box.
To improve the optical contrast required for DIC analysis, the Coronel sand was mixed with powdered calcium hydroxide at a mass ratio of 1:80. This treatment was selected to enhance grayscale contrast while minimizing potential effects on the dry mechanical behavior of the material. Additional laboratory tests conducted on the treated material showed no significant differences in its mechanical response compared with the untreated sand under the tested conditions.
Image processing was performed using MatchID© 2D software (version 2025.2.0) employing a localized two-stage optimization routine. Spatial discretization used a subset size of 21 × 21 pixels and a step size of 10 pixels. Correlation was based on the Normalized Sum of Squared Differences (NSSD) criterion to ensure robust image matching under controlled lighting conditions. Finally, shear strain distributions were computed using the finite Green–Lagrange strain tensor, providing a robust description of deformations during dynamic loading.
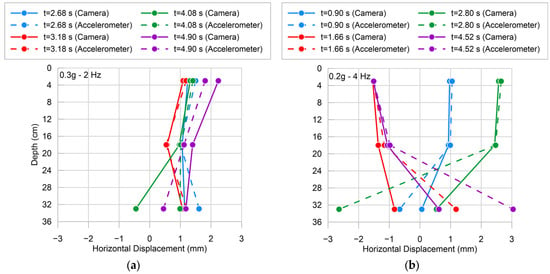
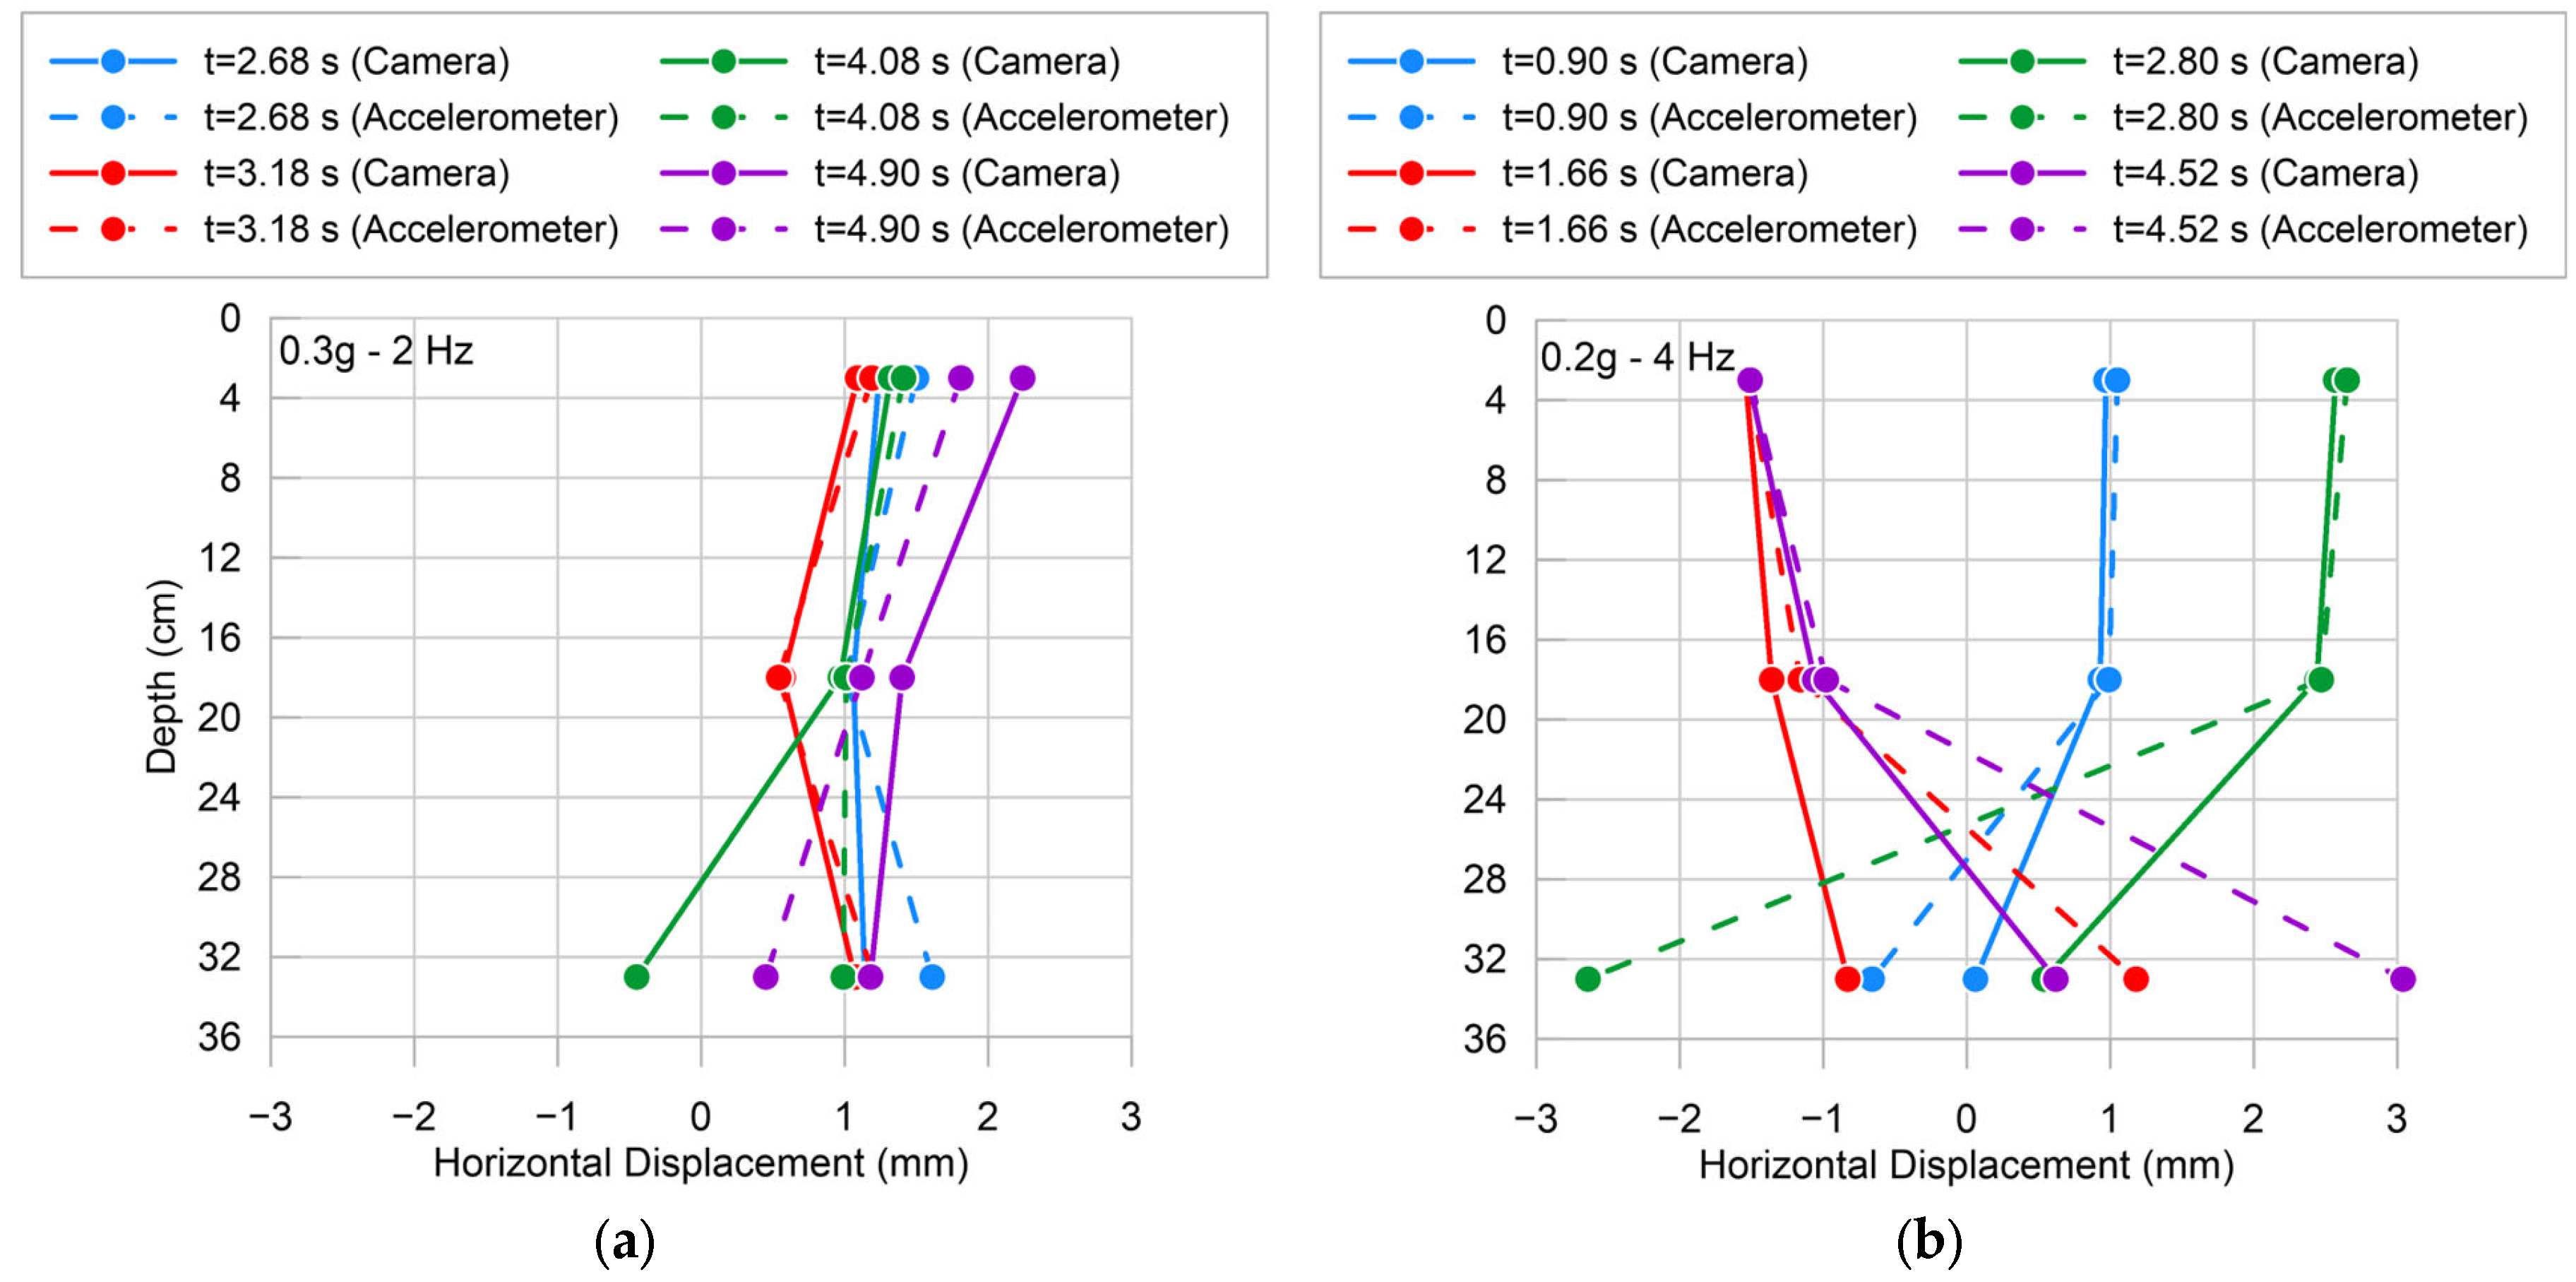
As an independent assessment of the optical measurements, horizontal soil-displacement profiles obtained from DIC were compared with those independently derived through double integration of the embedded accelerometer records. The acceleration records were baseline-corrected and numerically integrated twice to obtain displacement time histories, with drift correction applied to minimize the accumulation of low-frequency integration errors. Figure 9 presents representative comparisons for excitations of 0.3 g at 2 Hz and 0.2 g at 4 Hz at four instants during each test. Considering all 24 comparison points, the mean absolute error (MAE) between the two methods was 0.54 mm. The MAE was 0.13 mm, 0.10 mm, and 1.39 mm at depths of 3, 18, and 33 cm, respectively, indicating close agreement at the upper and middle measurement levels and larger discrepancies at the lowest elevation. A similar increase in the apparent differences between DIC- and accelerometer-derived displacements toward the lower part of a laminar box has been previously reported [21]. Overall, the comparison supports the capability of the DIC system to characterize the displacement response of the soil deposit while also identifying reduced agreement at the lowest measurement level.
Figure 9.
Comparison of horizontal soil-displacement profiles obtained from DIC and independently derived through double integration of embedded accelerometer records at representative instants for: (a) 0.3 g at 2 Hz; and (b) 0.2 g at 4 Hz.
3. Experimental Program and Results
3.1. Testing Plan and Scaling Criteria
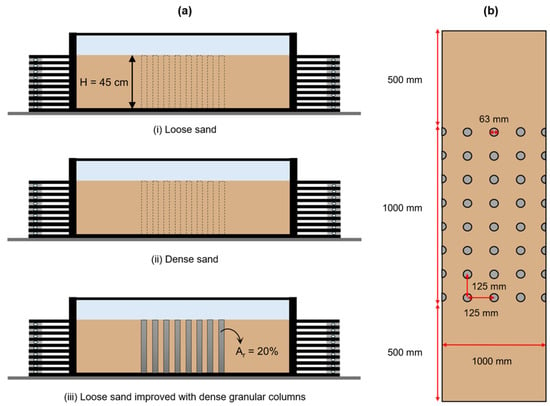
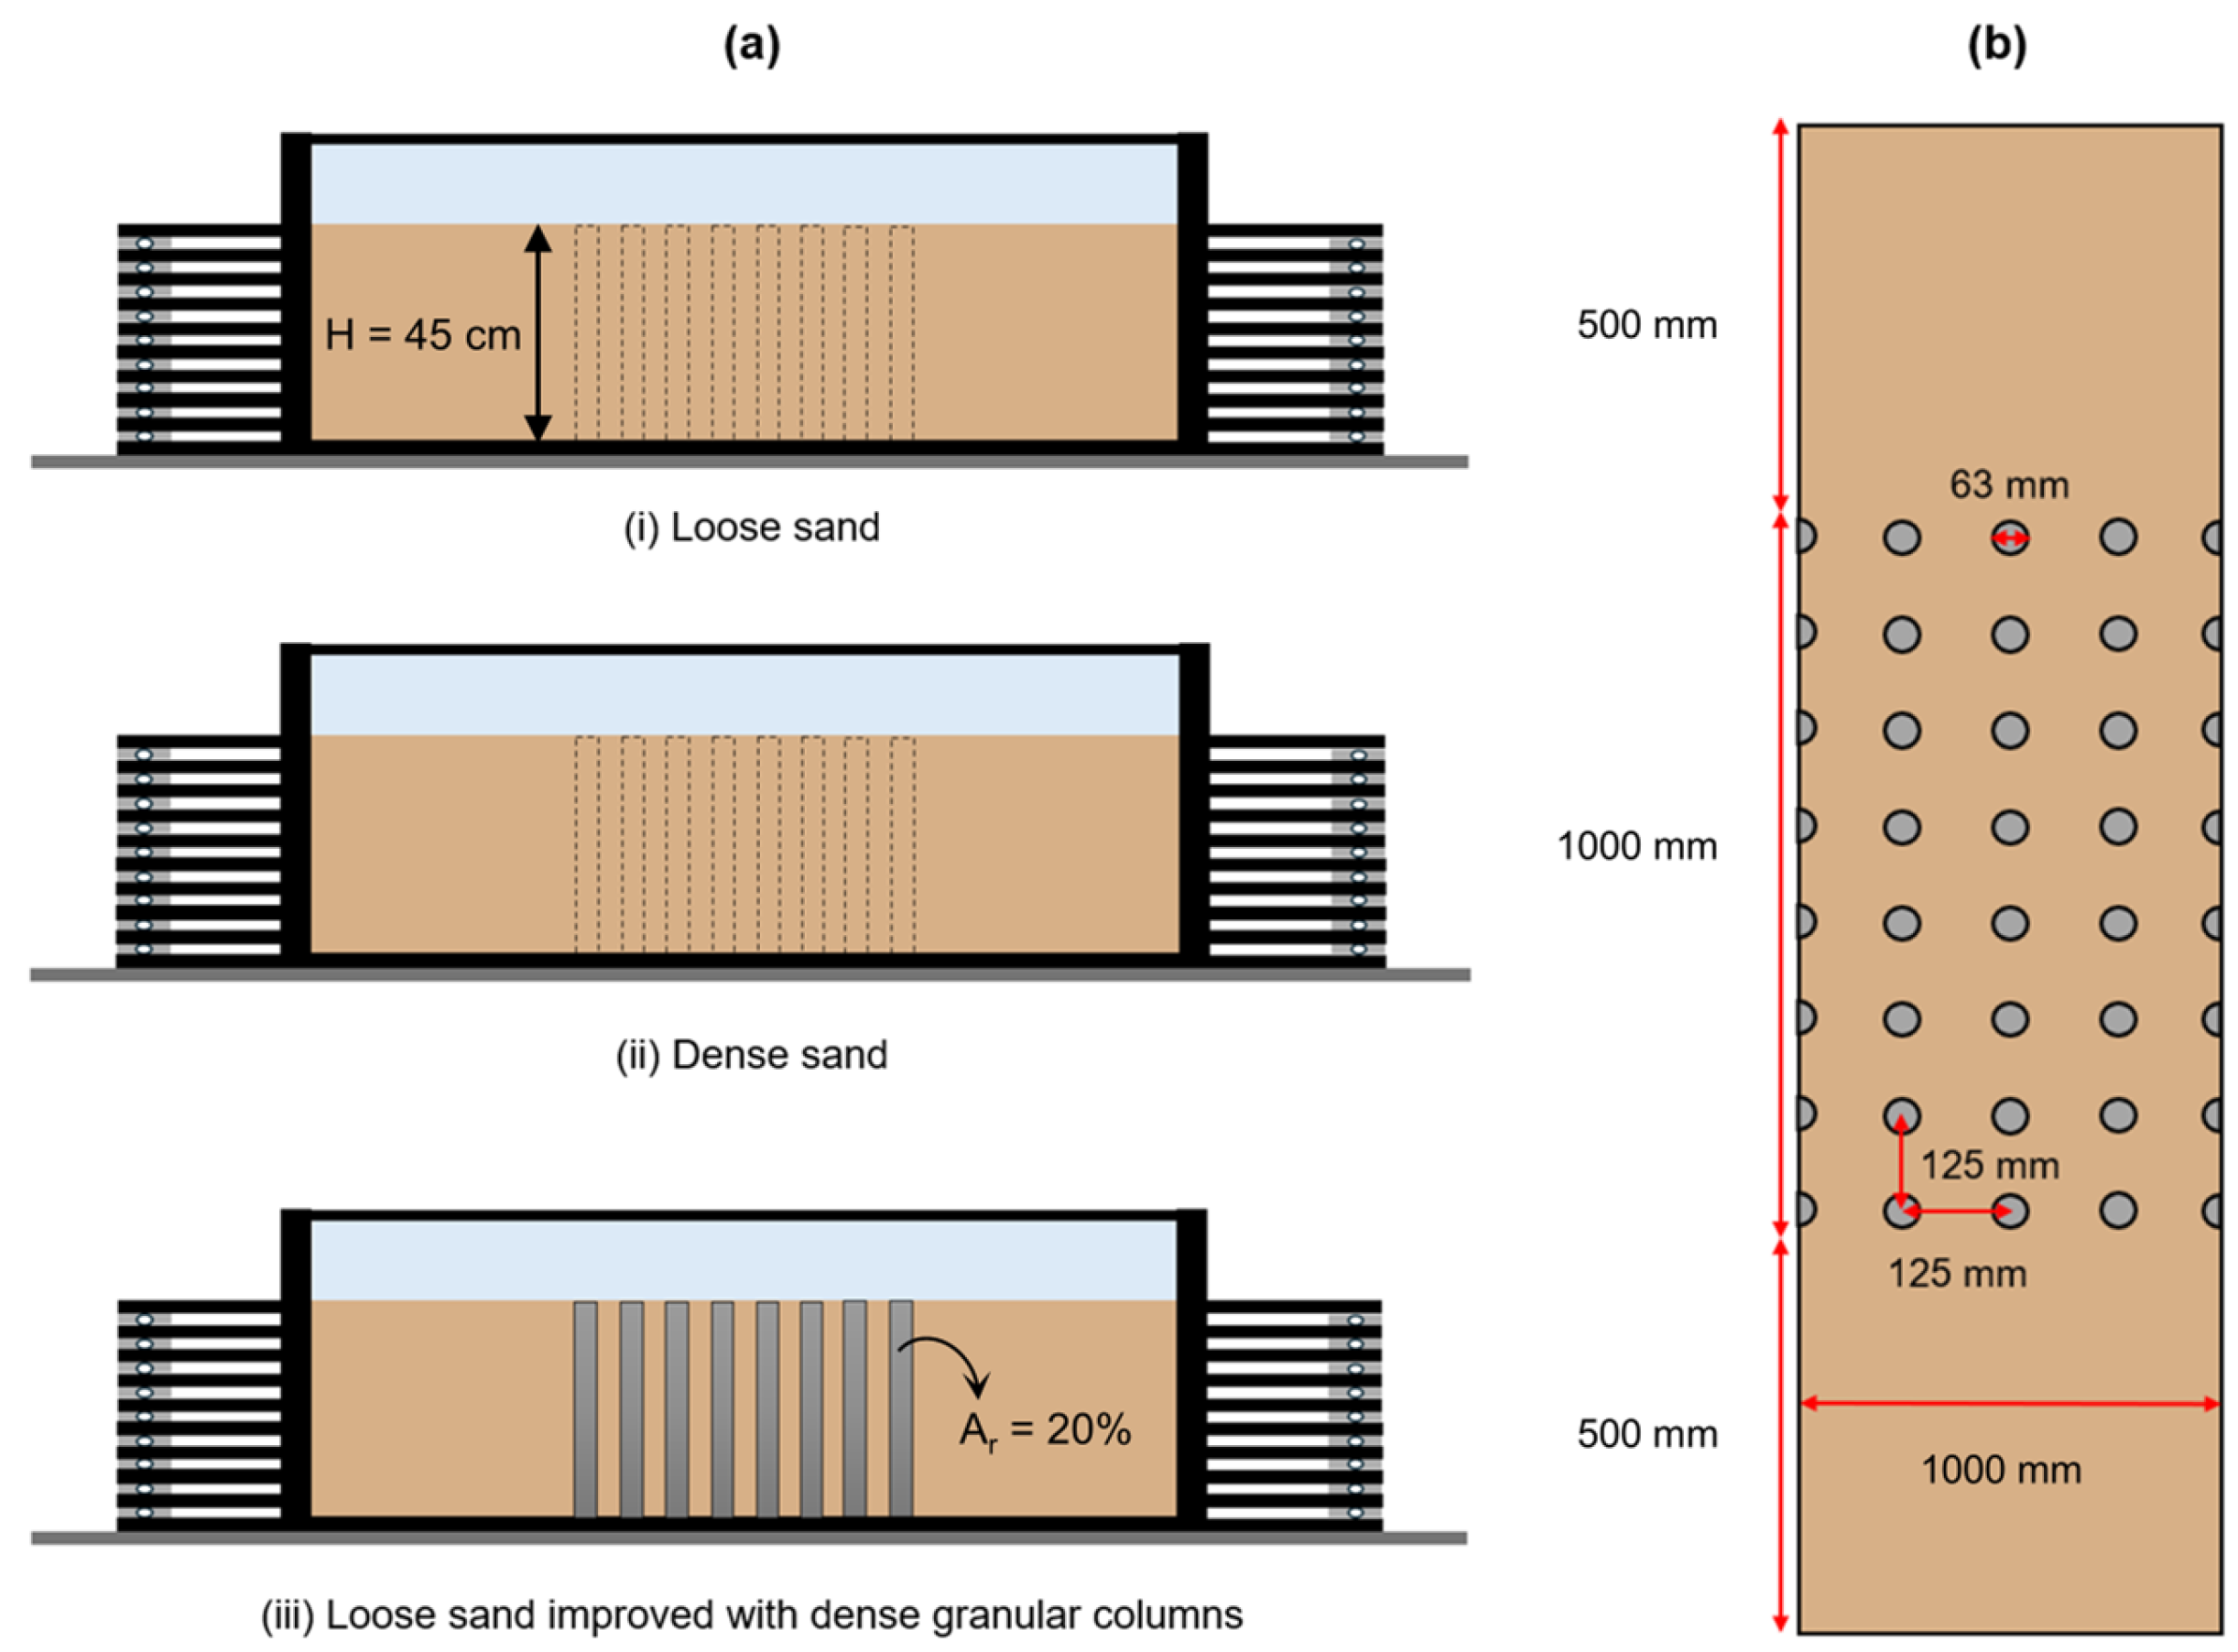
To validate the proposed experimental platform and demonstrate its capabilities under representative ground conditions, a series of reduced-scale physical models was prepared using natural Coronel sand. Three configurations were selected to provide distinct dynamic responses: (i) loose sand (), (ii) dense sand (), and (iii) loose sand improved with dense granular columns with an area replacement ratio, (i.e., the area of the columns to the total treatment area in plan view) of 20% (Figure 10). These cases allow assessment of the experimental system’s ability to reproduce well-established response trends while simultaneously acquiring conventional sensor data and DIC measurements. All experiments, with a prototype-to-model scale factor (λ) of 16, considered a 45-cm-thick soil deposit. Scaling transformations (Table 1) followed standard 1-g physical modeling similitude laws [8].
Figure 10.
(a) Elevation view of the three ground configurations considered in the experimental program. The vertical dashed lines indicate the locations of the granular columns used in the improved-ground case; (b) plan view of the granular-column layout for the improved loose-sand configuration.
Table 1.
Scaling factors (prototype/model) after [8].
Each model configuration was subjected to an identical shaking program consisting of one-dimensional (1D) sinusoidal base excitations with three frequencies (2, 4, and 8 Hz) sequentially combined with three target peak acceleration amplitudes (0.1, 0.2, and 0.3 g), resulting in nine individual test runs per configuration. Each configuration was constructed only once and subjected to the complete loading sequence without specimen reconstitution. Because the specimens were not reconstituted between motions, the response measured during each test may reflect both the characteristics of the applied excitation and cumulative effects associated with the preceding loading history; consequently, the effects of excitation amplitude and frequency cannot be considered fully independent. The loading protocol was applied in the same order for all configurations, progressing from 0.1 g (2, 4, and 8 Hz) to 0.2 g (2, 4 and 8 Hz) and finally to 0.3 g (2, 4 and 8 Hz). This approach ensured consistency among the tested configurations and avoided variability associated with repeated specimen preparation. Instrumentation redundancy was achieved by embedding two symmetrical arrays of accelerometers at the central plane and quarter-span sections of the container, monitoring the response at depths of 3 cm, 18 cm, and 33 cm below the ground surface (Figure 7). Together with the synchronized DIC measurements described in Section 2.3, this instrumentation strategy enabled complementary point and optical observations throughout the validation program.
The ratio between model column diameter and median gravel particle size is . This relatively small ratio may promote discrete-particle effects, including localized force chaining, packing variability, and enhanced dilatancy within the columns. In this study, particle size was not geometrically scaled from the prototype; doing so would have reduced the column material to sand, compromising both the mechanical response and the optical contrast required against the surrounding Coronel sand matrix. Instead, the gravel was selected to provide a distinct mechanical inclusion and high-contrast texture for DIC. Consequently, the granular-column test results are not intended to provide quantitative similitude of prototype column stiffness, dilatancy, or load-transfer mechanisms.
3.2. Model Preparation
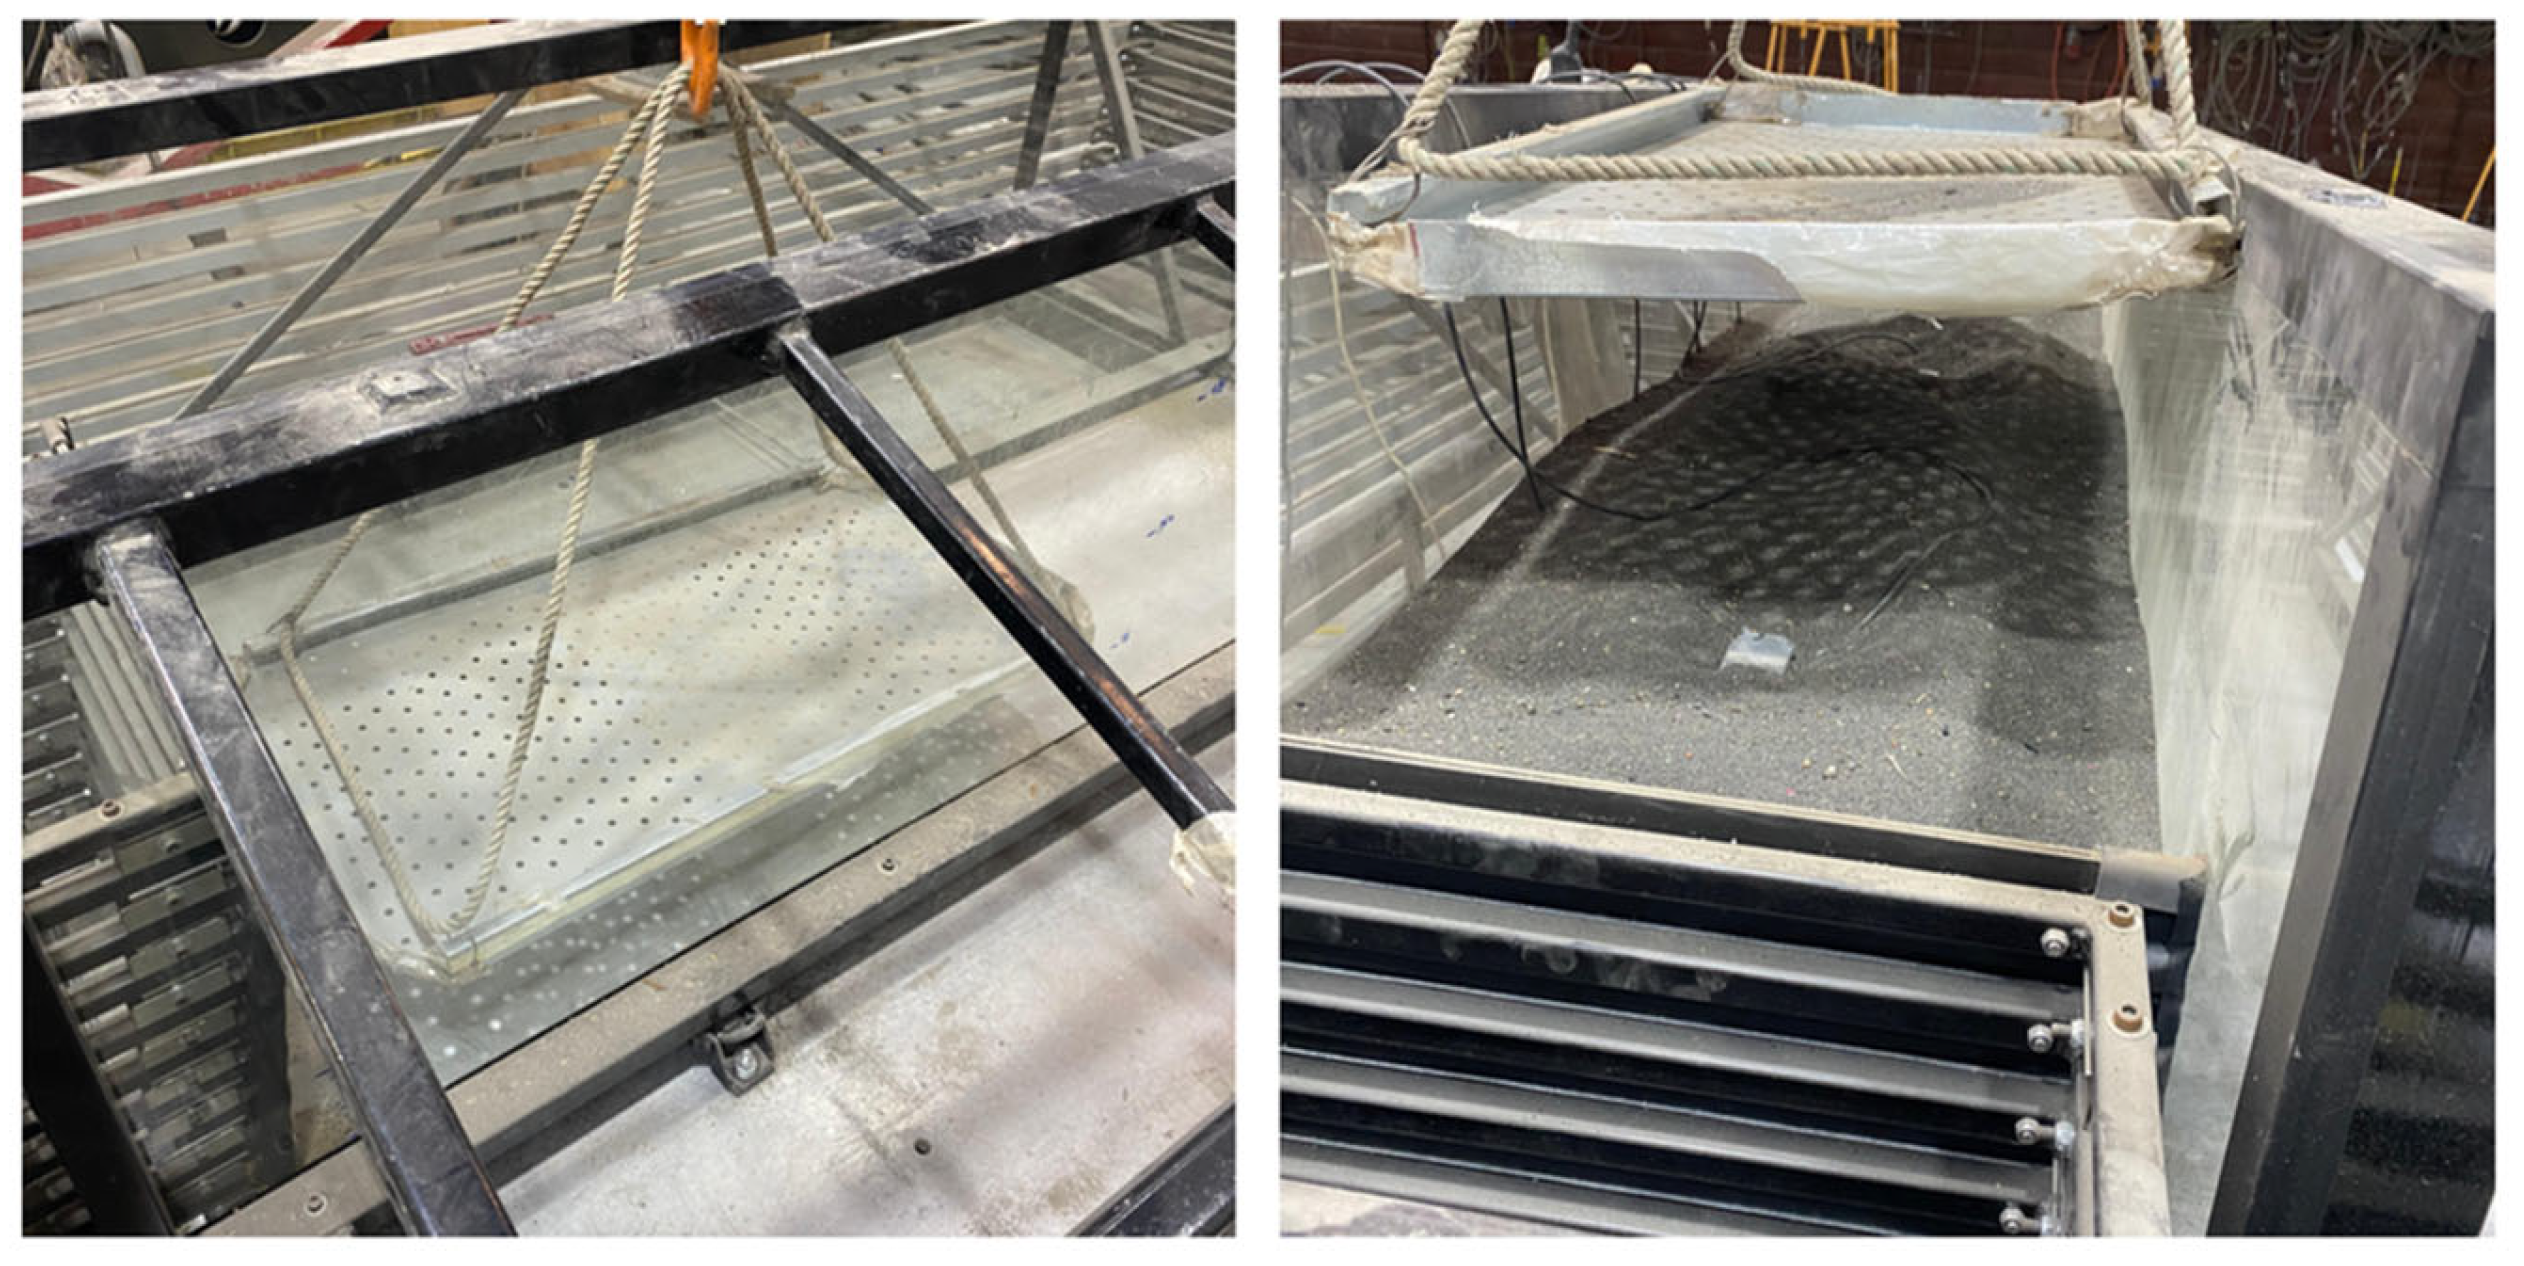
A calibrated pluviation system consisting of perforated steel plates that could be moved across the model container while maintaining a constant drop height was used to prepare the sand layers at their target relative densities (Figure 11). Prior to the experimental program, trial pluviation tests were performed using different drop heights, first in smaller calibration containers and subsequently in the laminar box. For each trial, the dry density was determined from the known mass of deposited sand and the corresponding volume, and the relative density was calculated using the previously determined maximum and minimum dry densities. The drop heights producing the target relative densities were thereby established and subsequently maintained during preparation of the experimental models.
Figure 11.
Pluviation system used to prepare the sand deposits at the target relative densities.
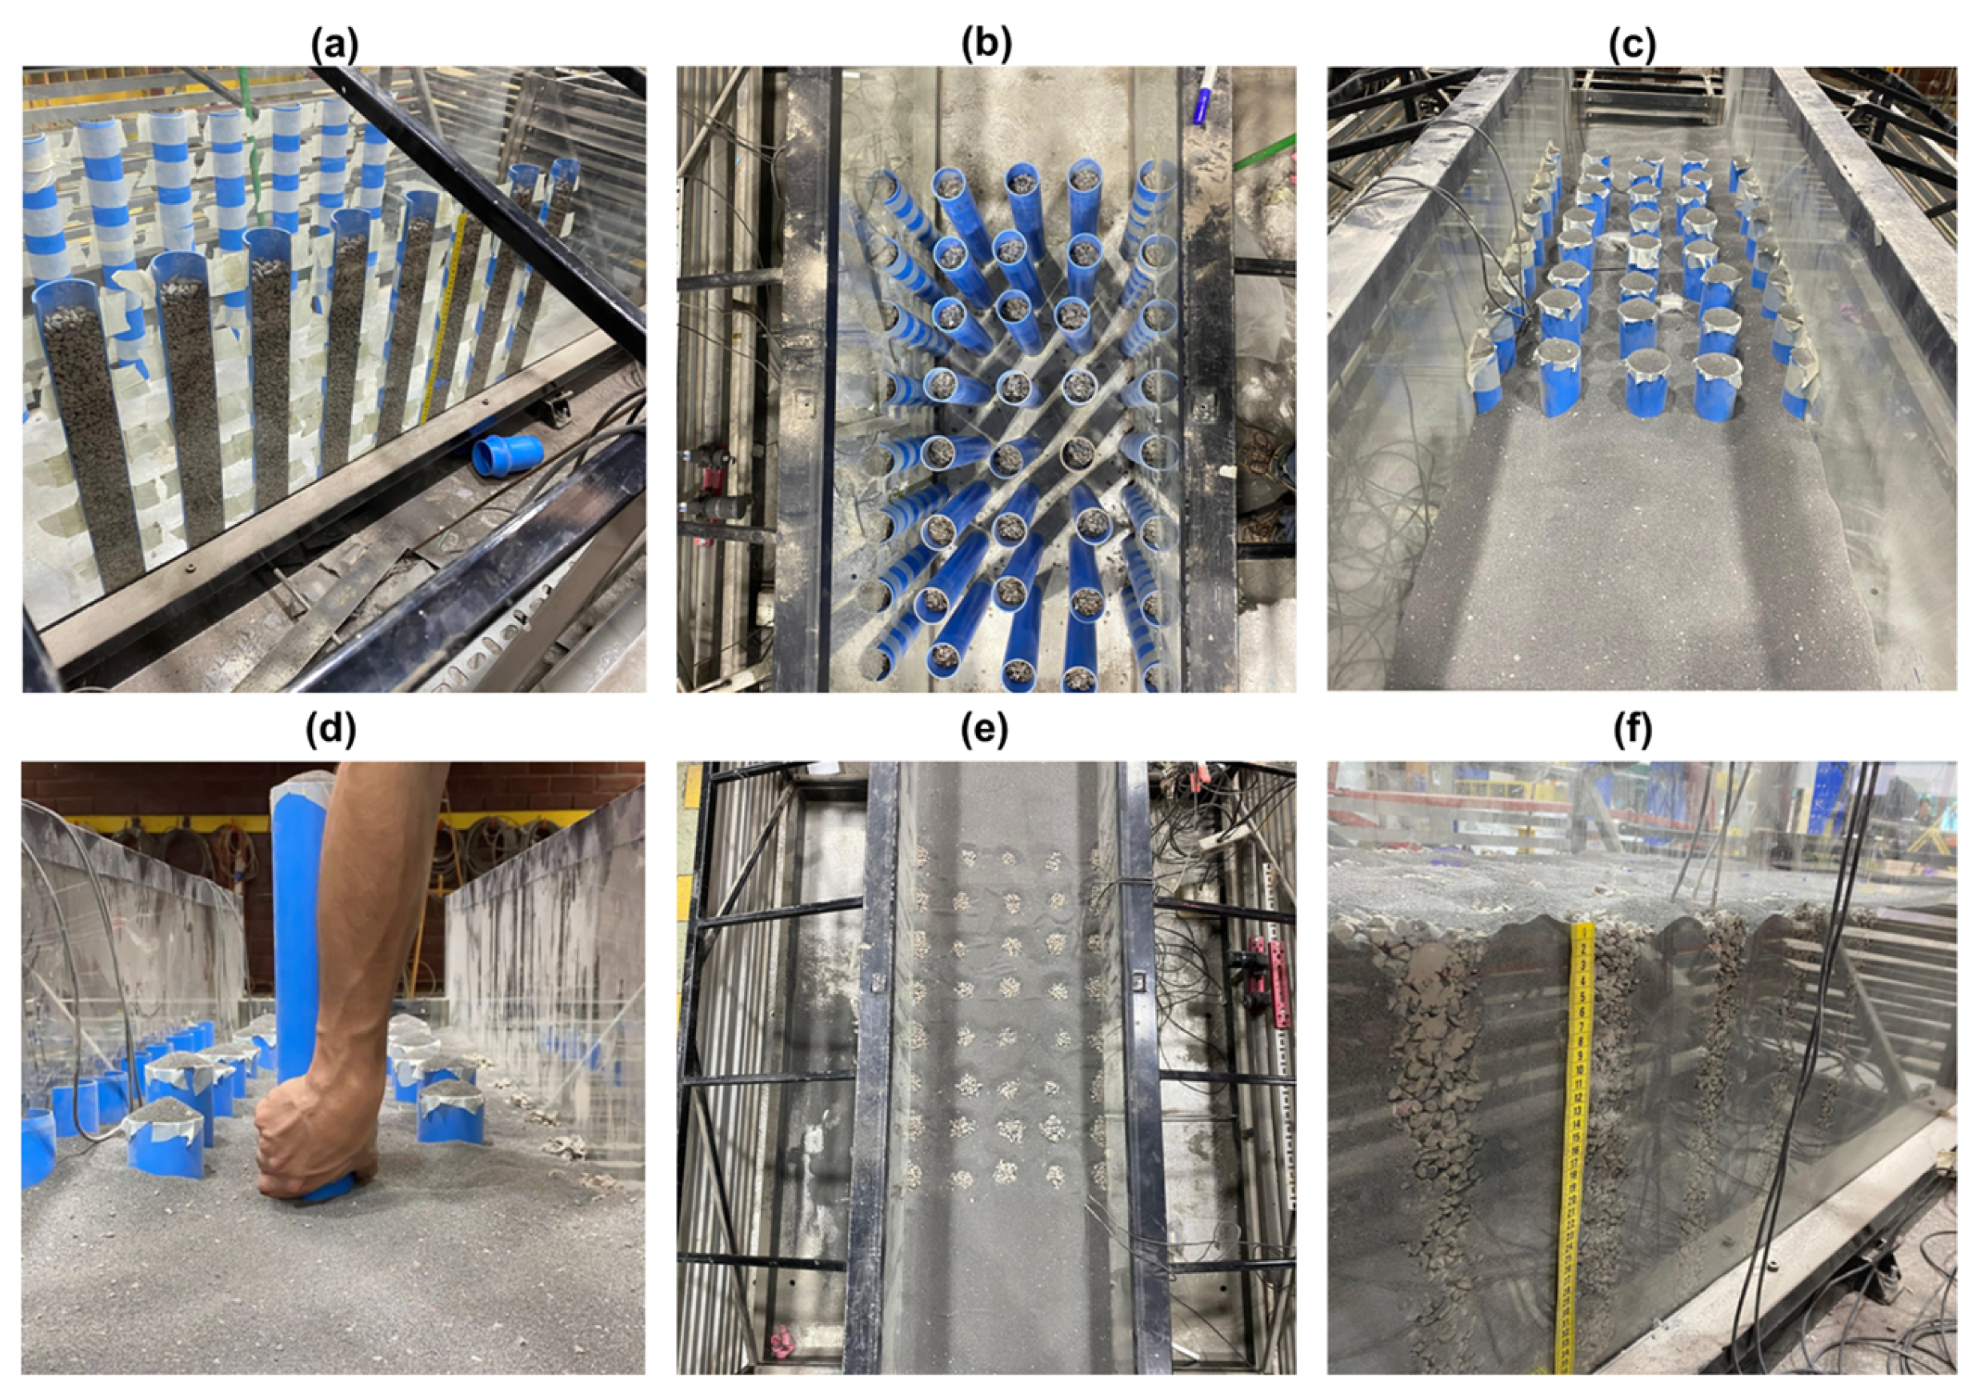
To provide a representative proof-of-concept ground-improvement setup, test configuration (iii) incorporated a grid of dense granular columns with an value of 20%. Following the relationship , a rectangular column pattern () was adopted. The columns were 0.063 m in diameter and 0.45 m in length, with a center-to-center spacing of 0.125 m. In prototype scale, this arrangement corresponds to columns 1.0 m in diameter and 7.2 m in length spaced uniformly at 2.0 m, representative of field applications [25]. The columns were constructed using relatively uniform fine gravel classified as GP according to the USCS (). This material is consistent with the particle-size ranges previously adopted in reduced-scale physical models incorporating granular inclusions [26,27]. The columns were constructed using removable polyvinyl chloride (PVC) casings with the target internal diameter. The casings were filled with compacted gravel in 0.05 m-thick lifts and carefully removed after model preparation to minimize disturbance and pre-shearing of the surrounding sand (Figure 12).
Figure 12.
Granular-column model preparation: (a) assembly and filling of lateral columns; (b) assembly and filling of central columns; (c) deposition of loose sand; (d) removal of PVC casings; (e) final model configuration in plan view; and (f) final model configuration in lateral view.
3.3. Acceleration Amplification Patterns
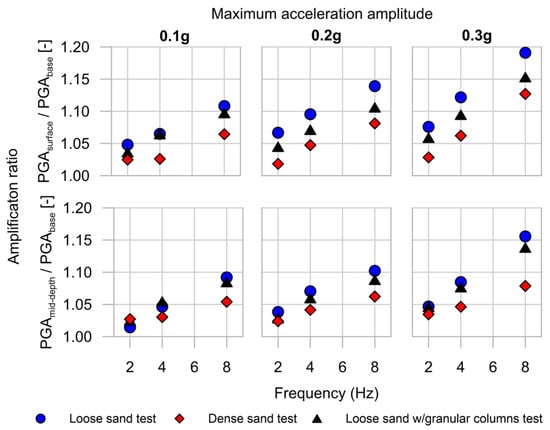
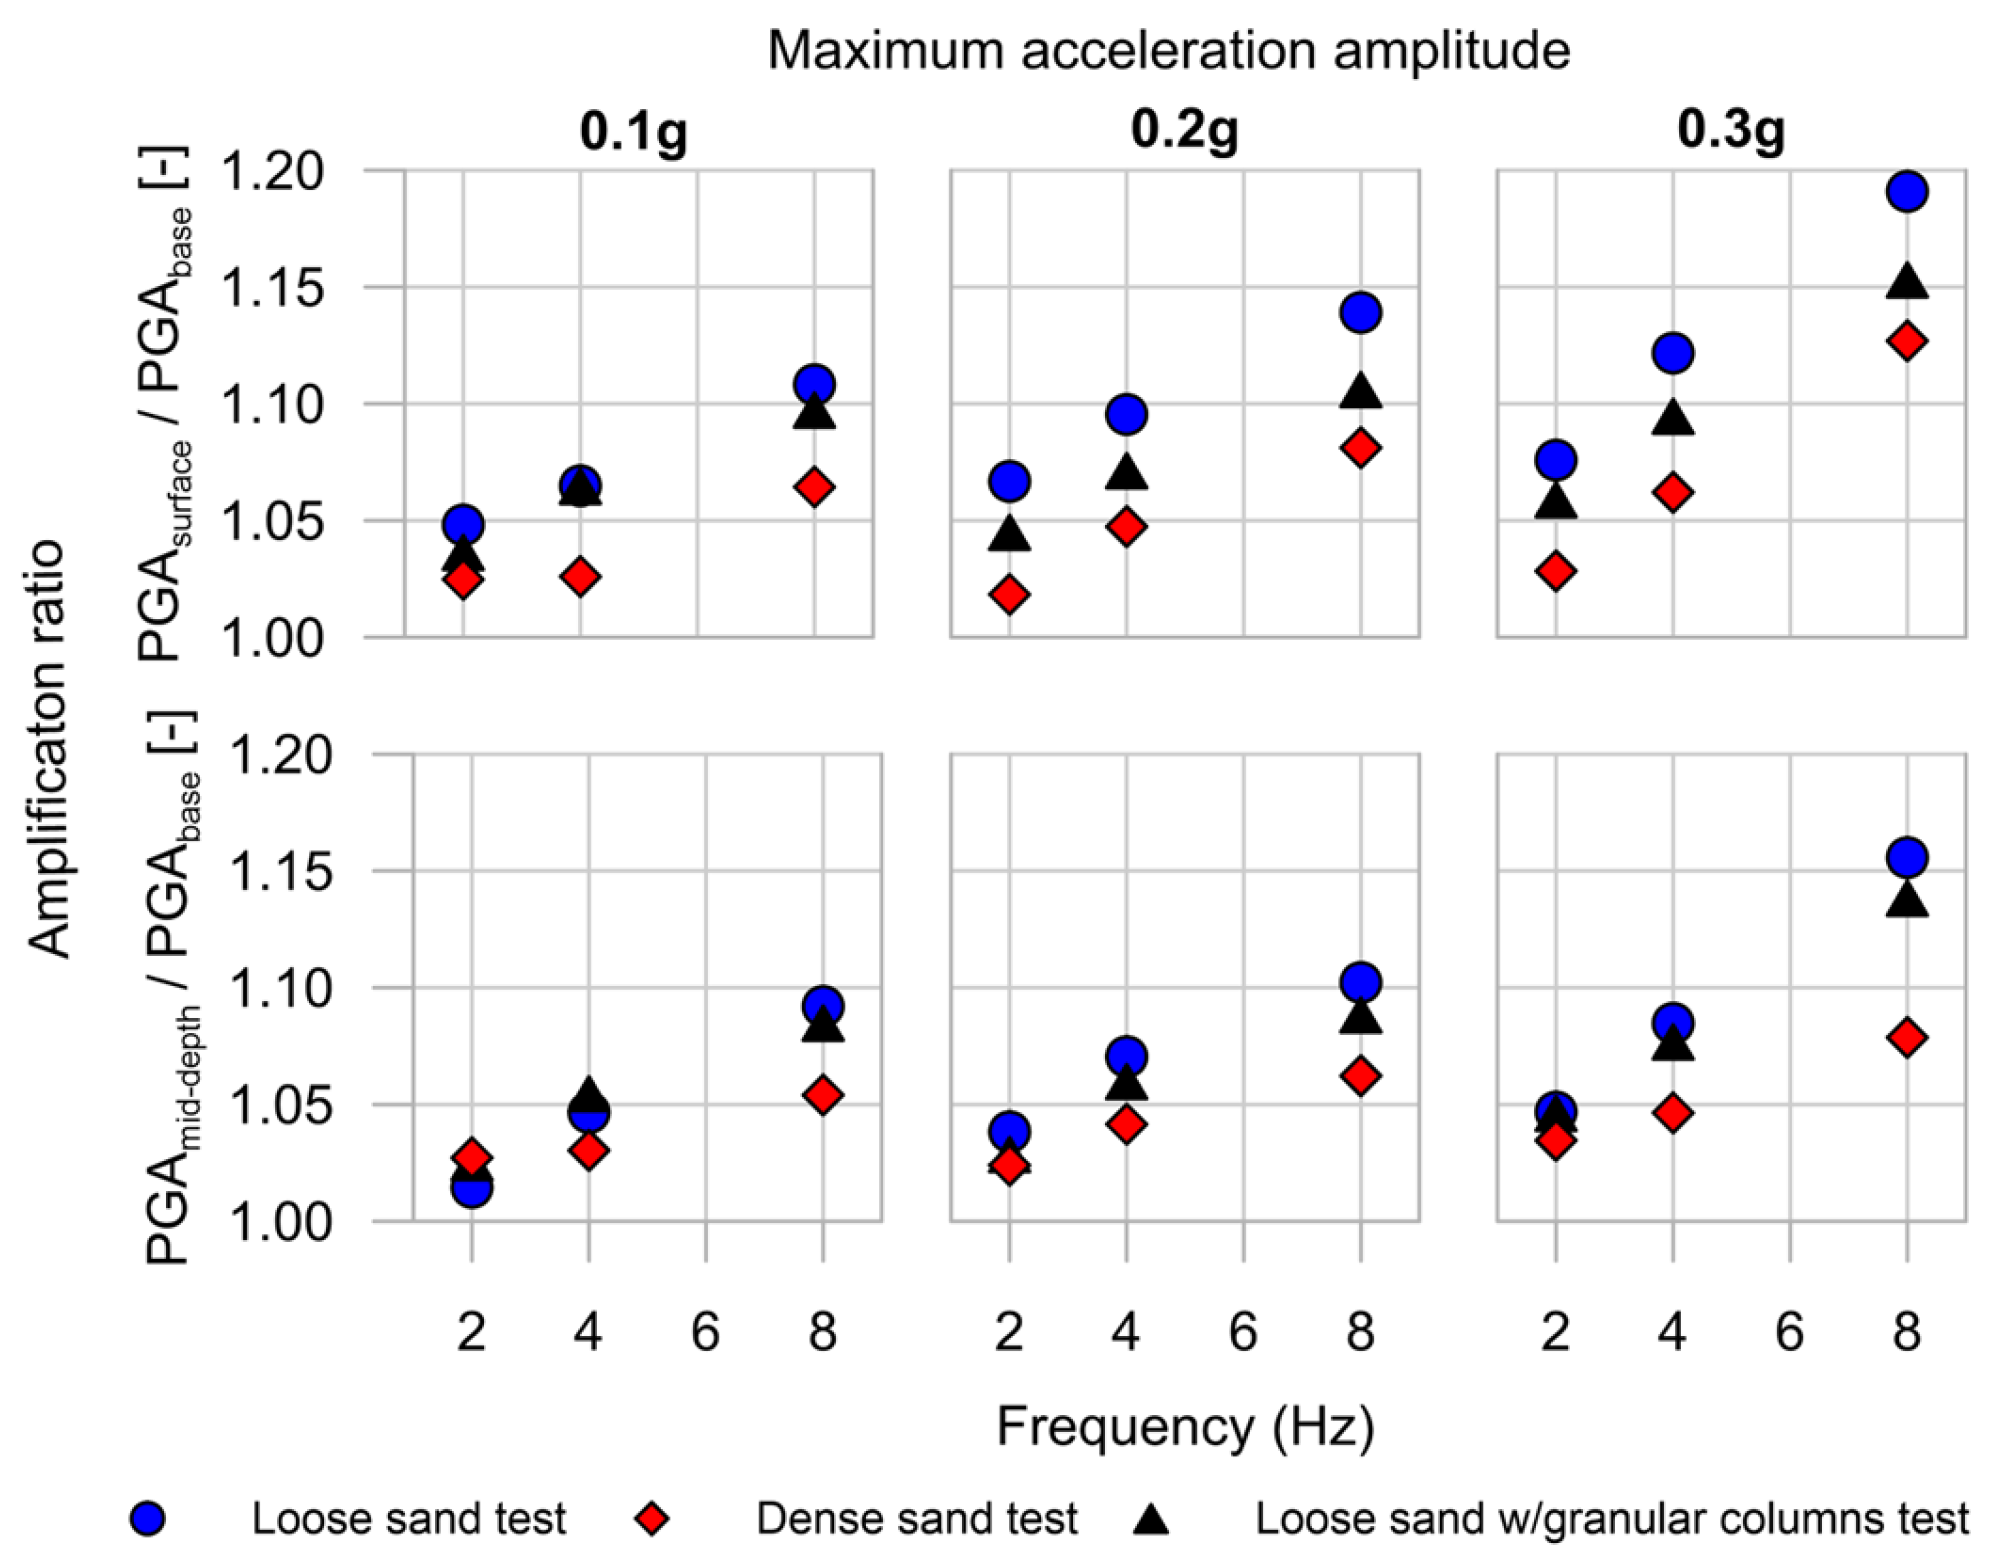
Dynamic soil amplification was assessed by computing peak acceleration ratios at two locations within the deposit: mid-depth and ground surface. Acceleration amplification was calculated as the ratio between the peak acceleration measured at the considered location and the peak acceleration of the input base motion. The experimental results presented in Figure 13 show that amplification within the soil profile is consistently greater at the ground surface than at mid-depth for all configurations analyzed. This response confirms that the experimental system adequately reproduces the expected transmission and progressive amplification of dynamic motion through the soil deposit as the effective confining stress decreases toward the surface.
Figure 13.
Acceleration amplification ratios at mid-depth and ground surface for the different ground configurations and input-motion frequencies and amplitudes.
The measured response also reproduced the expected influence of soil state and ground improvement on acceleration amplification. As anticipated, the loose sand deposit exhibited the highest amplification levels. Within the sequential loading program, higher amplification levels were generally observed during the higher-amplitude motions. For the excitation at 8 Hz and 0.3 g, peak acceleration amplification at the ground surface reached approximately 20%. In contrast, the densified deposit exhibited the lowest amplification ratios, while the granular-column-improved deposit displayed an intermediate response between the untreated loose and dense configurations.
3.4. Evaluation of Shear Strain Fields and Residual Deformations
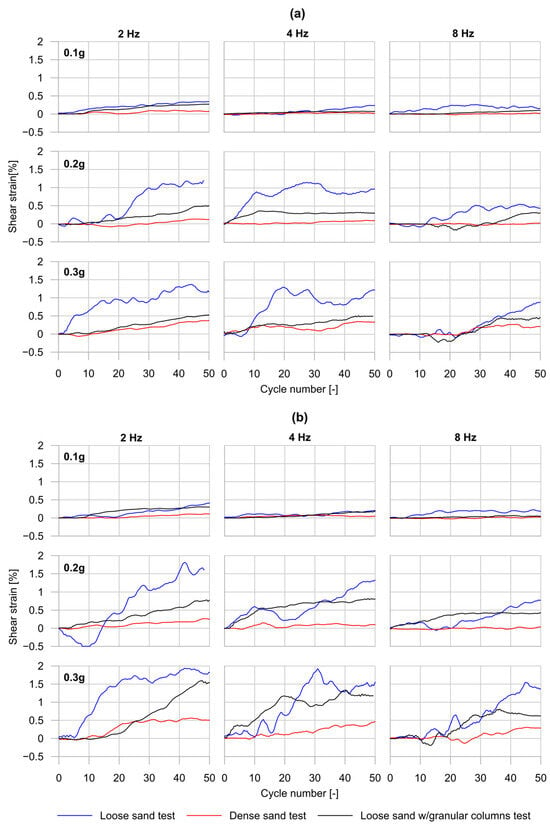
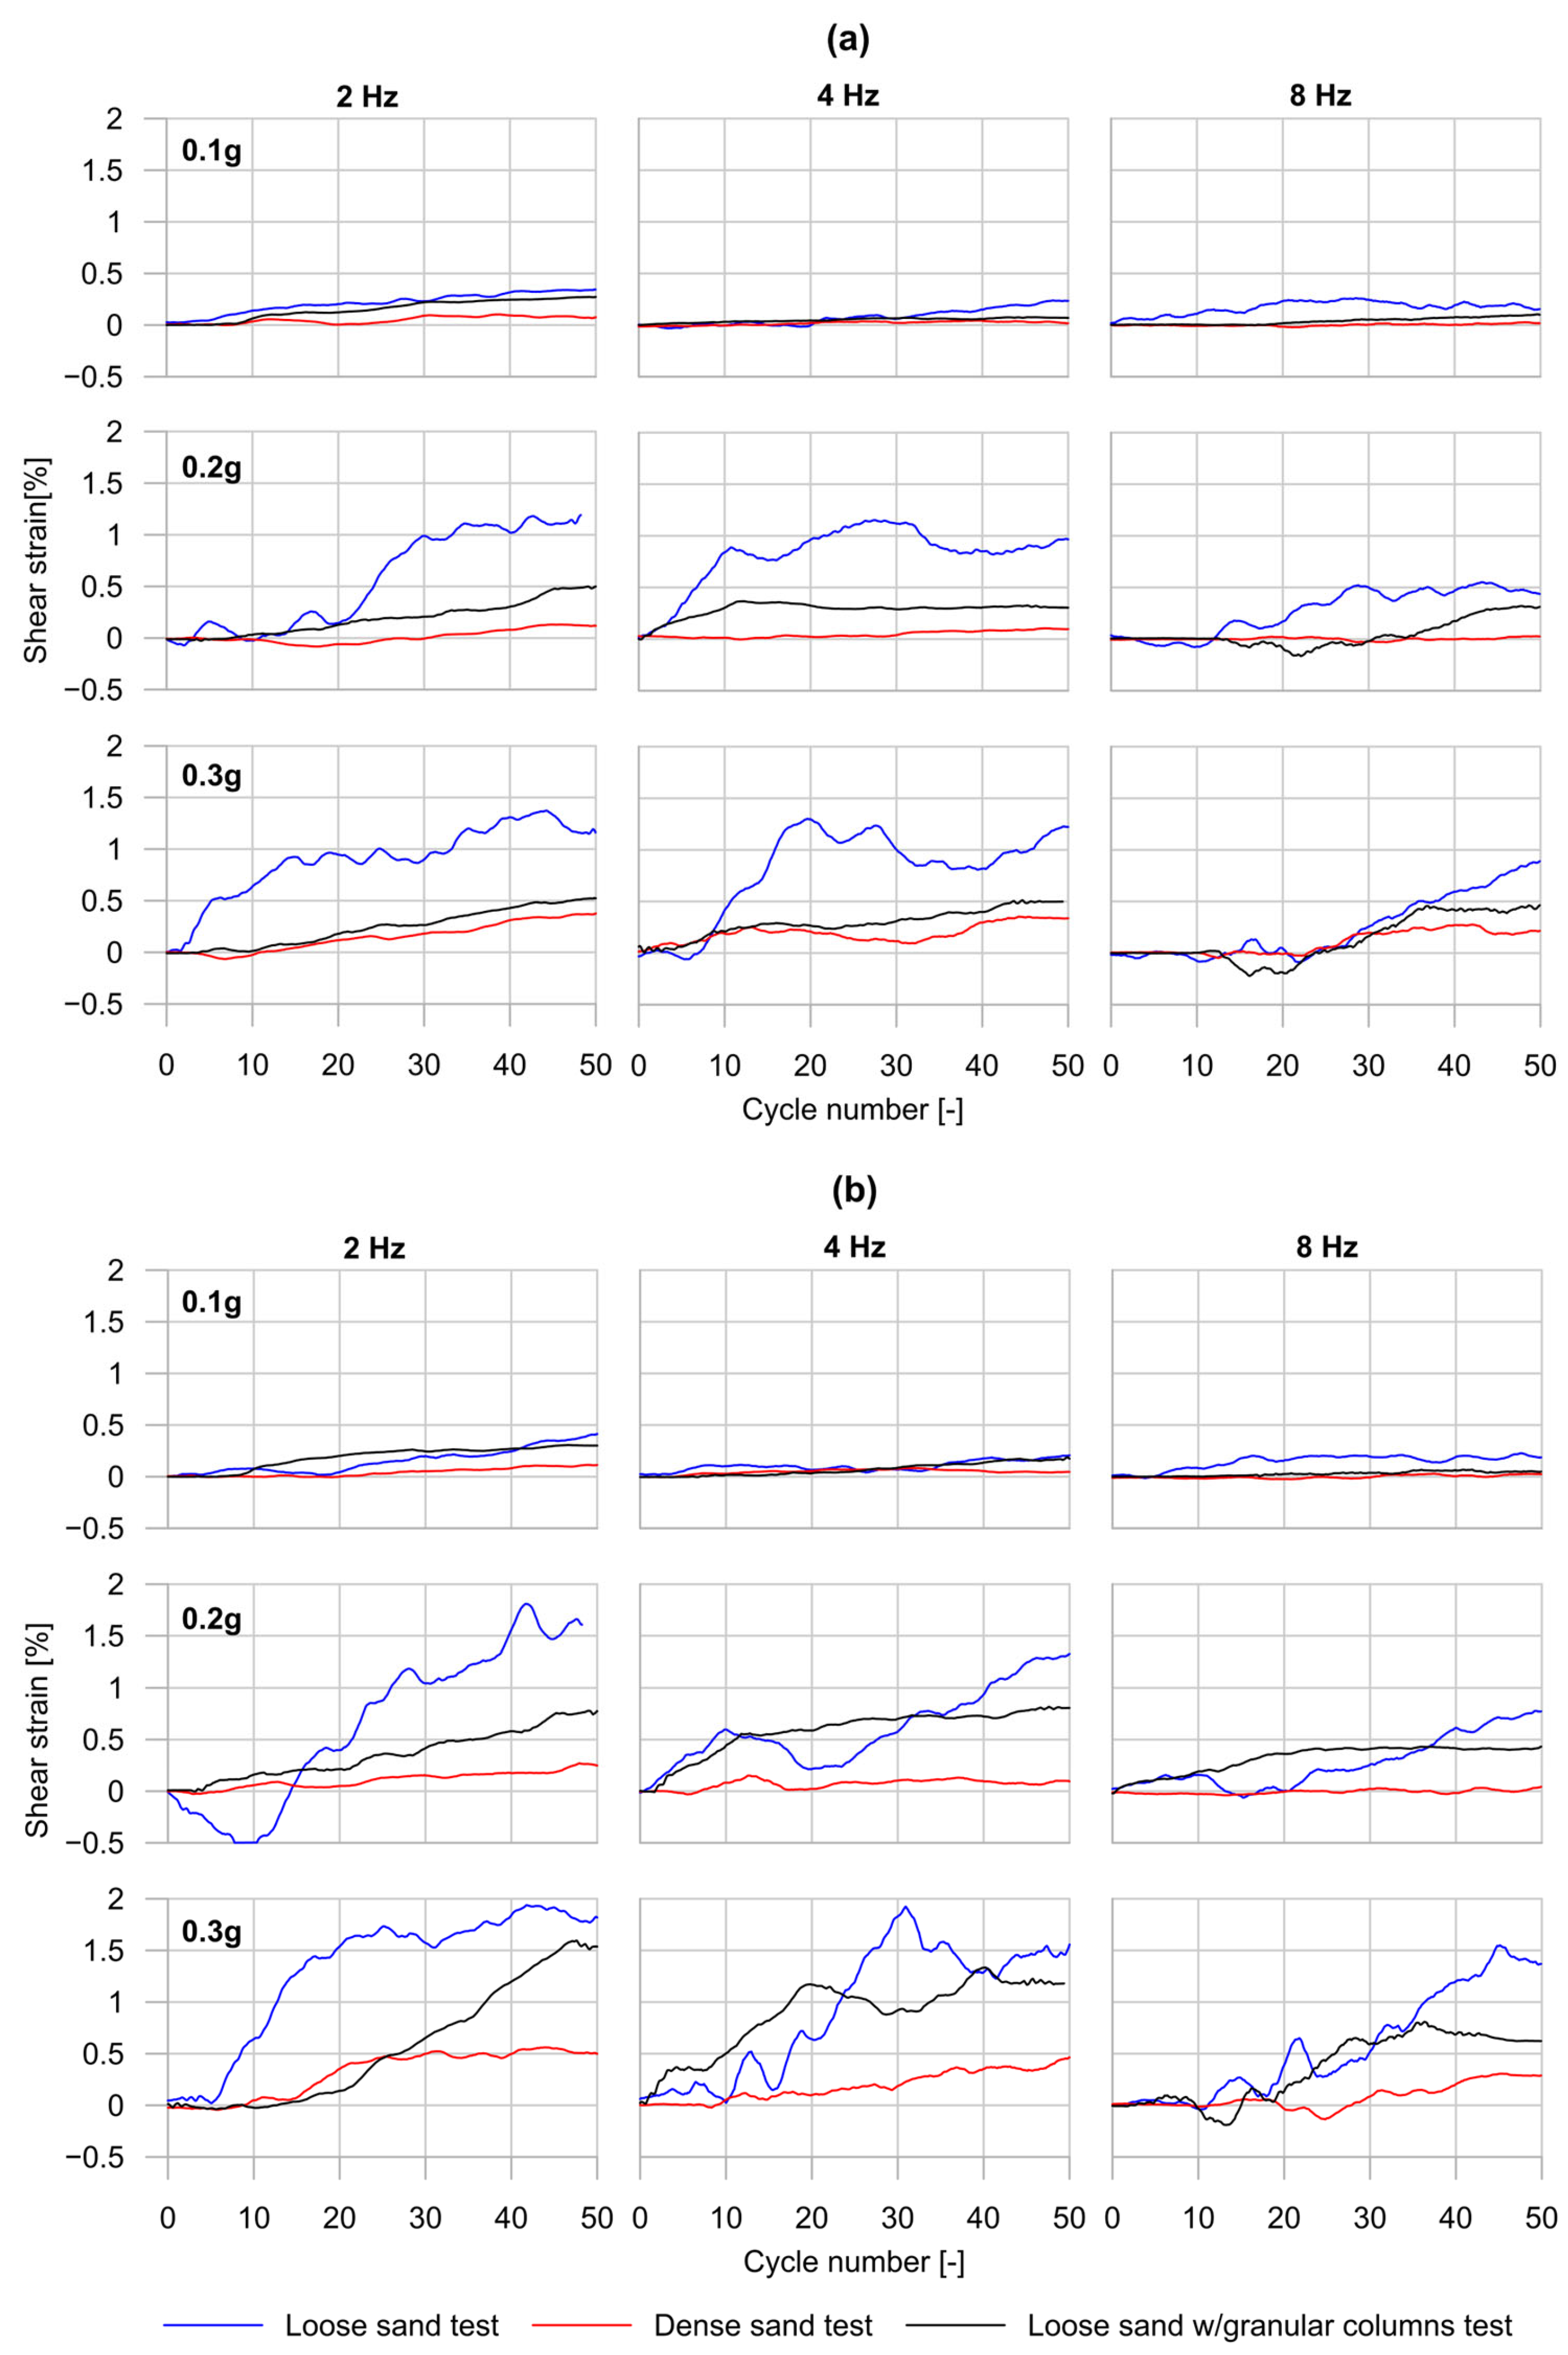
Shear strain fields obtained through DIC were evaluated at two representative depths: z = 0.50H (mid-depth) and z = 0.25H (near the ground surface). Cyclic shear strain histories acquired over 50 loading cycles consistently reproduced the expected response hierarchy (loose sand > loose sand improved with granular columns > dense sand) across all excitation frequencies and amplitudes. Since each specimen was subjected to the complete loading sequence back-to-back, the measured response reflects both the characteristics of the applied excitation and the cumulative effects associated with the loading history.
Figure 14 and Figure 15 show that the integrated measurement system successfully captured the expected differences in shear strain evolution among the three representative ground configurations. As anticipated, the loose sand model exhibited changes in shear strain consistent with rapid granular rearrangement and contraction. Conversely, both the dense sand profile and the granular-column-improved model generated smoother and more stable strain evolution. These observations agree with the expected influence of densification and granular-column improvement on cumulative deformation and demonstrate that the integrated measurement approach can resolve these mechanisms through optical measurements.
Figure 14.
Shear strain histories obtained from DIC for the different ground configurations and input-motion characteristics at: (a) z/H = 0.50 (mid-depth); and (b) z/H = 0.25 (near the ground surface).
Figure 15.
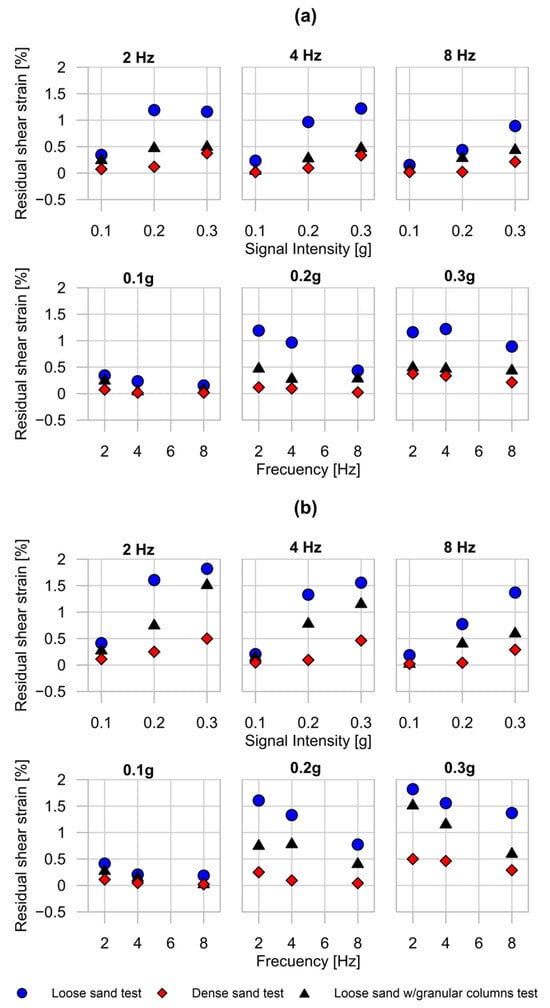
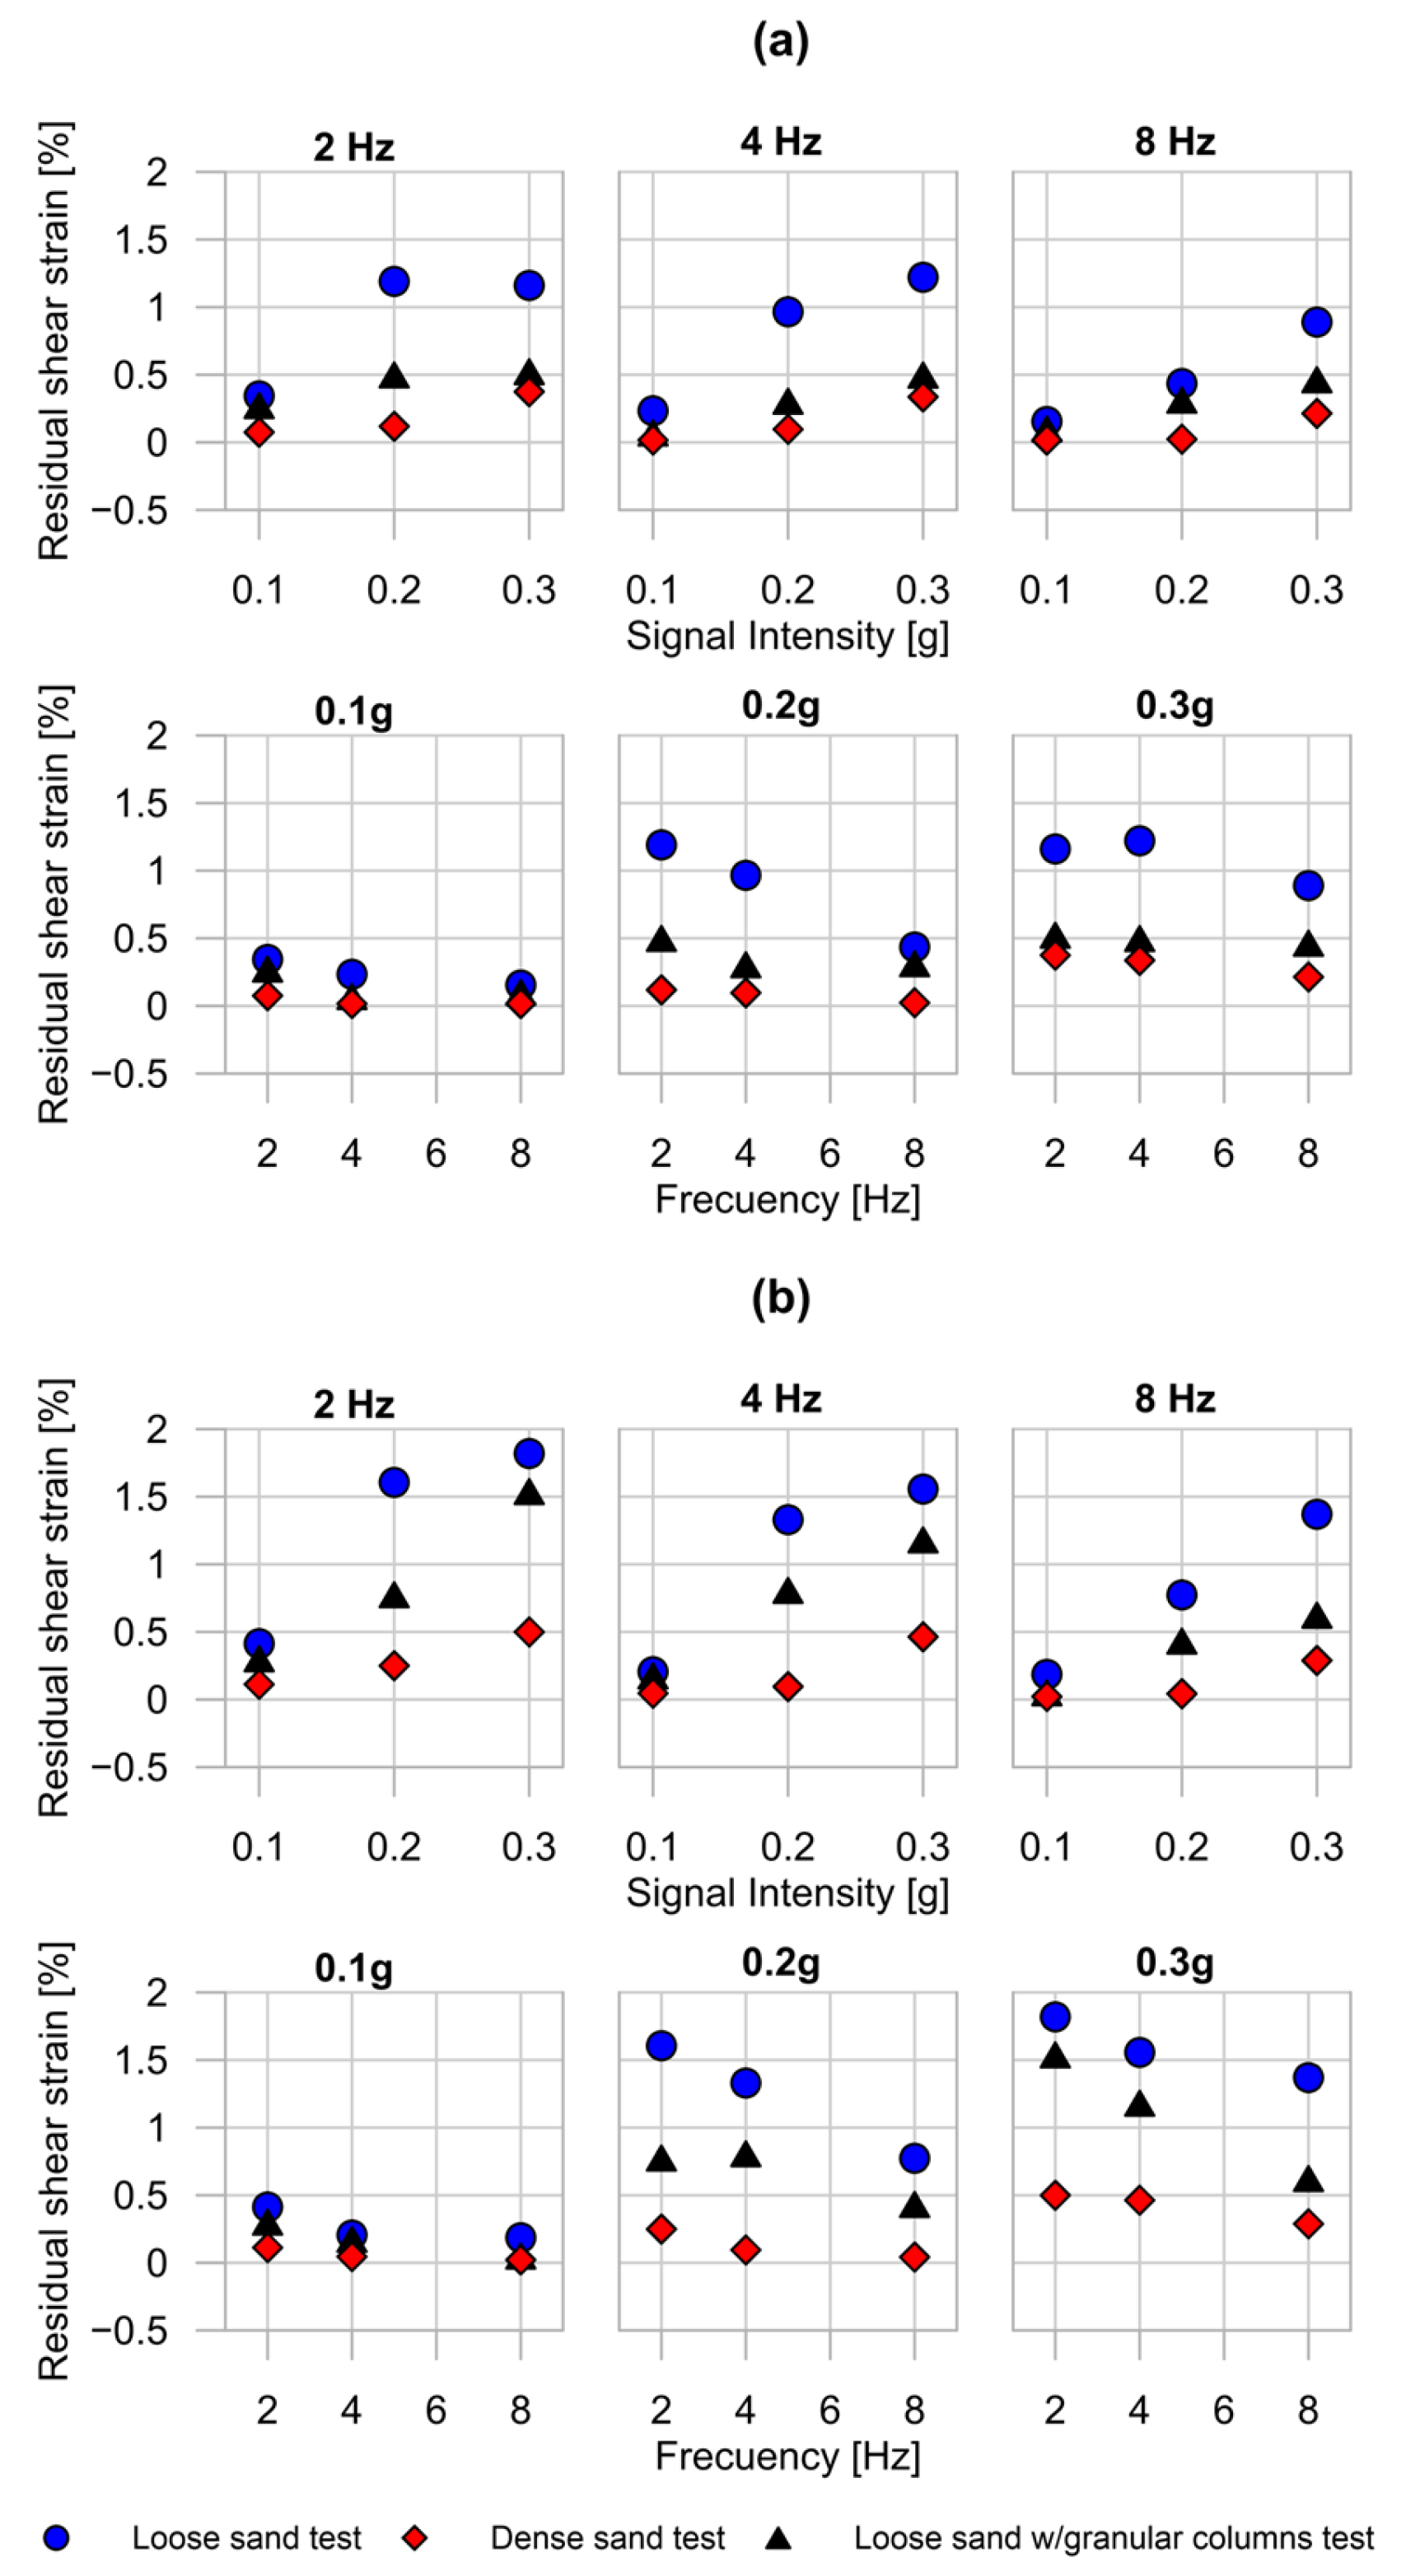
Residual shear strains obtained from DIC for the different ground configurations and input-motion characteristics at: (a) z/H = 0.50 (mid-depth); and (b) z/H = 0.25 (near the ground surface).
Residual shear strain was defined as the shear-strain value remaining at the end of the 50 loading cycles considered in each DIC record. Residual shear strain results further demonstrate the ability of the integrated measurement system to distinguish permanent deformation patterns associated with different ground conditions. Within the representative configurations evaluated, densification produced the smallest residual strains, while the granular-column-improved deposit reduced residual deformations by more than 50% relative to the untreated loose sand. This behavior is consistent with the expected shear-reinforcement mechanism, whereby the stiffer granular columns attract a larger proportion of the cyclic shear stress demand from the surrounding loose sand matrix [7,25]. Note, however, that given the particle-size scaling and the absence of direct stress measurements within the columns, these results should not be directly interpreted as a quantitative assessment of prototype column load-transfer mechanisms.
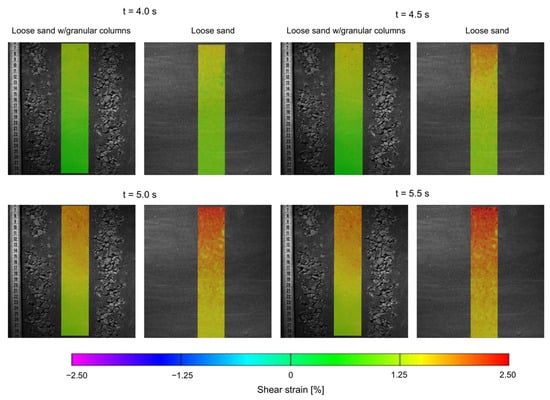
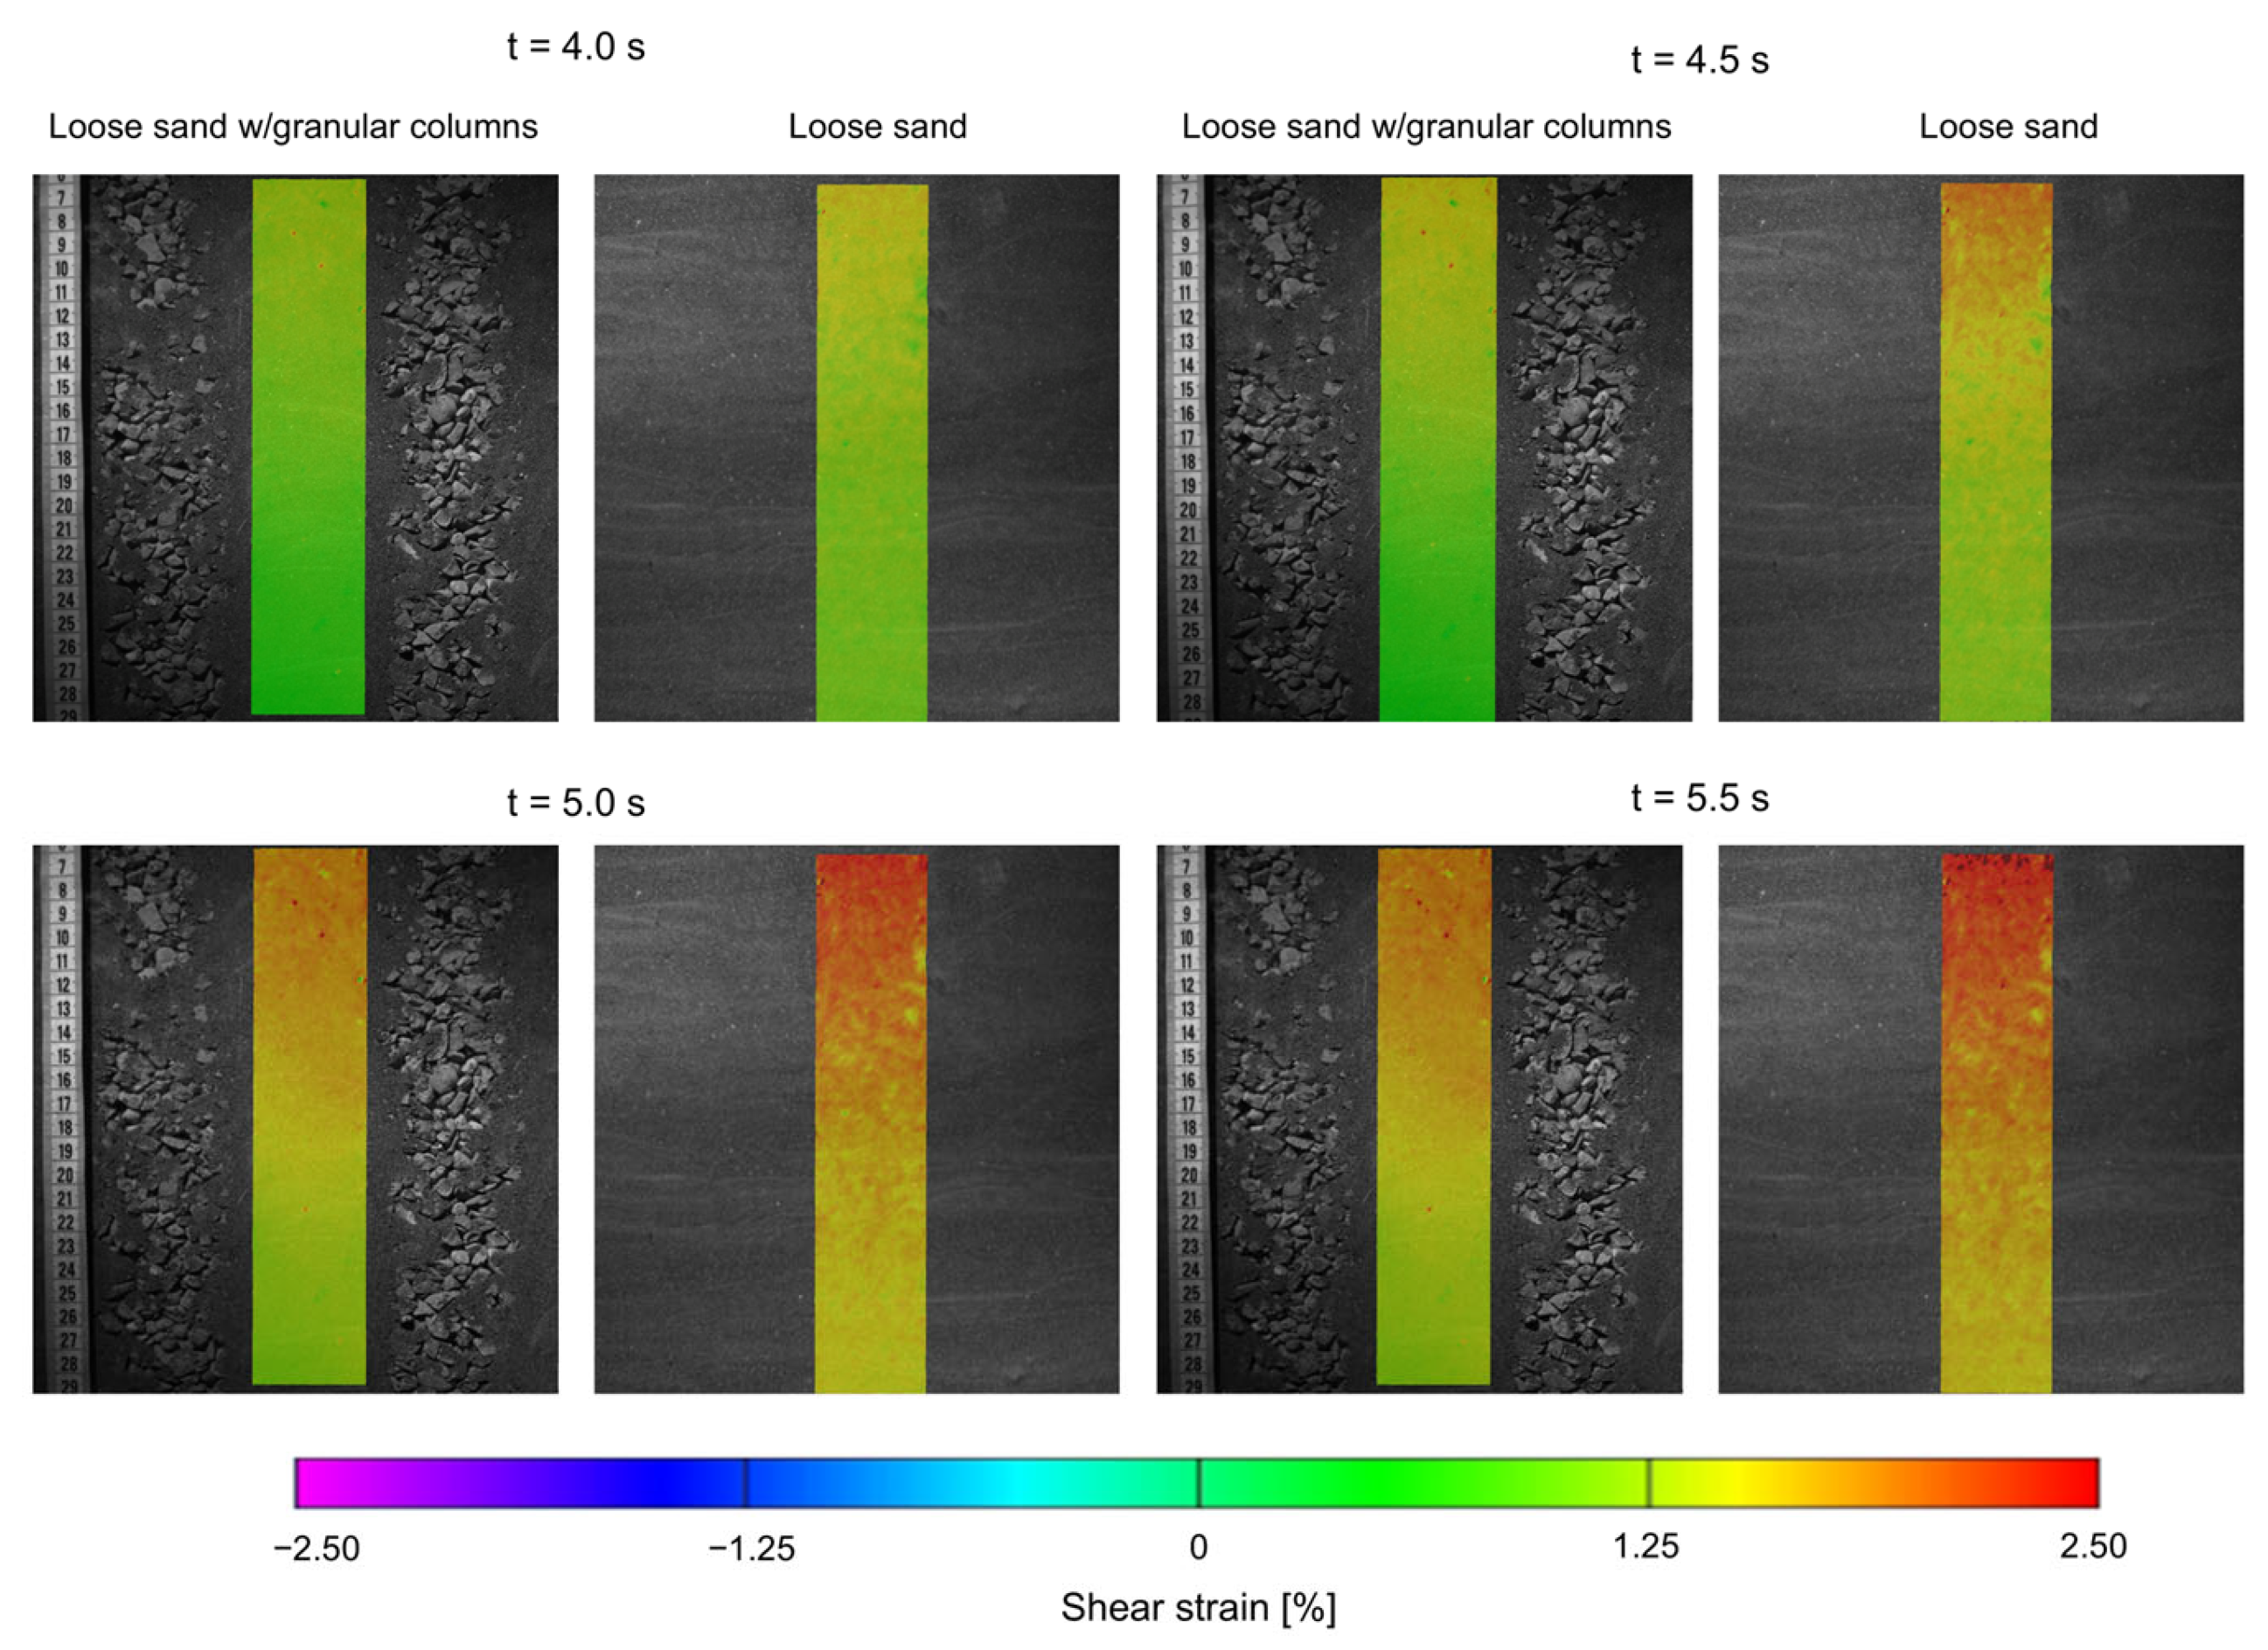
The spatial information provided by DIC also allows the deformation patterns of the untreated and improved deposits to be compared directly. Figure 16 presents representative shear-strain fields for the loose sand and granular-column-improved configurations under the same excitation condition and at equivalent instants during loading. Compared with the untreated loose sand, the improved configuration exhibits lower and less spatially extensive shear strains within the observed soil region, consistent with the reduced strain levels identified from the corresponding strain histories and residual-strain measurements. These results illustrate the capability of the DIC measurements to resolve spatial differences in deformation associated with the presence of the granular columns. However, because DIC provides kinematic information within the two-dimensional observation plane rather than direct measurements of stress transfer, these fields should not be interpreted as a quantitative assessment of load transfer between the columns and surrounding sand.
Figure 16.
Comparison of DIC-derived shear-strain fields for the granular-column-improved and untreated loose sand configurations at representative instants during the 0.2 g–4 Hz excitation.
4. Conclusions
This study presented the development, calibration, and experimental validation of a transparent laminar shear box for 1-g reduced-scale dynamic physical modeling. By integrating conventional geotechnical instrumentation with optical measurements through DIC, the proposed system provides a versatile experimental platform for investigating dynamic soil behavior under controlled laboratory conditions. Representative shaking table tests performed on loose sand, dense sand, and granular-column-improved sand were used as proof-of-concept applications to validate the capabilities of the system.
The developed laminar shear box showed kinematic behavior consistent with approximate free-field conditions. The measured equivalent inter-laminar resistance coefficient and the comparison of acceleration responses at different locations indicate that lateral boundary interference remained limited at the instrumented locations and under the excitation conditions investigated.
The integration of transparent sidewalls, conventional instrumentation, and DIC provides complementary measurements of soil response. While embedded sensors quantify the dynamic response at discrete locations, DIC enables continuous measurements of displacement and shear strain within the two-dimensional observation plane adjacent to the transparent sidewall, without interfering with the soil deposit. Although the temporal sampling resolution may limit the characterization of individual loading cycles, particularly at higher frequencies, the DIC measurements provide valuable information on spatial deformation patterns and accumulated strains.
The experiments reproduced the expected dynamic response hierarchy among the three ground configurations analyzed: loose sand > granular-column-improved sand > dense sand in terms of acceleration amplification and accumulated shear strain. These results demonstrate the ability of the proposed system to distinguish the response of different ground conditions under dynamic loading.
The integrated measurement approach also provided insight into the evolution of deformation mechanisms within the observed plane. It captured the progressive accumulation of shear strain in loose sand, the more stable response of the dense deposit, and the deformation patterns in soil associated with the presence of granular columns, illustrating the additional information that can be obtained beyond conventional point measurements.
Overall, the proposed system constitutes a useful experimental platform for future reduced-scale investigations of dynamic soil behavior. Its watertight characteristics, along with the ability to combine conventional instrumentation with synchronized optical deformation measurements, make it suitable for a broad range of applications, including soil–structure interaction, liquefaction, ground-improvement techniques, and other geotechnical problems involving complex deformation mechanisms under seismic loading. The watertight performance of the sealing system was verified through water-retention tests during commissioning of the device. However, its performance in dynamic tests involving saturated soils, including liquefaction experiments, remains to be investigated in future applications.
Author Contributions
Conceptualization, M.A., J.C.T. and E.S.; methodology, M.A. and J.C.T.; software, E.S.; validation, M.A., J.C.T. and E.S.; formal analysis, M.A., J.C.T. and E.S.; investigation, M.A.; resources, J.C.T. and E.S.; data curation, M.A.; writing—original draft preparation, M.A. and J.C.T.; writing—review and editing, M.A., J.C.T. and E.S.; visualization, M.A.; supervision, J.C.T.; project administration, J.C.T.; funding acquisition, J.C.T. All authors have read and agreed to the published version of the manuscript.
Funding
This research was funded by the Agencia Nacional de Investigación y Desarrollo (ANID) Fondecyt de Iniciación, grant No. 11231002.
Institutional Review Board Statement
Not applicable.
Informed Consent Statement
Not applicable.
Data Availability Statement
The original contributions presented in this study are included in the article. Further inquiries can be directed to the corresponding author.
Conflicts of Interest
The authors declare no conflicts of interest.
References
- Mijic, Z.; Bray, J.D. Insights from liquefaction ejecta case histories for the 2010–2011 Canterbury earthquakes. Soil Dyn. Earthq. Eng. 2024, 176, 108267. [Google Scholar] [CrossRef] [Scilit]
- Bhattacharya, S.; Hyodo, M.; Goda, K.; Tazoh, T.; Taylor, C.A. Liquefaction of soil in the Tokyo Bay area from the 2011 Tohoku (Japan) earthquake. Soil Dyn. Earthq. Eng. 2011, 31, 1618–1628. [Google Scholar] [CrossRef] [Scilit]
- Verdugo, R.; González, J. Liquefaction-induced ground damages during the 2010 Chile earthquake. Soil Dyn. Earthq. Eng. 2015, 79, 280–295. [Google Scholar] [CrossRef] [Scilit]
- De la Maza, G.; Williams, N.; Sáez, E.; Rollins, K.; Ledezma, C. Liquefaction-induced lateral spread in Lo Rojas, Coronel, Chile: Field study and numerical modeling. Earthq. Spectra 2017, 33, 219–240. [Google Scholar] [CrossRef] [Scilit]
- Adalier, K.; Elgamal, A. Mitigation of liquefaction and associated ground deformations by stone columns. Eng. Geol. 2004, 72, 275–291. [Google Scholar] [CrossRef] [Scilit]
- Bayati, H.; Bagheripour, M.H. Shaking table study on liquefaction behaviour of different saturated sands reinforced by stone columns. Mar. Georesour. Geotechnol. 2019, 37, 801–815. [Google Scholar] [CrossRef] [Scilit]
- Tiznado, J.C.; Dashti, S.; Ledezma, C.; Wham, B.P.; Badanagki, M. Performance of embankments on liquefiable soils improved with dense granular columns: Observations from case histories and centrifuge experiments. J. Geotech. Geoenviron. Eng. 2020, 146, 04020073. [Google Scholar] [CrossRef] [Scilit]
- Iai, S. Similitude for shaking table tests on soil-structure-fluid systems in 1-g gravitational field. Soils Found. 1989, 29, 105–118. [Google Scholar] [CrossRef] [Scilit]
- Turan, A.; Hinchberger, S.D.; El Naggar, H. Design and commissioning of a laminar soil container for use on small shaking tables. Soil Dyn. Earthq. Eng. 2009, 29, 404–414. [Google Scholar] [CrossRef] [Scilit]
- Ecemis, N. Simulation of seismic liquefaction: 1-g model testing system and shaking table tests. Eur. J. Environ. Civ. Eng. 2013, 17, 899–919. [Google Scholar] [CrossRef] [Scilit]
- Tsai, C.C.; Lin, W.C.; Chiou, J.S. Identification of dynamic soil properties through shaking table tests on a large saturated sand specimen in a laminar shear box. Soil Dyn. Earthq. Eng. 2016, 83, 59–68. [Google Scholar] [CrossRef] [Scilit]
- Kim, H.; Kim, D.; Lee, Y.; Kim, H. Effect of soil box boundary conditions on dynamic behavior of model soil in 1-g shaking table test. Appl. Sci. 2020, 10, 4642. [Google Scholar] [CrossRef] [Scilit]
- Li, Y.; Zheng, S.; Luo, W.; Cui, J.; Chen, Q. Design and performance of a laminar shear container for shaking table tests. Soil Dyn. Earthq. Eng. 2020, 135, 106157. [Google Scholar] [CrossRef] [Scilit]
- Fan, Z.; Yuan, Y.; Cudmani, R.; Deng, J.; Chrisopoulos, S.; Vogt, S.; Niebler, M. Large biaxial laminar shear box for 1-g shaking table tests on saturated sand. Soil Dyn. Earthq. Eng. 2024, 183, 108756. [Google Scholar] [CrossRef] [Scilit]
- Di Filippo, G.; Casablanca, O.; Biondi, G.; Cascone, E. Calibration of a large shaking table equipment for testing geotechnical physical models under plane strain conditions. Soil Dyn. Earthq. Eng. 2023, 166, 107726. [Google Scholar] [CrossRef] [Scilit]
- Zheng, S.; Li, W.-H.; Cui, J.; Li, Y.-D. Development and performance test of a stiffness-variable multidirectional laminar shear model container. Rock Soil Mech. 2022, 43, 616–625. [Google Scholar] [CrossRef]
- Chen, G.; Wang, Z.; Zuo, X.; Du, X.; Han, X.-J. Development of laminar shear soil container for shaking table test. Chin. J. Geotech. Eng. 2010, 32, 89–97. [Google Scholar]
- Sadek, S.; Iskander, M.G.; Liu, J. Accuracy of digital image correlation for measuring deformations in transparent media. J. Comput. Civ. Eng. 2003, 17, 88–96. [Google Scholar] [CrossRef] [Scilit]
- Alshibli, K.A.; Sture, S. Sand shear band thickness measurements by digital imaging techniques. J. Comput. Civ. Eng. 1999, 13, 103–109. [Google Scholar] [CrossRef] [Scilit]
- Take, W.A. Thirty-Sixth Canadian Geotechnical Colloquium: Advances in visualization of geotechnical processes through digital image correlation. Can. Geotech. J. 2015, 52, 1199–1220. [Google Scholar] [CrossRef] [Scilit]
- Segaline, H.; Sáez, E.; Ubilla, J. Continuous characterization of dynamic soil behavior by Digital Image Correlation in a transparent shear laminar box. Acta Geotech. 2022, 17, 2395–2414. [Google Scholar] [CrossRef] [Scilit]
- Jafarzadeh, B. Design and evaluation concepts of laminar shear box for 1g shaking table tests. In Proceedings of the 13th World Conference on Earthquake Engineering, Vancouver, BC, Canada, 1–6 August 2004; p. 1391. [Google Scholar]
- Ledezma, C.; Tiznado, J.C. Liquefaction effects on the Northern Coronel Pier during the 2010 Maule Chile earthquake. In Proceedings of the 16th World Conference on Earthquake Engineering, Santiago, Chile, 9–13 January 2017; p. 2200. [Google Scholar]
- Seed, H.B.; Idriss, I.M. Soil Moduli and Damping Factors for Dynamic Response Analyses; Report No. EERC 70–10; Earthquake Engineering Research Center, University of California: Berkeley, CA, USA, 1970. [Google Scholar]
- Han, J. Principles and Practice of Ground Improvement; John Wiley & Sons, Inc.: Hoboken, NJ, USA, 2015. [Google Scholar]
- Mehrannia, N.; Kalantary, F.; Ganjian, N. Experimental study on soil improvement with stone columns and granular blankets. J. Cent. South Univ. 2018, 25, 866–878. [Google Scholar] [CrossRef] [Scilit]
- Dash, S.K.; Bora, M.C. Influence of geosynthetic encasement on the performance of stone columns floating in soft clay. Can. Geotech. J. 2013, 50, 754–765. [Google Scholar] [CrossRef] [Scilit]

Disclaimer/Publisher’s Note: The statements, opinions and data contained in all publications are solely those of the individual author(s) and contributor(s) and not of MDPI and/or the editor(s). MDPI and/or the editor(s) disclaim responsibility for any injury to people or property resulting from any ideas, methods, instructions or products referred to in the content. |
© 2026 by the authors. Licensee MDPI, Basel, Switzerland. This article is an open access article distributed under the terms and conditions of the Creative Commons Attribution (CC BY) license.