


Abstract
Cooperative lane-change decisions at freeway merging areas can resolve local vehicle conflicts. A locally acceptable interaction does not necessarily ensure the maintenance and recovery of mainline traffic performance after a lane-change disturbance. Individual utility-oriented cooperation may even induce excessive yielding and amplify disturbances to upstream traffic. To address this problem, a hierarchical cooperative lane-change decision model for connected and automated vehicles (CAVs) is developed to enhance mainline traffic resilience. A coupled resilience indicator system of safety and efficiency is first established to characterize mainline performance maintenance and recovery throughout the lane-change disturbance process. The hierarchical cooperative lane-change decision model consists of a behavior-decision layer and a system-optimization layer. The behavior-decision layer develops a Stackelberg game to determine the equilibrium strategy between lane change and yielding, with resilience incorporated into the vehicle payoff. The system-optimization layer optimizes the lane-change speed and acceleration according to mainline speed fluctuations and vehicle delay. The coupled resilience of the mainline system is further used to determine the final execution parameters from the Pareto solution set. The results show that the proposed hierarchical cooperative lane-change model increases the minimum mean safety performance of the mainline system from approximately 0.66 to 0.78. System resilience varies nonmonotonically with the CAV penetration rate: the coupled resilience decreases to approximately 0.872 at a 60% penetration rate and recovers to approximately 0.887 at an 80% penetration rate. In addition, the increase in cooperation intensity from 0.3 to 0.9 improves system safety resilience by up to 2.6%. These results demonstrate the effectiveness of hierarchical coordination and reveal the influence of heterogeneous mixed traffic on mainline traffic resilience.
1. Introduction
1.1. Background
A freeway merging area is a critical section where on-ramp traffic flow merges into the mainline. Vehicles must complete acceleration, gap selection, and the lane change within limited space, which can cause speed fluctuations in mainline vehicles [1]. With the development of CAV technology, freeways will remain in a mixed-traffic state in which CAVs and human driven vehicles (HDVs) coexist for a long period. CAVs can share vehicle states and lane-change intentions, which provides the information required for cooperative lane changes. However, HDVs have uncertainties in response capability and willingness to cooperate. As a result, the lane-change process under mixed traffic exhibits heterogeneous interactions. If the response of a mainline-following vehicle does not match the traffic state, the lane-change timing or the yielding response magnitude may become inappropriate, which can amplify a local disturbance and continuously affect mainline operation [2,3]. Traditional instantaneous safety or efficiency indicators cannot adequately reflect how well mainline traffic performance is maintained under a disturbance or how the traffic state recovers afterward. Traffic resilience evaluates mainline traffic performance throughout the disturbance process [4]. It reflects the ability of the traffic flow to withstand lane-change disturbances and recover to a stable operating state. Traditional local lane-change and yielding decisions mainly focus on whether vehicles can form acceptable interaction strategies. The operational objectives of the mainline system also require the control of speed fluctuations and disturbance propagation caused by the lane-change-execution process. A single decision process cannot satisfy both requirements at the same time [5]. Therefore, it is necessary to develop a hierarchical cooperative lane-change decision method from the perspective of mainline traffic resilience. The method should coordinate local vehicle interaction outcomes with the requirements for mainline safety maintenance and efficiency recovery.
The effect of a lane-change disturbance on mainline traffic flow in a freeway merging area does not end instantaneously. It follows a continuous process of performance degradation, disturbance propagation, and state recovery. After a ramp vehicle merges into the mainline, the speed adjustment of the mainline-following vehicle will change the local following state. It may subsequently affect upstream vehicles, which can cause persistent fluctuations in the mainline traffic flow [1]. Therefore, the effect of a lane change should be evaluated over a continuous time horizon rather than from vehicle states at a single instant. Traffic resilience is suitable to assess the persistent effect of lane changes on mainline traffic flow in freeway merging areas [4]. Accordingly, a resilience characterization method for mainline traffic under lane-change disturbances can provide an evaluation basis for subsequent cooperative lane-change decisions.
Under mixed-traffic conditions with CAVs and HDVs, the lane-change process in a freeway merging area has a clear sequential decision structure. CAVs can obtain the states of surrounding vehicles in advance and communicate their lane-change intentions. The responses of HDVs are affected by driver reaction time, driving habits, and willingness to yield [6]. The lane-change intention of an on-ramp CAV can affect the judgment of the mainline-following vehicle on whether to yield, decelerate, or maintain its current state. The response of the mainline-following vehicle in turn affects target gap creation and lane change conditions. Therefore, a lane change in a freeway merging area is not an independent action completed by one vehicle. It is an interactive decision process with sequential dependence between the lane-changing vehicle and the mainline-following vehicle [7]. A Stackelberg game can describe the behavioral relationship in which one party acts as the leader and the other responds as the follower. It is suitable for the characterization of lane change interactions between CAVs and HDVs in mixed traffic.
The lane change and yielding strategy obtained from the vehicle game can reflect the local interaction outcome, but the traffic state in merging area also depends on the lane-change-execution process. An acceptable lane change scheme at the strategy level does not necessarily ensure stable execution. Excessive lane-change speed and large acceleration variations may cause new speed fluctuations. Excessive deceleration of the mainline-following vehicle may also delay the recovery of the mainline traffic flow [8]. A hierarchical cooperative lane-change decision method can coordinate vehicle interaction decisions with system-level execution optimization through two interconnected layers. The behavior-decision layer can determine the equilibrium strategy between the lane-changing vehicle and the mainline-following vehicle; the system-optimization layer can further refine the lane-change speed and lane-change acceleration. This hierarchical structure coordinates microscopic cooperative vehicle behavior with the requirements for maintenance of mainline safety and recovery of mainline efficiency.
A resilience-oriented hierarchical cooperative lane-change decision model for CAVs in freeway merging areas is developed to coordinate lane-change decisions with mainline traffic resilience objectives. The method focuses on the interaction process between the lane-changing vehicle and the mainline-following vehicle. It employs the evolution of mainline traffic performance under lane-change disturbances as the basis for resilience characterization. This structure forms a model framework that combines a behavior-decision layer with a system-optimization layer. The behavior-decision layer describes the lane change and yielding interaction between the lane-changing vehicle and the mainline-following vehicle. It can determine the corresponding strategy combination. The system-optimization layer first obtains Pareto-optimal execution parameters according to mainline speed fluctuations and vehicle delay. The coupled resilience criterion then determines the final execution scheme from the Pareto solution set. Simulation experiments validate the proposed model in terms of lane-change timing identification, changes in payoff contributions, comparisons among different cooperative optimization objectives, and sensitivity to the CAV penetration rate and cooperation intensity. These experiments can provide methodological support for cooperative lane-change control of CAVs in freeway merging areas.
1.2. Literature Review
1.2.1. Lane-Change Decisions in Freeway Merging Areas
Research on lane-change decisions in freeway merging areas mainly focuses on behavior identification, gap selection, and safety constraints during the on-ramp merging process. Because the acceleration lane has a limited length, on-ramp vehicles must complete speed adjustment and target gap assessment within a short period. The lane-changing behavior is usually affected by the lead vehicle, the following vehicle, and the end location of the acceleration lane. Early studies mainly adopted the rule models to describe the lane-change decision process. The acceptable gaps, relative speed, safe distance, and lane change incentives are used as the primary criteria [9]. These models have strong interpretability. They can clearly describe the basic safety conditions that vehicles must satisfy to complete a lane change in a freeway merging area.
With advances in vehicle trajectory data and microscopic simulation technologies, research on lane changes in freeway merging areas has gradually expanded from static rule judgments to dynamic behavior models. Related studies have used observed trajectories, naturalistic driving data, and simulation data to analyze lane-changing behavior under different traffic densities, relative speeds, and headways. These studies have further revealed the acceleration and deceleration characteristics of on-ramp vehicles and the response patterns of mainline vehicles during the merging process [10]. Some studies have applied machine learning methods to lane-change intention identification and lane-change timing prediction. Vehicle position, speed, acceleration, and adjacent vehicle states serve as features before a lane change, which improves the adaptability of the models to complex traffic states [11]. Data driven methods have been applied to identify the evolution of traffic states in freeway weaving sections under adverse weather conditions [12].
Research on lane-change decisions in freeway merging areas has also expanded from the feasibility of a single vehicle lane change to the operating state of the mainline traffic flow. After an on-ramp vehicle merges into the mainline, the car following state of following vehicle in the target lane changes and may further affect upstream vehicle operation [6]. Related studies assess the effects of lane changes in freeway merging areas through indicators such as speed fluctuations, traffic conflicts, delay changes and traffic flow stability, which provides a more systematic description of the relationship between lane-changing behavior and mainline operation [13]. An analysis from the perspective of traffic resilience places greater emphasis on the maintenance and recovery of mainline performance after a disturbance. It provides an approach to evaluate persistent system level effects of local lane-changing behavior.
1.2.2. Game Theory for CAV Lane-Change Decisions
The introduction of CAVs has shifted lane-change decisions in freeway merging areas from independent judgments by individual vehicles toward information interaction among multiple vehicles. CAVs can obtain the states of surrounding vehicles through vehicle-to-vehicle (V2V) communication and vehicle-to-infrastructure communication and can communicate lane-change intentions in advance. Vehicles can therefore establish clearer response relationships before a lane change. In mixed-traffic environments where CAVs and HDVs coexist, different vehicle types differ in information acquisition capability, control accuracy, and response behavior [14]. CAVs can execute cooperative strategies more consistently, whereas HDV responses remain affected by driver reaction time, risk perception, and willingness to yield [15]. These differences strengthen the heterogeneous interactions in the lane-change process.
Game theory has been widely applied to describe strategic interactions during vehicle lane changes. Noncooperative games have been used to characterize strategy conflicts between mandatory lane-changing vehicles and target lane vehicles in connected environments [16]. Quantal response equilibrium can further describe lane change choices under bounded rationality and uncertainty about the strategy of the other player [17]. A stochastic potential game can represent human like interactive decisions among on-ramp vehicles in mixed traffic within a decentralized framework [18]. A Stackelberg game characterizes the strategy dependence between a leader and a follower. It is therefore commonly applied to describe the sequential interaction between the lane-change decision of an on-ramp vehicle and the yielding response of a mainline vehicle [7].
The vehicle payoff function is an important component of a lane-change game model. Existing studies usually incorporate speed payoff, safety payoff, and comfort payoff into the payoff function to represent the tradeoff among travel efficiency, collision risk, and driving comfort [16]. Safety payoff can be characterized through intervehicle spacing, time to collision, or risk represented by the potential field. Comfort payoff is usually related to acceleration variation and smoothness of the lane change [19]. Under mixed-traffic conditions, the payoff function can also reflect response differences and the degree of cooperation among different vehicle types. This design allows the game model to describe not only vehicle strategy choices but also the behavioral reasons for different lane change and yielding strategy combinations.
1.2.3. Cooperative Lane-Change Control and Hierarchical Optimization Methods
Research on cooperative lane-change control for CAVs mainly examines how information sharing among vehicles can support speed coordination, gap creation, and trajectory optimization [20,21]. Existing methods include model predictive control, mixed-integer programming, heuristic optimization, and reinforcement learning [22]. Robust optimal control for mixed traffic can ensure lane change safety for CAVs under uncertain HDV behavior and reduce disturbances to surrounding traffic flow [23]. Reinforcement learning can learn cooperative merging strategies under complex traffic conditions through interactions with a simulation environment. Previous research has adopted a dual module framework that separately performs gap selection and vehicle motion control [24]. Multilane merging control under mixed traffic further incorporates mainline lane changes, on-ramp merging, and safety–efficiency coordination into a unified control process [25]. Mixed-integer nonlinear programming can jointly determine lane-change decisions, vehicle passage sequences and trajectories during multilane merging [26]. Multiagent deep reinforcement learning can generate multivehicle decision strategies for freeway merging areas through cooperative learning among vehicles. It can be extended to multilane mixed autonomy traffic control [27,28]. These approaches provide multiple methodological pathways for cooperative vehicle merging in freeway merging areas.
The actual effect of a lane change in a freeway merging area depends not only on whether vehicles establish an acceptable lane change strategy but also on speed adjustments and acceleration changes during the lane-change-execution process. Existing cooperative lane-change methods usually contain two levels: strategy decision and execution control [29]. The strategy decision layer determines whether a vehicle changes lanes, whether a mainline vehicle yields, and which vehicle receives passage priority. The execution control layer focuses on control variables such as lane-change speed, acceleration, trajectory shape, and intervehicle spacing [30]. Hierarchical optimization provides an effective framework that coordinates vehicle behavior decisions with system operational objectives. Existing studies generate cooperative decisions at the upper layer according to vehicle interactions and traffic operation requirements. The lower layer then converts these decisions into executable vehicle motion schemes [31]. Information is commonly transferred between the two layers through variables such as merging time, target gap, and vehicle state. These methods preserve the logic of vehicle interactions and improve the consistency between cooperative decisions and actual vehicle motion control [32].
1.2.4. Research Gaps
Existing studies have extensively examined lane-change decisions in freeway merging areas, cooperative interactions among CAVs, and cooperative lane-change control, but the following limitations also remain. (1) Existing studies mainly use safe distance, conflict risk, speed, and delay to assess lane change effects. These indicators describe traffic states at specific instants or stages but cannot distinguish lane-change events with similar instantaneous states but different subsequent performance degradation and recovery processes. Therefore, the complete disturbance process needs to be evaluated from the perspective of performance maintenance and recovery. (2) Current game-theoretic lane change studies mainly construct payoff functions around the safety, efficiency, and comfort of directly interacting vehicles. Such local equilibrium strategies may induce excessive yielding and do not necessarily improve mainline traffic performance under heterogeneous CAV–HDV interactions. Therefore, vehicle-level equilibrium decisions need to respond to system-level disturbance effects. (3) Most hierarchical cooperative lane-change methods usually separate strategy decisions from vehicle motion control. System-level disturbance absorption and performance recovery have not been sufficiently incorporated into both interaction decisions and subsequent execution parameter optimization. Therefore, an explicit mechanism is still lacking for incorporating disturbance-recovery characteristics into the selection of lane-change-execution parameters.
1.3. Motivation and Contributions
To enhance mainline traffic resilience under lane-change disturbances in mixed traffic with CAVs and HDVs, this study develops a Resilience-Oriented Hierarchical Cooperative Lane-Change Decision (RO-HCLD) model. The contributions are as follows: (1) A process-based resilience characterization method is established for mainline traffic under lane-change disturbances. Individual vehicle and system resilience are quantified from the perspectives of safety maintenance and efficiency recovery, and a coupled safety–efficiency resilience index is constructed to describe performance degradation, disturbance absorption, and state recovery. (2) A Stackelberg game model is proposed for mixed traffic with CAVs and HDVs. The equilibrium strategy for lane change and yielding is determined through speed, safety, comfort, and mainline disturbance payoffs. (3) A hierarchical cooperative lane-change method that combines behavior decisions with system optimization is designed. The method optimizes lane-change speed and acceleration according to the equilibrium strategy and reduces mainline speed fluctuations and vehicle delay. The coupled resilience criterion further determines the final execution parameters.
The remainder of this paper is organized as follows: Section 2 introduces the research scenario and problem description for the freeway merging area. Section 3 develops a resilience characterization method for mainline traffic under lane-change disturbances in the freeway merging area. Section 4 establishes the RO-HCLD model, which consists of a behavior-decision layer and a system-optimization layer. Section 5 conducts case validation on a microscopic traffic simulation platform. Section 6 summarizes the main conclusions.
2. Research Scenario and Problem Description
2.1. Research Scenario
The research scenario is a typical freeway merging area with a parallel acceleration lane under mixed traffic composed of CAVs and HDVs. After an on-ramp vehicle enters the acceleration lane, it must complete speed adjustment, gap selection, and the lane change before it reaches the end of the acceleration lane. The on-ramp lane-changing vehicle is defined as the lane-changing vehicle (LCV), which initiates the lane-change intention; the following vehicle in the target lane is defined as the mainline-following vehicle (MFV); the leading vehicle in the target lane is defined as the mainline-leading vehicle (MLV). The lane-change scenario is displayed in Figure 1.
Figure 1.
Lane-change scenario in the freeway on-ramp merging area.
2.2. Problem Description
Under the above research scenario, the LCV must determine appropriate lane-change timing according to the remaining length of the acceleration lane and the states of vehicles in the target lane. The response behavior of the MFV determines whether a lag gap can be created in the target lane and may affect upstream mainline vehicles through speed adjustment. The MLV determines the forward safety boundary after the LCV merges into the target lane. Therefore, a lane change in the freeway merging area requires not only an assessment of whether the LCV satisfies the lane change conditions but also coordination among the lane change demand of the LCV, the yielding response of the MFV, and the operating state of the mainline traffic flow. The problem contains the following three aspects.
- (1)
- Vehicle interaction: The LCV first selects lane change or no lane change according to its own state, the target gap, and the remaining length of the acceleration lane. The MFV then selects yielding or not yielding. When the MFV is a CAV, it can obtain the lane-change intention through communication; when the MFV is an HDV, its response can be characterized by observable vehicle states and the cooperation intensity.
- (2)
- Decision variables and constraints: The lane-change decision first determines whether the LCV changes lanes and whether the MFV yields. If the LCV selects no lane change, the vehicle maintains the current lane state and makes a new decision at the next decision time; if the LCV selects lane change, the lane-change speed and lane-change acceleration must also be determined. The lane-change process must satisfy the safe lead and lag gap constraints, vehicle dynamics constraints, the remaining length of the acceleration lane, and road geometry constraints.
- (3)
- Decision objectives and model output: Different lane-change and yielding strategies can change the speed, safety state, acceleration variation of the LCV and MFV. They also can impose different levels of disturbance on mainline vehicles. Strategy selection must consider both the payoffs of local vehicles and the effect of lane-change disturbance on the mainline traffic flow. The final model output is a cooperative lane change scheme that consists of a lane-change–yielding strategy and the lane-change-execution parameters.
3. Lane-Change Resilience Characterization
Resilience characterization for lane changes in freeway merging areas should describe how mainline traffic performance degrades after the LCV merges, how the traffic flow absorbs the local disturbance, and how it returns to a stable operating state. To establish this characterization, the evolution of mainline safety and efficiency under a lane-change disturbance is first analyzed. Resilience in the freeway merging area is then defined at the individual vehicle and system levels to distinguish the local response of the MFV from the overall recovery capability of the mainline traffic flow. Finally, an indicator system for the coupled resilience of safety and efficiency is constructed.
3.1. Lane-Change Disturbance Evolution and Resilience Definition
The effect of an LCV lane change on mainline traffic flow evolves continuously. Before the disturbance occurs, mainline vehicles are in a relatively stable car following state. After the LCV enters the target gap, the MFV must adjust its speed or headway. The mainline traffic performance subsequently degrades. If the MFV decelerates only slightly and upstream vehicles can maintain smooth car following, the speed fluctuations attenuate quickly; if the MFV decelerates sharply or causes consecutive vehicle responses, the disturbance may propagate upstream and extend the recovery time [33]. Accordingly, the effect of a lane-change disturbance cannot be described only through the safe distance or relative speed. The assessment should cover the complete process before, during, and after the disturbance.
Traffic resilience can describe the complete lane-change disturbance process from the perspectives of performance maintenance and state recovery [34,35]. Resilience is characterized by the temporal evolution of traffic performance over the complete disturbance process. A smaller performance degradation indicates a stronger capability to resist the disturbance, while a faster return toward a stable performance level indicates a stronger recovery capability.
Safety resilience reflects the extent to which vehicle safety is maintained. Efficiency resilience characterizes speed loss and the recovery level. The resilience metric is established based on the temporal evolution of traffic performance indicators. It integrates the variations of safety and efficiency performance during disturbance processes. The degradation and recovery characteristics of mainline traffic performance are then characterized through the resilience metric. The evolution curve of mainline traffic performance under a lane change disturbance is illustrated in Figure 2.
Figure 2.
Evolution curve of mainline traffic performance under a lane-change disturbance.
A 30 s analysis window is selected for each lane-change event, with 15 s before and 15 s after the lane change completion time. The main disturbance process is identified from the temporal evolution of the corresponding performance indicator within this window. The minimum performance level of the main disturbance is first identified, and its time is denoted by . The performance trajectory is then traced backward from . The last stable point before the main performance decline is identified as ; after this point, the performance departs from the pre-disturbance stable fluctuation and continues to evolve toward . The trajectory is also traced forward from . The first point at which the continuous recovery process ends and the performance enters a new stable fluctuation state is identified as .
Resilience in a freeway merging area comprises two levels: individual vehicle resilience and system resilience [36]. Individual vehicle resilience describes the ability of MFV to maintain safety and recover efficiency after a lane-change disturbance. System resilience reflects the overall effect of the disturbance on the mainline traffic flow. An evaluation that considers only the state of the MFV may ignore indirect effects on upstream vehicles. An assessment based only on the average mainline speed may obscure local high-risk interactions. Therefore, indicators are required at both the individual vehicle and system levels. The individual vehicle indicators explain microscopic vehicle responses. The system indicators evaluate the operating state of the mainline.
3.2. Safety–Efficiency Coupled Resilience Indicator System
Lane-change disturbances in freeway merging areas mainly cause two types of performance changes. The first type concerns safety performance, which is reflected by shorter distances among the vehicles, larger relative speeds, and higher potential conflict risk; the second type concerns efficiency performance, which is reflected by deceleration of upstream vehicles, a reduction in average speed, and a longer recovery time. Safety resilience is therefore used to quantify the safety maintenance level during a lane-change disturbance. The efficiency resilience quantifies speed loss and the recovery level. Together, these two dimensions form the indicator system for the coupled resilience of safety and efficiency, which evaluates the resilience of lane changes in freeway merging areas.
Safety resilience assessment first requires the definition of a safety performance indicator. Lane changes in freeway merging areas involve both longitudinal car-following interactions and lateral vehicle movements during gap entry. Therefore, conventional one-dimensional time-to-collision (TTC) cannot fully characterize the potential conflict risk during the merging process. A two-dimensional time-to-collision (2D-TTC) is adopted, which extends TTC to the longitudinal–lateral plane and considers both rear-end and sideswipe conflicts [37]. For each interacting vehicle pair, the longitudinal and lateral collision times are calculated according to the relative positions and velocities in the two directions. A directional collision time is considered valid only when the vehicle bodies overlap in the orthogonal direction at the predicted collision instant. The 2D-TTC of vehicle is defined as:
where and denote the longitudinal and lateral clearances between the vehicle bodies, respectively; and are the corresponding relative velocities. Vehicle length and width are considered when the clearances are determined. If the vehicles are not approaching in a given direction, or if their projected vehicle bodies do not overlap in the orthogonal direction at the corresponding collision instant, the directional TTC is set to infinity.
The TTC threshold is determined according to the minimum safe distance to account for differences in vehicle operating states. When the following vehicle approaches the leading vehicle, the critical 2D-TTC threshold is defined as:
where and denote the longitudinal speeds of the following and leading vehicles, respectively; is the reaction time; represents the maximum longitudinal deceleration; and is the longitudinal relative speed. The first case corresponds to a longitudinally dominated potential conflict, whereas the second case corresponds to a laterally dominated potential conflict. A vehicle is regarded as being in a potential conflict state when ; otherwise, it is regarded as being in a safe state.
The proportion of vehicles in a safe state on the mainline is defined as the safety performance of the mainline system.
where denotes the number of vehicles in the mainline system at time ; is the binary safety state indicator for vehicle . Based on the safety performance, individual vehicle and system safety resilience are defined as follows:
where denotes individual vehicle safety performance; represents the disturbance onset time; is the recovery time of individual vehicle safety performance; denotes the recovery time of system safety performance.
Equations (4) and (5) characterize safety resilience over the complete disturbance period from disturbance onset to recovery. Both a smaller degradation in safety performance and a shorter recovery time can lead to higher values of the proposed resilience indicators. Therefore, larger and values represent greater safety resilience of the individual vehicle and mainline system, respectively.
Efficiency resilience describes the speed loss and recovery process caused by a lane-change disturbance. The MFV speed and average mainline speed are employed to characterize individual vehicle efficiency performance and the system efficiency performance, respectively. The average mainline speed is defined as follows:
where denotes the speed of vehicle at time ; is the number of mainline vehicles. The average mainline speed reflects the effect of a lane-change disturbance on overall operational efficiency. When an LCV lane change causes the MFV and upstream vehicles to decelerate, decreases; when vehicles return to their car following states, gradually recovers. Individual vehicle and system efficiency resilience are defined as follows:
where denotes the steady state speed of vehicle ; represents the steady state average mainline speed. A larger efficiency resilience value indicates less speed loss caused by the lane-change disturbance and a higher level of system efficiency recovery. Equations (7) and (8) characterize efficiency resilience based on the accumulated speed deviation over the complete disturbance period from to the corresponding recovery time. Larger and values indicate greater efficiency resilience of the vehicle and mainline system, respectively.
A tradeoff exists between safety and efficiency during lane changes in freeway merging areas. Improved safety usually requires a larger headway or a lower speed and may cause a short-term efficiency loss. Improved efficiency may reduce the headway and increase potential conflict risk. An assessment based only on safety or efficiency resilience cannot fully evaluate the system effect of a cooperative lane change strategy. Therefore, a coupled resilience index is constructed to jointly consider safety resilience and efficiency resilience. Traditional linear aggregation may allow a high safety resilience to compensate for a low efficiency resilience, or vice versa. To reduce this compensatory effect, a weighted geometric aggregation is adopted. In this form, safety resilience and efficiency resilience are multiplied after weighting. The coupled resilience index is defined as follows:
where denotes the coupled resilience of the mainline system; is the safety resilience weight. Under the baseline setting, safety and efficiency are considered equally important, and . If safety receives greater emphasis in a practical application, can be increased; if traffic efficiency receives greater emphasis, can be reduced.
4. Hierarchical Cooperative Lane-Change Decision Model
To coordinate local vehicle interactions with mainline traffic performance, the proposed hierarchical model consists of a behavior-decision layer and a system-optimization layer. The behavior-decision layer uses a Stackelberg game to determine the lane change and yielding strategies of the LCV and MFV. The system-optimization layer further optimizes the lane-change speed and acceleration with mainline speed fluctuations and average delay as the objectives. A Pareto solution set is obtained through multi-objective optimization, and the coupled resilience of the mainline system is then used to select the final execution parameters. The final output is a cooperative lane change scheme that contains discrete strategies and continuous execution parameters. The structure of the proposed model is shown in Figure 3.
Figure 3.
RO-HCLD model structure.
4.1. Model Assumption
The following assumptions are introduced to define the players, information conditions, strategy space, and rules for information transfer between the two layers:
- (1)
- The LCV is a CAV with information sharing and control execution capabilities. It can obtain its own position, speed, acceleration, remaining length of the acceleration lane, and the states of vehicles in the target lane.
- (2)
- The MFV can be either a CAV or an HDV. A CAV obtains the lane-change intention of the LCV through communication and executes a cooperative response. The observable vehicle states and cooperation intensity parameter characterize the response of an HDV.
- (3)
- The game occurs within a short lane-change decision window. The LCV acts as the leader; the MFV acts as the follower. Both players select strategies according to the payoffs of different strategy combinations.
- (4)
- The LCV strategy set contains lane change and no lane change. The MFV strategy set contains yielding and not yielding. Different strategy combinations produce different payoffs.
- (5)
- The behavior-decision layer outputs an equilibrium strategy for lane change and yielding. If the LCV selects no lane change in the equilibrium strategy, the vehicle maintains its current state; if the LCV selects lane change, the decision proceeds to the system-optimization layer, which refines the lane-change speed and lane-change acceleration.
4.2. Behavior-Decision Layer
4.2.1. Game Structure and State Projection
- (1)
- Players and Strategy Space
The LCV and MFV are the players in the behavior-decision layer. The LCV first generates a lane change demand and decides whether to change lanes. After it observes the LCV strategy, the MFV selects yielding or not yielding. The two vehicles form a lane-change game with a sequential decision structure [7]. The strategy set of the LCV is defined as follows:
where denotes lane change and is no lane change. The strategy set of MFV is:
where denotes yielding and denotes not yielding. Different strategy combinations correspond to different payoff outcomes. The payoff matrix of the Stackelberg game is:
The payoff matrix only gives the payoff pair of the LCV and MFV for each of the four strategy combinations. It does not assign an a priori ranking to these combinations. The final order of the strategy combinations is determined from the subsequent payoff calculations.
- (2)
- State Projection under Different Strategies
Different strategy combinations produce different vehicle responses. Before the payoff matrix is constructed, the post-strategy states of the LCV and MFV are predicted according to the target gap and vehicle motion constraints. When the LCV selects lane change, a feasible merging position interval and a feasible merging speed interval are determined according to the predicted states of the MLV and MFV, the safe lead and lag gaps, road speed limits, and vehicle dynamic constraints. To avoid introducing an additional continuous optimization problem into the behavior-decision layer, the midpoints of each feasible interval and are used as the reference merging state.
Based on the current state and reference merging state of the LCV, the estimated merging time is calculated as follows:
The longitudinal response accelerations of the LCV and MFV under different candidate strategies are defined as:
where and are the current longitudinal position and speed of the LCV; and represent the current longitudinal position and speed of the MFV; and denote the longitudinal accelerations of the LCV and MFV under the normal car-following state, respectively; is the required safe lag gap between the LCV and MFV; is the lower bound of the allowable longitudinal acceleration of the MFV.
The strategy-specific longitudinal response acceleration is assumed to remain constant over the estimated merging period. The post-strategy speed and longitudinal position of vehicle are calculated as:
where denotes the LCV or MFV; and are the predicted speed and longitudinal position at the estimated merging time, respectively. If the reference merging state or the predicted motion violates the safe-gap or vehicle dynamic constraints, the corresponding lane change strategy is regarded as infeasible under the current traffic state. The predicted vehicle states are subsequently used to calculate the post-strategy total potential field intensity and the corresponding payoffs.
4.2.2. Game Payoff Function
The game payoff function consists of three components. First, a baseline payoff is constructed from speed, safety, and comfort. Second, the cooperation intensity is introduced to account for the payoff of the interacting vehicle and form the cooperative payoff. Finally, a resilience penalty based on mainline speed fluctuation is embedded into the cooperative payoff to reflect the system disturbance caused by each candidate strategy.
- (1)
- Baseline Payoff Function
A CAV lane-change decision must consider both local vehicle operation requirements and changes in the state of the mainline system. The baseline payoff of a vehicle consists of speed payoff, safety payoff, and comfort payoff:
where denotes the baseline payoff of vehicle ; , , and represent the speed payoff, safety payoff, and comfort payoff, respectively; , , and are the corresponding payoff weights. To account for the heterogeneity of HDV decision preferences, these weights are assumed to vary among vehicles rather than being identical for all HDVs. Since the three weights represent the relative importance of multiple objectives and satisfy the normalization constraint , they are generated according to a Dirichlet distribution. A balanced preference assumption is adopted for HDVs, where the payoff weights follow a Dirichlet distribution . For CAVs, a safety-oriented preference assumption is adopted, where the payoff weights follow a Dirichlet distribution with a higher concentration parameter assigned to the safety objective. The weights of CAV follow . The speed payoff represents the speed change after the vehicle executes a strategy:
where denotes the current speed of vehicle ; is predicted speed at the estimated merging time under the corresponding candidate strategy, as calculated in Equation (16). When the vehicle speed increases after strategy execution, the speed payoff is positive; when the vehicle decelerates to yield or avoid risk, the speed payoff decreases.
The safety payoff is characterized through the change in total potential field intensity. The basic formulation of the vehicle potential field and road boundary potential field follows driving safety field theory. It is extended to account for the constraint at the end of the acceleration lane [38]. The total potential field intensity consists of the vehicle potential field and the road boundary potential field:
where is the vehicle potential field and represents the potential field at the end of the acceleration lane. If the total potential field intensity decreases after strategy execution, the potential safety risk decreases and the safety payoff increases:
where denotes the predicted total potential field intensity under the corresponding candidate strategy. The potential field method considers both vehicle interactions and road boundary constraints. It is suitable for the characterization of dynamic safety risk in mandatory lane change scenarios within freeway merging areas. The safety payoff is used to account for the local safety risk associated with different lane change and yielding strategies before the execution parameters are optimized.
During a lane change in a freeway merging area, yielding by the MFV, acceleration of the LCV before it merges, or lateral lane change motion can all cause acceleration variations. Excessive acceleration variation can reduce driving comfort and increase the car following disturbance of upstream vehicles. Acceleration and its variation reflect driving smoothness during the lane-change process. They can therefore represent the comfort payoff [18]. The comfort payoff is defined as follows:
where and are the resultant accelerations of vehicle before and after strategy execution, respectively; is the maximum allowable acceleration of vehicle .
- (2)
- Cooperative Payoff Function
The baseline payoff in Equation (18) reflects the operating benefit of each vehicle itself. To characterize the cooperative interaction between the LCV and MFV, the cooperation intensity parameter is introduced to account for the payoff of the interacting vehicle. The cooperative payoffs of the LCV and MFV are defined as follows:
where and denote the baseline payoffs of the LCV and MFV, respectively; and represent their strategies; is the cooperation intensity. A larger assigns greater importance to the payoff of the interacting vehicle and therefore represents stronger cooperation. The parameter does not directly determine the yielding behavior. Instead, it changes the payoff associated with each strategy combination and consequently affects the equilibrium strategy.
- (3)
- Incorporation of the Mainline Disturbance Penalty
To account for the short-term effect of local interaction strategies on mainline traffic, a resilience penalty is further embedded into the cooperative payoff. The resilience term is not an independent positive payoff objective. It represents the additional system penalty caused by traffic disturbance under each candidate strategy combination. The payoff functions of the LCV and MFV after incorporating the resilience penalty are defined as follows:
where and represent the cooperative payoffs considering system resilience for the LCV and MFV, respectively; is the normalized resilience penalty.
Mainline speed fluctuations reflect the extent of disturbance propagation toward upstream traffic. Larger speed fluctuations indicate a stronger adverse effect of the lane change strategy on system stability. The normalized resilience penalty term is defined as the negative value of the standard deviation of mainline vehicle speeds:
where denotes the standard deviation of mainline vehicle speeds; is the speed of vehicle at time ; represents the average mainline speed; is the number of vehicles included in the calculation.
4.2.3. Game Equilibrium Solution
The LCV first makes the lane-change decision. The MFV subsequently selects yielding or not yielding according to the action of the LCV. Compared with a conventional Nash equilibrium solution in which players act simultaneously, backward induction can preserve the sequential relationship between the leader decision and follower response. It is more suitable for the solution of a Stackelberg game under a complete information setting. Therefore, backward induction is adopted to solve the lane change and yielding strategy. For a given LCV strategy , the best response of the MFV is:
After the LCV accounts for the best response of the MFV, it selects:
The final equilibrium strategy is:
where is the equilibrium strategy combination for lane change and yielding under the current state. This strategy combination represents the initial output of the behavior-decision layer. It is then passed to the system-optimization layer for optimization of the execution parameters.
4.3. System-Optimization Layer
The behavior-decision layer determines only whether the LCV changes lanes and whether the MFV yields. However, the actual effect of the lane change on the mainline traffic flow also depends on the lane-change speed and lane-change acceleration. Therefore, under a given equilibrium strategy , the system-optimization layer refines the lane-change-execution parameters with the objectives of minimizing the mainline vehicle speed standard deviation and average delay. The system-optimization layer uses the lane-change speed and acceleration as the decision variables:
where is the lane-change-execution parameter vector; denotes the lane-change-execution speed of the LCV; is the lane-change-execution acceleration of the LCV.
Different lane-change speeds and accelerations can produce different responses of the LCV, MFV, and upstream mainline vehicles. To each candidate execution parameter vector , the corresponding traffic state evolution is projected before the objective values are evaluated. All particles start from the same observed traffic state at the activation time of the system-optimization layer. The projection covers the LCV and the mainline vehicles included in the system-level evaluation. Their positions, speeds, and accelerations are projected, while the corresponding intervehicle gaps, mainline speed fluctuations. The vehicle travel times are subsequently derived from these states. The traffic states are updated at a projection step of . For vehicle , the longitudinal state is recursively projected as follows:
where , and denote the longitudinal position, speed, and acceleration of vehicle at time , respectively; is the projection time step. The LCV is projected according to the candidate execution parameters . The MFV follows the equilibrium response determined by the behavior-decision layer. When the MFV yields, its longitudinal response acceleration is determined according to Equation (15) based on the projected merging state of the LCV; otherwise, the normal car-following acceleration in Equation (15) is adopted. The remaining mainline vehicles evolve according to their predefined microscopic vehicle behavior models.
The traffic flow stability objective is represented by the standard deviation of mainline vehicle speeds:
where is the standard deviation of mainline vehicle speeds under the execution parameter vector ; represents the speed of vehicle under this parameter vector; refers to the corresponding average mainline speed. A smaller indicates weaker mainline speed fluctuations and more stable traffic flow. The efficiency objective is represented by average delay:
where refers to the delay of vehicle ; is the actual travel time through the merging area; denotes the free flow travel time; and are the times when vehicle enters and exits the merging area, respectively; is the length of the merging area; is the free flow speed of vehicle . The multi-objective optimization model of the system-optimization layer is formulated as follows:
4.4. Hierarchical Optimization Model Solution Method
The solution procedure of the RO-HCLD model consists of two stages: the behavior-decision layer and the system-optimization layer. The behavior-decision layer uses backward induction to solve the equilibrium strategy for lane change and yielding. The system-optimization layer uses the multi-objective particle swarm optimization (MOPSO) algorithm to determine the lane-change-execution parameters [39].
At each lane-change decision step, the vehicle states of the LCV, MFV, and MLV are read first. Next, the payoffs of the LCV and MFV are calculated for each strategy combination. The payoff matrix is constructed. After the MFV observes the LCV strategy, it selects its best response. The LCV then determines its optimal strategy according to the best response of the MFV, which yields the output of the behavior-decision layer.
If the LCV strategy in is no lane change, the LCV maintains its current lane state and proceeds to the next decision step. If the LCV strategy in is lane change, the system-optimization layer determines the feasible parameter range according to the equilibrium strategy and starts the MOPSO solution procedure. Each particle in MOPSO represents a candidate set of execution parameters. Its fitness is evaluated through the standard deviation of mainline vehicle speeds and average delay. Nondominated solutions that satisfy the safe distance constraints, vehicle dynamics constraints, and road geometry constraints are stored in the external archive. These constraints further ensure the safety and feasibility of lane-change execution by restricting the forward and rear gaps, vehicle motion states, and available merging space. The Pareto solution set is obtained after the iterations are completed [40].
MOPSO generates a set of Pareto-optimal execution parameters according to the mainline speed fluctuation and average delay objectives. These objectives are sensitive to changes in lane-change speed and acceleration, but they characterize only the direct operational effects of the execution parameters. To further account for the degradation and recovery of mainline traffic performance, the coupled resilience defined in Section 3 is introduced as the criterion for compromise solution selection. For each Pareto solution, the corresponding system safety resilience and system efficiency resilience are estimated from the traffic state evolution. The estimated coupled resilience is calculated as follows:
where , and denote the estimated coupled resilience, system safety resilience, and system efficiency resilience under candidate execution parameters, respectively. A larger value represents stronger resilience. The final execution parameters are therefore determined by the Pareto solution with the maximum estimated coupled resilience:
where is the optimal lane-change-execution parameters output by the system-optimization layer. Accordingly, the final output of the RO-HCLD model is:
where represents the complete cooperative lane change scheme; refers to the equilibrium strategy for lane change and yielding output by the behavior-decision layer; denotes the lane-change-execution parameters. Algorithm 1 presents the complete solution procedure.
| Algorithm 1. Solution Procedure of the RO-HCLD Model | |
| Input: Road geometric parameters ; vehicle state set CAV penetration rate cooperation intensity strategy sets and particle number maximum iteration number external archive size Output: Complete cooperative lane change scheme | |
| Step | Description |
| 1: | Initialize the decision step t, particle population P, and external archive |
| 2: | Read the current road geometric parameters G and vehicle state set X(t). |
| 3: | Identify the lane-changing vehicle LCV, the mainline-following vehicle MFV, and the mainline leading vehicle MLV. |
| 4: | Determine the payoff weights according to vehicle type: for HDVs and for CAVs. |
| 5: | Construct the LCV strategy set |
| 6: | Construct the MFV strategy set |
| 7: | for each strategy combination , , do |
| 8: |
Determine the feasible merging position interval and feasible merging speed interval according to the MLV and MFV states, safe lead and lag gaps, road speed limits, and vehicle dynamic constraints. |
| 9: | if the candidate lane-change strategy is feasible then |
| 10: | Determine the reference merging state
and calculate the estimated merging time according to Equation (13). |
| 11: | Calculate the strategy-specific longitudinal response accelerations of the LCV and MFV according to Equations (14) and (15). |
| 12: | Project the post-strategy speed and longitudinal position of the LCV and MFV according to Equations (16) and (17). |
| 13: | if the projected states violate the safe-gap or vehicle dynamic constraints then |
| 14: | Mark the corresponding strategy combination as infeasible. |
| 15: | Else |
| 16: | Calculate the post-strategy total potential field intensity |
| 17: | Calculate the speed payoff safety payoff and comfort payoff |
| 18: | Calculate the baseline payoff |
| 19: | Calculate the cooperative payoffs
and according to Equations (23) and (24) with cooperation intensity . |
| 20: | Calculate the normalized resilience penalty
according to Equations (27) and (28). |
| 21: | Calculate the final payoffs and according to Equations (25) and (26). |
| 22: | end if |
| 23: | end if |
| 24: | end for |
| 25: | Construct the Stackelberg payoff matrix G from the feasible strategy combinations. |
| 26: | for each LCV strategy do |
| 27: | Calculate the best response of the MFV, |
| 28: | end for |
| 29: | Determine the optimal LCV strategy |
| 30: | Obtain the equilibrium strategy of the behavior-decision layer. |
| 31: | if then |
| 32: | Set the LCV maintains its current lane state. |
| 33: | Else |
| 34: | Activate the system-optimization layer and determine the feasible range of the execution parameters according to |
| 35: | Initialize the MOPSO population. Each particle represents a candidate execution parameter vector |
| 36: | for to do |
| 37: | for to do |
| 38: | Project the traffic-state evolution from the same observed state using and with according to Equations (33) and (34). |
| 39: | Calculate the mainline speed standard deviation according to Equation (35). |
| 40: | Calculate the average delay according to Equations (36)–(39). |
| 41: | Check the forward safety-distance constraint
and rear safety- distance constraint |
| 42: | Check the vehicle dynamic constraints and |
| 43: | Check the road geometric constraint |
| 44: | if satisfies all constraints then |
| 45: | Update the personal best position of particle j and the external archive according to Pareto dominance. |
| 46: | if then truncate the external archive according to the MOPSO archive-maintenance rule. |
| 47: | end if |
| 48: | end for |
| 49: | Select the global guide particle from according to the Pareto dominance relationship. |
| 50: | Update the particle velocities and positions and enforce the feasible bounds of and |
| 51: | end for |
| 52: | Obtain the Pareto non-dominated solution set from the external archive |
| 53: | for each nondominated solution do |
| 54: | Calculate the estimated system safety resilience and system efficiency resilience from the projected traffic-state evolution. |
| 55: | Calculate the estimated coupled resilience |
| 56: | end for |
| 57: | Select the optimal execution parameters |
| 58: | end if |
| 59: | Generate the complete cooperative lane change scheme |
| 60: | Return |
5. Experimental Validation and Result Analysis
5.1. Experimental Scenario and Parameter Settings
A freeway merging area with a parallel acceleration lane was constructed on the Simulation of Urban Mobility (SUMO) microscopic traffic simulation platform. The behavior decision model was connected to a controller implemented in Python 3.10.5 through the Traffic Control Interface (TraCI) of SUMO. During the simulation, the Python based controller read vehicle position, speed, acceleration, lane index, headway, and the remaining length of the acceleration lane from TraCI in real time. After an LCV entered the lane-change decision zone, the payoffs of different strategy combinations were calculated. The equilibrium strategy of the Stackelberg game was then solved. If the equilibrium result was lane change, the system-optimization layer further determined the lane-change speed and lane-change acceleration and sent speed control and lane-change control commands to SUMO through TraCI; if the equilibrium result was no lane change, the vehicle maintained the current lane and proceeded to the next decision step. The lane-change model comparison includes the baseline lane-change model, the Individual Utility-Oriented Cooperative Lane-Change Decision (IUO-CLD) model, and the RO-HCLD model.
The behavioral characteristics of HDVs were analyzed based on the NGSIM trajectory dataset. The NGSIM I-80 trajectory dataset was used as the empirical basis for the HDV parameter settings. The dataset was collected from an approximately 503 m freeway section that contains five regular freeway lanes, one high-occupancy vehicle (HOV) lane, and one on-ramp. Vehicle trajectories were recorded at 0.1 s intervals during three 15 min periods, namely 4:00–4:15 p.m., 5:00–5:15 p.m., and 5:15–5:30 p.m. These periods cover both congestion formation and congested traffic conditions.
After denoising and smoothing the vehicle trajectories, the mean spacing, mean time headway, and standard deviation of acceleration were determined as 19.46 m, 2.80 s, and 1.60 m/s2, respectively. These trajectory-based behavioral characteristics were used as empirical references for determining the HDV parameters in the microscopic simulation.
The Krauss car-following model and the LC2013 lane-changing model are adopted to represent the longitudinal and lateral behaviors of HDVs, respectively. The NGSIM trajectory data were used to extract the behavioral characteristics of human drivers, including car-following and lane-changing features. These trajectory-based characteristics provided an empirical basis for determining the parameters of the Krauss and LC2013 models to reproduce realistic HDV behaviors in the simulation environment. Table 1 lists the road, vehicle, and simulation parameters. Table 2 presents the experimental schemes, parameter combinations, number of replicated runs, and valid sample sizes. In Table 2, the traffic saturation level is quantified by the volume-to-capacity (V/C) ratio. A V/C value around 0.3 generally corresponds to relatively low traffic intensity. A value around 0.8 represents a high-saturation or near-capacity condition [41,42]. Values between these two levels represent intermediate traffic conditions. Therefore, V/C = 0.30 and 0.80 were selected to represent low and high saturation conditions, respectively. The midpoint between these two values, V/C = 0.55, is used to represent the moderate saturation condition.
Table 1.
Simulation parameter settings.
Table 2.
Design of simulation experiments.
For the sensitivity analysis, the CAV penetration rate was varied from 10% to 90% at 10% intervals to examine the effect of mixed-traffic composition on system resilience. The cooperation intensity ranges from 0 to 1, where a larger value indicates that a vehicle assigns greater importance to the payoff of the interacting vehicle. To cover low, moderate, and high cooperation conditions over the full parameter range, three representative levels were selected: η = 0.3, 0.6, and 0.9, corresponding to low, moderate, and strong cooperation, respectively. At , the vehicle still assigns greater weight to its own payoff. At , the interacting vehicle’s payoff receives slightly greater weight than the vehicle’s own payoff. At , the interaction approaches the fully cooperative limit while a nonzero weight is still retained for the vehicle’s own payoff. These values are therefore used as representative levels.
To reduce the effect of randomness in vehicle-generation and lane-change events, each experimental group was repeated with different random seeds. Valid lane-change events that completed the full decision process were screened from the SUMO vehicle trajectories and lane-change records. All comparisons used the same event screening criteria and indicator calculation methods to ensure comparability among the different schemes.
The external archive size, population size, and maximum iteration number of MOPSO were set to 100, 30, and 30, respectively. Each particle represents a candidate lane-change execution scheme, where the particle position consists of the lane-change speed and acceleration parameters. Therefore, each triggered optimization process involves a maximum of 900 objective function evaluations. To evaluate the computational burden of the proposed optimization procedure, the computation time of all valid lane-change optimization events was recorded in the RO-HCLD simulations. The average computation time of each triggered MOPSO optimization process is 2.95 s, with a standard deviation of 0.86 s. The minimum and maximum computation times were 2.21 s and 3.87 s, respectively. The reported computation time represents the time required to complete the entire MOPSO procedure, including the iterative evaluation and update of candidate execution parameters. For each particle, traffic states are projected at 0.5 s intervals during its evaluation.
To further assess the computational efficiency of MOPSO, the available maneuver time was examined for all valid lane-change events. It was defined as the time interval from activation of the system-optimization layer to the moment when the LCV reaches the end of the acceleration lane. The minimum, average, and maximum available maneuver times were 8.26 s, 12.55 s, and 17.73 s, respectively. The maximum observed MOPSO computation time was 3.87 s, which was still shorter than the minimum available maneuver time of 8.26 s. Therefore, the optimization computation does not exhaust the available maneuver time. A time margin remains for subsequent lane-change execution. It indicates that the proposed lane-change decision method has acceptable computational efficiency for the investigated merging scenarios.
5.2. Effectiveness Validation Results of the Lane-Change Method
5.2.1. Effectiveness Validation of the Behavior-Decision Layer
To validate the lane-change timing identification capability of the Stackelberg game model, the predicted and observed lane-change times were compared, and their difference was used as the evaluation metric. A negative value indicates an earlier prediction, whereas a positive value indicates a later prediction. Because the timing difference is a continuous variable, kernel density estimation was adopted to describe its distribution under different traffic densities. Figure 4 presents the kernel density estimates, and Table 3 provides the corresponding statistical characteristics.
Figure 4.
Kernel density estimates of lane-change time differences.
Table 3.
Differences between predicted and observed lane-change time.
The mean lane-change timing differences are −0.818 s, −0.840 s, and −0.603 s under low, medium, and high traffic density conditions, respectively. These results indicate that the Stackelberg game model identifies lane change opportunities approximately 0.6–0.8 s earlier than the baseline model. This earlier identification reflects the response capability of the behavior-decision layer and provides additional time for subsequent cooperative interaction and execution optimization. As traffic density increases, smaller target gaps and stronger safety and comfort constraints result in more conservative strategies under complex traffic conditions.
To further validate the behavior-decision layer, Figure 5, Figure 6 and Figure 7 present the distributions of the speed, safety, and comfort payoffs under different traffic density conditions, respectively. The color scale represents the sample density and indicates the regions where the payoff samples are more concentrated. Figure 5 presents the distributions of the speed payoff under different traffic density conditions. The distribution of the speed payoff changes with increasing traffic density, which indicates that the speed responses associated with different strategy combinations vary across traffic conditions. Compared with the low-density condition, the speed payoff shows more evident variation under the medium- and high-density conditions. It reflects the stronger effect of vehicle interactions on speed adjustment as traffic density increases.
Figure 5.
Distribution of speed payoff under different traffic density conditions.
Figure 6.
Distribution of safety payoff under different traffic density conditions.
Figure 7.
Distribution of comfort payoff under different traffic density conditions.
Figure 6 shows the distributions of the safety payoff under different traffic density conditions. Under the low-density condition, the safety payoff samples are mainly concentrated within 0.8–1.0. As traffic density increases, the distribution extends toward lower safety payoff values. This change indicates that the reduction in available gaps and the stronger interactions among vehicles increase the differences in safety conditions among lane-change events.
Figure 7 presents the distributions of the comfort payoff under different traffic density conditions. Under the medium- and high-density conditions, the comfort payoff samples are mainly concentrated within 0.4–0.6, while some samples exceed 0.8 under the high-density condition. The wider variation under high traffic density reflects greater differences in acceleration adjustment among lane-change events. This result indicates that more intensive vehicle interactions lead to greater variation in driving smoothness during the lane-change process.
Figure 8 shows the proportions of game strategy combinations under different payoff weights. The results illustrate that the proportion of the no lane change and yielding strategy decreases from 67% to 41% as density increases. The lane change and not yielding strategy rises from 4% to 23%. When the speed payoff weight is increased, the proportion of the no lane change and not yielding strategy reaches 66% under medium density conditions. The lane change and not yielding strategy reaches 32% under high density conditions. In contrast, higher weights for the safety or comfort payoff clearly increase the proportion of yielding strategies. These findings indicate that the behavior-decision layer can adjust the strategy combination according to traffic density and payoff preferences instead of applying a fixed lane change or yielding rule.
Figure 8.
Proportions of game strategy combinations under different weighting.
5.2.2. Effectiveness Validation of the System-Optimization Layer
To further validate the capability of the system-optimization layer to refine lane-change-execution parameters, the equilibrium strategy for lane change and yielding was first determined. MOPSO was then applied with the standard deviation of mainline vehicle speeds and average delay as the optimization objectives. Three settings were considered: balanced preference, safety preference, and efficiency preference. The corresponding safety weights were 0.5, 0.7, and 0.3, respectively. The Pareto solutions and compromise solutions under these settings were compared. Figure 9 presents the Pareto solutions and the distributions of the selected lane-change-execution parameters under different resilience preferences. The three preferences select different positions along the same Pareto front. The safety preference favors solutions with smaller mainline speed fluctuations, whereas the efficiency preference shifts the selected solution toward lower vehicle delay. The balanced preference lies between these two cases. The median optimal lane-change speed increases from approximately 19.5 m/s under the safety preference to 23.5 m/s under the balanced preference and 27.5 m/s under the efficiency preference. These optimized speeds correspond to the acceleration lane and remain below its speed limit of 120 km/h. A similar shift occurs in lane-change acceleration, for which the median value changes from approximately −0.70 m/s2 to −0.30 m/s2 and 0.10 m/s2, respectively. The parameter distributions also become wider as the preference shifts toward efficiency. These results indicate that the coupled resilience criterion can distinguish Pareto solutions and translate different safety–efficiency preferences into differentiated lane-change-execution parameters.
Figure 9.
Distribution of Pareto solution sets under different preference settings.
Based on the Pareto solution sets, the evolution of traffic safety performance was further analyzed to evaluate the impact of different lane-change decision strategies on mainline traffic operations. Specifically, the safety performance evolution based on TTC was compared between the IUO-CLD and RO-HCLD models. Figure 10 presents the corresponding performance curves and mean values. Under the IUO-CLD model, the MFV may make large speed adjustments because of excessive yielding. The safety performance curves show pronounced fluctuations. The minimum mean value is approximately 0.66. Under the RO-HCLD model, the curves are more stable and the minimum mean value increases to approximately 0.78, which corresponds to an improvement of about 18.2%. It demonstrates that the incorporation of the mainline disturbance payoff and the optimization of execution parameters can reduce the loss of mainline safety performance caused by lane-change disturbances.
Figure 10.
System safety performance curves under different optimization objectives.
In addition to safety performance, the efficiency performance evolution of the mainline traffic system was analyzed based on average speed variations. The efficiency performance curves of the mainline system under different cooperative optimization objectives are displayed in Figure 11. Under the IUO-CLD model, the minimum efficiency performance of the mainline system is approximately 0.7. Substantial variation exists among different lane-change events. Under the RO-HCLD model, the minimum value increases to approximately 0.8. The efficiency performance curves are more concentrated across the different events. It indicates that the system-optimization layer can reduce unnecessary speed loss during the lane-change-execution process and improve the recovery of mainline efficiency. The mean curves show that the efficiency performance of the mainline system under the cooperative lane-change model based on individual vehicle utility gradually recovers to the pre-disturbance level. For the hierarchical model with a system performance objective, the mean efficiency slightly exceeds the pre-disturbance level after the disturbance. This result indicates that adjustments to the lane-change speed and acceleration reduce the speed loss of mainline vehicles and stabilize system efficiency recovery.
Figure 11.
System efficiency performance curves under different optimization objectives.
The above results demonstrate that the proposed RO-HCLD model can effectively improve the safety and efficiency performance of mainline traffic during lane-change disturbances. Compared with the IUO-CLD model, RO-HCLD reduces the degradation of mainline safety performance and mitigates the loss of traffic efficiency caused by lane changes. These results indicate that optimizing lane-change decisions from a system-oriented perspective can improve the operational stability of freeway merging areas.
System resilience indicators under different cooperative optimization objectives were further calculated. The results are presented in Figure 12. It shows that the overall distribution of the system safety resilience under the lane-change model based on system performance is clearly higher than that under the lane-change model based on individual vehicle utility. For the coupled resilience of the mainline system, the overall distribution under the lane-change model based on system performance is also higher than that under the IUO-CLD model. Its standard deviation is 0.057, which is slightly higher than the value of 0.049 based on individual vehicle utility. It indicates that some differences among individual lane-change events remain despite the improvement in system resilience. For the efficiency resilience of the mainline system, the median values under the models based on system performance and individual vehicle utility are 0.969 and 0.963, respectively. The difference between the two values is small. This finding illustrates that the system-optimization layer provides a relatively limited improvement in efficiency resilience but produces a more concentrated distribution. Overall, the improvement in system resilience under the RO-HCLD model mainly originates from the increase in the safety resilience of the mainline system.
Figure 12.
Distribution characteristics of system resilience indicators.
5.2.3. Comparison of Different Lane-Change Decision Strategies
To evaluate the performance of the RO-HCLD model, three lane-change approaches were compared: noncooperative lane change, the IUO-CLD model, and the RO-HCLD model. Table 4 presents the mean values of the resilience indicators under the different lane-change decision strategies. The coupled resilience and the safety resilience of the mainline system under the IUO-CLD model are 0.791 and 0.655, respectively, which are lower than the corresponding values of 0.822 and 0.707 under noncooperative lane change. This comparison shows that local vehicle cooperation does not necessarily improve system performance. The coupled resilience of the mainline system under the RO-HCLD model is 0.876, which is 10.7% and 6.6% higher than that under the IUO-CLD model and under noncooperative lane change. The safety resilience of the mainline system under the RO-HCLD model is 0.795, which is 21.4% and 12.4% higher than that under the IUO-CLD model and noncooperative lane change, respectively. Compared with the IUO-CLD model, the RO-HCLD model improves individual vehicle safety resilience and individual vehicle efficiency resilience by 3.13% and 4.24%, respectively. It demonstrates that the mainline disturbance payoff and resilience-guided execution parameter selection can improve the system resilience while they maintain the operating state of individual vehicles.
Table 4.
Mean values of resilience indicators under different lane-change decision strategies.
5.3. Sensitivity Analysis
To analyze the applicability of the RO-HCLD model under different connected and automated traffic conditions, the CAV penetration rate and cooperation intensity were selected as sensitivity parameters. Under the RO-HCLD model, system resilience and individual vehicle resilience were calculated for different parameter combinations. The results are presented in Figure 13.
Figure 13.
Mean resilience under different cooperation intensities and CAV penetration rates.
As can be seen in Figure 13, the system resilience presents a non-monotonic variation as the CAV penetration rate increases from 10% to 90%. The coupled resilience of the mainline system first decreases and then recovers with increasing CAV penetration. Under weak cooperation, the mean value decreases from 0.892 at a 10% penetration rate to 0.865 at a 60% penetration rate and then increases to 0.889 at a 90% penetration rate. Similar variation trends are observed under different cooperation intensities. The safety resilience of the mainline system shows a consistent pattern, with the minimum value occurring at a 60% penetration rate. Under strong cooperation, the safety resilience decreases from 0.820 at 10% penetration to 0.783 at 60% penetration and recovers to 0.827 at 90% penetration. In contrast, the efficiency resilience remains relatively stable and gradually improves at high CAV penetration rates. Under strong cooperation, the mean value increases from 0.9620 at 60% penetration to 0.9700 at 90% penetration. These results suggest that the interaction between CAVs and HDVs becomes more complex during the medium-penetration stage, which limits the improvement of system safety performance. When CAVs become dominant in the traffic flow, the enhanced coordination capability is more effective in reducing speed loss and improving recovery performance.
The individual resilience indicators show more significant variations with CAV penetration rates than the system-level indicators. The individual safety resilience first decreases and then recovers as the proportion of CAVs increases. Under strong cooperation, the mean value decreases from 0.696 at a 10% penetration rate to 0.625 at a 60% penetration rate and increases to 0.654 at a 90% penetration rate. The larger variation compared with system safety resilience suggests that individual vehicles are more sensitive to heterogeneous interactions between CAVs and HDVs during the transition stage of mixed traffic. In contrast, the individual efficiency resilience shows a relatively stable variation pattern. Under strong cooperation, the value decreases slightly from 0.9085 at 10% penetration to 0.9042 at 60% penetration and increases to 0.9128 at 90% penetration. These results suggest that individual safety recovery is more affected by changes in traffic composition, while individual efficiency recovery mainly depends on coordinated speed adjustment and stable lane-change execution.
Cooperation intensity has a substantially greater effect on safety resilience than on efficiency resilience. When the cooperation intensity increases from 0.3 to 0.9, the maximum increase in the safety resilience of the mainline system is approximately 2.6%. The efficiency resilience of the mainline system changes by less than 0.5%. Individual vehicle safety resilience shows the largest increase at a medium CAV penetration rate. The improvement is approximately 3.3%. It indicates that the MFV is more susceptible to heterogeneous vehicle interactions under this condition. Individual vehicle efficiency resilience reaches its highest value of approximately 0.912 at an 80% CAV penetration rate under strong cooperation. Overall, a moderate level of cooperation provides a better balance between safe yielding and efficiency maintenance. A further increase in cooperation intensity mainly improves the safety state, but the efficiency benefit gradually weakens. These findings indicate that the cooperation intensity should match the CAV penetration rate rather than simply be set to its maximum value.
To further examine whether the variation patterns shown in Figure 13 are systematic rather than caused by simulation variability, the distributions of the resilience indicators across the repeated simulations were further analyzed. Each parameter combination was independently simulated 15 times with different random seeds. Figure 14 presents the distributions of the five resilience indicators under different CAV penetration rates and cooperation intensities.
Figure 14.
Resilience distribution under different cooperation intensities and CAV penetration rates.
As shown in Figure 14, variations are observed among the repeated simulations, whereas the median values and the main distribution ranges generally follow the variation patterns of the mean values in Figure 13. In particular, the system coupled resilience and system safety resilience decrease during the medium CAV penetration stage and recover as the penetration rate further increases. Similar distribution shifts are observed under different cooperation intensities. The individual safety resilience exhibits relatively larger variability, whereas the system and individual efficiency resilience remain more concentrated. These consistent distribution patterns across repeated simulations indicate that the non-monotonic relationship between CAV penetration rate and resilience is not dominated by individual simulation variability. The results further support the systematic influence of heterogeneous interactions between CAVs and HDVs on resilience during the mixed-traffic transition stage.
6. Conclusions
To address the inconsistency between local lane-change decisions and the resilience objectives of the mainline system in freeway merging areas, this study proposes a resilience-oriented hierarchical cooperative lane-change decision model for CAVs to enhance mainline traffic resilience. The method establishes a coupled resilience index of safety and efficiency. A lane change and yielding strategy is determined through a Stackelberg game in the behavior-decision layer. Lane-change speed and acceleration are optimized in the system-optimization layer. This structure coordinates local vehicle interactions with the operational objectives of the mainline system.
The experimental results from the SUMO simulation platform demonstrate that the proposed model can link microscopic vehicle interaction decisions with improvements in mainline system resilience. It can address the possibility that local cooperative strategies may not improve system performance. The results show that the Stackelberg game model identifies lane change opportunities approximately 0.75 s earlier on average than the baseline lane-change model. It can adjust the lane change and yielding strategy according to traffic density and payoff preferences. Compared with the cooperative lane-change model based on individual vehicle utility, the hierarchical cooperative lane-change model based on system performance improves the coupled resilience of the mainline system and the safety resilience of the mainline system by 10.7% and 21.4%, respectively. The overall performance is also better than that of the noncooperative lane change strategy. This comparison indicates that a cooperative relationship based only on individual vehicle payoffs may cause excessive yielding. Mainline disturbance payoff mitigates the adverse effects of local interaction strategies. Resilience-oriented coupled Pareto selection effectively reduces the disturbance to mainline traffic caused by lane changes. The sensitivity analysis indicates that system resilience varies nonmonotonically with the CAV penetration rate. Heterogeneous vehicle interactions at a medium penetration rate impose some limitations on resilience improvement. A high penetration rate is more favorable for the recovery of mainline efficiency. The effect of cooperation intensity is context dependent and should match the CAV penetration rate and traffic state.
Future research will extend the current Stackelberg game between the lane-changing vehicle and the mainline-following vehicle to a multivehicle cooperative game framework. The extended model will more accurately describe continuous on-ramp merging and multivehicle response processes. Future work can also consider to use larger real-world vehicle trajectory datasets to optimize the potential field parameters, payoff weights, resilience weights, and cooperation intensity. These efforts can improve the applicability and adaptive capability of the proposed hierarchical cooperative lane-change method in real freeway merging areas. Another extension will explicitly model stochastic communication delay, packet loss, and information retransmission. Their effects on lane-change decisions, execution parameters, and mainline traffic resilience will be further evaluated under different communication conditions.
Author Contributions
Conceptualization, F.W. and Y.L. (Yuran Li); methodology, F.W. and S.L.; validation, S.L. and Y.L. (Yuran Li); formal analysis, F.W. and H.Z.; investigation, H.Z. and S.L.; data curation, S.L. and F.W.; writing—original draft preparation, F.W., S.L. and Y.L. (Yuran Li); writing—review and editing, F.W., C.Z., Y.L. (Yuran Li) and Y.L. (Yan Li); visualization, S.L. and Y.L. (Yuran Li); supervision, Y.L. (Yan Li) and C.Z.; funding acquisition, F.W. and Y.L. (Yan Li). All authors have read and agreed to the published version of the manuscript.
Funding
The research described in this paper was jointly supported by the National Natural Science Foundation of China (Grant No. 52678568, 52608712), the Science and Technology Projects of Xizang Autonomous Region, China (Grant No. XZ202601ZD0012), the Natural Science Basic Research Plan in Shaanxi Province of China (Grant No. 2025JC-YBMS-367, 2025JC-YBQN-524) and the Hebei Natural Science Foundation (E2024210032).
Institutional Review Board Statement
Not applicable.
Informed Consent Statement
Not applicable.
Data Availability Statement
The raw data are available on request.
Conflicts of Interest
Author Shuang Liu was employed by the company Nanjing MicroVideo Technology Co., Ltd. The remaining authors declare that the research was conducted in the absence of any commercial or financial relationships that could be construed as a potential conflict of interest.
References
- Sun, B.; Ma, G.; Song, J.; Cheng, Z.; Wang, W. Driving safety field modeling focused on heterogeneous traffic flows and cooperative control strategy in highway merging zone. Phys. A Stat. Mech. Its Appl. 2023, 630, 129215. [Google Scholar] [CrossRef] [Scilit]
- Li, L.; Qian, C.; Gan, J.; Zhang, D.; Qu, X.; Xiao, F.; Ran, B. DCoMA: A dynamic coordinative merging assistant strategy for on-ramp vehicles with mixed traffic conditions. Transp. Res. Part C Emerg. Technol. 2024, 165, 104700. [Google Scholar] [CrossRef] [Scilit]
- Liu, Y.; Zhou, A.; Wang, Y.; Peeta, S. Proactive longitudinal control to preclude disruptive lane changes of human-driven vehicles in mixed-flow traffic. Control Eng. Pract. 2023, 136, 105522. [Google Scholar] [CrossRef] [Scilit]
- Chen, G.; Van Woensel, T.; Xu, J.; Luo, Y.; Li, Y. Assessing movement-specific resilience of a signalized road network under lane-level cascading failure. Phys. A Stat. Mech. Its Appl. 2024, 654, 130154. [Google Scholar] [CrossRef] [Scilit]
- Jing, D.; Chen, R.; Yao, E.; Menéndez, M. A hierarchical cooperative merging control strategy for the mixed traffic of CAVs and HDVs. Transp. Res. Part C Emerg. Technol. 2025, 179, 105230. [Google Scholar] [CrossRef] [Scilit]
- Yang, W.; Dong, C.; Chen, X.; Chen, Y.; Wang, H. A cooperative control method for safer on-ramp merging process in heterogeneous traffic flow. Accid. Anal. Prev. 2023, 193, 107324. [Google Scholar] [CrossRef] [Scilit]
- Jiang, Y.; Chen, H.; Xiao, G.; Cong, H.; Yao, Z. A Stackelberg game-based on-ramp merging controller for connected automated vehicles in mixed traffic flow. Transp. Lett. 2025, 17, 423–441. [Google Scholar] [CrossRef] [Scilit]
- Zhang, L.; Zheng, J.; Zhang, Z.; Wang, Z.; Wang, M. Integrated motion planning for on-ramp merging based on Stackelberg game modeling considering interactive characteristics. IEEE Trans. Veh. Technol. 2025, 74, 11762–11776. [Google Scholar] [CrossRef] [Scilit]
- Kesting, A.; Treiber, M.; Helbing, D. General lane-changing model MOBIL for car-following models. Transp. Res. Rec. J. Transp. Res. Board 2007, 1999, 86–94. [Google Scholar] [CrossRef] [Scilit]
- Yang, M.; Wang, X.; Quddus, M. Examining lane change gap acceptance, duration and impact using naturalistic driving data. Transp. Res. Part C Emerg. Technol. 2019, 104, 317–331. [Google Scholar] [CrossRef] [Scilit]
- Zhang, Y.; Xu, Q.; Wang, J.; Wu, K.; Zheng, Z.; Lu, K. A learning-based discretionary lane-change decision-making model with driving style awareness. IEEE Trans. Intell. Transp. Syst. 2023, 24, 68–78. [Google Scholar] [CrossRef] [Scilit]
- Ma, J.; Ma, J.; Zeng, M.; Zou, X.; Luo, Q.; Zhang, Y.; Li, Y. A deep learning approach on traffic states prediction of freeway weaving sections under adverse weather conditions. Sustainability 2025, 17, 7970. [Google Scholar] [CrossRef] [Scilit]
- Chen, J.; Zhou, Y.; Chung, E. An integrated approach to optimal merging sequence generation and trajectory planning of connected automated vehicles for freeway on-ramp merging sections. IEEE Trans. Intell. Transp. Syst. 2024, 25, 1897–1912. [Google Scholar] [CrossRef] [Scilit]
- Jiang, Y.; Man, Z.; Wang, Y.; Yao, Z. Cooperative lane-changing for connected autonomous vehicles merging into dedicated lanes in mixed traffic flow. Expert Syst. Appl. 2024, 252, 124163. [Google Scholar] [CrossRef] [Scilit]
- Li, X.; Chen, B.; Sun, X.; Wang, J.; Fu, X. Speed limit zone length control strategy under mixed traffic flow environment: An approach considering variable speed limit and lane change. J. Transp. Eng. Part A Syst. 2024, 150, 04024073. [Google Scholar] [CrossRef] [Scilit]
- Ali, Y.; Zheng, Z.; Haque, M.M.; Wang, M. A game theory-based approach for modelling mandatory lane-changing behaviour in a connected environment. Transp. Res. Part C Emerg. Technol. 2019, 106, 220–242. [Google Scholar] [CrossRef] [Scilit]
- Wang, B.; Li, Z.; Wang, S.; Li, M.; Ji, A. Modeling bounded rationality in discretionary lane change with the quantal response equilibrium of game theory. Transp. Res. Part B Methodol. 2022, 164, 145–161. [Google Scholar] [CrossRef] [Scilit]
- Jing, D.; Yao, E.; Chen, R.; Menéndez, M. Decentralized human-like ramp merging decision-making and control based on a stochastic potential game. IEEE Trans. Intell. Transp. Syst. 2025, 26, 16724–16734. [Google Scholar] [CrossRef] [Scilit]
- Li, Y.; Chen, G.; Luo, Y.; Chen, B.; Shao, J.; Li, Y. A personalized driving risk assessment and rolling prediction method by integrating multiple indicators. Accid. Anal. Prev. 2025, 221, 108201. [Google Scholar] [CrossRef] [Scilit]
- Yi, R.; Yao, Y.; Pu, F.; Zhou, Y.; Wang, X. Cooperative CAV mandatory lane-change control enabled by V2I. Commun. Transp. Res. 2024, 4, 100126. [Google Scholar] [CrossRef] [Scilit]
- Kamal, M.A.S.; Bakibillah, A.S.M.; Hayakawa, T.; Yamada, K.; Imura, J. Cooperative look-ahead lane change system for improving driving intelligence of automated vehicles in critical scenarios. IEEE Trans. Intell. Veh. 2024, 9, 5876–5888. [Google Scholar] [CrossRef] [Scilit]
- Yao, X.; Du, Z.; Sun, Z.; Calvert, S.C.; Ji, A. Cooperative lane-changing in mixed traffic: A deep reinforcement learning approach. Transp. A Transp. Sci. 2026, 22, 1. [Google Scholar] [CrossRef] [Scilit]
- Li, A.; Chavez Armijos, A.S.; Cassandras, C.G. Robust optimal lane-changing control for connected autonomous vehicles in mixed traffic. Automatica 2025, 174, 112169. [Google Scholar] [CrossRef] [Scilit]
- Yang, W.; Dong, C.; Zhang, Z.; Chen, X.; Wang, H. A dual-module cooperative control method for on-ramp area in heterogeneous traffic flow using reinforcement learning. Eng. Appl. Artif. Intell. 2025, 150, 110584. [Google Scholar] [CrossRef] [Scilit]
- Yang, W.; Dong, C.; Zhang, Z.; Zhang, H.; Wang, H. Cooperative control strategy for heterogeneous traffic flow in multi-lane on-ramp areas with connected and automated technology. Transp. Res. Part C Emerg. Technol. 2025, 178, 105248. [Google Scholar] [CrossRef] [Scilit]
- Chen, J.; Wu, Y.; Zhou, Y.; Chung, E.; Wang, S. Solving connected automated vehicle merging problems: A generalized Benders decomposition-based approach for mixed-integer nonlinear programming. Transp. Res. Part B Methodol. 2025, 200, 103293. [Google Scholar] [CrossRef] [Scilit]
- Gan, Q.; Li, B.; Xiong, Z.; Li, Z.; Liu, Y. Multi-vehicle cooperative decision-making in merging area based on deep multi-agent reinforcement learning. Sustainability 2024, 16, 9646. [Google Scholar] [CrossRef] [Scilit]
- Liu, L.; Li, X.; Li, Y.; Li, J.; Liu, Z. Reinforcement-learning-based multilane cooperative control for on-ramp merging in mixed-autonomy traffic. IEEE Internet Things J. 2024, 11, 39809–39819. [Google Scholar] [CrossRef] [Scilit]
- Zhang, L.; Ding, H.; Cheng, Z.; Zheng, X.; Zhang, W. A traffic control strategy for freeway merging zones cooperating safety and efficiency in the intelligent connected environment of mixed vehicles. Transp. Res. Part C Emerg. Technol. 2025, 179, 105298. [Google Scholar] [CrossRef] [Scilit]
- Liu, J.; Qu, T.; Dong, S.; Gao, B. Lane-changing-enabled eco approach control for autonomous vehicles at a signalized intersection in mixed traffic environment. IET Intell. Transp. Syst. 2025, 19, e70036. [Google Scholar] [CrossRef] [Scilit]
- Tang, Z.; Zhu, H.; Zhang, X.; Iryo-Asano, M.; Nakamura, H. A novel hierarchical cooperative merging control model of connected and automated vehicles featuring flexible merging positions in system optimization. Transp. Res. Part C Emerg. Technol. 2022, 138, 103650. [Google Scholar] [CrossRef] [Scilit]
- Yuan, Y.; Yuan, Y.; Yuan, B.; Li, X. Cooperative bus eco-approaching and lane-changing strategy in mixed connected and automated traffic environment. Transp. Res. Part C Emerg. Technol. 2024, 169, 104907. [Google Scholar] [CrossRef] [Scilit]
- Dong, S.; Gao, X.; Mostafavi, A.; Gao, J.; Gangwal, U. Characterizing resilience of flood-disrupted dynamic transportation network through the lens of link reliability and stability. Reliab. Eng. Syst. Saf. 2023, 232, 109071. [Google Scholar] [CrossRef] [Scilit]
- Fan, H.; Gong, X.; Lyu, J. Resilience assessment of strait/canal: A rule-based Bayesian network framework. Transp. Res. Part D Transp. Environ. 2023, 124, 103960. [Google Scholar] [CrossRef] [Scilit]
- Wu, Y.; Chen, S. Resilience modeling and pre-hazard mitigation planning of transportation network to support post-earthquake emergency medical response. Reliab. Eng. Syst. Saf. 2023, 230, 108918. [Google Scholar] [CrossRef] [Scilit]
- Bruneau, M.; Chang, S.E.; Eguchi, R.T.; Lee, G.C.; O’Rourke, T.D.; Reinhorn, A.M.; Shinozuka, M.; Tierney, K.; Wallace, W.A.; von Winterfeldt, D. A framework to quantitatively assess and enhance the seismic resilience of communities. Earthq. Spectra 2003, 19, 733–752. [Google Scholar] [CrossRef] [Scilit]
- Guo, H.; Xie, K.; Keyvan-Ekbatani, M. Modeling driver’s evasive behavior during safety-critical lane changes: Two-dimensional time-to-collision and deep reinforcement learning. Accid. Anal. Prev. 2023, 186, 107063. [Google Scholar] [CrossRef] [Scilit]
- Wang, J.; Wu, J.; Li, Y. The driving safety field based on driver–vehicle–road interactions. IEEE Trans. Intell. Transp. Syst. 2015, 16, 2203–2214. [Google Scholar] [CrossRef] [Scilit]
- Coello Coello, C.A.; Pulido, G.T.; Lechuga, M.S. Handling multiple objectives with particle swarm optimization. IEEE Trans. Evol. Comput. 2004, 8, 256–279. [Google Scholar] [CrossRef] [Scilit]
- Opricovic, S.; Tzeng, G.H. Compromise solution by MCDM methods: A comparative analysis of VIKOR and TOPSIS. Eur. J. Oper. Res. 2004, 156, 445–455. [Google Scholar] [CrossRef] [Scilit]
- Jiang, C.; Lu, J.J.; Jiang, Y.; Cai, X.; Ni, A. Developing a traffic management framework for coastal expressway bridges under adverse weather conditions: Case study of rain day in Shenzhen, China. Discret. Dyn. Nat. Soc. 2015, 2015, 218672. [Google Scholar] [CrossRef] [Scilit][Green Version]
- Jeihani, M.; James, P.; Saka, A.A.; Ardeshiri, A. Traffic recovery time estimation under different flow regimes in traffic simulation. J. Traffic Transp. Eng. Engl. Ed. 2015, 2, 291–300. [Google Scholar] [CrossRef] [Scilit]
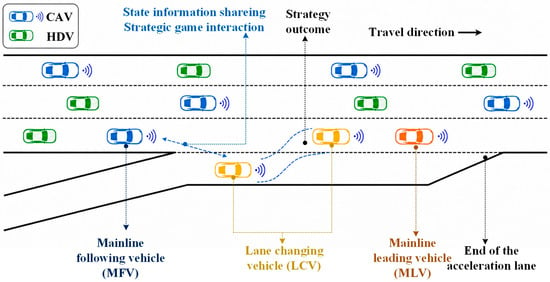
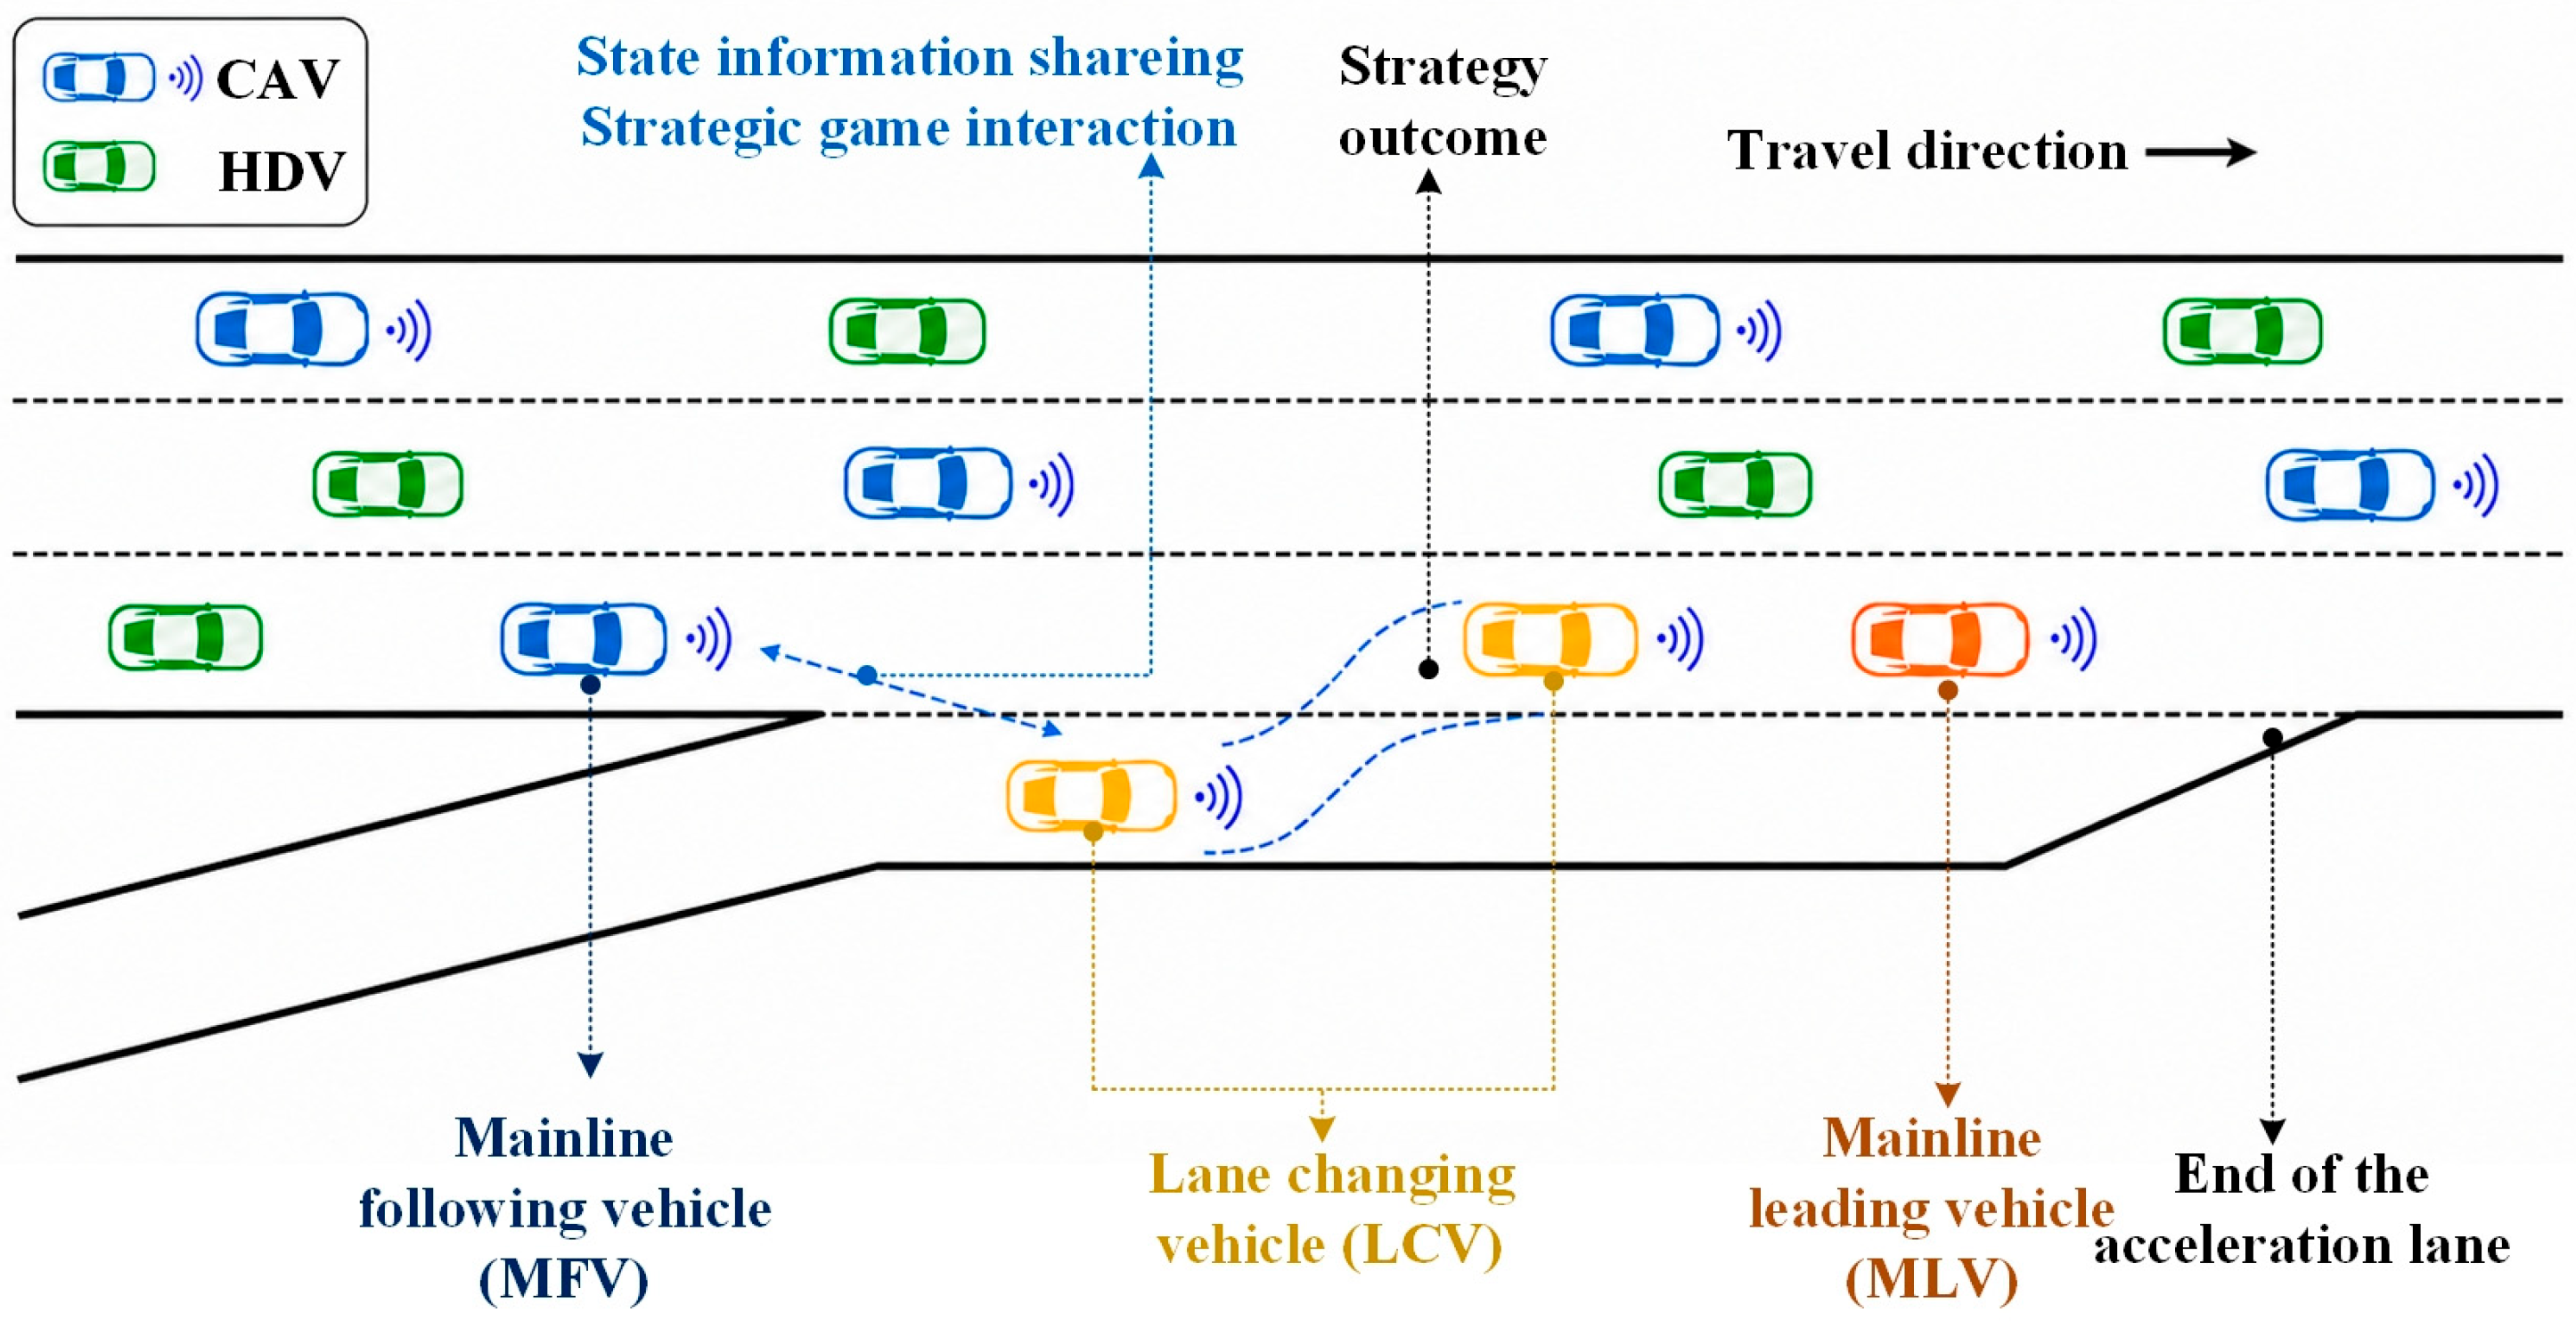
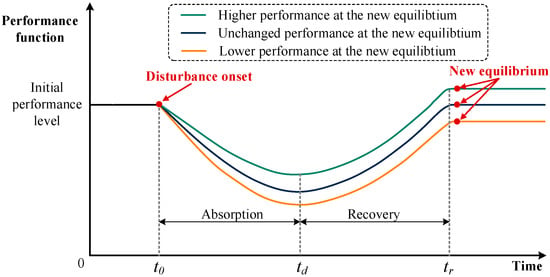
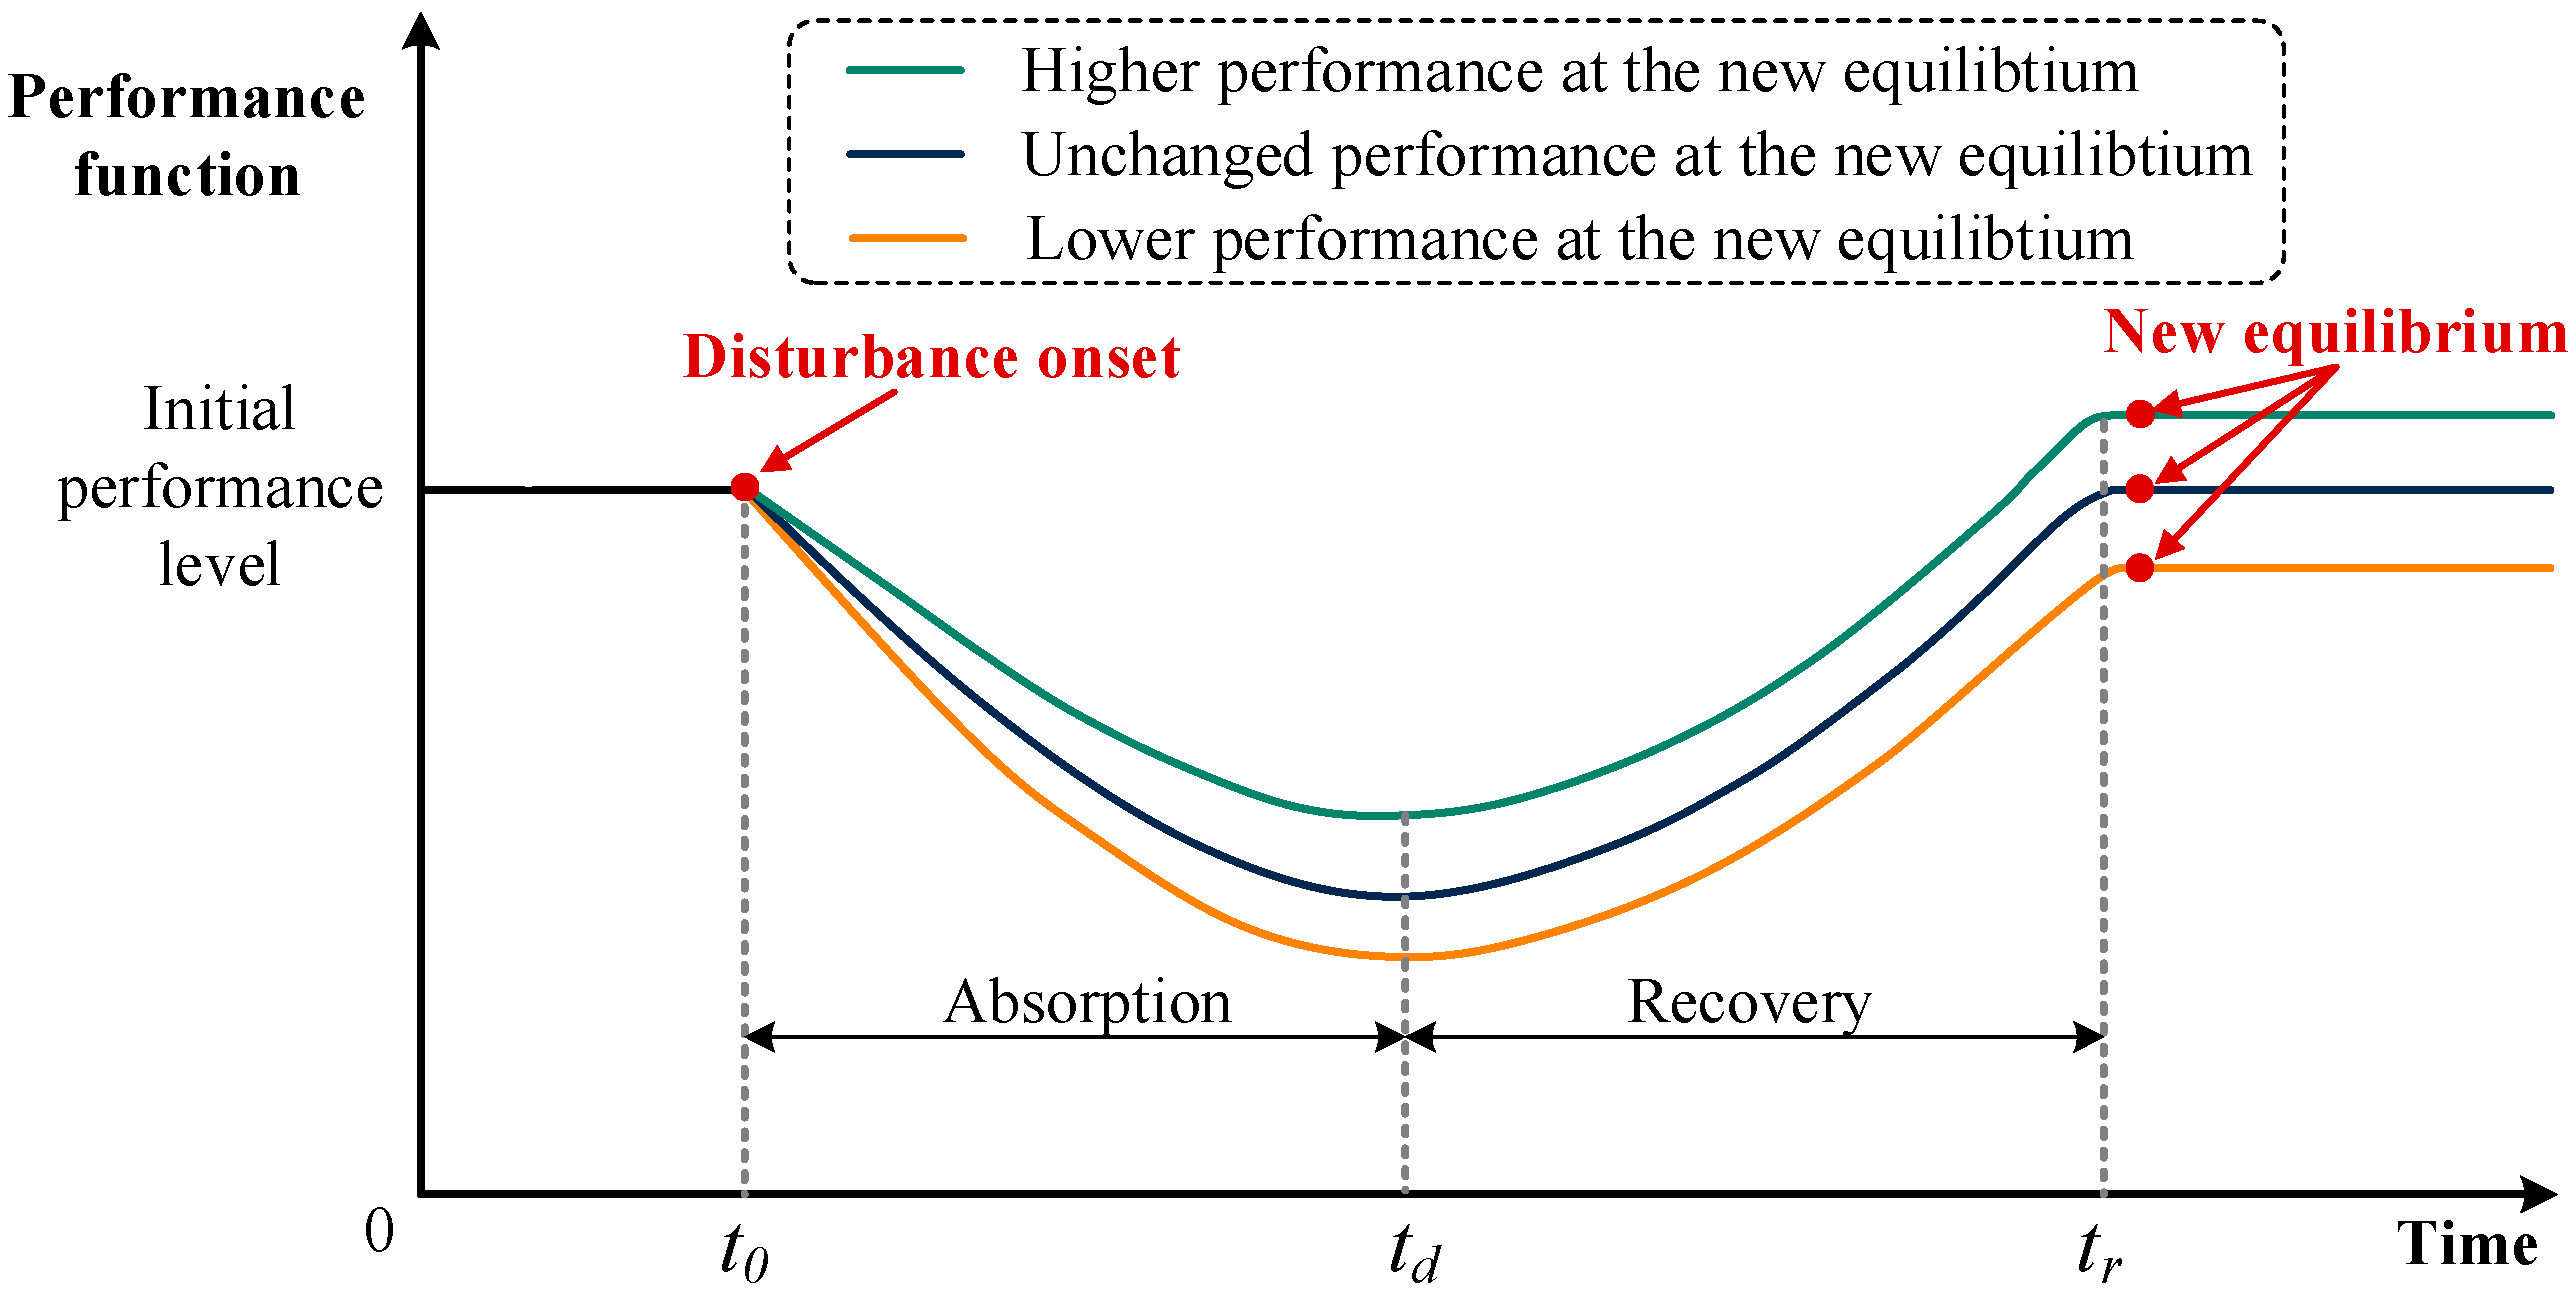
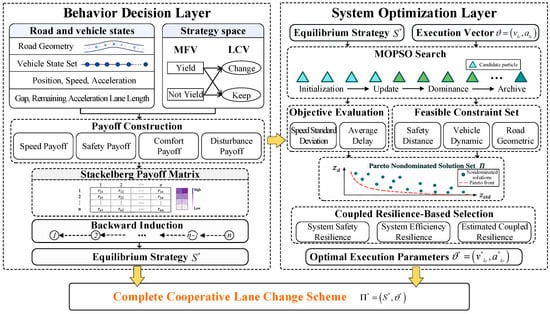
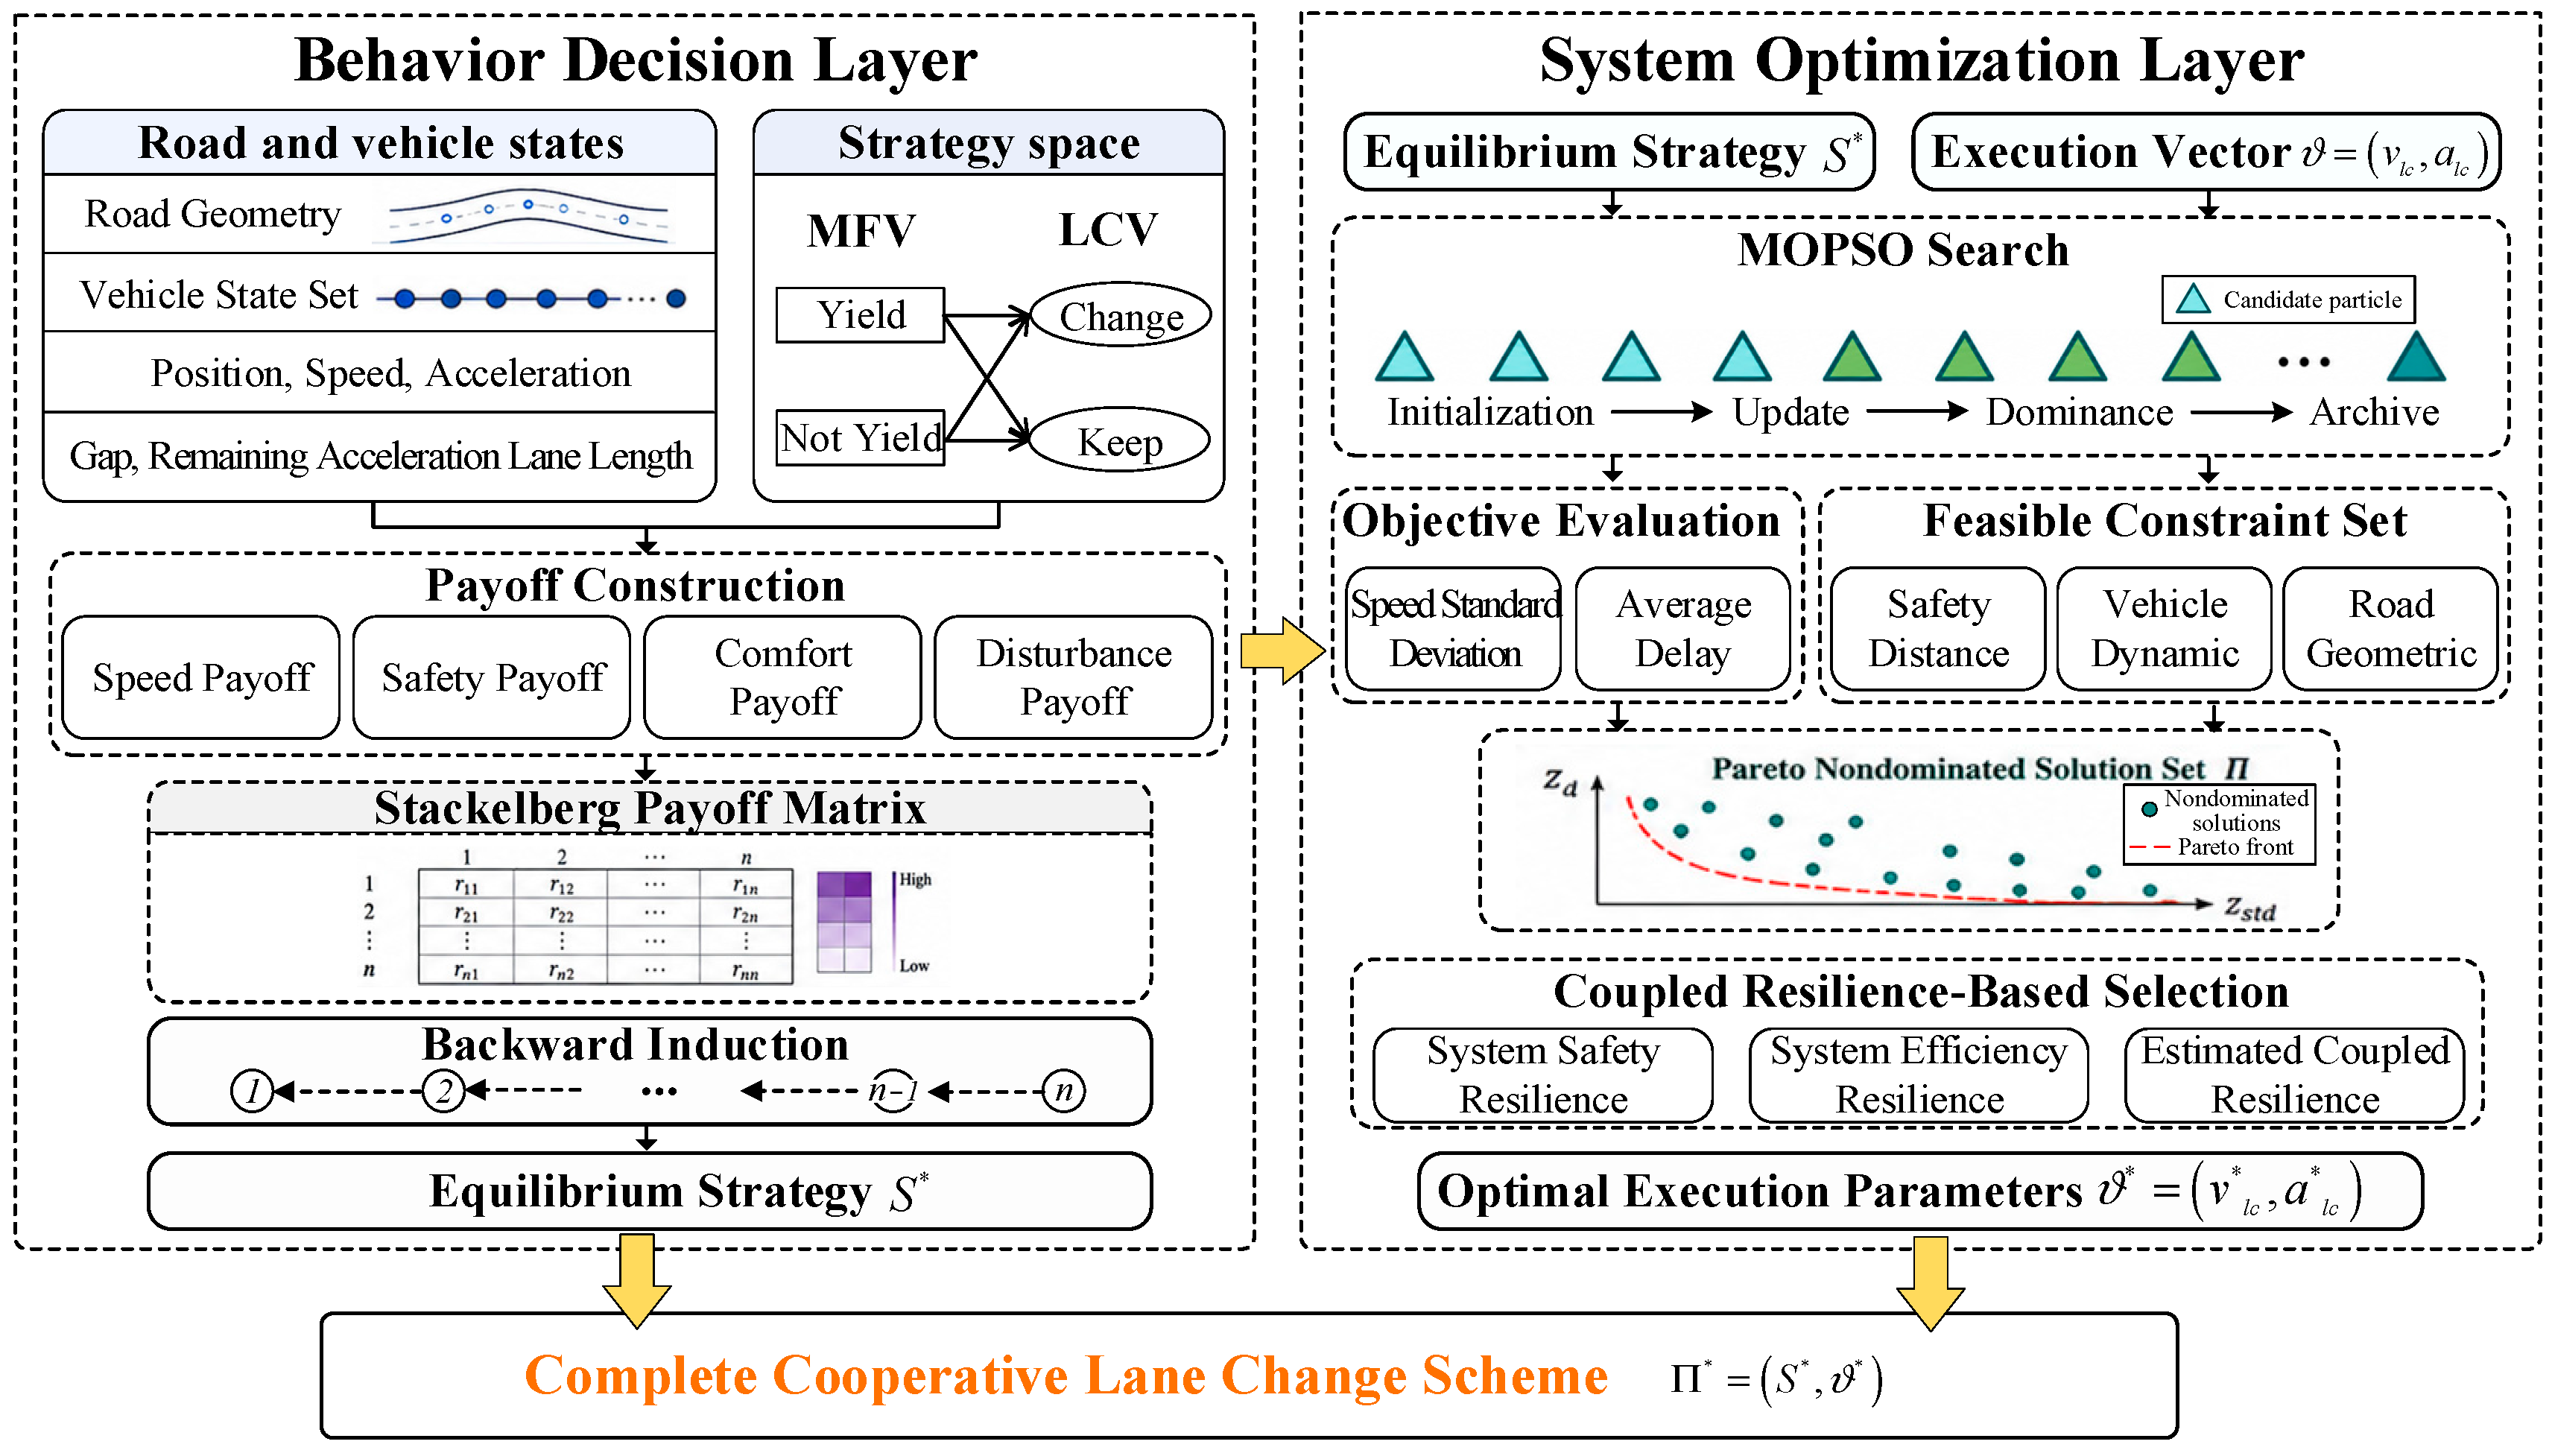
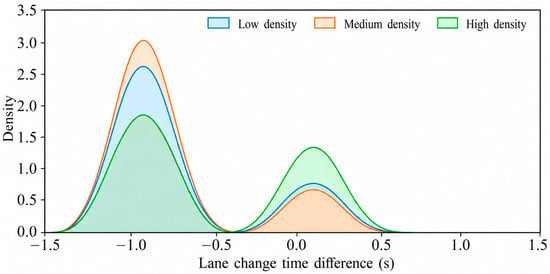
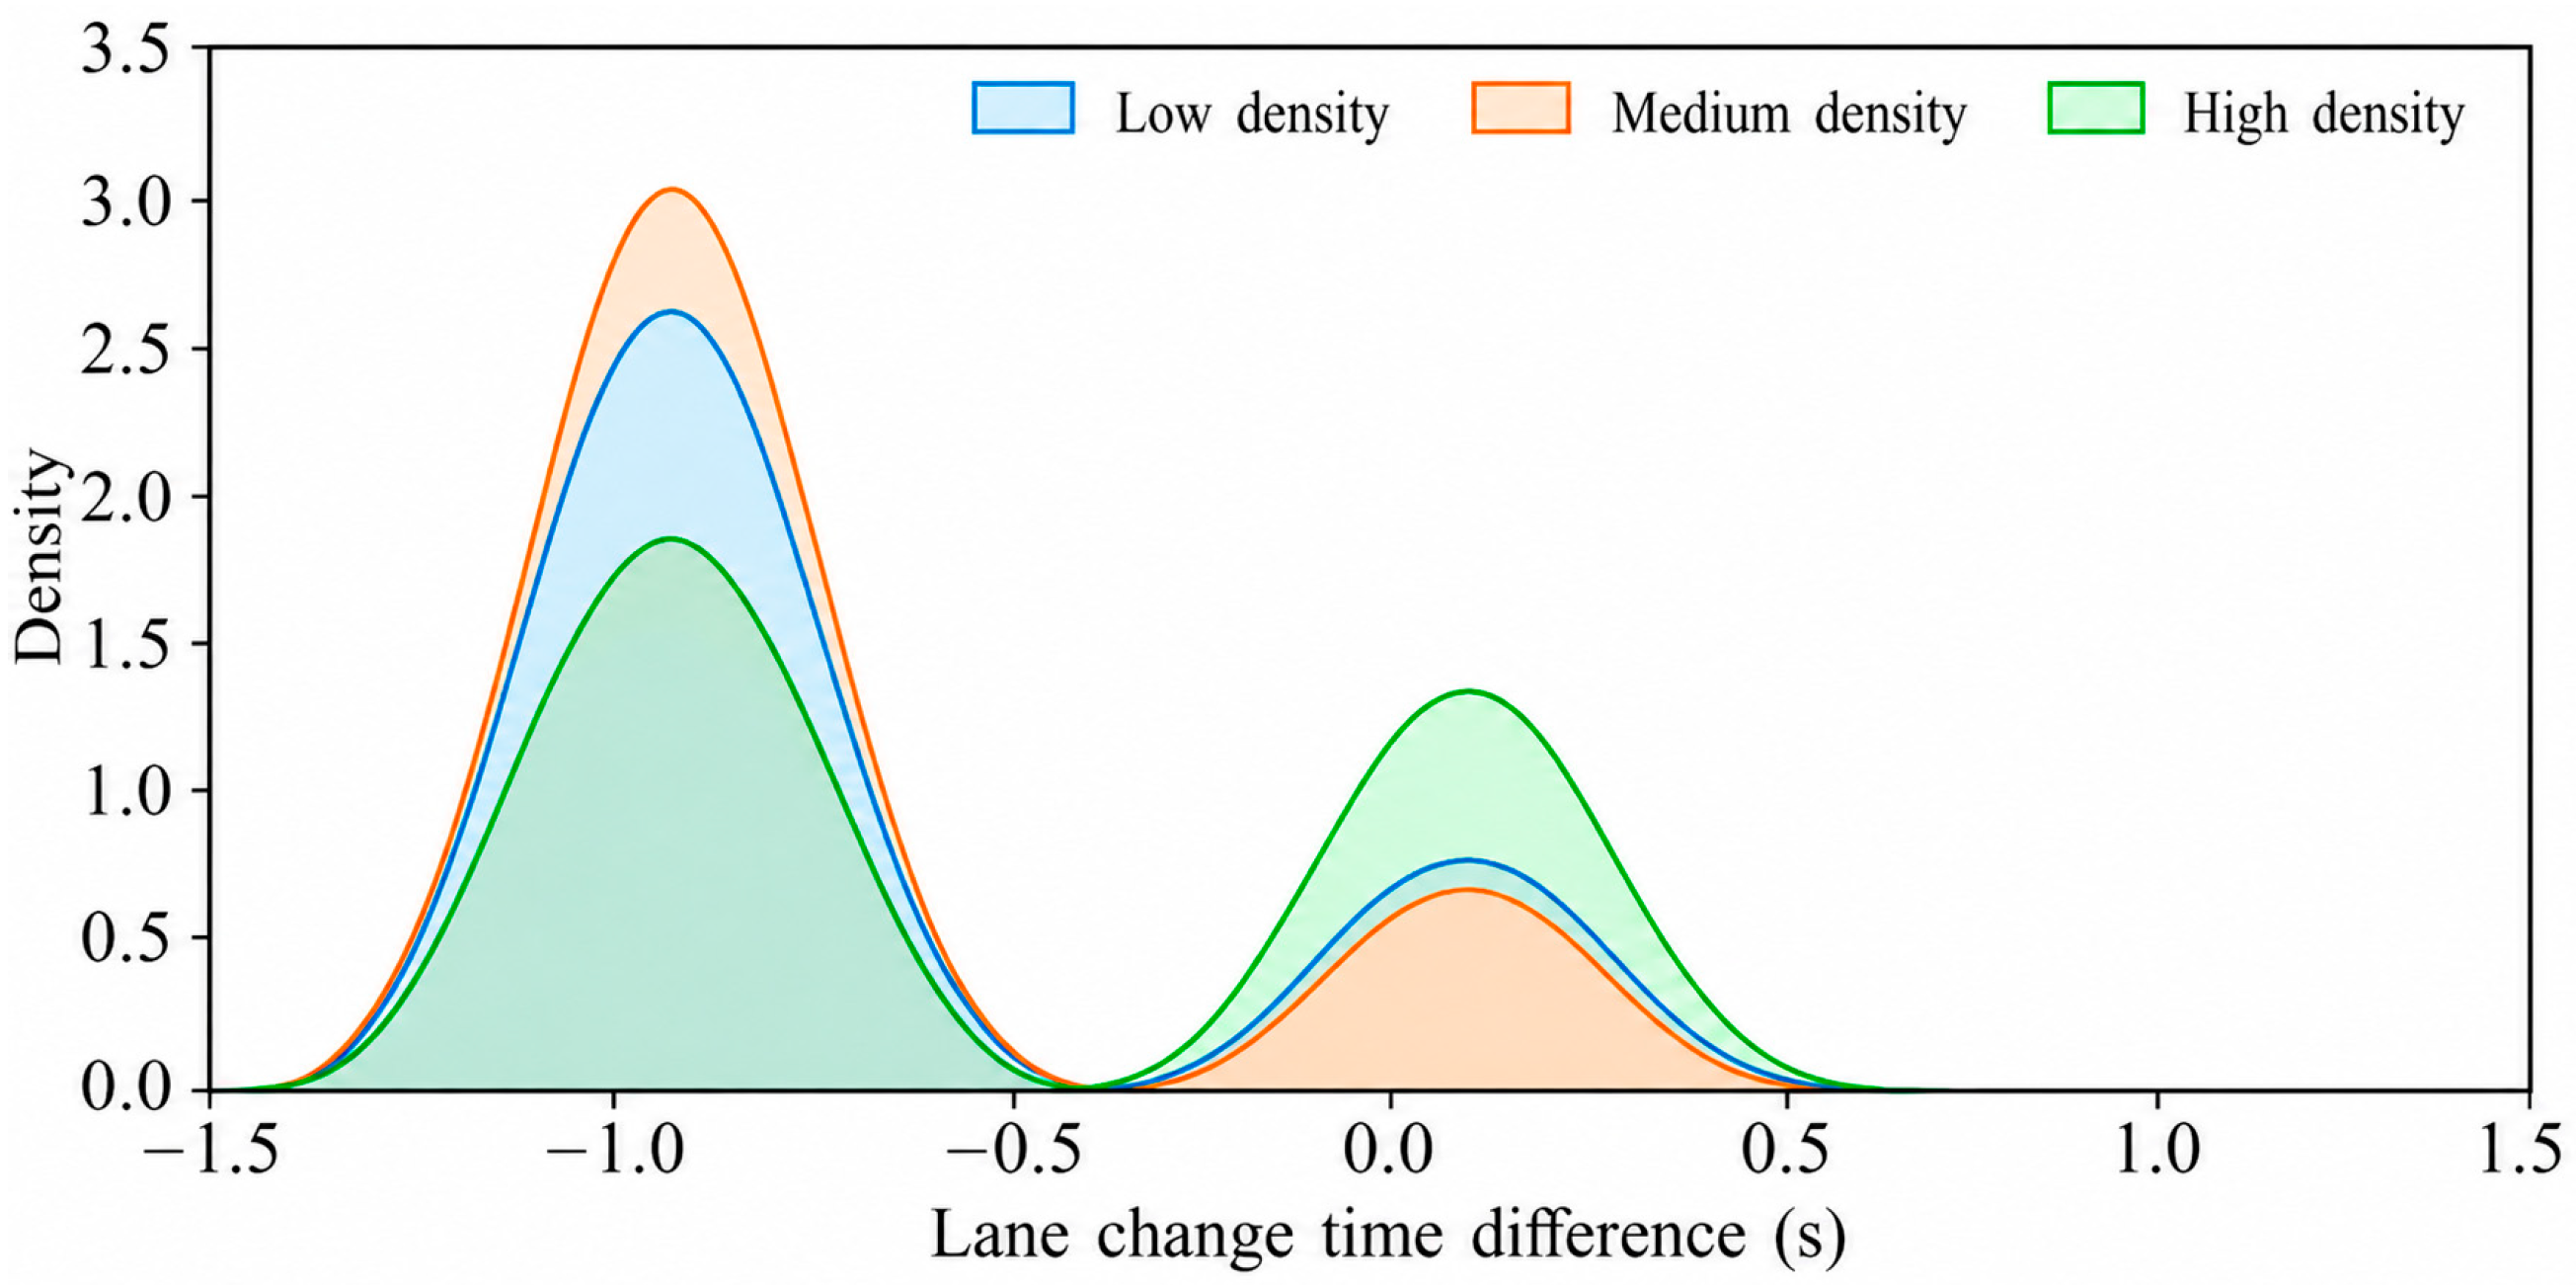
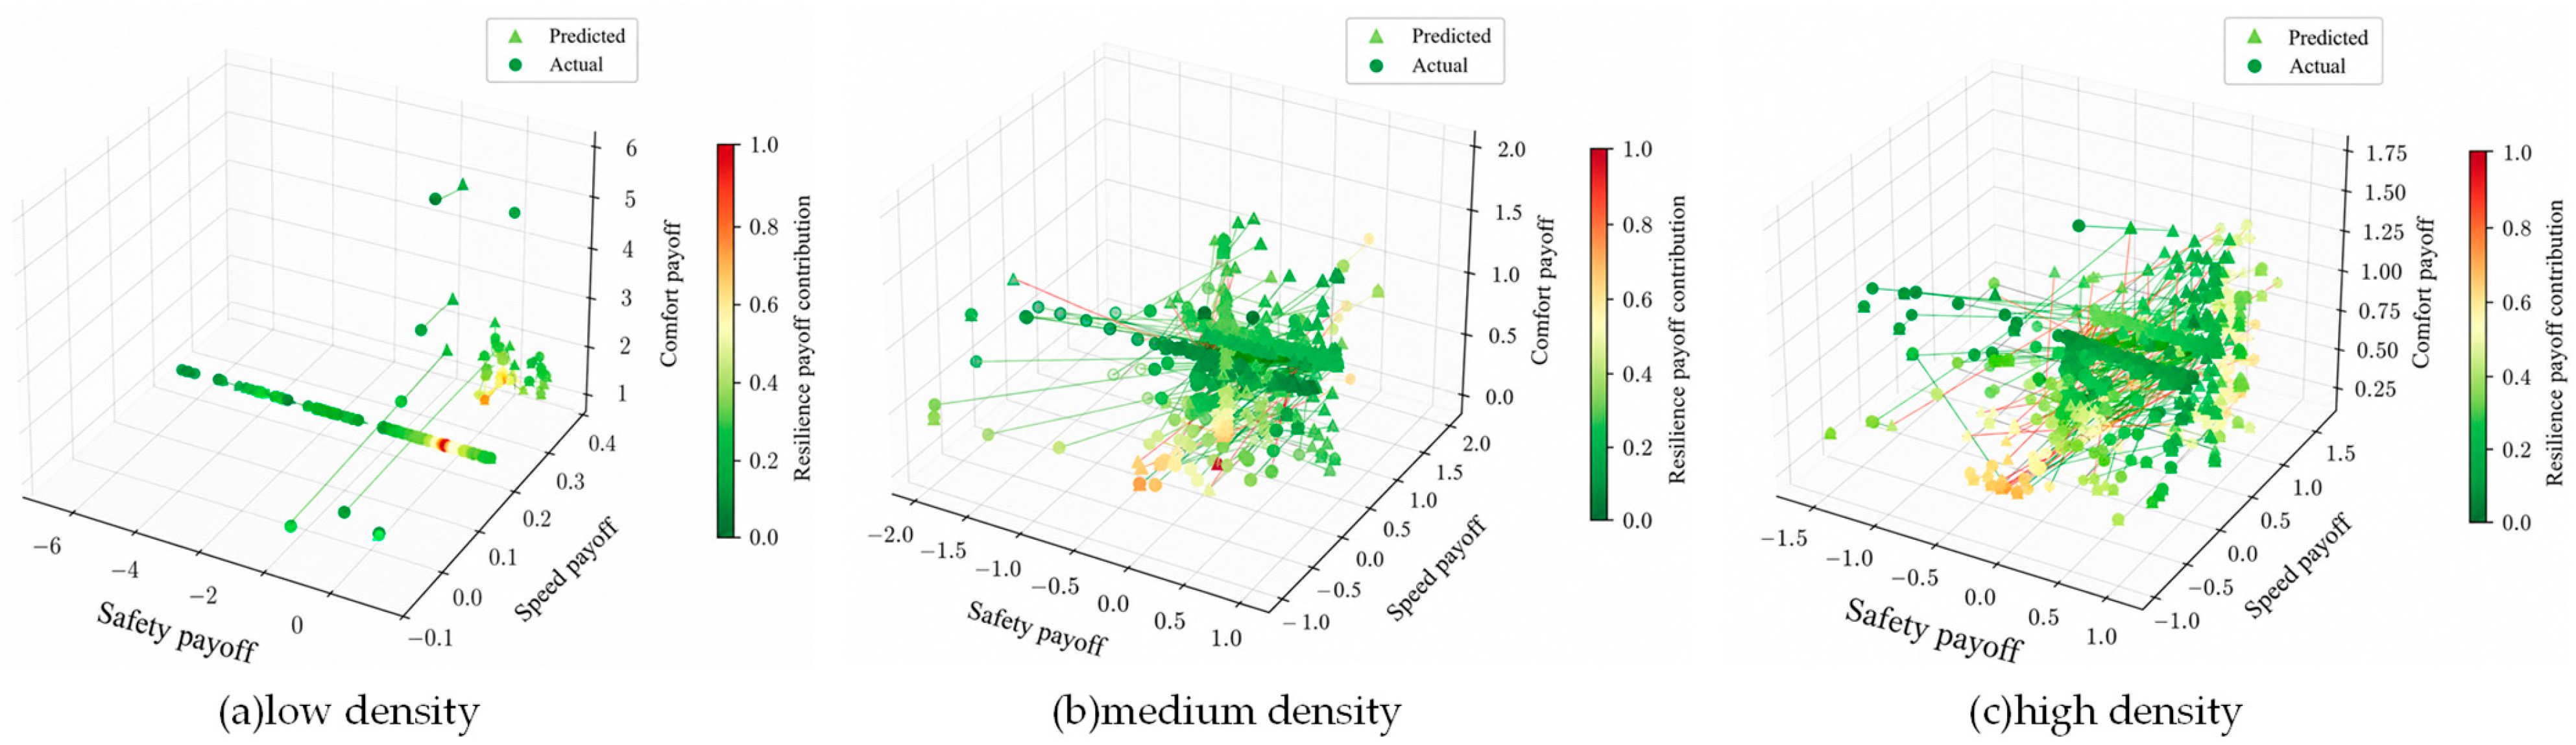
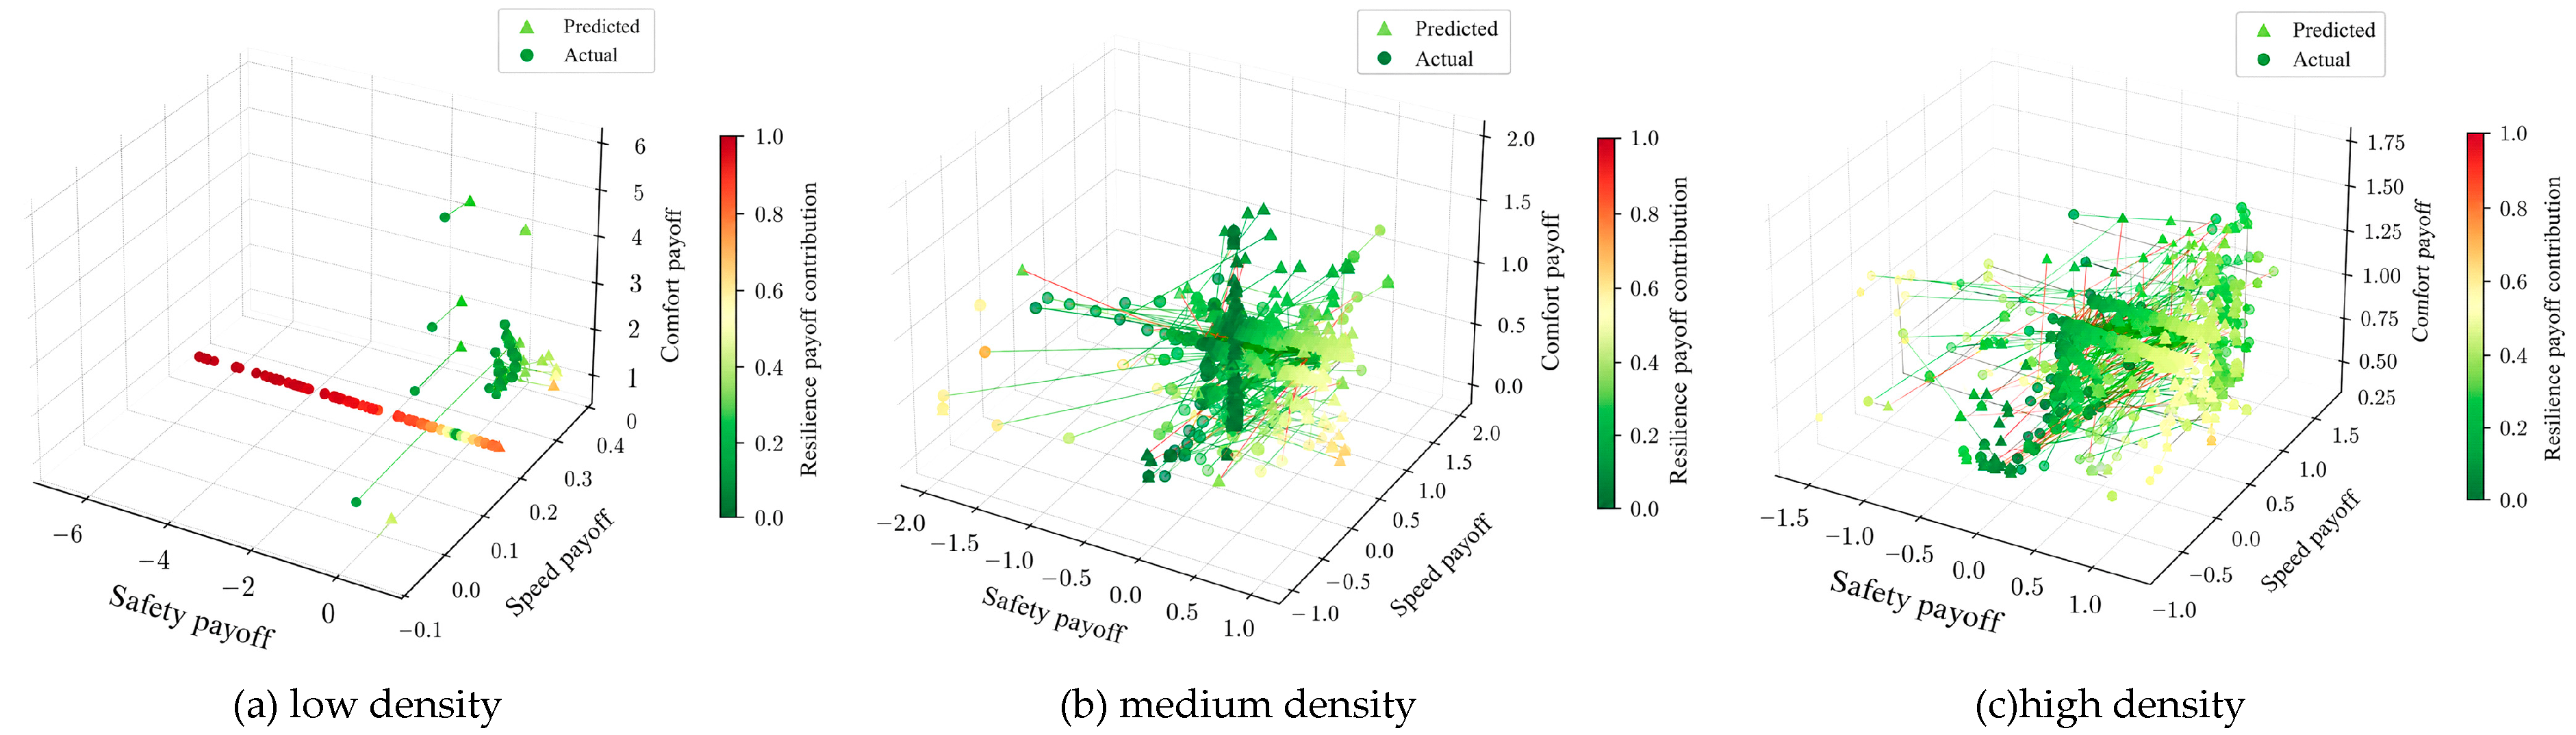
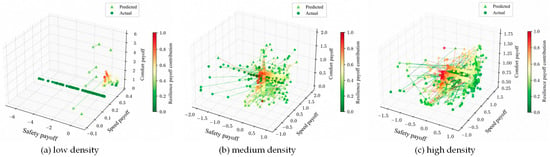
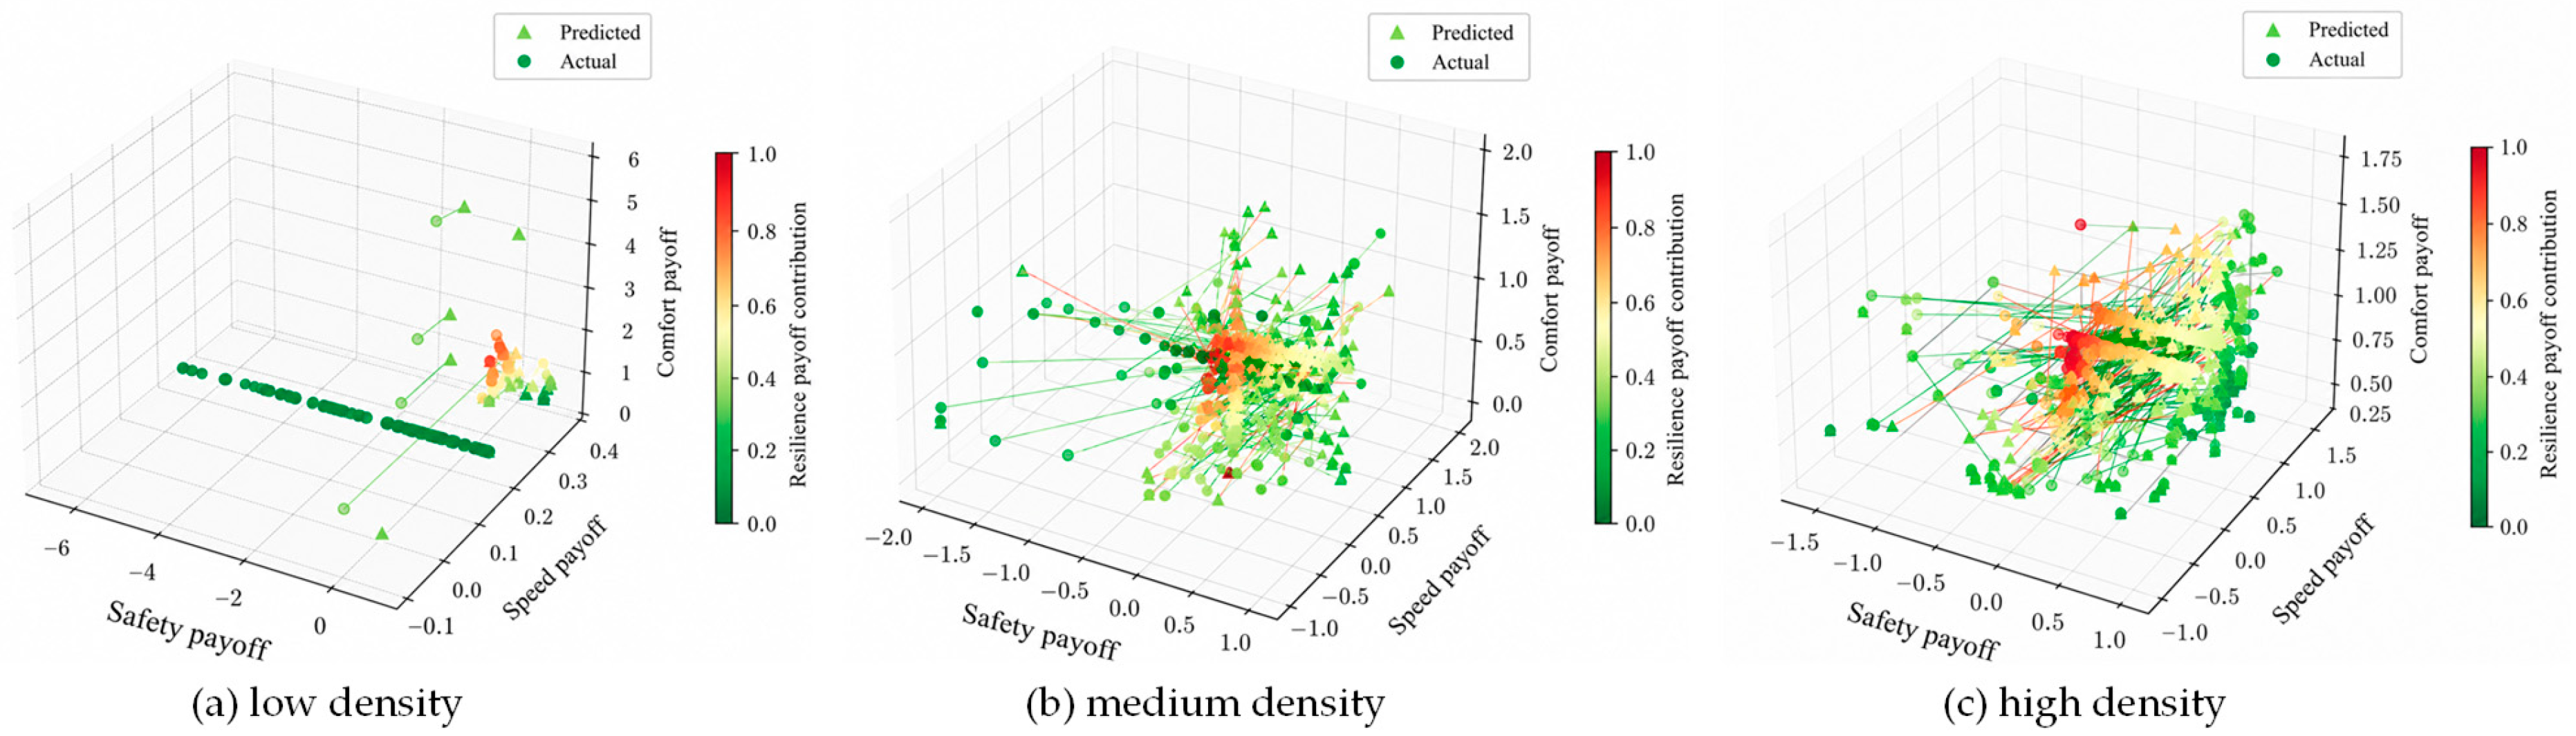
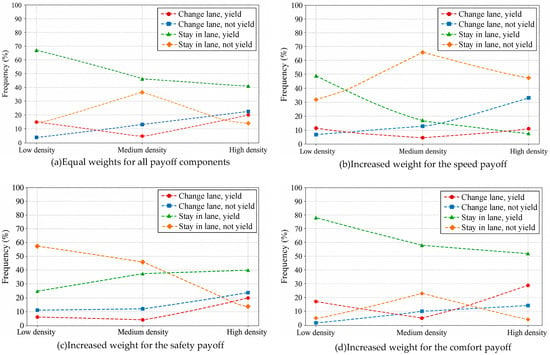
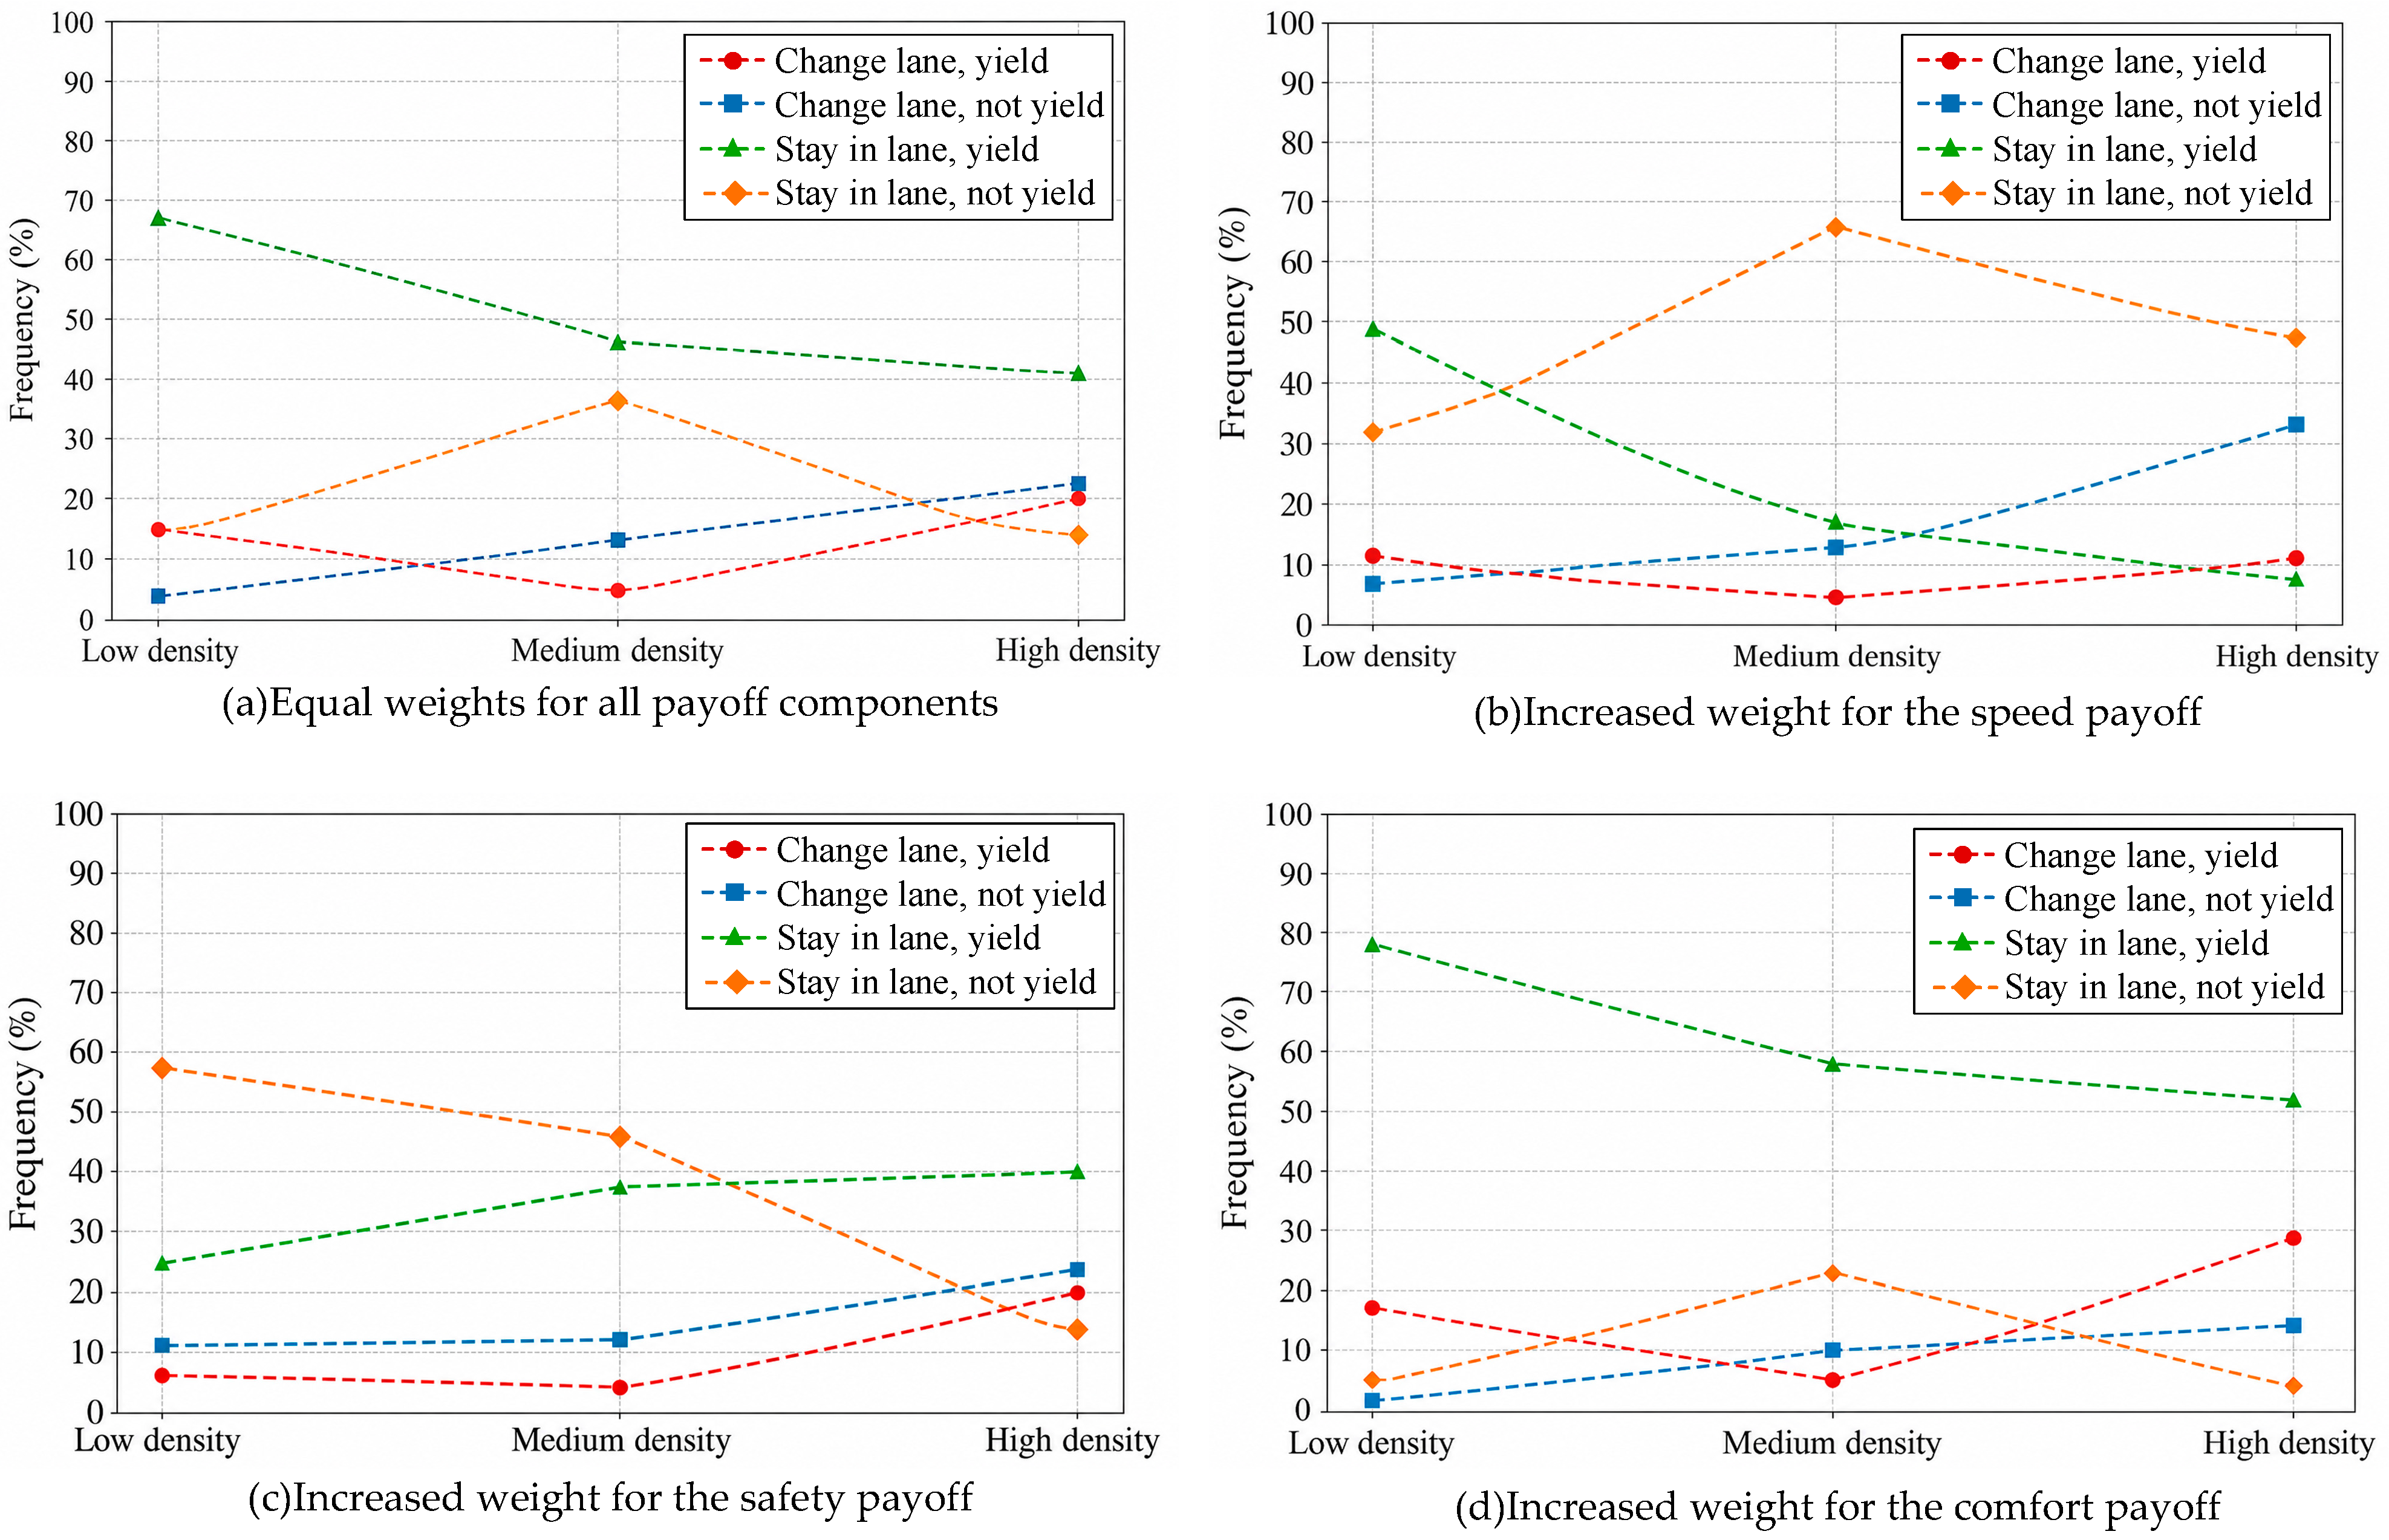
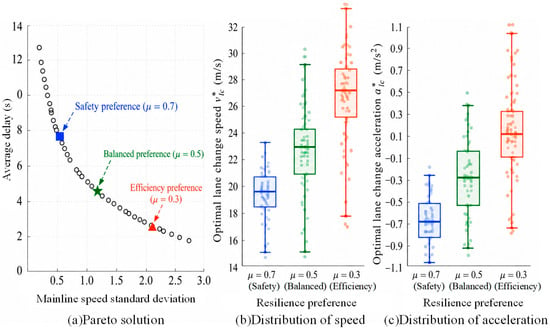
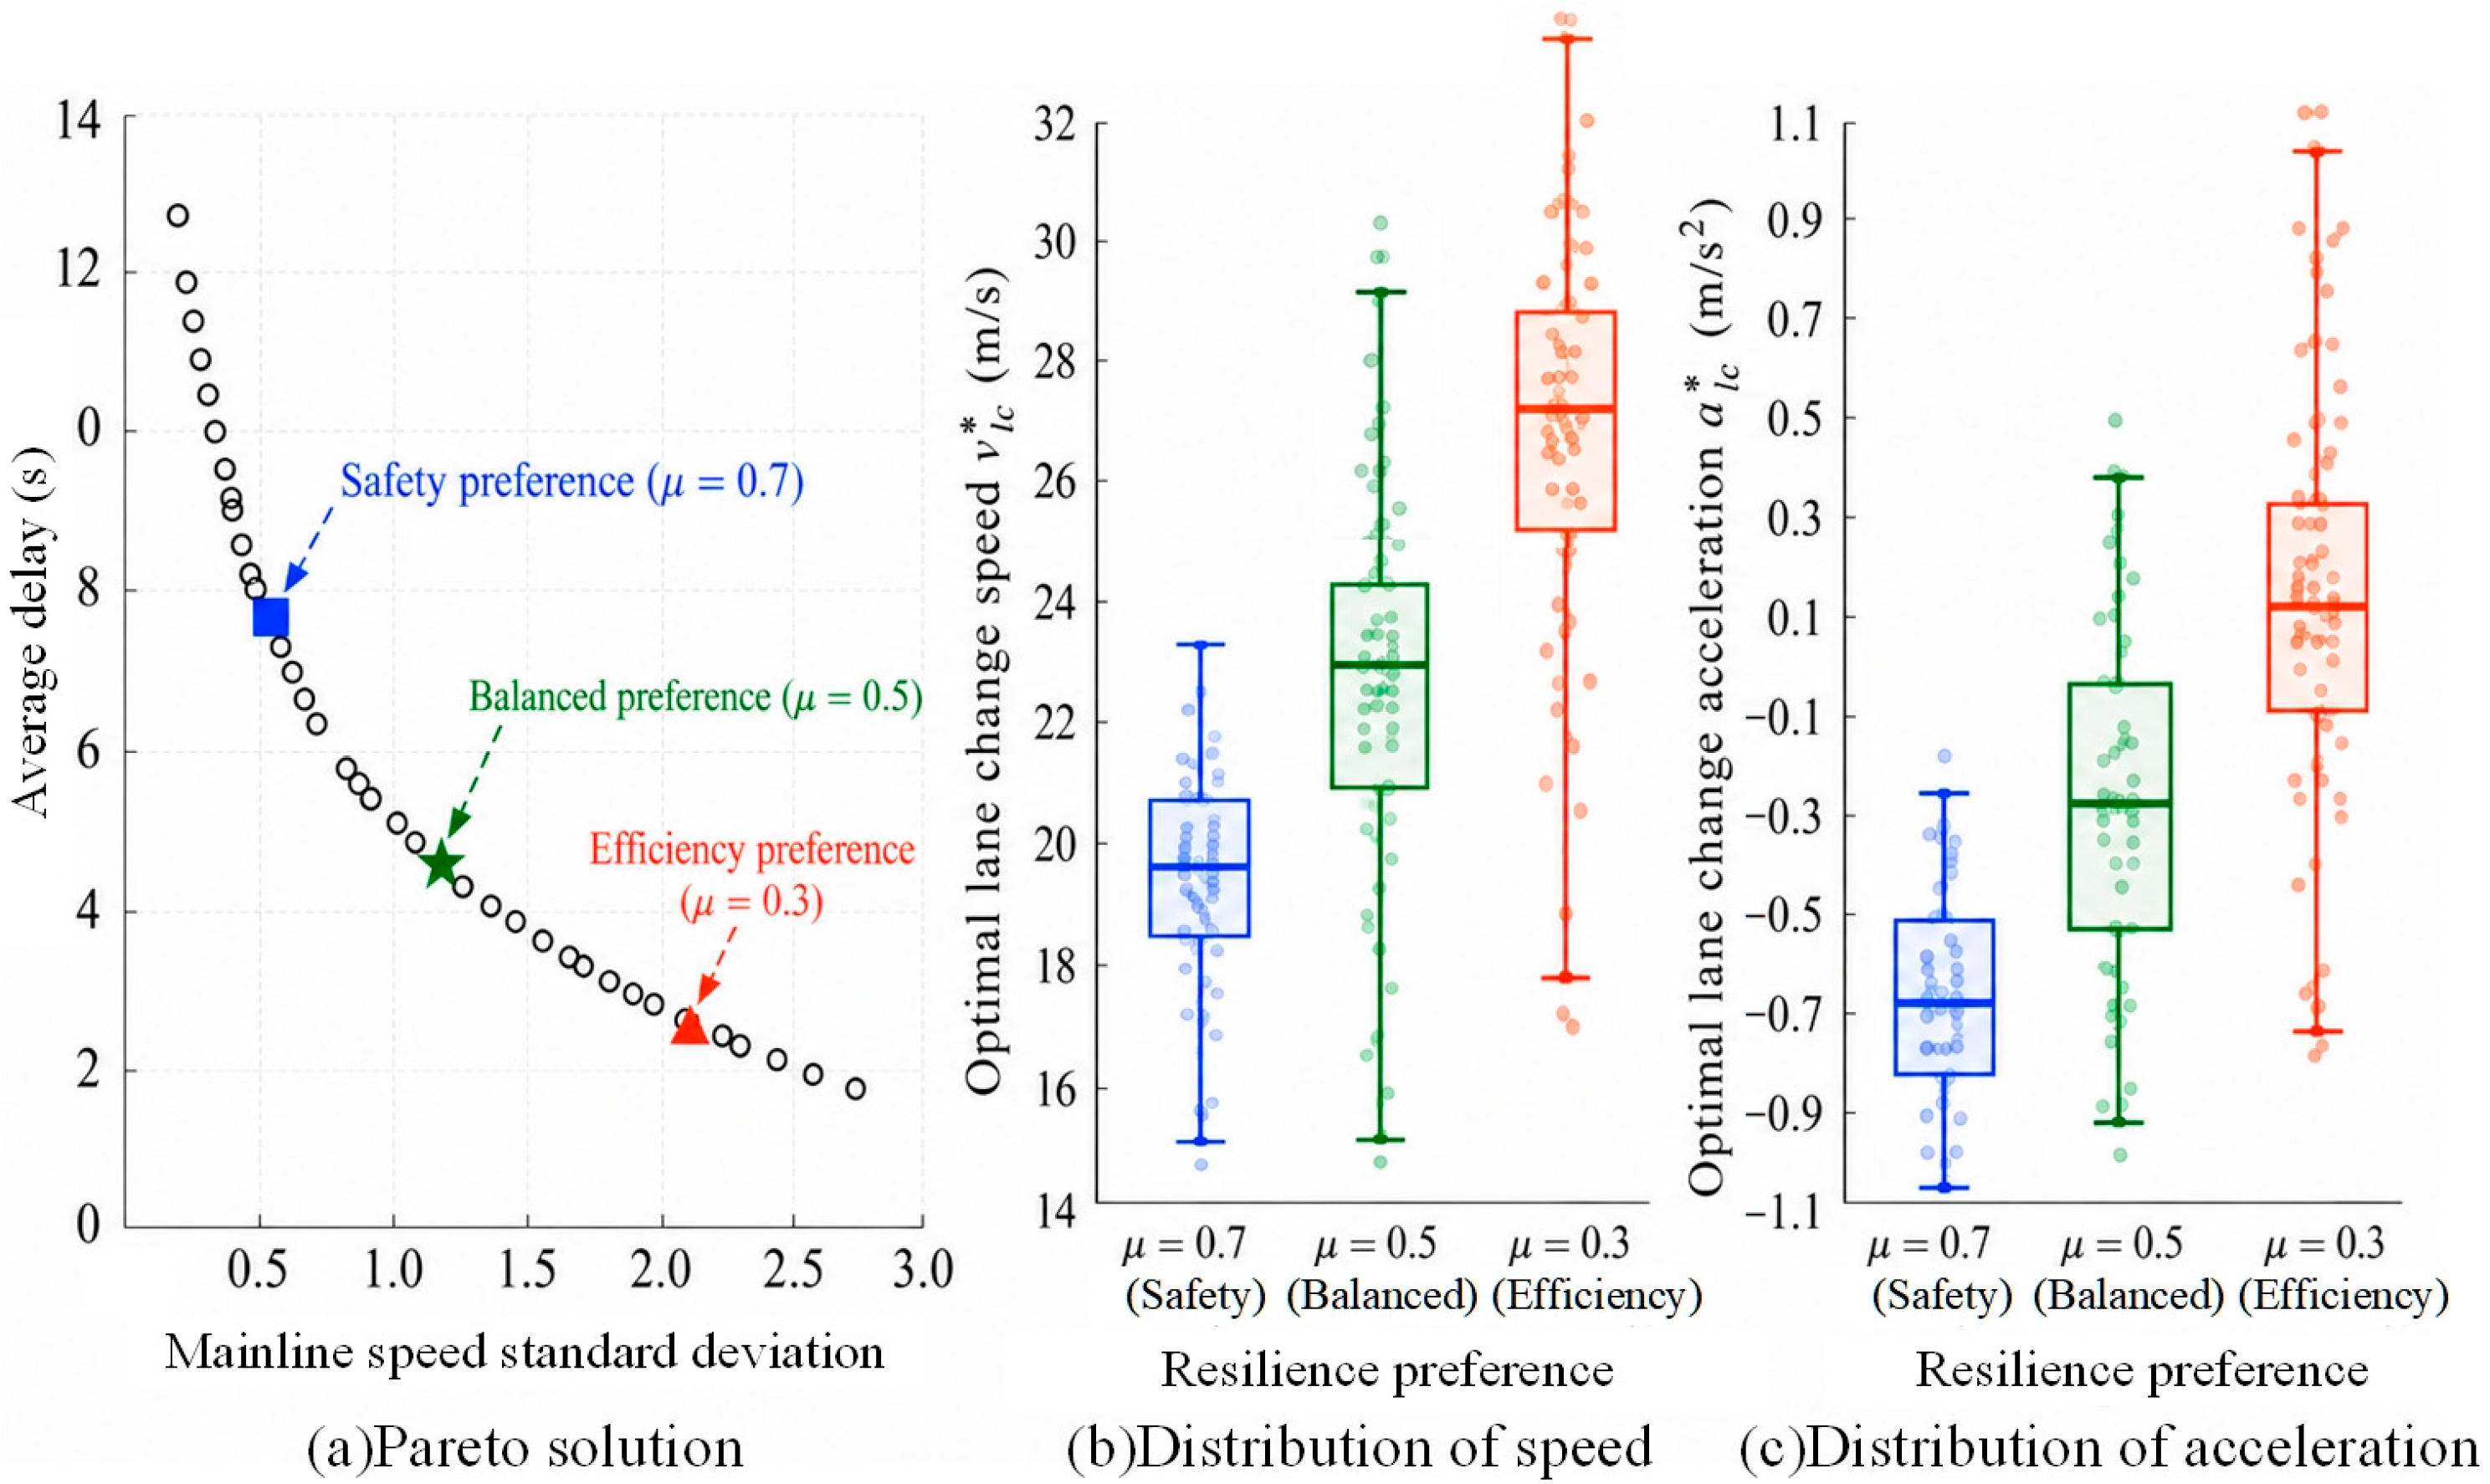
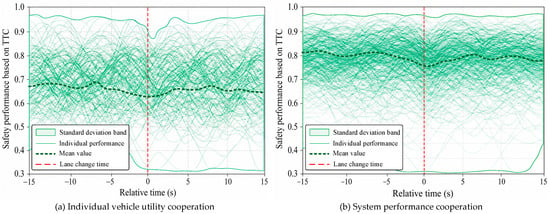
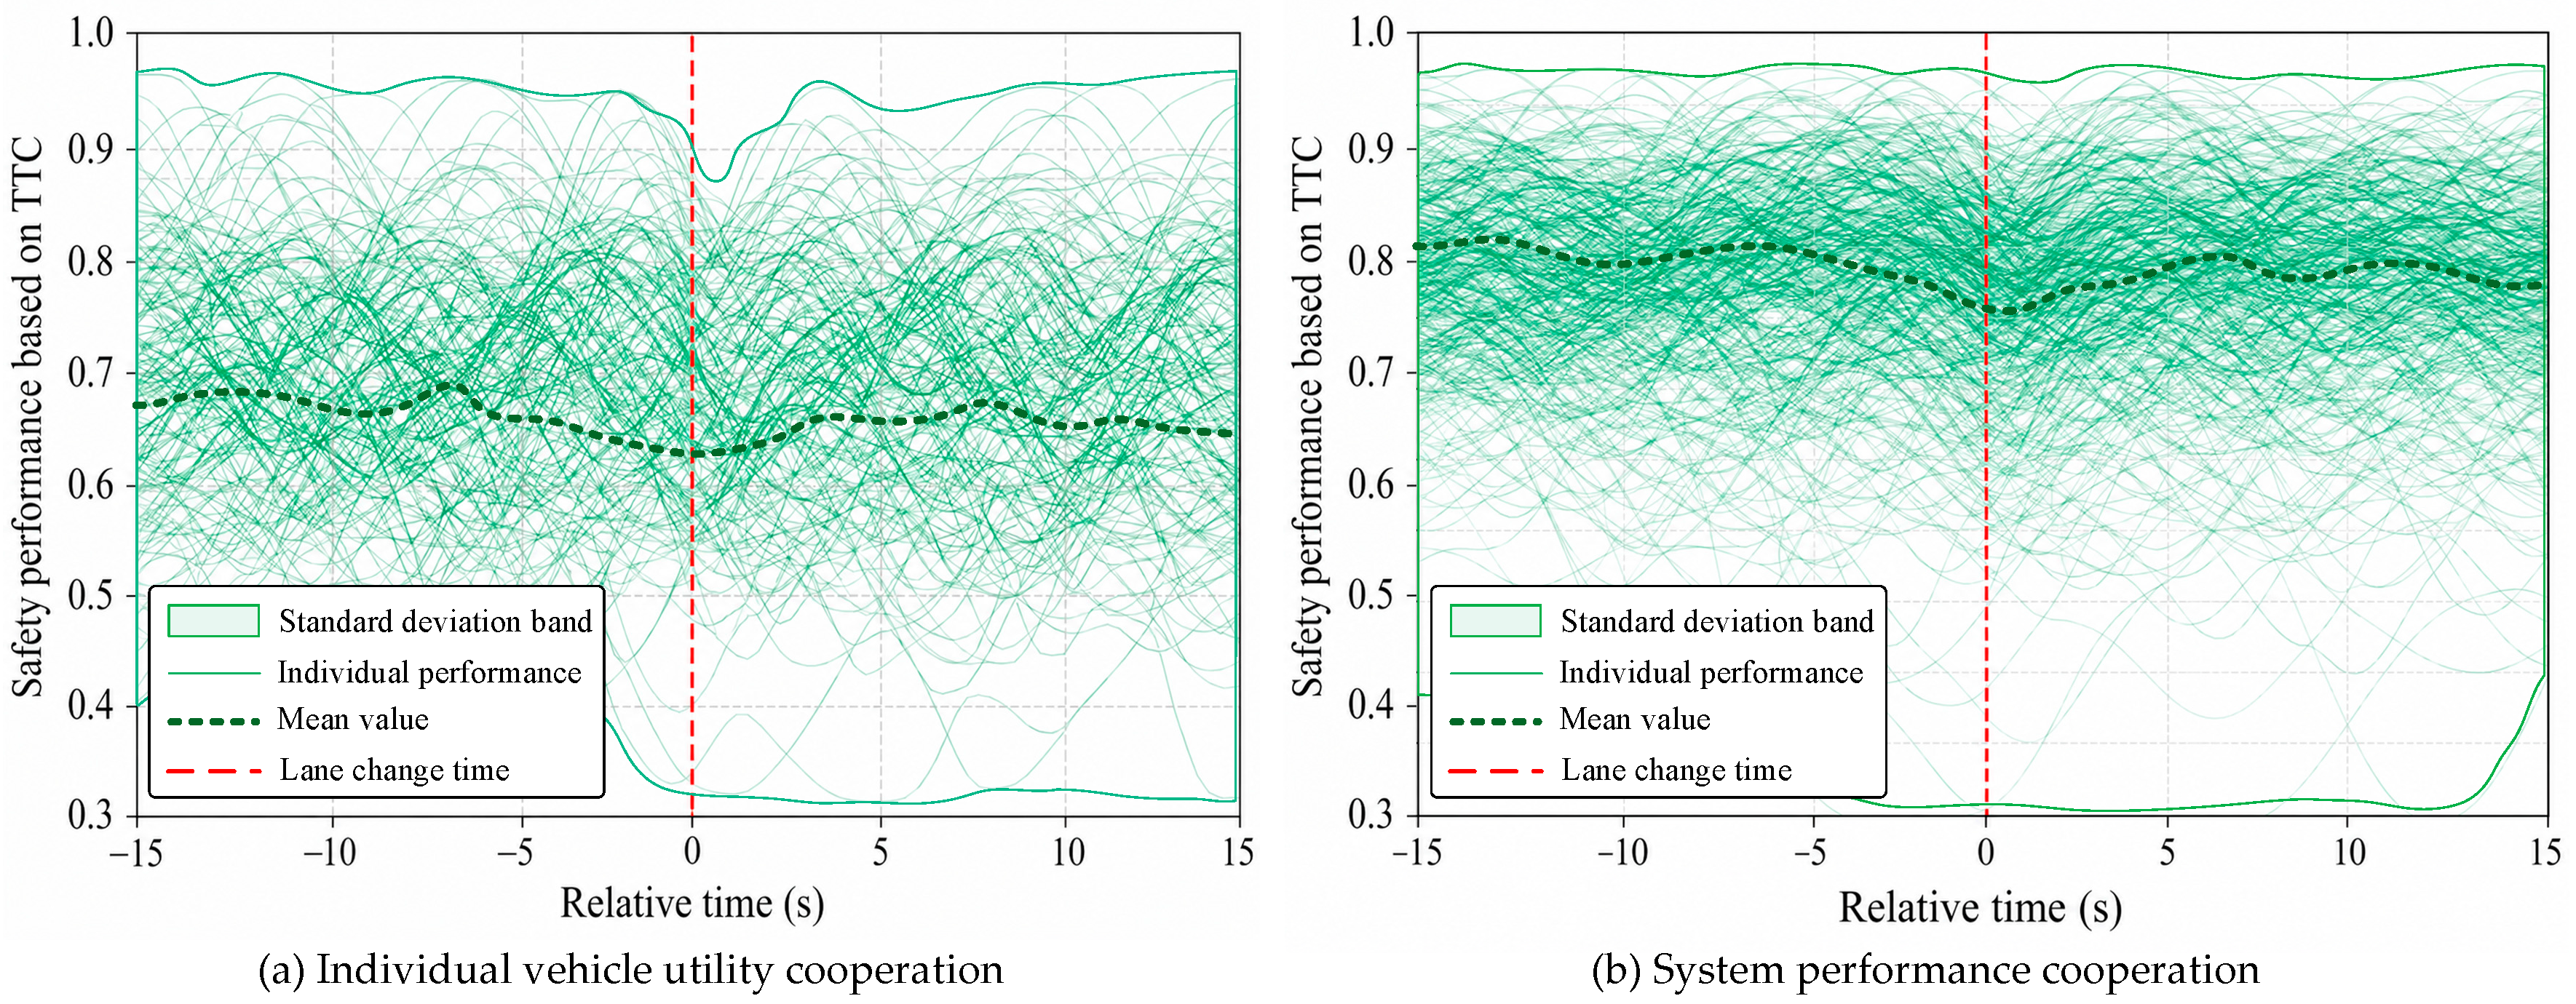
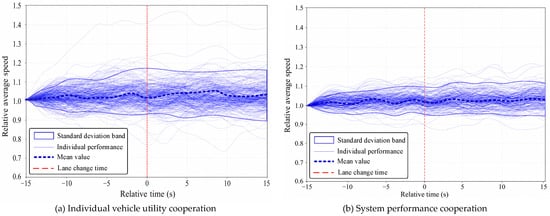
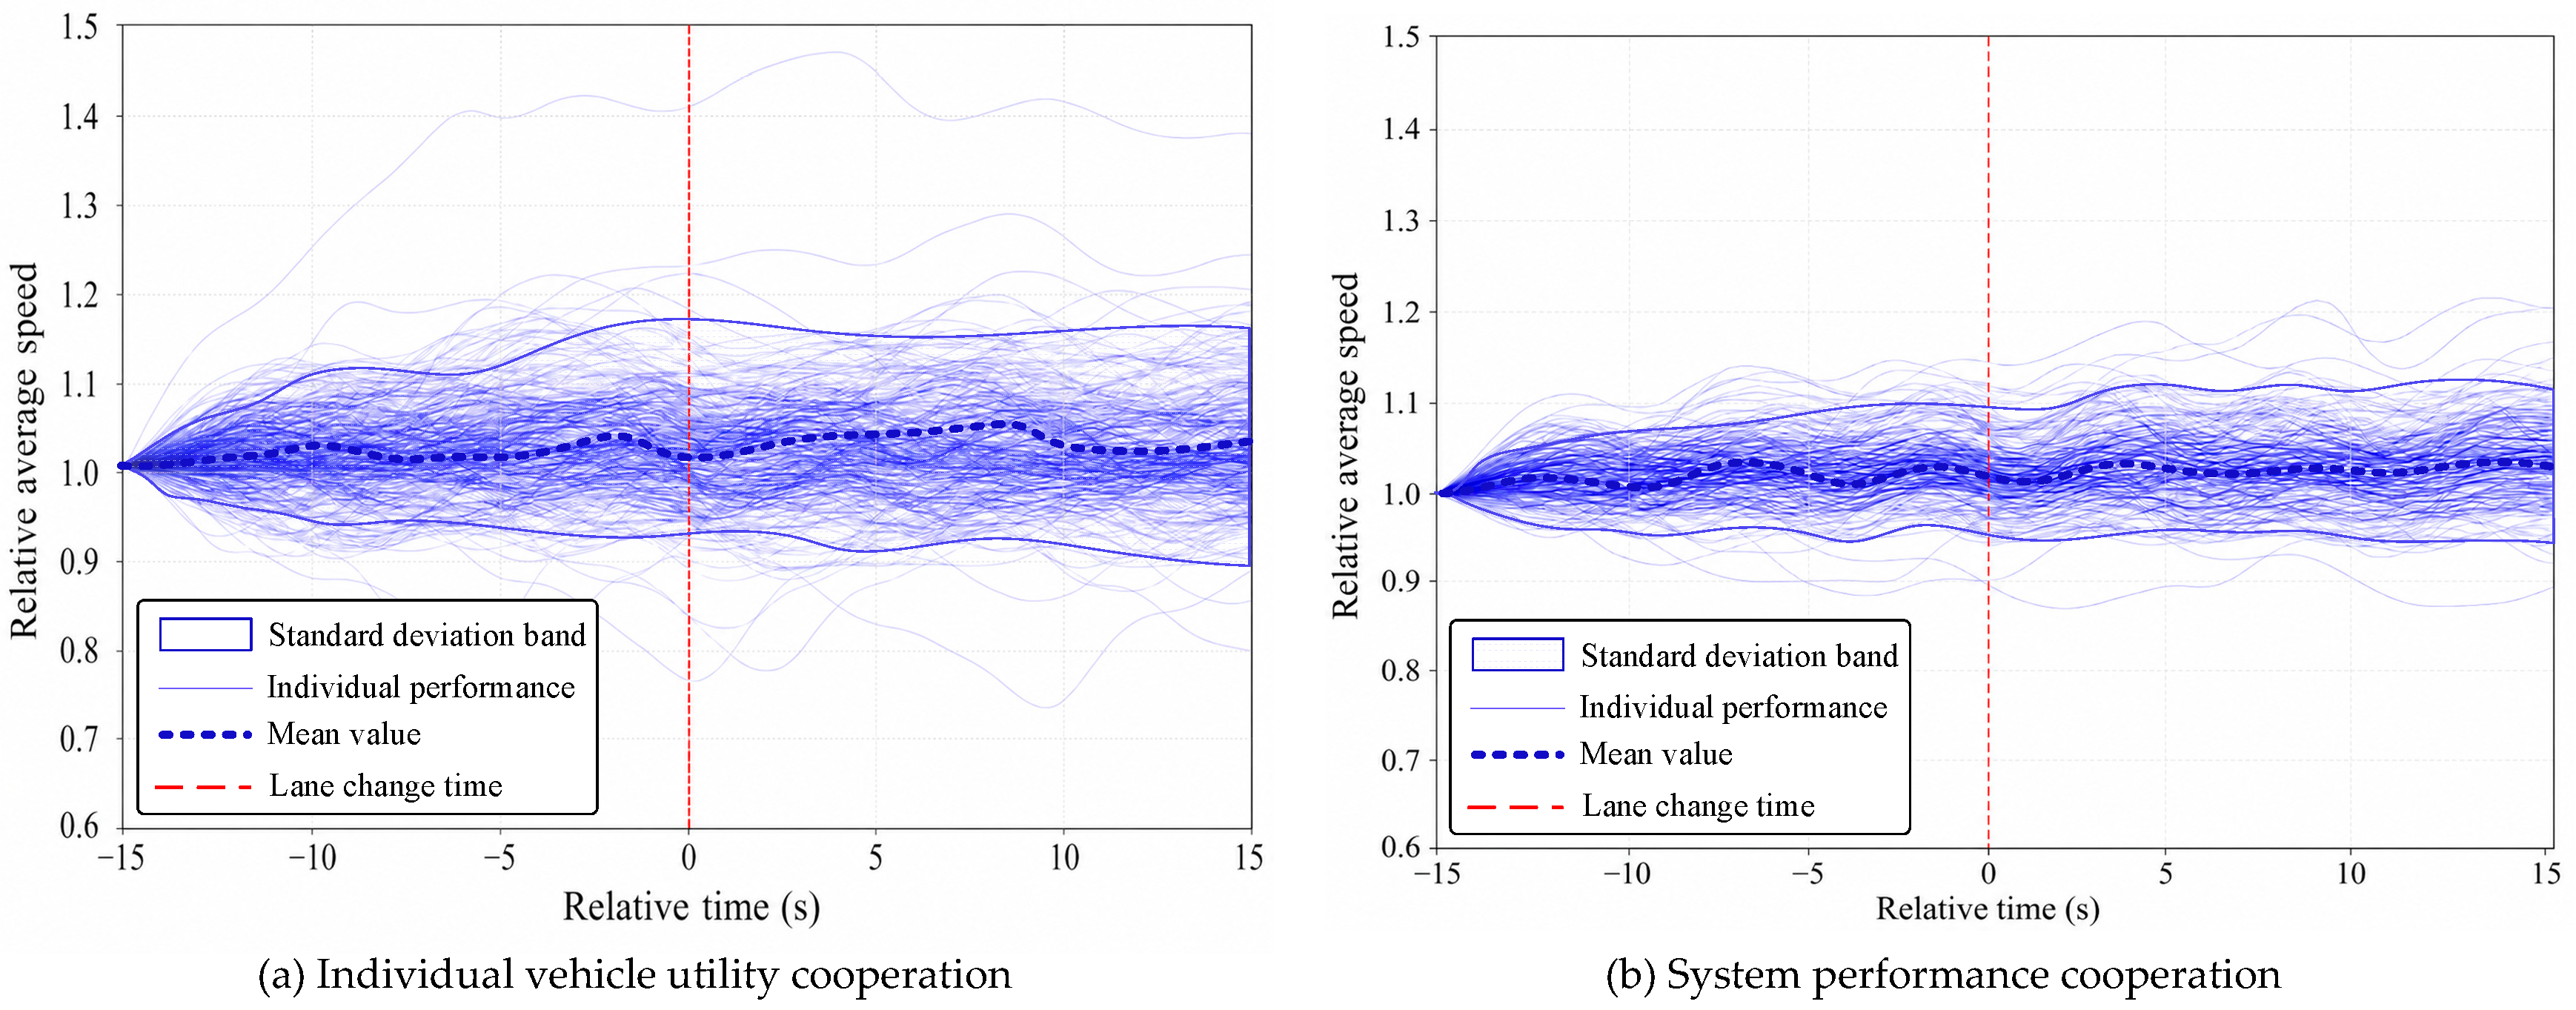
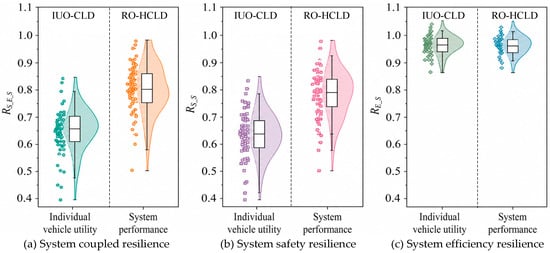
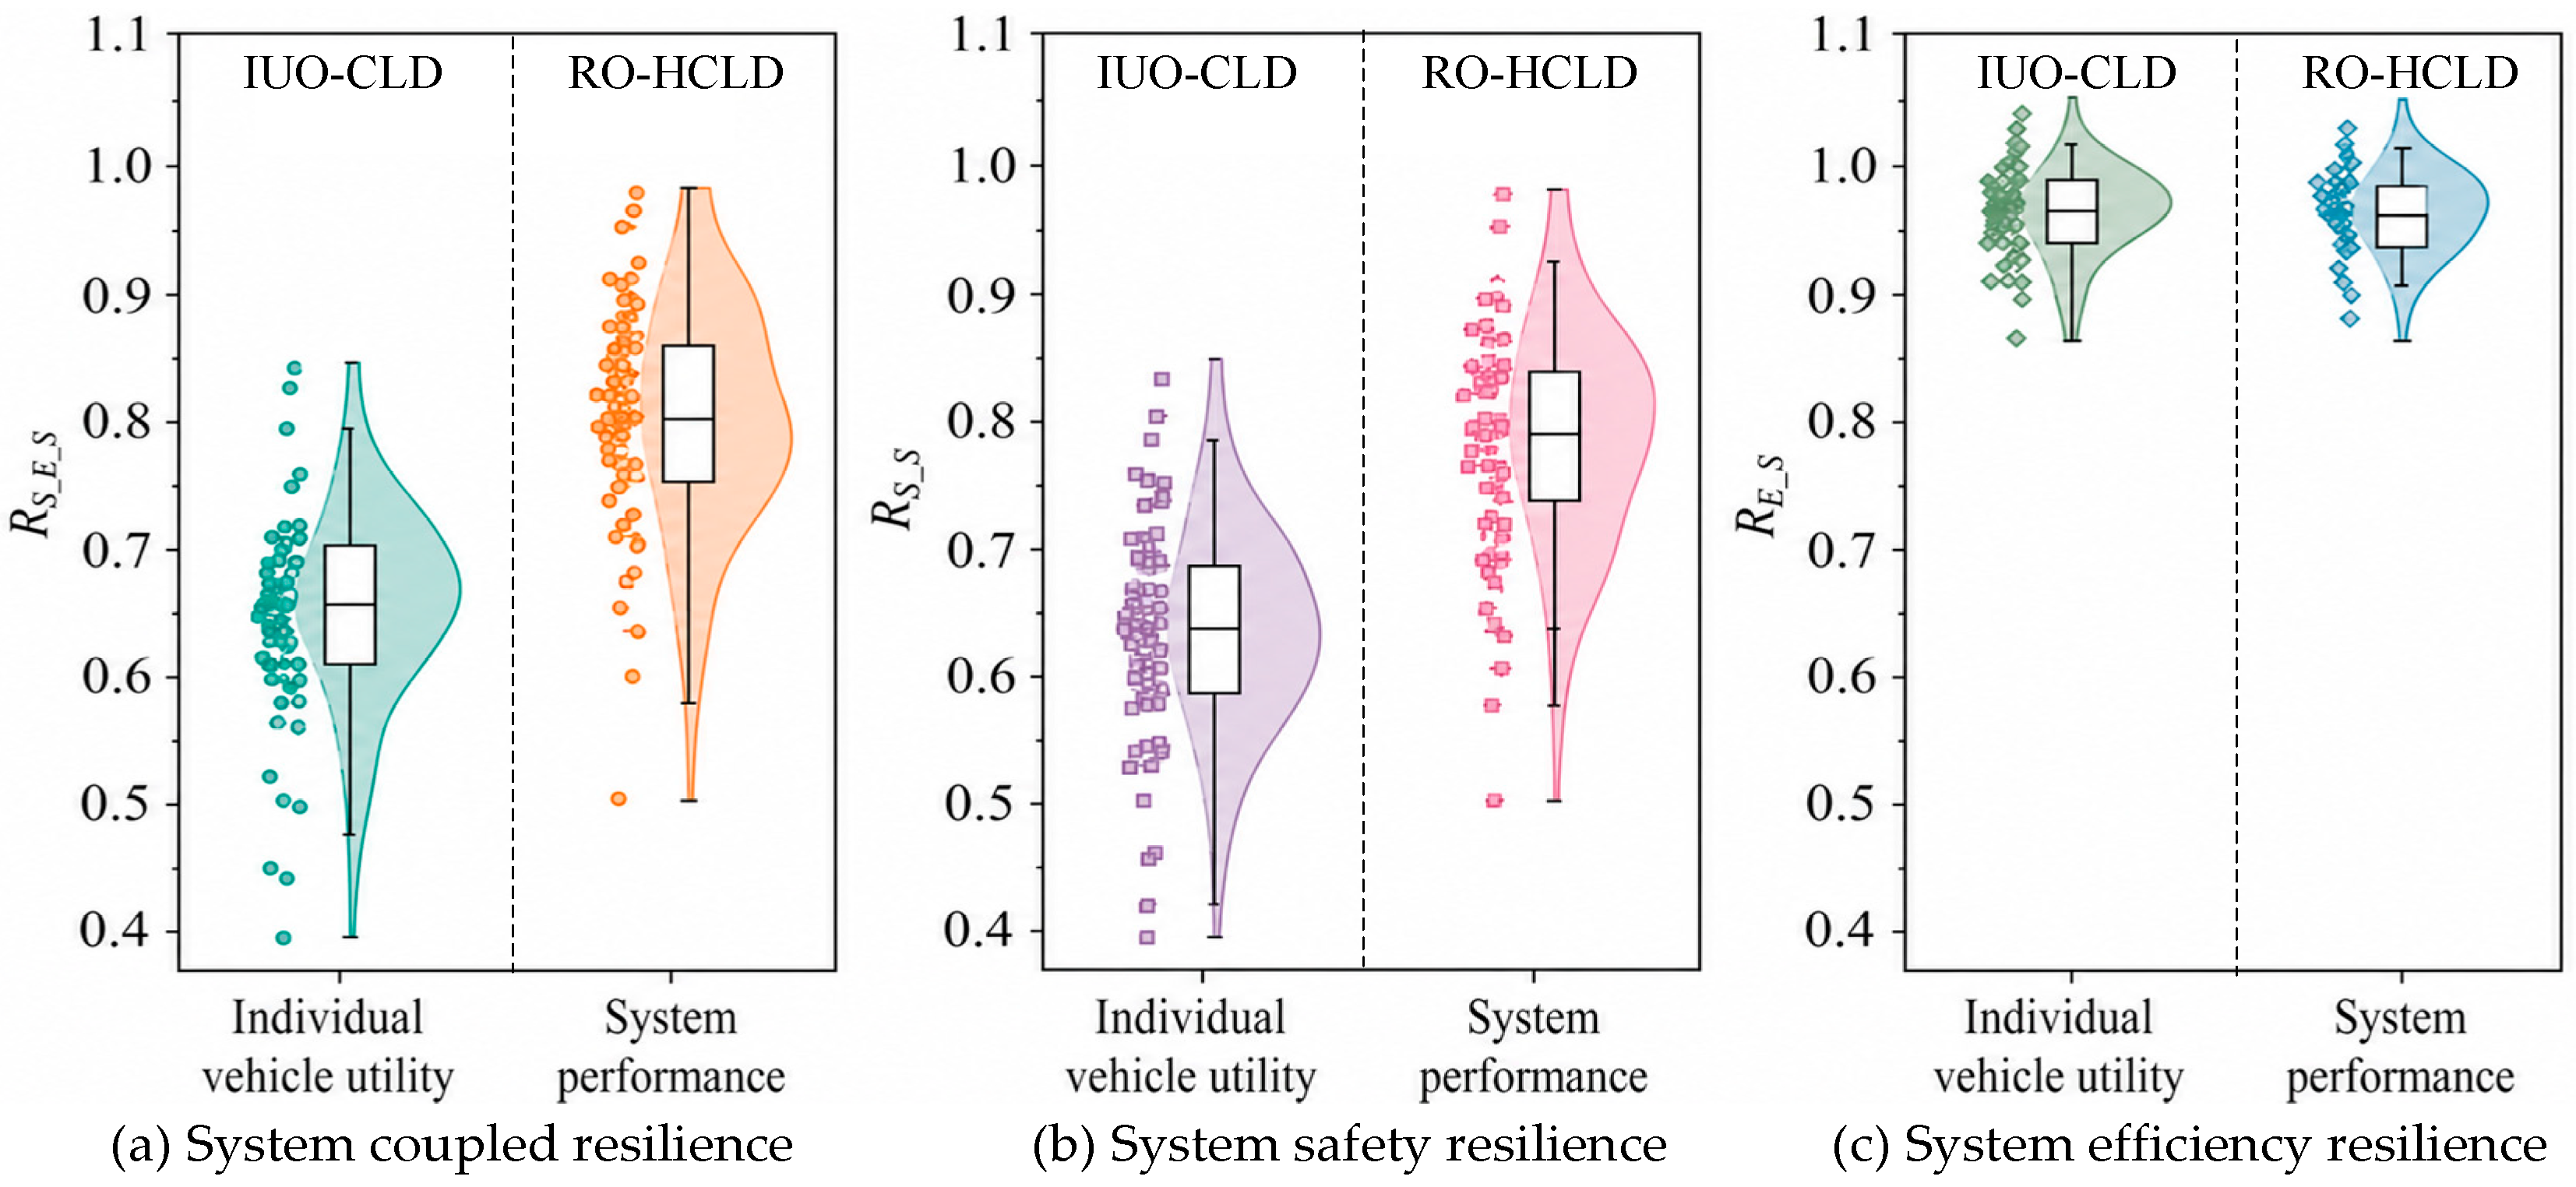
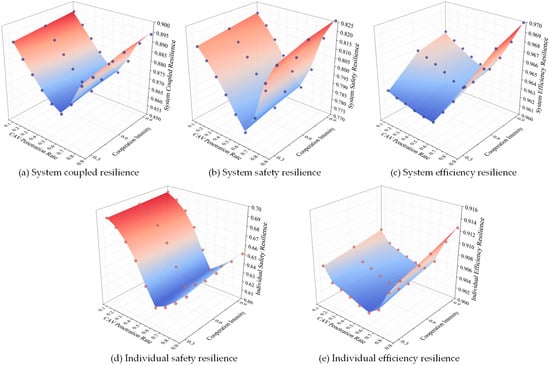
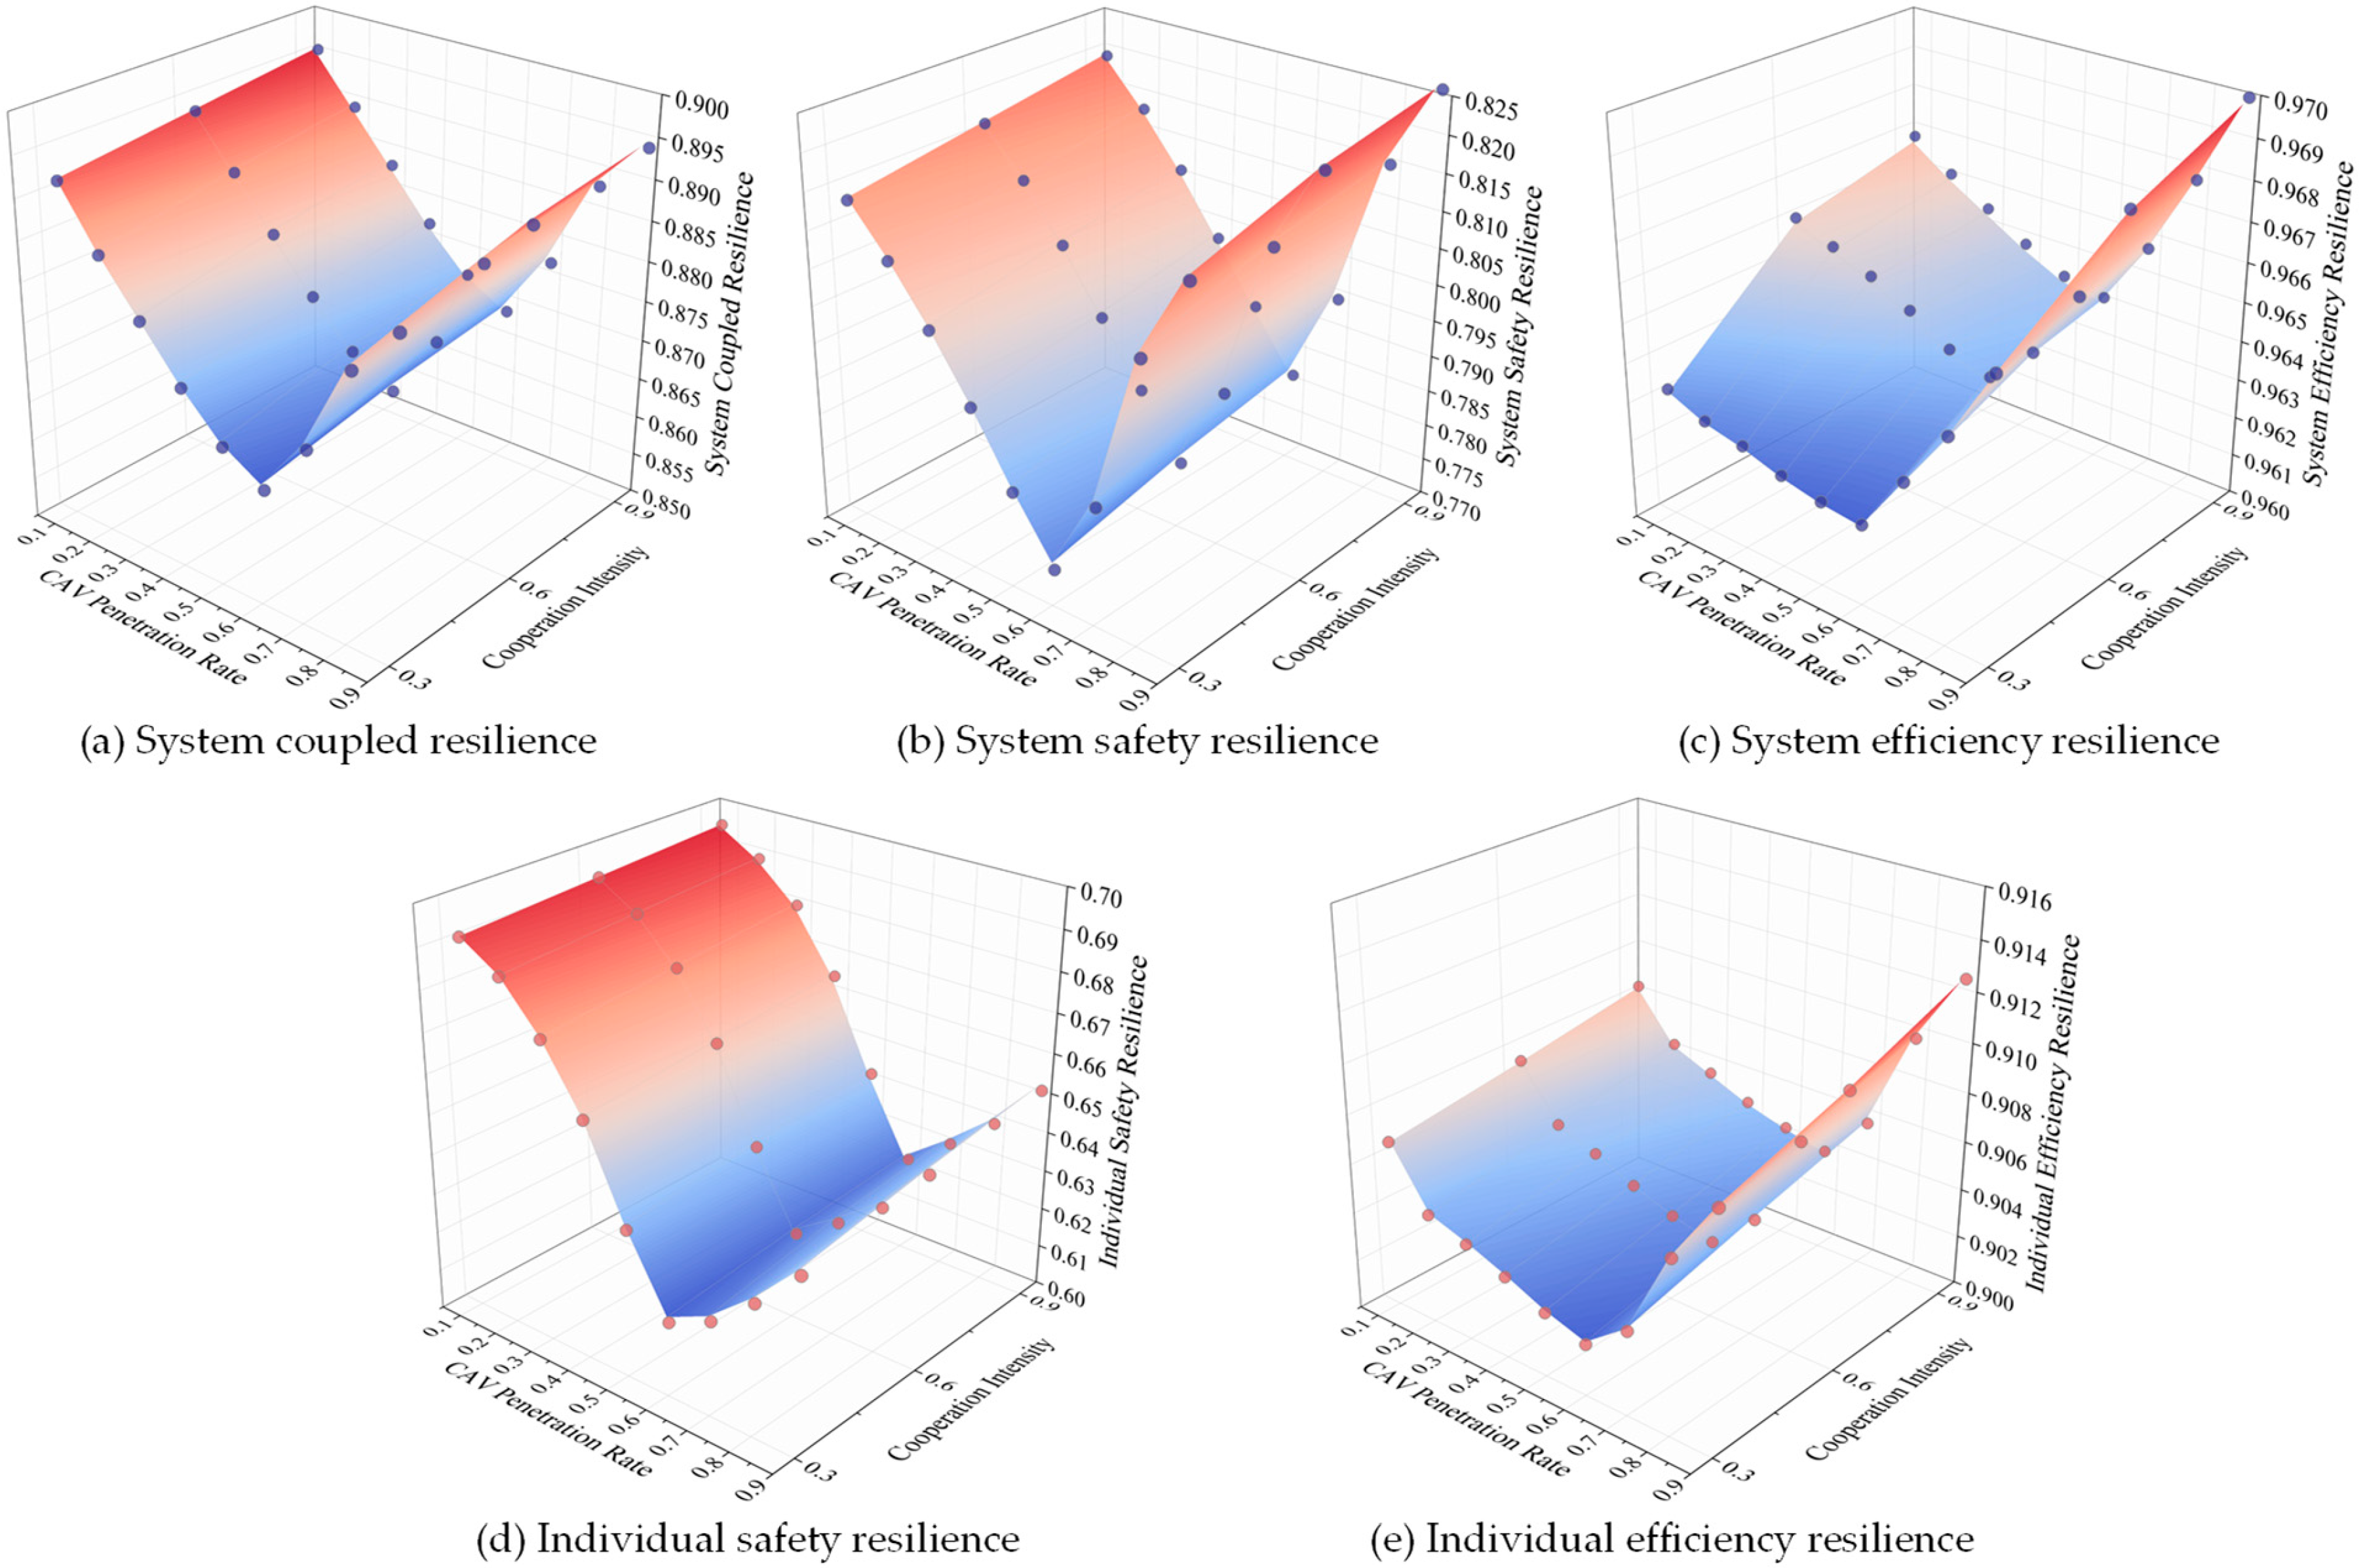
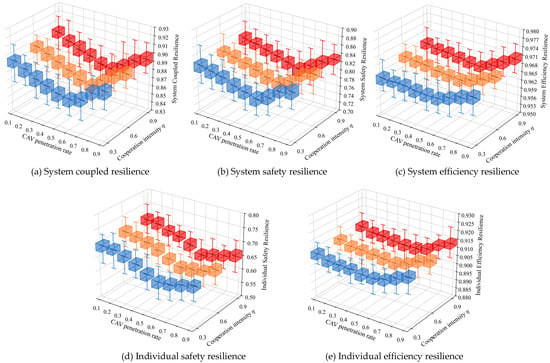
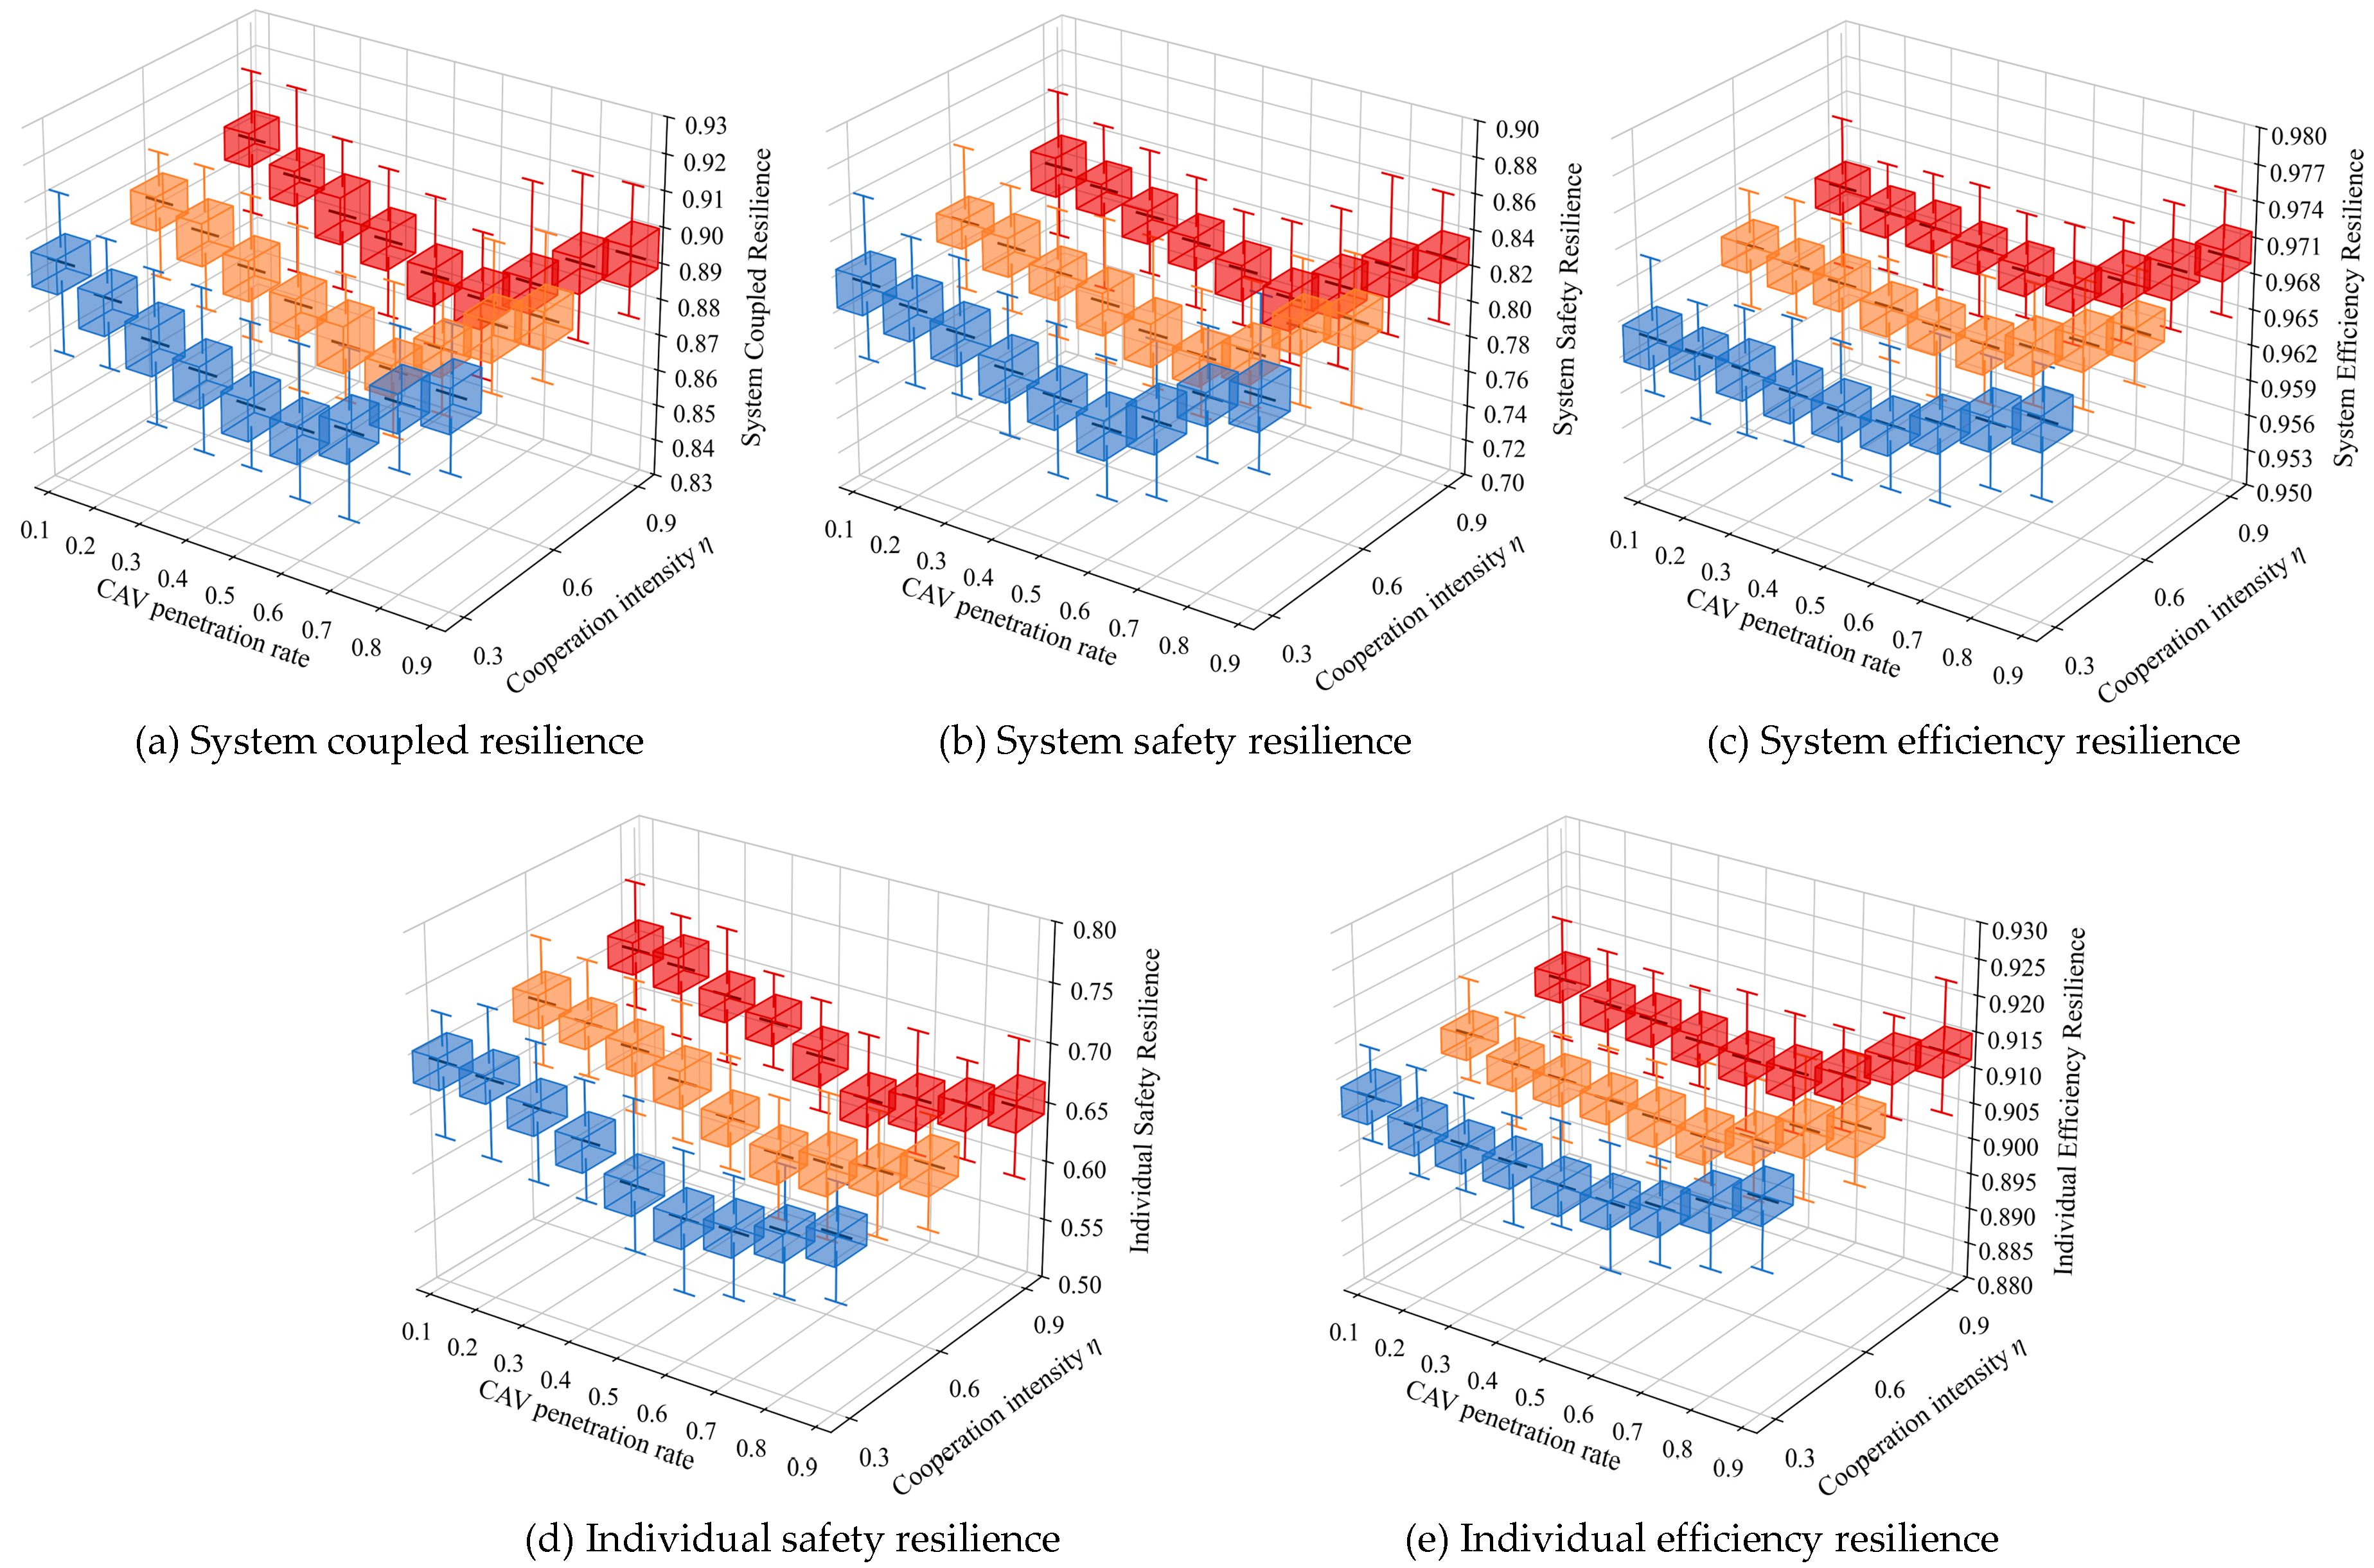

Disclaimer/Publisher’s Note: The statements, opinions and data contained in all publications are solely those of the individual author(s) and contributor(s) and not of MDPI and/or the editor(s). MDPI and/or the editor(s) disclaim responsibility for any injury to people or property resulting from any ideas, methods, instructions or products referred to in the content. |
© 2026 by the authors. Licensee MDPI, Basel, Switzerland. This article is an open access article distributed under the terms and conditions of the Creative Commons Attribution (CC BY) license.