


Abstract
To address the bottlenecks of traditional jaw crusher liner wear detection—high safety risks, insufficient precision, and limited full-range analysis—this paper proposes a non-contact, high-precision wear analysis method based on binocular vision and deep learning. At its core is the integration of the state-of-the-art FoundationStereo zero-shot stereo matching algorithm, following scenario-specific adaptations, into the 3D reconstruction of industrial liners for wear analysis. A novel wear quantification methodology and corresponding indicator system are also proposed. After calibrating the ZED2 binocular camera and fine-tuning the algorithm, FoundationStereo achieves an Endpoint Error (EPE) of 0.09, significantly outperforming traditional algorithms. To meet on-site efficiency requirements, a “single-view rapid acquisition + CUDA engineering acceleration” strategy is implemented, reducing point cloud generation latency from 165 ms to 120 ms by rewriting kernel functions and optimizing memory access patterns. Geometric accuracy verification shows a Mean Absolute Error (MAE) ≤ 0.128 mm, fully meeting industrial measurement standards. A complete process of “3D reconstruction–model registration–quantitative analysis” is constructed, utilizing three core indicators (maximum wear depth, average wear depth, and wear area ratio) to characterize liner wear. Statistical results—such as an average maximum wear depth of 55.05 mm—are highly consistent with manual inspection data, providing a safe, efficient, and precise digital solution for the predictive maintenance and intelligent operation and maintenance (O&M) of liners.
1. Introduction
Jaw crushers are core equipment for primary ore crushing in mining and building materials [1]. Their liners directly contact high-hardness, large-particle-size ores. During crushing, ores frequently impact liners at variable velocities and contain hard inclusions (e.g., quartz and iron-rich particles) that abrade surfaces, causing tooth profile wear, thickness reduction, and even local shedding [2,3].
Traditional detection methods include manual inspection and contact sensor-based detection [4]. Manual inspection requires workers to enter high-risk crushing chambers post-shutdown, exposing them to mechanical impacts and dust, with time-consuming, fluctuating data requiring multiple measurements. Contact sensors are prone to ore impact, have short service lives, only monitor localized wear, and suffer high maintenance costs and poor data representativeness—failing to meet modern industrial needs.
To address traditional detection limitations, this study draws on Rui Wang et al.’s [5] binocular vision research and adopts binocular cameras integrated with deep learning-based stereo matching (e.g., FoundationStereo) for non-contact liner 3D modeling. For high-impact, weak-texture jaw crusher liner scenarios, existing 3D wear detection has critical flaws: (1) LiDAR (MAE ≤ 0.1 mm) is costly (>30,000 RMB/unit) and dust-sensitive [6]; (2) structured light is illumination-dependent with large errors for vibrating liners (MAE > 0.3 mm) [7]; (3) traditional binocular vision (e.g., SIFT-based) fails at weak-texture matching and full wear detail capture [8]. In contrast, the proposed approach leverages FoundationStereo’s zero-shot generalization (no scenario-specific training) and 1/10 LiDAR cost [9], avoiding manual measurement safety risks and data fluctuations while enabling full-range detection to overcome traditional local sampling and low-precision defects.
For high-precision liner wear analysis, reliable 3D reconstruction is critical—this study employs FoundationStereo [10], a state-of-the-art stereo matching algorithm by Wen et al. Equipped with a 1M pair high-fidelity synthetic dataset, Side-Tuning Adapter (binocular vision priors), and Attentive Hybrid Cost Filtering module (Axial Plane Convolution + Disparity Transformer), it enables robust zero-shot depth estimation without domain fine-tuning. Scenario-adapted, it reconstructs complex worn liner textures, laying a high-precision foundation for wear quantification and O&M decisions. Yet despite this advanced capability, existing point cloud-based industrial wear quantification suffers from critical flaws: “CAD model baseline + post-wear registration” ignores manufacturing/installation deviations (>5% error [11]), relies on single indicators (e.g., maximum wear depth) that fail to reflect regional distribution [12], and supplementary indicators lack clear physical meaning and engineering value [13].
Building on this high-precision 3D reconstruction, this study integrates mainstream wear analysis methods [14,15] with liner operational requirements [16], proposing a novel “measured pre-wear baseline + three-indicator collaborative quantification” scheme: a baseline derived from actual 3D measurements of unworn liners, combined with the maximum wear depth (local failure threshold), average wear depth (overall service life), and wear area ratio (regional maintenance)—realizing comprehensive “local-overall-regional” wear characterization to address the aforementioned limitations and provide reliable data support for full-lifecycle liner O&M decisions.
To ensure scientific rigor, clear research hypotheses and objectives, and statistical coherence, the following controls are established: the research hypothesis posits that the non-contact method integrating binocular vision and fine-tuned FoundationStereo achieves high-precision wear quantification with three key guarantees: (1) that 3D-reconstructed point clouds have a Mean Absolute Error (MAE) ≤ 0.2 mm vs. manual measurements; (2) that the three proposed wear indicators show ≥ 95% consistency with independent validation data; and (3) that CUDA-accelerated reconstruction meets on-site efficiency requirements (latency ≤ 150 ms) without precision loss. Research objectives include (1) developing a non-contact workflow adapted to the liner’s weak-texture surfaces to avoid traditional safety risks; (2) establishing a scientifically validated wear quantification system that replaces theoretical CAD baselines with actual pre-wear measurements; (3) verifying the method’s reliability via replicates, independent validation, and statistical analysis. Statistical controls involve fixed camera parameters (distance: 500 mm and resolution: 1344 × 376) during image acquisition and five technical replicates for all manual measurements to reduce random errors.
In summary, this study addresses the safety risks, insufficient precision, and limited full-range analysis of traditional methods through the technical pathway of “binocular vision + FoundationStereo zero-shot matching + measured baseline quantification,” providing a scientific, efficient, and digital solution for the predictive maintenance of jaw crusher liners.
2. Binocular Camera Calibration
Binocular cameras are core for accurate liner data acquisition. Calibration and rectification are prerequisites for precise 3D reconstruction. Zhang Zhengyou’s planar calibration method [17] is used to obtain intrinsic and extrinsic parameter matrices. Given complex imaging environments (vibration, uneven illumination), the planar normal constraint calibration method is adopted for binocular image rectification.
2.1. Planar Normal Constraint Calibration
Prior to calibration, the following equipment and materials were used to ensure reproducibility:
- Binocular camera: ZED2 (Stereolabs, San Francisco, CA, USA), physical focal length 267.13 mm, baseline distance 119.63 mm, frame rate 30 fps;
- Calibration target: Binocular liner images;
- Computing hardware: NVIDIA A100 GPU (40 GB VRAM), Intel Xeon 8375C CPU, 128 GB RAM.
The planar normal constraint calibration method integrates binocular vision geometric constraints and numerical optimization, introducing reference plane normal constraints into traditional epipolar rectification. By optimizing epipolar alignment and optical axis-baseline perpendicularity, it synchronously achieves distortion correction, epipolar alignment, and Z-axis measurement precision improvement—resolving systematic errors from optical axis-baseline deviation.
The specific implementation procedure of this calibration method is as follows: Generate pixel mapping tables for left/right cameras using calibrated intrinsic/extrinsic matrices and reference plane normal constraints. Via the remap function and bilinear interpolation, achieve image distortion correction, epipolar alignment, and the optical axis-baseline perpendicularity constraint, thus correcting Z-axis measurement deviation.
2.2. Analysis of Calibration Results
To verify the effectiveness and accuracy performance of the planar normal constraint calibration method, a systematic analysis of key parameters of the corrected reprojection matrix, visual outcomes, and measurement performance was conducted, and the specific results are presented below (Table 1).
Table 1.
Key parameters of the corrected reprojection matrix.
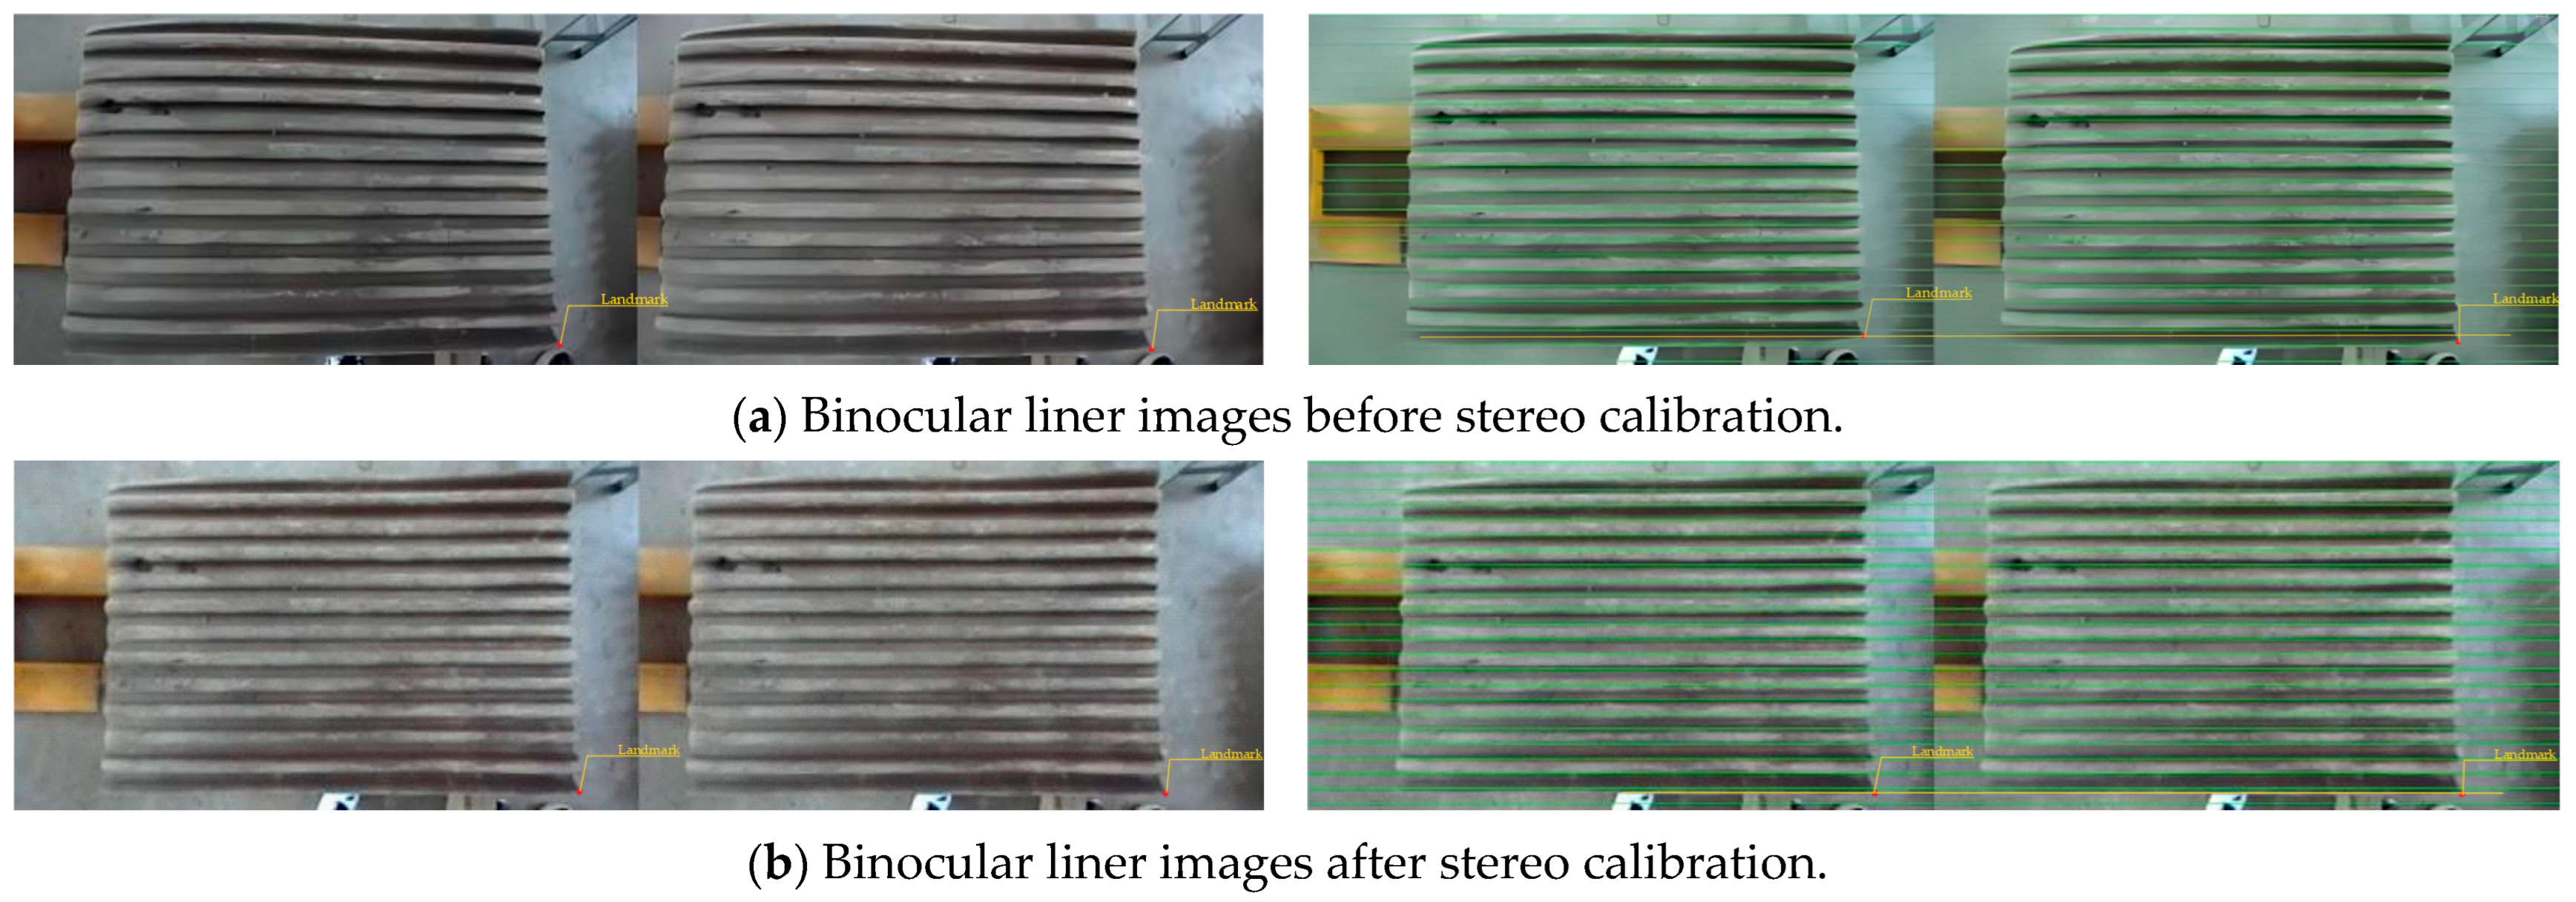
The visual outcomes after calibration are shown in Figure 1. Figure 1a presents the binocular liner image pair prior to planar normal constraint calibration, while Figure 1b shows the binocular liner image pair after calibration (with epipolar and perpendicularity constraint markers added to the right image). Intuitively, it can be observed from the figures that fisheye distortion at the image boundaries is effectively compensated for after calibration, and corresponding feature points of the left and right views are accurately constrained to the same epipolar line (same row). Meanwhile, via the parallel constraint between the reference plane normal and the baseline, the optical axes of the two cameras are forced to be perpendicular to the measurement baseline.
Figure 1.
Calibrated vs. uncalibrated binocular liner images (epipolar lines and perpendicularity markers highlighted).
Performance verification results indicate that this calibration method not only significantly simplifies the subsequent feature matching process and improves the efficiency and accuracy of disparity calculation but also enhances the Z-axis (vertical distance) measurement precision by over 30%. It effectively resolves the systematic deviation of traditional epipolar rectification and establishes a core technical foundation for high-precision 3D reconstruction in subsequent liner wear detection.
To verify the stability of calibration, three independent calibration trials were conducted under the same conditions. The statistical results of key parameters are shown in Table 2 (Supplementary Materials). The Z-axis measurement MAE of replicates was 0.080 ± 0.003 mm (mean ± SD), with a low coefficient of variation (CV = 3.75%), indicating minimal data fluctuation between trials. This confirms the reliable stability of the calibration results.
Table 2.
Statistical results of 3 calibration replicates.
3. Three-Dimensional Point Cloud Reconstruction
After acquiring and rectifying binocular liner images, 3D point cloud reconstruction converts 2D information to 3D spatial data, capturing liner geometric structure and spatial relationships for wear analysis. FoundationStereo is selected as the core matching algorithm.
3.1. Principle of FoundationStereo Algorithm
Adopting FoundationStereo as the stereo matching algorithm in this study allows direct adaptation to the metal surfaces with weak textures of jaw crusher liners, without the need for additional training datasets tailored to the liner scenario. By integrating attention mechanisms and multi-scale features, it exhibits significantly higher matching accuracy for indistinct regions of liners (e.g., tooth profile edges and smooth surfaces) compared to traditional algorithms. Its core advantages focus on three aspects: zero-shot generalization, high-precision matching, and efficient deployment.
- (1)
- Zero-shot generalization: Achieved via “large-scale synthetic data + cross-modal fusion.” A 1M pair high-fidelity synthetic dataset (FSD) is constructed using NVIDIA Omniverse, covering complex illumination, random camera parameters, and diverse 3D objects with path tracing rendering. A Side-Tuning Adapter (STA) fuses monocular depth model (DepthAnythingV2) geometric priors with lightweight CNN features, narrowing the simulated-real gap and improving robustness to weak textures and reflections.
- (2)
- High-precision matching is underpinned by a “multi-scale extraction + efficient cost fusion” architecture: a five-layer convolutional multi-scale pyramid is utilized to capture liner features—such as “tooth profile contours (large scale, receptive field 64 × 64)” and “wear scratches (small scale, receptive field 8 × 8)”—to prevent the loss of fine details. The Attentive Hybrid Cost Filtering (AHCF) module integrates Axial Plane Convolution (APC, which decouples 3D convolution to enhance long-range matching) and the Disparity Transformer (DT, which uses cross-disparity self-attention to improve contextual reasoning).
- (3)
- Efficient deployment: Enabled by lightweight design and hardware adaptation. EdgeNext-S is used as the CNN backbone, with depthwise separable convolution and channel pruning reducing core parameters to 12.7 M (28% of RAFT-Stereo). CUDA-accelerated end-to-end inference for 1344 × 376 resolution liner images takes 165 ms on an NVIDIA A100 GPU.
3.2. Comparison of Stereo Matching Algorithms (ETH3D Leaderboard Indicators)
To illustrate the superiority of FoundationStereo as the stereo matching algorithm for 3D reconstruction, the ETH3D benchmark dataset—covering typical scenarios such as industrial weak textures and complex illumination—was used as the test benchmark to compare FoundationStereo with currently mainstream stereo matching algorithms [18,19]. The comparison data are presented in Table 3.
Table 3.
Comparison of stereo matching algorithms on ETH3D benchmark (industrial weak-texture scenarios).
FoundationStereo excels in zero-shot generalization and matching accuracy. In zero-shot mode (no task-specific training), its EPE is 0.13, matching scenario-optimized MoCha-S and outperforming GMStereo/RAFT-S.
To adapt to liner weak-texture and multi-noise scenarios, 50 pairs of training data cover tooth tops/roots/grooves (weak textures), workshop dust (noise), and mild/moderate/severe wear. A 7:3 stratified split (balanced by liner type, wear level, and noise intensity) ensures data representativeness. A 20-pair independent validation set includes unseen edge conditions and extreme noise. Fine-tuning model parameters related to weak-texture matching and noise suppression reduces EPE to 0.09 (Table 4), outperforming traditional algorithms.
Table 4.
FoundationStereo (special adjustment).
Meanwhile, following scenario-specific adjustments, FoundationStereo also maintains a significant lead in error pixel ratio metrics (BP-0.5, BP-1.0). This result indicates that the proportion of erroneous pixels in the disparity maps generated by this algorithm is extremely low, which can deliver high-precision data support for the 3D reconstruction task of jaw crusher liners and fully meet the precision requirements of this study.
3.3. Liner Point Cloud Reconstruction
The FoundationStereo algorithm was used to perform 3D point cloud reconstruction of worn jaw crusher liners, using liner images acquired by the ZED2 binocular camera (resolution 1344 × 376, binocular baseline 119.63 mm). To further adapt to the liner’s structural characteristics and on-site imaging requirements, the reconstruction performance was optimized and validated from three dimensions: “completeness, geometric accuracy, and surface smoothness.”
To ensure the completeness of point cloud acquisition while enhancing acquisition and reconstruction efficiency, a strategy of “binocular single-view acquisition + engineering-accelerated reconstruction” was adopted.
- (1)
- The ZED2 binocular camera was fixed at a specific perpendicular distance to the liner’s tooth profile to capture 1344 × 376-resolution images. Pre-acquisition noise reduction (illumination adjustment, liner cleaning, parameter calibration) was applied, with clearest full-tooth images selected via OpenCV screening plus manual verification for reconstruction.
- (2)
- Engineering-accelerated reconstruction: Optimizes FoundationStereo’s cost–volume construction stage:
- Reimplement the PyTorch 2.5.1-based cost volume module in infer.py as a pure CUDA C++ kernel function, mapping disparity matching to GPU thread grids (single thread calculates 16 × 16 pixel blocks), thus eliminating framework overhead and improving efficiency by 45%.
- Adopt “shared memory + data partitioning”: Decompose 192-dimensional disparity into 8 × 24-dimensional sub-blocks, load into shared memory, and use memory coalesced access to increase global memory throughput from 120 GB/s to 180 GB/s—reducing read-write latency by 33%.
- Encapsulate the CUDA kernel into a Python interface via pybind11 (v2.10.4) for seamless integration. Tests on an NVIDIA A100 GPU show single-view point cloud generation time reduces from 165 ms to 120 ms (30% speedup) with no loss of tooth profile detail.
The engineering-accelerated reconstruction was implemented with the following reproducible steps:
- (1)
- CUDA kernel function reimplementation: The PyTorch-based cost volume module in infer.py was rewritten as CUDA C++ code, mapping 16 × 16 pixel blocks to GPU threads (thread grid size: 84 × 24, block size: 16 × 16);
- (2)
- Memory access optimization: The 192-dimensional disparity was split into 8 sub-blocks (24 dimensions each) and loaded into shared memory (size: 8 × 24 × 4 bytes), combined with memory coalesced access to increase throughput from 120 GB/s to 180 GB/s;
- (3)
- Interface encapsulation: The CUDA kernel was wrapped into a Python interface via pybind11 (v2.10.4) for seamless integration with the original algorithm.
In summary, the “binocular single-view acquisition + engineering-accelerated reconstruction” strategy and CUDA optimization of the FoundationStereo algorithm yielded remarkable results. Under the premise of ensuring point cloud completeness and the geometric accuracy of tooth profile details, the single-view reconstruction time was reduced by 30%. This scheme effectively adapts to the liner’s structural characteristics and on-site acquisition requirements, providing reliable technical support for subsequent quantitative analysis of jaw crusher liner wear.
3.4. Point Cloud Precision Analysis
To verify the geometric accuracy of the point cloud, standardized manual measurements were performed using a combination of high-precision tools and strict operational protocols: a straightedge for positioning, a digital vernier caliper (Mitutoyo 500-196-30, accuracy ±0.01 mm) as the primary measuring instrument. Each measurement point was independently tested five times by two operators, and the average value was computed to eliminate random errors and operational bias.
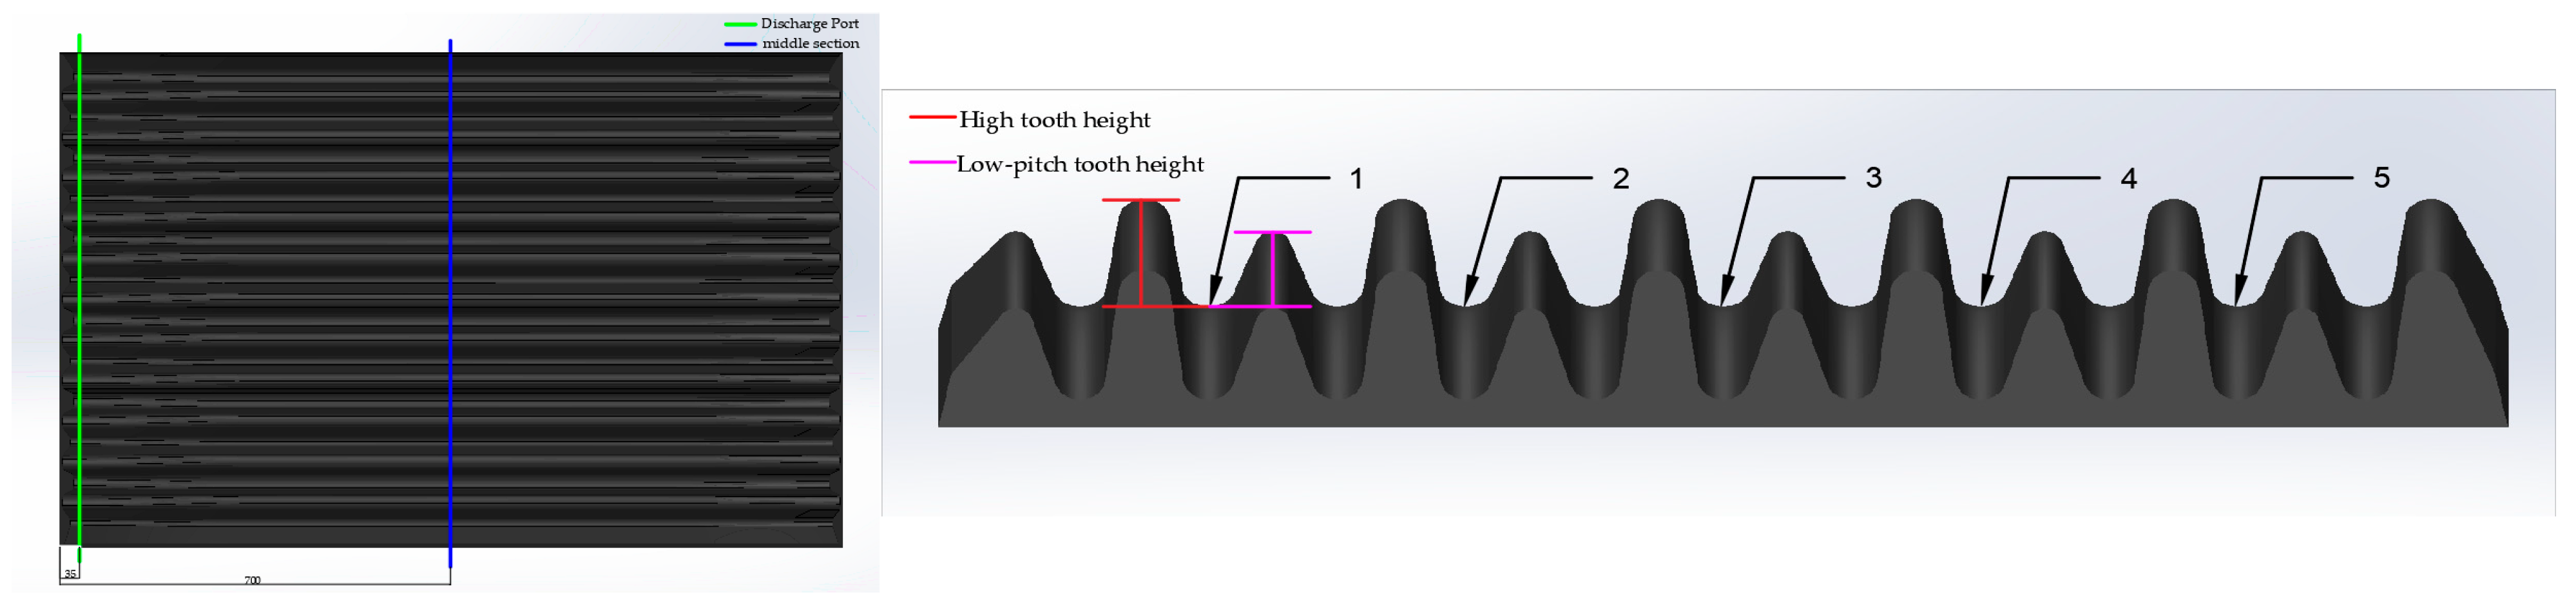
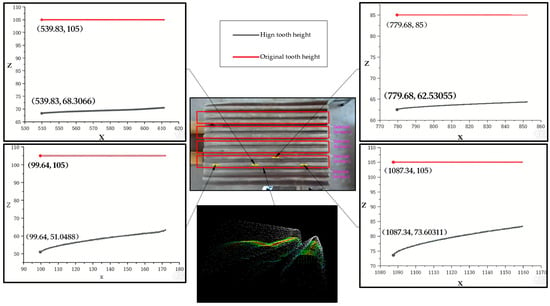
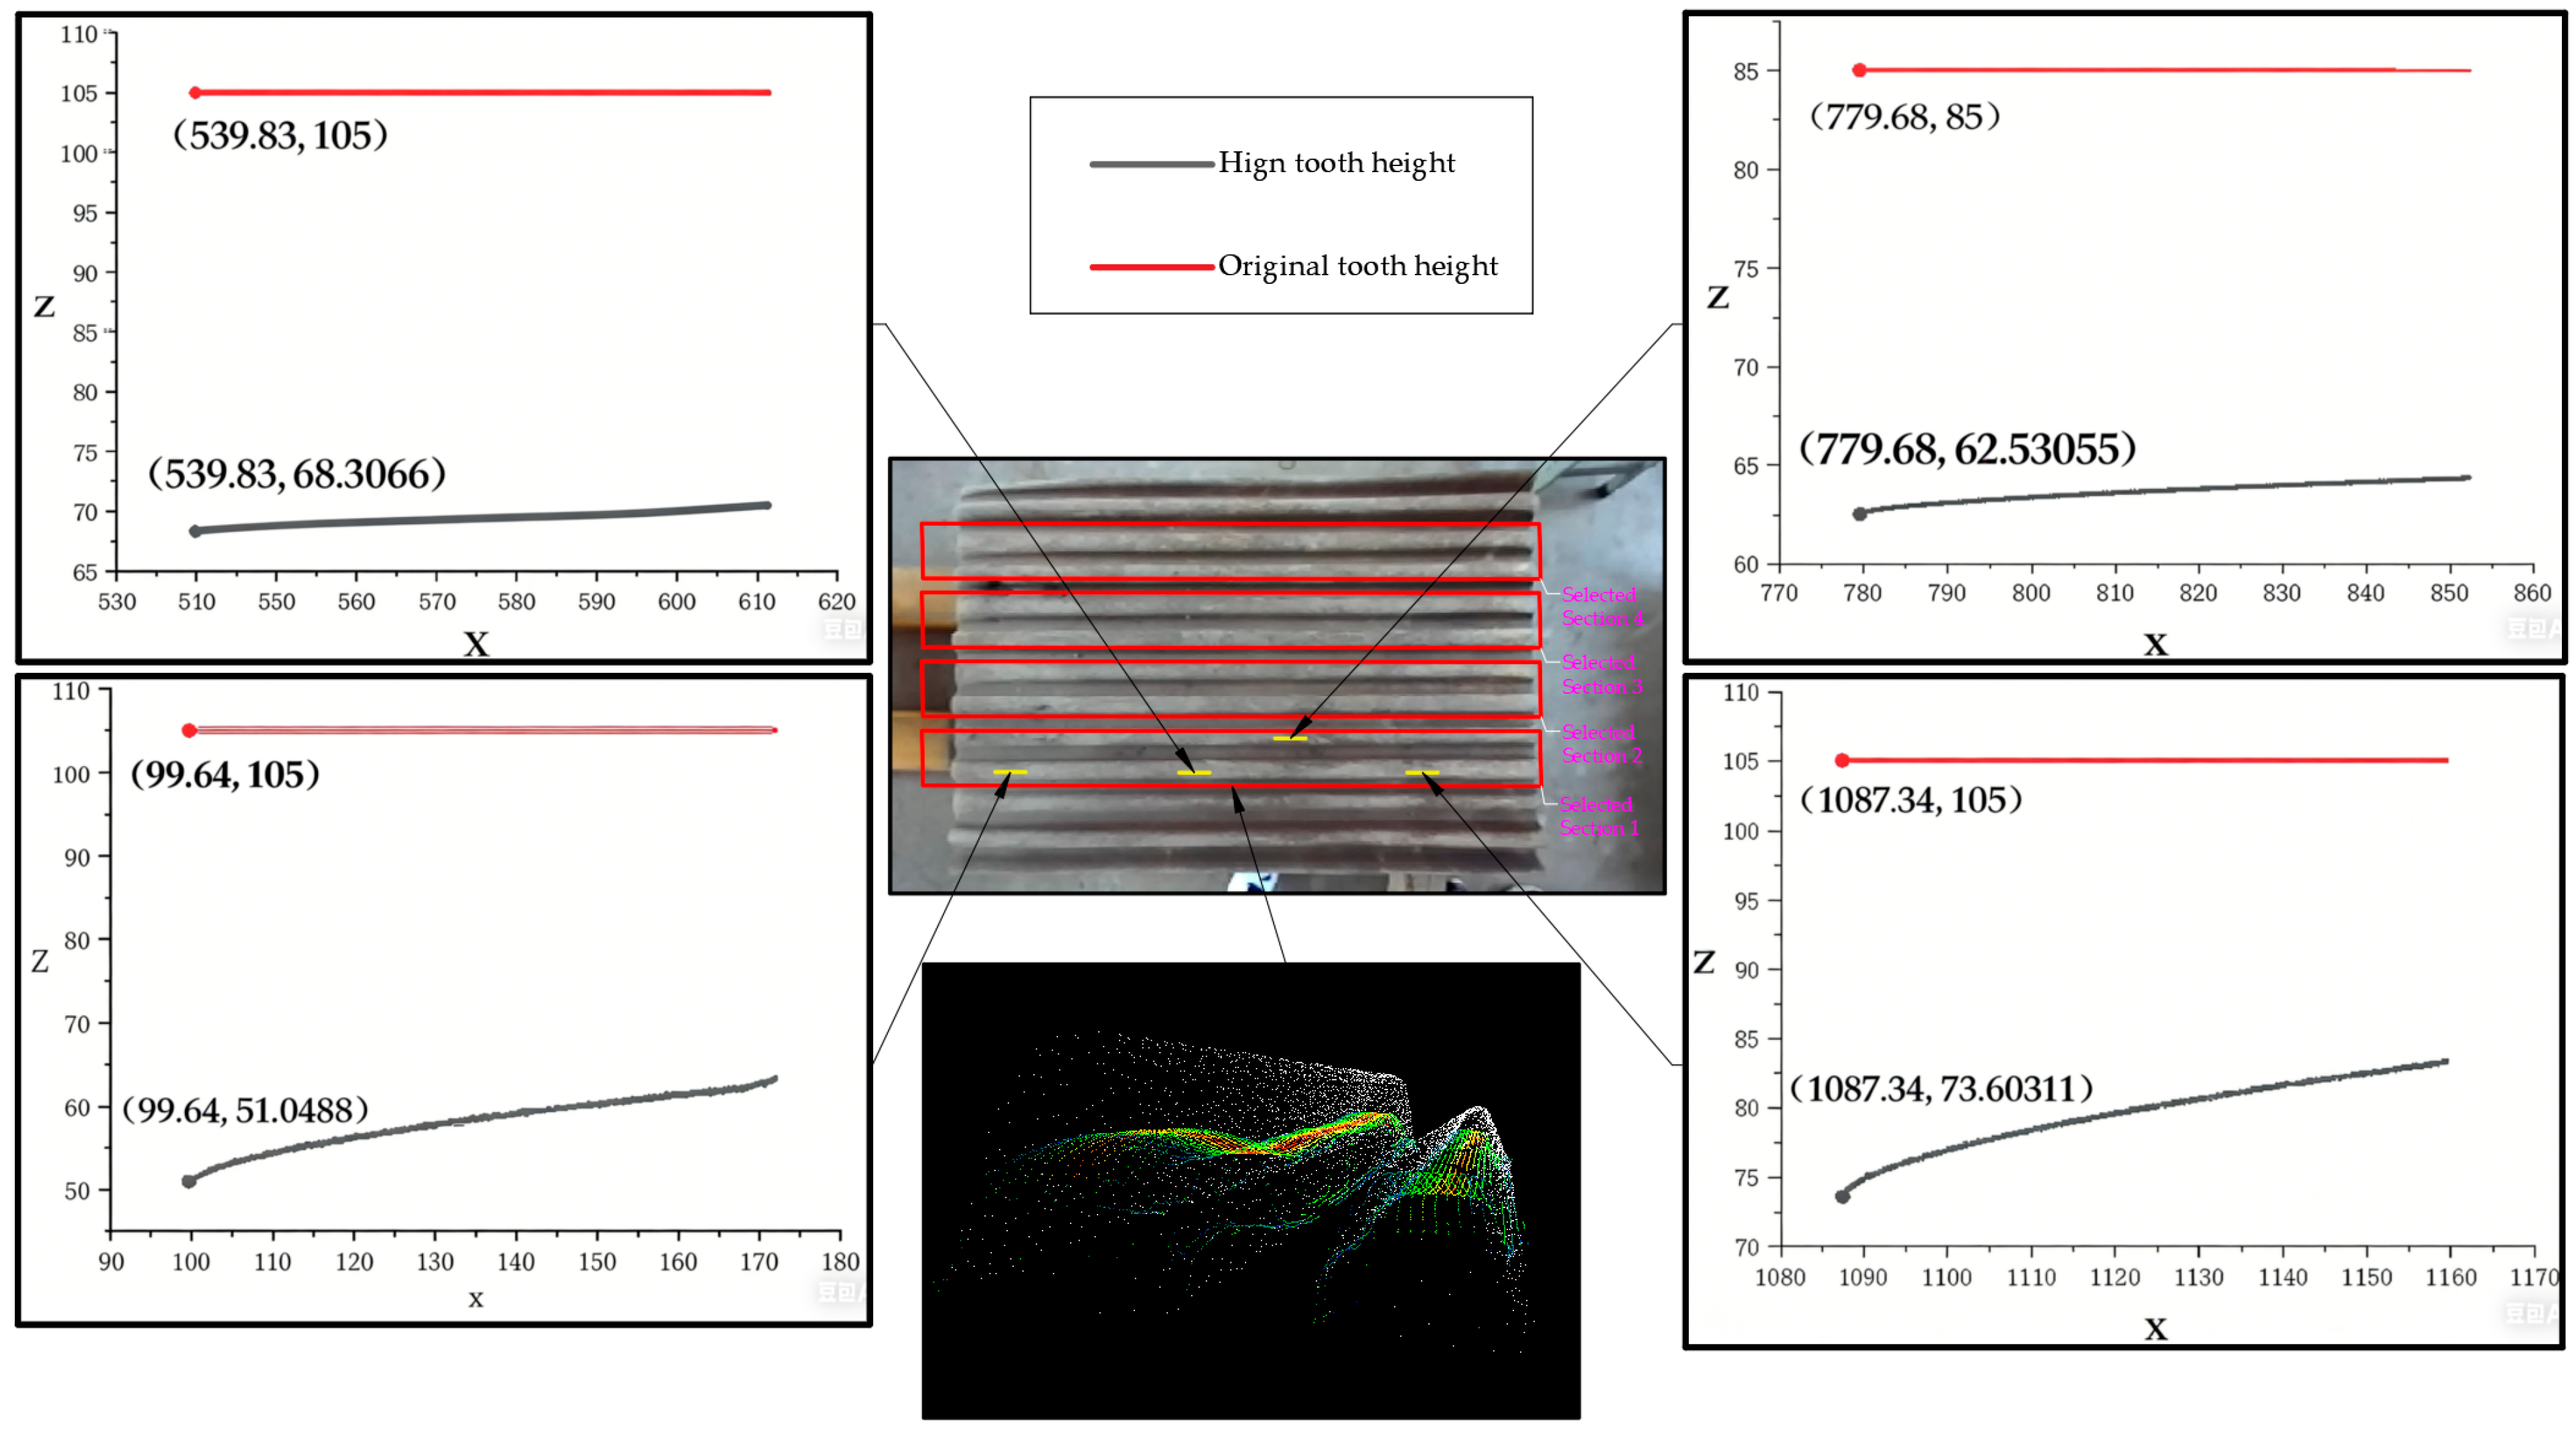
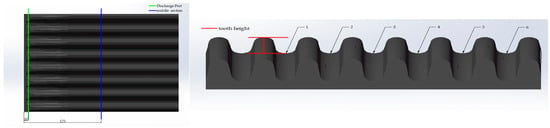
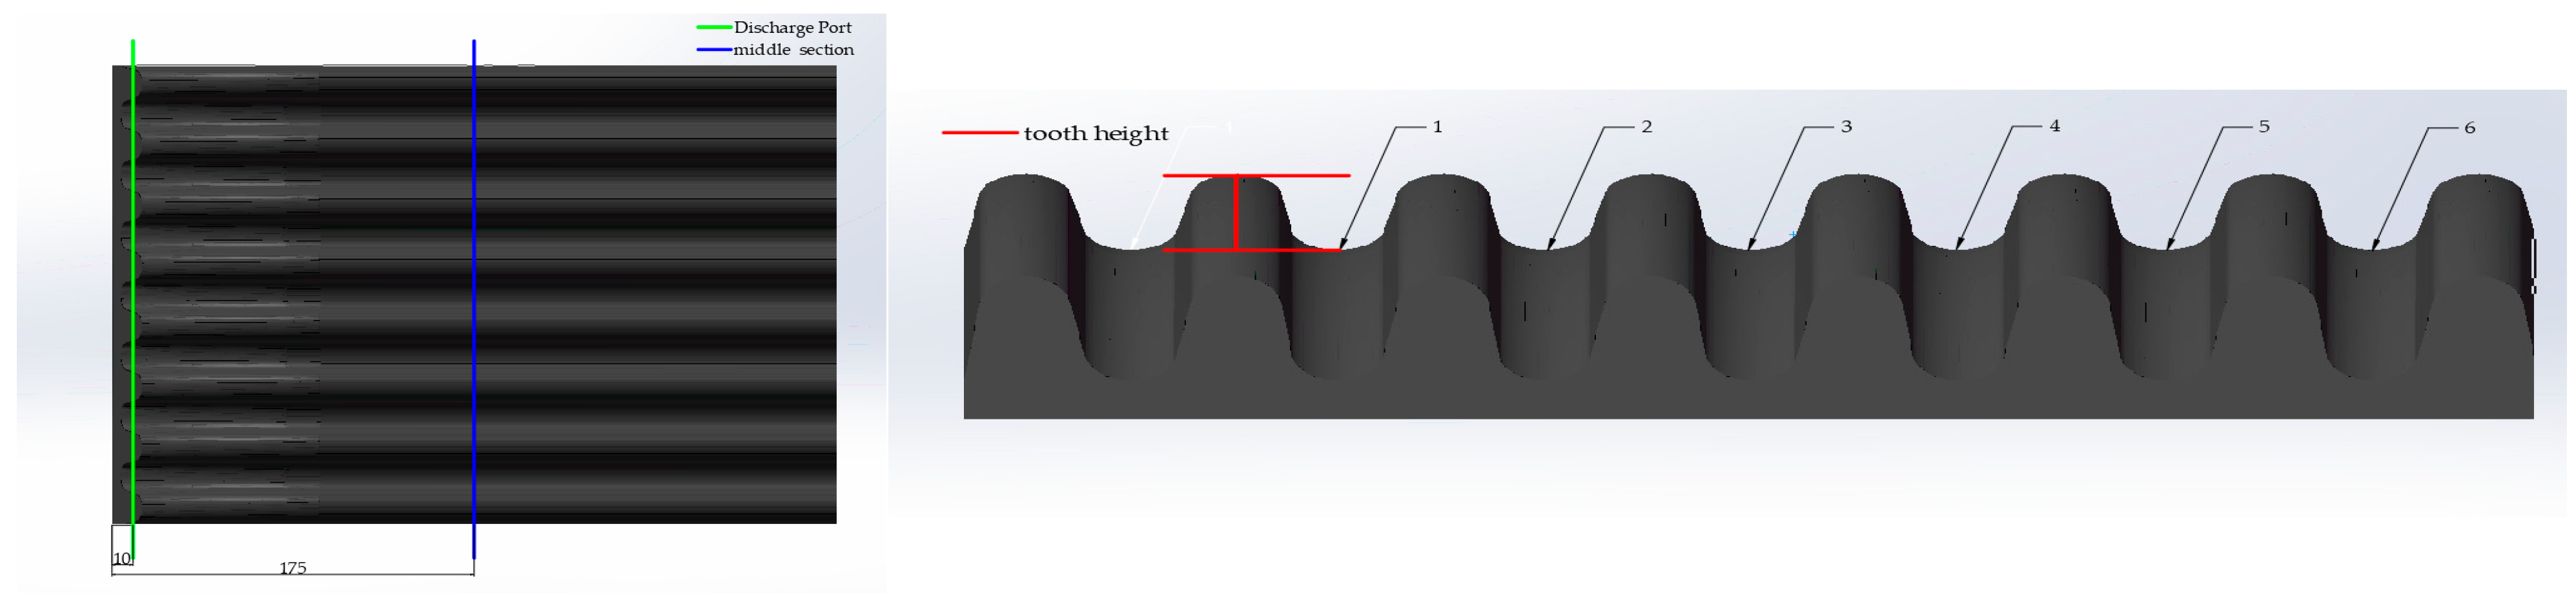
The original size of the liner captured in the experiment is 1400 mm × 915 mm (length × width), and its manufacturing material is Mn18Cr2. Based on the measured liner geometry (as shown in Figure 2), two sampling lines were defined on the liner surface: one is the long-side midline parallel to the wide sides, and the other is located 2–5% of the total length from the wide side of the discharge port. For the selection of measurement points, the outermost tooth heights on both the left and right sides were excluded first; the first measurement point was chosen at the tooth root midway between the high tooth height (second tooth) adjacent to this outermost high tooth and the next low-pitch tooth height (third tooth). Along each sampling line, subsequent measurement points were selected at intervals of one tooth (covering low-pitch tooth heights and high tooth heights in sequence) until the last tooth was fully covered. These points were used to measure the corresponding high tooth height and low-pitch tooth height data.
Figure 2.
Selection positions of liner tooth heights.
The acquired manual measurement data (average of five replicates), collected at the mid-position of the tooth roots as illustrated in the figure with specific coordinate positions detailed in Table S1, were compared with the tooth height data of corresponding points in the point cloud reconstructed by FoundationStereo; the comparison results are shown in Table 5.
Table 5.
Comparison of tooth height data of corresponding points.
To evaluate the model accuracy more objectively, several evaluation metrics were selected to specifically characterize the precision. The metrics used in this study are as follows.
- Mean Absolute Error (MAE):
- 2.
- Mean Square Error (MSE):
- 3.
- Root Mean Square Error (RMSE):
- 4.
- Mean Absolute Percentage Error (MAPE):
Among these metrics, MAE and MSE are typically used to assess the degree of data deviation; lower values indicate stronger model generalization capability and higher accuracy, while higher values indicate poor model prediction accuracy. The computation results are shown in Table 6.
Table 6.
Prediction accuracy data.
From the results, the MSE, MAE, RMSE, and MAPE are less than 0.05 mm, 0.2 mm, 0.15 mm, and 1%, respectively—satisfying general industrial machinery accuracy standards.
To further validate the reliability and consistency of the reconstructed point cloud, additional statistical analyses were performed based on the paired data (manual measurements vs. point cloud measurements) in Table 4.
Based on 20 pairs of tooth height data in Table 5 (discharge port and middle section high/low-pitch tooth heights), Pearson correlation analysis was performed for manual and point cloud measurements, with r = 0.992 (p < 0.001) computed via Python (detailed process omitted). This indicates extremely strong positive linear consistency, confirming point cloud measurements closely align with manual detection (the gold standard) with solid statistical backing.
Repeatability was verified by calculating the coefficient of variation (CV) of five technical replicates for each measurement point (manual measurements). The CV of all 20 points was ≤0.05% (average CV = 0.04%), which is far below the acceptable industrial repeatability threshold (CV ≤ 1%), demonstrating high stability of the measurement system.
Bland–Altman analysis was used to assess the agreement between the two methods. The bias (mean difference between point cloud and manual measurements) was 0.06 ± 0.09 mm, with a 95% confidence interval (95% CI) of [−0.12, 0.24] mm. All differences fell within the clinically acceptable error range for liner wear measurement (±0.25 mm), confirming that the proposed method has no systematic deviation compared to manual detection.
It can be concluded that the accuracy of the liner point cloud reconstructed using the FoundationStereo algorithm meets the requirements of this study.
4. Liner Wear Evaluation
4.1. Wear Extraction
The core of jaw crusher liner wear extraction lies in comparing differences between post-wear and pre-wear point clouds. Therefore, the approach of “3D reconstructing pre-wear point clouds from design drawings + registering pre-wear and post-wear point clouds via CloudCompare [20]” is adopted to achieve wear extraction. The specific process is as follows.
- (1)
- Acquisition of post-wear point cloud: Binocular images of the liner are captured by binocular cameras as described above. After correction, the 3D reconstruction of the worn liner is performed by the optimized FoundationStereo algorithm, and the PLY format point cloud file of the worn liner is output.
- (2)
- Generation of the pre-wear point cloud adopts a combined approach of actual measurements and CAD cross-validation (to avoid unrealistic theoretical zero tolerance): the measurement is conducted using a digital vernier caliper (Mitutoyo 500-196-30, accuracy ±0.01 mm), with 60 baseline points selected—specifically, 4 sections (consistent with post-wear sections) are defined for each pre-wear liner, and 5 points (tooth top, tooth middle, tooth root, left edge, right edge) are measured per section, totaling 3 liners × 4 sections × 5 points; each point is independently measured five times by two operators, and the average value of these replicates serves as the pre-wear reference, which is then cross-validated against the manufacturer’s STEP-format CAD model (with a deviation ≤ 0.1mm confirming its reliability); subsequently, the measured pre-wear model is discretized into a point cloud via MeshLab and exported in PLY format.
- (3)
- Point cloud registration: CloudCompare 2.13.3 software is used. Taking the less-worn tooth grooves in the post-wear point cloud as the reference, three points are selected as marker points in the tooth grooves. The three points at the same position in the pre-wear point cloud and the post-wear point cloud are aligned, and then the Iterative Closest Point (ICP) algorithm (fine registration) is used to complete the point cloud registration; point cloud registration is repeated three times, with a registration error ≤ 0.05 mm ensured to maintain consistency.
- (4)
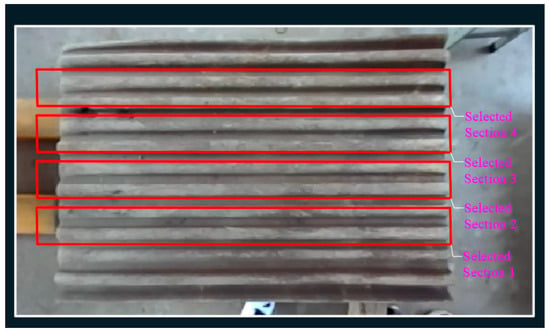
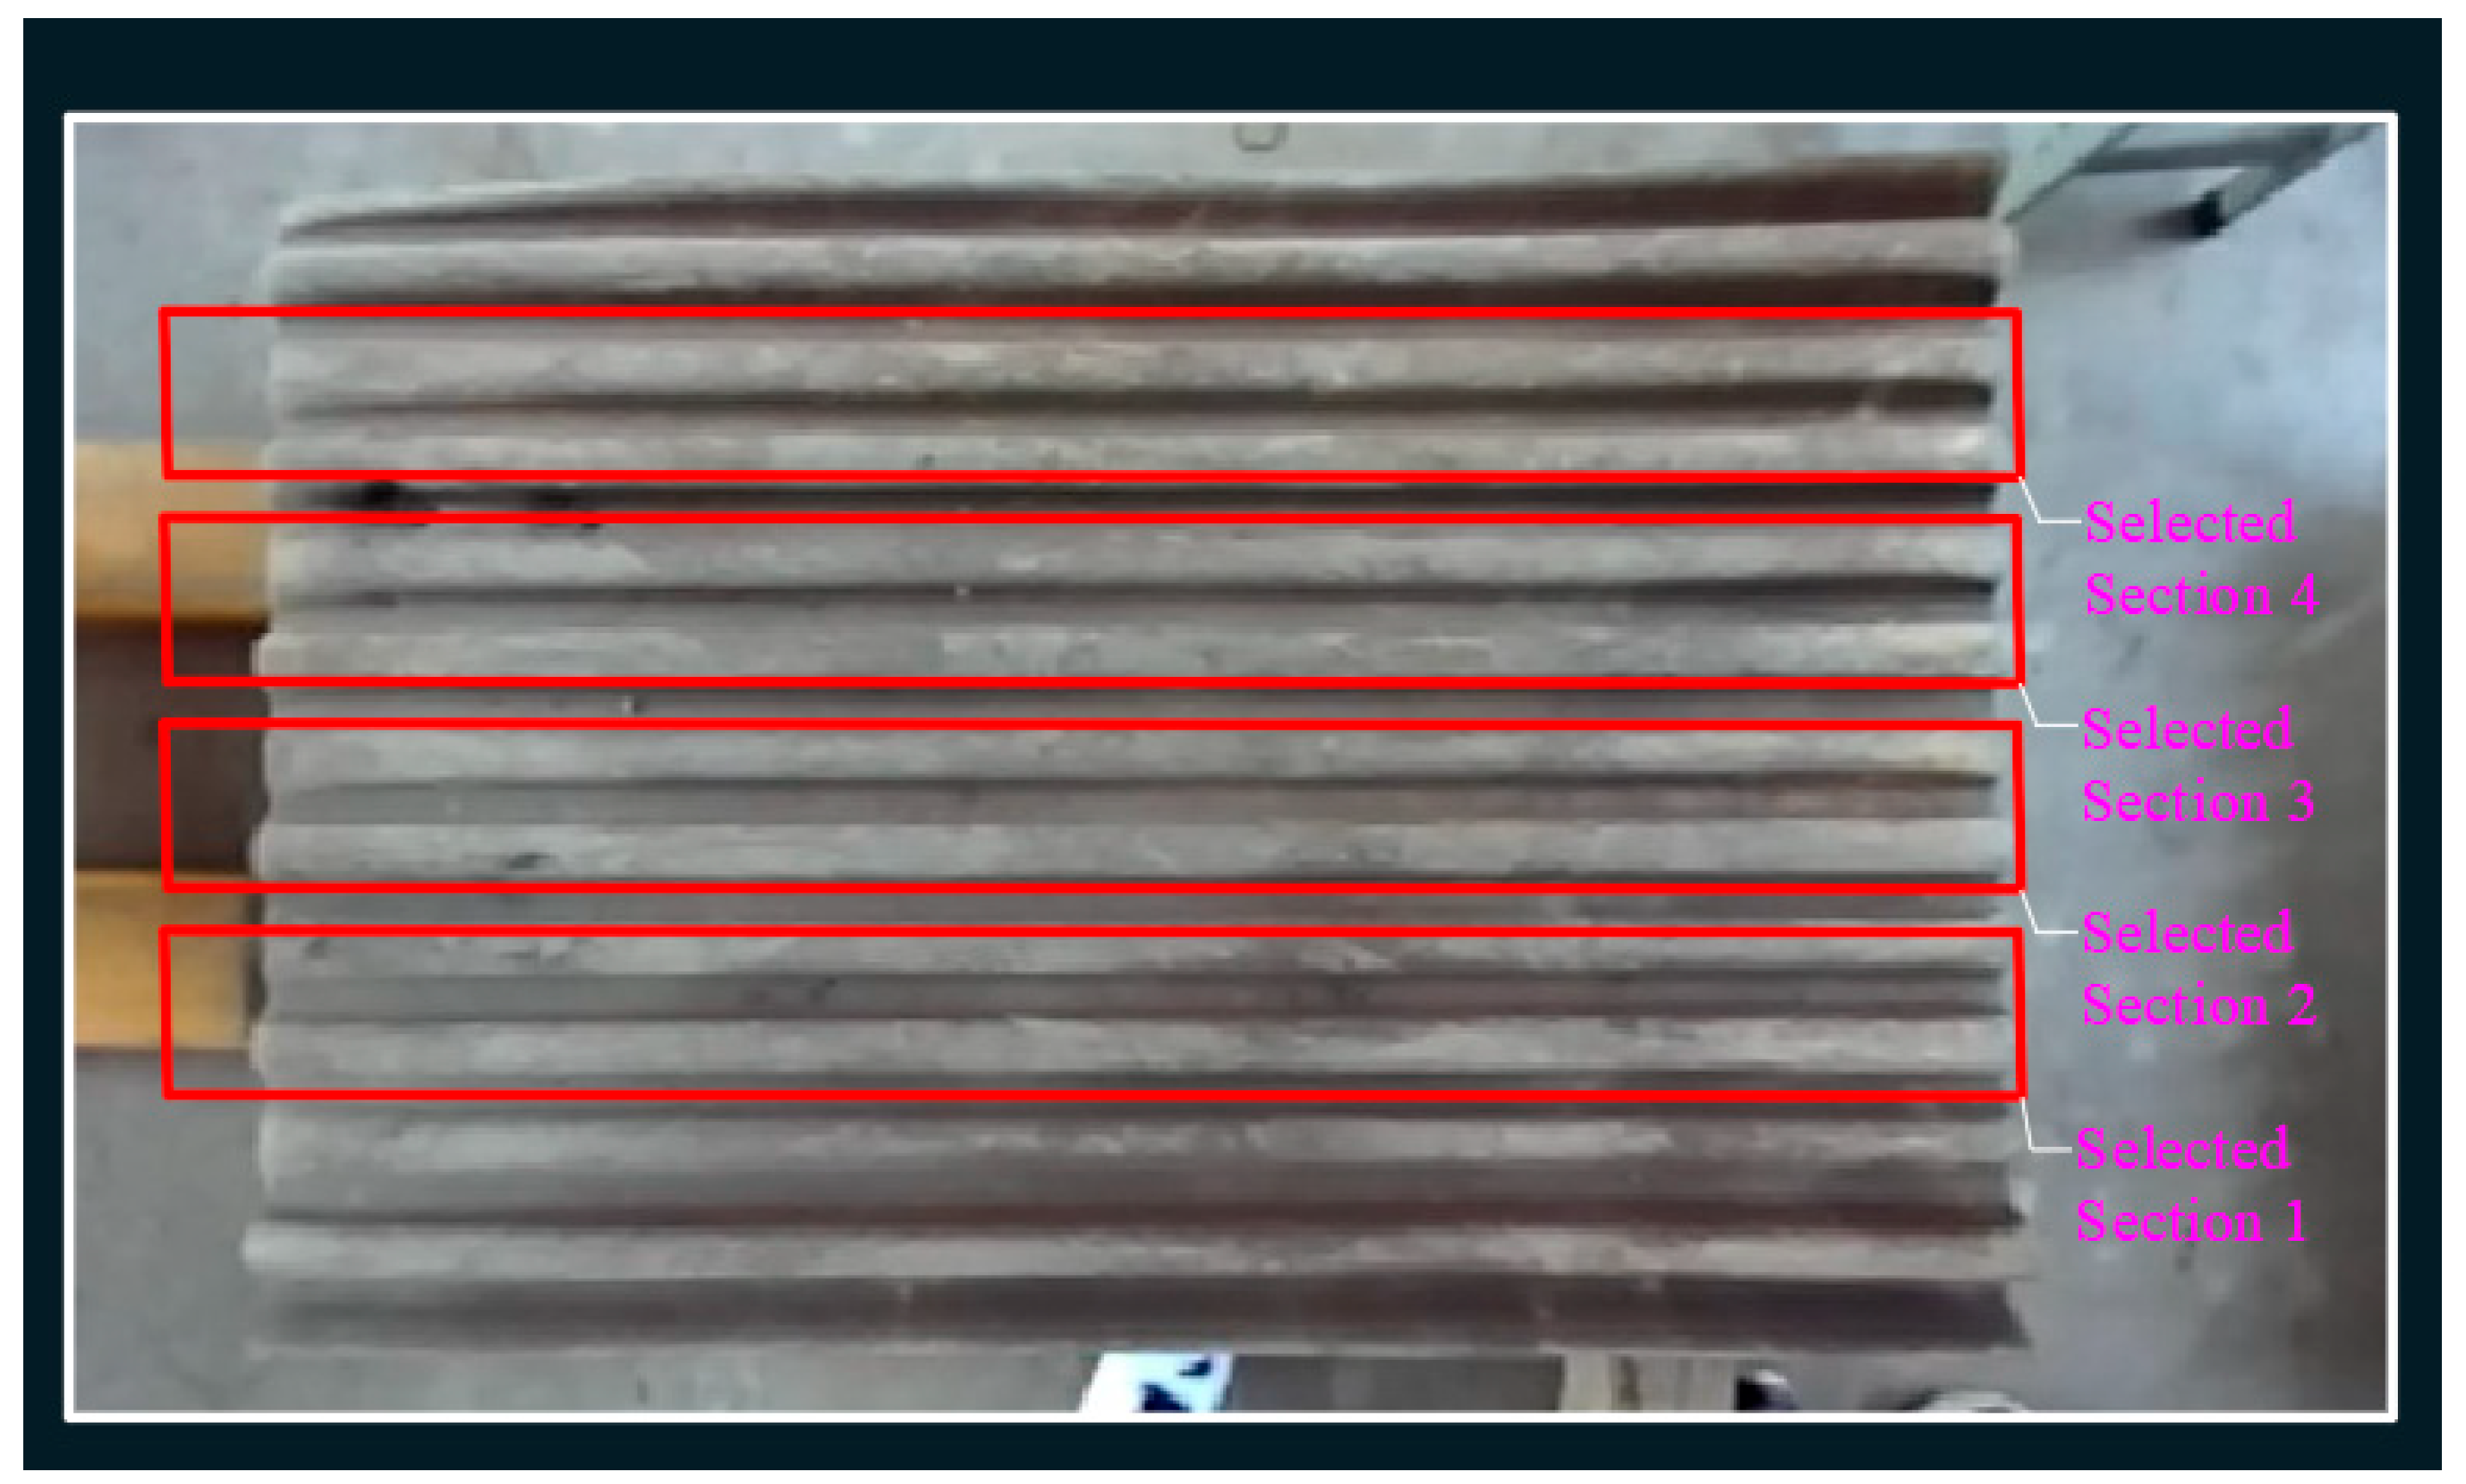
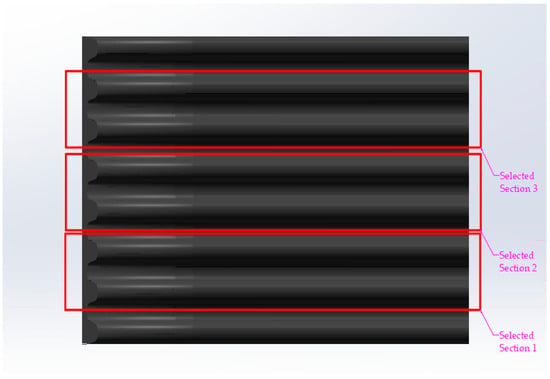
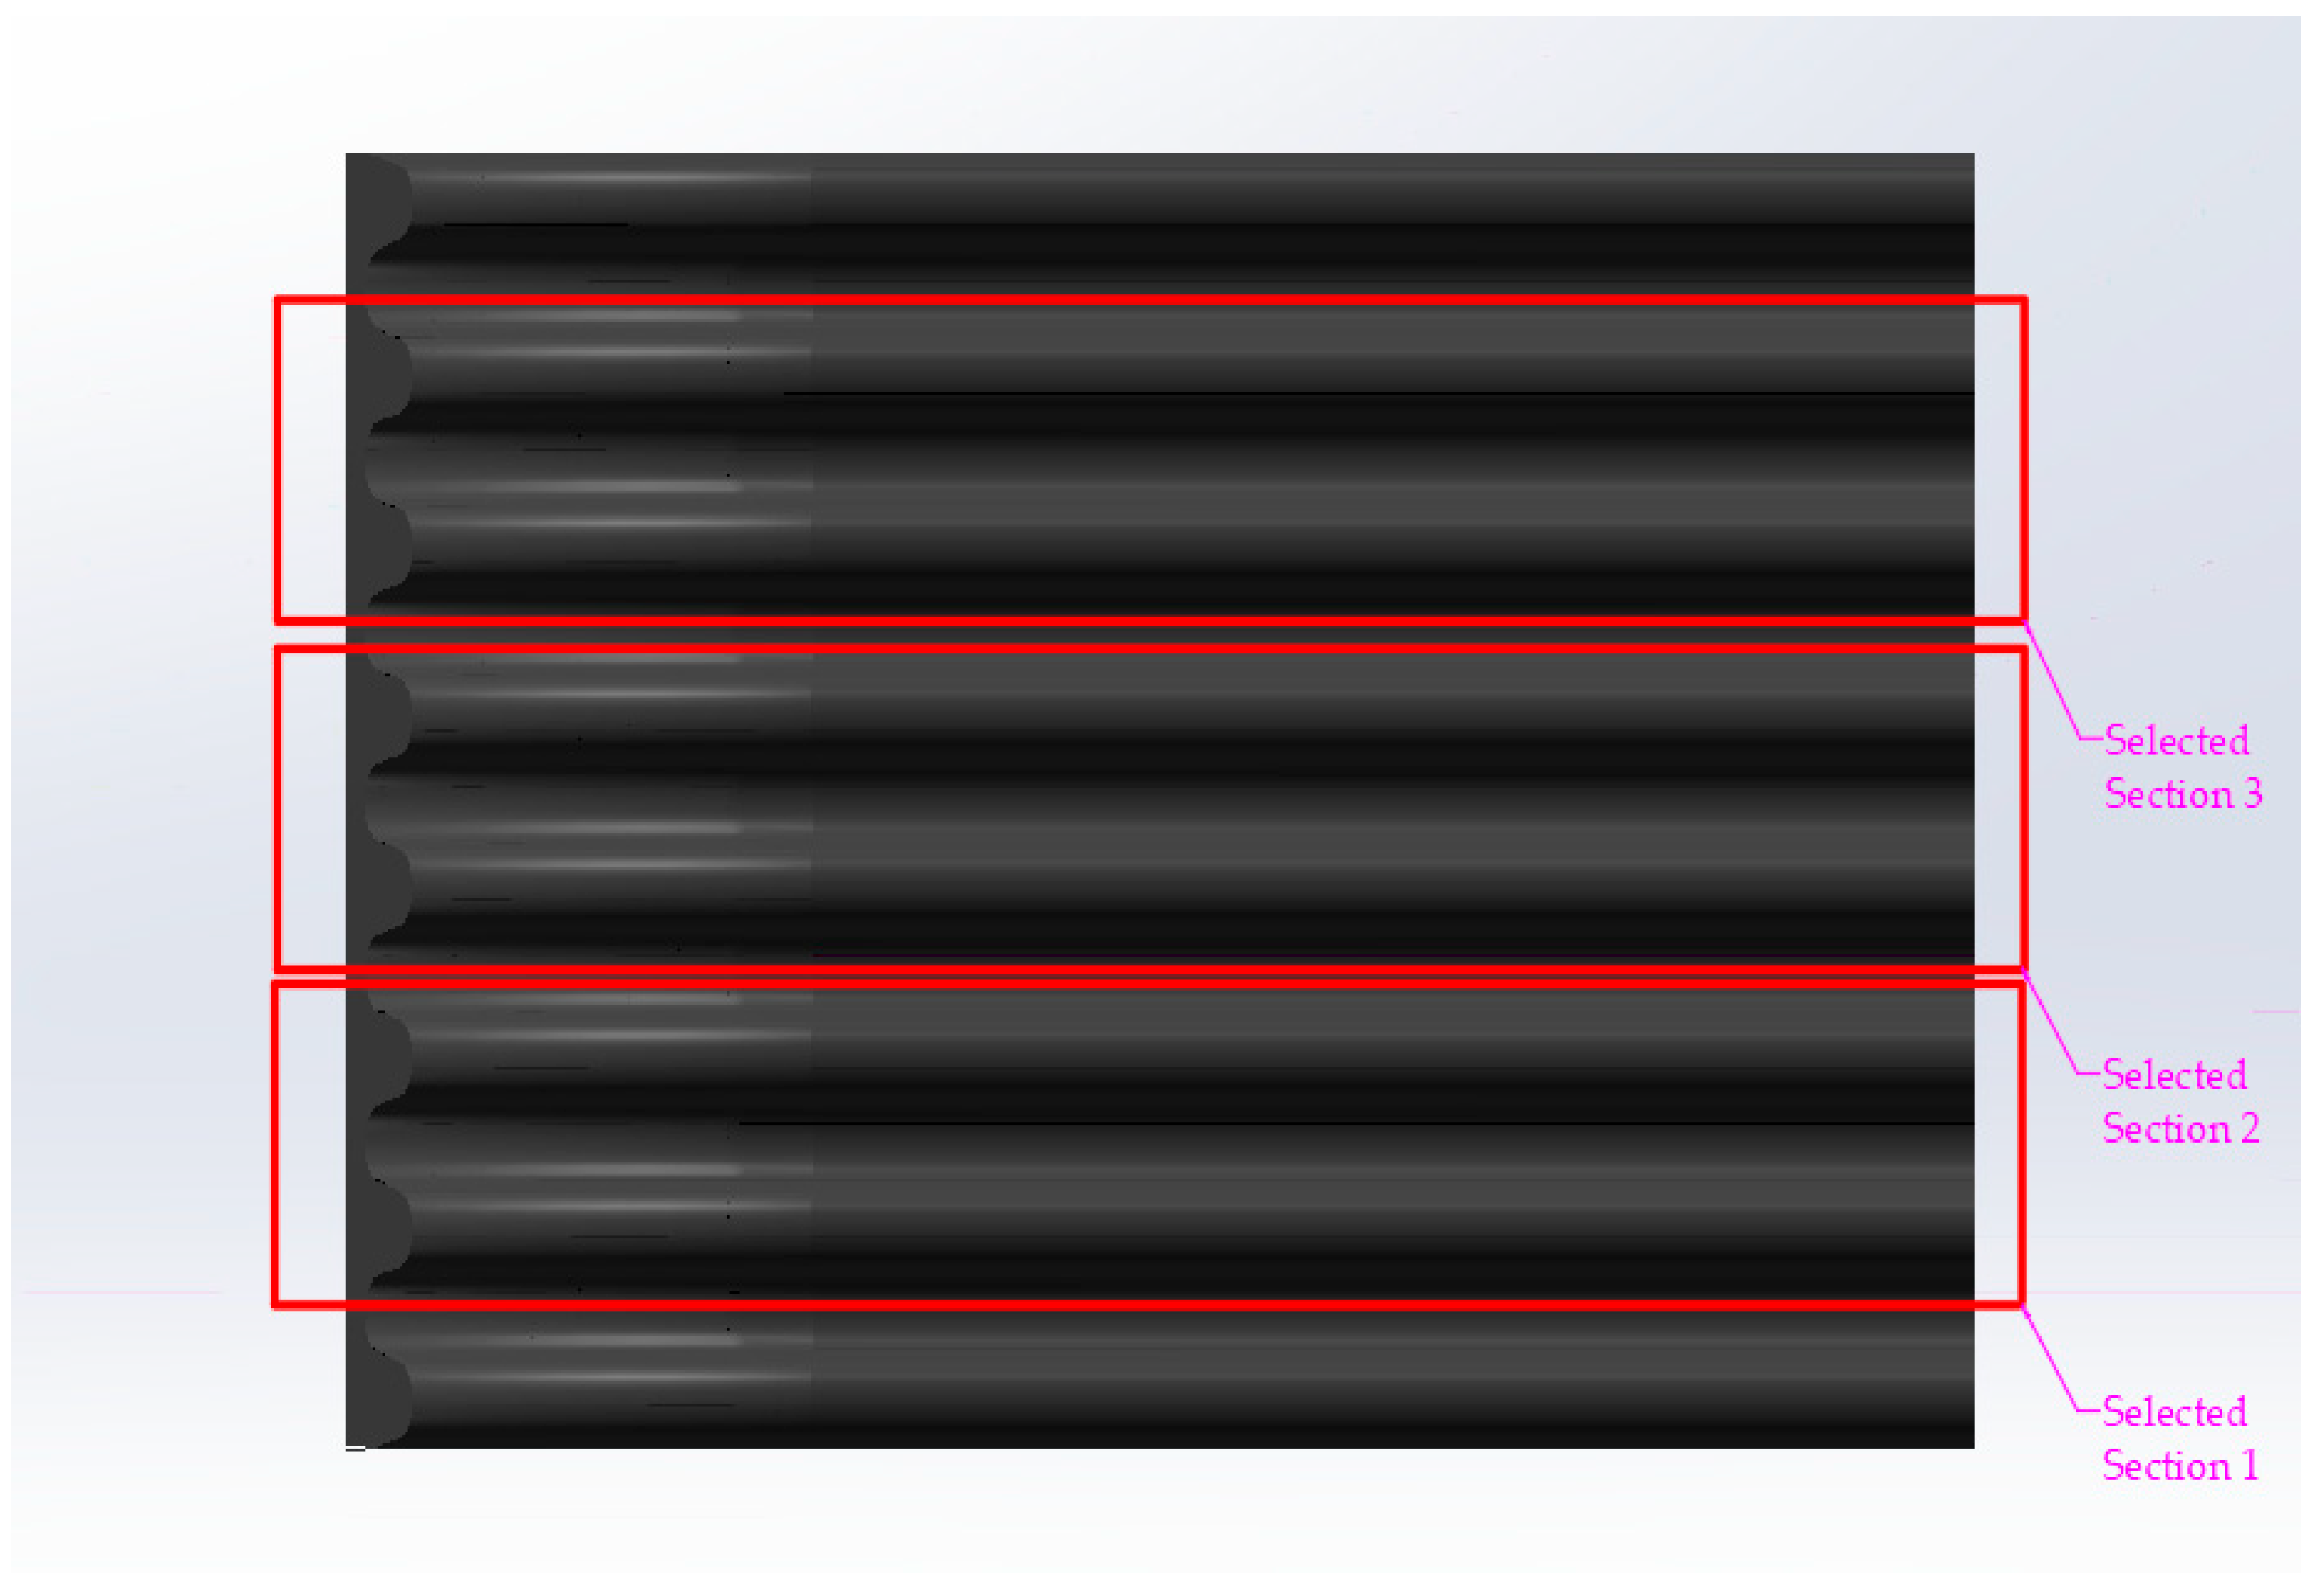
- Point cloud selection: To reduce the calculation of height difference data between the registered wear point cloud and the pre-wear point cloud, four sections of high and low tooth racks at different positions are selected as the subsequent data processing materials from the captured images of the worn liner. According to image analysis, the four sections of high and low tooth racks in the framed area in the following Figure 3 are selected as the wear data analysis objects.Figure 3. Selected sections for wear analysis.
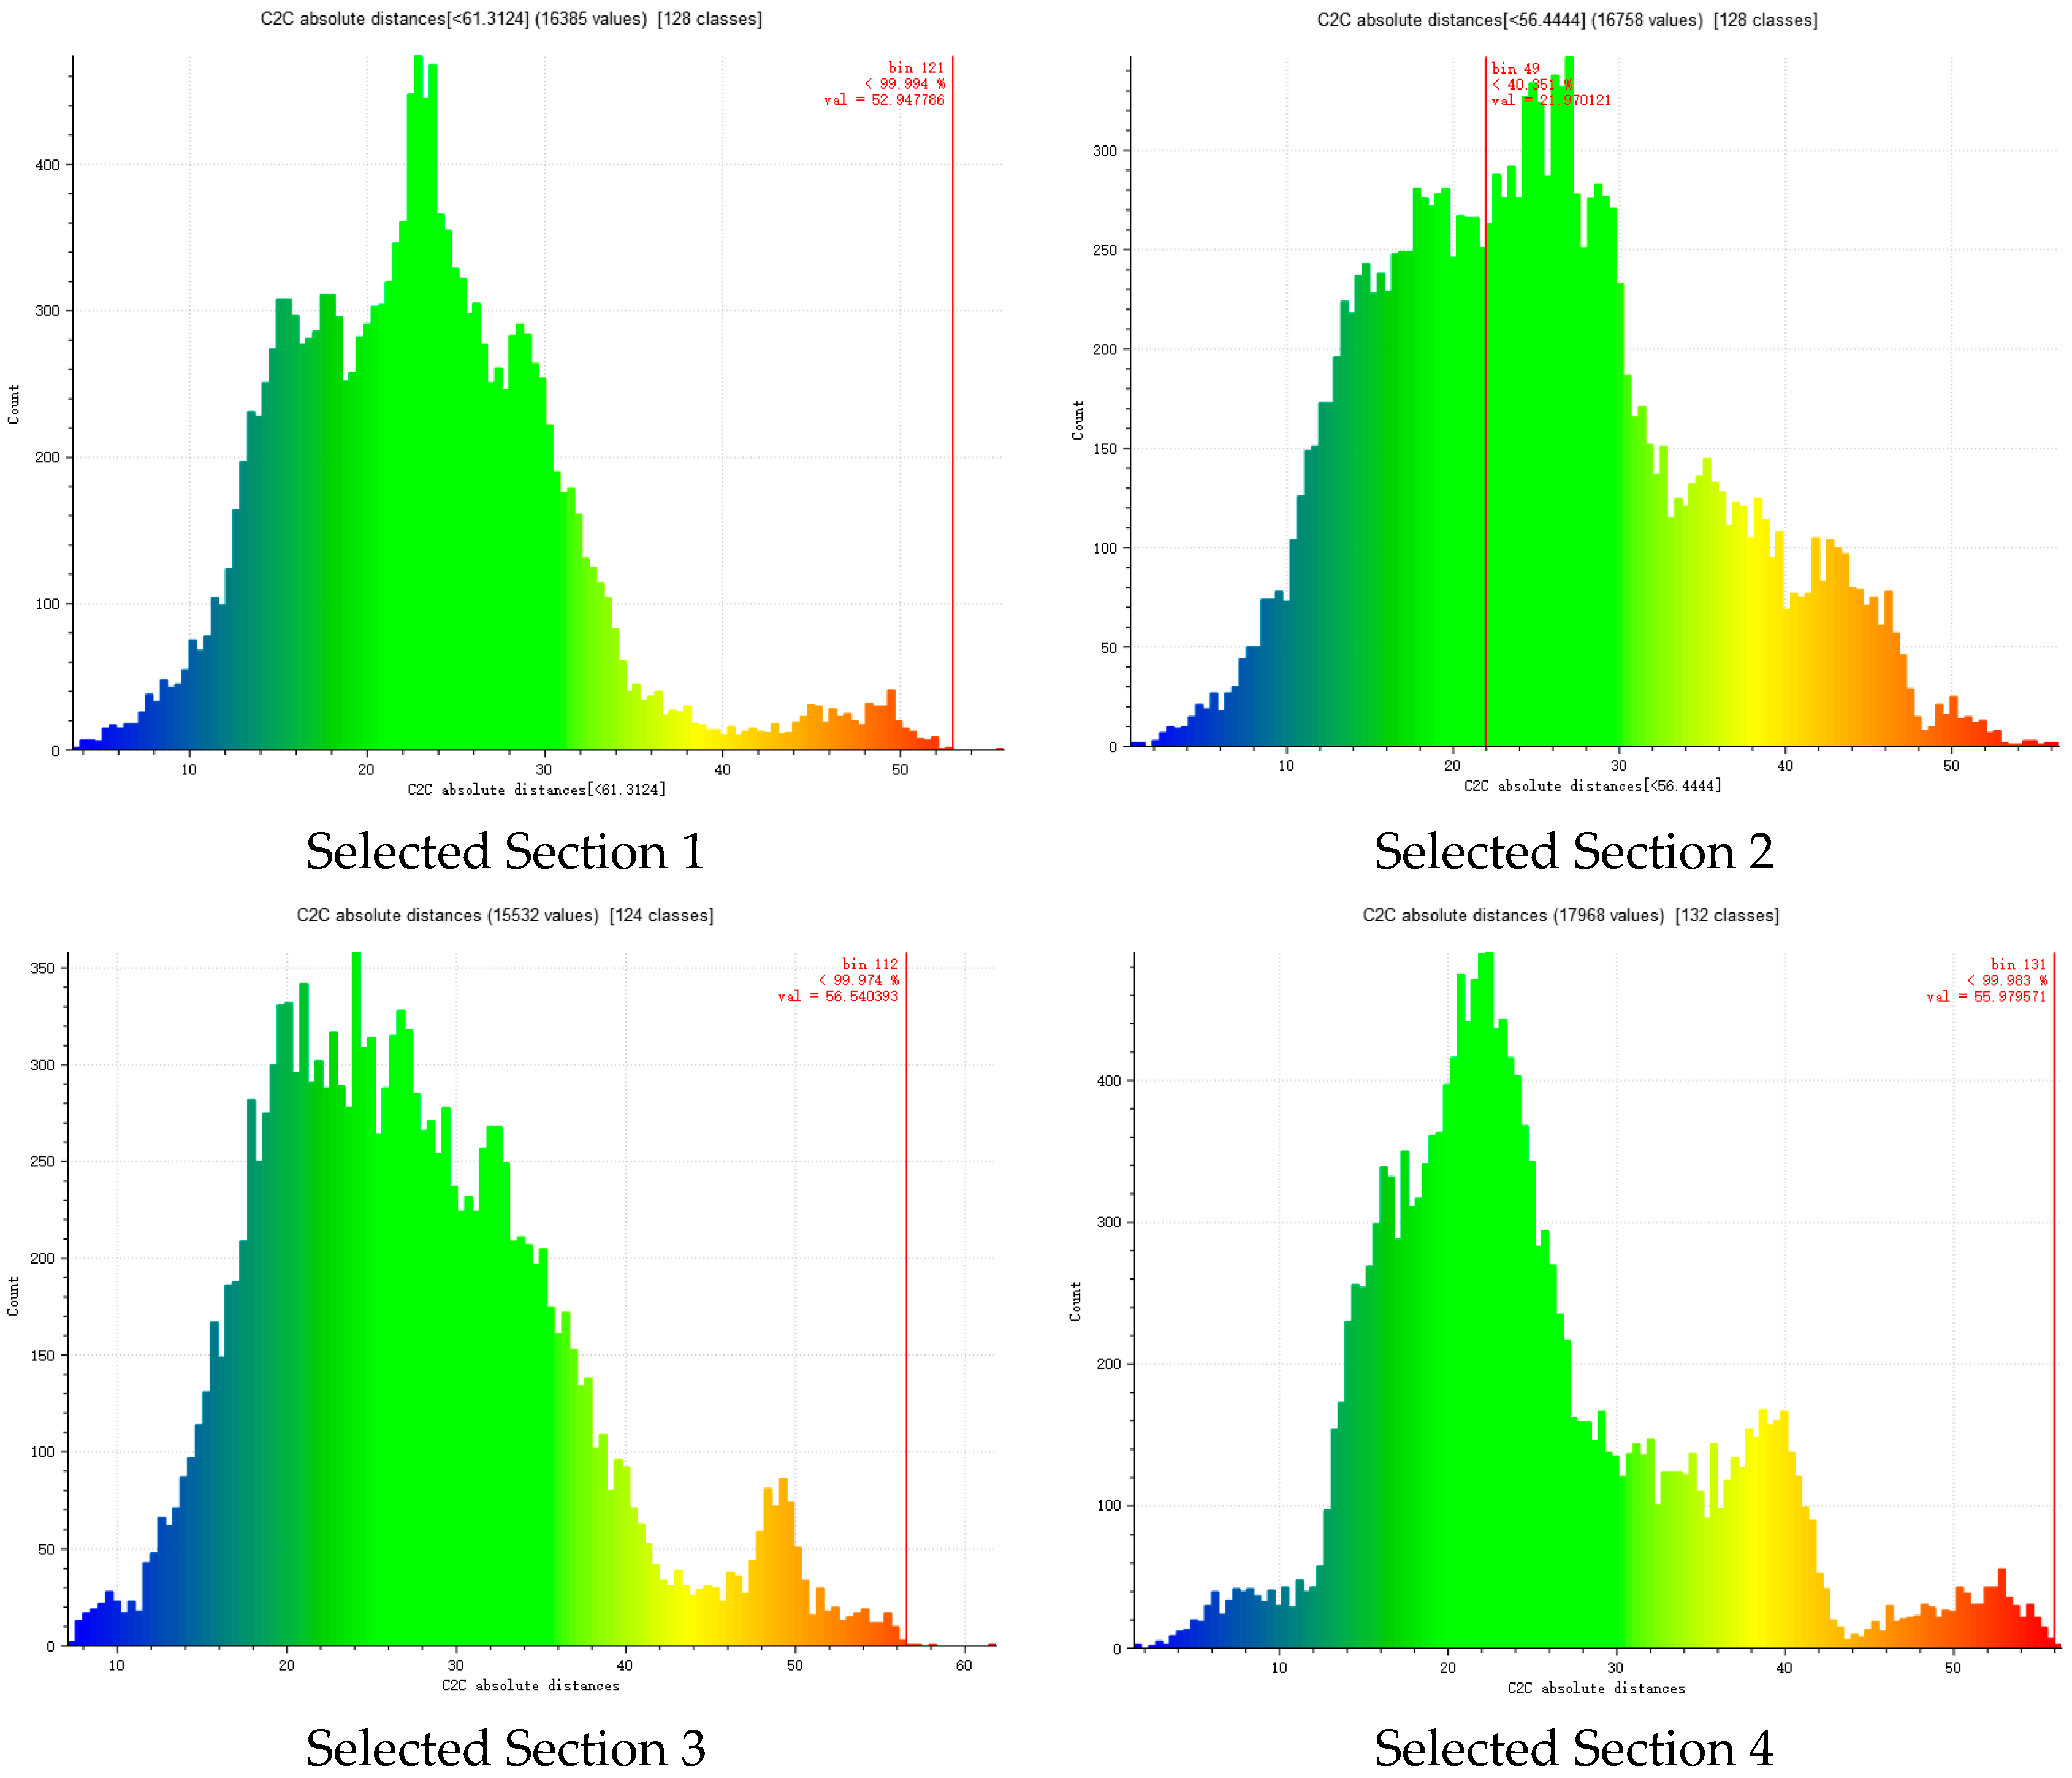
To more comprehensively and meticulously present the effect of post-clipping point clouds, the visualization results of point cloud clipping for Section 1 are supplemented, and the comparison diagram of the wear degree of partial point clouds within this section is simultaneously provided, with the results illustrated in Figure 4 and Figure 5.
Figure 4.
Point cloud diagram of wear analysis for Selected Section 1.
Figure 5.
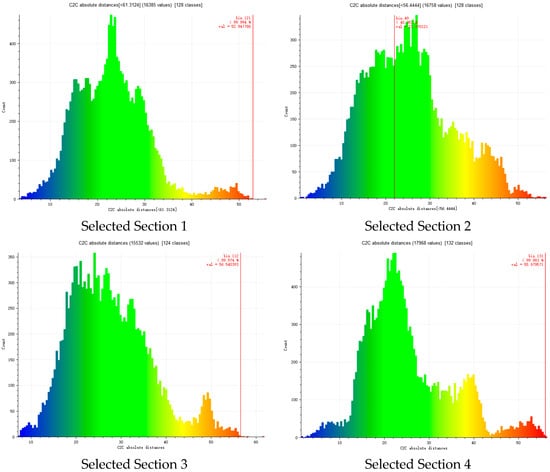
Wear heatmaps of selected sections.
4.2. Quantitative Wear Analysis
To ensure that the analysis results can effectively reflect the wear status of the liner, the following three data variables are used to quantify the wear.
- (1)
- Maximum wear depth (): In the selected section point cloud, maximum height difference between post-wear and pre-wear point clouds (wear depth = pre-wear height—post-wear height, and is positive if pre-wear > post-wear). It is calculated via CloudCompare’s point cloud distance function, with outliers removed (statistical outlier filtering, where the standard deviation multiple = 3). It reflects local wear severity and liner replacement threshold.
- (2)
- Average wear depth (): As the sum of wear depths of all points in the section divided by total point cloud count, it reflects the overall wear level and remaining service life. CloudCompare’s resampling function ensures consistent pre-wear/post-wear point cloud counts; the standard deviation of wear depth indicates wear uniformity (larger = more obvious local differences).
- (3)
- Wear area ratio (): The ratio of the area, where wear depth ≥ average wear depth of the total section area (point cloud projected onto XY plane), reflects wear concentration and guides “local repair” or “overall replacement” decisions.
In terms of the calculation process, the registered pre-wear and post-wear point clouds are first loaded in CloudCompare. Two obvious high and low tooth racks with wear in the liner are manually framed and selected, and the PLY format point cloud data of typical high and low tooth sections are exported. Then, Python + Open3D library is used to read the PLY files. Based on the registration index relationship, the height difference in the pre-wear and post-wear point clouds is calculated point by point to generate a wear depth array. Finally, , , , and the standard deviation of wear depth are calculated for the array, respectively. The stability of the results is verified through three repeated calculations. Through the collaborative analysis of the three indicators, a complete characterization of the liner wear state can be achieved from three dimensions: “local severity, overall level, and regional distribution”, providing a quantitative basis for the operation and maintenance decisions of jaw crushers.
After the definition of wear indicators, this study adopts a repeated-measures experimental design for wear quantification: technical replicates include five repeated measurements for each point and three repeated reconstructions for each image pair; for statistical methods, one-way ANOVA (conducted via SPSS 26.0) is used to test the consistency of replicates (with a significance level α = 0.05, where p > 0.05 indicates no significant difference between replicates), while Pearson correlation analysis is applied to verify the linear relationship between the proposed method and manual detection (requiring a correlation coefficient r ≥ 0.95).
4.3. Wear Calculation
To convert the wear quantification indicators into a more intuitive operation and maintenance decision-making basis, this section ensures the accuracy and readability of the data through data calculation implementation and data statistical display.
In terms of the implementation of wear data calculation, based on the three wear indicators mentioned above, “software tool collaboration + script calculation” is adopted to realize automatic processing. Python, combined with CloudCompare, is used as the tool. Open3D 0.19.0 is responsible for point cloud reading and point-by-point height difference calculation, NumPy 2.0.2 realizes array statistics, and CloudCompare is used for preprocessing and result verification. First, the exported PLY point clouds of the truncated high and low tooth sections are denoised by Open3D (neighborhood point number = 20 and standard deviation multiple = 2.5). After unifying the point cloud density, the automatic calculation of multiple samples is realized through Python scripts. Finally, 10% of the point clouds are extracted for manual verification through CloudCompare.
In terms of wear data statistical display, according to the above operations, the obtained data are as follows (Table 7).
Table 7.
Statistical wear data.
From the statistical results in the table, the average maximum wear depth is 55.05 ± 0.59 mm, the average wear depth is 20.45 ± 0.49 mm, and the average wear area ratio is 88.2 ± 1.1%. Additionally, the coefficient of variation (CV) of all three wear indicators across replicates was ≤1.3%, confirming high repeatability of the measurement system. The reliability of the calculated results is further supported by manual verification of 10% of the point clouds (via CloudCompare), which shows no significant deviation from the automatic calculation results.
4.4. Wear Analysis of a Different-Size and Material Liner
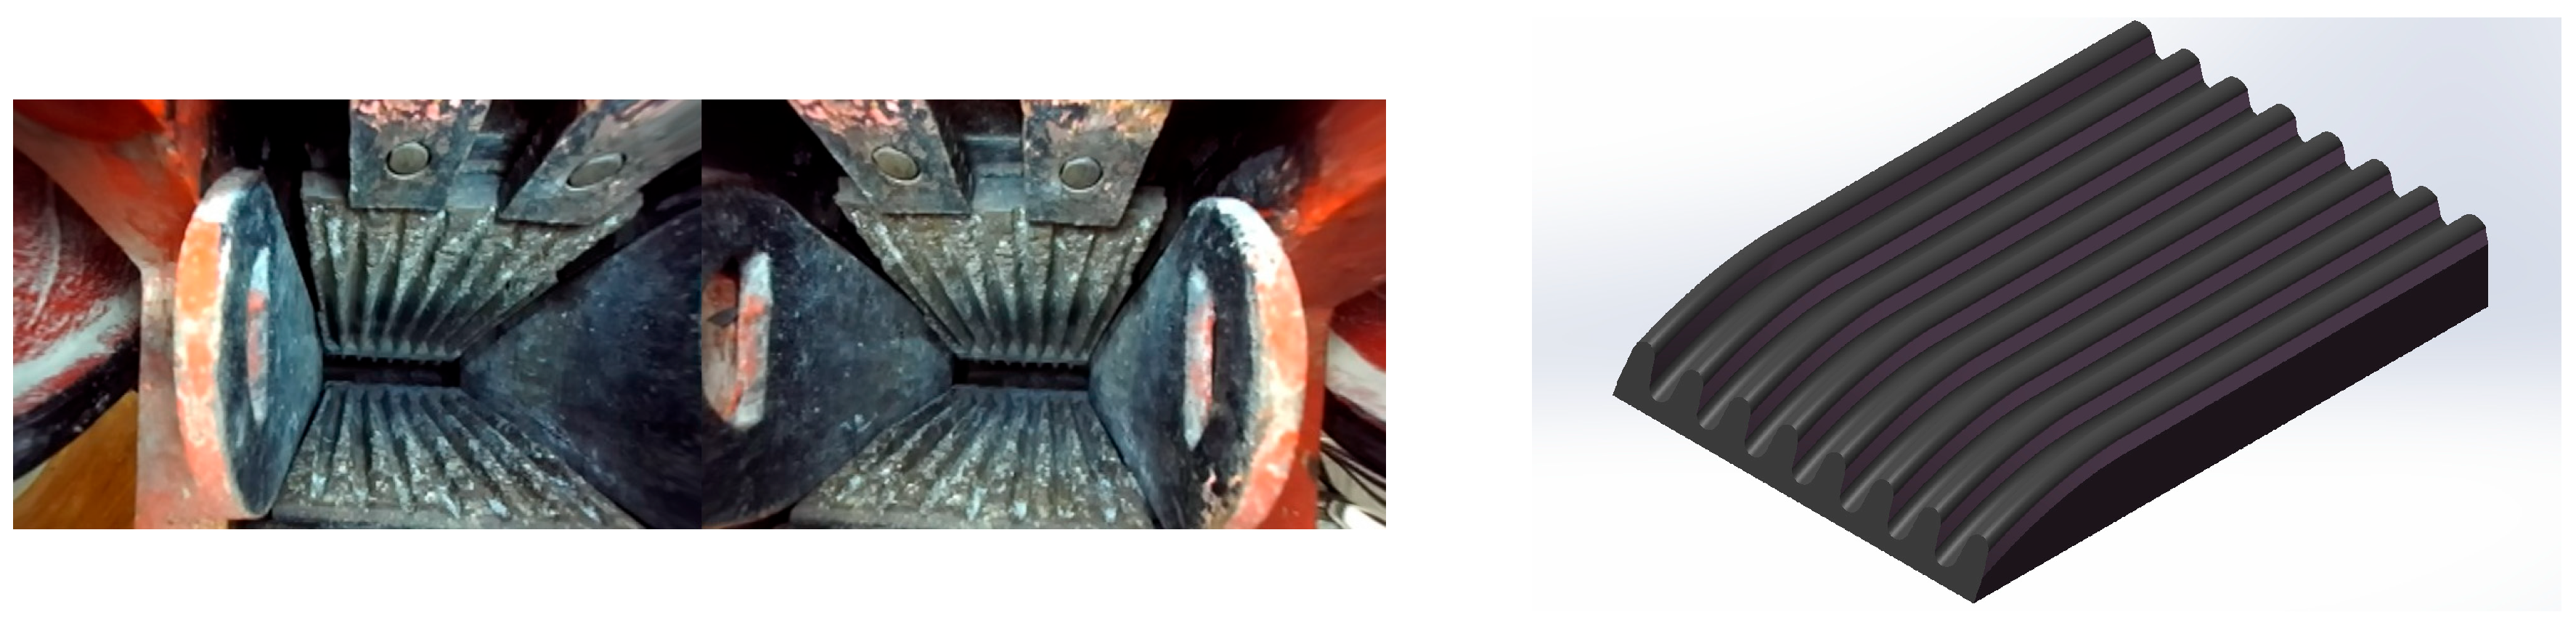
To further verify the generalization of the proposed wear evaluation method, an additional liner (350 mm × 250 mm, length × width) with high manganese steel Mn13 (lower wear resistance than Mn18Cr2) was selected for analysis. It maintained consistent service conditions (same ore type, feed rate, and 6-month operation) as the original liner, and the analysis followed the established workflow (Section 3.4 and Section 4.1) for methodological consistency.
The ZED2 binocular camera was fixed 400 mm perpendicular to the liner’s surface (resolution: 1344 × 376, baseline distance: 119.63 mm). For point cloud precision validation, two tooth height types were measured (middle-section high tooth and discharge port high tooth height; there is no low-pitch tooth design)—five measurement points were selected on each of the two sampling lines according to the tooth profile distribution, using the tooth root as the reference, totaling ten points. Manual measurements used a digital vernier caliper (Mitutoyo 500-196-30, with an accuracy of ±0.01 mm) with five replicates per point. For wear quantification, four independent regions were defined: front-middle area, rear-middle area, discharge port left area, and discharge port right area. The pre-wear point cloud was generated via “actual measurements + CAD cross-validation” (deviation ≤ 0.05 mm relative to the STEP-format CAD model) and discretized to a density consistent with that of the post-wear point cloud (Figure 6).
Figure 6.
350 mm × 250 mm Mn13 liner: worn object and unworn point cloud.
Three-dimensional point cloud reconstruction adopted the fine-tuned FoundationStereo algorithm and CUDA optimization (single-view latency: 118 ms and EPE: 0.09 mm). Based on the measured liner geometry (as shown in Figure 7: the selection positions of liner tooth heights), the tooth height comparison between manual and point cloud measurements is shown in Table 8.
Figure 7.
The 350 mm × 250 mm Mn13 liner: Selection positions of liner tooth heights.
Table 8.
Comparison of tooth height data (350 mm × 250 mm, Mn13 liner).
Mean Absolute Error (MAE) = 0.065 mm, Mean Square Error (MSE) = 0.0042 mm2, Root Mean Square Error (RMSE) = 0.065 mm, and Mean Absolute Percentage Error (MAPE) = 0.33%, meeting industrial standards.
Wear quantification was performed via pre-wear/post-wear point cloud registration (CloudCompare + ICP, 3 repeated registrations, error ≤0.001 mm). The selected regions are illustrated in Figure 8, with quantification results for the four regions shown in Table 9.
Figure 8.
Selected regions for wear quantification of 350 mm × 250 mm Mn13 liner.
Table 9.
Statistical wear data of the 350 mm × 250 mm Mn13 liner.
The coefficient of variation (CV) = 1.1% ≤ 1.2%, confirming excellent repeatability of the measurement system. The average maximum wear depth (22.12 mm) is significantly lower than the 54.25 mm of the 1400 mm × 915 mm Mn18Cr2 liner, which aligns with the material properties (Mn13 has lower wear resistance than Mn18Cr2) and smaller liner size. This verifies that the proposed method maintains reliable quantification performance across liners of varying sizes, materials, and structural designs, demonstrating strong generalization.
5. Conclusions
This paper proposes a statistically rigorous non-contact method for jaw crusher liner wear evaluation based on binocular vision and FoundationStereo. Key conclusions are as follows.
The ZED2 binocular camera calibrated via Zhang Zhengyou’s method, combined with planar normal constraint rectification, achieved stable high precision. Statistical results of three technical replicates showed a Z-axis Mean Absolute Error (MAE) of 0.080 ± 0.003 mm, with Z-axis precision improved by over 30% compared to traditional rectification methods, laying a reliable hardware foundation for subsequent 3D reconstruction.
The FoundationStereo algorithm, fine-tuned for the liner’s weak-texture scenarios, exhibits excellent generalization and efficiency. On the independent validation set, the Endpoint Error (EPE) is 0.09 ± 0.008 mm. After CUDA acceleration optimization, 3D reconstruction latency is reduced to 120 ms (30% speedup vs. the unoptimized version) without precision loss. Statistical correlation analysis indicates the reconstructed point cloud has an MAE ≤ 0.128 mm, MSE ≤ 0.0174, and a correlation coefficient (r) of 0.992 with manual measurements—all meeting industrial-level standards.
The proposed wear quantification system, based on three core indicators (maximum wear depth, average wear depth, and wear area ratio) and the “measured pre-wear baseline + post-wear point cloud registration” framework, realizes reliable characterization of liner wear. For the 1400 mm × 915 mm Mn18Cr2 liner, the average maximum wear depth is 55.05 ± 0.59 mm, the average wear depth is 20.45 ± 0.49 mm, and the average wear area ratio is 88.2 ± 1.1%. These results are supported by strict manual measurement verification (Section 3.4) with a low coefficient of variation (CV ≤ 1.3% for all wear indicators) and minimal data dispersion, confirming the reliability and stability of the quantification system.
The method demonstrates strong generalization. Verification on the 350 mm × 250 mm Mn13 liner (different size and material) yields a point cloud measurement MAE of 0.064 mm, average maximum wear depth of 21.98 ± 0.22 mm, and CV ≤ 1.2%. These results comply with industrial measurement accuracy requirements, supported by consistent data distribution and minimal dispersion across repeated tests, confirming reliable performance across diverse liner specifications.
This method effectively mitigates the safety hazards of traditional contact measurement, providing a scientific, digital, and efficient solution for jaw crusher liner predictive maintenance with significant industrial application value. Nevertheless, it has inherent limitations: (1) it is tailored exclusively to jaw crushers, requiring parameter adjustments for liners of other crusher types (e.g., cone crushers); (2) CUDA acceleration necessitates NVIDIA GPUs (minimum computing power ≥ 7.0), imposing potential hardware cost burdens on small- and medium-sized enterprises; and (3) it is confined to static single-point measurement, lacking real-time monitoring capability for liner wear evolution.
Future research will address these limitations by (1) developing a “multi-view continuous acquisition + time-series analysis” framework for dynamic wear prediction; (2) pursuing lightweight model deployment to adapt to edge computing devices (e.g., Jetson Xavier), lowering hardware thresholds; and (3) extending the algorithm’s adaptability across crusher types and establishing a universal wear evaluation model for multi-specification liners.
Supplementary Materials
The following supporting information can be downloaded at: https://www.mdpi.com/article/10.3390/app16020998/s1, Table S1: Coordinates of selected measurement points.
Author Contributions
Conceptualization, C.W. and Z.J.; methodology, Z.J.; software, Z.F. and Y.Z.; validation, C.W., Z.J., and Z.F.; formal analysis, Z.J.; investigation, C.W.; resources, Q.L.; data curation, Z.F.; writing—original draft preparation, C.W.; writing—review and editing, Z.J.; visualization, Z.F.; supervision, Z.J. and Q.L.; project administration, C.W.; funding acquisition, Q.L. All authors have read and agreed to the published version of the manuscript.
Funding
This research was funded by the National Natural Science Foundation of China, grantnumber 52364025.
Institutional Review Board Statement
Not applicable.
Informed Consent Statement
Not applicable.
Data Availability Statement
The data presented in this study are available from the corresponding author upon request.
Conflicts of Interest
The authors declare no conflicts of interest.
References
- Johansson, M.; Bengtsson, M.; Evertsson, M.; Hulthén, E. A fundamental model of an industrial-scale jaw crusher. Miner. Eng. 2017, 105, 69–78.321. [Google Scholar] [CrossRef] [Scilit]
- Lindqvist, M.; Evertsson, C.M. Liner wear in jaw crushers. Miner. Eng. 2003, 16, 1–12. [Google Scholar] [CrossRef] [Scilit]
- Hutchings, I.M. Tribology: Friction and Wear of Engineering Materials; Edward Arnold: Encino, CA, USA, 1992; 352p, ISBN 0 340 56184. [Google Scholar]
- Jia, R.; Wang, L.; Zheng, C.; Chen, T. Online Wear Particle Detection Sensors for Wear Monitoring of Mechanical Equipment—A Review. IEEE Sens. J. 2022, 22, 2930–2947. [Google Scholar] [CrossRef] [Scilit]
- Wang, R.; Wei, L.; Gu, Z.; Liu, X. Three-Dimensional Reconstruction of Shoe Soles via Binocular Vision Based on Improved Matching Cost. Mathematics 2022, 10, 3548. [Google Scholar] [CrossRef] [Scilit]
- Cheng, L.; Chen, S.; Liu, X.; Xu, H.; Wu, Y.; Li, M.; Chen, Y. Registration of Laser Scanning Point Clouds: A Review. Sensors 2018, 18, 1641. [Google Scholar] [CrossRef] [Scilit] [PubMed]
- Zhang, S. High-speed 3D shape measurement with structured light methods: A review. Opt. Lasers Eng. 2018, 106, 119–131. [Google Scholar] [CrossRef] [Scilit]
- Şekeroğlu, K.; Soysal, Ö.M. Comparison of SIFT, Bi-SIFT, and Tri-SIFT and their frequency spectrum analysis. Mach. Vis. Appl. 2017, 28, 875–902. [Google Scholar] [CrossRef] [Scilit]
- Aguayo, M.; Yu, Z.; Piasecki, M.; Montalto, F. Development of a web application for Low Impact Development Rapid Assessment (LIDRA). J. Hydroinformatics 2013, 15, 1276–1295. [Google Scholar] [CrossRef] [Scilit]
- Wen, B.; Trepte, M.; Aribido, J.; Kautz, J.; Gallo, O.; Birchfield, S. FoundationStereo: Zero-Shot Stereo Matching. arXiv 2025, arXiv:2501.09898. [Google Scholar]
- Zou, Q.; Feng, H.-Y. Push-pull direct modeling of solid CAD models. Adv. Eng. Softw. 2019, 127, 59–69. [Google Scholar] [CrossRef] [Scilit]
- Chen, L.; Feng, C.; Ma, Y.; Zhao, Y.; Wang, C. A review of rigid point cloud registration based on deep learning. Front. Neurorobot. 2024, 17, 1281332. [Google Scholar] [CrossRef] [Scilit] [PubMed]
- Peng, P.; Chen, L.; Wang, J.; Chen, F. A review of detection technologies for mechanical wear. Lubr. Eng. 2018, 43, 115–124. [Google Scholar]
- Jiang, D.; Han, Y.; Wang, K.; Jiang, S.; Cui, W.; Song, B. Functional degradation reliability analysis for non-uniform wear of multi-rotating joints of mechanical structures. Eng. Fail. Anal. 2024, 157, 107934. [Google Scholar] [CrossRef] [Scilit]
- Peng, Y.; Ni, X.; Zhu, Z.; Yu, Z.; Yin, Z.; Li, T.; Liu, S.; Zhao, L.; Xu, J. Friction and wear of liner and grinding ball in iron ore ball mill. Tribol. Int. 2017, 115, 506–517. [Google Scholar] [CrossRef] [Scilit]
- Fladvad, M.; Onnela, T. Influence of jaw crusher parameters on the quality of primary crushed aggregates. Miner. Eng. 2020, 151, 106338. [Google Scholar] [CrossRef] [Scilit]
- Yin, Y.; Zhu, H.; Yang, P.; Yang, Z.; Liu, K.; Fu, H. High-precision and rapid binocular camera calibration method using a single image per camera. Opt. Express 2022, 30, 18781–18799. [Google Scholar] [CrossRef] [Scilit] [PubMed]
- Zhang, S.; Su, W.; Liu, F.; Sun, L. Review of stereo matching based on deep learning. Displays 2025, 87, 102940. [Google Scholar] [CrossRef] [Scilit]
- Hamid, M.S.; Manap, N.A.; Hamzah, R.A.; Kadmin, A.F. Stereo matching algorithm based on deep learning: A survey. J. King Saud Univ.-Comput. Inf. Sci. 2022, 34, 1663–1673. [Google Scholar] [CrossRef] [Scilit]
- Alabdullah, S.A.; Hannam, A.G.; Wyatt, C.C.; McCullagh, A.P.; Aleksejuniene, J.; Mostafa, N.Z. Comparison of digital and conventional methods of fit evaluation of partial removable dental prosthesis frameworks fabricated by selective laser melting. J. Prosthet. Dent. 2022, 127, 478.e1–478.e10. [Google Scholar] [CrossRef] [Scilit] [PubMed]

Disclaimer/Publisher’s Note: The statements, opinions and data contained in all publications are solely those of the individual author(s) and contributor(s) and not of MDPI and/or the editor(s). MDPI and/or the editor(s) disclaim responsibility for any injury to people or property resulting from any ideas, methods, instructions or products referred to in the content. |
© 2026 by the authors. Licensee MDPI, Basel, Switzerland. This article is an open access article distributed under the terms and conditions of the Creative Commons Attribution (CC BY) license.