


Abstract
This study aimed to develop a non-invasive blood glucose estimation method by integrating wearable multimodal signals, including photoplethysmography (PPG), electrodermal activity (EDA), and skin temperature (ST), with food log–derived nutritional features, and to validate its clinical reliability. We analyzed data from 16 adults who underwent continuous glucose monitoring (CGM) while multimodal physiological signals were collected over 8–10 consecutive days, yielding more over 20,000 paired samples. Features from food logs and physiological signals were extracted, followed by feature selection using Boruta and minimum Redundancy Maximum Relevance (mRMR). Five machine learning models were trained and evaluated using five-fold cross-validation. Food log features alone demonstrated stronger predictive power than unimodal physiological signals. The fusion of nutritional, physiological, and temporal features achieved the best accuracy using LightGBM, reducing the RMSE to 12.9 mg/dL, with a MARD of 7.9%, a MAE of 8.82 mg/dL, and R2 of 0.69. SHapley Additive exPlanations (SHAP) analysis revealed that 24-h carbohydrate and sugar intake, time since last meal, and short-term EDA features were the most influential predictors. By integrating multimodal wearable and dietary information, the proposed framework significantly enhances non-invasive glucose estimation. The interpretable LightGBM model demonstrates promising clinical utility for continuous monitoring and early dysglycemia management.
1. Introduction
Diabetes is a lifelong metabolic disorder characterized by chronic hyperglycemia, primarily caused by insufficient insulin secretion, impaired insulin action, or a combination of both [1]. Insulin, a hormone produced by the pancreas, regulates blood glucose levels. When insulin secretion or action is compromised, glucose cannot be effectively transported into cells for energy metabolism, resulting in abnormally elevated blood glucose concentrations. Symptoms of diabetes include thirst, hunger, and increased urination frequency, and diabetic patients are at a higher risk of developing various severe complications, including retinopathy, nephropathy, neuropathy, and cardiovascular diseases [2]. Diabetes is classified into three main types: Type 1 diabetes mellitus (T1DM), Type 2 diabetes mellitus (T2DM), and gestational diabetes. T2DM is the most common type, affecting over 95% of diabetes patients globally [3,4]. According to the latest statistics from the World Health Organization (WHO), approximately 537 million adults (aged 20–79) had diabetes in 2021, and the total number of diabetes patients is projected to rise to 643 million by 2030, making diabetes the seventh leading cause of death [4].
Early intervention is crucial. Lifestyle and behavioral programs have been shown to improve glycemic control [5,6]. Although minimally invasive CGM is clinically available, it remains costly and typically requires professional implantation, limiting broad adoption [7,8,9]. These constraints have motivated research on non-invasive, scalable solutions.
With the growth of smart health technologies, compact and affordable wearables (e.g., wristbands, smartwatches) routinely capture physiological signals such as PPG, electrocardiography (ECG), EDA, and ST. Coupled with artificial intelligence, such devices are increasingly used for chronic disease management, risk assessment, and public health monitoring [10,11,12,13,14,15].
Recent studies explored non-invasive glucose estimation from physiological signals. For example, Zhang et al. proposed a fitting-based sliding window algorithm with three-level classification accuracy of 81.49% [16]. Tsai et al. extracted 30 time-domain and derivative features from PPG signals, reaching 80% accuracy, though the system exhibited poor generalizability across individuals [17]. Multimodal approaches have combined ECG with PPG [18] or dual-wavelength PPG with bioimpedance [19], reporting promising error metrics and high Clarke Error Grid (CEG) coverage. However, these approaches have predominantly relied on endogenous physiological signals, offering limited representation of exogenous drivers such as meal timing and nutrient composition, which are key determinants of postprandial glucose fluctuations. This gap restricts model accuracy and robustness across diverse populations. To address these limitations, this study makes the following key contributions:
- Multimodal Features fusion framework. We propose a novel blood glucose estimation framework that integrates wearable physiological signals with food log–derived nutritional and temporal features. By jointly modeling endogenous physiological dynamics and exogenous meal-driven fluctuations, the framework achieves a more comprehensive representation of glycemic variation.
- Robust feature engineering and selection. A unified preprocessing pipeline is designed, comprising denoising, short-window feature extraction, and a two-stage feature selection strategy. The combination of Boruta and mRMR ensures that retained predictors are both highly informative and minimally redundant, thereby improving robustness and reducing overfitting in high-dimensional multimodal data.
- Rigorous benchmarking and interpretability. Multiple state-of-the-art machine learning regressors are systematically compared, with the LightGBM-based fusion model demonstrating the best performance. Beyond predictive accuracy, model interpretability is achieved through SHAP analysis, which identifies physiologically meaningful features thereby enhancing transparency and supporting potential clinical adoption.
Section 2 describe the experimental equipment, data preprocessing procedures, feature extraction, as well as the proposed model fusion algorithm. The subsequent sections present the experimental results, followed by a detailed discussion and the conclusions of the study.
2. Materials and Methods
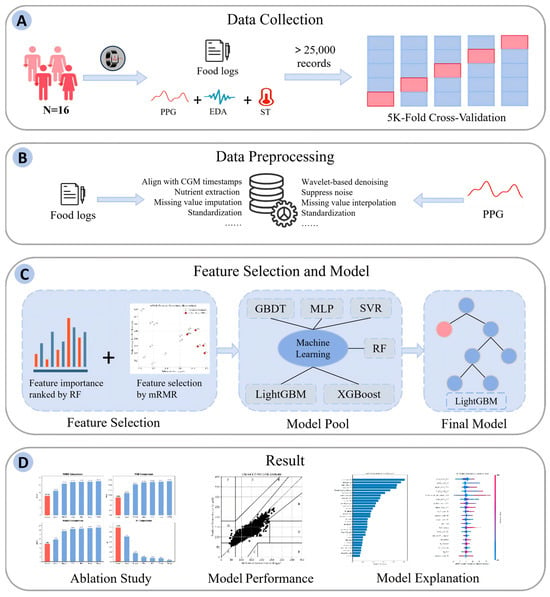
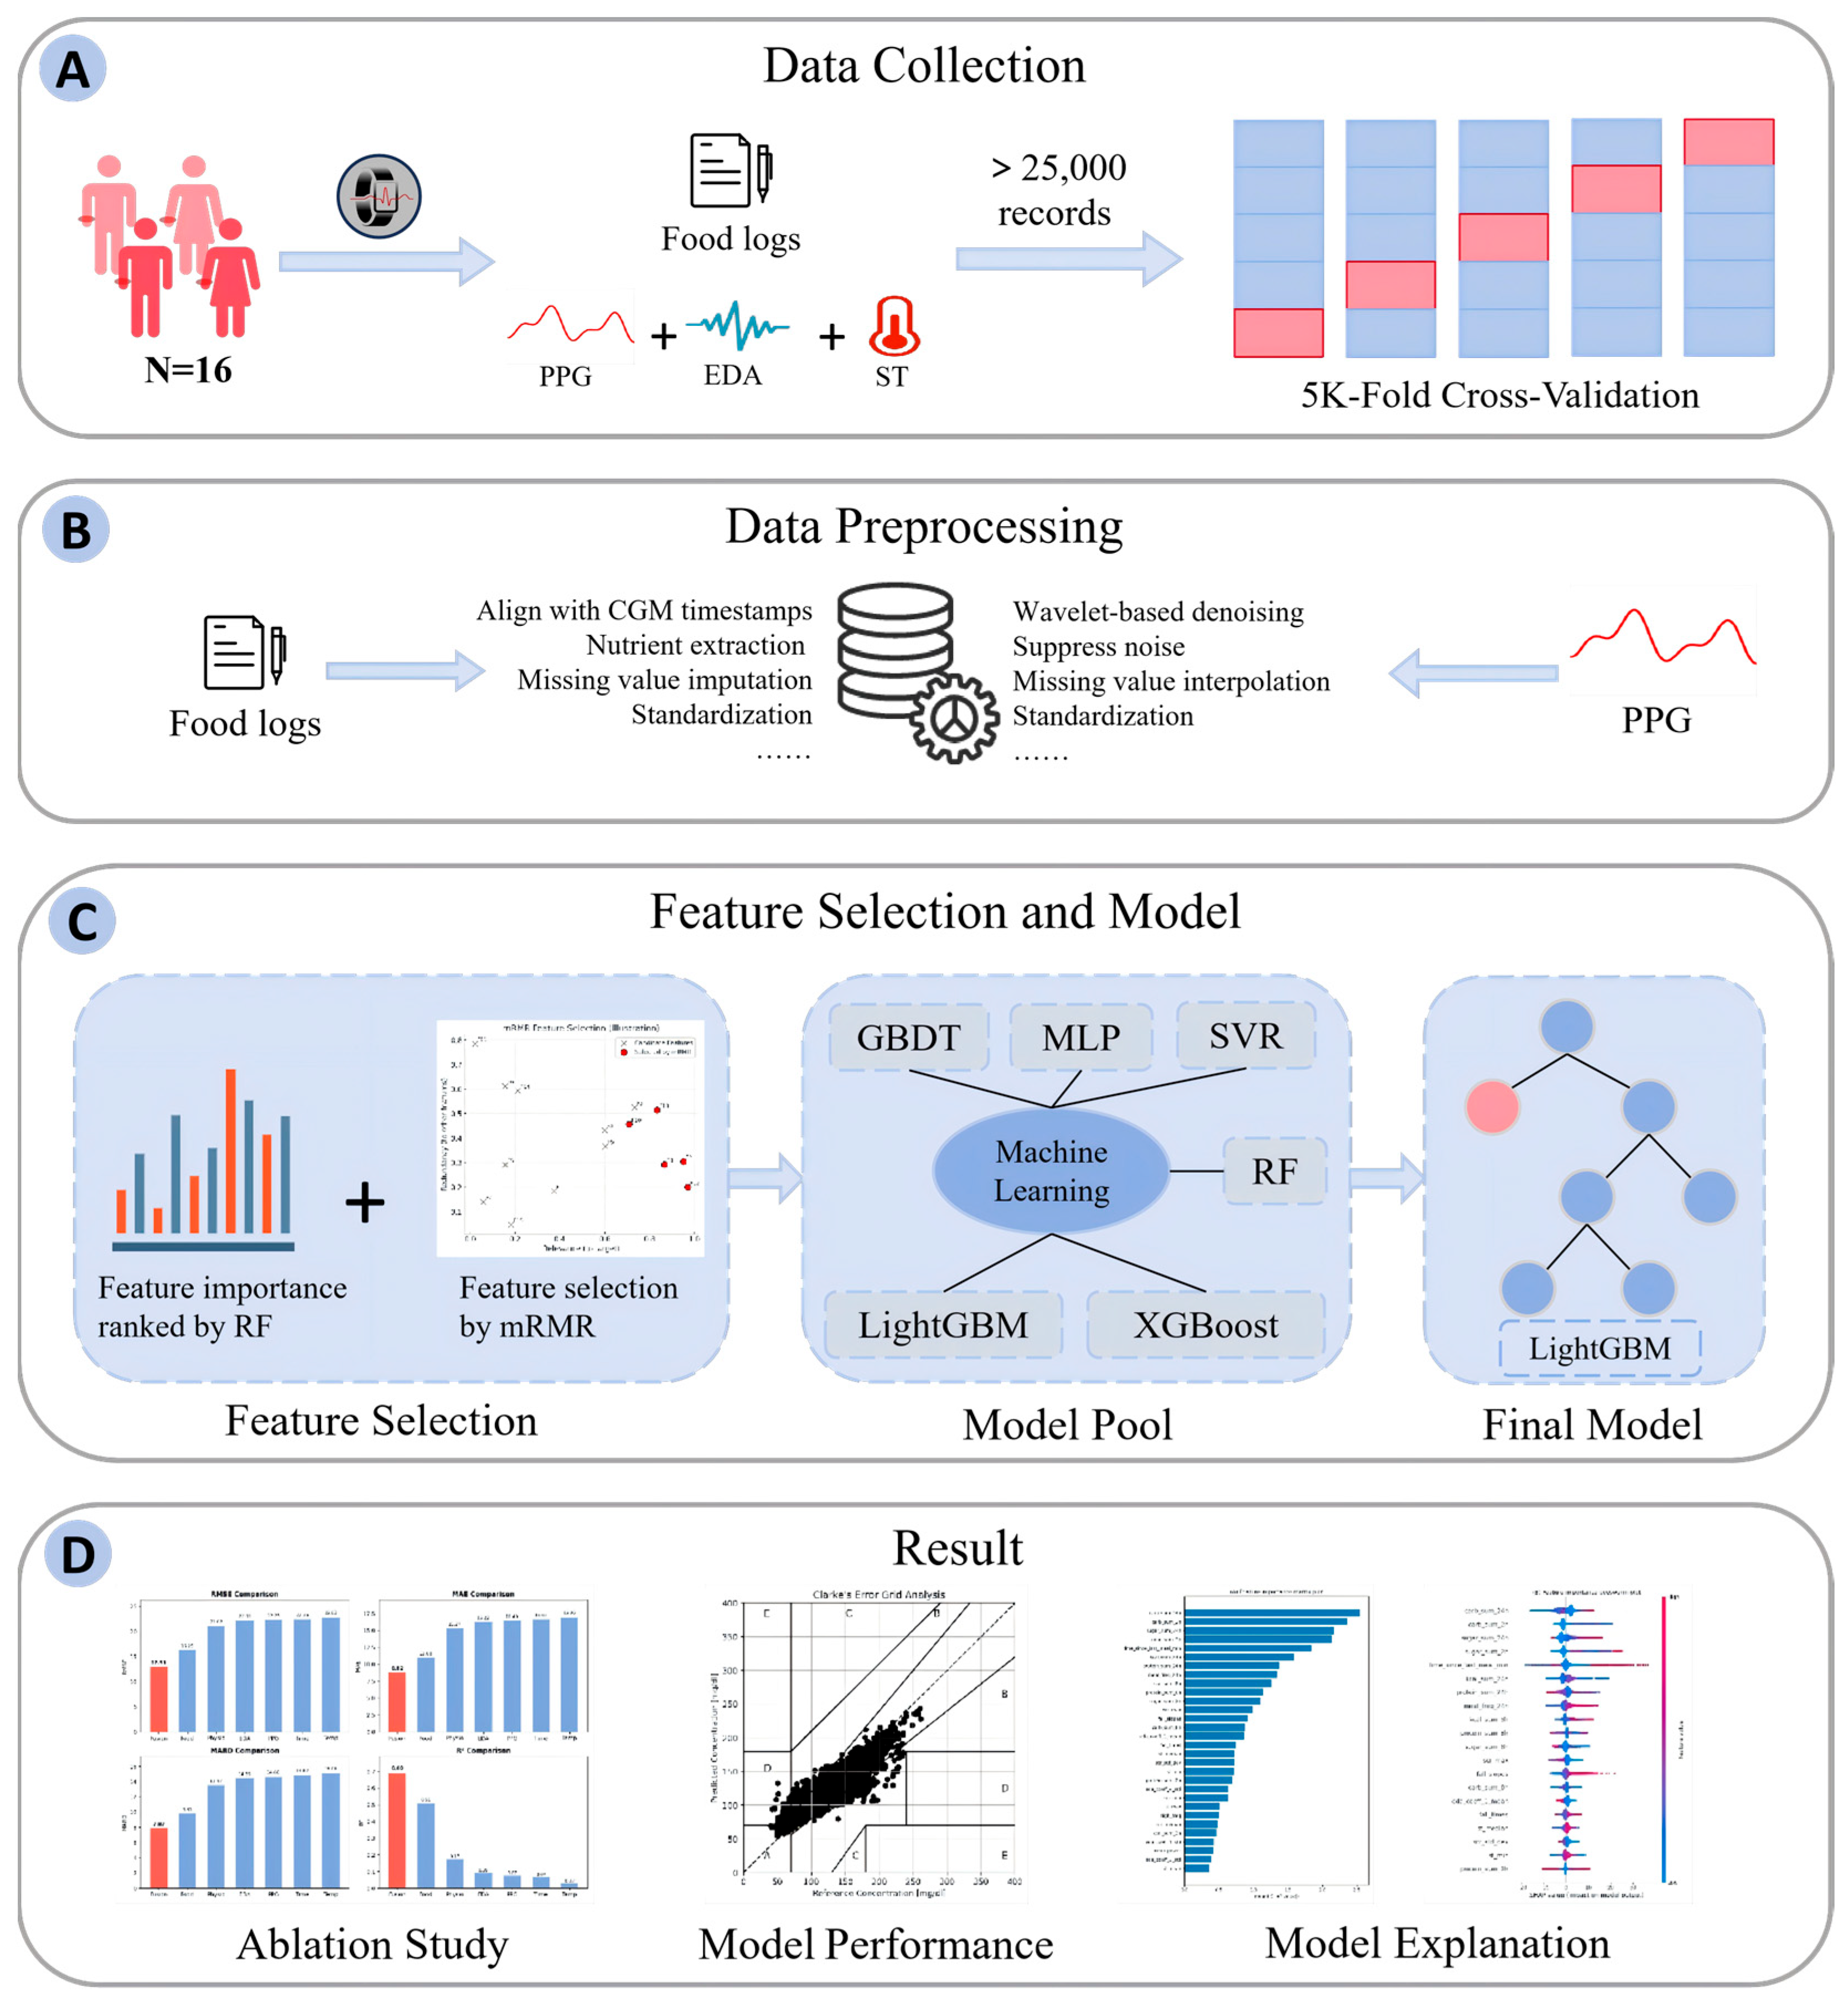
Figure 1 illustrates the design concept of the multi-modal feature fusion technique for early-stage diabetes prediction.
Figure 1.
Overall framework of multi-modal feature fusion. (A) Multimodal physiological data collection and dataset construction. (B) Feature extraction and statistical analysis across signal modalities. (C) Machine learning modeling with multiple regression algorithms evaluated via five-fold cross-validation, and LightGBM selected as the final model. (D) Model performance evaluation and interpretability analysis.
2.1. Data Collection
This study recruited participants from the Duke University patient population who had glycated hemoglobin (A1C) levels within the high-normal to prediabetic range [20]. All participants were post-menopausal females aged 35–65 years. As such, the study population was restricted to this group, and sex-based comparisons were not applicable beyond this population.
Inclusion criteria were as follows: (1) adults aged between 35 and 65 years; (2) A1C level in the high-normal or prediabetic range; (3) ability to attend study visits and comply with study procedures; and (4) access to a personal computer or laptop to enable daily upload of wearable device data.
Exclusion criteria were as follows: (1) history of chronic obstructive pulmonary disease (COPD); (2) history of cardiovascular disease; (3) history of cancer; (4) history of chronic kidney disease; (5) patients who opted out of clinical research opportunities in MaestroCare; and (6) inability to provide daily uploads due to lack of appropriate equipment or technical limitations.
A total of 16 participants meeting the inclusion criteria were enrolled in this study. Each participant wore a Dexcom G6 CGM device (Dexcom Inc., San Diego, CA, USA) and an Empatica E4 (Empatica Inc., Boston, MA, USA) wrist-worn wearable sensor for 8–10 consecutive days, enabling continuous monitoring of physiological signals and glucose dynamics under free-living conditions. This design allowed the collection of day-to-day physiological and behavioral variability within a short-term longitudinal window.
The Dexcom G6 recorded interstitial glucose concentrations (mg/dL) at 5-min intervals. Simultaneously, the Empatica E4 measured PPG (64 Hz), EDA (4 Hz) and ST (4 Hz). E4 data were uploaded via the Empatica Manager desktop application to secure cloud storage, while CGM data were collected through the Dexcom Clarity mobile or web platform.
In this study, participant privacy was ensured by de-identifying all data through the assignment of unique subject identifiers and the application of date-shifting procedures. During the study period, participants were provided with standardized breakfast meals on alternating days and were instructed to record all dietary intake in food logs. These records were subsequently aligned with the CGM timeline to facilitate multimodal data fusion.
2.2. Data Preprocessing
Raw food log entries and continuous physiological recordings were transformed into structured features suitable for machine learning analysis through a unified preprocessing pipeline. Dietary intake was extracted from subject-reported logs, including total energy and macronutrient composition such as carbohydrates, sugars, and proteins, and aligned with CGM timestamps. To capture metabolic dynamics at different scales, cumulative nutritional indicators were calculated over 2-h, 8-h, and 24-h windows. The 2-h window corresponds to the typical postprandial glycemic excursion, reflecting short-term metabolic responses to meals [21]. The 8-h window represents diurnal eating patterns and intermediate-term nutrient load, while the 24-h window provides an integrated measure of daily energy balance, which is strongly linked to long-term glycemic control [22]. Based on these windows, aggregated features were derived, including total calories, carbohydrate, sugar, and protein intake, as well as meal frequency indices quantifying eating density and temporal difference measures such as time since last meal to reflect inter-meal intervals and metabolic state. In total, 17 nutritional features were constructed from the food logs. A detailed description of these features is provided in Supplementary Table S1. Missing values were imputed using median or zero substitution, and all continuous variables were standardized prior to model training.
PPG, EDA, and ST were continuously recorded by the wearable device. To improve signal quality, raw waveforms were preprocessed using a wavelet-based denoising strategy. Wavelet transform provides joint time–frequency analysis and is well suited for quasi-periodic biomedical signals such as PPG [23]. In this study, the eighth-order Symlet wavelet (sym8) was employed. The denoising procedure involved decomposing the raw signal into approximation and detail coefficients, applying soft-thresholding to high-frequency components to suppress noise, and reconstructing the denoised waveform via inverse transformation. This process effectively reduced baseline drift and high-frequency noise while preserving the essential morphological characteristics of the physiological signals.
After the wavelet-based denoising step, an artifact detection and handling procedure was implemented to further enhance data reliability. Artifacts were identified based on both signal-level and physiological plausibility criteria, including infinite or undefined values, extreme outliers, and segments with zero variance indicative of signal dropout or sensor malfunction [24,25]. In addition, physiologically implausible measurements derived from the signals were filtered to prevent the inclusion of non-representative data in feature extraction. Short duration artifacts were handled through local interpolation or median-based correction to preserve temporal continuity, whereas feature windows containing persistent or unrecoverable artifacts were excluded from further analysis. Overall, artifact handling affected only a limited portion of the dataset, and the majority of samples were retained after preprocessing. Missing values were handled using median imputation, and all continuous variables were subsequently standardized using z-score normalization to ensure comparability across modalities.
2.3. Feature Extraction
After preprocessing, multidimensional physiological features were extracted from PPG, EDA, and ST to characterize autonomic nervous system (ANS) activity and metabolic state [26,27,28,29]. From the PPG signal, 35 features were obtained, including heart rate variability (HRV) indices and pulse waveform morphology. HRV, widely used to assess autonomic function, was calculated from peak-to-peak intervals using time- and frequency-domain methods [30,31,32,33]. Additional PPG features captured hemodynamic changes, such as waveform contour and the dicrotic notch [34,35]. The EDA signal yielded 20 features, including statistical descriptors of skin conductance response (SCR) as well as wavelet-based coefficients that captured time–frequency dynamics [27]. From ST, eight statistical descriptors such as mean, standard deviation, skewness, and kurtosis were derived to reflect peripheral thermoregulatory responses influenced by glucose fluctuations [28,29]. Altogether, 63 physiological features across the three modalities were included in the analysis. A detailed description and mathematical definition of each feature are provided in Supplementary Table S2.
2.4. Feature Selection
A total of 80 features were initially extracted from the food logs and physiological signals. Using the full feature set without selection may introduce redundancy, increase the risk of overfitting, and reduce model interpretability. Therefore, a two-stage feature selection pipeline was employed, integrating Boruta—a random forest–based wrapper method—and mRMR, a mutual information–based ranking approach. This combined strategy was designed to retain features that are both statistically relevant and minimally redundant, resulting in an information-efficient predictor subset.
Boruta performs all-relevant feature selection by iteratively evaluating the importance of each real feature against a set of permuted “shadow” features generated through random shuffling [36]. Feature importance was derived from random forest classifiers, where the mean decrease in Gini impurity serves as the importance measure. If the importance of a real feature consistently exceeds the maximum shadow feature across iterations, it is labeled as “confirmed” and retained. This mechanism provides a conservative safeguard against excluding potentially relevant predictors, particularly in high-dimensional and non-linear data spaces.
Although Boruta identifies relevant features, it does not address redundancy among them. To further refine the feature set, the mRMR algorithm was applied to the Boruta-selected candidates. mRMR relies on mutual information (MI) to quantify both feature–target relevance and feature–feature redundancy. For two random variables X and Y, the mutual information is defined as Equation (1):
where p(x,y) is the joint probability distribution and p(x), p(y) are the marginal distributions.
The optimization objective of the mRMR algorithm is defined as follows:
Here, measures the dependency between feature and the target glucose value, while penalizes redundancy between features. This balance ensures that the final subset contains features that are highly informative yet complementary.
Applying this two-stage process, Boruta selected a candidate pool of relevant features, and mRMR ranked them by their relevance–redundancy trade-off. The top 30 features were retained as the final input set for model training. The detailed list of their correlations and mutual information values with blood glucose is provided in Table 1.
Table 1.
Top-30 Features and Correlation and Mutual Information with Blood Glucose.
2.5. Model and Evaluation
2.5.1. Model of Machine Learning
The glucose prediction task was formulated as a supervised regression problem, where the input consisted of multimodal features selected in Section 2.3, and the output was the continuous glucose concentration measured by CGM. To evaluate model performance, we benchmarked multiple machine learning algorithms representing different methodological families: gradient boosting decision trees, ensemble bagging methods, kernel-based methods, and neural networks.
Light Gradient Boosting Machine (LightGBM). LightGBM is an efficient implementation of gradient boosting decision trees [37]. It constructs additive models in a forward stage-wise fashion and optimizes the objective by gradient descent. The optimization problem is formulated as Equation (3):
where denotes the squared error loss, is the -th regression tree, and is a regularization term penalizing tree complexity to control overfitting.
Random Forest (RF). RF is a bagging ensemble method that aggregates the predictions of multiple decorrelated decision trees [38]. Each tree is trained on a bootstrap sample of the data, and feature selection is randomized at each node split. The prediction is obtained as Equation (4):
where is the total number of trees.
EXtreme Gradient Boosting (XGBoost). XGBoost is an optimized implementation of gradient boosting with additional regularization and system-level optimizations [39]. The objective function combines training loss with L1/L2 penalties:
where is the squared error loss, is the number of leaves in tree , are the leaf weights, and are regularization parameters.
Gradient Boosting Decision Tree (GBDT). GBDT is an additive model that constructs an ensemble of weak regression trees by sequentially minimizing a differentiable loss function via gradient descent [40]. Given training data , the model is updated as Equation (6):
where is the regression tree fitted to the negative gradient of the loss at iteration , and is the learning rate. GBDT is particularly effective in handling complex, non-linear relationships in biomedical data.
Support Vector Regression (SVR). SVR constructs a regression function that tolerates errors within an -margin while maximizing flatness [41]. The optimization problem is:
subject to .
Here, denotes the mapping to a high-dimensional feature space, and are slack variables, and is a regularization parameter. This framework balances prediction accuracy and model complexity.
Multi-Layer Perceptron (MLP). MLP is a feedforward neural network trained with backpropagation [42]. For hidden layer :
and final prediction:
ReLU activations, L2 weight decay, and early stopping were used to improve generalization.
2.5.2. Evaluation Metrics
In this work, we employed several evaluation metrics. RMSE is a commonly used metric for measuring prediction error, reflecting the magnitude of the deviation between the predicted and actual values. MARD is primarily used to assess the accuracy of blood glucose prediction models, particularly in clinical applications, where it is widely used for evaluating glucose monitoring systems in accordance with international standards (e.g., ISO 15197:2013) [43]. MAE is another commonly used metric for evaluating model error, representing the average absolute difference between the predicted and actual values. In addition, R2 measures the proportion of variance in the reference glucose values that is explained by the model predictions, indicating the goodness of fit between predicted and observed measurements. The detailed descriptions of these metrics are as follows:
where represents the number of samples, is the predicted value from the model, and is the actual value.
3. Results
This study utilized a multimodal dataset comprising physiological signals (PPG, EDA, and ST), food logs, and CGM values. A total of 25,573 valid paired samples were collected from 16 participants monitored over 8–10 consecutive days. Six machine learning regressors were benchmarked, including GBDT, RF, SVR, MLP, LightGBM, and XGBoost. For GBDT, the number of trees was set to 1000, with a learning rate of 0.03, a maximum depth of 3, and an early-stopping criterion of 20 iterations without improvement. RF models were trained with 500 estimators, a maximum depth of 8, and constraints on minimum samples per split (6) and per leaf (3). The SVR employed a radial basis function (RBF) kernel with penalty parameter , , and = “scale”. The MLP consisted of two hidden layers, optimized with a learning rate of , a maximum of 500 iterations, and early stopping after 20 stagnant epochs. For LightGBM, we used 1500 boosting iterations, a learning rate of 0.03, 31 leaves, and a minimum of 40 samples per leaf. XGBoost was trained with 600 estimators, a learning rate of 0.06, a maximum depth of 5, and a minimum child weight of 3. All models were trained within a five-fold cross-validation framework to ensure robust estimation, with early stopping applied to boosting models and MLP to mitigate overfitting. Model performance was assessed using RMSE, MAE, MARD, and . In addition, CEG analysis was employed to evaluate clinical acceptability, while SHAP was used to provide interpretability of feature contributions.
3.1. BG Prediction Result
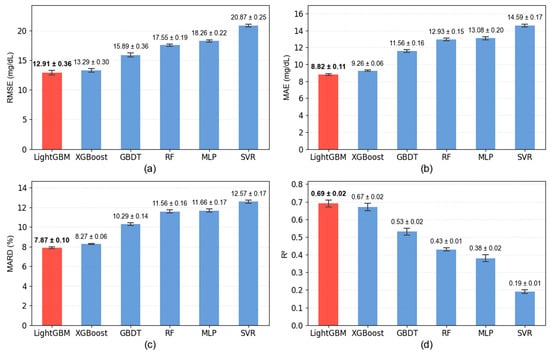
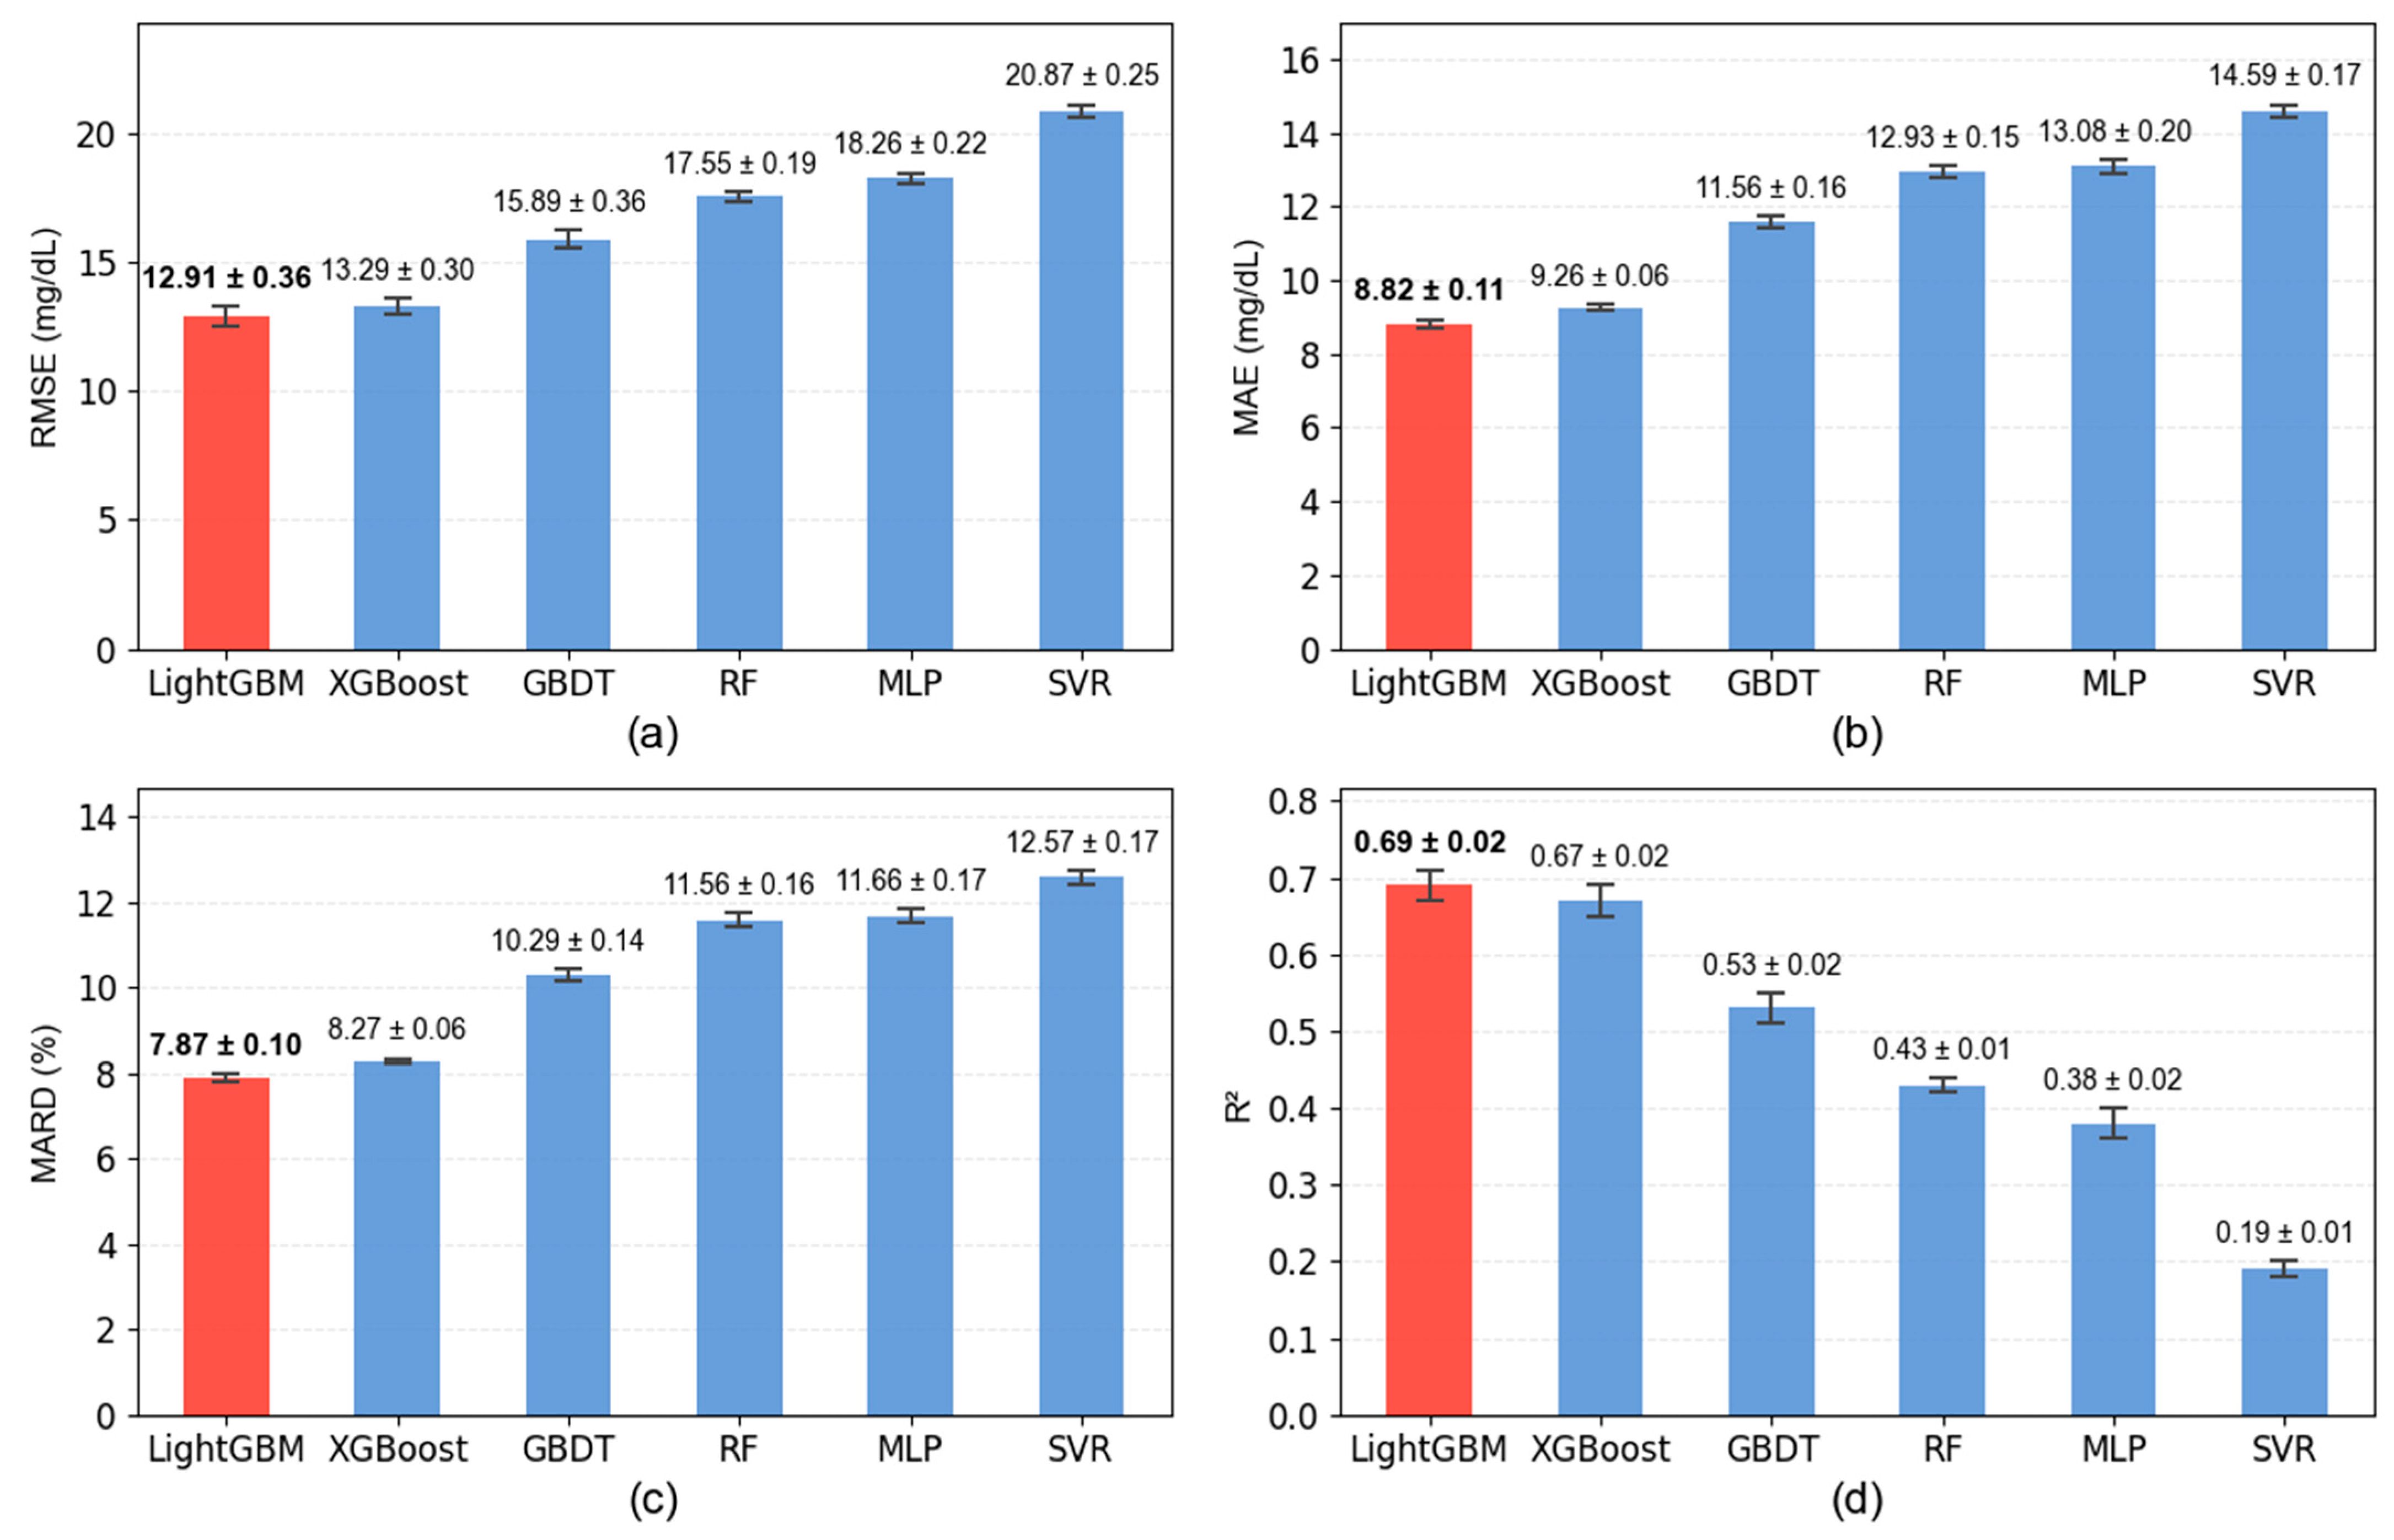
In this work, we benchmarked six machine learning regressors within a multimodal fusion framework. As shown in Figure 2, LightGBM consistently outperformed all other models across multiple evaluation metrics. The models were trained on an initial set of 80 input features, from which 30 features were retained through the Boruta–mRMR feature selection pipeline. LightGBM achieved the lowest RMSE of 12.91 ± 0.36 mg/dL, MAE of 8.82 ± 0.11 mg/dL, and MARD of 7.87 ± 0.10%, of 0.69 ± 0.02 under five-fold cross-validation.
Figure 2.
Performance comparison of six machine learning models under multimodal fusion. (a) RMSE of different models. (b) MAE of different models. (c) MARD of different models. (d) R2 of different models.
By contrast, XGBoost ranked second, yielding an RMSE of 13.29 ± 0.30 mg/dL and an of 0.67 ± 0.02, while GBDT, RF, MLP, and SVR exhibited noticeably poorer performance, with RMSE values exceeding 15 mg/dL and markedly lower values (≤0.53). These findings highlight the superiority of LightGBM in capturing the complex, nonlinear relationships underlying multimodal physiological and nutritional features.
We examined the impact of feature dimensionality on prediction performance by evaluating the model using different numbers of top-ranked features after mRMR selection. When retaining 25 features, the model achieved an RMSE of 12.92 mg/dL. The lowest RMSE of 12.91 mg/dL was obtained with 30 features, whereas increasing the feature set to 35 features resulted in a slight performance degradation (RMSE = 12.93 mg/dL). These results indicate that model performance reaches a plateau around 30 features, suggesting that this configuration provides a favorable balance between predictive accuracy and feature dimensionality.
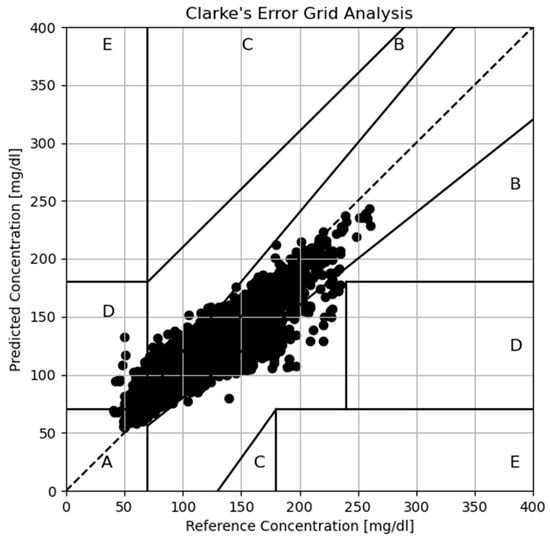
The CEG is widely used to evaluate the clinical accuracy of glucose estimation methods by categorizing prediction errors according to their potential impact on clinical decision-making. According to the original definition proposed by Clarke et al., predictions falling within Zones A and B are considered clinically acceptable, as they would lead to correct treatment decisions or only benign deviations without adverse clinical consequences. In contrast, predictions located in Zones C, D, and E may result in unnecessary treatment adjustments, failure to detect dysglycemic events, or even dangerous therapeutic actions, respectively [44].
In light of this clinical framework, CEG analysis was conducted to further assess the practical safety of the proposed non-invasive glucose estimation model. The results indicate that 96.1% of predictions fall within Zone A, representing clinically accurate outcomes, while an additional 3.4% fall within Zone B, corresponding to benign errors that would not affect treatment decisions. Importantly, no predictions were observed in Zones C or E, which are associated with potentially dangerous misclassifications. As illustrated in Figure 3, this distribution demonstrates that the proposed model not only achieves high predictive accuracy but also satisfies established criteria for clinical safety, thereby supporting its potential utility in real-world glucose monitoring applications.
Figure 3.
CEG of the blood glucose levels of LightGBM.
3.2. Ablation Study Result
The contribution of different modalities was assessed through ablation experiments, in which models were trained using individual feature groups as well as their combinations. Table 2 summarizes the results obtained under unimodal, physiological-only, and multimodal fusion settings.
Table 2.
Performance comparison of different modalities on blood glucose prediction.
The unimodal models based on physiological signals alone showed limited predictive ability. For example, the PPG-only model produced an RMSE of 22.25 mg/dL and a MARD of14.60%, while the ST-only model performed worst, with an RMSE of 22.82 mg/dL and a MARD of 15.06%. When all physiological signals were combined, performance improved slightly, reducing the RMSE to 21.02 mg/dL and the MARD to 13.47%.
In contrast, models trained exclusively on food log features achieved substantially better performance, with an RMSE of 16.25 mg/dL and a MARD of 9.81%. These findings highlight the critical role of nutritional intake in driving blood glucose dynamics.
The most pronounced performance gains were observed under the multimodal fusion setting, in which physiological signals, food logs, and temporal features were jointly integrated. The LightGBM model achieved an RMSE of 12.91 mg/dL and a MARD of 7.87%, representing a relative error reduction of approximately 20% compared with the food-only setting and nearly 40% compared with unimodal physiological models. These findings demonstrate that multimodal fusion effectively captures complementary information and substantially improves both the accuracy and robustness of non-invasive glucose prediction.
3.3. Model Interpretability
In this work, to enhance the transparency and clinical reliability of the proposed framework, SHAP were applied to the best-performing LightGBM-based fusion model. Given the tree-based nature of LightGBM, SHAP values were computed using the TreeSHAP framework via the SHAP TreeExplainer, which provides efficient and exact attribution of feature contributions without relying on sampling-based approximations.
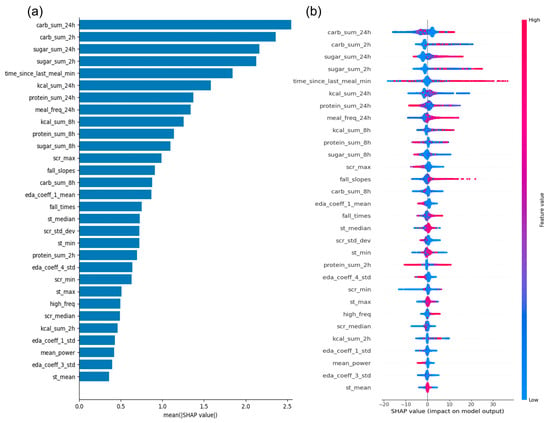
Global feature importance was quantified by the mean absolute SHAP value across all samples, representing the average magnitude of each feature’s contribution to predicted glucose levels. Based on this metric, a feature importance matrix plot (Figure 4a) was generated to rank the most influential predictors. In parallel, a SHAP beeswarm plot (Figure 4b) was constructed using all selected features to visualize the distribution, directionality, and inter-sample variability of feature effects, with point color encoding corresponding feature values.
Figure 4.
SHAP analysis of feature importance in the LightGBM fusion model. (a) Mean absolute SHAP values ranking features by their overall contribution to glucose prediction. (b) SHAP beeswarm plot illustrating the distribution and direction of individual feature impacts on model output, with colour representing feature values.
The SHAP analysis revealed that nutritional variables were the dominant determinants of glucose dynamics. In particular, cumulative carbohydrate and sugar intake over both short-term (2 h) and longer-term (24 h) windows exhibited strong positive associations with glucose levels, consistent with established postprandial glycemic physiology. Time since the last meal also emerged as a critical predictor, reflecting the interaction between fasting duration and glycemic regulation. Additional contributions from total caloric intake and protein consumption further underscored the role of macronutrient composition in shaping glucose responses.
Physiological features contributed meaningfully, albeit to a lesser extent. SCR features, particularly amplitude and variability metrics, were positively associated with glucose elevations, potentially reflecting sympathetic nervous system activation linked to stress-induced hyperglycemia. Moreover, pulse morphology features such as inter-beat intervals and waveform slopes, together with ST metrics, were identified as relevant predictors, suggesting that autonomic cardiovascular regulation and peripheral thermoregulation jointly modulate glucose homeostasis.
Beyond global feature importance, SHAP further provides decision-level interpretability by decomposing individual glucose predictions into additive contributions from each input feature. From a clinical reasoning perspective, elevated glucose predictions are primarily explained by recent carbohydrate intake, shorter fasting intervals, and increased sympathetic activity, whereas lower glucose predictions are typically associated with pro longed fasting, reduced recent carbohydrate exposure, and more stable autonomic and thermoregulatory states. Such decomposition closely mirrors clinical reasoning processes, in which dietary intake, meal timing, and physiological stress are jointly considered when interpreting glucose regulation. Accordingly, the proposed interpretability framework extends beyond feature importance ranking and provides human-understandable, clinically coherent explanations for individual model decisions, thereby enhancing trustworthiness and translational potential for real-world glucose monitoring applications.
4. Discussion
4.1. Comparison Result
The results in Table 3 present the prediction performance of previous studies. Notably, both Bent et al. and Chowdhury et al. conducted their analyses using the same glucose dataset as in the present study. However, their models achieved substantially higher error rates. Bent et al. employed XGBoost obtained an RMSE of 21.10 mg/dL, while Chowdhury et al. introduced MMG-Net that improved A + B zone coverage but still resulted in an RMSE of 17.26 mg/dL and an MAE of 13.51 mg/dL. By contrast, our multimodal LightGBM model achieved a markedly lower RMSE of 12.91 mg/dL and an MAE of 8.82 mg/dL while maintaining a comparable A + B zone coverage of 99.5%. Hina et al. reported the lowest RMSE (11.2 mg/dL) with a Fine Gaussian model; however, such methods often rely on highly constrained datasets and may not generalize well to broader populations. Taken together, our results strike a balance between predictive accuracy, interpretability, and robustness, highlighting the potential of multimodal integration for reliable non-invasive glucose monitoring.
Table 3.
Comparison result of other previous studies.
4.2. Limitations and Future Work
Although the proposed multimodal framework for blood glucose prediction demonstrates encouraging performance, several limitations should be acknowledged, and future research directions can be outlined accordingly.
First, the present study was conducted on a relatively small and homogeneous cohort of individuals at early stages of diabetes. Such sample characteristics limit the generalizability of the findings. To ensure broader clinical applicability, future work should aim to expand the dataset to encompass larger and more heterogeneous populations, covering different age groups, glycemic phenotypes, and comorbidities. Establishing multi-center collaborations with hospitals and community health facilities will be critical for achieving high-quality, large-scale data collection.
Second, regarding temporal stability, the current dataset was collected over 8–10 consecutive days per participant, which permits assessment of short-term model robustness but does not allow direct evaluation of long-term stability over extended periods such as weeks or months. Although samples from different days were interleaved during cross-validation, thereby implicitly exposing the model to temporally heterogeneous data, the framework’s long-term generalization capability remains to be fully characterized. Future longitudinal studies with extended monitoring periods are required to systematically assess temporal drift, inter-day variability, and model degradation over time. Incorporating adaptive calibration or continual learning strategies may further improve long-term stability in real-world applications.
Third, while our framework integrates photoplethysmography, electrodermal activity, and skin temperature, other physiological modalities were not included. Signals such as accelerometry, respiratory rate, and blood oxygen saturation may provide additional complementary information that can enhance prediction accuracy and temporal robustness. Future studies should investigate adaptive multimodal fusion strategies, including attention-based transformers and graph neural networks, to capture both the dynamic interactions and latent dependencies among these signals.
Finally, the current model was trained and evaluated in an offline batch setting. Real-time deployment in wearable or mobile environments remains an unmet challenge. Future efforts will focus on implementing the framework in edge-computing devices to enable continuous, real-time glucose prediction. Practical deployment will also require optimization of computational efficiency through model compression, energy-aware design, and latency control to ensure feasibility in long-term, real-world monitoring scenarios.
5. Conclusions
In this study, we proposed a multimodal framework for non-invasive blood glucose prediction that integrates wearable physiological signals and food log–derived nutritional features. By employing a unified preprocessing pipeline, rigorous feature selection through Boruta and mRMR, and advanced machine learning regressors, the framework achieved clinically reliable accuracy. The LightGBM fusion model attained an RMSE of 12.91 mg/dL, a MARD of 7.87%, and 99.5% of predictions within Clarke Zones A and B, substantially outperforming unimodal approaches and demonstrating superiority over several state-of-the-art methods applied to the same dataset. SHAP analysis further confirmed the physiological plausibility of the model by highlighting the importance of both exogenous nutritional drivers and endogenous autonomic and thermoregulatory signals.
Overall, these findings demonstrate the effectiveness of multimodal integration for non-invasive glucose monitoring and establish a foundation for the future development of personalized, clinically deployable solutions. Future research should focus on validating the framework in larger and more diverse populations, incorporating additional biosignals, and enabling real-time deployment in wearable platforms to support long-term diabetes management and preventive care.
Supplementary Materials
The following supporting information can be downloaded at: https://www.mdpi.com/article/10.3390/app16020790/s1, Table S1: Feature extraction for food log; Table S2: Feature extraction for signal data.
Author Contributions
Conceptualization, Y.S. and J.Y.; methodology, Y.S.; software, Y.S.; validation, Y.S. and J.Y.; formal analysis, Y.S.; investigation, Y.S.; resources, Y.S.; data curation, Y.S.; writing—original draft preparation, Y.S.; writing—review and editing, J.Y.; visualization, Y.S.; supervision, J.Y.; project administration, J.Y.; funding acquisition, J.Y. All authors have read and agreed to the published version of the manuscript.
Funding
This research received no external funding.
Institutional Review Board Statement
The publicly available datasets used in this study have received ethical approval from the relevant institutions, and no new ethical review was required.
Informed Consent Statement
Informed consent was obtained from all subjects involved in the study.
Data Availability Statement
WeThe datasets analyzed during the current study are available in the PhysioNet repository, https://www.physionet.org/content/big-ideas-glycemic-wearable/1.1.2/001/#files-panel (accessed on 18 September 2023).
Conflicts of Interest
Author Junsheng Yu was employed by the company Beijing Health State Monitoring & Consulting Co., Limited, Beijing, China. The remaining authors declare that the research was conducted in the absence of any commercial or financial relationships that could be construed as a potential conflict of interest.
Abbreviations
The following abbreviations are used in this manuscript:
| A1C | glycated hemoglobin |
| ANS | autonomic nervous system |
| CEG | Clarke Error Grid |
| CGM | continuous glucose monitoring |
| COPD | chronic obstructive pulmonary disease |
| EDA | electrodermal activity |
| GBDT | Gradient Boosting Decision Tree |
| LightGBM | Light Gradient Boosting Machine |
| MAE | Mean Absolute Error |
| MARD | Mean Absolute Relative Difference |
| MLP | Multi-Layer Perceptron |
| mRMR | minimum Redundancy Maximum Relevance |
| PPG | photoplethysmography |
| R2 | coefficient of determination |
| RBF | radial basis function |
| RF | Random Forest |
| RMSE | Root Mean Square Error |
| SCR | skin conductance response |
| HRV | heart rate variability |
| SHAP | SHapley Additive exPlanations |
| ST | skin temperature |
| SVR | Support Vector Regression |
| T1DM | Type 1 diabetes mellitus |
| T2DM | Type 2 diabetes mellitus |
| WHO | World Health Organization |
References
- Ramasahayam, S.; Arora, L.; Chowdhury, S.R.; Anumukonda, M. FPGA based system for blood glucose sensing using photoplethysmography and online motion artifact correction using adaline. In Proceedings of the 2015 9th International Conference on Sensing Technology (ICST), Auckland, New Zealand, 8–10 December 2015; pp. 22–27. Available online: https://ieeexplore.ieee.org/abstract/document/7438358/ (accessed on 24 April 2025).
- Nickerson, H.D.; Dutta, S. Diabetic complications: Current challenges and opportunities. J. Cardiovasc. Trans. Res. 2012, 5, 375–379. [Google Scholar] [CrossRef] [Scilit]
- American Diabetes Association. 2. Classification and diagnosis of diabetes: Standards of medical care in diabetes—2020. Diabetes Care 2020, 43, S14–S31. [Google Scholar] [CrossRef] [Scilit] [PubMed]
- International Diabetes Federation. Diabetes Atlas. 2024. IDF Diabetes Atlas 10th Edition. Available online: https://diabetesatlas.org/resources/previous-editions/ (accessed on 24 April 2025).
- García-Molina, L.; Lewis-Mikhael, A.-M.; Riquelme-Gallego, B.; Cano-Ibáñez, N.; Oliveras-López, M.-J.; Bueno-Cavanillas, A. Improving type 2 diabetes mellitus glycaemic control through lifestyle modification implementing diet intervention: A systematic review and meta-analysis. Eur. J. Nutr. 2020, 59, 1313–1328. [Google Scholar] [CrossRef] [Scilit]
- O’Donoghue, G.; O’Sullivan, C.; Corridan, I.; Daly, J.; Finn, R.; Melvin, K.; Peiris, C. Lifestyle interventions to improve glycemic control in adults with type 2 diabetes living in low-and-middle income countries: A systematic review and meta-analysis of randomized controlled trials (RCTs). Int. J. Environ. Res. Public Health 2021, 18, 6273. [Google Scholar] [CrossRef] [Scilit]
- Chen, C.; Zhao, X.-L.; Li, Z.-H.; Zhu, Z.-G.; Qian, S.-H.; Flewitt, A. Current and emerging technology for continuous glucose monitoring. Sensors 2017, 17, 182. [Google Scholar] [CrossRef] [Scilit] [PubMed]
- Park, E.-Y.; Baik, J.; Kim, H.; Park, S.-M.; Kim, C. Ultrasound-modulated optical glucose sensing using a 1645 nm laser. Sci. Rep. 2020, 10, 13361. [Google Scholar] [CrossRef] [Scilit] [PubMed]
- Rodbard, D. Continuous glucose monitoring: A review of successes, challenges, and opportunities. Diabetes Technol. Ther. 2016, 18, S2-3–S2-13. [Google Scholar] [CrossRef] [Scilit]
- Iqbal, S.M.A.; Mahgoub, I.; Du, E.; Leavitt, M.A.; Asghar, W. Advances in healthcare wearable devices. npj Flex. Electron. 2021, 5, 9. [Google Scholar] [CrossRef] [Scilit]
- Joshi, A.M.; Jain, P.; Mohanty, S.P.; Agrawal, N. iGLU 2.0: A new wearable for accurate non-invasive continuous serum glucose measurement in IoMT framework. IEEE Trans. Consum. Electron. 2020, 66, 327–335. [Google Scholar] [CrossRef] [Scilit]
- Patel, S.; Park, H.; Bonato, P.; Chan, L.; Rodgers, M. A review of wearable sensors and systems with application in rehabilitation. J. Neuroeng. Rehabil. 2012, 9, 21. [Google Scholar] [CrossRef] [Scilit]
- Rodgers, M.M.; Alon, G.; Pai, V.M.; Conroy, R.S. Wearable technologies for active living and rehabilitation: Current research challenges and future opportunities. J. Rehabil. Assist. Technol. Eng. 2019, 6, 2055668319839607. [Google Scholar] [CrossRef] [Scilit] [PubMed]
- Sabry, F.; Eltaras, T.; Labda, W.; Alzoubi, K.; Malluhi, Q. Machine learning for healthcare wearable devices: The big picture. J. Healthc. Eng. 2022, 2022, 4653923. [Google Scholar] [CrossRef] [Scilit] [PubMed]
- Xie, Y.; Lu, L.; Gao, F.; He, S.; Zhao, H.; Fang, Y.; Yang, J.; An, Y.; Ye, Z.; Dong, Z. Integration of artificial intelligence, blockchain, and wearable technology for chronic disease management: A new paradigm in smart healthcare. Curr. Med. Sci. 2021, 41, 1123–1133. [Google Scholar] [CrossRef] [Scilit]
- Zhang, G.; Mei, Z.; Zhang, Y.; Ma, X.; Lo, B.; Chen, D.; Zhang, Y. A noninvasive blood glucose monitoring system based on smartphone PPG signal processing and machine learning. IEEE Trans. Ind. Inform. 2020, 16, 7209–7218. [Google Scholar] [CrossRef] [Scilit]
- Tsai, C.-W.; Li, C.-H.; Lam, R.W.-K.; Li, C.-K.; Ho, S. Diabetes care in motion: Blood glucose estimation using wearable devices. IEEE Consum. Electron. Mag. 2020, 9, 30–34. [Google Scholar] [CrossRef]
- Li, J.; Ma, J.; Omisore, O.M.; Liu, Y.; Tang, H.; Ao, P.; Yan, Y.; Wang, L.; Nie, Z. Noninvasive blood glucose monitoring using spatiotemporal ECG and PPG feature fusion and weight-based choquet integral multimodel approach. IEEE Trans. Neural Netw. Learn. Syst. 2024, 35, 14491–14505. [Google Scholar] [CrossRef] [Scilit] [PubMed]
- Yen, C.-T.; Chen, U.-H.; Wang, G.-C.; Chen, Z.-X. Non-invasive blood glucose estimation system based on a neural network with dual-wavelength photoplethysmography and bioelectrical impedance measuring. Sensors 2022, 22, 4452. [Google Scholar] [CrossRef] [Scilit]
- Cho, P.; Kim, J.; Bent, B.; Dunn, J. BIG IDEAs Lab Glycemic Variability and Wearable Device Data [Internet]. PhysioNet. Available online: https://physionet.org/content/big-ideas-glycemic-wearable/1.1.2/ (accessed on 22 July 2025).
- Wolever, T.; Jenkins, D.; Jenkins, A.; Josse, R. The glycemic index: Methodology and clinical implications. Am. J. Clin. Nutr. 1991, 54, 846–854. [Google Scholar] [CrossRef] [Scilit]
- Ley, S.H.; Hamdy, O.; Mohan, V.; Hu, F.B. Prevention and management of type 2 diabetes: Dietary components and nutritional strategies. Lancet 2014, 383, 1999–2007. [Google Scholar] [CrossRef] [Scilit] [PubMed]
- Chang, F.; Hong, W.; Zhang, T.; Jing, J.; Liu, X. Research on wavelet denoising for pulse signal based on improved wavelet thresholding. In Proceedings of the 2010 First International Conference on Pervasive Computing, Signal Processing and Applications, Harbin, China, 17–19 September 2010; pp. 564–567. Available online: https://ieeexplore.ieee.org/abstract/document/5636069/ (accessed on 19 July 2025).
- Charlton, P.H.; Paliakaitė, B.; Pilt, K.; Bachler, M.; Zanelli, S.; Kulin, D.; Allen, J.; Hallab, M.; Bianchini, E.; Mayer, C.C.; et al. Assessing hemodynamics from the photoplethysmogram to gain insights into vascular age: A review from VascAgeNet. Am. J. Physiol.-Heart Circ. Physiol. 2022, 322, H493–H522. [Google Scholar] [CrossRef] [Scilit] [PubMed]
- Kher, R.K.; Patel, D.M. A comprehensive review on wearable health monitoring systems. Open Biomed. Eng. J. 2021, 15, 213–225. [Google Scholar] [CrossRef] [Scilit]
- Susana, E.; Ramli, K.; Purnamasari, P.D.; Apriantoro, N.H. Non-invasive classification of blood glucose level based on photoplethysmography using time–frequency analysis. Information 2023, 14, 145. [Google Scholar] [CrossRef] [Scilit]
- Donelli, M.; Espa, G.; Feraco, P.; Manekiya, M. Wearable non-invasive blood glucose monitor system based on galvanic skin resistance measurement. Electron. Lett. 2021, 57, 901–902. [Google Scholar] [CrossRef] [Scilit]
- Limberg, J.K.; Farni, K.E.; Taylor, J.L.; Dube, S.; Basu, A.; Basu, R.; Wehrwein, E.A.; Joyner, M.J. Autonomic control during acute hypoglycemia in type 1 diabetes mellitus. Clin. Auton. Res. 2014, 24, 275–283. [Google Scholar] [CrossRef] [Scilit] [PubMed]
- McGinn, R.; Carter, M.R.; Barrera-Ramirez, J.; Sigal, R.J.; Flouris, A.D.; Kenny, G.P. Does type 1 diabetes alter post-exercise thermoregulatory and cardiovascular function in young adults? Scand. Med. Sci. Sports 2015, 25, e504–e514. [Google Scholar] [CrossRef] [Scilit] [PubMed]
- Lee, M.S.; Lee, Y.K.; Pae, D.S.; Lim, M.T.; Kim, D.W.; Kang, T.K. Fast emotion recognition based on single pulse PPG signal with convolutional neural network. Appl. Sci. 2019, 9, 3355. [Google Scholar] [CrossRef] [Scilit]
- ChuDuc, H.; NguyenPhan, K.; NguyenViet, D. A review of heart rate variability and its applications. APCBEE Procedia 2013, 7, 80–85. [Google Scholar] [CrossRef] [Scilit]
- Benichou, T.; Pereira, B.; Mermillod, M.; Tauveron, I.; Pfabigan, D.; Maqdasy, S.; Dutheil, F. Heart rate variability in type 2 diabetes mellitus: A systematic review and meta-analysis. PLoS ONE 2018, 13, e0195166. [Google Scholar] [CrossRef] [Scilit]
- Selvaraj, N.; Jaryal, A.; Santhosh, J.; Deepak, K.K.; Anand, S. Assessment of heart rate variability derived from finger-tip photoplethysmography as compared to electrocardiography. J. Med. Eng. Technol. 2008, 32, 479–484. [Google Scholar] [CrossRef] [Scilit]
- Chellappan, K.; Sahathevan, R. Accelerated aging and noninvasive cardiovascular risk monitoring. Cerebrovasc. Dis. 2015, 40, 25–27. [Google Scholar]
- Sinchai, S.; Kainan, P.; Wardkein, P.; Koseeyaporn, J. A photoplethysmographic signal isolated from an additive motion artifact by frequency translation. IEEE Trans. Biomed. Circuits Syst. 2018, 12, 904–917. [Google Scholar] [CrossRef] [Scilit]
- Kursa, M.B.; Rudnicki, W.R. Feature selection with the boruta package. J. Stat. Soft. 2010, 36, 1–13. [Google Scholar] [CrossRef] [Scilit]
- Ke, G.; Meng, Q.; Finley, T.; Wang, T.; Chen, W.; Ma, W.; Ye, Q.; Liu, T.-Y. Lightgbm: A highly efficient gradient boosting decision tree. Adv. Neural Inf. Process. Syst. 2017, 30, 52. Available online: https://proceedings.neurips.cc/paper/2017/hash/6449f44a102fde848669bdd9eb6b76fa-Abstract.html (accessed on 10 September 2025).
- Breiman, L. Random forests. Mach. Learn. 2001, 45, 5–32. [Google Scholar] [CrossRef] [Scilit]
- Chen, T.; Guestrin, C. XGBoost: A scalable tree boosting system. In Proceedings of the 22nd ACM SIGKDD International Conference on Knowledge Discovery and Data Mining, San Francisco, CA, USA, 13–17 August 2016; ACM: New York, NY, USA; pp. 785–794. Available online: https://dl.acm.org/doi/10.1145/2939672.2939785 (accessed on 22 July 2025).
- Friedman, J.H. Greedy function approximation: A gradient boosting machine. Ann. Stat. 2001, 29, 1189–1232. [Google Scholar] [CrossRef] [Scilit]
- Cortes, C.; Vapnik, V. Support-vector networks. Mach. Learn. 1995, 20, 273–297. [Google Scholar] [CrossRef] [Scilit]
- Hornik, K.; Stinchcombe, M.; White, H. Multilayer feedforward networks are universal approximators. Neural Netw. 1989, 2, 359–366. [Google Scholar] [CrossRef] [Scilit]
- ISO 15197:2013; In Vitro Diagnostic Test Systems: Requirements for Blood-Glucose Monitoring Systems for Self-Testing in Managing Diabetes Mellitus. International Organization for Standardization: Geneva, Switzerland, 2003.
- Clarke, W.L.; Cox, D.; Gonder-Frederick, L.A.; Carter, W.; Pohl, S.L. Evaluating clinical accuracy of systems for self-monitoring of blood glucose. Diabetes Care 1987, 10, 622–628. [Google Scholar] [CrossRef] [Scilit]
- Bent, B.; Cho, P.J.; Henriquez, M.; Wittmann, A.; Thacker, C.; Feinglos, M.; Crowley, M.J.; Dunn, J.P. Engineering digital biomarkers of interstitial glucose from noninvasive smartwatches. npj Digit. Med. 2021, 4, 89. [Google Scholar] [CrossRef] [Scilit]
- Chowdhury, M.H.; Chowdhury, M.E.H.; Alqahtani, A. MMG-net: Multi modal approach to estimate blood glucose using multi-stream and cross modality attention. Biomed. Signal Process. Control 2024, 92, 105975. [Google Scholar] [CrossRef] [Scilit]
- Hina, A.; Saadeh, W. Noninvasive blood glucose monitoring systems using near-infrared technology—A review. Sensors 2022, 22, 4855. [Google Scholar] [CrossRef] [Scilit] [PubMed]
- Nie, Z.; Rong, M.; Li, K. Blood glucose prediction based on imaging photoplethysmography in combination with machine learning. Biomed. Signal Process. Control 2023, 79, 104179. [Google Scholar] [CrossRef] [Scilit]

Disclaimer/Publisher’s Note: The statements, opinions and data contained in all publications are solely those of the individual author(s) and contributor(s) and not of MDPI and/or the editor(s). MDPI and/or the editor(s) disclaim responsibility for any injury to people or property resulting from any ideas, methods, instructions or products referred to in the content. |
© 2026 by the authors. Licensee MDPI, Basel, Switzerland. This article is an open access article distributed under the terms and conditions of the Creative Commons Attribution (CC BY) license.