


Abstract
As a packaging material, molded pulp has experienced sustained growth in demand because of its high recyclability and biodegradability. However, refined structural modeling of their behavior during transportation remains limited. This study established finite element representations of molded pulp packaging structural cells and developed a spring–mass dynamic model that incorporates the parameters of the packaged product. The proposed model can predict the combined modal characteristics of molded pulp packaging and the protected item while significantly reducing the computational requirements compared with traditional FEM (finite element method) analyses. Experimental validation shows that the prediction error of the first order modal frequency is approximately 6%, which meets the actual needs. The model provides a foundation for the subsequent optimization of molded pulp structures under road transport conditions.
1. Introduction
In recent years, with the implementation and expansion of environmental protection policies, the concept of sustainability has become increasingly ingrained in industry and consumer awareness. Consequently, the demand for environmentally friendly packaging from governments and consumers has continued to grow [1,2,3]. As a representative eco-friendly packaging material, molded pulp products have found widespread application in the packaging of fruits, eggs, and electronic products owing to their biodegradability, recyclability, and environmental compatibility [4,5,6,7,8,9,10,11]. According to Grand View Research [12], the global molded pulp packaging market was estimated to be worth US dollar 5445.2 million in 2023. Food packaging continued leading the molded pulp market with a share of over 44.0%, followed by food service with about a 24% market share; packaging for electronic products is expected to have a CAGR (compound annual growth rate) of 9.1% and is the third largest end use.
However, molded pulp has seen limited application in the packaging of large-volume and heavy-weight products, such as household appliances [5,8,9]. To address these limitations, several researchers [13,14] have conducted dedicated studies aimed at improving the structural performance and expanding the applicability of molded pulp in heavy duty packaging scenarios.
Early experimental investigations on road-transported fruit indicated that molded pulp trays, when compared with expanded polystyrene (EPS) trays, were more likely to induce fruit damage under prolonged vibration exposure [15]. However, studies on egg packaging have revealed the opposite trend: eggs packaged in molded pulp trays exhibited significantly lower breakage rates than those packaged in EPS trays [16]. More recent studies have further demonstrated that molded pulp materials produced through optimized formulations and forming processes exhibit excellent cushioning performance when used to package hard-skinned fruits, such as apples and Hami melons [17,18]. In addition, several studies have reported that molded pulp products manufactured from waste paper and other natural plant fibers possess remarkable shock absorption capabilities, effectively reducing the impact loads and vibrations transmitted to the packaged goods during transportation, thereby providing comprehensive protection [13,14,19].
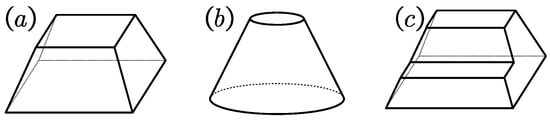
Dynamic performance analyses were conducted to further investigate their behavior under dynamic transportation conditions. The impact absorption capability of molded pulp products originates from the collective contribution of numerous structural cells embedded within the material [20,21]. As illustrated in Figure 1, these structural cells constitute the fundamental building blocks of molded pulp products [21]. By repeatedly arranging identical cells throughout the packaging structure, the molded pulp product attains load-bearing capacity, impact resistance, and other mechanical functions.
Figure 1.
Typical molded pulp structural cell models: (a) rectangular, (b) circular, and (c) stepped structure.
There are differing views regarding whether variations in structural cell geometry influence impact absorption performance when the molded pulp material itself remains unchanged. Early studies suggested that, for structural cells of equal height, the impact energy absorption is independent of the cell shape [22]. However, subsequent research reported that axisymmetric structural cells exhibit superior collapse behavior under impact loading [23], a conclusion influenced by both the experimental methods employed and the height of the cells. Earlier studies generally examined low-height structural cells and did not account for the possibility that a greater height amplifies the performance differences among cell geometries. For identical structural cells, increasing the height alone does not enhance the maximum load they can withstand [24].
Simulation-based investigations have shown that increasing the thickness of molded pulp can effectively improve its load-bearing capacity [25,26], and a modular modeling approach for the numerical simulation of molded pulp structural cells has also been proposed [26]. Claude introduced a laboratory method for the rapid fabrication of molded pulp structural cells using 3D-printed polylactic acid molds, enabling impact tests that validated the accuracy of the corresponding finite element (FE) models [20].
However, at present, there is a lack of in-depth theoretical research specifically addressing the design of molded pulp packaging for road transport conditions.
In this study, a modeling framework was developed for the operating conditions most commonly encountered by packaged products during transportation to predict the first order frequency. Based on a clear characterization of the excitation environment, the model avoids dominant road transport excitation peaks by shifting the dynamic system first order frequency out of excitation peak frequency, thereby providing theoretical guidance for the design and optimization of transport packaging systems of molded pulp products.
2. Truck Road Transportation Excitation
Road transportation is the primary logistical scenario for molded pulp packaging. During transport, the interaction between a vehicle and road surface generates complex shock and vibration excitations that directly influence the dynamic response of the packaging–product system. This section analyzes the characteristics of the shock environment, constructs the shock response spectrum, and introduces response spectrum processing methods to quantify the key parameters of road-induced excitation. These parameters provide the necessary loading inputs for building and experimentally validating the dynamic model of molded pulp products, thereby ensuring that both the model and experiments accurately reflect the actual transportation conditions.
In essence, road transport excitation is a composite load that consists of random vibrations and transient shocks. The distribution of energy and associated frequency characteristics fundamentally determines the design strategy for vibration mitigation in packaging systems. Based on a review of the literature and verification with measured data, the core characteristics of the road transport shock environment can be summarized as a low frequency concentration of excitation energy and scene-dependent variability of excitation intensity.
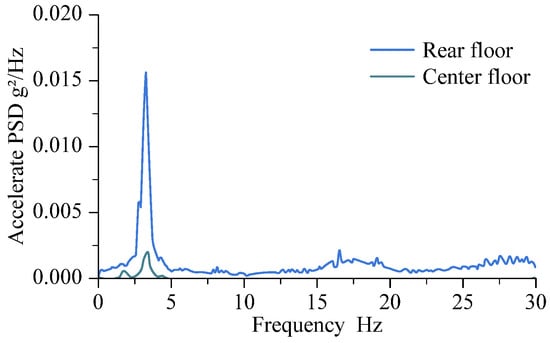
During road transportation, excitation energy is primarily generated by pavement joints, potholes, speed bumps, surface roughness irregularities, vehicle suspension dynamics, and speed fluctuations. The energy of these excitations is predominantly concentrated in the low-frequency range. A 14.6 m truck transportation experiment covering 4600 km used PSD (power spectral density) analysis to characterize the frequency distribution of excitation energy. The results indicate that the acceleration PSD peaks, as shown in Figure 2, occur at 3.5 Hz, 9 Hz, 18 Hz, and 25 Hz. Among these, the 3.5 Hz peak exhibited the highest PSD value of 0.0081 g2/Hz, whereas the PSD values at 9 Hz, 18 Hz, and 25 Hz were 0.00057 g2/Hz, 0.00213 g2/Hz, and 0.000865 g2/Hz, respectively [27]. In addition, the PSD measured at the midpoint of the cargo compartment was significantly lower than that measured at the rear of the compartment.
Figure 2.
Acceleration power spectral density at different positions within the vehicle cargo compartment.
When the first order modal frequency of the molded pulp packaging–product system overlaps with these low frequency peaks, resonance is likely to occur, leading to a deterioration or even failure of the cushioning performance. In the structural design of molded pulp packaging, it is crucial to prioritize parameter optimization that shifts the system’s first order modal frequency away from the critical band of 3.5 Hz ± 20%. Concurrently, it is essential to consider the avoidance of the secondary peak regions near 9 Hz, 18 Hz, and 25 Hz. This approach fundamentally reduces the risk of resonance during road transportation.
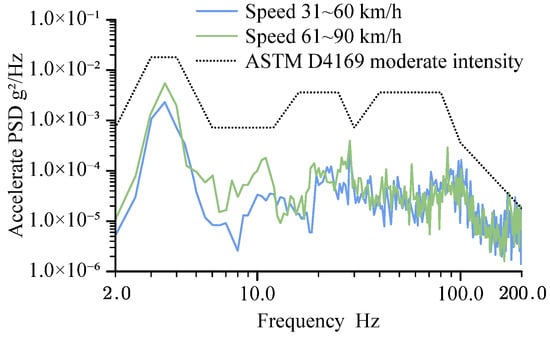
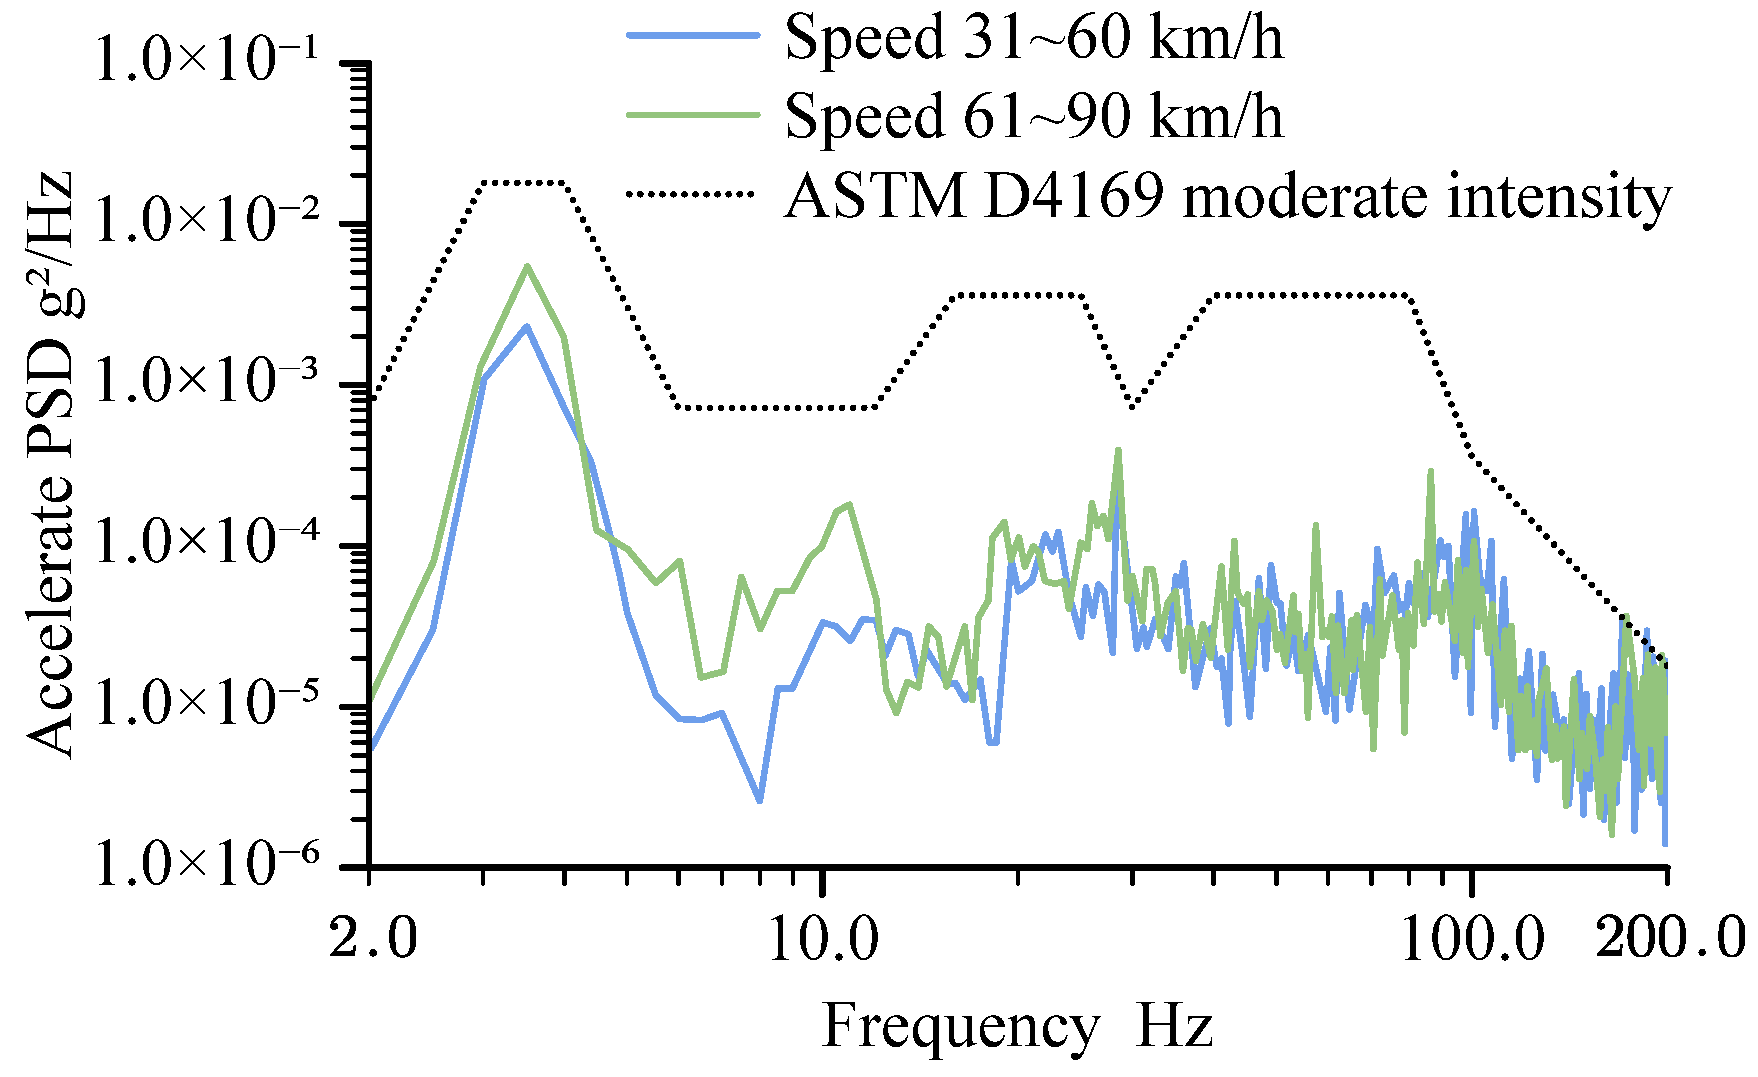
Under different vehicle speeds, the excitation intensity exhibited noticeable variations. As shown in Figure 3, the acceleration PSD curves differ significantly across speed ranges. When the vehicle travels at 31–60 km/h, the PSD value at 3.5 Hz is approximately 0.0023 g2/Hz, whereas at 61–90 km/h, the PSD value at the same frequency increases to approximately 0.0055 g2/Hz [28].
Figure 3.
Acceleration PSD at different vehicle speeds.
Given that this study focuses on road transport conditions for molded pulp packaging products, the subsequent dynamic modeling and experimental procedures adopted a PSD value of 0.0055 g2/Hz at 3.5 Hz as the baseline excitation parameter, ensuring that the findings maintain strong engineering relevance.
The excitation in road transportation is broadband. Research on long-distance truck road transportation on different roads and using different types of trucks [27,28,29] shows that the excitation of truck transportation is mainly around 3.5 Hz, which is at least 10 times higher than other acceleration PSD peaks. Therefore, it is reasonable to avoid this frequency.
3. Simplified Modeling of Molded Pulp Structures
The molded pulp structure consists of two primary components: the main load-bearing structure at the base and the auxiliary positioning and impact energy absorption structure along the sidewalls. The bottom load-bearing structure is responsible for supporting the overall weight and maintaining structural stability, whereas the sidewalls serve dual functions: providing positional stability and effectively absorbing impact energy. This structural design aims to maximize the synergistic interaction among different parts of the molded pulp product, ensuring that both load-bearing and impact-absorbing requirements are satisfied during use.
This study focuses on the structural cell of the primary load-bearing structure of molded pulp. The structural cells were designed in various geometrical forms, such as trapezoidal, conical, and stepped configurations. Among these, the trapezoidal cell structure was selected as the principal subject for a detailed investigation.
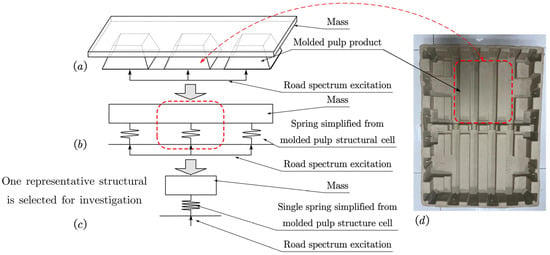
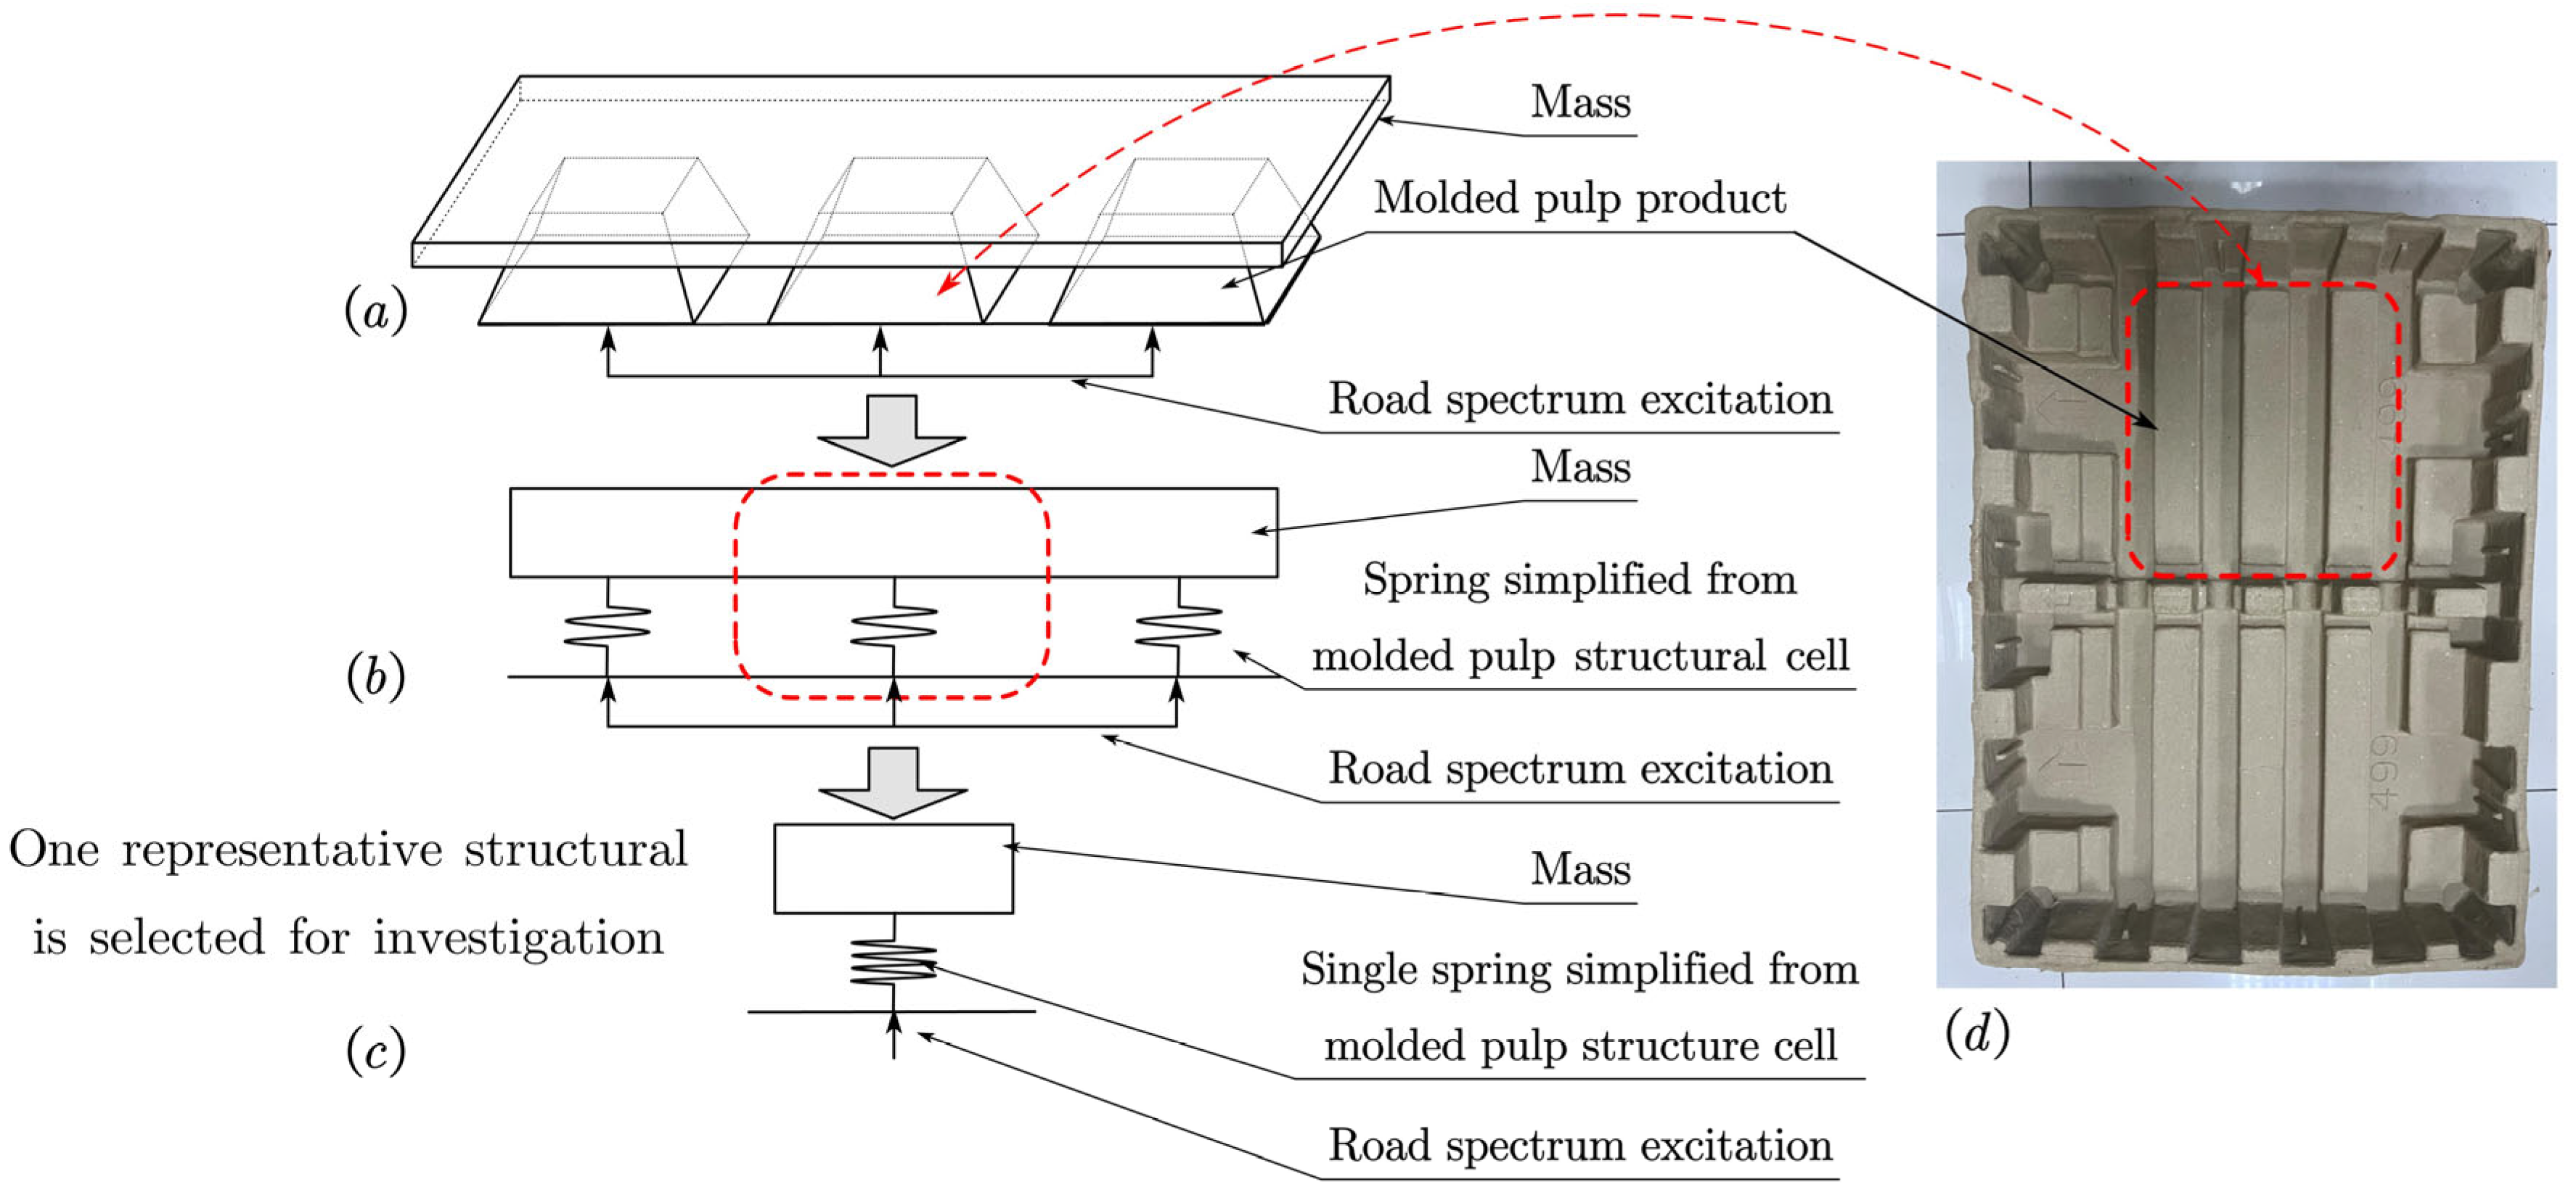
As shown in Figure 4, in practical applications, the sidewalls of the molded pulp structural cell primarily contribute to its load-bearing capacity. The bending resistance of the top surface and bottom edges plays a supplementary role in resisting overall structural deformation. This integrated structural performance provides significant advantages in supporting and vibration damping of the packaged objects. Therefore, in this study, we isolated a representative rectangular structure from the molded pulp system, selected an individual structural cell, and employed the FEM (finite element method) to determine its normal stiffness matrix. The stiffness values of multiple springs were then connected in parallel to construct a simplified overall dynamic model of the molded pulp product and packaged object. This enables an in-depth analysis of how the molded pulp structural cell provides support and vibration attenuation in practical packaging applications.
Figure 4.
Schematic of the simplification methodology for the molded pulp model. (a) Original vibration model of the molded pulp packaging and packaged product, (b) simplified spring representation of the molded pulp structural cell, (c) selected single molded pulp structural cell and mass block model, and (d) real molded pulp tray.
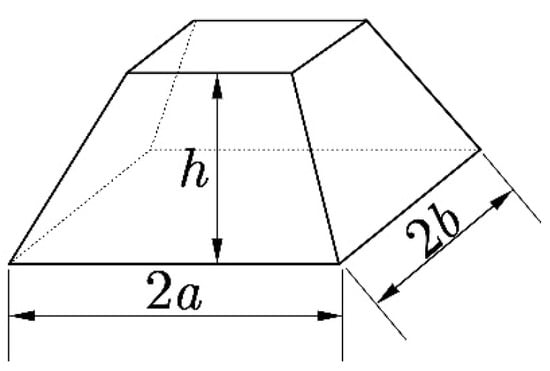
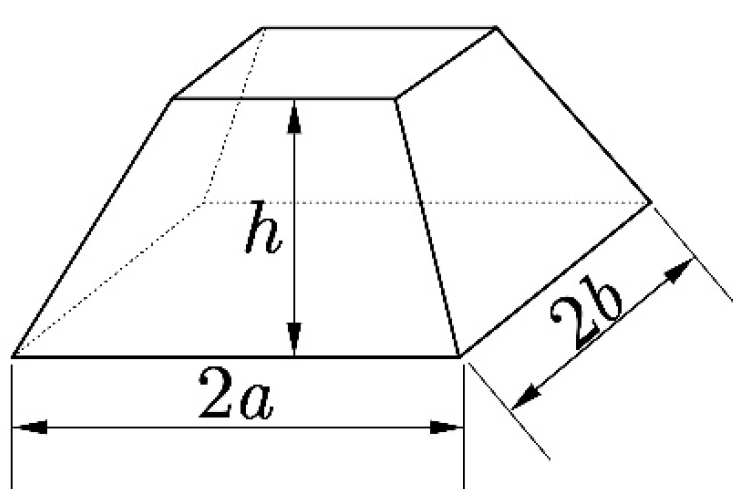
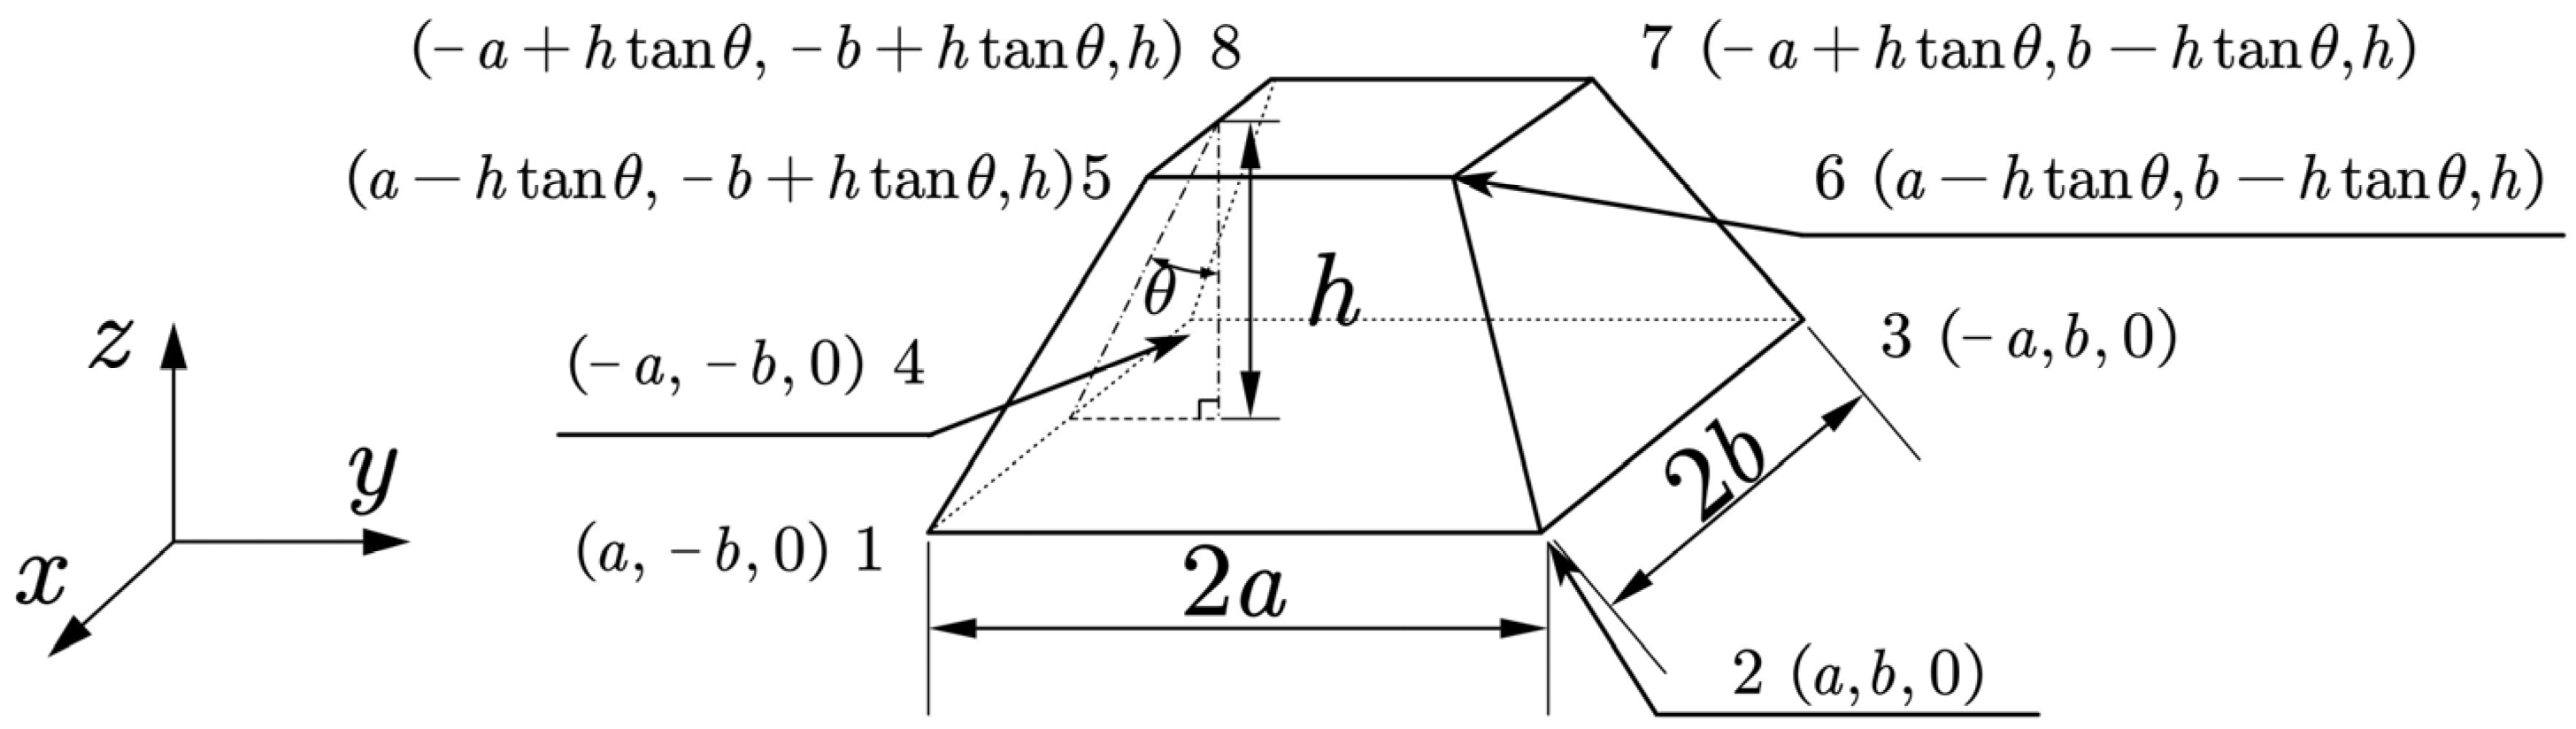
Figure 5 shows the dimensional parameters of the molded pulp structural cell. The half length a, half width b, height h, draft angle θ, and thickness th all exert distinct influences on the structural performance. These geometric parameters play critical roles in determining the load bearing and vibration damping capacities of molded pulp products, which form the central focus of this section’s investigation.
Figure 5.
Schematic diagram of the dimensions of the molded pulp structural cell.
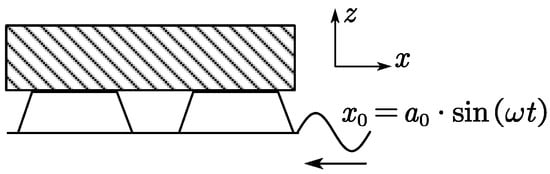
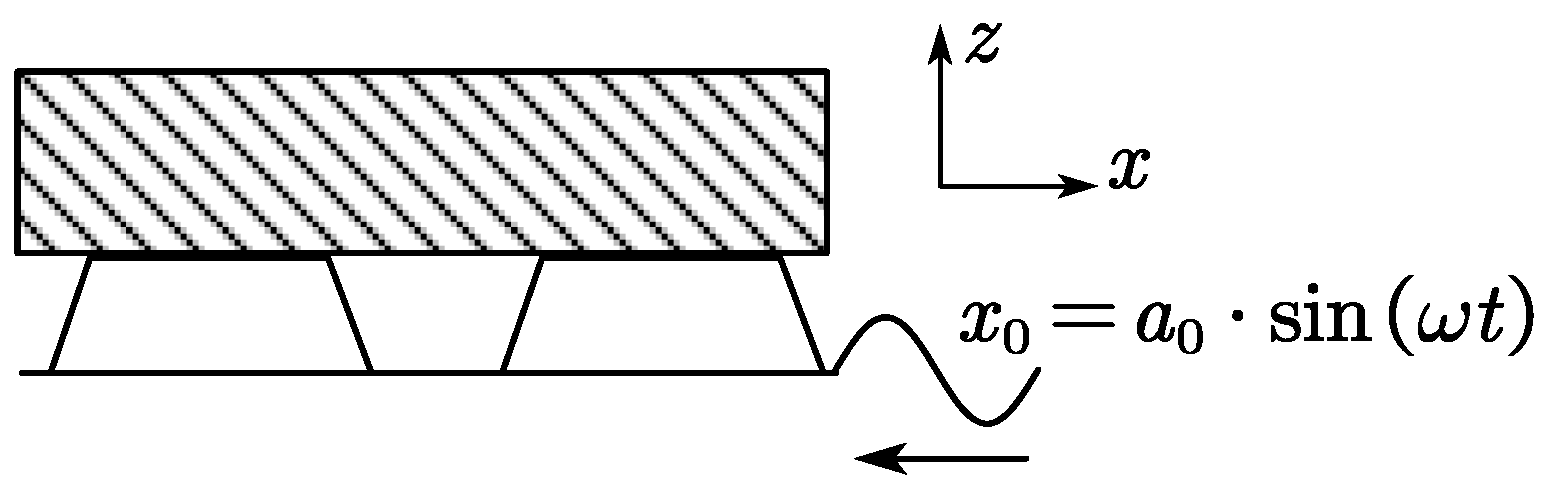
When molded pulp is used as a cushioning material, the portion that predominantly contributes to vibration attenuation is the lower section of the structure, which comes into contact with the product and undergoes precompression under gravitational load [30,31]. As shown in Figure 6, excitation was applied beneath the molded pulp structural cell, which transmitted stress to the abstracted mass block representing the packaged object above, thereby inducing displacement in the mass block.
Figure 6.
Schematic of molded pulp vibration mitigation structure.
Figure 6 shows a schematic of the molded pulp vibration damping structure. When placed between the ground and load, the molded pulp structural cell undergoes strain owing to the downward gravitational acceleration of the mass block. Within this small strain range, the vibration can be regarded as occurring under fixed constraints between the molded pulp structure and load. The following assumptions were made to simplify the description of the model state:
- The model ignores the effect of damping.
- The displacements of Nodes 5–8 of the structural cells are equal, but the displacements between different structural cells can be different.
- The model only considers the resonance problem caused by excitation during transportation and does not consider cumulative fatigue damage and transient shock events.
Consequently, in the elastic stage, the composite system can be modeled as a constrained, non-damping forced vibration system. Thus, the structural analysis requires the establishment of both the vibration response model and the stiffness of the equivalent spring. The relationship between the force and displacement in the z-direction was computed using FEM to determine the model stiffness. Accordingly, the following sections are devoted to calculating the normal stiffness of the structural cell and determining the modal frequencies of the corresponding dynamic model.
4. Establishment of the Relationship Between the Normal Stiffness of the Structural Cell Model and Its Structural and Material Parameters
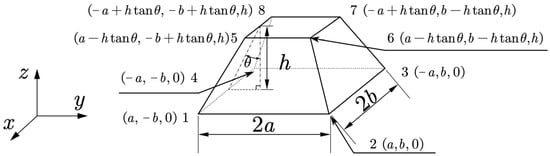
The normal stiffness of the structural cell model is critical for developing the subsequent dynamic model of the composite system comprising the molded pulp packaging and packaged object. It serves as an essential structural link between external excitation and system mass. A parameterized model was constructed to illustrate the molded pulp structural cell, as shown in Figure 7.
Figure 7.
Model of the molded pulp structural cell.
As shown in Figure 7, the structure was modeled as a surface-based shell element consisting of eight nodes and five elements. The correspondence between the element and node numbers is presented in Table 1.
Table 1.
Correspondence between the elements and nodes.
The coordinates of the nodes were defined as follows:
4.1. Construction of the Shell Element Stiffness Matrix
For the shell element, the stiffness matrix comprises two parts: the in-plane stress component and the out-of-plane bending component.
The stiffness matrix for the in-plane stress component is given by
where each component is expressed as
and the explicit forms of these terms are given by
where t denotes the shell thickness, and ; . Parameters and represent the local coordinate values of the nodes, taking either 1 or −1. .
The stiffness matrix corresponding to the bending component is expressed as
where each element can be written as
By substituting the constitutive model of molded pulp material [32] into Equation (6), the explicit expressions of these terms are obtained as
where , ; ; .
Based on the discussion of the in-plane and bending problems, each node possesses three translational and two rotational degrees of freedom. The initial assumption sets the rotational angle around the z-axis to zero. To maintain consistency in the spatial degrees of freedom, a rotational degree of freedom around z was introduced but assigned a value of zero.
Accordingly, the shell element stiffness matrix can be expressed as
where the subscripts denote the node numbers, and e represents the element number. The element kij for two nodes is given by
where and are derived from the in-plane and bending analyses, respectively.
The shell element displacement vector is
The shell element force vector is
The relationship between the element coordinate system and the global coordinate system is expressed by the rotational transformation matrix R0 = RzRyRx. The overall transformation matrix is defined as λ = diag[R0R0R0R0R0R0R0R0]. And thus, the element displacement matrix, force matrix, and stiffness matrix in the global coordinate system is represented as
The element force and displacement relations can be described as . The nodal displacement dimensional are and , and the nodal force dimensional are and . It is obvious that the dimensions of the translation–translation, translation–rotation term, and rotation–rotation sub-block in the stiffness matrix naturally satisfy F/L, F, and F·L, respectively.
A dimensional check confirmed that all submatrices of the element stiffness matrix possessed physically consistent units, ensuring compatibility between the nodal forces and generalized displacements.
For a linear elastic shell element under small deformations, the transpose global stiffness matrix can be written as , which shows that the stiffness matrix remains symmetric after the transformation, as expected.
4.2. Establishment of the Global Stiffness Matrix for the Structural Cell Model
For the global model, the relationship between the nodal forces and displacements is expressed as F = kq, where F denotes the global nodal force vector, K is the global stiffness matrix, and q is the global displacement vector. In the model considered in this study, each node is shared by multiple elements, and its resultant nodal force is the vector sum of the forces contributed by all the elements that share that node.
Taking Node 1 as an example, this node is shared by Element 1 and Element 4; therefore, its total nodal force is obtained by summing the contributions from both elements:
where the superscript denotes the element number and the subscript corresponds to the node number.
When the nodal forces are obtained by summing the contributions from all elements sharing that node, the corresponding stiffness components must be summed. Expanding the force–displacement relationship leads to the global stiffness matrix of the eight-node trapezoidal shell element:
where represents the stiffness influence of node i on node j under the applied load, and every is a 6 × 6 matrix. The overall stiffness matrix k has dimensions of 48 × 48. It can be observed that the stiffness coupling terms appear only between nodes belonging to the same element.
4.3. Calculation of the Normal Stiffness of the Structural Cell Model
For the simplified FE representation of the molded pulp structure, the model can be further reduced to an equivalent axial spring system, where the relationship between force and displacement is expressed as
In Equation (15), the supporting force P arises from the deformation of the structural cell. In the simplified model, Nodes 5–8, which are in contact with the mass block, experienced identical displacements along the z-direction. Consequently, the total supporting force is the sum of the z-directional forces at these nodes.
Referring to Equation (11), the displacement matrix q is given as
where only the last four nodes exhibit vertical displacement z0, and the upper nodes remain fixed.
Using the global stiffness matrix from Equations (12)–(14), the total vertical reaction force at Nodes 5–8 is obtained as
where ki,j denotes the element of the global stiffness matrix of the molded pulp structural unit.
Let the equivalent spring stiffness k of the simplified model be defined as .
When substituting the symbolic parameters’ half bottom dimensions a, b, height h, thickness th, draft angle θ, in-plane elastic modulus E1, shear modulus G, and Poisson’s ratio v1 into the elements of the stiffness matrix of Equation (14), the simplified stiffness k is
where the coefficients are defined as , .
The longitudinal stiffness k of the molded pulp structural cell in the simplified model is determined by its geometrical parameters, bottom length a, width b, thickness th, height h, and draft angle θ, as well as the material parameters, in-plane elastic modulus E1, shear modulus G, and Poisson’s ratio v1.
Within the interval θ∈(0,π/2], parameter A increases with θ, while B decreases with increasing θ. Consequently, the overall stiffness k decreases with increasing a and b, but increases with larger th, h, and material parameters E1, G, and v1.
The normal stiffness k, which encapsulates all structural and material parameters of the molded pulp structural cell, is therefore of fundamental importance for establishing the subsequent global dynamic model of the molded pulp packaging system and packaged object.
4.4. Establishment of the Vibration Dynamics Model for the Molded Pulp Packaging–Product Assembly
When molded pulp packaging supports an object, the bearing capacity arises from the distributed arrangement of structural cells discussed in the previous section.
As illustrated in Figure 8, the molded pulp structure supporting the packaged object can be simplified as a spring–mass system. In the z-direction, the sidewalls and bottom plate of each molded pulp structural cell collectively act as an equivalent spring supporting the mass block that represents the packaged product.
Figure 8.
Load-bearing model of the molded pulp structural cell and its simplified representation. (a) Load-bearing model; (b) simplified model.
Because Nodes 5–8 of the structural cell are symmetrically distributed and each supports the same mass, the total supporting force is the sum of the vertical reaction forces at these four nodes. This simplification enables the structural cell to be treated as a single elastic spring element with an equivalent normal stiffness k, which has been derived analytically using Equation (18).
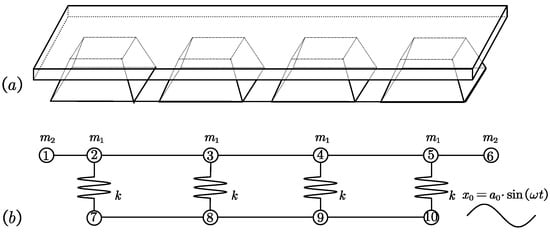
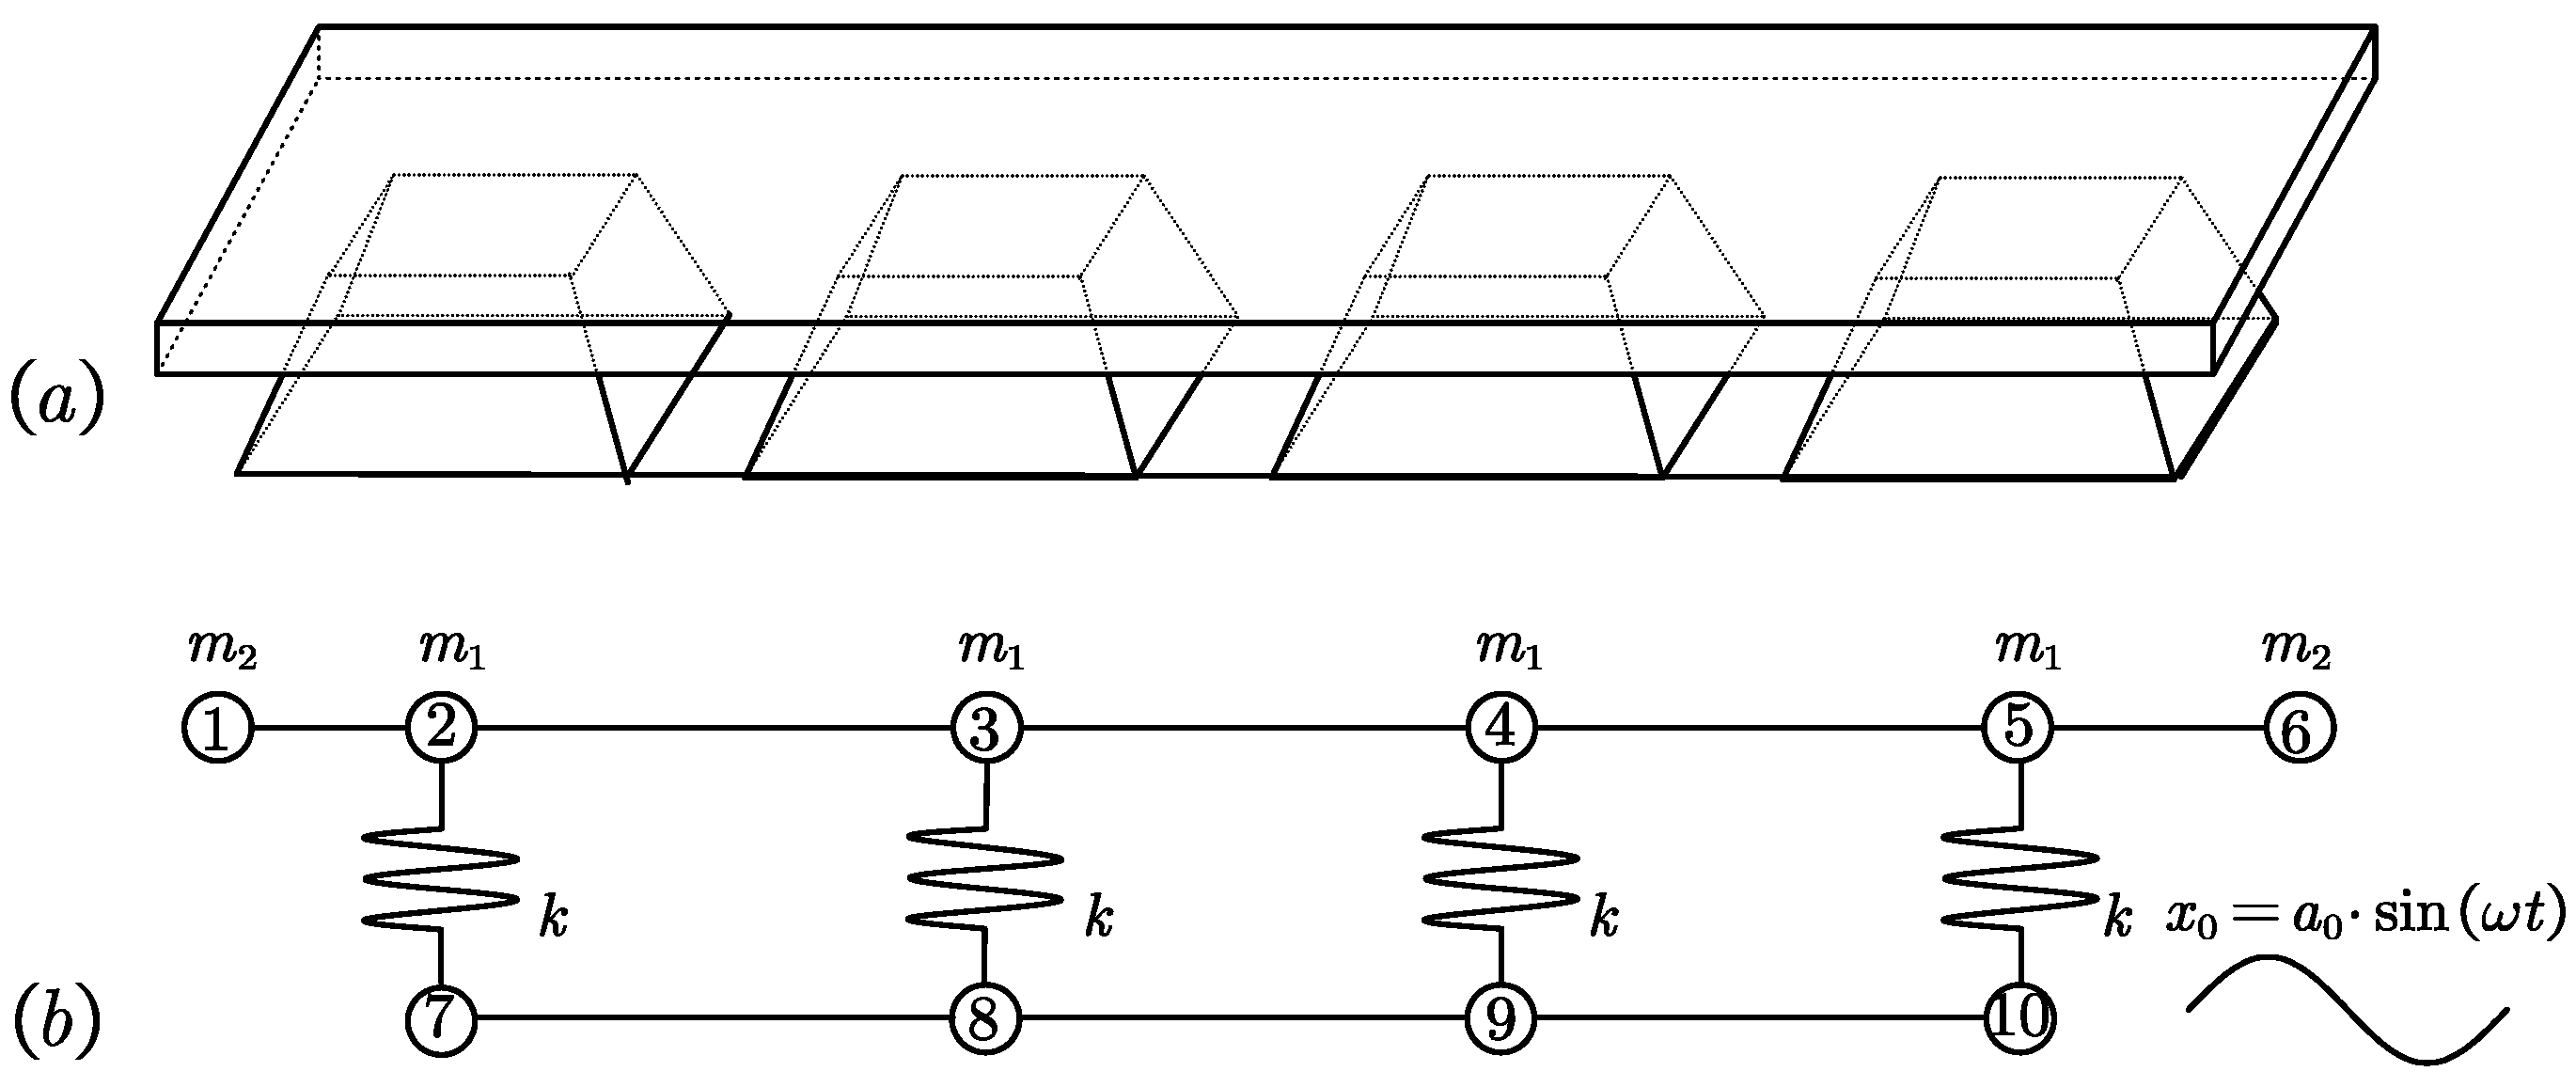
Extending the analysis to the entire molded pulp packaging system and the product it supports, it can be observed that mutual interactions may occur among the products when multiple molded pulp structural cells support them simultaneously. To accurately capture the vibration characteristics of the coupled system, a lumped-mass modeling approach was adopted, as shown in Figure 9.
Figure 9.
Load-bearing model of the molded pulp packaging and product system. (a) Overall model; (b) simplified configuration.
In this model, k represents the normal stiffness of the molded pulp structural cell, m1 and m2 denote the concentrated masses corresponding to different components of the packaged product, and x0 = a0 sin(ωt) describes the base excitation displacement.
The masses are interconnected by equivalent elastic beams possessing bending, torsional, and axial stiffnesses equivalent to the physical parameters of the actual substructures they replace.
Each substructure connected two adjacent concentrated masses, and each end of the beam had six degrees of freedom (three translational and three rotational). The nodal force and displacement vectors are expressed as
The mass matrix of the substructure is given by
where m is the mass of the substructure, l1 and l2 are the distances from each mass to the substructure centroid, l = l1 + l2 is the total beam length, and Jx, Jy, Jz are the moments of inertia of the principal axes.
Considering bending and torsional deformation, the substructure stiffness matrix is
where
where A is the beam cross-sectional area, Ip the polar moment of inertia, Iy and Iz the planar moments of inertia about the y-axes and z-axes, respectively, and E the elastic modulus of the packaged object.
When external excitation is applied through the base, for instance, at Node 2, the external elastic element with stiffness k induces a restoring force k[x7-asin(ωt)], where x7 is the displacement of the node along the excitation direction.
Considering that Nodes 7–10 are constrained in the normal direction, only their normal stiffness components are retained in the global stiffness matrix. Ignoring damping, the global equation of motion is , where m is the global mass matrix, k the global stiffness matrix, and f the external force vector.
If the base excitation displacement is x(t) = x0sin(ωt) = ℜ{a0eiωt}, then ẍ(t) = −x0ω2sin(ωt). When the base excitation acts only on selected degrees of freedom, the motion equation becomes
where kb is the additional stiffness matrix owing to the molded pulp structural cells, and Sb is the selection vector with entries of 1 for the base-excited degrees of freedom and 0 otherwise.
Transforming Equation (24) to the frequency-domain gives
Model reduction is necessary owing to the high dimensionality and coupling within the system. By solving Equation (17), following displacement relation can be found as
where an(n = 3, 9, 15, 17, 21, 23, 27, 29, 33, 35) are parameters that contain L and all these displacements are not on the main vibration axes. By employing kinematic constraints and modal condensation, the displacement relations between nodes can be expressed as
where is the reduced displacement vector containing only the principal vibration degrees of freedom, and is the reduction (or mapping) matrix constructed according to the equivalence and proportional relations among nodal displacements, as specified in Equation (26).
Substituting (27) into (25) and premultiplying by yields the reduced-order harmonic response equation:
which can be simplified as
where Q denotes the response amplitude in the modal coordinates.
Reconstructing the full displacement vector yields
and the time-domain displacement is x(t) = ℜ{X(ω) eiωt}.
If structural symmetry and Equation (26) allow the system to be approximated by a single principal degree of freedom, the governing equation reduces to
Leading to the explicit transfer function between base displacement amplitude a0 and the structural response:
For free vibration without external excitation or damping, the reduced order system satisfies
which corresponds to the eigenvalue problem
where mr = TTMT, Kr=TTKT, and Kb,r = TTKbT; T is the mapping matrix defined by Equation (26).
The eigen frequencies are ordered as ω1 ≤ ω2 ≤ …, where ω1 is the first order modal frequency.
This can be expressed functionally as
where w is the width, h1 the height, and l the length of the mass block; k is the normal stiffness of the molded pulp structural cell derived from Equation (18); m1 is the mass of the product supported by the molded pulp packaging.
Thus, Equation (35) establishes a comprehensive coupled vibration model incorporating both the structural parameters of the molded pulp cells and the physical properties of the packaged product. This model enables the accurate computation of the vibration modes of the packaging–product assembly and facilitates the optimization of the molded pulp structural cell design for enhanced vibration mitigation performance.
4.5. Sensitivity Analysis of the Dynamic Model
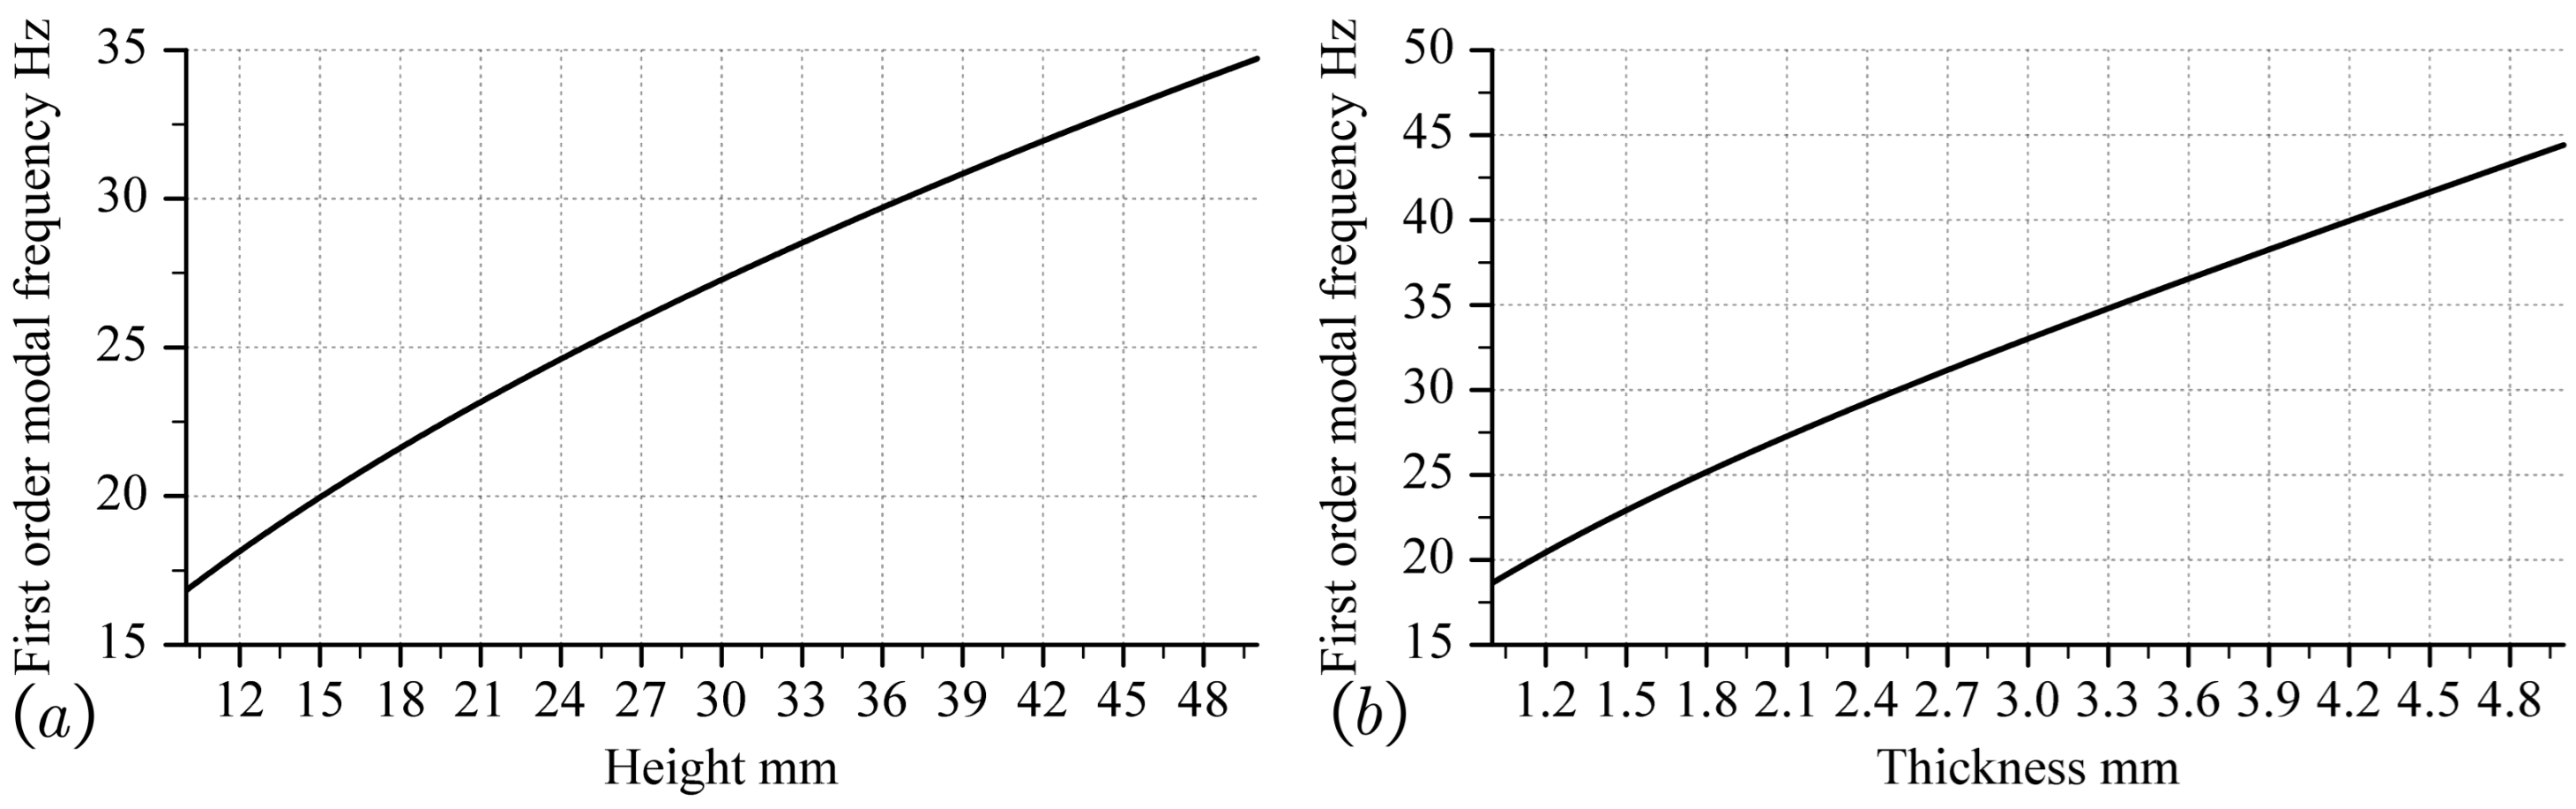
For a fixed mass block and identical excitation conditions, the influence of the normal stiffness k of the molded pulp structural cell on the first order modal frequency was investigated. By substituting Equation (18) into Equation (35), the effects of the cell parameters, including the plate thickness th, height h, length a, width b, and draft angle θ, on the first order modal frequency of the overall dynamic model were obtained.
As shown in Figure 10a, the first order modal frequency of the overall dynamic model increases with increasing cell thickness. During the increase in thickness, the frequency passed through 18 Hz and 25 Hz, which correspond to the resonance frequencies of road transport excitation. This indicates that in the design and production processes, the influence of thickness on the modal frequency of the overall dynamic model must be carefully considered to avoid overlapping with the excitation frequency range.
Figure 10.
The influence of (a) thickness th and (b) height h on the first order modal frequency.
As shown in Figure 10b, the effect of height h on the first order modal frequency approximately follows a quadratic relationship. As height increased, the growth rate of the frequency gradually decreased. The frequency also crossed 18 Hz and 25 Hz, implying potential resonance with transportation excitations. Hence, the height must be carefully selected to prevent resonance during the design process.
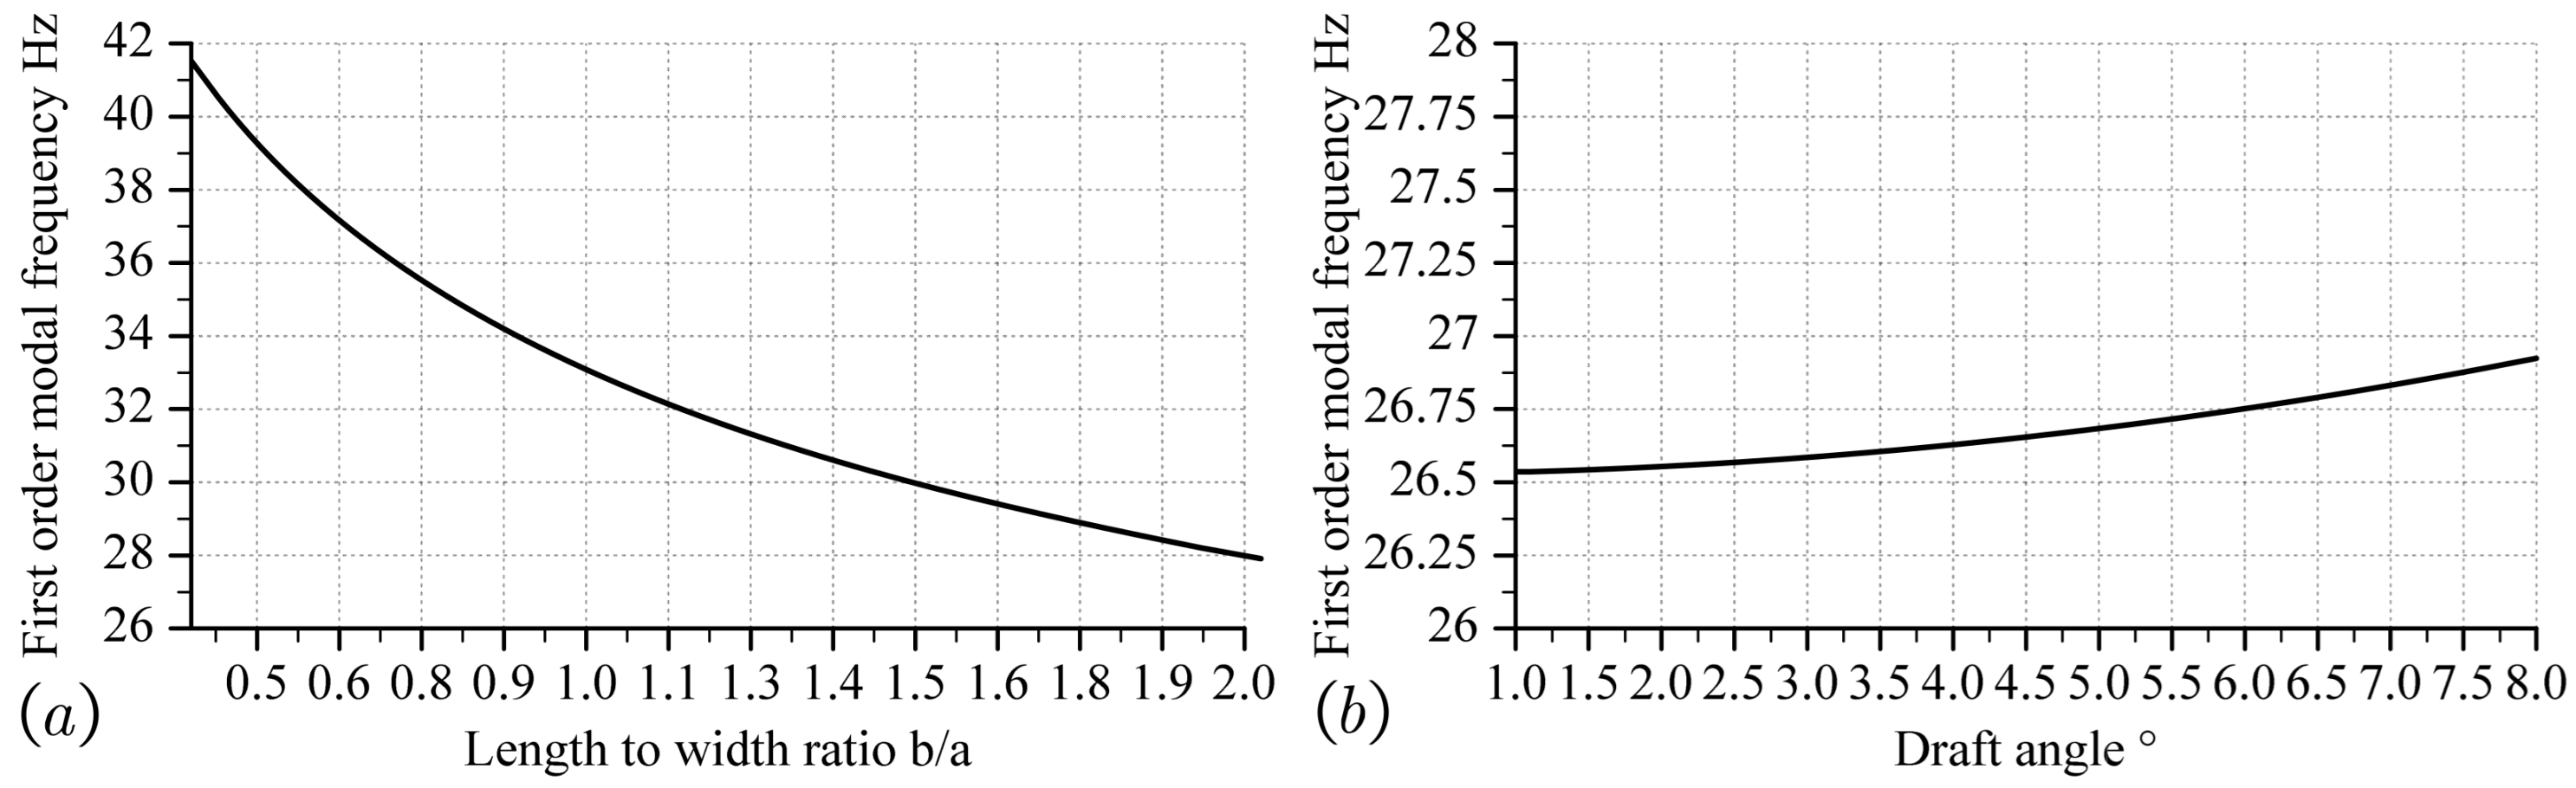
As shown in Figure 11a, the influence of the aspect ratio b/a is approximately quadratic: as b/a increases, the first order frequency decreases, and the rate of decrease gradually diminishes. The aspect ratio strongly affects the dynamic characteristics of the overall packaging structure; thus, its impact on the first order modal frequency should be precisely evaluated in the design.
Figure 11.
The influence of (a) bottom aspect ratio b/a and (b) draft angle θ on the first order modal frequency.
Figure 11b shows that increasing the draft angle θ from 1° to 8° (the typical maximum in engineering applications) results in only a 0.45 Hz increase (approximately 2%) in the modal frequency. Compared with the other dimensional parameters, this variation was negligible. Therefore, in practical design, the draft angle may be determined primarily based on manufacturing efficiency rather than on dynamic considerations.
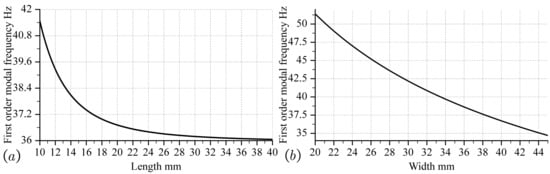
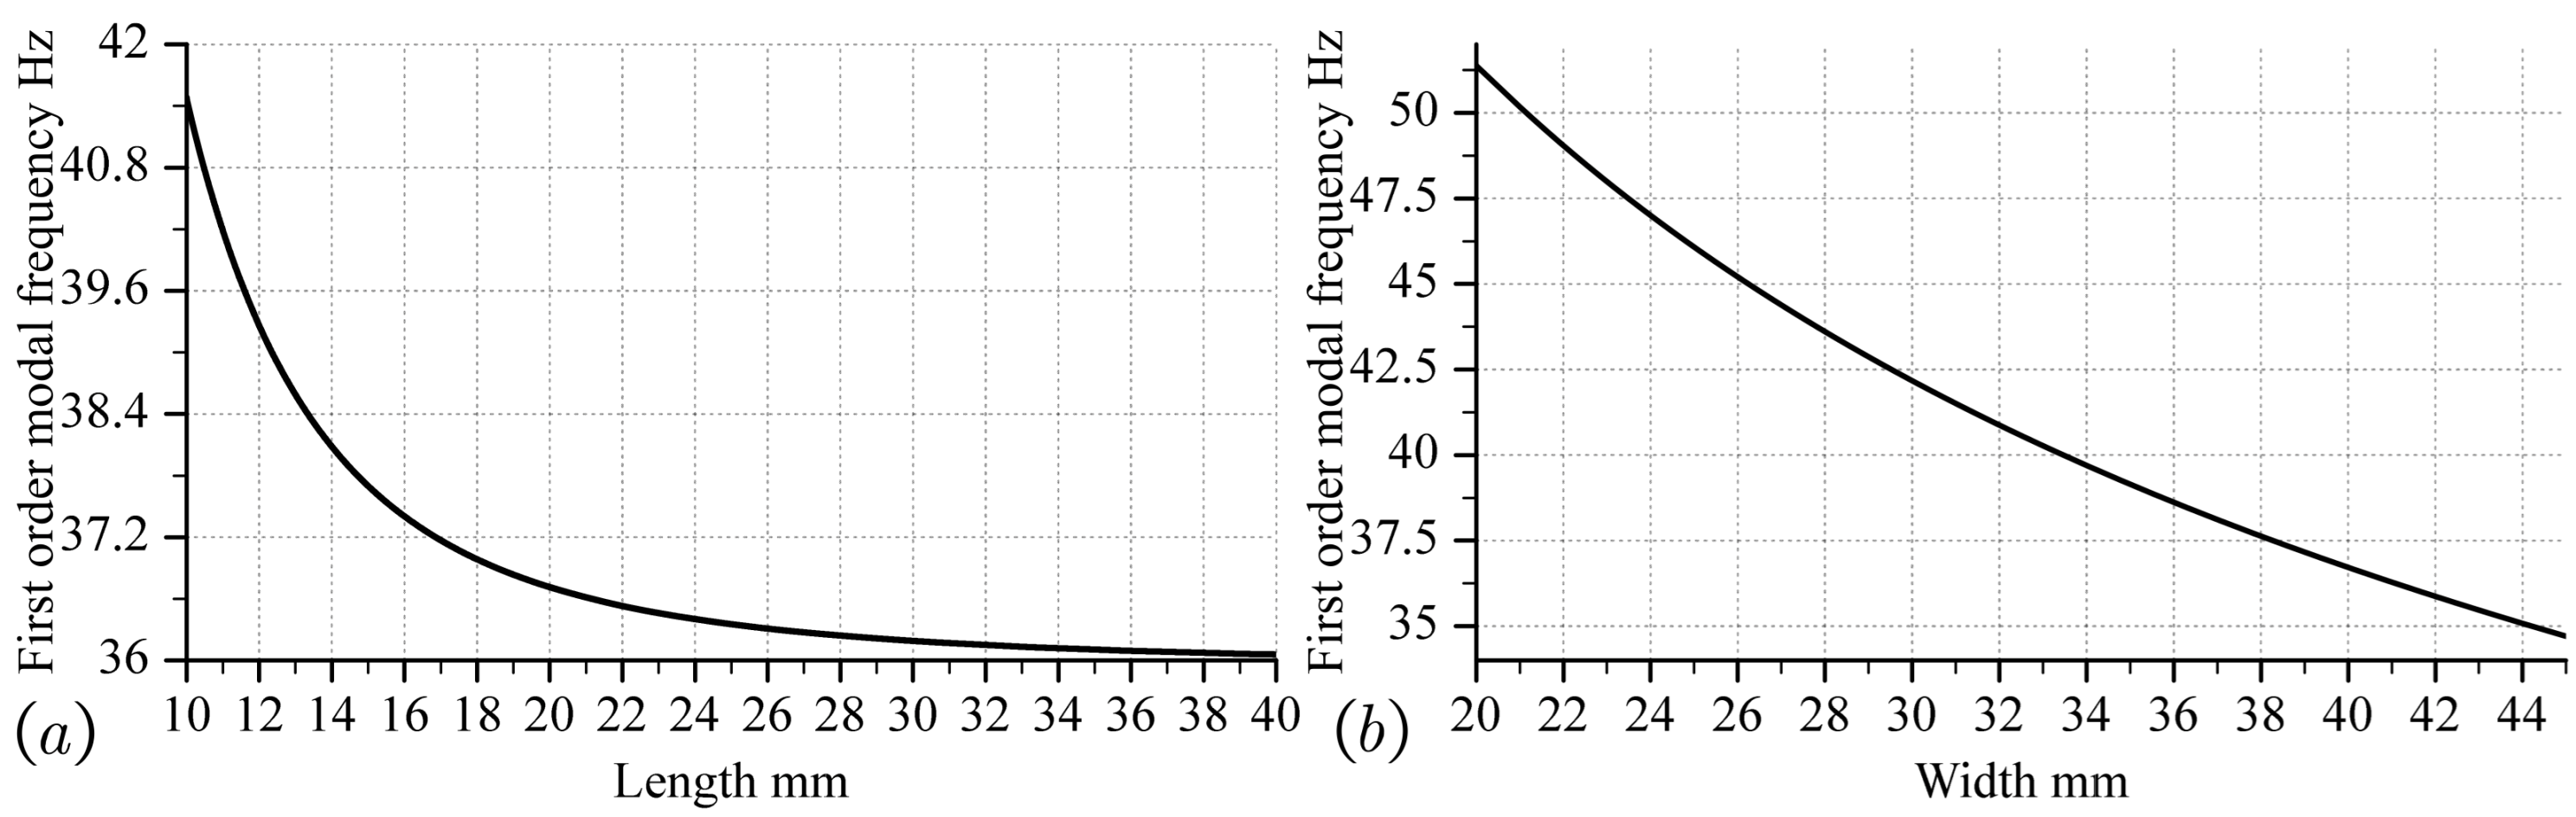
Figure 12 illustrates the influence of the length and width of the structural cell on the first order modal frequency. When other parameters are kept constant and maintain an equal bottom area, both the length and width show a decreasing relationship with frequency as their dimensions increase. As the bottom area increased, the first order modal frequency of the overall dynamic model decreased, indicating a reduction in stiffness.
Figure 12.
The influence of (a) length a and (b) width b on the first order modal frequency.
4.6. Optimization Design Method for Road Transportation of Molded Pulp Packaging
Optimization design methods can be used to determine the final result under the influence of different parameters. By substituting the external dimensions w, h, and l, mass m1, and material properties of the packaged item into the dynamic model in Section 4, the first order modal frequency of the dynamic model is used as one of the objective functions:
where k is the stiffness of the molded pulp structural cell, which is dependent on the design variable X = [m, n, a, b, h, th, θ]; the structural cell has length a, width b, height h, thickness th, draft angle θ, and structure cell number m × n. The second objective function is to minimize the overall volume of the structure:
To ensure that the optimization results meet the requirements of actual engineering, nonlinear constraint functions are introduced into the model, including response strain limits, structural geometric constraints, and frequency bandgap conditions, thereby ensuring the feasibility and safety of the obtained structure in terms of manufacturability, mechanical performance, and dynamic response. The overall constraint conditions are as follows:
where .
In the actual packaging structure topology optimization design, dynamic performance must be considered simultaneously, such as avoiding the environmental excitation frequency band of the modal frequency, structural compactness, and resource utilization efficiency. However, the priorities of different engineering objectives are not equivalent. Prioritizing the structural modal performance is a prerequisite for ensuring vibration resistance reliability. Second, the structural height directly affects the stacking efficiency and packaging dimensions and should be controlled. Finally, although the overall structural volume affects the material utilization efficiency, it can be appropriately weighed under the premise that other constraints are met. Therefore, the weighted multi-objective form, as shown in Equation (39), is adopted to construct a comprehensive performance evaluation index:
where ω1(X) is the first order modal frequency, h(X) is the height of the structural cell, V(X) is the total structural volume, and λhλv is the corresponding weighting factor used to control the priority between different optimization objectives.
By inputting the objective function in Equation (40) and the boundary conditions in Equation (39) into the gradient descent method, the optimization results can be obtained.
5. Comparison of Dynamic Model and Finite Element Model in Computational Efficiency
In this section, the molded pulp structure was modeled using the Abaqus 2021.HF3 FE software. Simplified models were employed for a comparison with the theoretical dynamic model to analyze the computational efficiency. The objective was to minimize the computational cost while maintaining sufficient accuracy by comparing the following:
- The full FE model;
- A simplified FE model with reduced boundary complexity;
- The proposed theoretical dynamic model of the molded pulp packaging and packaged assembly (Section 4).
All calculations were performed on the same computer, configured with AMD 5600 G CPU without hyper-threading (total 6 cores), 32 GB DDR4 3200 MHz memory, and a 1 TB solid-state drive.
Modal analysis was performed using the Lanczos eigensolver in Abaqus/Standard. The convergence of the eigenfrequencies was ensured by the internal tolerance of the solver, and additional verification was performed through mesh refinement and modal consistency checks. According to a previous material study [32], the elastic modulus of molded pulp was Ex = 123.15 MPa, with Poisson’s ratios v = 0.1378 and v’ = 0.014, the out-of-plane elastic modulus was Ez = 1.259 MPa, and shear modulus was G = 3.43 MPa.
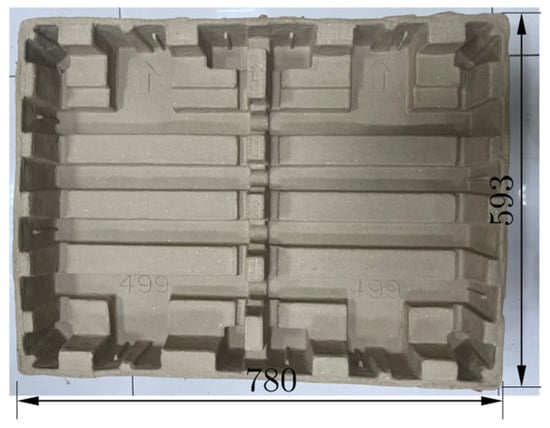
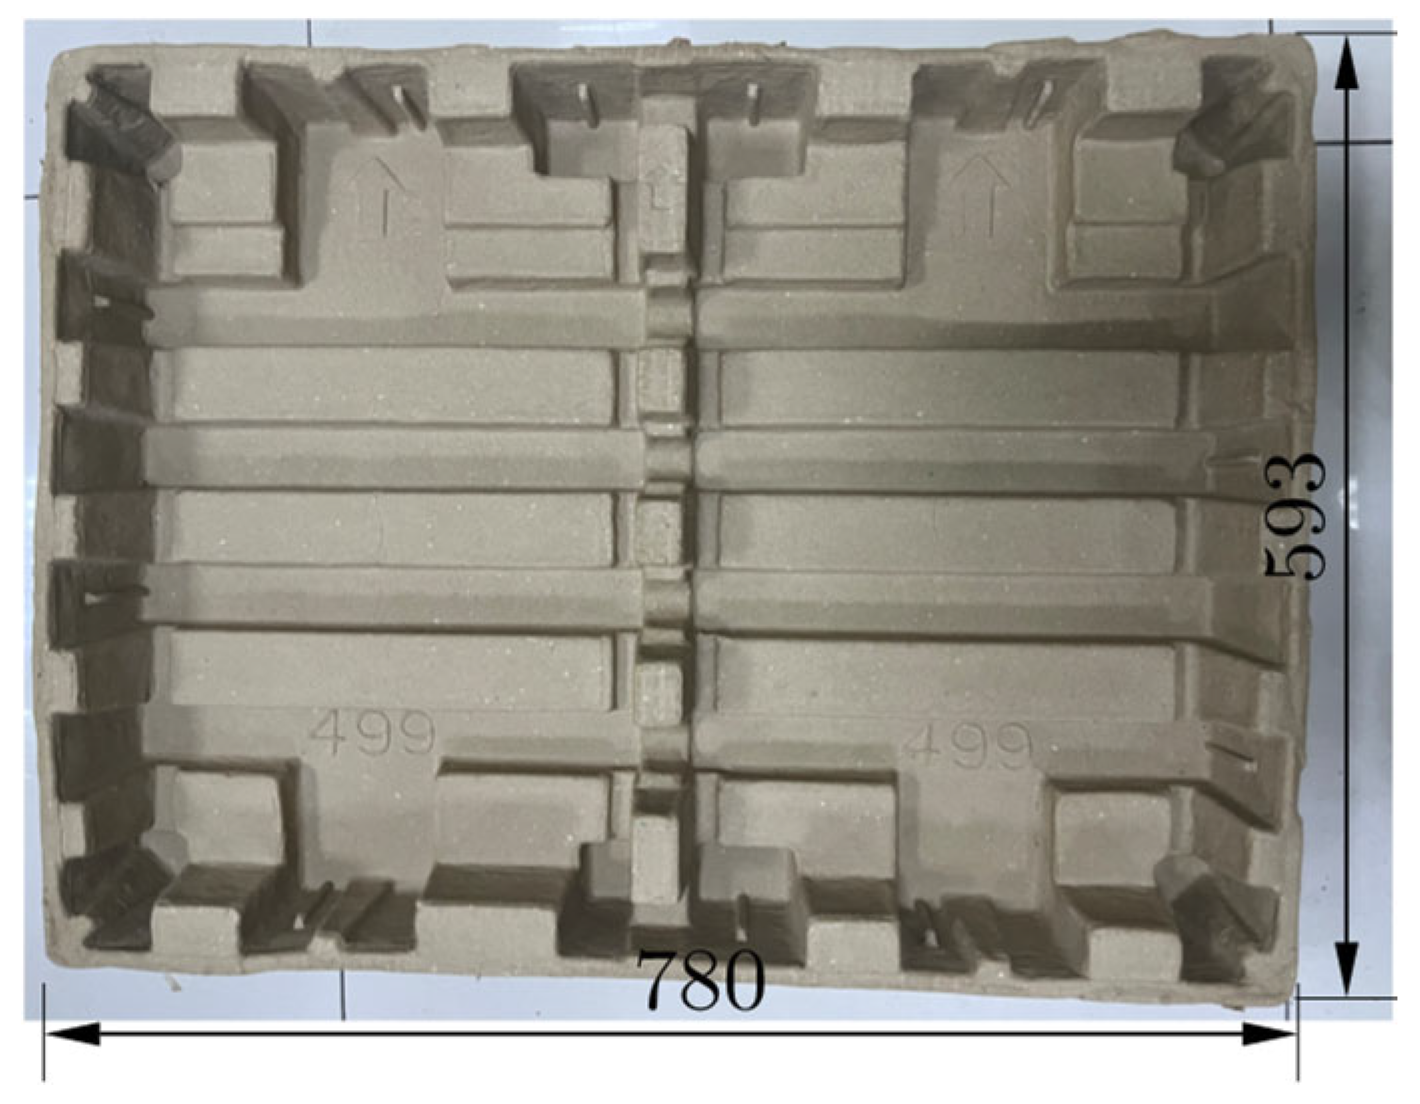
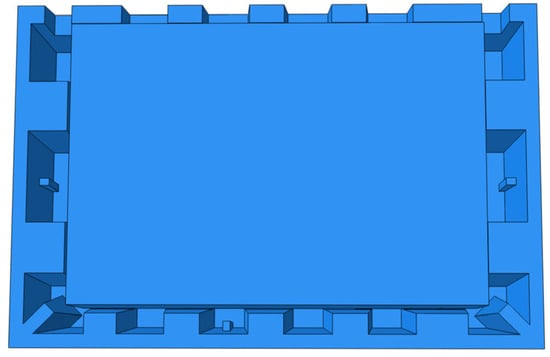
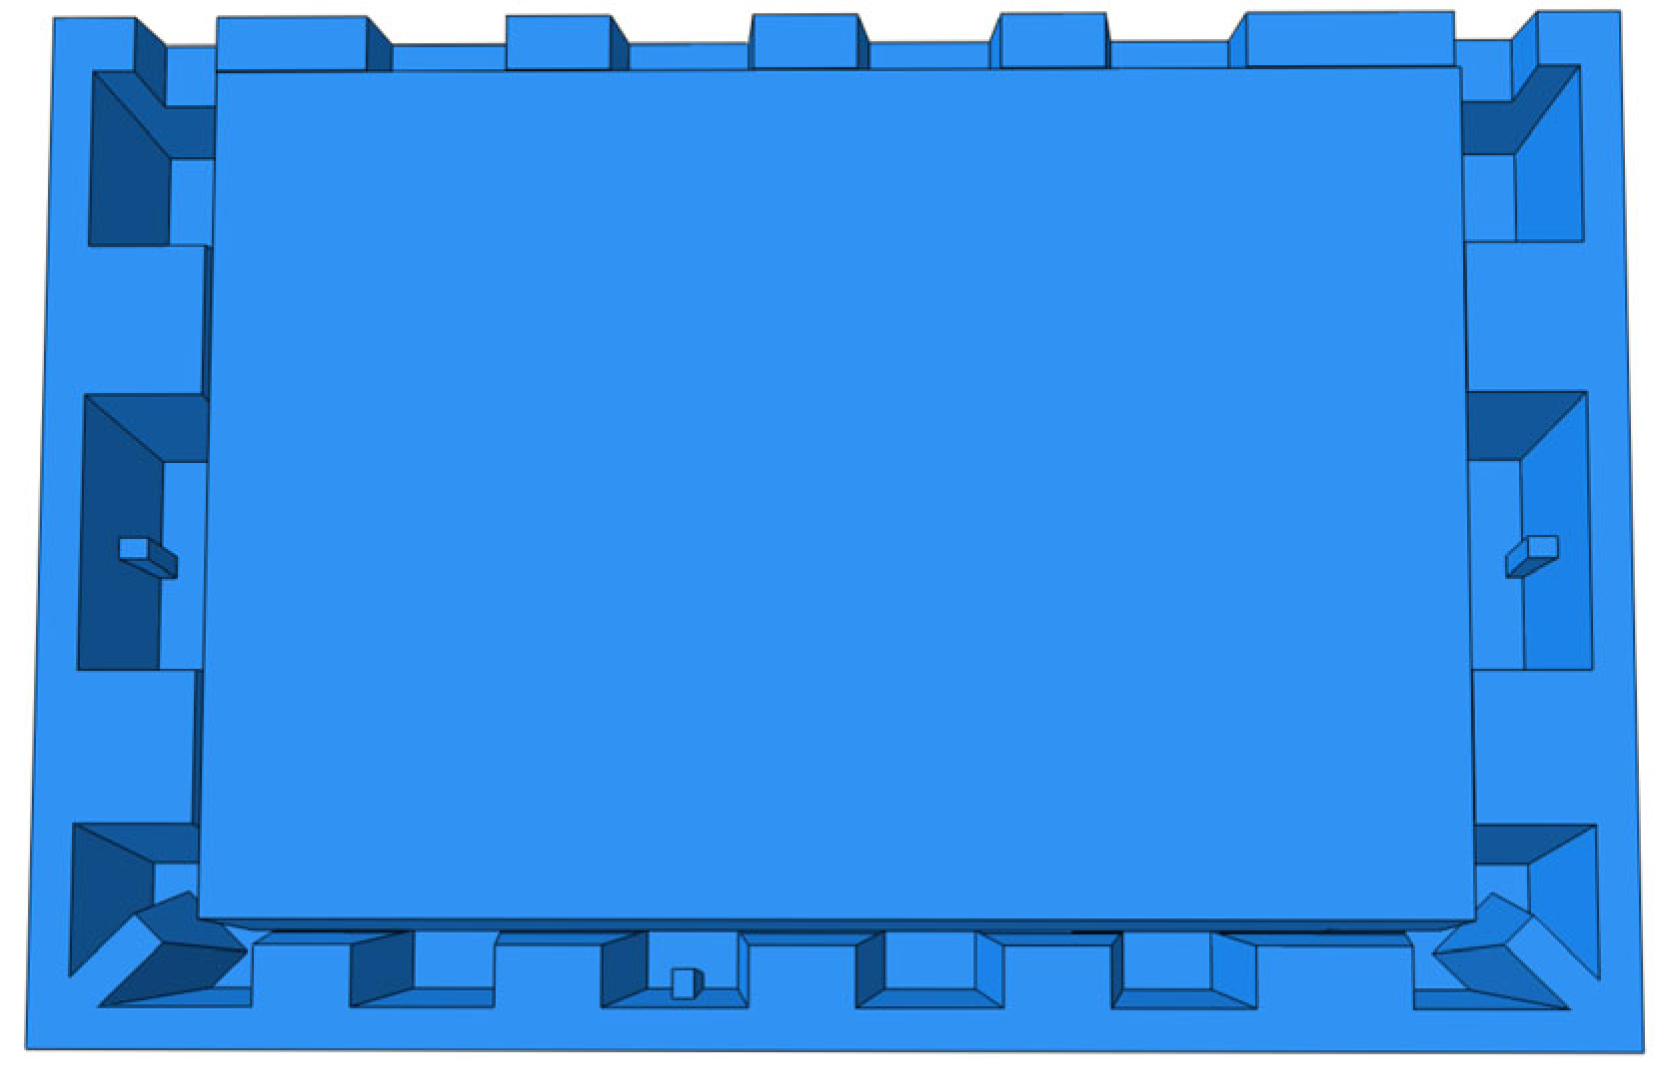
The full structural model was built based on the experimental molded pulp sample, and the differences between the simulated and experimental modal frequencies were used to verify the validity of the FE models. The investigated specimen was a molded pulp tray with dimensions of 780 mm × 593 mm × 106 mm, as shown in Figure 13. The tray served as a supporting and cushioning component beneath the packaged product.
Figure 13.
The molded pulp product investigated in this section.
5.1. Full Structural FE Model
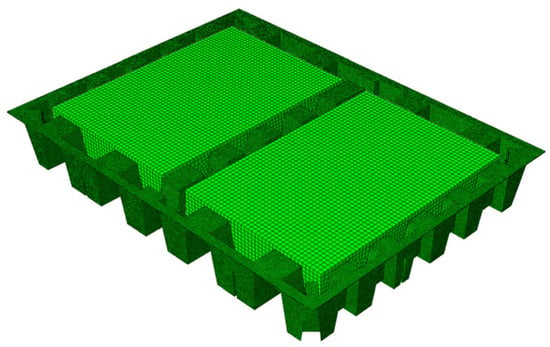
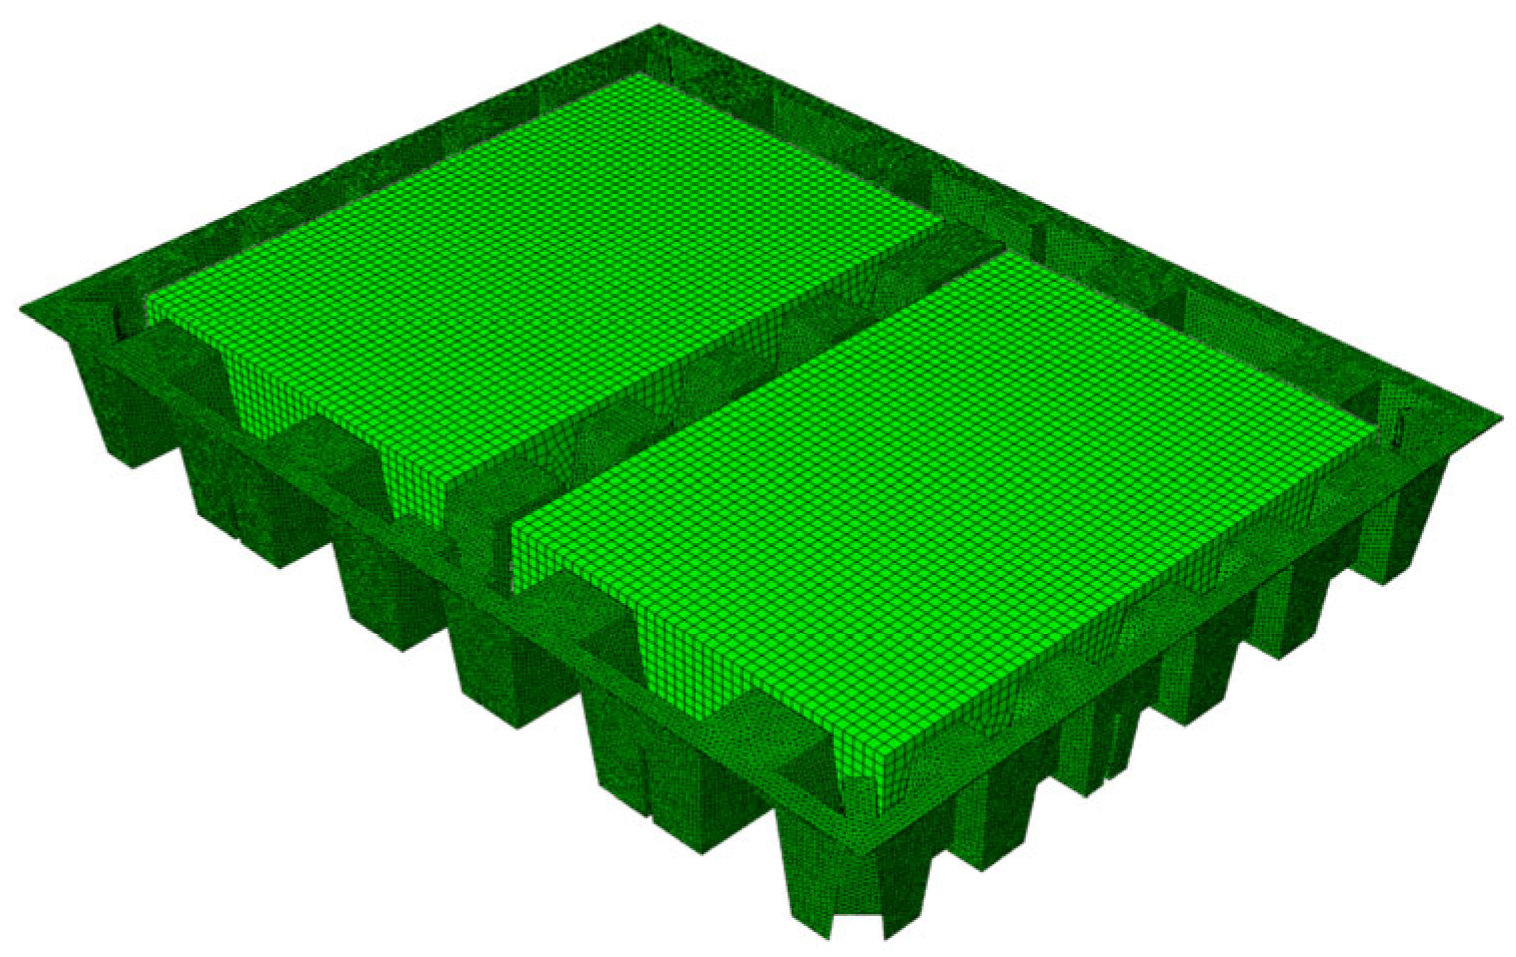
As shown in Figure 14, the full model employed tetrahedral solid elements to represent the molded pulp structure, with a mass block placed inside each cavity to simulate the loaded condition during transport. The local coordinate directions were assigned according to the material anisotropy, and the material properties followed a porosity-dependent transversely isotropic model [32]. Frictional contact was defined between the mass block and the molded pulp structure, and a rigid plate was placed at the base. The molded pulp mesh size was set to 4 mm, with the C3D4 element type. The first two modal shapes are shown in Figure 15.
Figure 14.
FE model of the molded pulp structure.
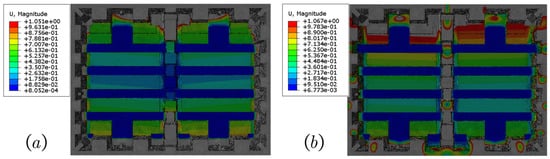
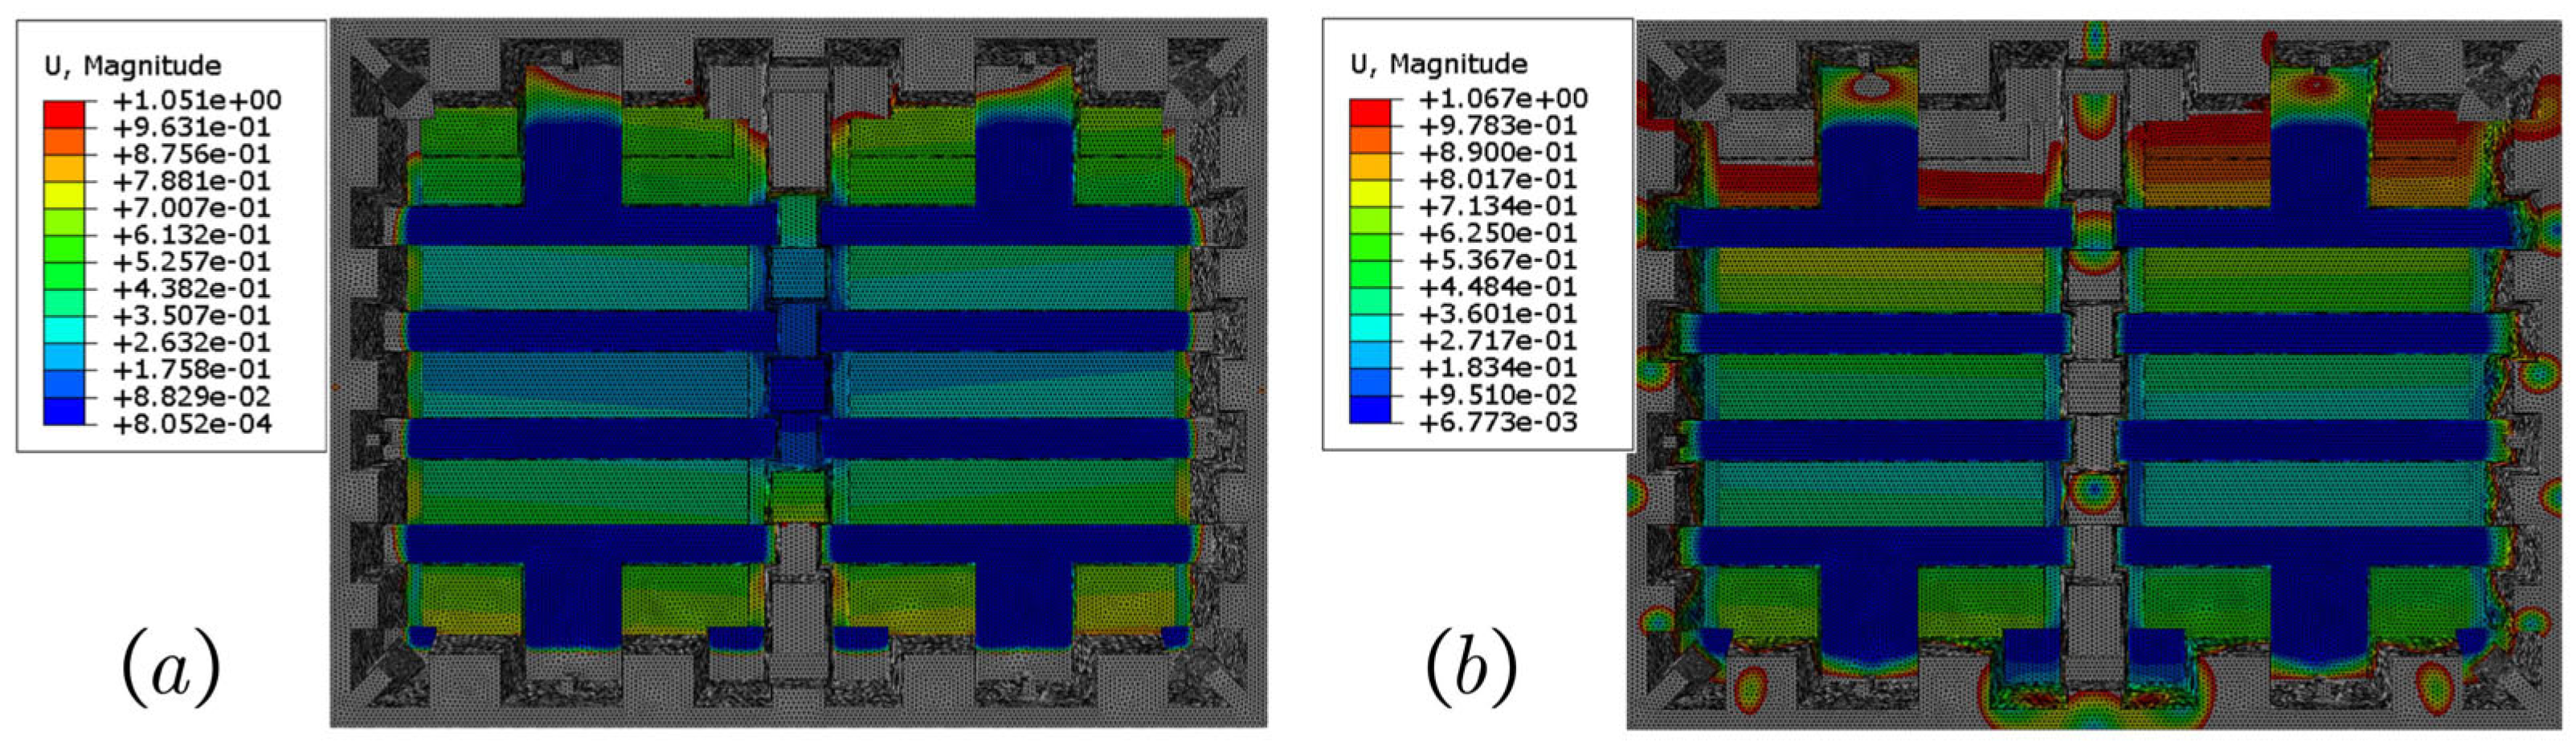
Figure 15.
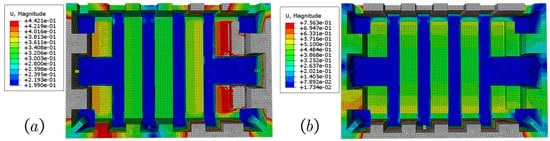
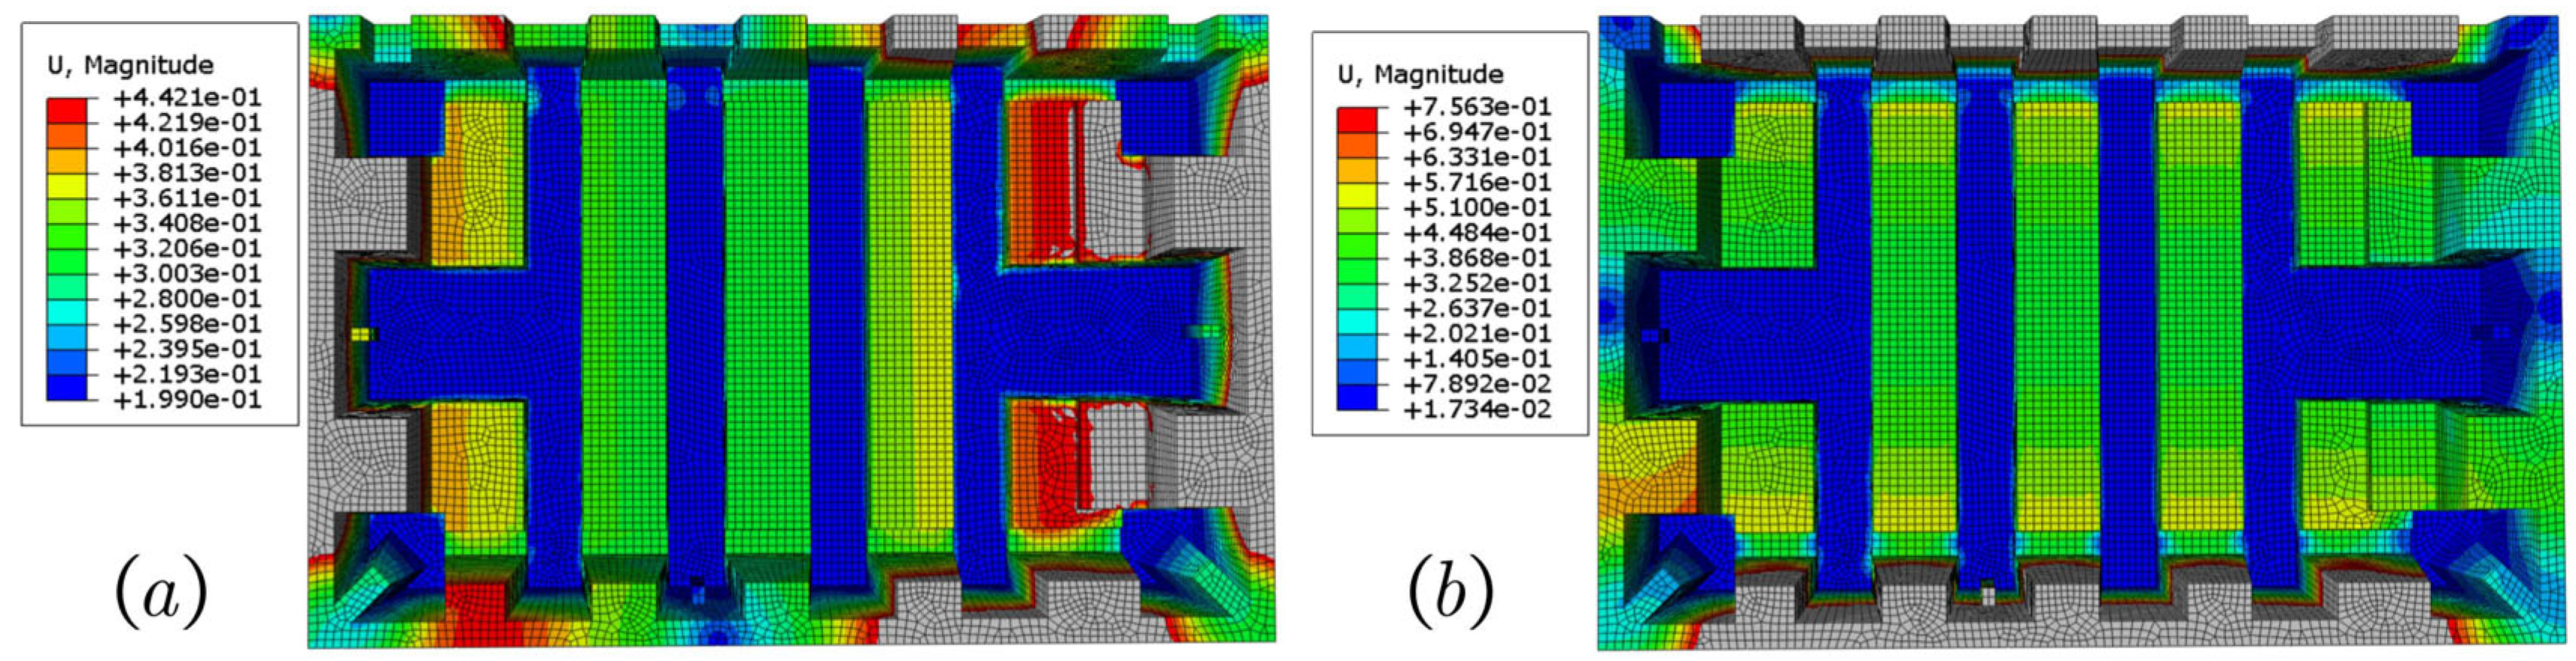
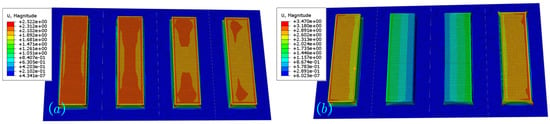
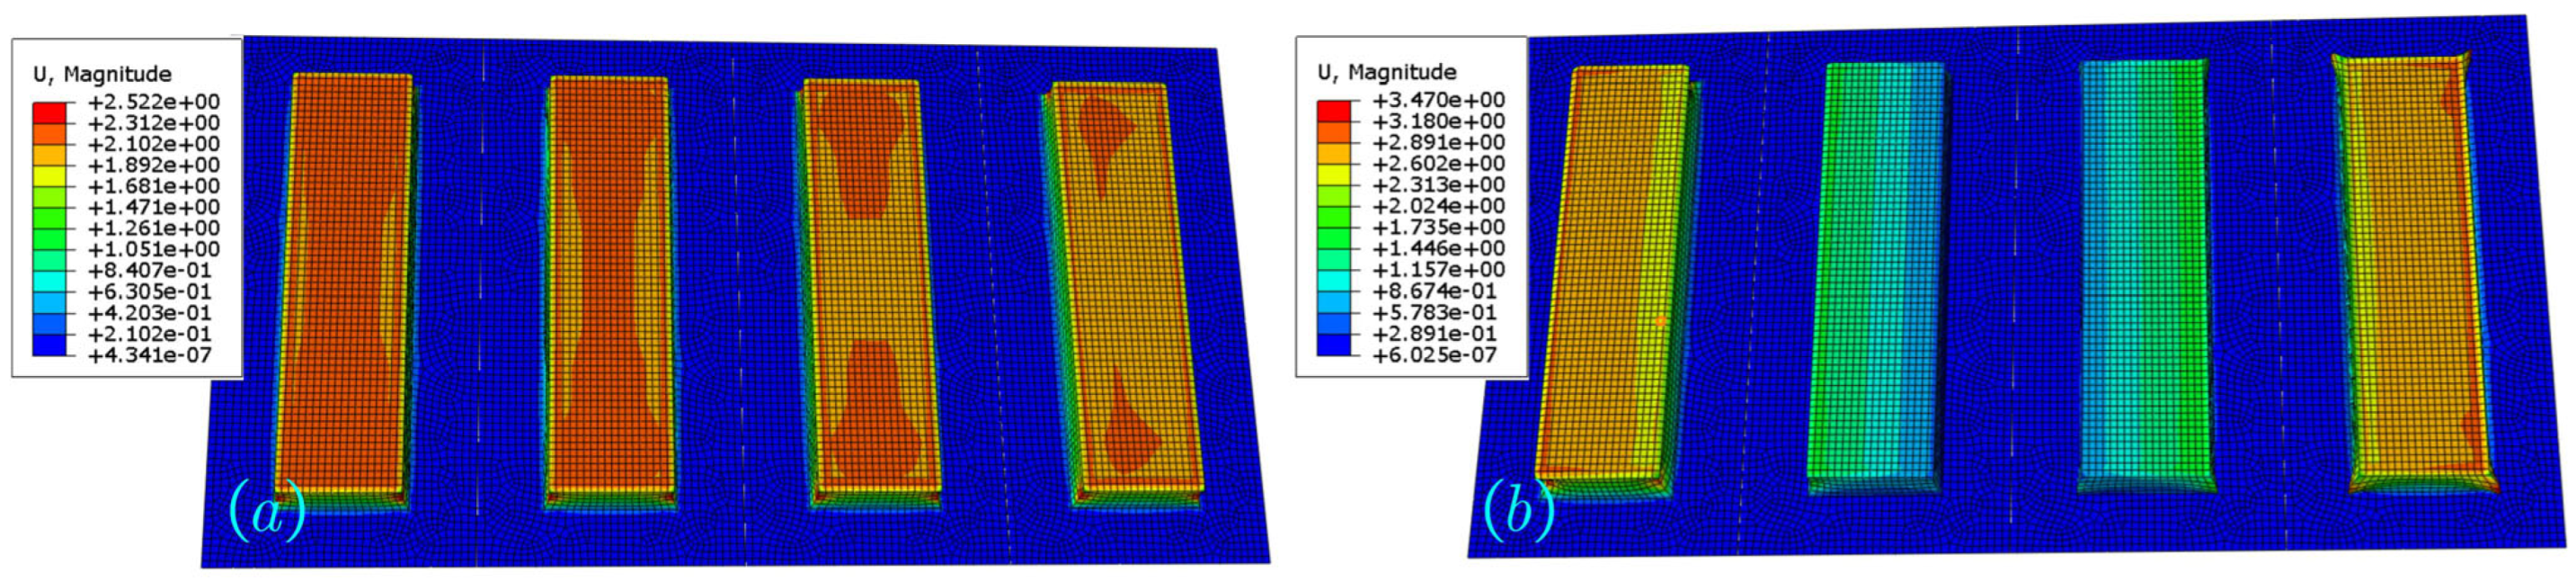
Modal shapes with normalized displacement of the whole structural of the molded pulp: (a) first mode; (b) second mode. The displacement values are scaled for visualization and indicate relative deformation only.
After 5 min 46 s of six-thread parallel solver time, Figure 15a shows that the first modal frequency occurred at 25.304 Hz, corresponding to a vertical translational vibration. Figure 15b shows that the second modal frequency appeared at 55.164 Hz, representing a torsional mode. The sidewall modes were excluded because of the numerous localized free-edge oscillations.
5.2. Half Structure Shell Model
Figure 16 shows the half structure model that used quadrilateral shell elements to represent half of the molded pulp tray, also incorporating a mass block. The same contact and material definitions as in Section 5.1 were applied. The molded pulp mesh size was set to 4 mm, with the S4R element type.
Figure 16.
FE model of the half structural molded pulp system with mass block.
As shown in Figure 17, the solver was completed in 2 min 13 s. The first modal frequency appeared at 25.786 Hz, corresponding to vertical motion, and the second torsional modal frequency occurred at 80.705 Hz. The sidewall simplification effectively eliminated the interference from the local free edge modes.
Figure 17.
Modal shapes with normalized displacement of the semi simplified model of the molded pulp: (a) first mode; (b) second mode. The displacement values are scaled for visualization and indicate relative deformation only.
5.3. Connected Structural Cell Shell Model
A further simplified shell model without edge boundaries was constructed by connecting the structural cells (Figure 18). A mass block was included to represent the packaged load. The model shared the same material and contact definitions as those described in Section 5.1. The molded pulp mesh size was set to 4 mm, with the S4R element type.
Figure 18.
Model of the mass block assembly connected by molded pulp structural cells.
As shown in Figure 19, the solver completed in 58 s, with the first modal frequency at 26.003 Hz (vertical mode) and the second modal frequency at 76.354 Hz (torsional mode).
Figure 19.
Modal shapes with normalized displacement of the molded pulp product without edge structures: (a) first mode; (b) second mode. The displacement values are scaled for visualization and indicate relative deformation only.
5.4. Dynamic Model of Molded Pulp Structural Cell
To validate the dynamic model developed in Section 4.1, experimental data from the specimen shown in Figure 13 were used. The geometrical and mechanical parameters were measured to ensure accuracy: wall thickness th = 1.5 mm, short side a = 50 mm, long side b = 285 mm, and draft angle θ = 5°. The material constants were E1 = 123.15 MPa, v1 = 0.1378, and G = 3.43 MPa.
Substituting these values into the axial stiffness Equation (18) yields
Using k = 1.365 × 10⁴ N/m and the mass block parameters (w = 305 mm, h1 = 60 mm, l = 440 mm, and m1 = 20 kg), the displacement response was computed based on Equation (32). The resulting amplitude–frequency response is shown in Figure 20.
Figure 20.
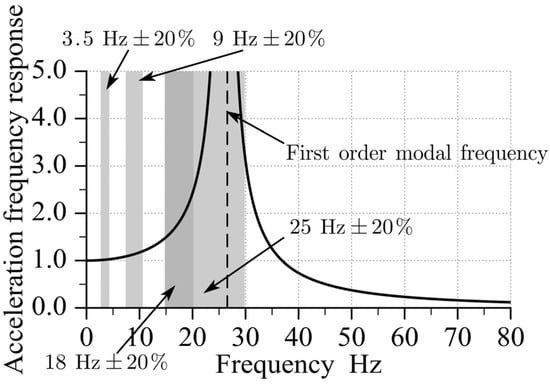
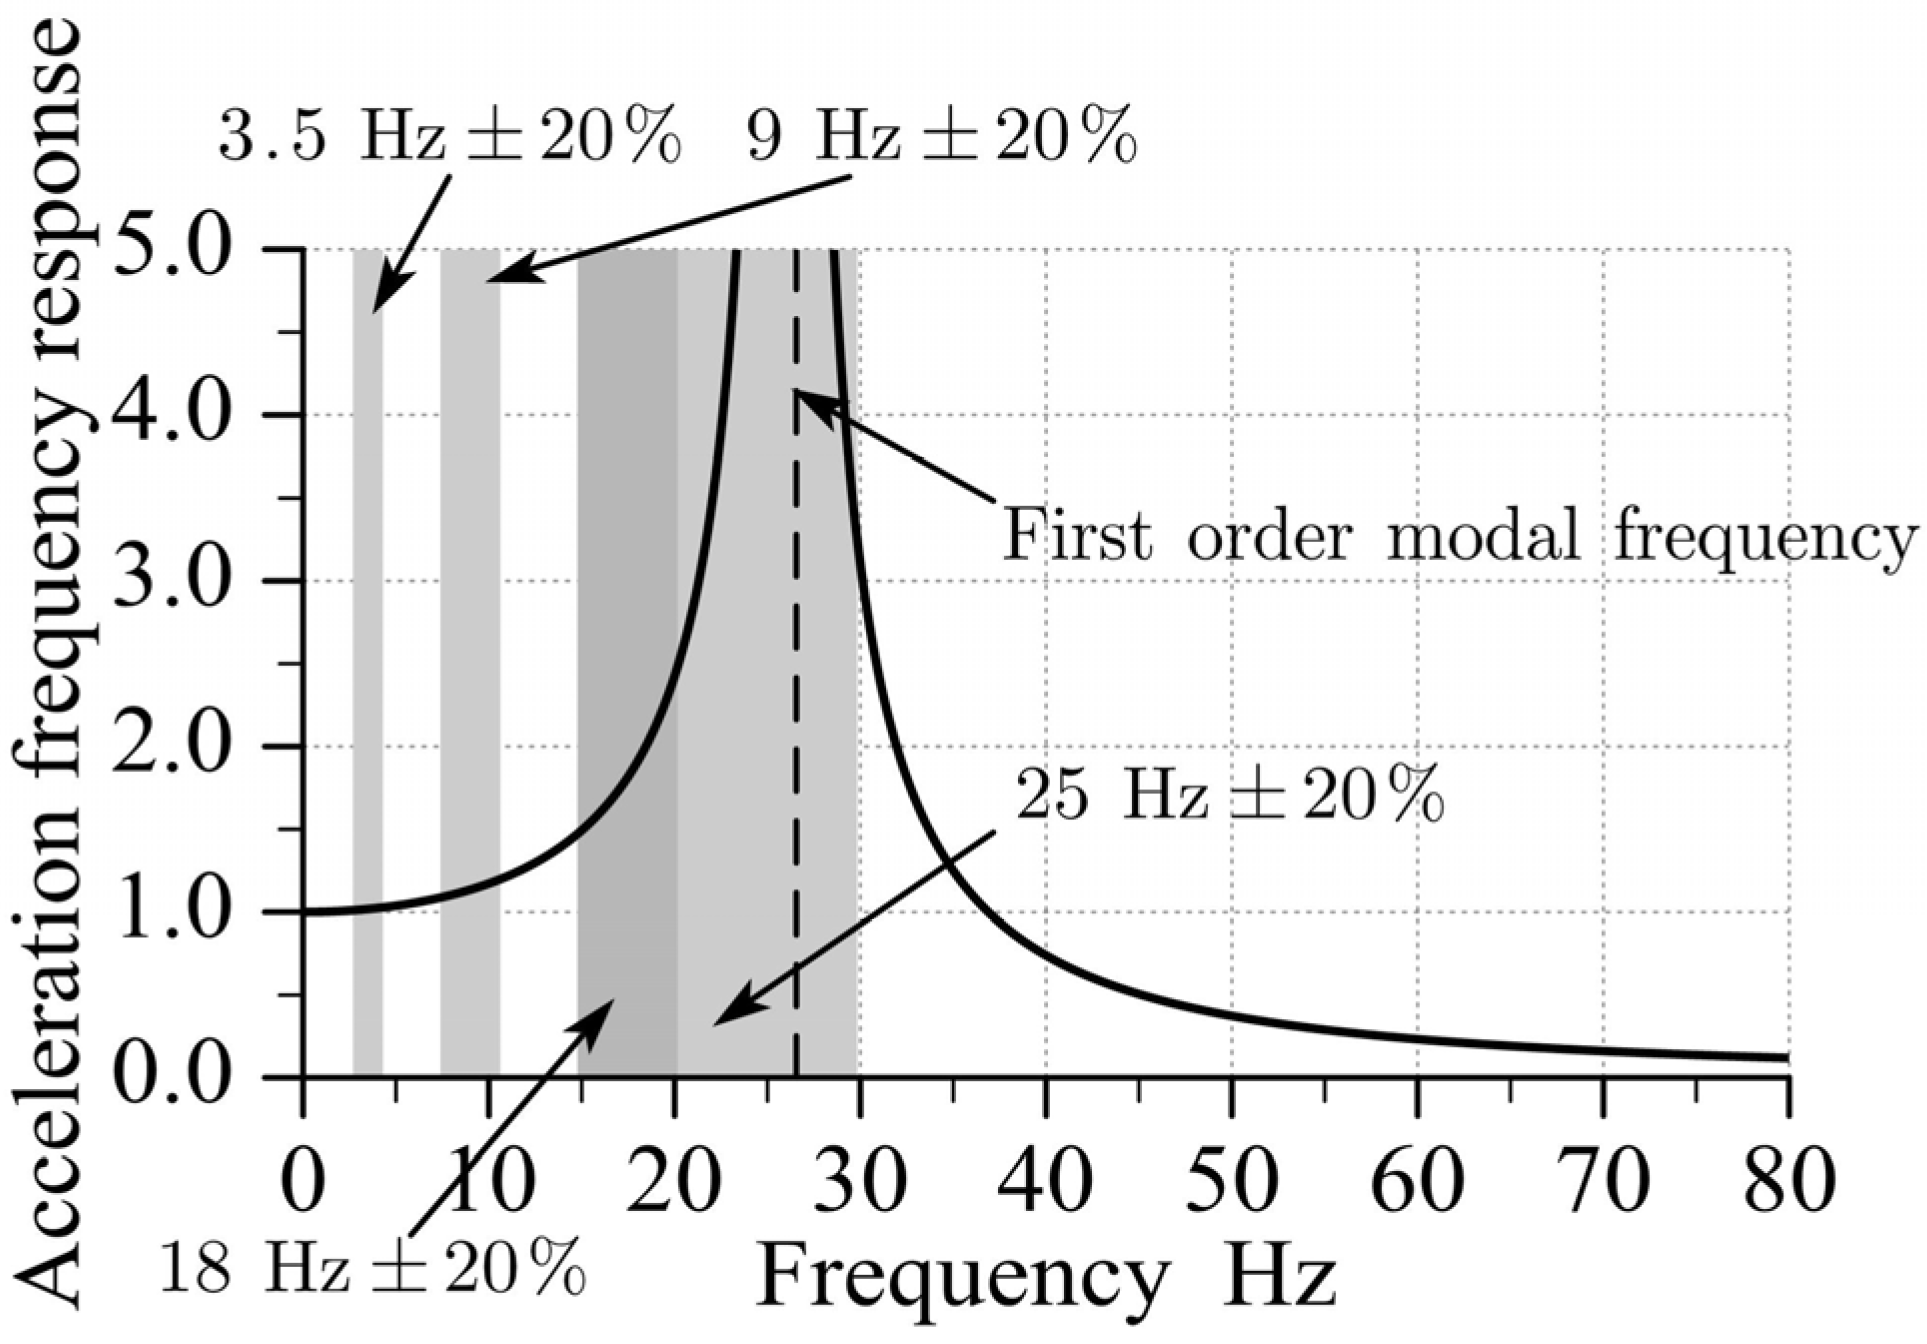
Theoretical acceleration frequency response of the dynamic model.
As shown in Figure 20, when the excitation frequency reached 26.554 Hz, the vibration amplitude reached its maximum value, identifying the system’s resonance frequency. The independently calculated modal frequency from Equation (35) was also 26.554 Hz, demonstrating full consistency and verifying the accuracy of the proposed dynamic model.
5.5. Comparison of Modal Frequencies and Computational Resources
As shown in Table 2, the connected cell simplified shell model exhibits a 2.76% increase in first order frequency relative to the full model, whereas the computation time is reduced by 83.24%. The proposed analytical dynamic model demonstrated a 4.95% frequency deviation but achieved a five-order reduction in computation time, with only a single processing thread required. This represents a substantial computational advantage for rapid optimization in the vibration attenuation design.
Table 2.
Modal frequencies and computational resources for different molded pulp models.
6. Validation of the Dynamic Model
To validate the accuracy of the dynamic model of molded pulp products established in Section 4, vibration experiments were designed following international standards. Both fixed frequency and frequency sweep vibration tests were conducted to compare the experimental data with model-based predictions. Through this comparison, the predictive precision of the model was quantitatively evaluated, providing experimental support for subsequent analyses of the dynamic behavior of the packaging system.
6.1. Experimental Setup for Vibration Testing of Molded Pulp Products
The vibration experiment was designed in strict accordance with the sine vibration load simulation requirements specified in ASTM D4169-22 [33], the international standard for the performance testing of shipping containers and systems. Considering the heavy duty industrial supporting applications of molded pulp products, the experimental parameters and procedures were determined as follows.
6.1.1. Test Object and Core Parameters
The test specimen was a type 499 heavy duty molded pulp support tray produced by Wuhan Penghuan Packaging Co., Ltd. (Wuhan, China). The tray was designed for heavy industrial components with a rated load capacity of ≥40 kg. The geometric dimensions of the specimen were 780 mm × 593 mm × 106 mm. According to a previous material study [32], the elastic modulus of molded pulp was Ex = 123.15 MPa, with Poisson’s ratios v = 0.1378 and v’ = 0.014, the out-of-plane elastic modulus was Ez = 1.259 MPa, and shear modulus was G = 3.43 MPa.
6.1.2. Vibration Test Conditions
To simulate realistic transportation loads, two vibration test conditions were designed.
The fixed frequency vibration test evaluates the predictive accuracy of the model at specific frequencies. The excitation frequencies were set at 3.5 Hz, 9 Hz, 18 Hz, and 25 Hz, with an acceleration amplitude of 0.5 g peak control, where g = 9.8 m/s2. Each frequency point was maintained for 5 min. Seven measurement points were selected: the center and four corners of the load’s top surface, the molded pulp base surface, and the upper surface of the molded pulp cell. Vertical acceleration signals were collected at all points using accelerometers.
The frequency sweep vibration test identifies the system’s resonance frequencies and verifies the model’s ability to predict the resonance behavior. Owing to the minimum operational frequency of the vibration table of 5 Hz, the sweep range was set from 5 Hz to 50 Hz, with an acceleration amplitude of 0.5 m/s2 peak control. The sweep rate was set at 0.7 oct/min according to the guidance of ASTM D4169-22 [33] and ASTM D999-08R23 [34]. Vertical acceleration signals were recorded for the identification of the resonance frequency.
6.1.3. Experimental Apparatus
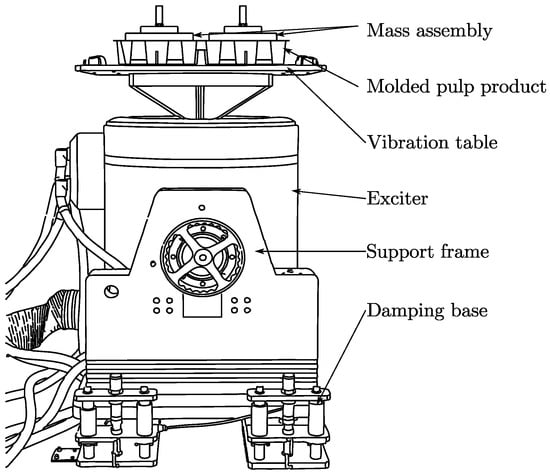
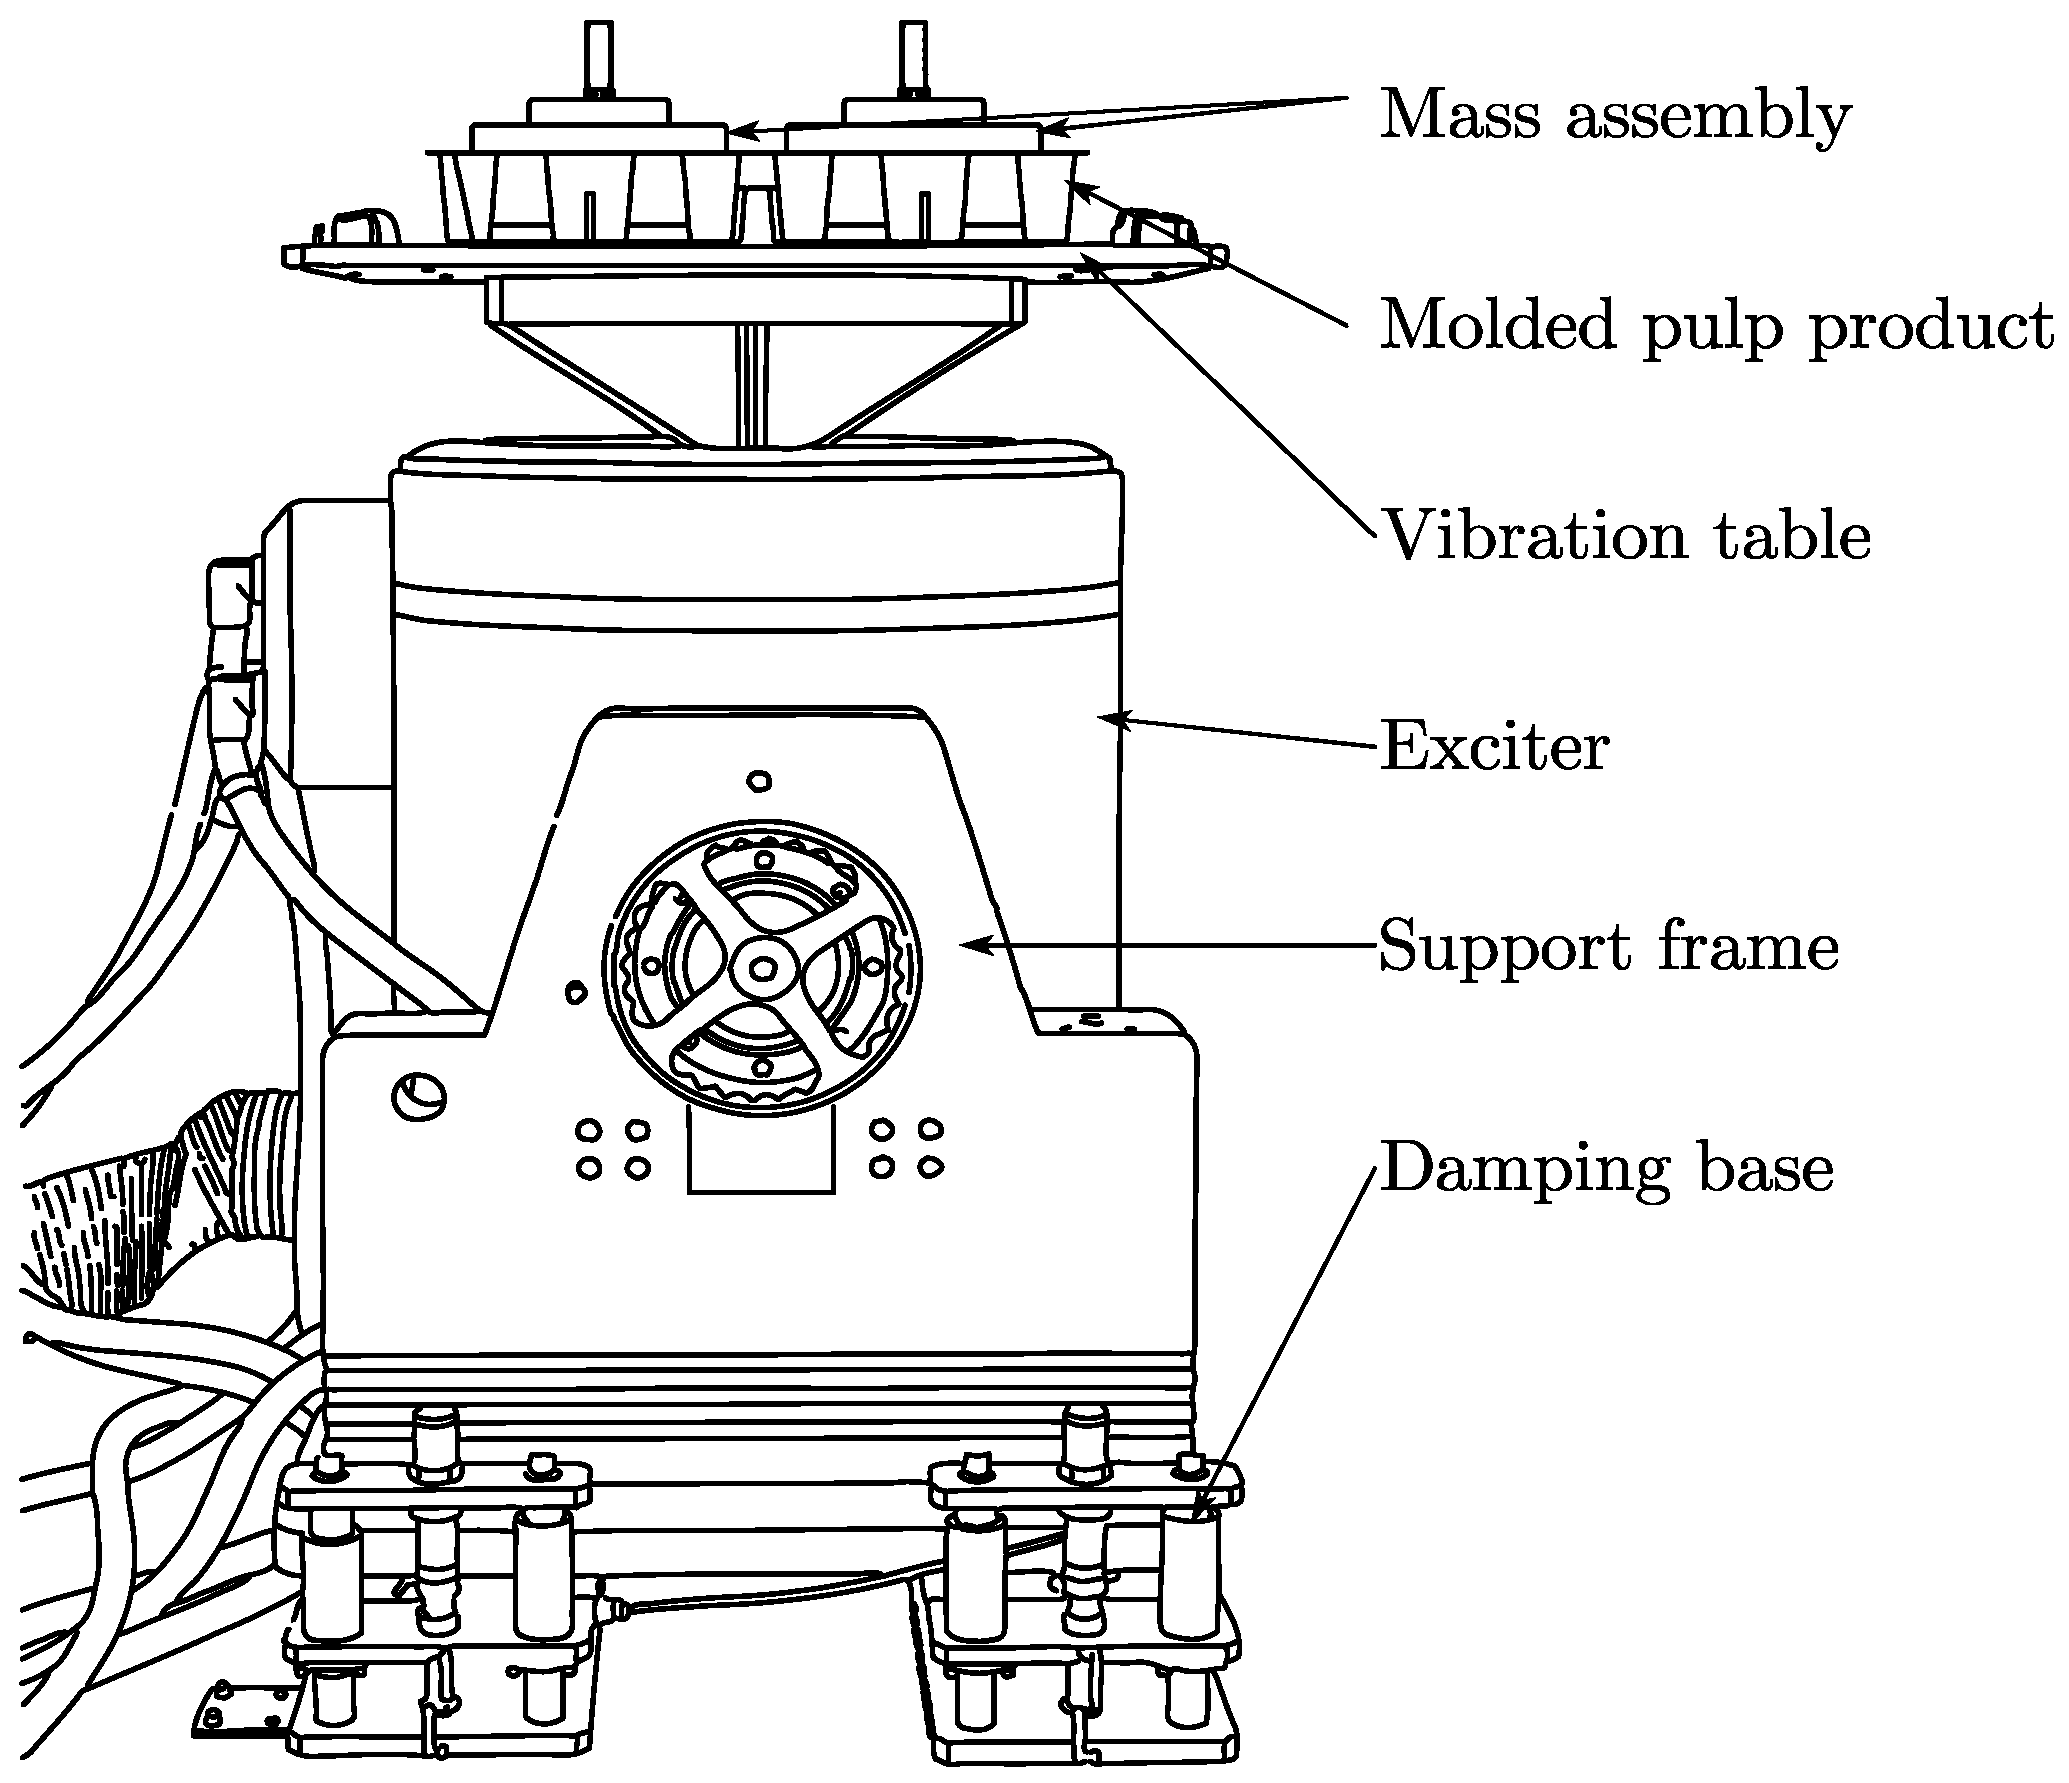
A schematic of the experimental apparatus is shown in Figure 21. The exciter was mounted on a damping base through a supporting frame, and the vibration table was rigidly connected above the exciter. The molded pulp product and mass block assembly were placed on top of the vibration table.
Figure 21.
Schematic of the experimental apparatus.
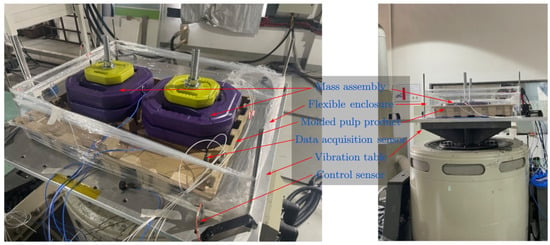
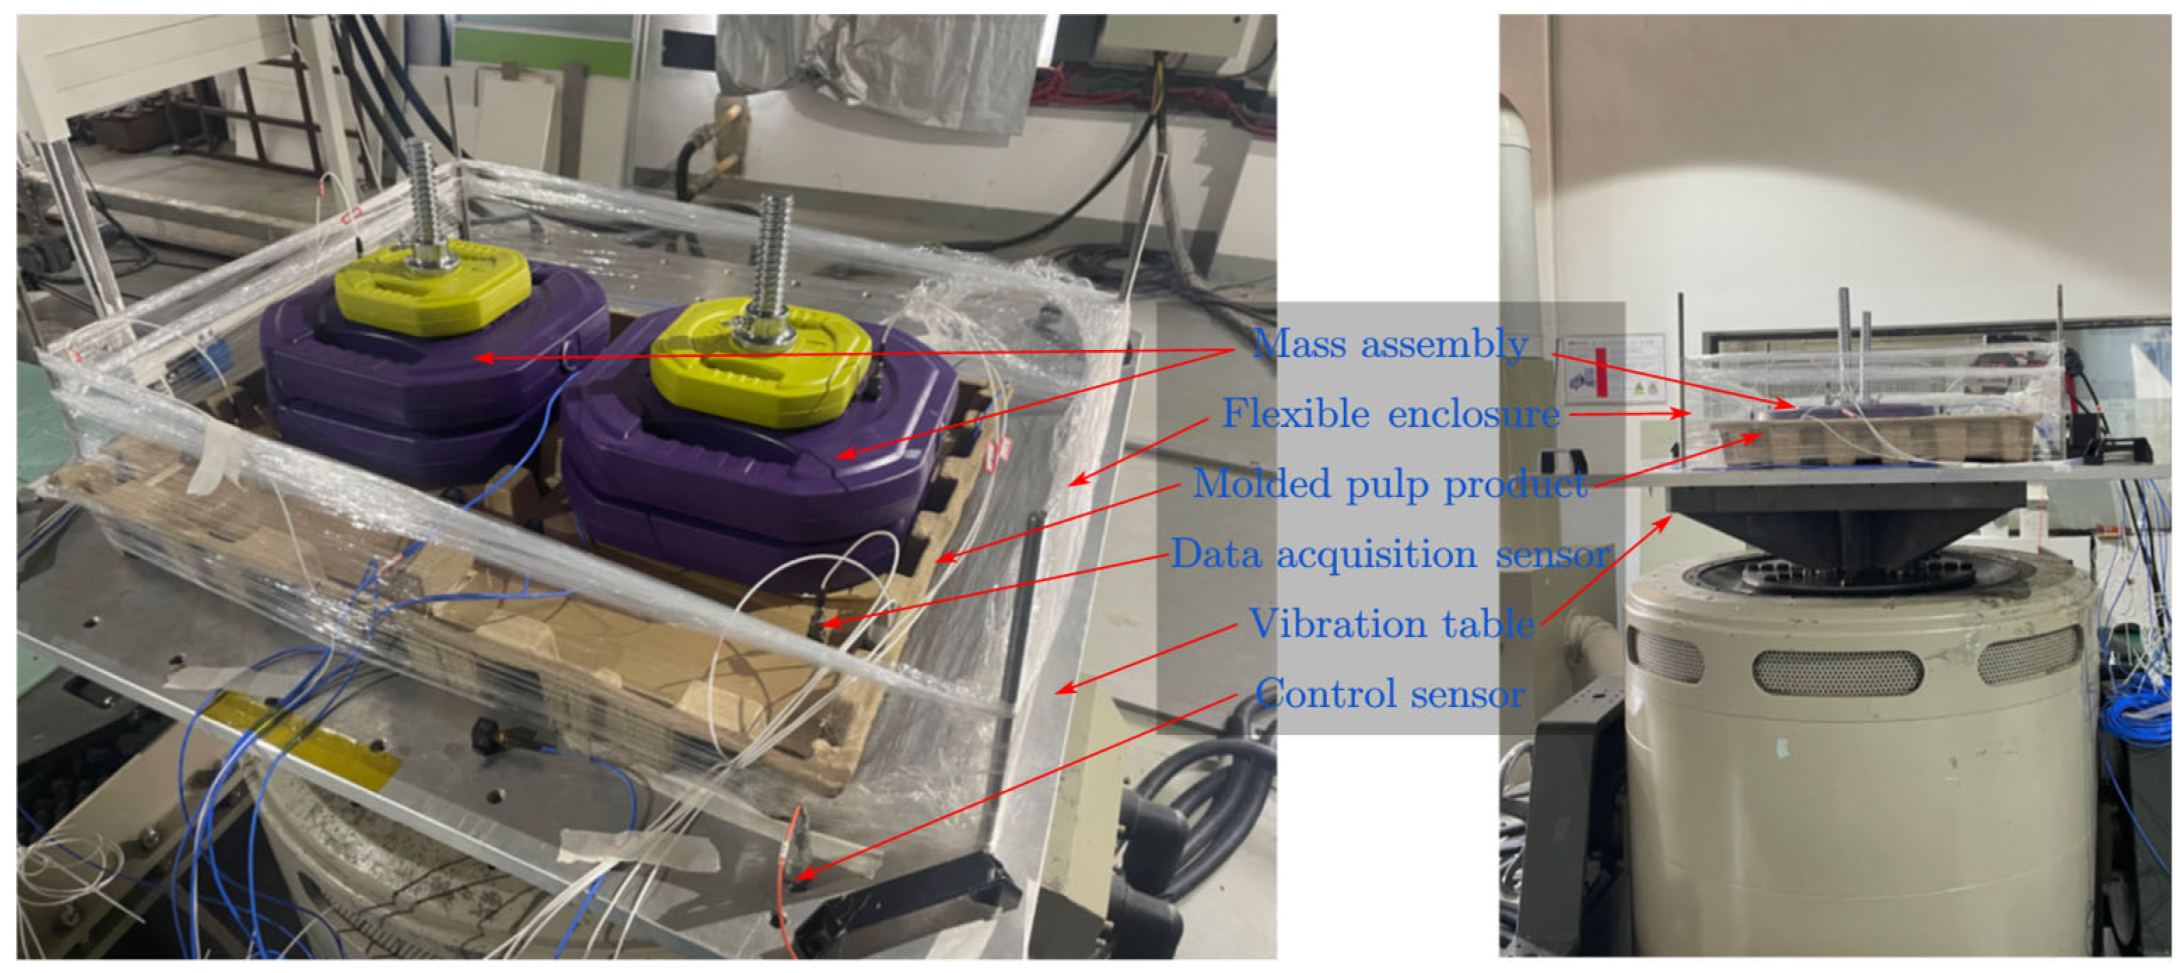
The experimental setup is shown in Figure 21. An acrylic mass block was fabricated to match the internal contours of the molded pulp product. Dumbbell weights were added to increase the mass, and the assembly was rigidly connected using metal rods to form the integrated structure shown in Figure 22.
Figure 22.
Setup of the vibration table experiment.
The core loading system consists of three components: a mass block, molded pulp tray, and vibration table. The technical specifications and working principles of the key devices are as follows.
The vibration excitation system used the JinDun Technology EM-4000F2K-50N250 electromagnetic vibration tester. This single-axis system operates in the vertical direction with a maximum rated load of 39.2 kN. The fixed frequency excitation range was 3–2000 Hz, and the sweep range was 5–2000 Hz, with a maximum acceleration of 1 g. This range covers the experimental frequency range of 3.5–50 Hz. The molded pulp specimen was placed directly on the surface of the vibration table and secured using soft enclosures to prevent lateral displacement.
Both the specimen and table excitation points were instrumented with PCB 352C33 and PCB 356A16 Integrated Circuit Piezoelectric accelerometers manufactured by PCB Piezotronics Inc. These sensors have a measurement range of 50 g and a frequency response of 0.1–10,000 Hz. The sensors were attached to the molded pulp and mass block using beeswax to minimize energy loss during vibration.
The acceleration signals were synchronously acquired using a LMS SCADAS Mobile 06S data acquisition system (LMS International, Leuven, Belgium). The system comprises a 40 channel acquisition front end, Ethernet communication module, and power supply. Data analysis was performed using the LMS Test.Lab 14A software with a sampling frequency range of 1–204.8 kHz. Data were exported in txt format for further analysis and processing purposes.
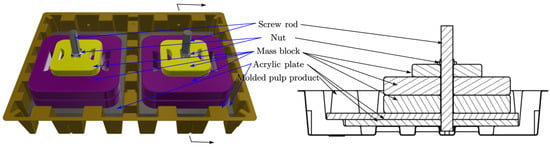
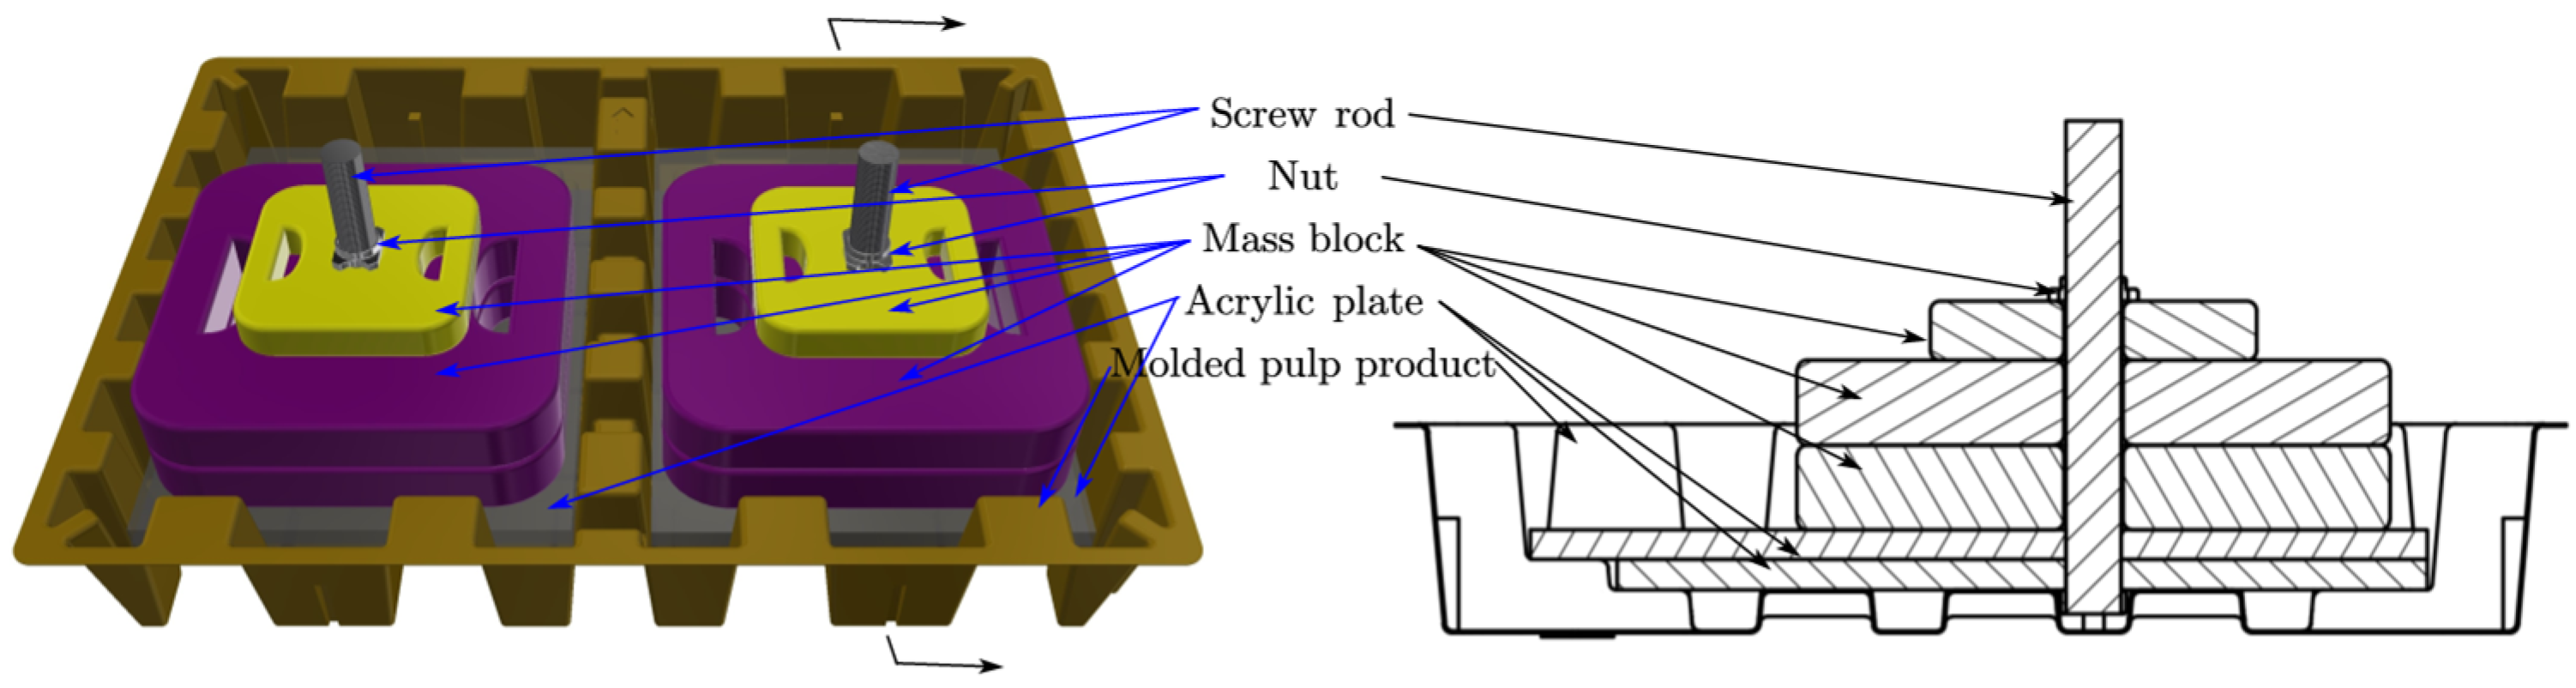
To match the inner support structure of molded pulp product, a dual-layer acrylic load plate (thickness = 10 mm, dimensions = 305 mm × 440 mm) was fabricated. The adjustable mass was achieved using 7.5 kg and 1.25 kg dumbbell plates, bringing the total mass to 20 kg. Two stainless steel rods (M24 × 290 mm, type 304) rigidly connected the load plates and weights, which were secured with M24 nuts to form an integrated load assembly, as shown in Figure 23.
Figure 23.
Assembly of the molded pulp structure and the applied load.
To ensure the reliability of the dynamic analysis, the collected acceleration data in the Oz direction were processed as follows: after mean removal and baseline correction to eliminate low frequency drift, the trapezoidal integration method was applied twice to reconstruct the velocity and displacement signals as follows:
To suppress high frequency noise amplification during integration and to obtain smooth displacement time histories, a 50 Hz low pass filter was applied to u(t) of the 1011 order Finite Impulse Response (FIR) method. The gain deviation at the edge frequency of 50 Hz was −0.4865 dB, indicating that the amplitude attenuation was approximately 5.5% and the energy attenuation was approximately 10.7%. This indicates that 50 Hz is within the effective passband and does not fall into the transition band, implying that this frequency component is essentially unaffected by the filter suppression. Fast Fourier Transform (FFT) was performed on a(t) to obtain the acceleration amplitude spectrum and analyze the energy distribution in the frequency-domain.
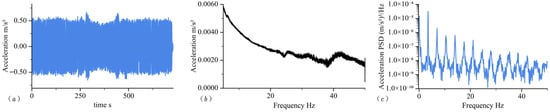
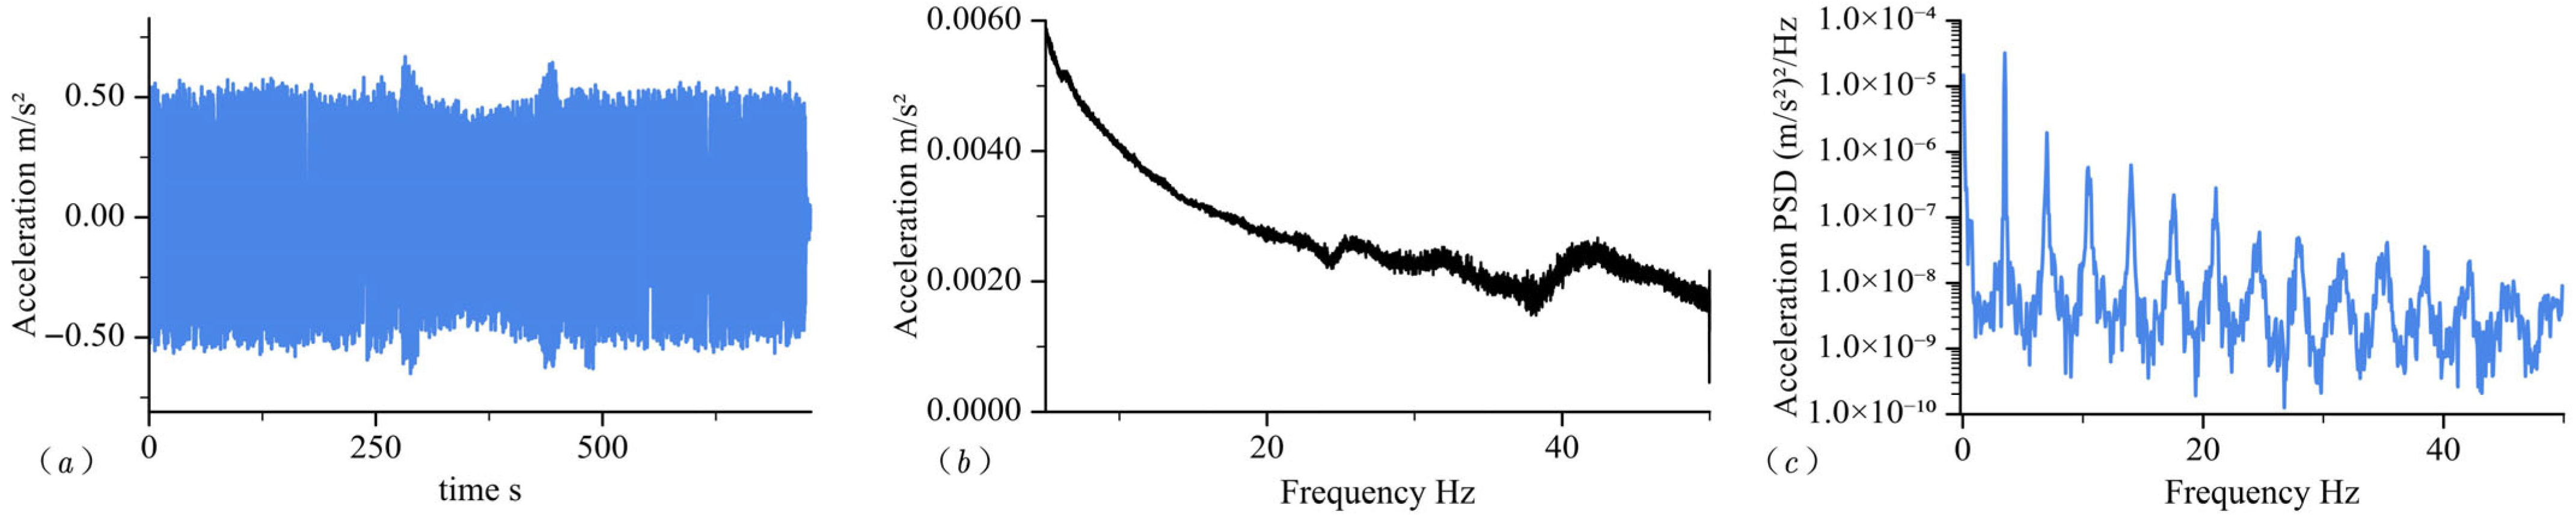
Figure 24a shows that the time-domain acceleration amplitude remained stable at approximately 0.5 m/s2 with less than 5% fluctuation; time-domain RMS is 0.002481. Figure 24b indicates that the excitation energy peaked at 5 Hz and decreased progressively with frequency, reaching 0.002 m/s2 at 50 Hz, which is consistent with the expected energy distribution pattern in the frequency sweep tests. Figure 24c shows that the acceleration PSD peak is 3.245 (m/s2)2/Hz at 3.5 Hz, and the frequency-domain RMS is 0.002419. The RMS value reconstructed from the acceleration PSD agreed well with the time-domain RMS, with a relative deviation of approximately 2.6%. This level of discrepancy is acceptable for Welch-based spectral estimation and confirms the accuracy of PSD normalization and implementation.
Figure 24.
Acceleration amplitudes under molded pulp excitation: (a) time-domain, (b) frequency-domain, and (c) acceleration PSD.
6.2. Experimental Results and Model Validation of Molded Pulp Product Vibration Tests
6.2.1. Frequency Sweep Test Results and Resonance Frequency Identification
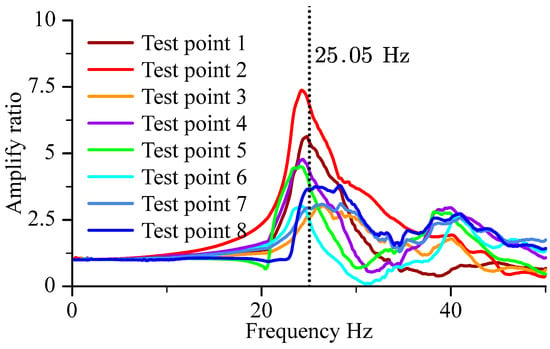
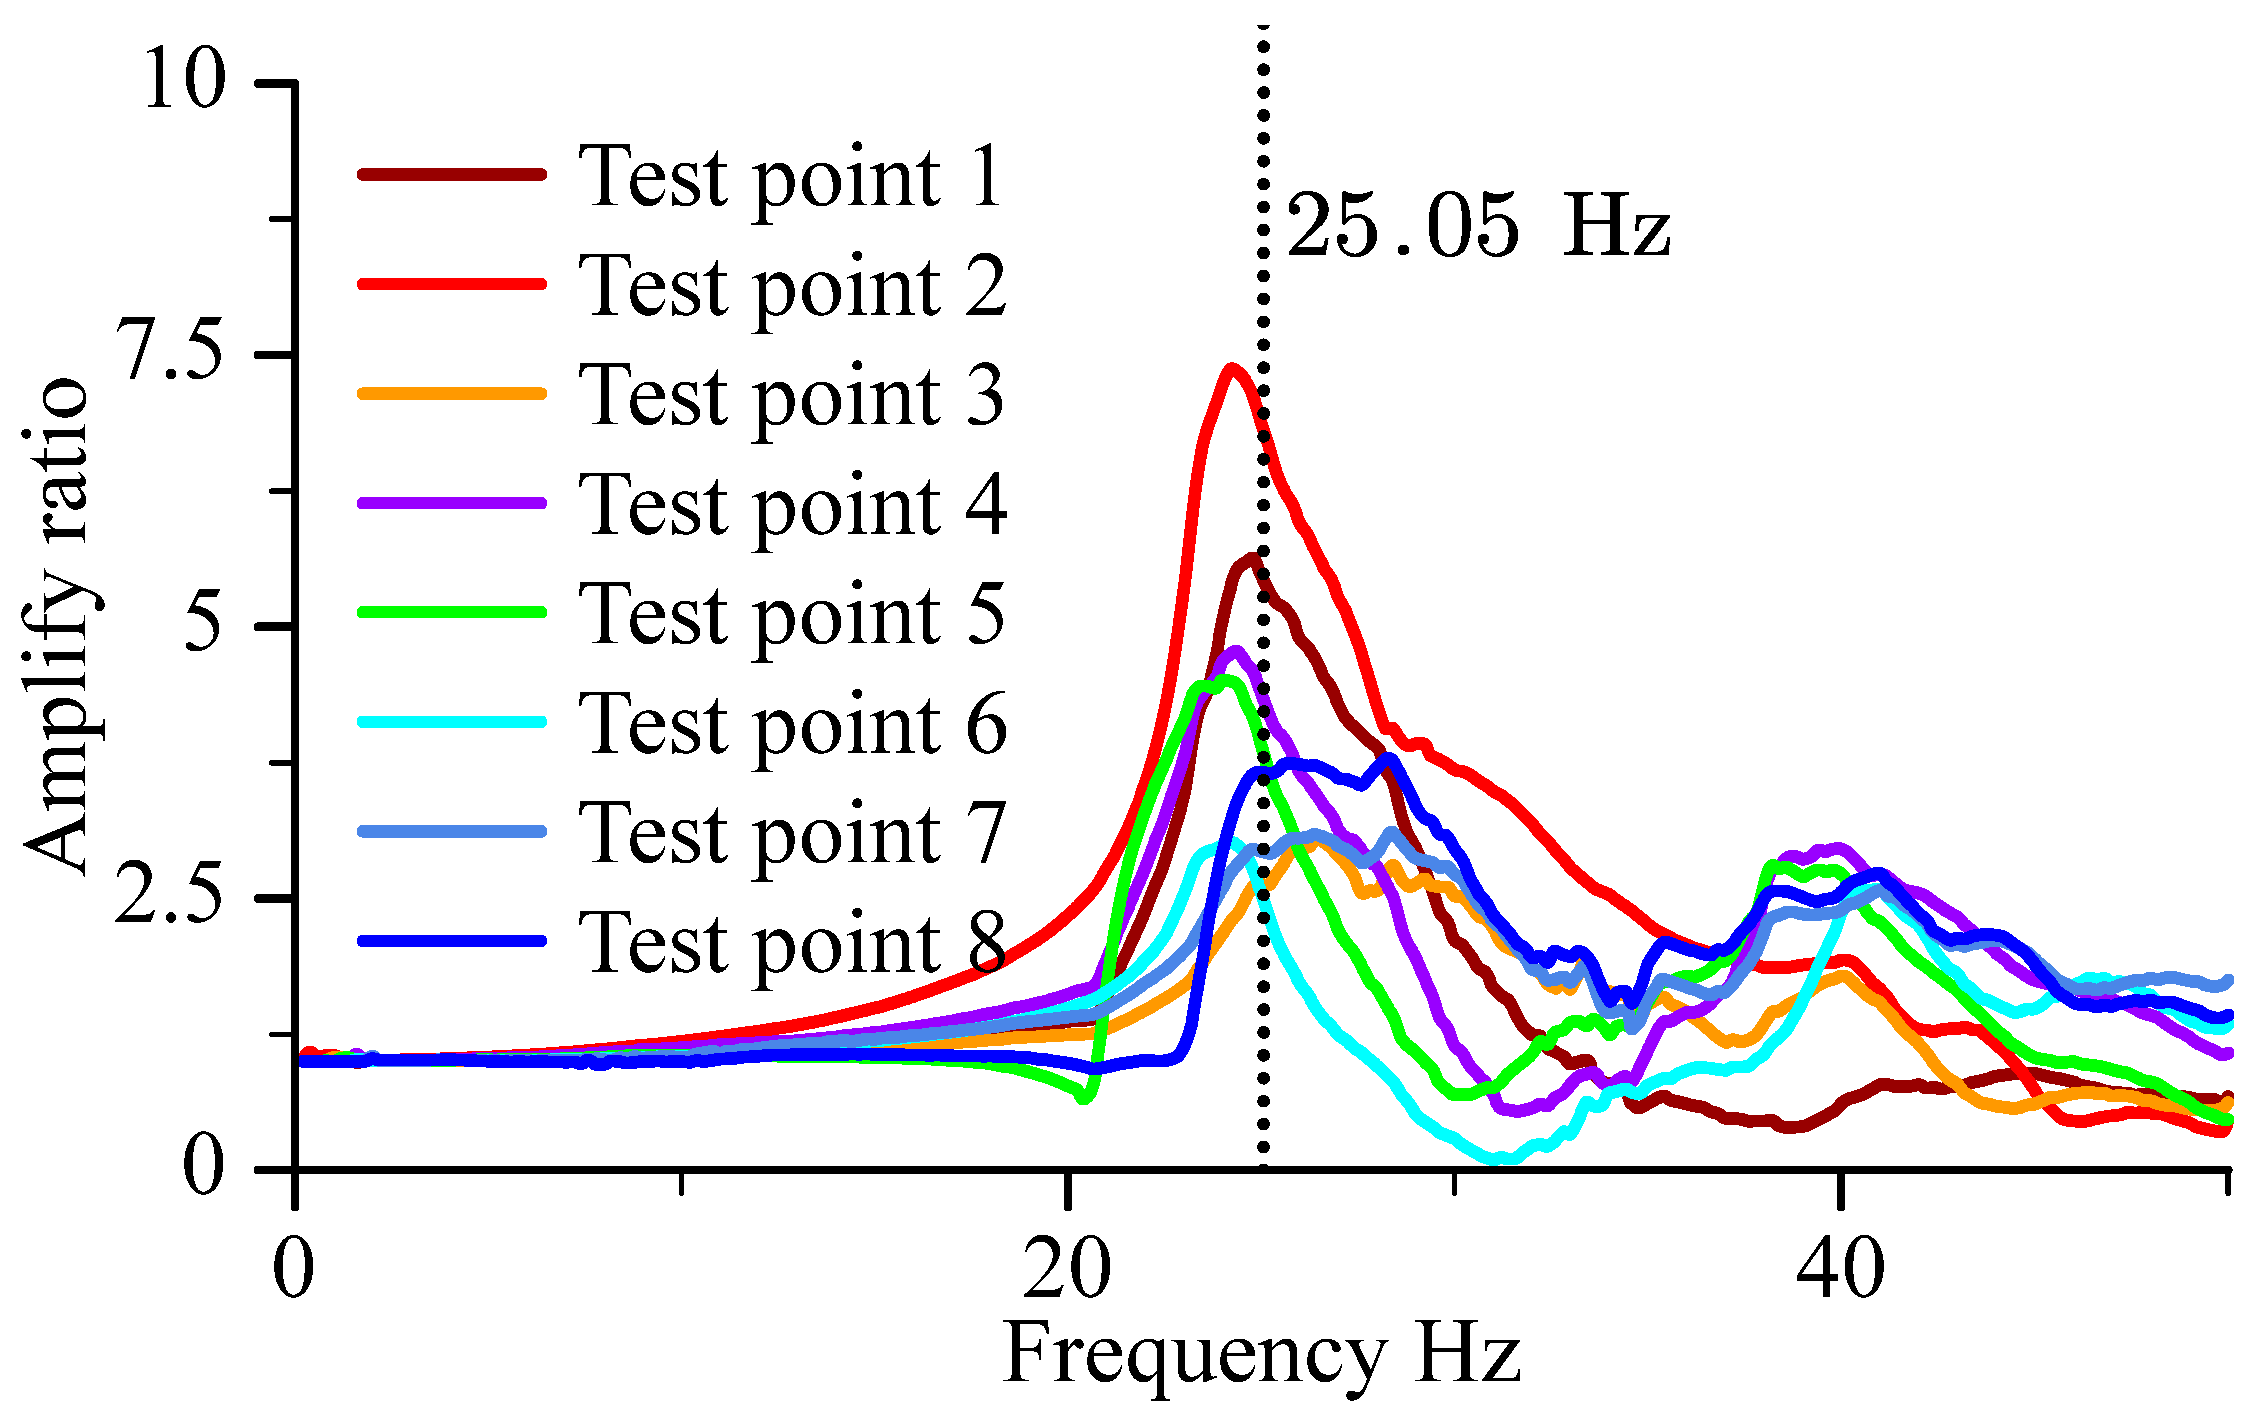
To verify the validity of the dynamic model established in Section 4.1 and the FE model developed in Section 4.3, frequency sweep experimental data were analyzed and compared with the model predictions. The acceleration frequency responses, defined as the ratio of the load response acceleration amplitude to the excitation acceleration amplitude, were calculated, and the resulting frequency response curve is shown in Figure 25.
Figure 25.
Load frequency response under frequency sweep excitation.
From the figure, it can be observed that the system exhibits a distinct frequency response peak at 25.05 Hz, indicating the first order frequency of the coupled molded pulp–mass block system. A secondary resonance was observed at 40 Hz.
To quantitatively evaluate the predictive accuracy of the models, the relative errors between the experimentally measured first order modal frequencies and those computed from the different models are listed in Table 3.
Table 3.
Comparison of experimental modal frequencies from molded pulp vibration tests and the calculated accuracy of different models.
All relative errors of the first order modal frequency were within 6%, confirming that both the FE models (Section 5.1, Section 5.2 and Section 5.3) and the dynamic model (Section 5.4) accurately predicted the resonance characteristics and frequency response of the system. The first order frequency of the experiment considered within typical experimental error closely matched the frequency predicted by the FE model described in Section 4, demonstrating a strong consistency between the experimental and numerical results. However, all the computed second order frequencies were significantly higher than 40 Hz, making it impossible for the FE model to adequately explain the predicted overall second order modal frequencies of 55.164 Hz, 80.705 Hz, and 76.354 Hz. The FE model-predicted frequencies may refer to the overall structural modal frequencies of different orders. The experimental result may not be the second order modal frequency because some test point sensors were unattached during testing.
6.2.2. Error Source Analysis and Model Improvement Directions
The minor discrepancies between the experimental and model predicted results primarily arise from the following factors, which provide guidance for subsequent model optimization:
- Neglect of material damping: The dynamic and FE models established in Section 5.1 and Section 5.3 did not incorporate the material damping effects. The modal frequency of a proportionally damped system is . As the damping increases, the modal frequency of the damped system decreases monotonically, and the results for the damped system are closer to the experimental results. Introducing an appropriate damping ratio in future modeling will enhance the accuracy of resonance frequency prediction.
- Centroid offset of simulated load: In the experiment, a composite load was assembled using acrylic plates, dumbbell weights, and steel rods. Owing to differences in material density and slight asymmetry in positioning, the centroid of the load deviated from the idealized centroid assumed in the theoretical model. This induced a minor eccentric load, resulting in small deviations between the experimental acceleration responses and those predicted under the assumption of symmetric loading.
- Because molded pulp materials absorb adhesives and increase local strength, traditional adhesives cannot be used for bonding accelerating sensors. Using beeswax for bonding the sensors resulted in the accelerometer sensor detaching during testing, rendering the data point unusable and ultimately limiting the amount of test data obtained. Typical experimental errors should be considered.
6.2.3. Model Validation Conclusions
Based on the vibration test results and error analysis, the following conclusions were drawn:
The dynamic model (Section 5.4) and FE model (Section 5.1, Section 5.2 and Section 5.3) predict the resonance first order modal frequency of the molded pulp–mass block-coupled system with an error not exceeding 6.0%, satisfying both engineering and theoretical accuracy requirements.
The models effectively captured the dynamic characteristics of the coupled system and can serve as reliable theoretical tools for vibration attenuation design and optimization of molded pulp packaging systems.
The experimentally identified discrepancies, mainly due to ignoring material damping, centroid offset, and sensor installation, provide a clear direction for model refinement. Incorporating damping parameters and correcting for load centroid deviations are expected to further reduce the prediction errors and enhance the model’s applicability under complex operating conditions.
7. Discussion
This study provides a mechanistic understanding of how molded pulp structural cells govern the dynamic behavior of packaging systems subjected to road transport excitation. By integrating a stiffness formulation derived from shell element theory with a system-level vibration model, this study advances beyond prior studies that predominantly focused on empirical impact tests or static cushioning behavior [22,23]. The findings clarify the quantitative relationship between the geometric parameters of molded pulp structural cells and the first order modal frequency of the packaging–product assembly, thereby addressing the lack of theoretical guidance previously highlighted in the field [20].
A key contribution of this study is the demonstration that the aspect ratio, base area, thickness, and height of the molded pulp structural cell exert strong and predictable influences on the system stiffness and the first order modal frequency, whereas the draft angle plays a negligible role. This resolves the long standing inconsistencies regarding the role of cell geometry reported in earlier studies on energy absorption performance [24,26]. The results further indicate that elevating the first order modal frequency effectively reduces the likelihood of resonance with dominant truck transport excitation peaks, particularly within the 3–20 Hz range commonly observed in road environments [28]. This establishes a direct design pathway for improving the vibration attenuation performance through geometric optimization rather than relying solely on material modification.
The proposed analytical dynamic model also exhibits a substantial improvement in computational efficiency compared with the full and simplified FE models, achieving a comparable first order modal frequency accuracy with five orders of magnitude lower computational cost when ignoring damping. This efficiency is crucial for iterative structural optimization, whereas the traditional FE model of molded pulp consumes more time [25]. The model predicted the first modal frequency accuracy, which was supported by vibration tests conducted under standardized conditions, with experimental–numerical frequency deviations within 6%. The observed discrepancies were primarily attributable to the material damping, centroid offsets, and test sensor detach method. Factors explicitly identified in this study offer clear directions for future refinement.
By adjusting the coordinate definition of the structural cell in Section 4, the structural modal frequencies of the circular Figure 1b can be roughly predicted. By increasing the stiffness matrix size through a stacked model and adjusting the coordinate definition of the structural cell in Section 4, the stepped structure shape modal frequencies shown in Figure 1c can be predicted. This demonstrates the potential of the model for other applications.
Considering details such as model damping, the asynchronous displacement between nodes of structural element cells, and the coupling relationship of displacement matrices of multiple structural cells, further improvement in the model’s prediction accuracy of the first modal frequency is required. Full-scale road transportation tests remain a future research topic for improving test accuracy.
The contribution of the in-plane elastic and shell bending to the normal stiffness can be studied in the future. This method may find physical and numerical connections on the equivalent normal stiffness of the molded pulp structural cell.
Overall, this study establishes a unified, analytically tractable modeling framework that links material properties, structural cell geometry, and system-level first modal frequency. Its scientific value lies in enabling the performance-driven design of molded pulp packaging for heavy duty and large format applications, a domain where empirical practices have historically dominated. Considering generalizability and experimental validation, this study demonstrates both theoretical rigor and practical relevance. This provides a foundational basis for subsequent research on damping modeling, multi-structure cell coupling effects, full-scale transport simulations, and structure optimization.
Author Contributions
Conceptualization, methodology, software, validation, formal analysis, investigation, data curation, writing—original draft preparation, visualization, Z.L.; resources, supervision, K.M.; writing—review and editing, Z.L. and K.M. All authors have read and agreed to the published version of the manuscript.
Funding
This research received no external funding.
Institutional Review Board Statement
Not applicable.
Informed Consent Statement
Not applicable.
Data Availability Statement
The data supporting the reported results in this study, are not publicly available due to proprietary information. However, the data may be made available from the corresponding author upon reasonable request.
Acknowledgments
The authors would like to thank Junjie Tang for his help of experiment in this paper. The authors are grateful to Luyao Xiong, Shengquan Li, and Ping Wang for the financial support of this work. The authors thank to Wuhan Penghuan Packaging Co., Ltd. for the materials provided for experiment.
Conflicts of Interest
The authors declare no conflicts of interest.
References
- Ogunmakinde, O.E. A Review of Circular Economy Development Models in China, Germany and Japan. Recycling 2019, 4, 27. [Google Scholar] [CrossRef] [Scilit]
- Union, E. Sustainable Waste Management in a Circular Economy. In A Policy Brief from the Policy Learning Platform on Environment and Resource Efficiency; European Union: Brussels, Belgium, 2020. [Google Scholar]
- Zhang, Z.; Hao, F.; Hu, D.; Liu, W.; Chen, X. Natural Plant Fiber-Based Materials for Packaging Applications—A Review of Recent Innovations and Developments. Adv. Mater. Technol. 2025, 10, 2401020. [Google Scholar] [CrossRef] [Scilit]
- Chen, X.; Jiang, H.; Wang, G.; Wang, J.; Chen, F. Disposable Bamboo Fiber Meal Boxes Characterized by Efficient Preparation, Excellent Performance, and the Potential for Beneficial Degradation. J. Clean. Prod. 2024, 434, 139973. [Google Scholar] [CrossRef] [Scilit]
- Dwibedi, V.; Kaur, G.; George, N.; Rana, P.; Ge, Y.; Sun, T. Research Progress in the Preservation and Packaging of Fruits and Vegetables: From Traditional Methods to Innovative Technologies. Food Packag. Shelf Life 2024, 46, 101385. [Google Scholar] [CrossRef] [Scilit]
- Shi, F.; Wang, C.; Tang, J.; Huang, J.; Pan, H.; Zhang, M.; Zeng, B.; Wang, J. All-Biomass-Based Molded Pulp Products with Excellent Mechanical Strength and Water Stability for Plastic Packaging Substitute. Ind. Crops Prod. 2024, 214, 118574. [Google Scholar] [CrossRef] [Scilit]
- Arshad, M.T.; Hassan, S.; Shehzadi, R.; Sani, M.A.; Ikram, A.; Maqsood, S.; Ahmad, A.; Hussain, M.F.; Abdullah, Z.; Gnedeka, K.T. Emerging trends in sustainable packaging of food products: An updated review. J. Nat. Fibers 2025, 22, 2505608. [Google Scholar] [CrossRef] [Scilit]
- Danielewicz, D. Manufacturing of Form-Molded Pulp Products (FMPPs) in the Papermaking Industry—A Review. BioResources 2025, 20, 5114–5156. [Google Scholar] [CrossRef] [Scilit]
- Kossalbayev, B.D.; Belkozhayev, A.M.; Abaildayev, A.; Kadirshe, D.K.; Tastambek, K.T.; Kurmanbek, A.; Toleutay, G. Biodegradable Packaging from Agricultural Wastes: A Comprehensive Review of Processing Techniques, Material Properties, and Future Prospects. Polymers 2025, 17, 2224. [Google Scholar] [CrossRef] [Scilit]
- Sarder, R.; Debnath, M.; Sutton, C.; Kardam, S.K.; Mani, K.A.; Lucia, L.; Pal, L. Development of Molded Fibers-Based Packaging from Sugarcane Bagasse for Sustainable Alternatives to Single-Use Plastics. BioResources 2025, 20, 7147–7161. [Google Scholar] [CrossRef] [Scilit]
- Zaini, L.H.; Surisetty, J.; Lammer, H.; Veigel, S.; Gindl-Altmutter, W. The Suitability of Fibers from the Inner Part of Oil Palm Trunks for Molded Pulp Packaging Materials. Ind. Crops Prod. 2025, 234, 121506. [Google Scholar] [CrossRef] [Scilit]
- Molded Pulp Packaging Market Size & Share Report. 2025. Available online: https://www.grandviewresearch.com/industry-analysis/molded-pulp-packaging-market (accessed on 14 November 2025).
- Niini, A.; Tanninen, P.; Varis, J.; Leminen, V. Effects of Press-Forming Parameters on the Dimensional Stability of Paperboard Trays. BioResources 2021, 16, 4876–4890. [Google Scholar] [CrossRef] [Scilit]
- Niini, A.; Tanninen, P.; Laukala, T.; Varis, J.; Leminen, V. A Folding Method to Increase the Rigidity of Paperboard Tray Packages. BioResources 2022, 17, 1427–1441. [Google Scholar] [CrossRef] [Scilit]
- Singh, S.P.; Xu, M. Bruising in Apples as a Function of Truck Vibration and Packaging. Appl. Eng. Agric. 1993, 9, 455–460. [Google Scholar] [CrossRef] [Scilit]
- Seydim, A.C.; Dawson, P.L. Packaging Effects on Shell Egg Breakage Rates During Simulated Transportation. Poult. Sci. 1999, 78, 148–151. [Google Scholar] [CrossRef] [Scilit]
- Jarupan, L.; Hunsa-Udom, R.; Bumbudsanpharoke, N. Potential Use of Oil Palm Fronds for Papermaking and Application as Molded Pulp Trays for Fresh Product under Simulated Cold Chain Logistics. J. Nat. Fibers 2022, 19, 2772–2784. [Google Scholar] [CrossRef] [Scilit]
- Choi, S.R.; Jung, H.; Choi, D.S. The Development of Pulp Mold Tray for Melon Packaging. Korean J. Packag. Sci. Technol. 2013, 19, 125–131. [Google Scholar]
- Singh, A.K.; Itkor, P.; Lee, M.; Shin, J.; Lee, Y.S. Promoting Sustainable Packaging Applications in the Circular Economy by Exploring and Advancing Molded Pulp Materials for Food Products: A Review. Crit. Rev. Food Sci. Nutr. 2022, 63, 11010–11025. [Google Scholar] [CrossRef] [Scilit]
- Humbert, C.; Jadeau-Guichard, H.; Nicolay, P. Moulded-Pulp Packaging: A Straightforward Method for Quickly Designing, Manufacturing and Testing Complex Shapes for Crash Protection Pads. Appl. Sci. 2024, 14, 11516. [Google Scholar] [CrossRef] [Scilit]
- Fei, W. Test and Simulation Analysis of Pulp Molding Properties of Different Materials. Master’s Thesis, Hunan University of Technology, Zhuzhou, China, 2017. [Google Scholar]
- Eagleton, D.G.; Marcondes, J.A. Cushioning Properties of Moulded Pulp. Packag. Technol. Sci. 1994, 7, 65–72. [Google Scholar] [CrossRef] [Scilit]
- Hoffmann, J. Compression and Cushioning Characteristics of Moulded Pulp Packaging. Packag. Technol. Sci. 2000, 13, 211–220. [Google Scholar] [CrossRef] [Scilit]
- Wang, Z.; Cai, Y.; Jing, Y. Molded Pulp Material Structure Parameters on the Performance of the Buffer. Energy Procedia 2012, 17, 1872–1877. [Google Scholar] [CrossRef] [Scilit]
- Gurav, S.P.; Bereznitski, A.; Heidweiller, A.; Kandachar, P.V. Mechanical Properties of Paper-Pulp Packaging. Compos. Sci. Technol. 2003, 63, 1325–1334. [Google Scholar] [CrossRef] [Scilit]
- Ma, X.; Soh, A.K.; Wang, B. A Design Database for Moulded Pulp Packaging Structure. Packag. Technol. Sci. 2004, 17, 193–204. [Google Scholar] [CrossRef] [Scilit]
- Hinsch, R.T.; Slaughter, D.C.; Craig, W.L.; Thompson, J.F. Vibration of Fresh Fruits and Vegetables during Refrigerated Truck Transport. Trans. ASAE 1993, 36, 1039–1042. [Google Scholar] [CrossRef] [Scilit]
- Zhou, R.; Yan, L.; Li, B.; Xie, J. Measurement of Truck Transport Vibration Levels in China as a Function of Road Conditions, Truck Speed and Load Level. Packag. Technol. Sci. 2015, 28, 949–957. [Google Scholar] [CrossRef] [Scilit]
- Park, J.; Choi, S.; Jung, H.M. Measurement and Analysis of Vibration Levels for Truck Transport Environment in Korea. Appl. Sci. 2020, 10, 6754. [Google Scholar] [CrossRef] [Scilit]
- Zhang, Y.; Chao, D.; Bokka, S.K.; He, Z.; Ni, Y. Molded Fiber and Pulp Products as Green and Sustainable Alternatives to Plastics: A Mini Review. J. Bioresour. Bioprod. 2022, 7, 14–25. [Google Scholar] [CrossRef] [Scilit]
- Bwade, E.K.; Aliyu, B.; Tashiwa, Y.I. Vibration Intensity and Its Variation on Road-Transported Agricultural Materials—A Review. Agric. Eng. Int. CIGR J. 2024, 26, 225–237. [Google Scholar]
- Li, Z.; Tang, J.; Mao, K.; Zhu, Z. Constitutive Model and Experimental Study of Molded Pulp Material. J. Eng. Fibers Fabr. 2023, 18, 1–15. [Google Scholar] [CrossRef] [Scilit]
- ASTM D4169-22; Standard Practice for Performance Testing of Shipping Containers and Systems. D10 Committee ASTM International: West Conshohocken, PA, USA, 2022. [CrossRef] [Scilit]
- ASTM D999-08R23; Test Methods for Vibration Testing of Shipping Containers. D10 Committee ASTM International: West Conshohocken, PA, USA, 2023. [CrossRef] [Scilit]





Disclaimer/Publisher’s Note: The statements, opinions and data contained in all publications are solely those of the individual author(s) and contributor(s) and not of MDPI and/or the editor(s). MDPI and/or the editor(s) disclaim responsibility for any injury to people or property resulting from any ideas, methods, instructions or products referred to in the content. |
© 2026 by the authors. Licensee MDPI, Basel, Switzerland. This article is an open access article distributed under the terms and conditions of the Creative Commons Attribution (CC BY) license.