


Abstract
This study experimentally investigated the long-term deformation behavior of a ballasted railway turnout affected by adjacent deep excavation through an integrated multi-sensor field-monitoring approach. The monitored facility consisted of two 60 kg, #10 single turnouts located approximately 13 m from an excavation with a maximum depth of approximately 21 m. Field monitoring was conducted for approximately 640 days, from the pre-excavation stage to the completion of the underground structure. Three complementary measurement methods were employed: a track master system for track geometry, tilt-angle-based rail displacement sensors for local rail displacement, and an automatic leveling system for absolute sleeper displacement. The relative measurement methods primarily identified local rail geometry variations within approximately ±1–2 mm, whereas the absolute sleeper measurements revealed substantially larger support system movements. In particular, a maximum sleeper settlement of approximately −9.1 mm and a maximum heave of approximately +4.9 mm were observed at different locations of the T2 turnout, producing a longitudinal differential displacement of approximately 14 mm within the turnout system. The results indicate that excavation-induced turnout deformation consists of both global support system movement and local differential rail deformation, which cannot be completely characterized using a single measurement reference framework. The principal contribution of this study is the experimental clarification of the complementary roles of relative and absolute displacement measurements in distinguishing local track geometry changes from global sleeper support movement. The proposed integrated monitoring framework provides a practical basis for identifying critical deformation zones and improving the structural assessment and maintenance of turnouts affected by adjacent excavation.
1. Introduction
A turnout is a track structure required to change the direction of a train by shifting its track. The process involves rails and other track structures along with their track components [1]. The travel direction of a train is changed by moving the rails of the point part through the mechanical operation of a point machine [1]. It is a delicate operation, because even small deformations of the tongue rail operated by the point machine and of the related mechanical equipment can affect the safe operation of the train [1]. When excavation construction is performed near a turnout, the uplift and subsidence of the ground may directly cause deformation of the turnout track structure, leading to human casualties and economic losses due to the derailment of a traveling train [1]. Therefore, turnouts with complex structures require effective measurement techniques and three-dimensional (3D) analysis methods to identify the displacement behavior of the entire system.
Several studies have examined the turnout track irregularity caused by excavations adjacent to urban railways. Kim examined the track deformation characteristics above the ground due to an adjacent construction excavation and found that vertical deformation was dominant above the ground [1]. They also found that the most important variable of the turnout displacement behavior varied depending on the excavation location. They additionally reported that the track of the turnout above the ground can also be affected by adjacent excavation [1].
Choi et al. derived the effects of the construction process on the track irregularity for each stage of construction excavation based on the numerical analysis of excavation work adjacent to an urban railway [2]. Siahkouh et al published a review paper that comprehensively summarizes the latest monitoring technologies for the transition zone of ballasted tracks, where settlement and stiffness changes occur. It compares the advantages and disadvantages of the latest technologies, including fiber optic sensors, image-based measurement, and IoT-based real-time monitoring [3].
Park conducted a numerical analysis of the track irregularity of in-service ballasted tracks and found that the locations of maximum displacement in the vertical and lateral directions with respect to the excavation area can be different [4]. In the field measurement results, the maximum values of the longitudinal-level irregularity and alignment irregularity occurred at the center of the construction excavation site, whereas lateral displacements, such as cross-level irregularity and gauge irregularity, occurred at the start and end points of the site [4]. Therefore, the installation locations for measuring instruments should preferably include the start and end points of the excavation area and consider the locations of in-service tracks during adjacent construction excavation [4].
Kim analyzed the track irregularity at each measurement location of the target and detected significant gauge and cross-level irregularities at turnout hills and joints [5]. They also found that significant longitudinal-level and alignment irregularities occurred at the nose of the turnout crossing [5]. Jeon and Lee recommended conducting a 3D numerical analysis and real-time monitoring, as followed in this study, to prevent accidents caused by track irregularity (e.g., derailment) when deep construction excavation is performed near urban railway structures [6].
Lee compared numerical analysis results with tunnel convergence and track deformation (ballast settlement) measurements to evaluate an automatic measurement technique for subway structures adjacent to construction excavation [7]. The field measurement and numerical analysis results differed slightly in both cases, but they exhibited similarities in the construction stage and locations of maximum convergence and track deformation [7]. In addition, they presented an evaluation technique for 3D analysis that analyzed the deformation geometry of tunnel convergence by identifying the displacement and longitudinal changes at each measurement location under the application of a mean value of the probability density [7]. Choi et al. developed an improved automatic measurement evaluation system for subway structures affected by adjacent excavation by integrating multiple field measurement techniques and automated data processing [8]. The results highlighted the importance of systematic field measurements and automated evaluation for ensuring the safety of railway infrastructure under adjacent construction conditions [8]. However, the study primarily focused on subway structures and automated monitoring systems, whereas a comprehensive three-dimensional deformation analysis of ballast turnout systems subjected to adjacent excavation was not addressed [8]. Therefore, further investigation is required to evaluate the overall displacement behavior and structural response of turnout systems using integrated field measurement techniques [8]. Sleepers that support the rails of the turnout track have different gaps and dimensions, and each sleeper has various cross-sections [8]. Shi et al comprehensively analyzed the impact of vertical stiffness irregularity in ballast tracks on settlement, rail deformation, and vehicle-track interaction. They demonstrated that variations in stiffness are a major cause of track irregularity and increased maintenance costs and compared various evaluation techniques and improvement measures [9].
Previous studies have investigated the structural performance and operational safety of railway turnouts and track systems from various perspectives. These studies analyzed vulnerability factors affecting turnout performance, identified the causes of turnout deterioration, evaluated running safety according to different track structures, and examined the influence of structural displacement on the integrity of railway infrastructure. Collectively, these studies emphasized that turnout systems are highly susceptible to structural deformation and operational deterioration under unfavorable loading and environmental conditions. However, most of these investigations focused on vulnerability assessment or structural behavior under conventional service conditions, while comprehensive evaluations of turnout deformation induced by adjacent excavation and the resulting three-dimensional displacement characteristics remain limited [10,11,12,13]. Recent studies have increasingly focused on advanced monitoring technologies and engineering approaches for assessing the safety of railway infrastructure. Non-destructive testing and structural health monitoring techniques have been widely adopted to evaluate the condition of railway facilities, while deformation-control technologies have been proposed to minimize the impact of deep excavations adjacent to high-speed railways. In addition, recent railway infrastructure studies have increasingly adopted advanced non-destructive testing, structural health monitoring, and automated data-analysis techniques to improve the efficiency and reliability of infrastructure condition assessment. These studies demonstrate the growing importance of integrating advanced monitoring and analytical techniques into railway infrastructure management [14,15,16,17]. Several studies and technical guidelines have established evaluation methods and maintenance criteria for railway track systems through field measurements, operational safety assessments, and infrastructure management standards. Previous research investigated track impact coefficients and train running safety based on track geometry inspection data, while national maintenance guidelines and railway design standards provided engineering criteria for track management and roadbed design. In addition, maintenance regulations have specified inspection procedures to ensure the long-term safety of railway infrastructure. Although these studies provide valuable design and maintenance frameworks, they primarily address conventional track management practices and do not sufficiently consider the complex deformation behavior of turnout systems under adjacent excavation [18,19,20,21]. Therefore, it is necessary to evaluate the stress and deformation caused by adjacent construction excavation by modeling the structural and physical characteristics of the rails. Conventional single-point measurements are often inadequate for fully verifying the comprehensive deformation of gravel track turnouts on earthwork subgrades due to the complexity of track structures and field conditions. Therefore, this study presents an effective multi-sensor measurement protocol and a 3D data-driven evaluation technique to analyze the overall behavioral characteristics of the turnout system.
In this study, the displacement behavior affecting the turnout track deformation (e.g., subsidence and uplift) was monitored and measured in each stage of an adjacent construction excavation using experimental methods: the track master system for measuring track irregularity, rail displacement sensors for measuring vertical displacement, and automatic level measurement for measuring the displacement of sleepers supporting the turnout rails. In addition, to analyze the displacement behavior of a gravel track turnout adjacent to construction excavation, the displacement characteristics across different turnout locations were evaluated comprehensively through the spatial and time-series integration of the field measurements (track master system, rail displacement sensor, and automatic level measurement). Although previous studies have investigated excavation-induced ground deformation, railway track irregularity, and turnout behavior, most field investigations have focused on either a single monitoring quantity or a single measurement reference framework. In particular, relative track geometry measurements and absolute support system displacement measurements have rarely been directly compared at the same operational turnout subjected to adjacent excavation. This distinction is important because local rail geometry changes and global sleeper support movements do not necessarily exhibit the same displacement magnitude or spatial pattern. For example, a nearly uniform vertical movement of adjacent sleepers may result in significant absolute settlement while producing only a relatively small change in local rail geometry. Based on this research gap, the objective of this study is to experimentally investigate the deformation behavior of a ballasted turnout subjected to adjacent deep excavation by integrating three monitoring methods with different measurement reference frameworks: a track master system for track geometry, tilt-angle-based sensors for local rail displacement, and an automatic leveling system for absolute sleeper displacement. The field measurements are evaluated spatially and temporally according to the principal construction stages to distinguish local rail deformation from global support system movement.
The principal contribution of this study is, therefore, not the application of conventional monitoring instruments or the monitoring of deformation according to construction stages. Rather, it lies in the field-based comparison of monitoring systems with different reference frameworks and in experimentally distinguishing local relative rail geometry changes from global absolute sleeper support displacement within the same operational turnout. Through this integrated interpretation, the study demonstrates that the two deformation components can exhibit different magnitudes, spatial distributions, and critical locations during adjacent excavation. This provides a more comprehensive framework for evaluating turnout deformation than approaches based on a single monitoring quantity or reference system.
2. Field Measurement
2.1. Overview
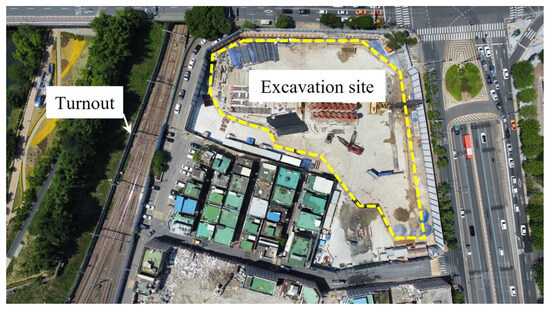
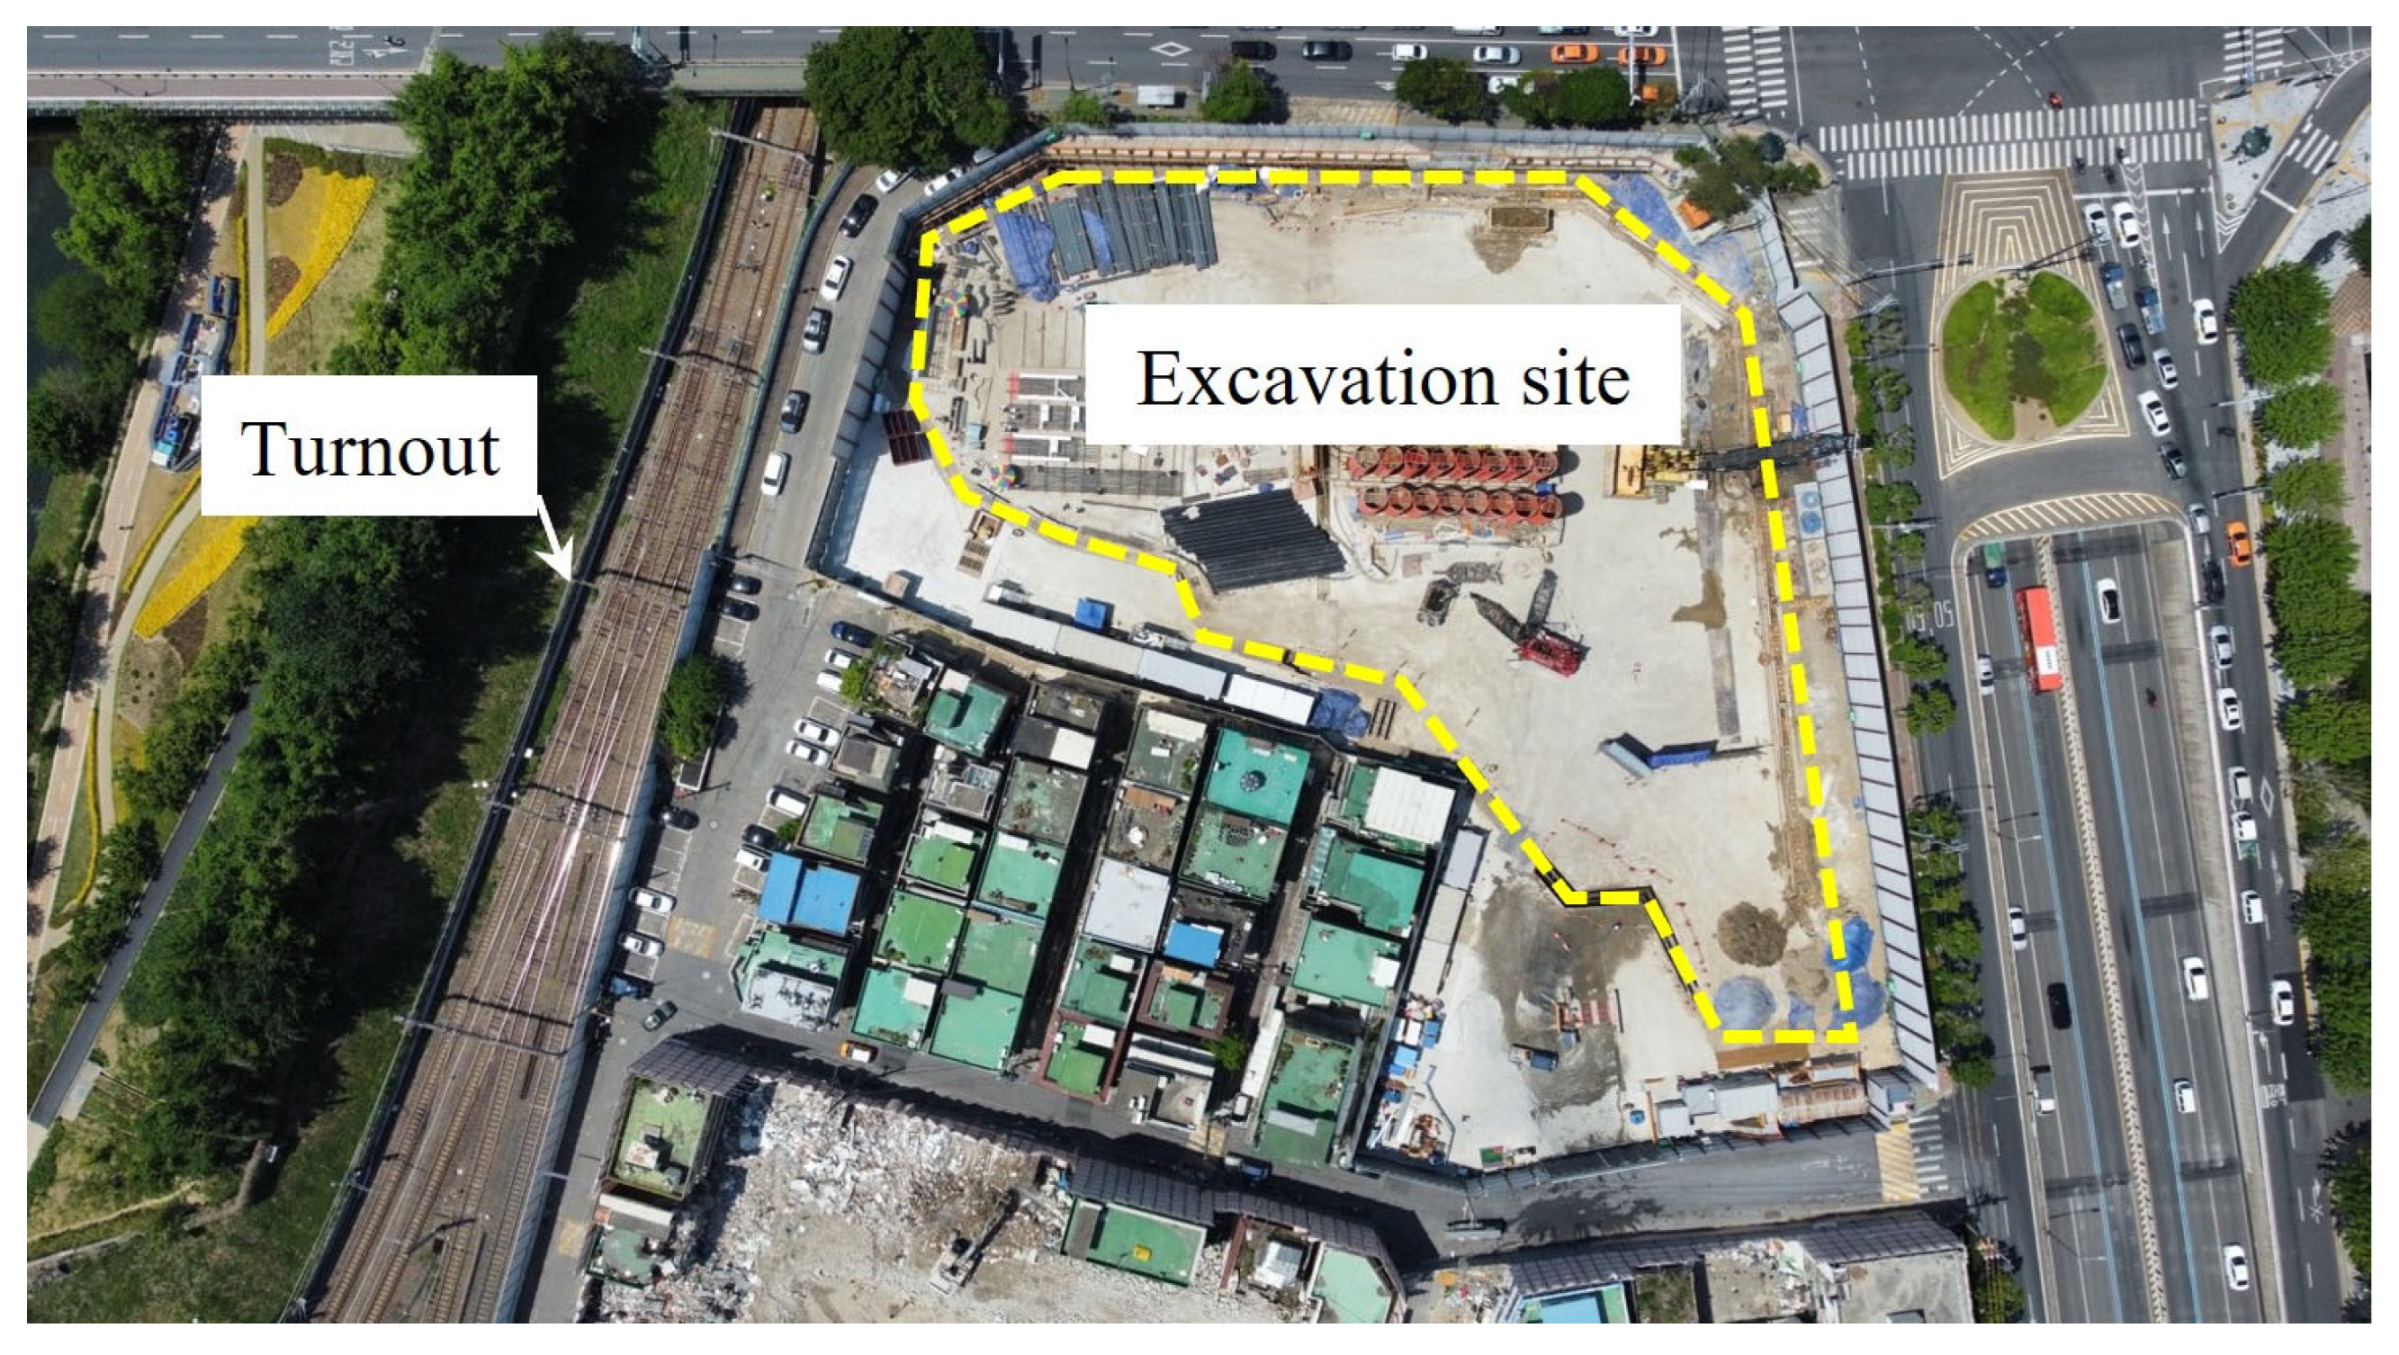
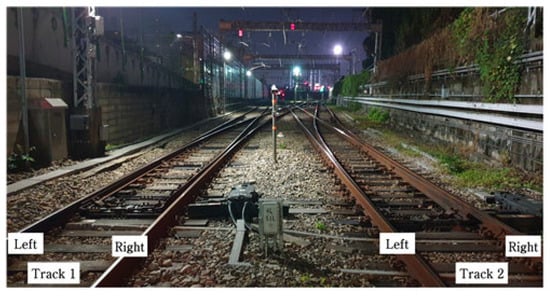
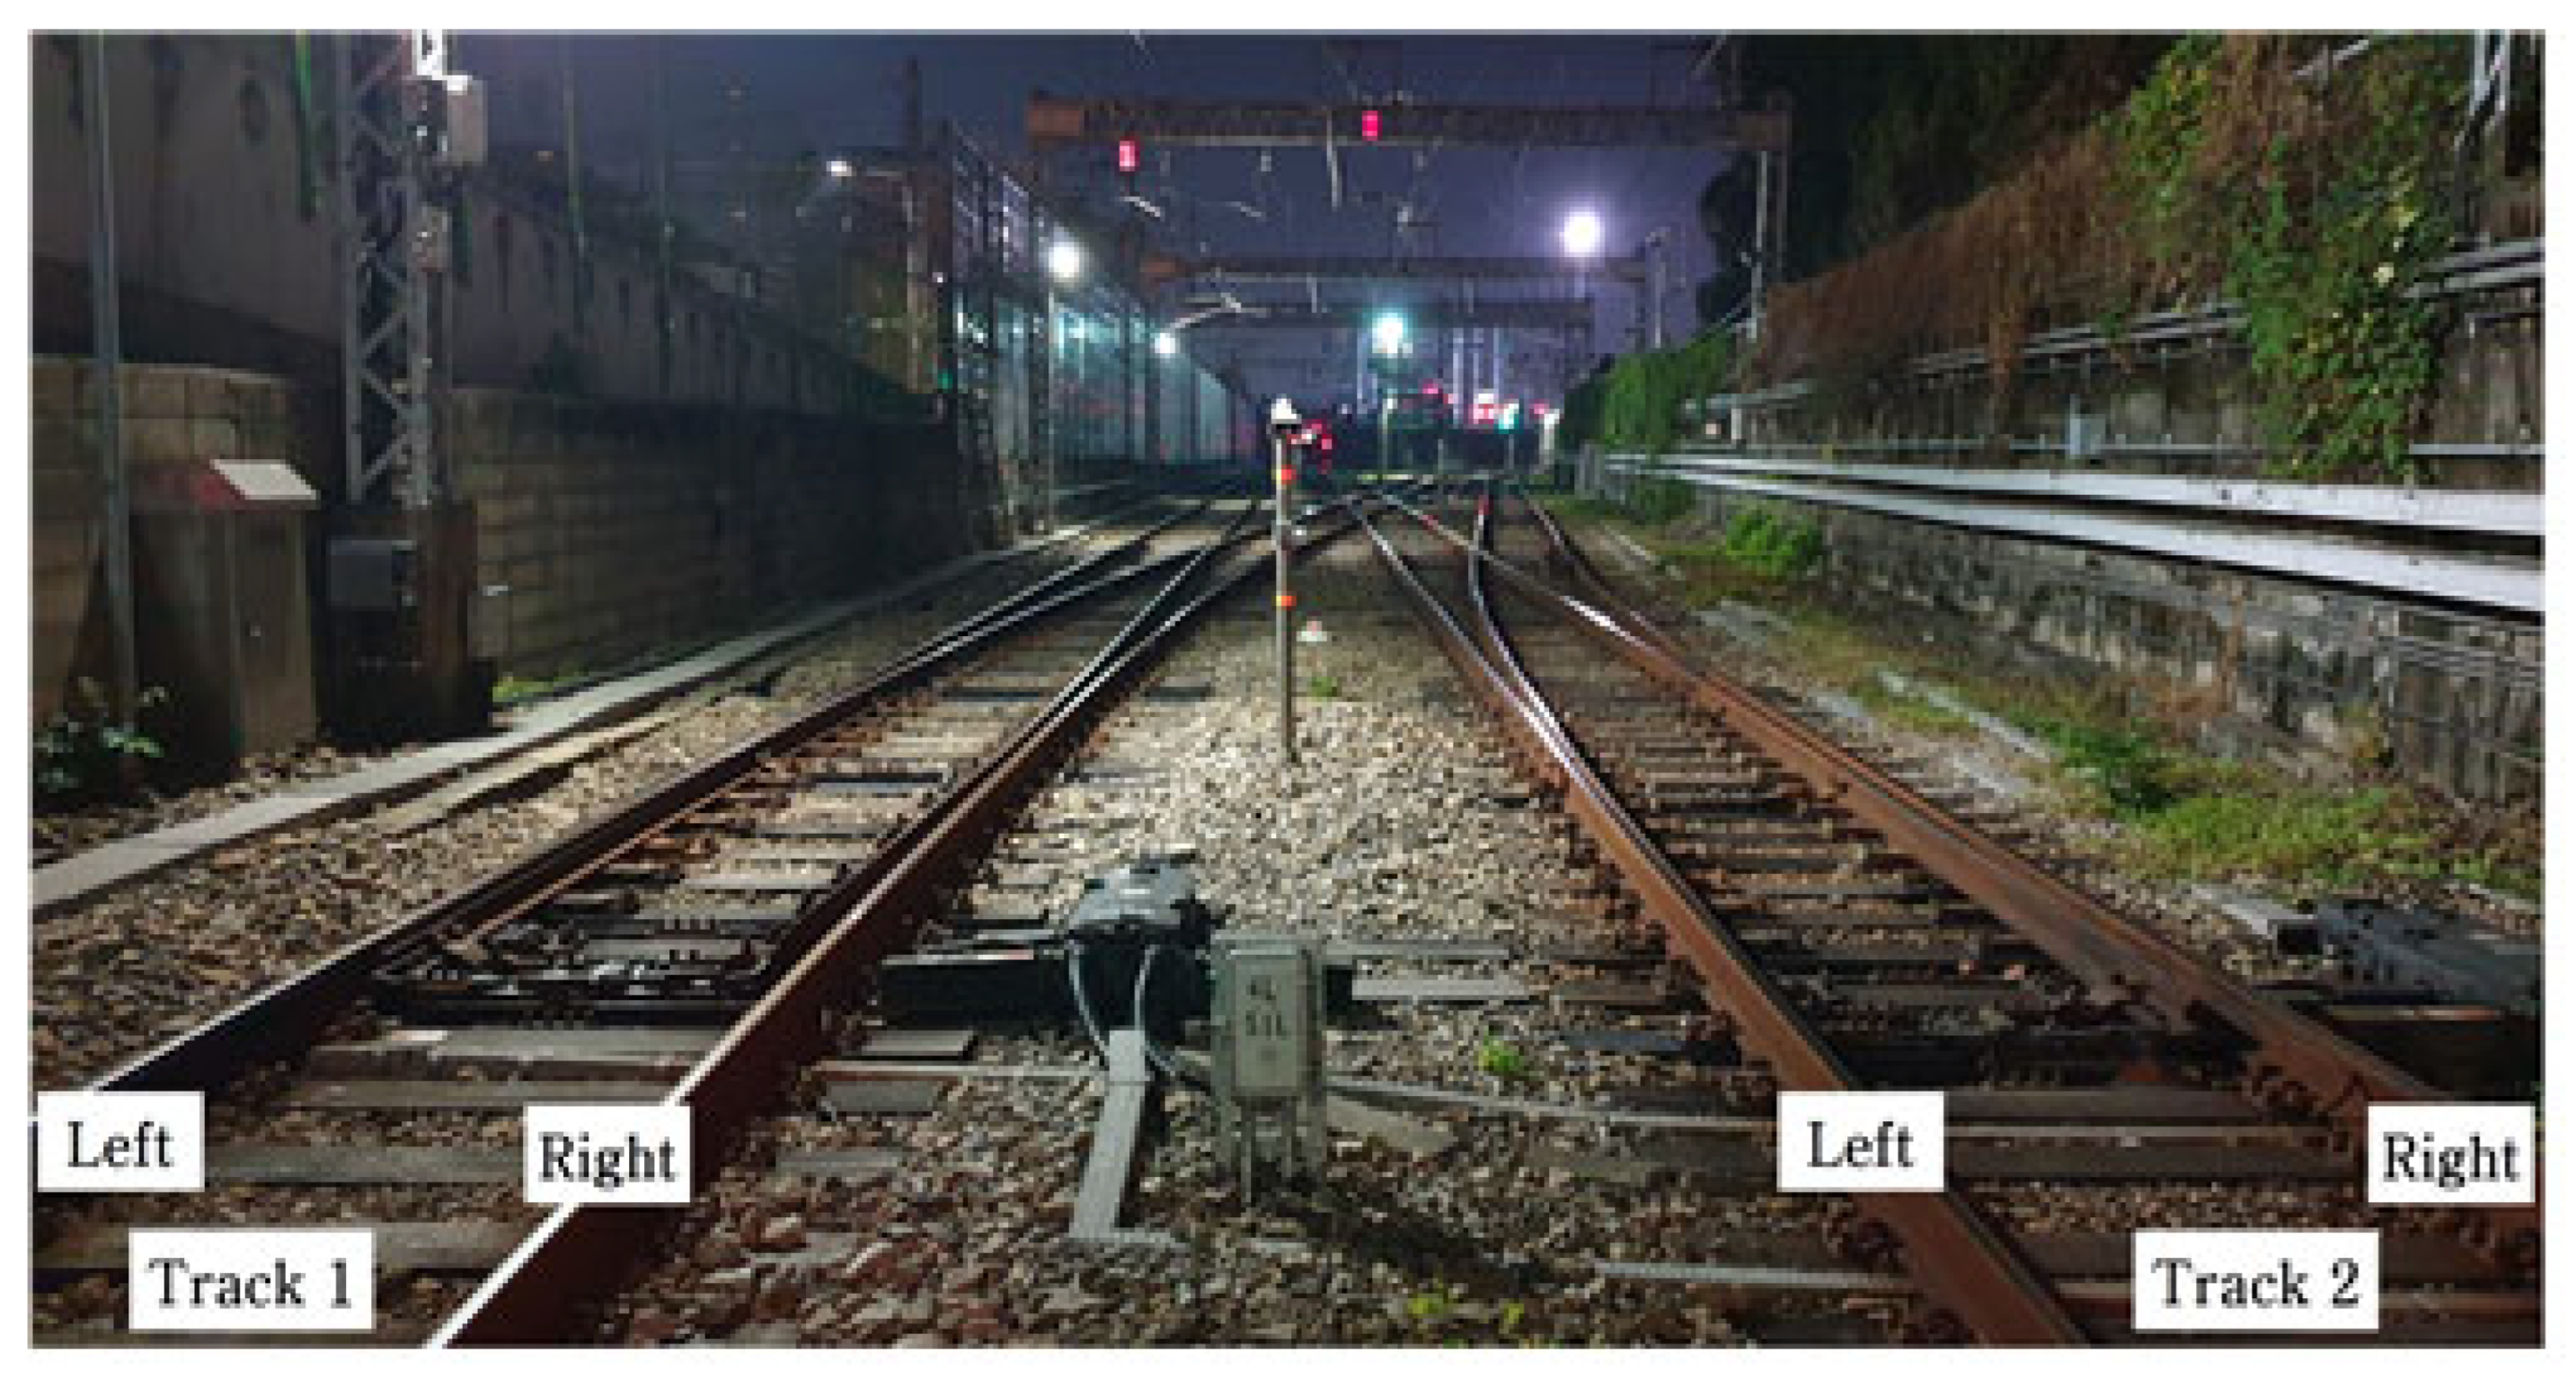
This study focused on a standard single turnout (60 kg, #10, 2 units)—an above-ground gravel track turnout adjacent to a large-scale construction excavation site, as shown in Figure 1 [1].
Figure 1.
Target facility.
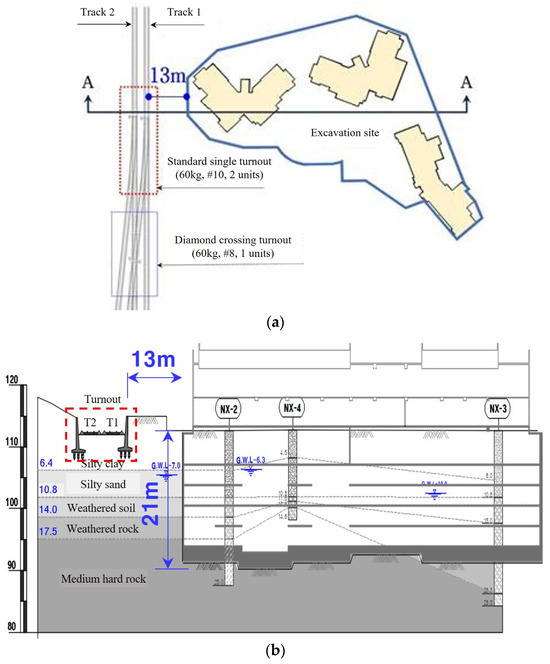
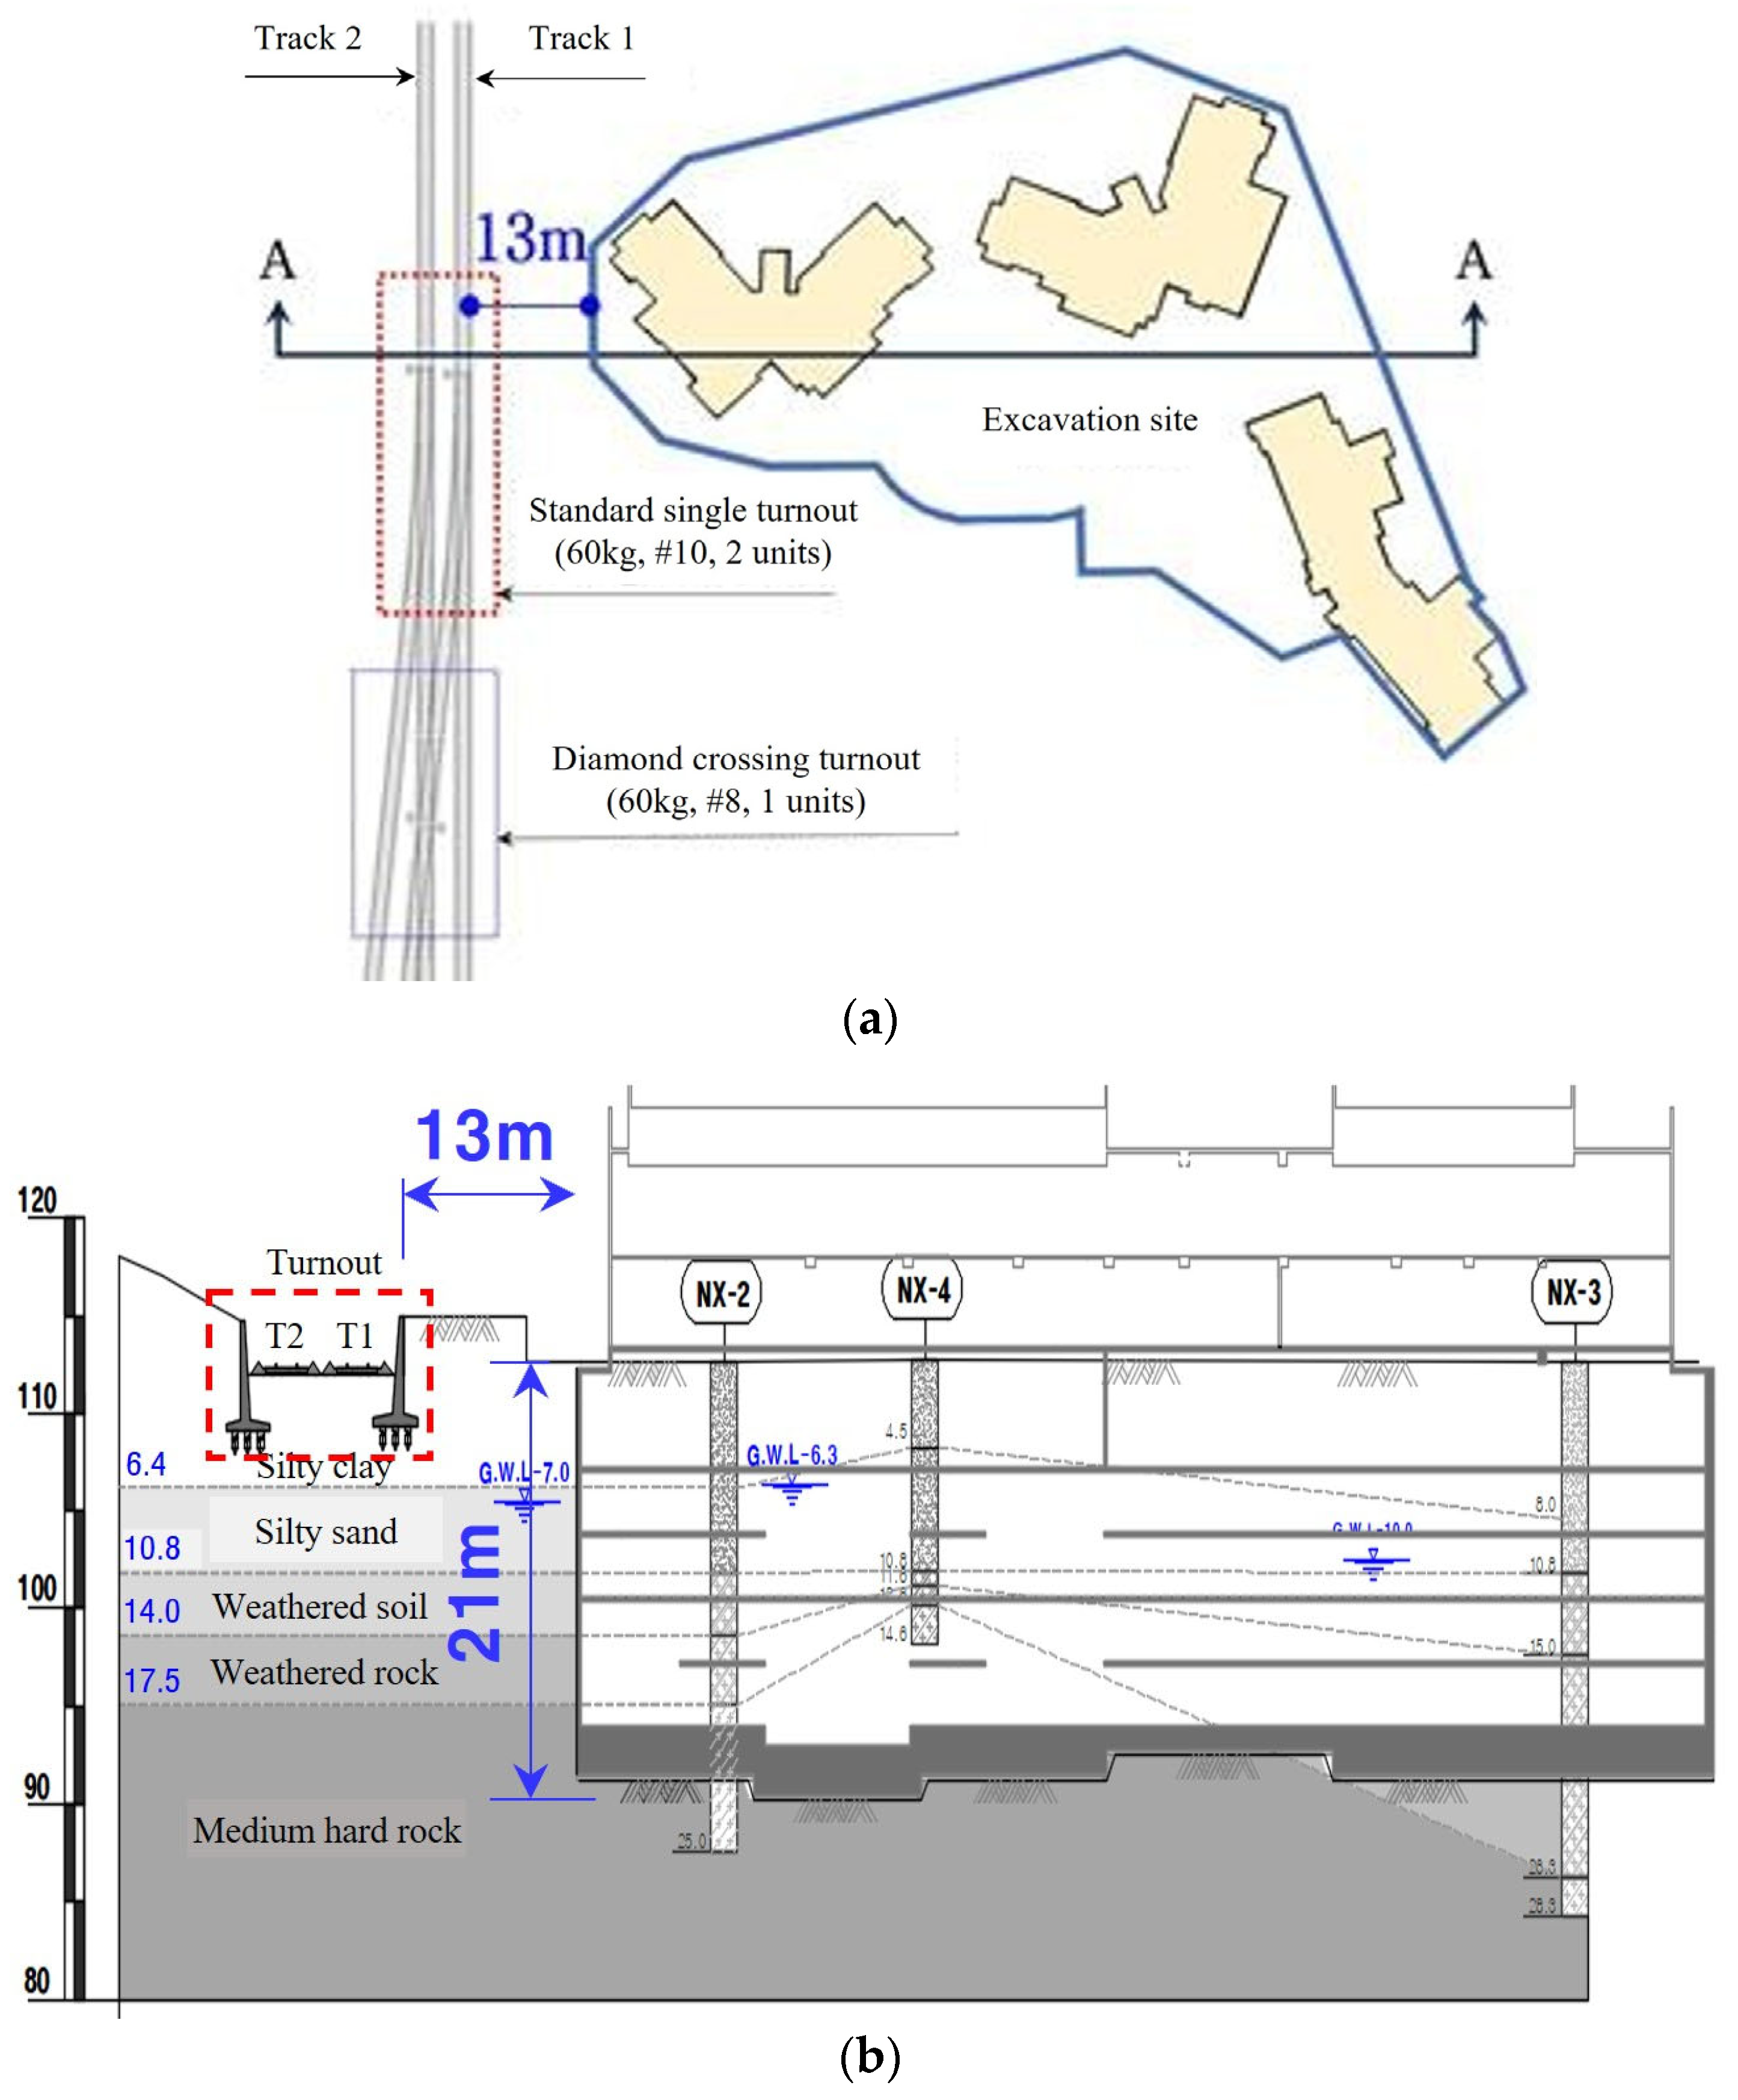
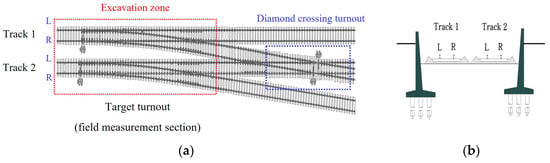
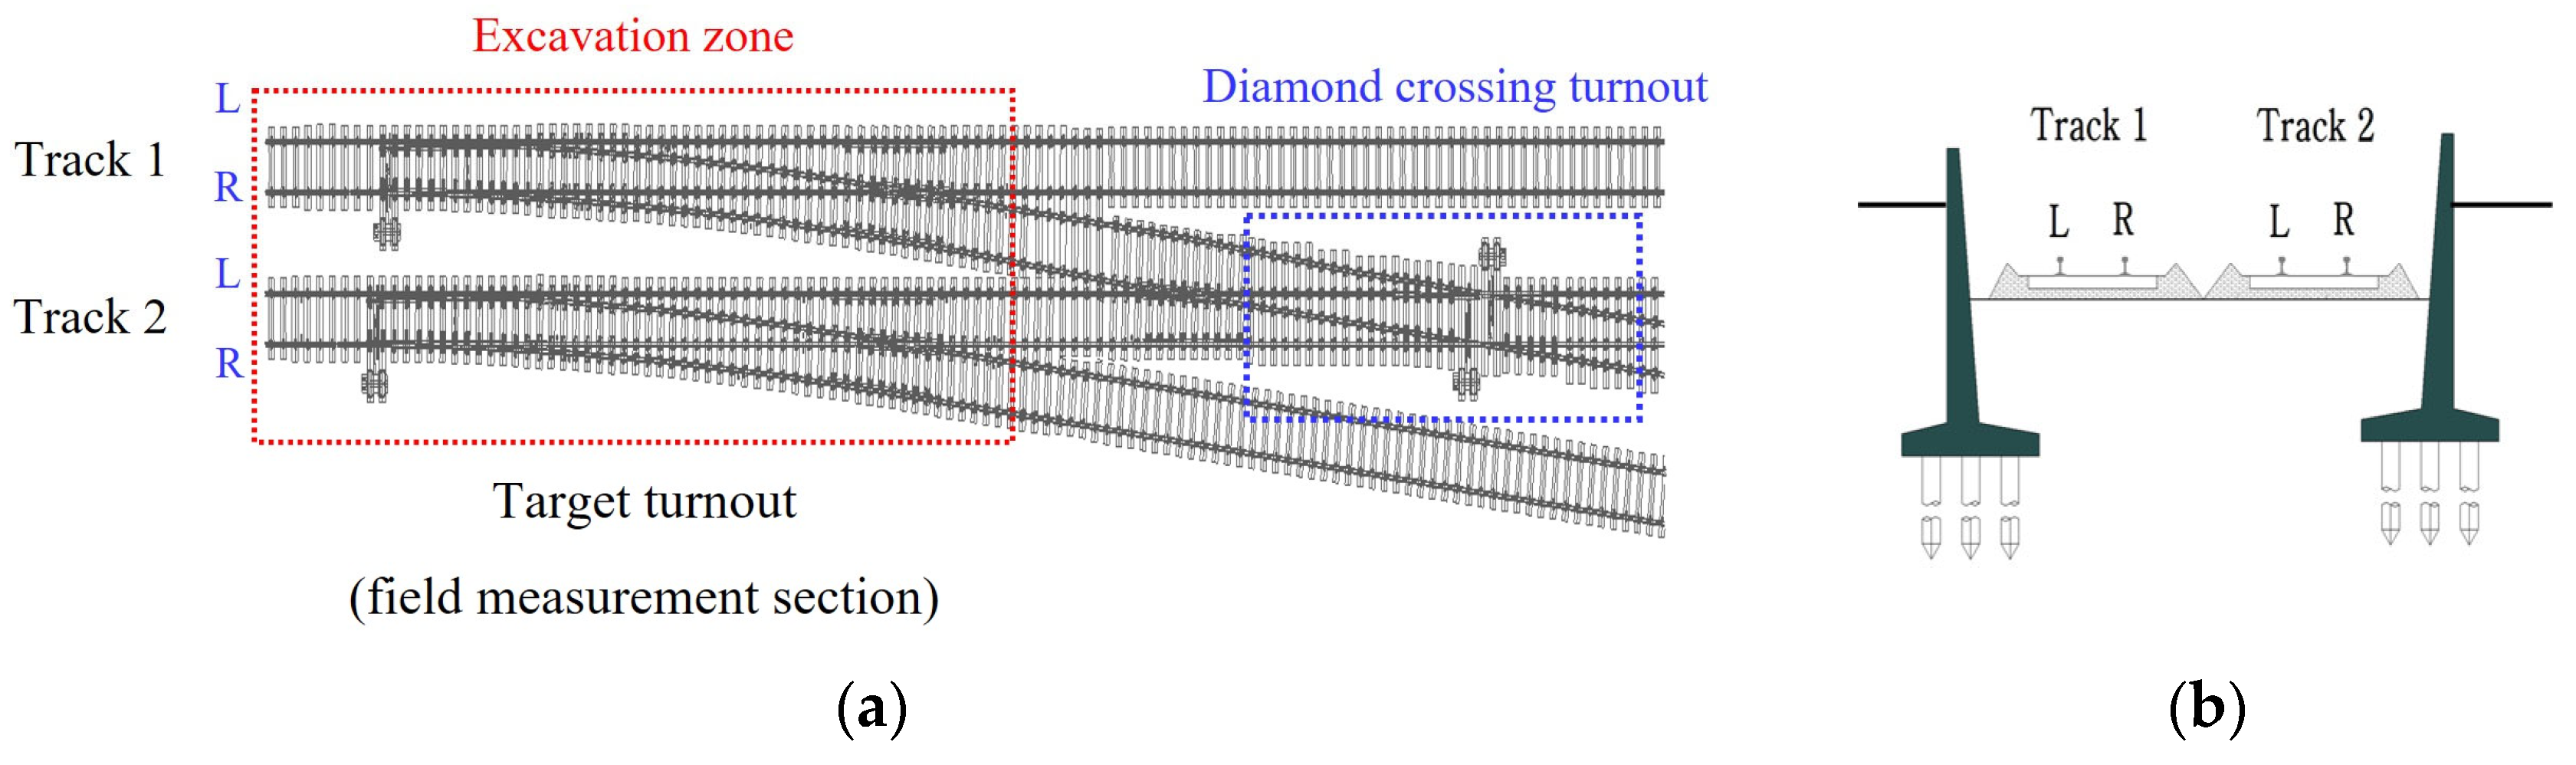
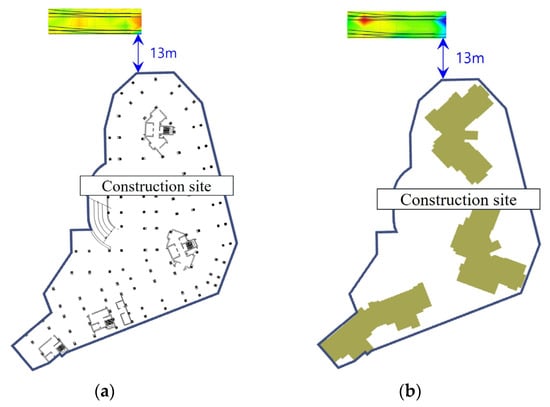
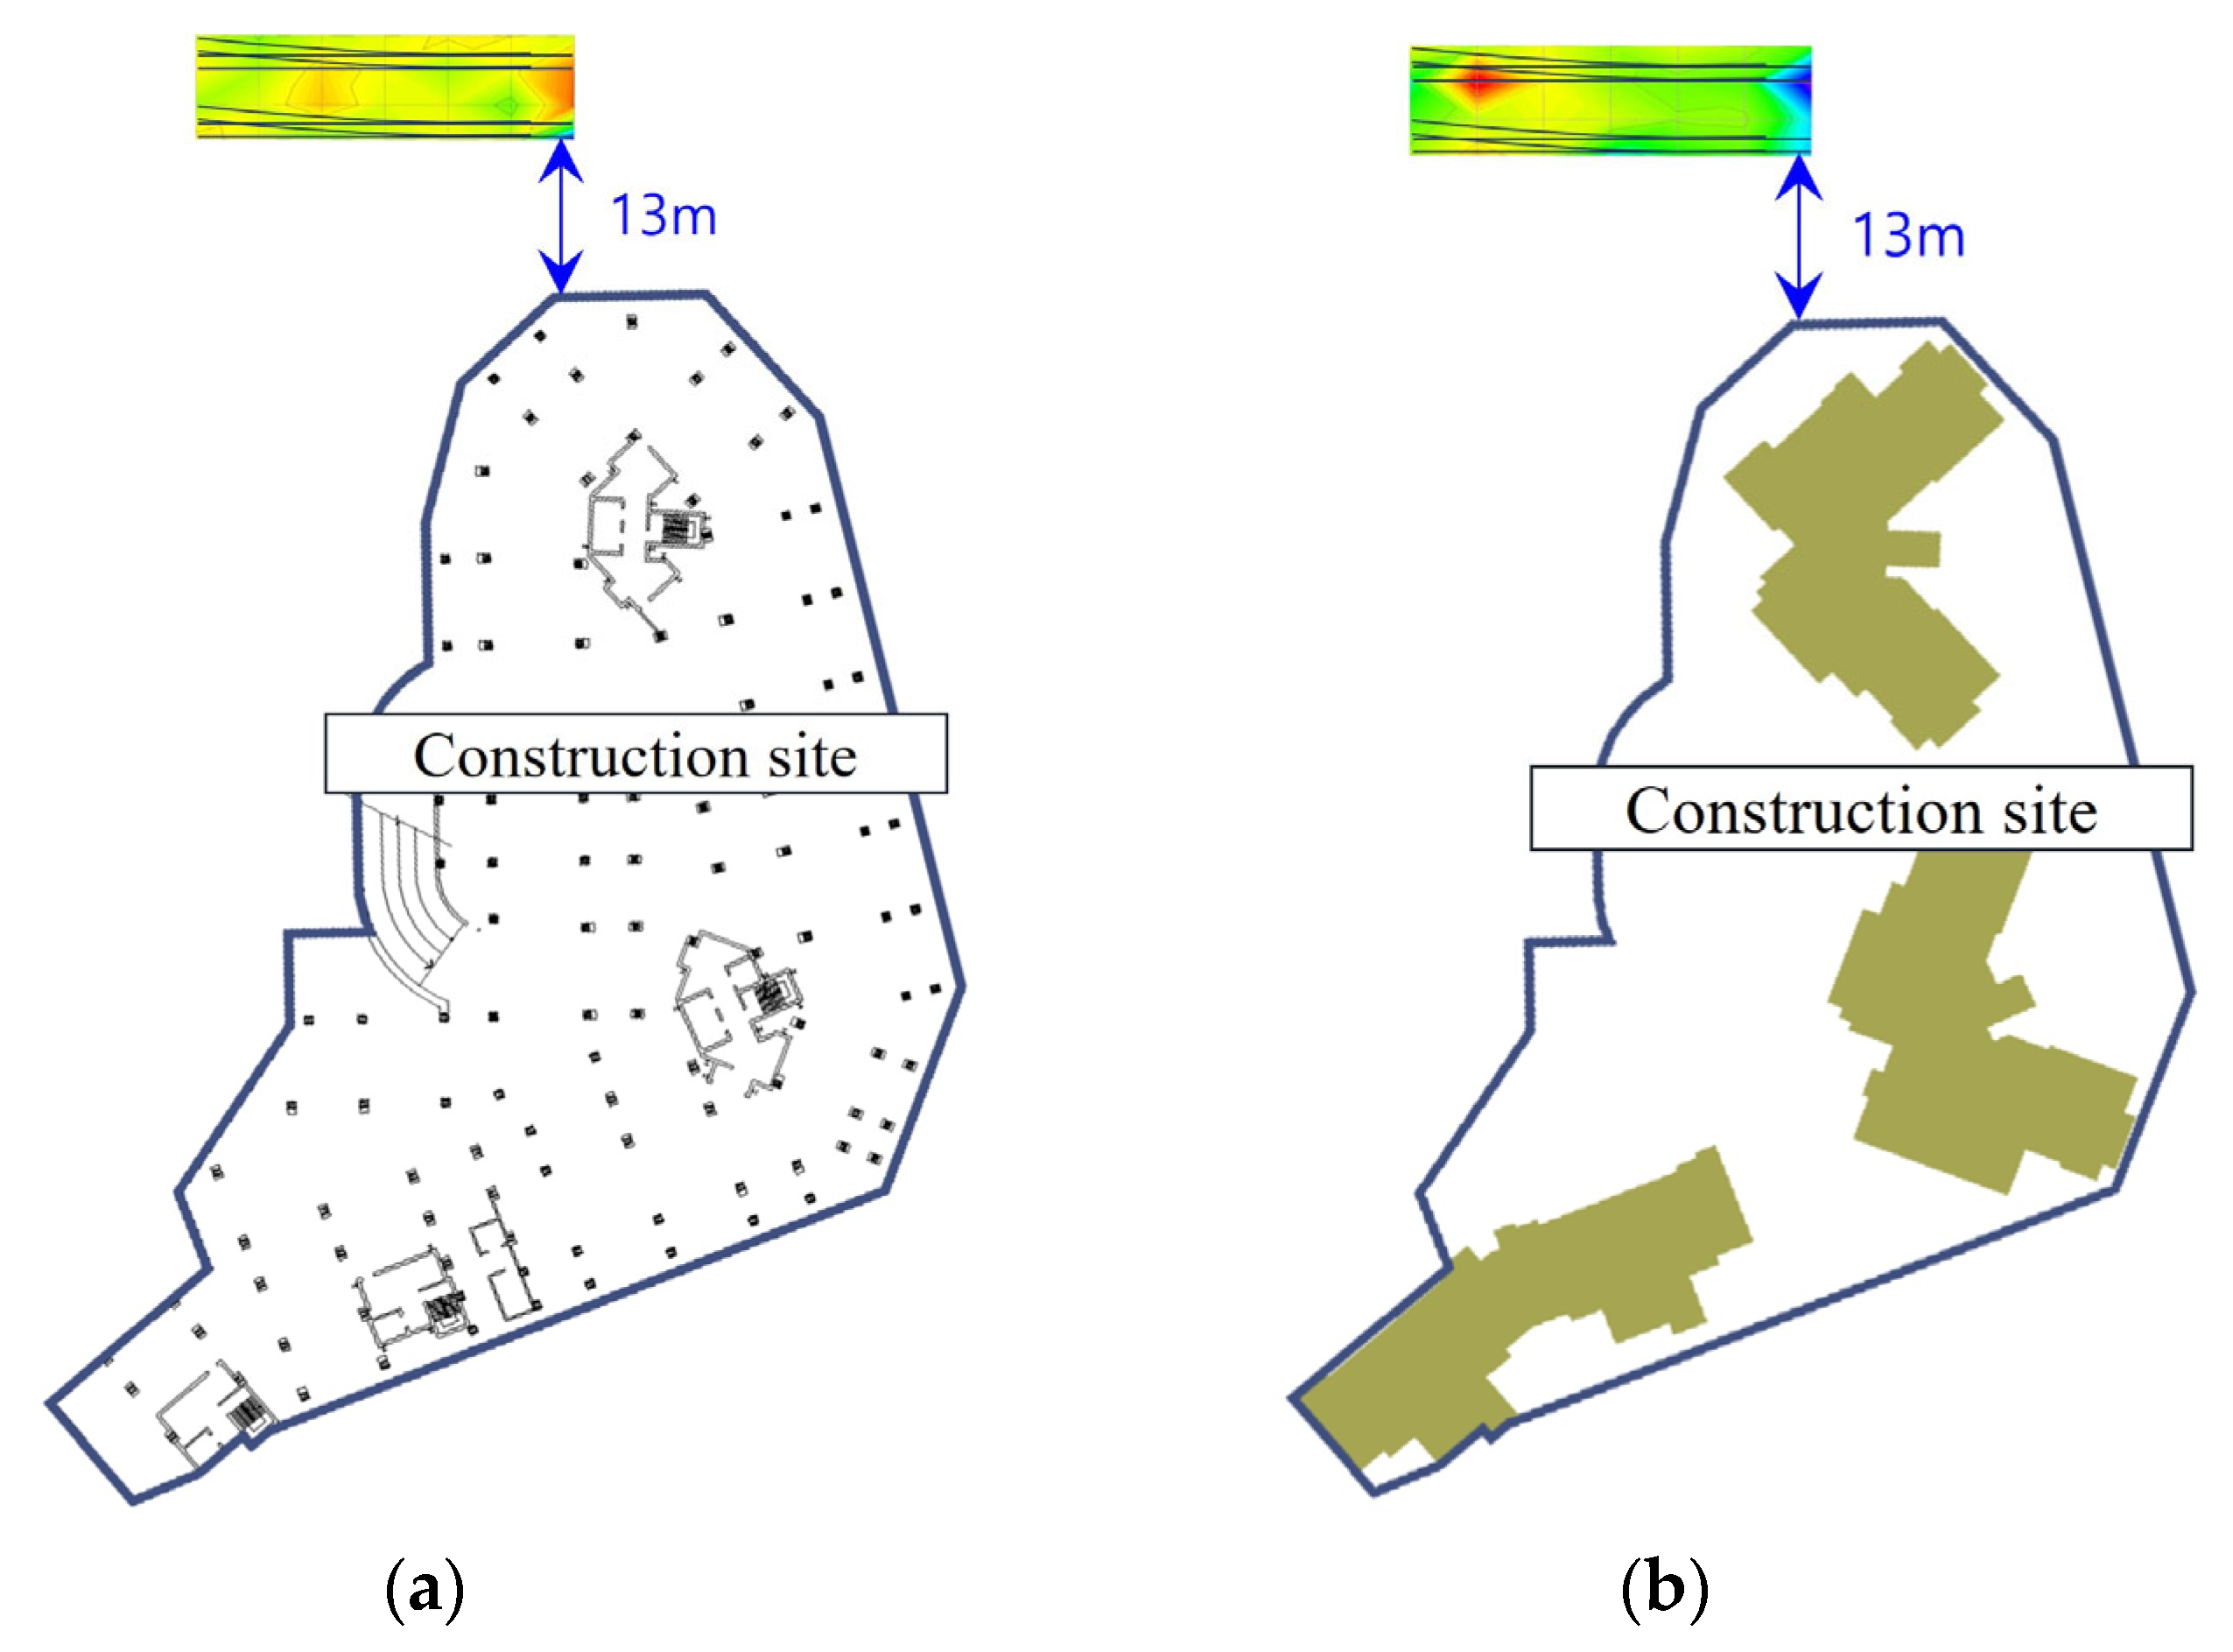
The layout of the construction excavation is shown in Figure 2 [1]. The distance between the turnout and the construction excavation site is approximately 13 m, as shown in Figure 2a, and the excavation depth is approximately 21 m [1]. Because the excavation depth was relatively large compared with the horizontal distance from the operational turnout, excavation-induced stress redistribution and ground movement had the potential to affect both the ballast–subgrade support system and the rail geometry. In addition, the target turnout contains structurally discontinuous regions, including the point, lead, crossing, rail joint, and tongue rail sections. These differences in structural configuration and support conditions were therefore considered important factors in interpreting the spatially non-uniform deformation observed during the excavation [1]. In addition, the ground at the turnout track and excavation work consists of silty clay, silty sand, weathered soil, weathered rock, and medium hard rock, as shown in Figure 2b.
Figure 2.
Status of construction excavation adjacent to the target turnout of this study; (a) top view; (b) sectional view.
The section examined in this study has three turnouts owing to the operation of main lines and installation of sidings for depot entry/exit tracks. These include one D/C turnout created by the crossing tracks and two standard single turnouts.
Figure 3.
View of the turnout.
Table 1.
Specifications of the turnout.
To evaluate the proposed system under actual operational conditions, field experiments were conducted at an operational railway turnout site, as shown in Figure 3. The test section consists of two primary track lines designated as Track 1 and Track 2, with each track further categorized into left and right rails.
The detailed planar and cross-sectional status of the test site is illustrated in Figure 4. As shown in the top view of Figure 4, the field measurement section centers on the target turnout, which is directly located within a designated excavation zone (indicated by the red dotted line). Downstream of the target turnout, a diamond crossing turnout (indicated by the blue dotted line) is interconnected with both Track 1 and Track 2 (left and right rails).
Figure 4.
Detailed status of the target facility: (a) top view and (b) sectional view of the track section.
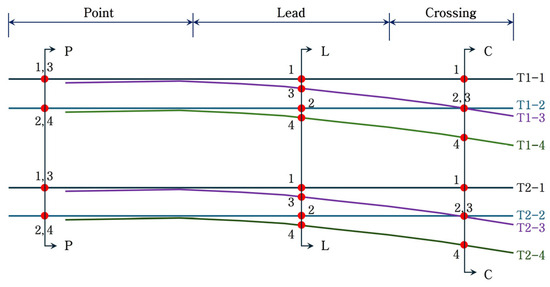
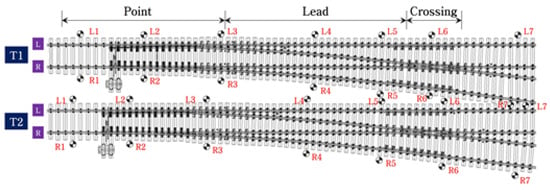
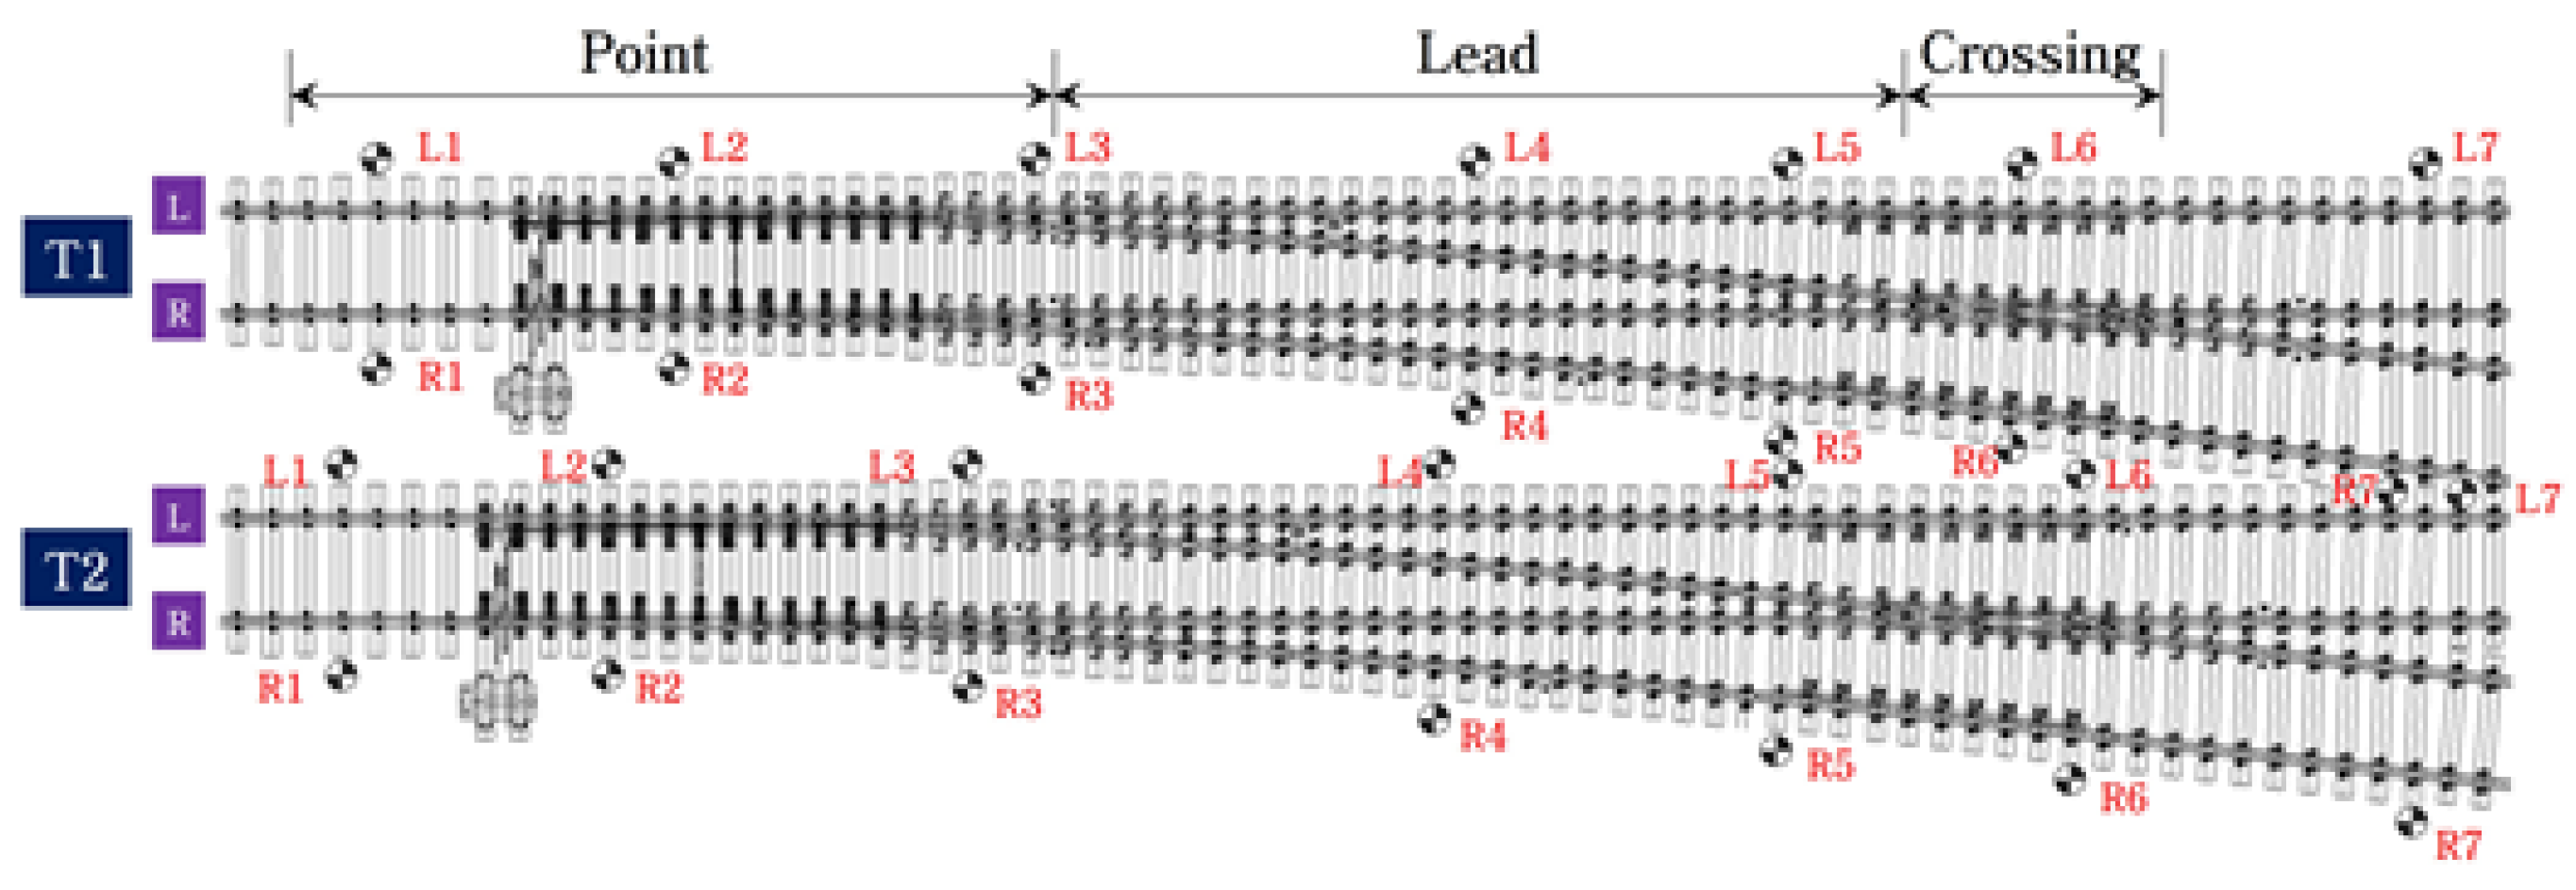
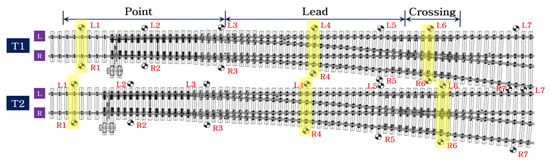
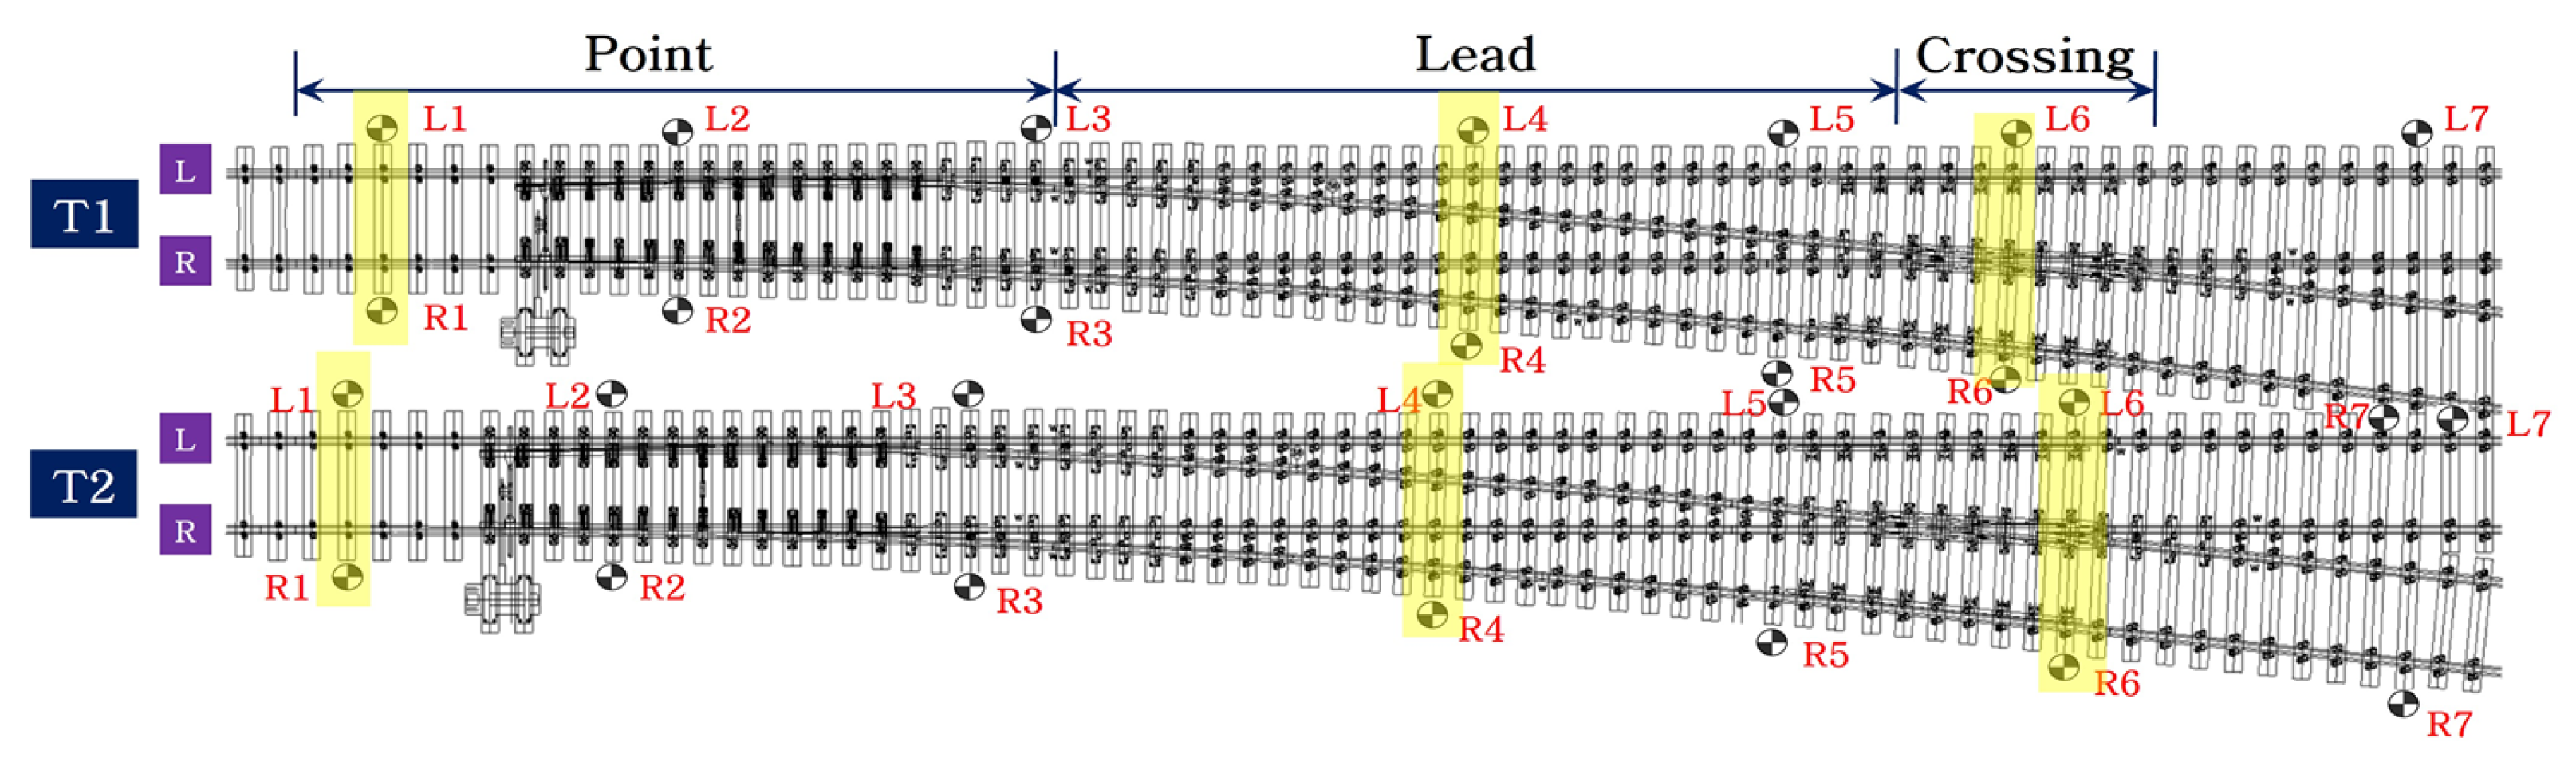
To systematically analyze the structural response and dynamic behavior along the turnout geometry, each turnout is divided longitudinally into three functional zones: the Point, Lead, and Crossing sections (Figure 5). Across both Track 1 (comprising rails T1-1 through T1-4) and Track 2 (comprising rails T2-1 through T2-4), three critical reference cross-sections are established.
Figure 5.
Sections to be examined for each turnout location.
2.2. Installation of Measuring Instruments at the Site
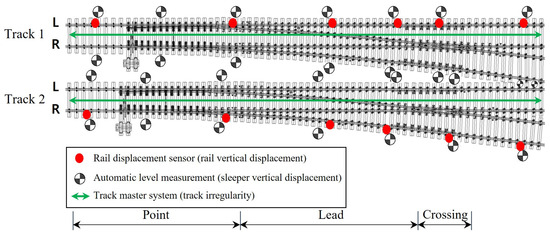
Field measurements were performed to measure the turnout track deformation due to the excavation. A track master system for measuring the turnout track irregularity and a rail displacement sensor for measuring the vertical displacement of the rails were installed. In addition, an automatic level measurement was installed to measure the vertical displacement of the sleepers, which are the support points of the rail. Figure 6 shows the installation points of all measuring instruments.
Figure 6.
Locations of measuring instruments.
The longitudinal-level irregularity, cross-level irregularity, and twist irregularity were measured using the track master system (see Table 2). The rail displacement sensor was attached to the rail web at 20 locations on the left side of the T1 track and right side of the T2 track to avoid interference with the operation of the turnout tongue rail. The prism of the automatic level measurement was installed at both ends of seven sleepers at major turnout locations for the T1 and T2 tracks. Thus, automated measurements were performed at a total of 28 points.
Table 2.
Technical specifications of the monitoring instruments used in this study.
The three monitoring systems were selected to quantify different components of the turnout response (see Table 3). In this study, the track master system and rail displacement sensors are classified as relative measurement methods because their principal outputs represent local changes in rail geometry or rail displacement with respect to a reference associated with the monitored track. In contrast, the automatic leveling system is classified as an absolute displacement measurement method because the sleeper elevations are measured with respect to an external survey reference that is independent of local rail deformation. Accordingly, the three systems should not be interpreted as measuring an identical physical quantity. The track master system primarily identifies spatial changes in track geometry, the rail displacement sensors monitor localized rail response, and the automatic leveling system quantifies the movement of the sleeper support system. Their combined application was, therefore, intended to distinguish local differential rail deformation from global support system movement.
Table 3.
Management criteria adopted for the field-monitoring results.
2.3. Track Master System
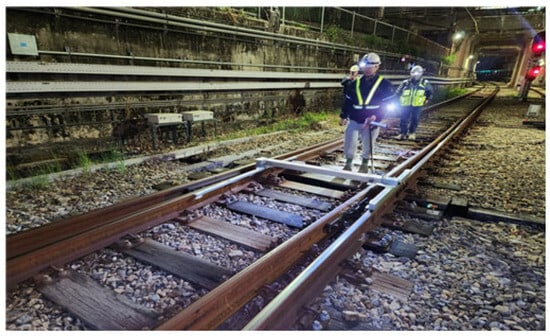
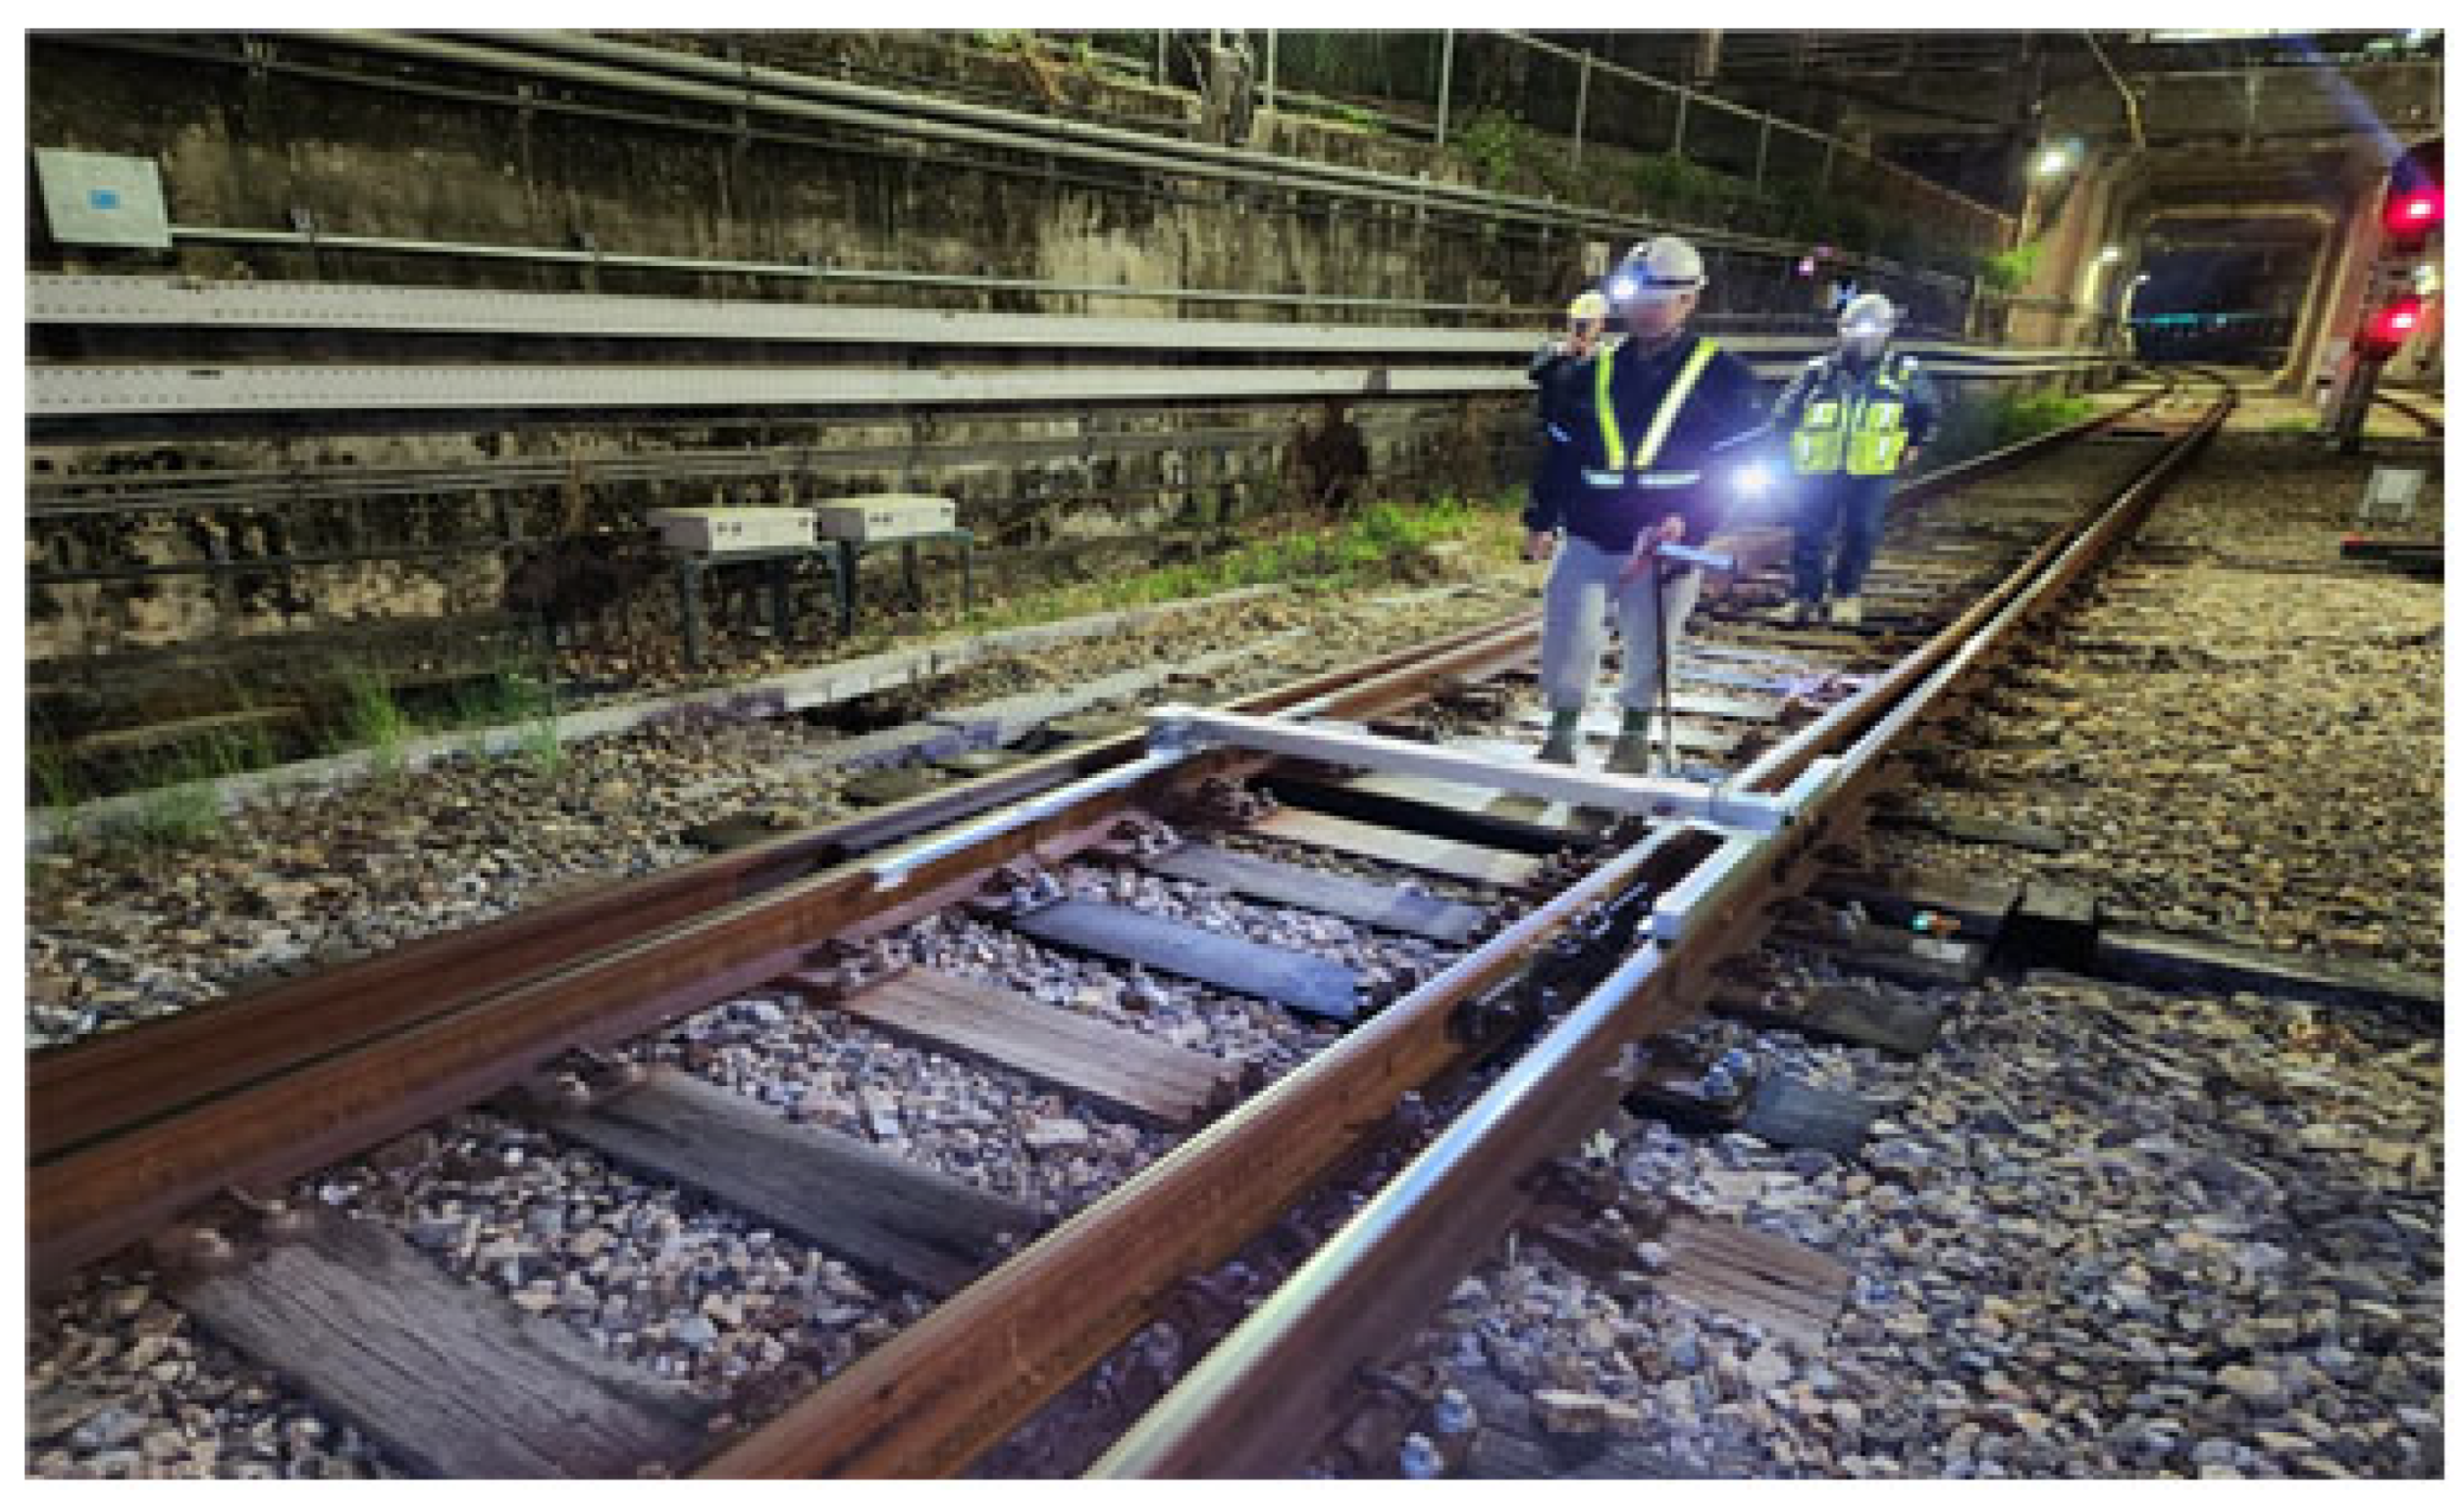
In this study, the track irregularity was measured using the Track Master (LR-S100). As shown in Figure 7, track irregularity measurement using the Track Master system can directly measure the locational change of the rail head in direct contact with the railway wheels. It should be noted that the track master was moved along the turnout as a survey instrument, and the measurements were not performed during train passage. The turnout was therefore not subjected to a simultaneous moving wheel load during the track master survey. The measured geometry consequently represents the unloaded or quasi-static track condition at each survey stage, including the residual deformation accumulated in the ballast–sleeper–rail system. During each survey, the track master system was moved longitudinally along the turnout at a low measurement speed, and rail-head geometry was recorded at a spatial interval of 0.25 m. The longitudinal-level, cross-level, and twist parameters were obtained from the track geometry outputs measured at the corresponding spatial positions. For the excavation-effect evaluation, the values measured after excavation were referenced to the corresponding pre-excavation measurements, and the resulting spatial differences were used to construct the profiles presented in the results. Thus, these figures represent the change in track geometry between the two survey stages rather than raw sensor signals plotted directly against distance.
Figure 7.
Measurement using the Track Master system.
The gyro (angular velocity) sensor is a key component of the track master system and is used to analyze the displacement behavior of the gravel track turnout due to the adjacent excavation by measuring the deformation and geometrical changes of the turnout rails before and after construction, in addition to the longitudinal-level irregularity, cross-level irregularity, and twist irregularity. Measurements were performed during the construction initiation stage (before construction excavation) and upon the completion of excavation (after construction). The track master measurements were performed only at selected construction stages and were not intended to provide a continuous time history over the entire monitoring period. Therefore, the track master data were not directly compared with every time step of the approximately 640-day continuous monitoring records obtained from the rail displacement sensors and the automatic leveling system. The track master displacement profile used in the comparative analysis was calculated from the difference between the measurements obtained before excavation and those obtained after the completion of excavation at the corresponding spatial locations. Therefore, the track master result represents the net relative change in track geometry between the two reference stages rather than a continuous time-series measurement. The continuously monitored rail displacement and sleeper elevation data were separately used to evaluate the temporal development of deformation between these reference stages. Accordingly, the comparison among the three monitoring systems represents a stage-matched spatial comparison rather than a direct correlation of continuous time-series data.
2.4. Rail Displacement Sensor
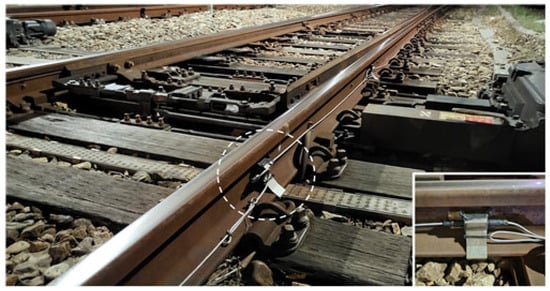
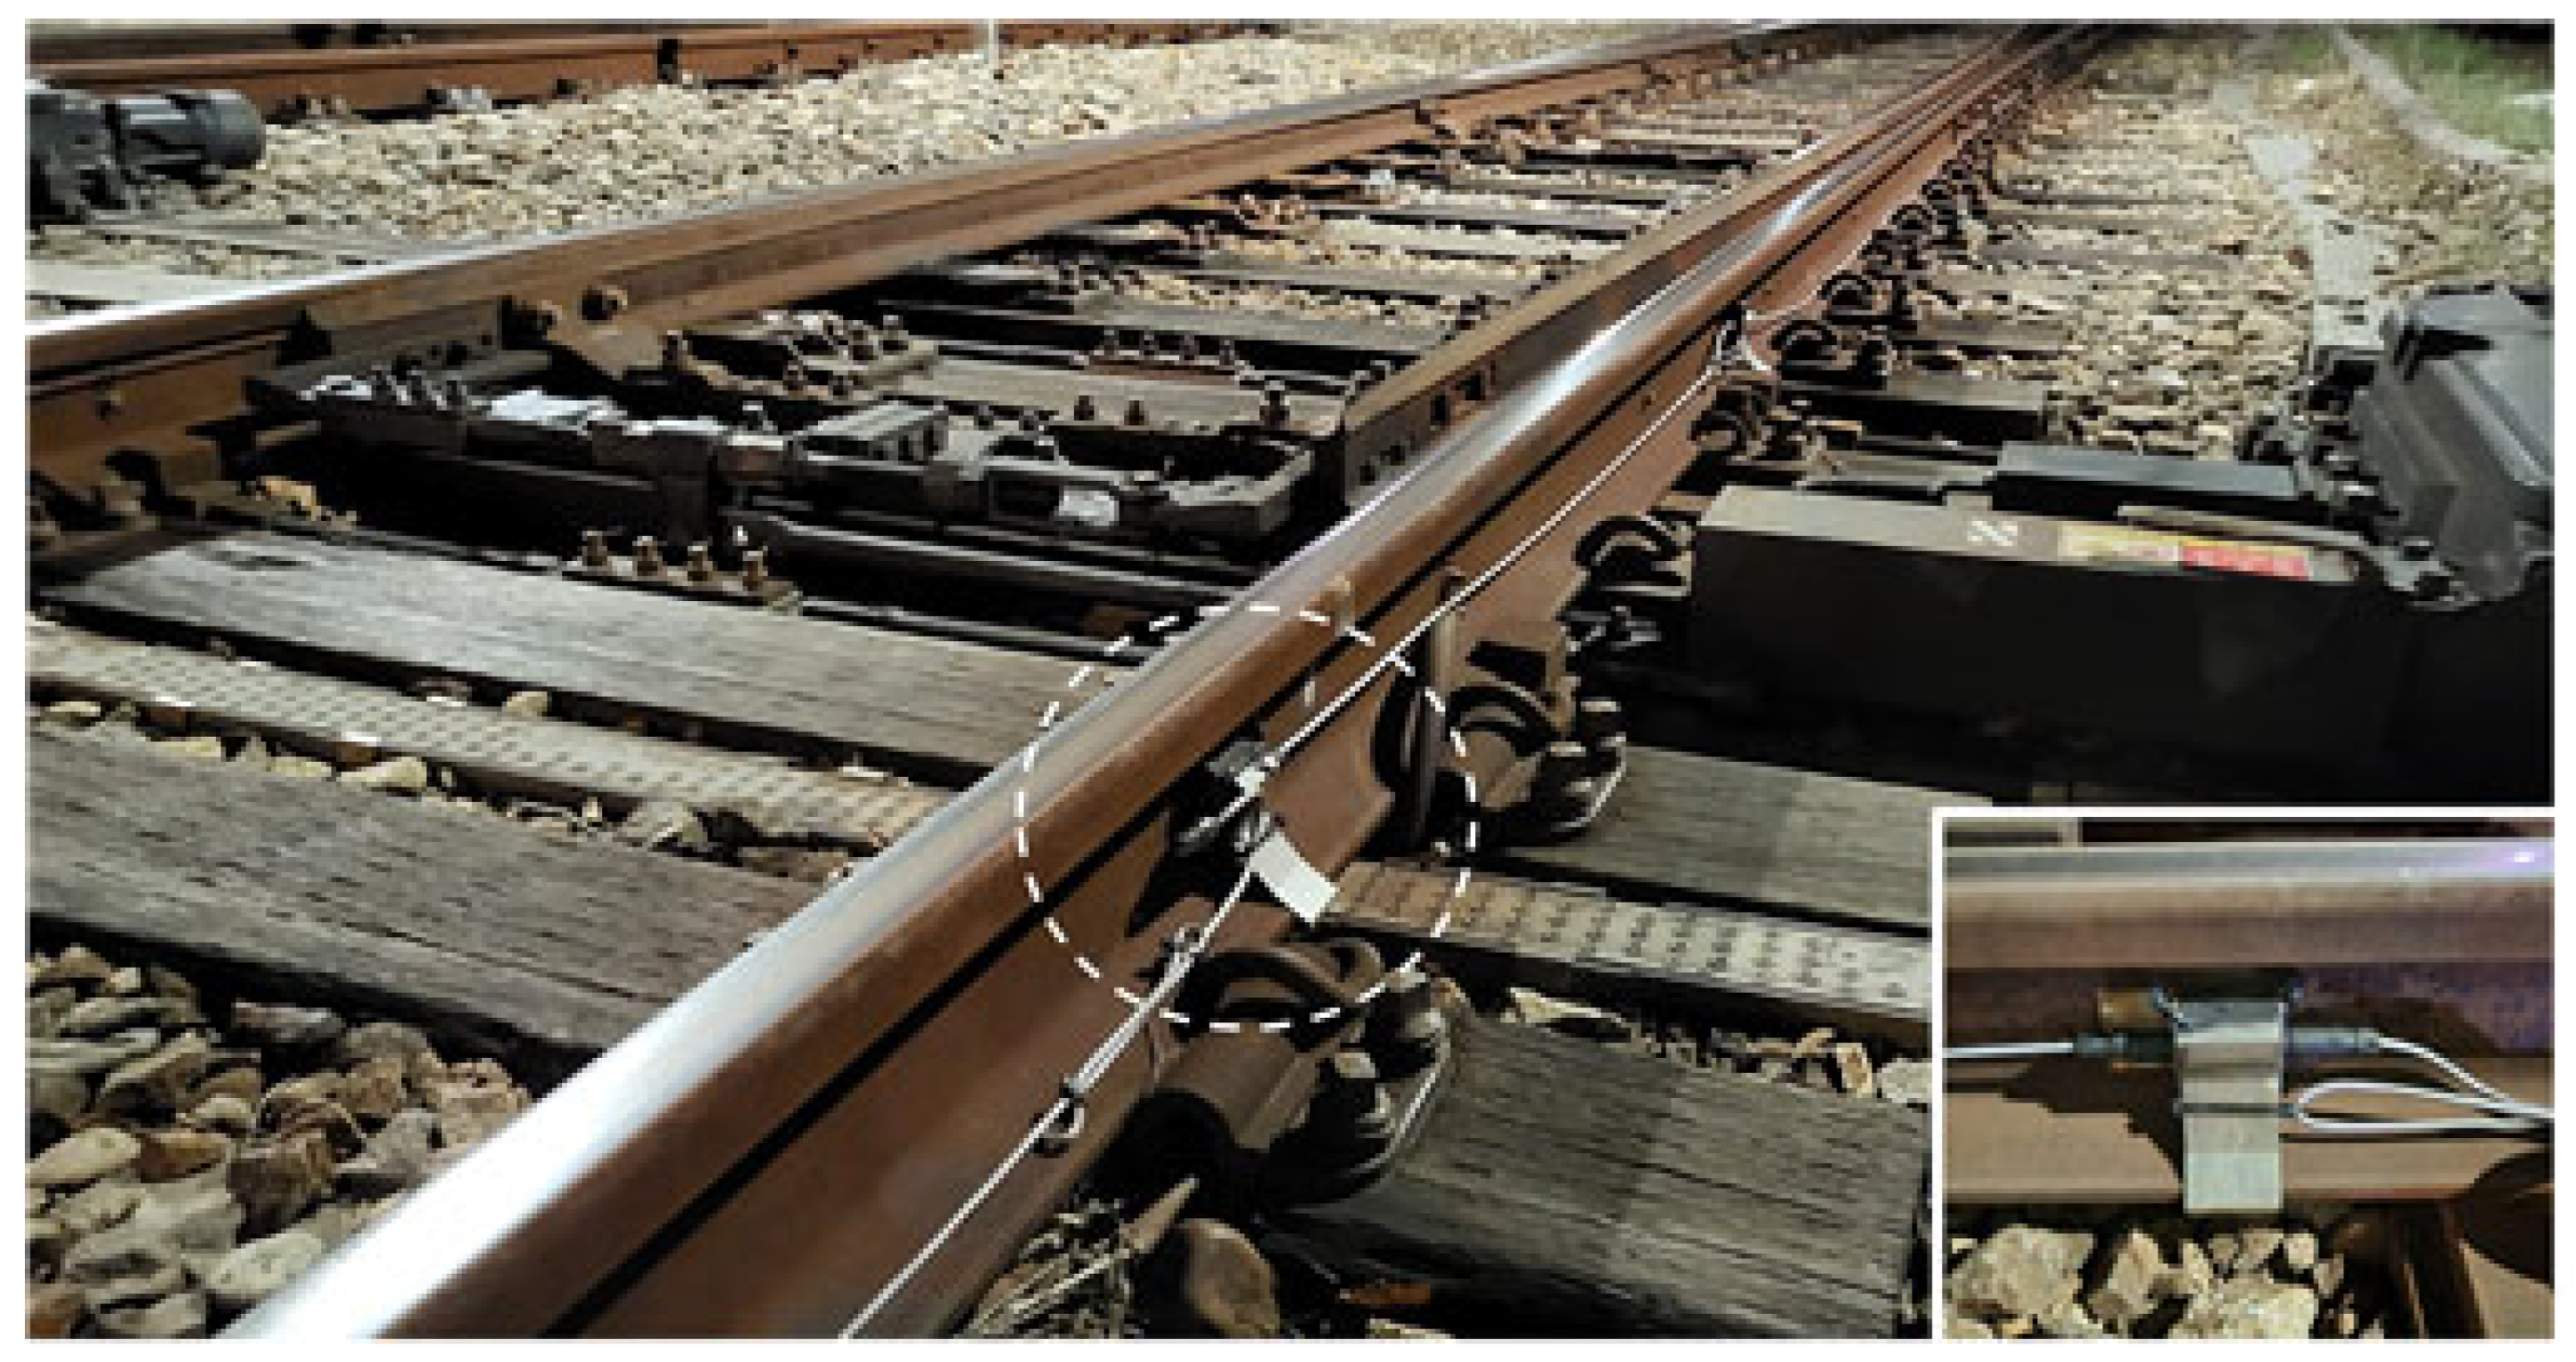
To monitor the vertical displacement of the turnout rail induced by adjacent excavation, tilt angle-based rail displacement sensors were deployed via an automated measurement system, with the configuration illustrated in Figure 8.
Figure 8.
Installation of the rail displacement sensor.
In this study, the rail displacement sensor was attached to the rail web to measure the vertical displacement of the turnout rail caused by the adjacent construction excavation. The vertical displacement of the rail was measured using the rail displacement sensor, which measures the displacement of the rail using the tilt angle. The sensor was attached to the rail web to avoid interference with the operation of the turnout tongue rail. Measurements were obtained using an automated measurement system for approximately 640 days, from the pre-excavation stage to the completion of the underground structure. The automated measurement is shown in Figure 8.
2.5. Automatic Level Measurement (Sleeper Vertical Displacement)
In this study, targets were installed at both ends of the sleepers, and their vertical displacements were measured using the automatic level measurement to identify the displacement behavior of the turnout due to ground behavior during the adjacent excavation. Measurements were performed using an automated measurement system for approximately 640 days from the pre-excavation stage to the completion of the underground structure. The long-term sleeper displacement was interpreted by separating the response during the principal excavation stages from the subsequent time-dependent response observed after the major excavation activities. Because the monitoring period extended to the completion of the underground structure, the latter response was not interpreted exclusively as creep, but rather as a combined time-dependent response including ground stress redistribution, ballast rearrangement, and subsequent structural construction effects. To measure the vertical displacement of the turnout sleepers due to the ground behavior during the adjacent excavation work, measurement points were fixed at major turnout locations, as shown in Figure 9.
Figure 9.
Automatic level measurement location map.
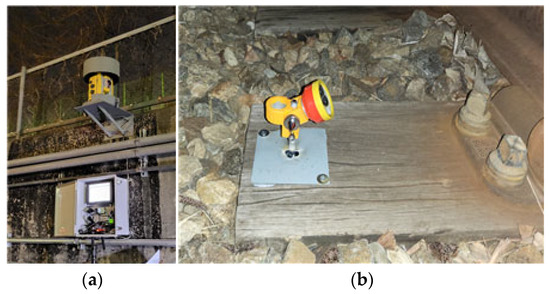
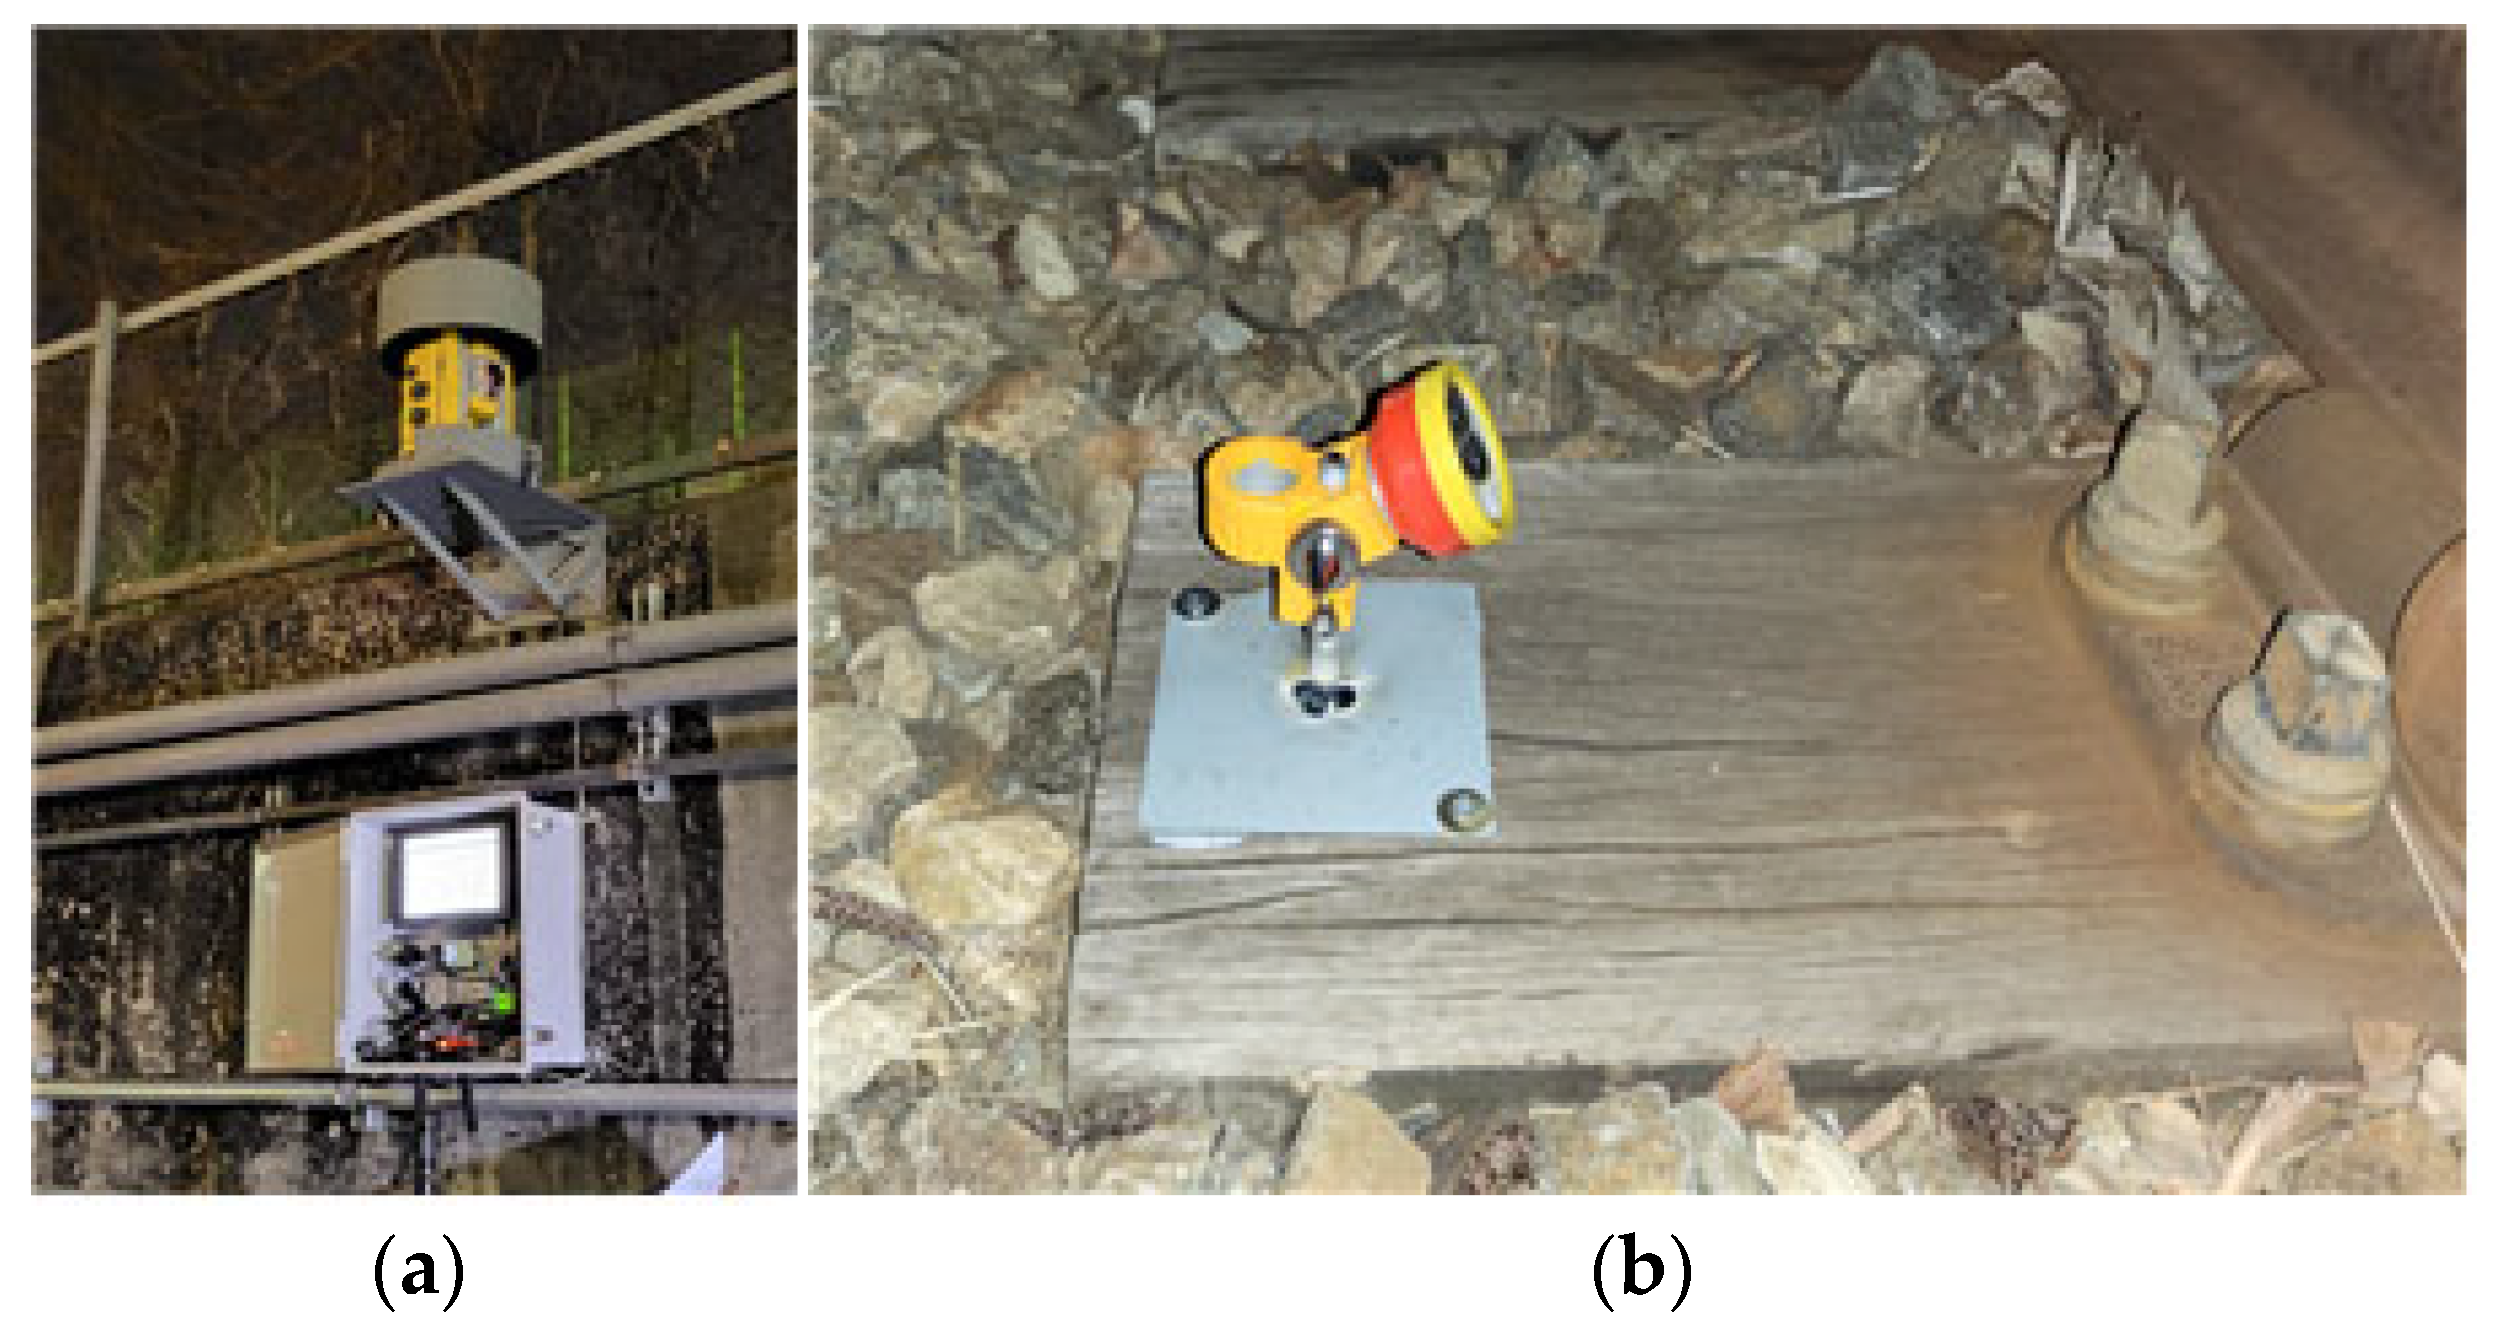
The automatic level measurement was installed at the top of the retaining wall, as shown in Figure 10a.
Figure 10.
Installation of (a) automatic level measurement and (b) level measurement target.
The target was installed at both ends of seven sleepers for each turnout, as shown in Figure 10b, resulting in its installation at a total of 28 locations. After measuring the coordinates of the turnout sleepers by treating the automatic level measurement installation location as an absolute value, they were compared with the initial coordinates to calculate the displacement amount. For the three-dimensional representation of the turnout deformation, each automatic level monitoring point was assigned its corresponding plan position along the turnout, and the vertical displacement at each point was calculated as the elevation difference between the analyzed construction stage and the initial pre-excavation reference condition. The measured vertical displacement was then plotted as the vertical component at the corresponding sleeper location. Thus, the three-dimensional representation was constructed directly from the measured spatial coordinates and vertical displacement values of the monitored sleepers. No spatial interpolation was performed between adjacent measurement points. Because only a limited number of representative sleeper locations were monitored, interpolation of the unmeasured ballast or sleeper deformation was intentionally avoided to prevent the generation of artificial deformation gradients. Accordingly, the resulting three-dimensional representation should be interpreted as a measured-point-based spatial visualization rather than as a continuous structural deformation model. Based on these monitoring procedures, the measured data from the track master system, rail displacement sensors, and automatic leveling system were subsequently analyzed to evaluate the spatial and temporal deformation characteristics of the turnout. The corresponding measurement results are presented separately in Section 3, whereas their comparative interpretation and engineering implications are discussed in Section 4. Because the primary objective of the field monitoring was to identify safety-relevant localized deformation of an operational turnout, the quantitative evaluation focused on the maximum settlement and heave, displacement range, differential displacement between critical locations, temporal displacement change, and exceedance of the applicable management criteria. Mean values and dispersion statistics across different locations were not adopted as the principal assessment indices because spatial averaging may obscure localized deformation at structurally critical turnout components.
3. Multi-Measurement-Based Field Monitoring
3.1. Track Measurement Results
3.1.1. Measurement Results for Longitudinal-Level Irregularity
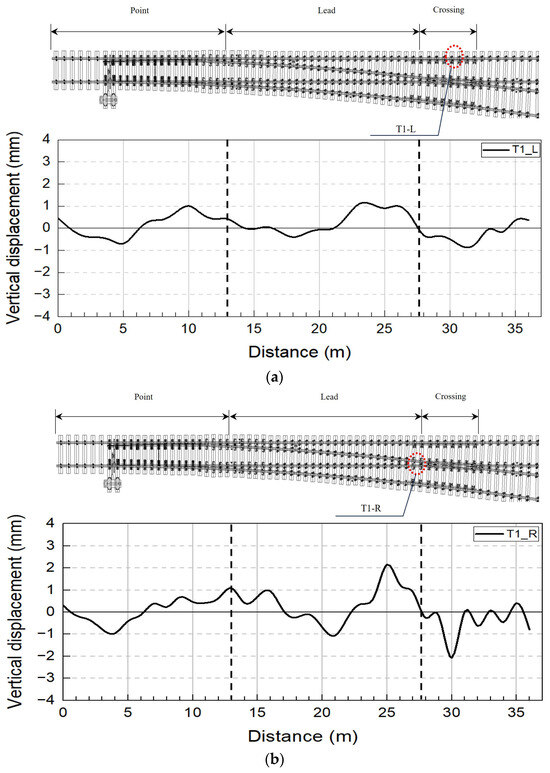
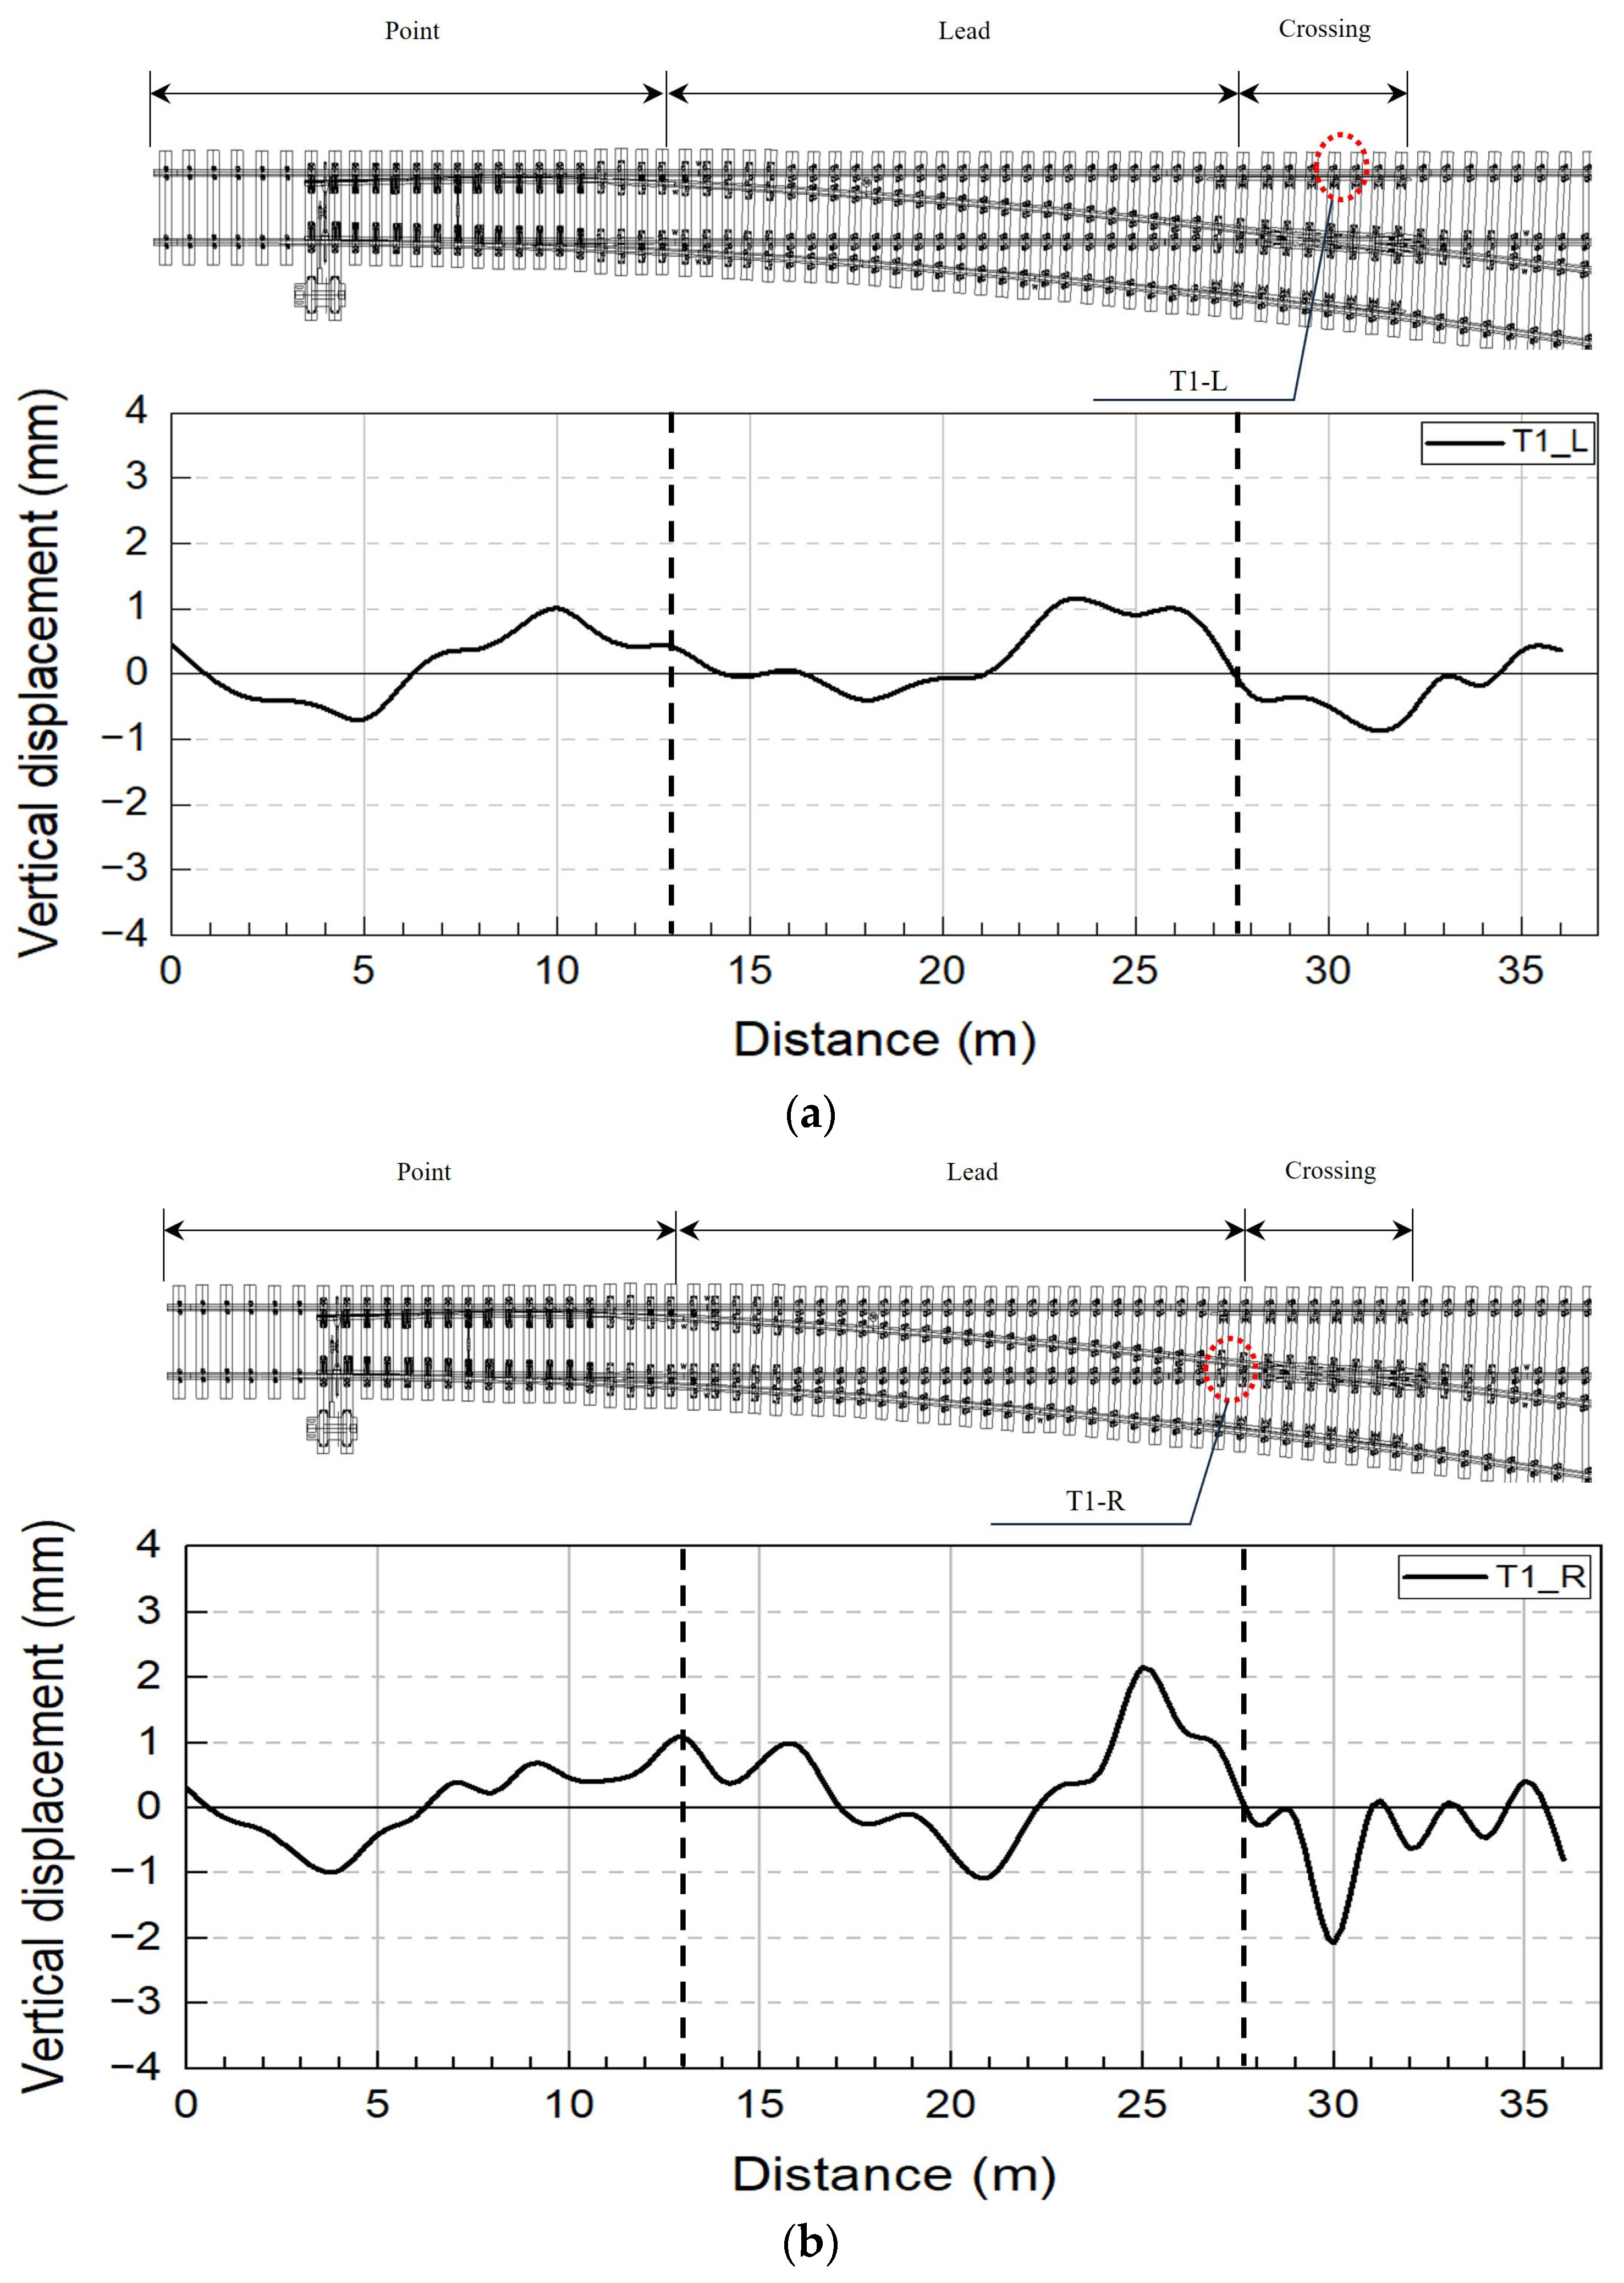
The longitudinal-level irregularity of the T1 track was analyzed using the track master system, with the displacement behaviors of the left and right rails illustrated in Figure 11. The results demonstrate that the rail displacements remained within the management standard while exhibiting complex, multi-directional deformation characterized by concurrent subsidence and uplift across different turnout parts. The vertical dashed lines in the graph denote the boundaries between the point, lead, and crossing sections of the turnout.
Figure 11.
Longitudinal-level irregularity measurement results from the track master system (T1 track): (a) left rail and (b) right rail.
The turnout displacements before and after construction were analyzed using the track master system. The maximum longitudinal-level irregularity of the T1 track was measured to be −0.836 mm for the left rail and −2.074 mm for the right rail, as shown in Figure 11a and Figure 11b, respectively. These values remained within the 9 mm track geometry management criterion for longitudinal-level irregularity specified [18,20]. In addition, the maximum longitudinal-level irregularity was found to occur at the crossing part for both the left and right rails, as shown in Figure 11. An examination of the spatial distribution of the displacement revealed that subsidence occurred at the point and crossing parts, where the tongue rail is located, and a maximum uplift of +2.152 mm was observed at the rear end of the lead part. In particular, in the case of the right rail, the uplift of the lead part (25 m point) and subsidence of the crossing part (30 m point) occurred simultaneously, indicating complex deformation characteristics in the longitudinal and lateral directions.
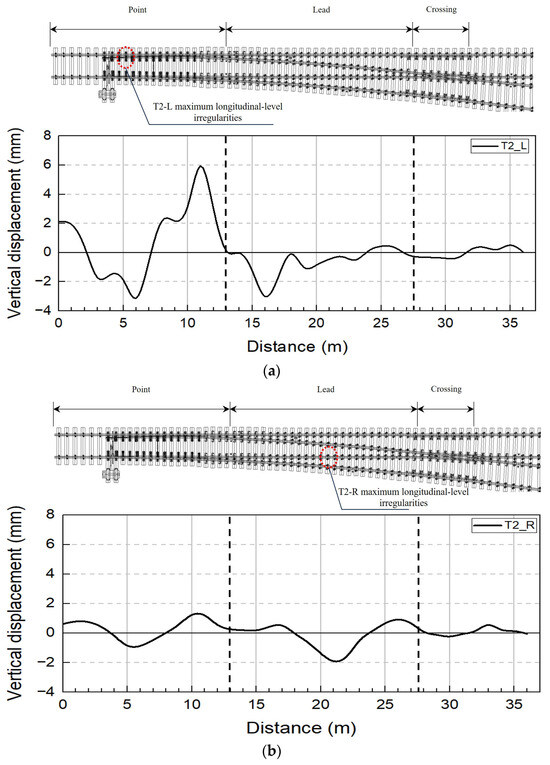
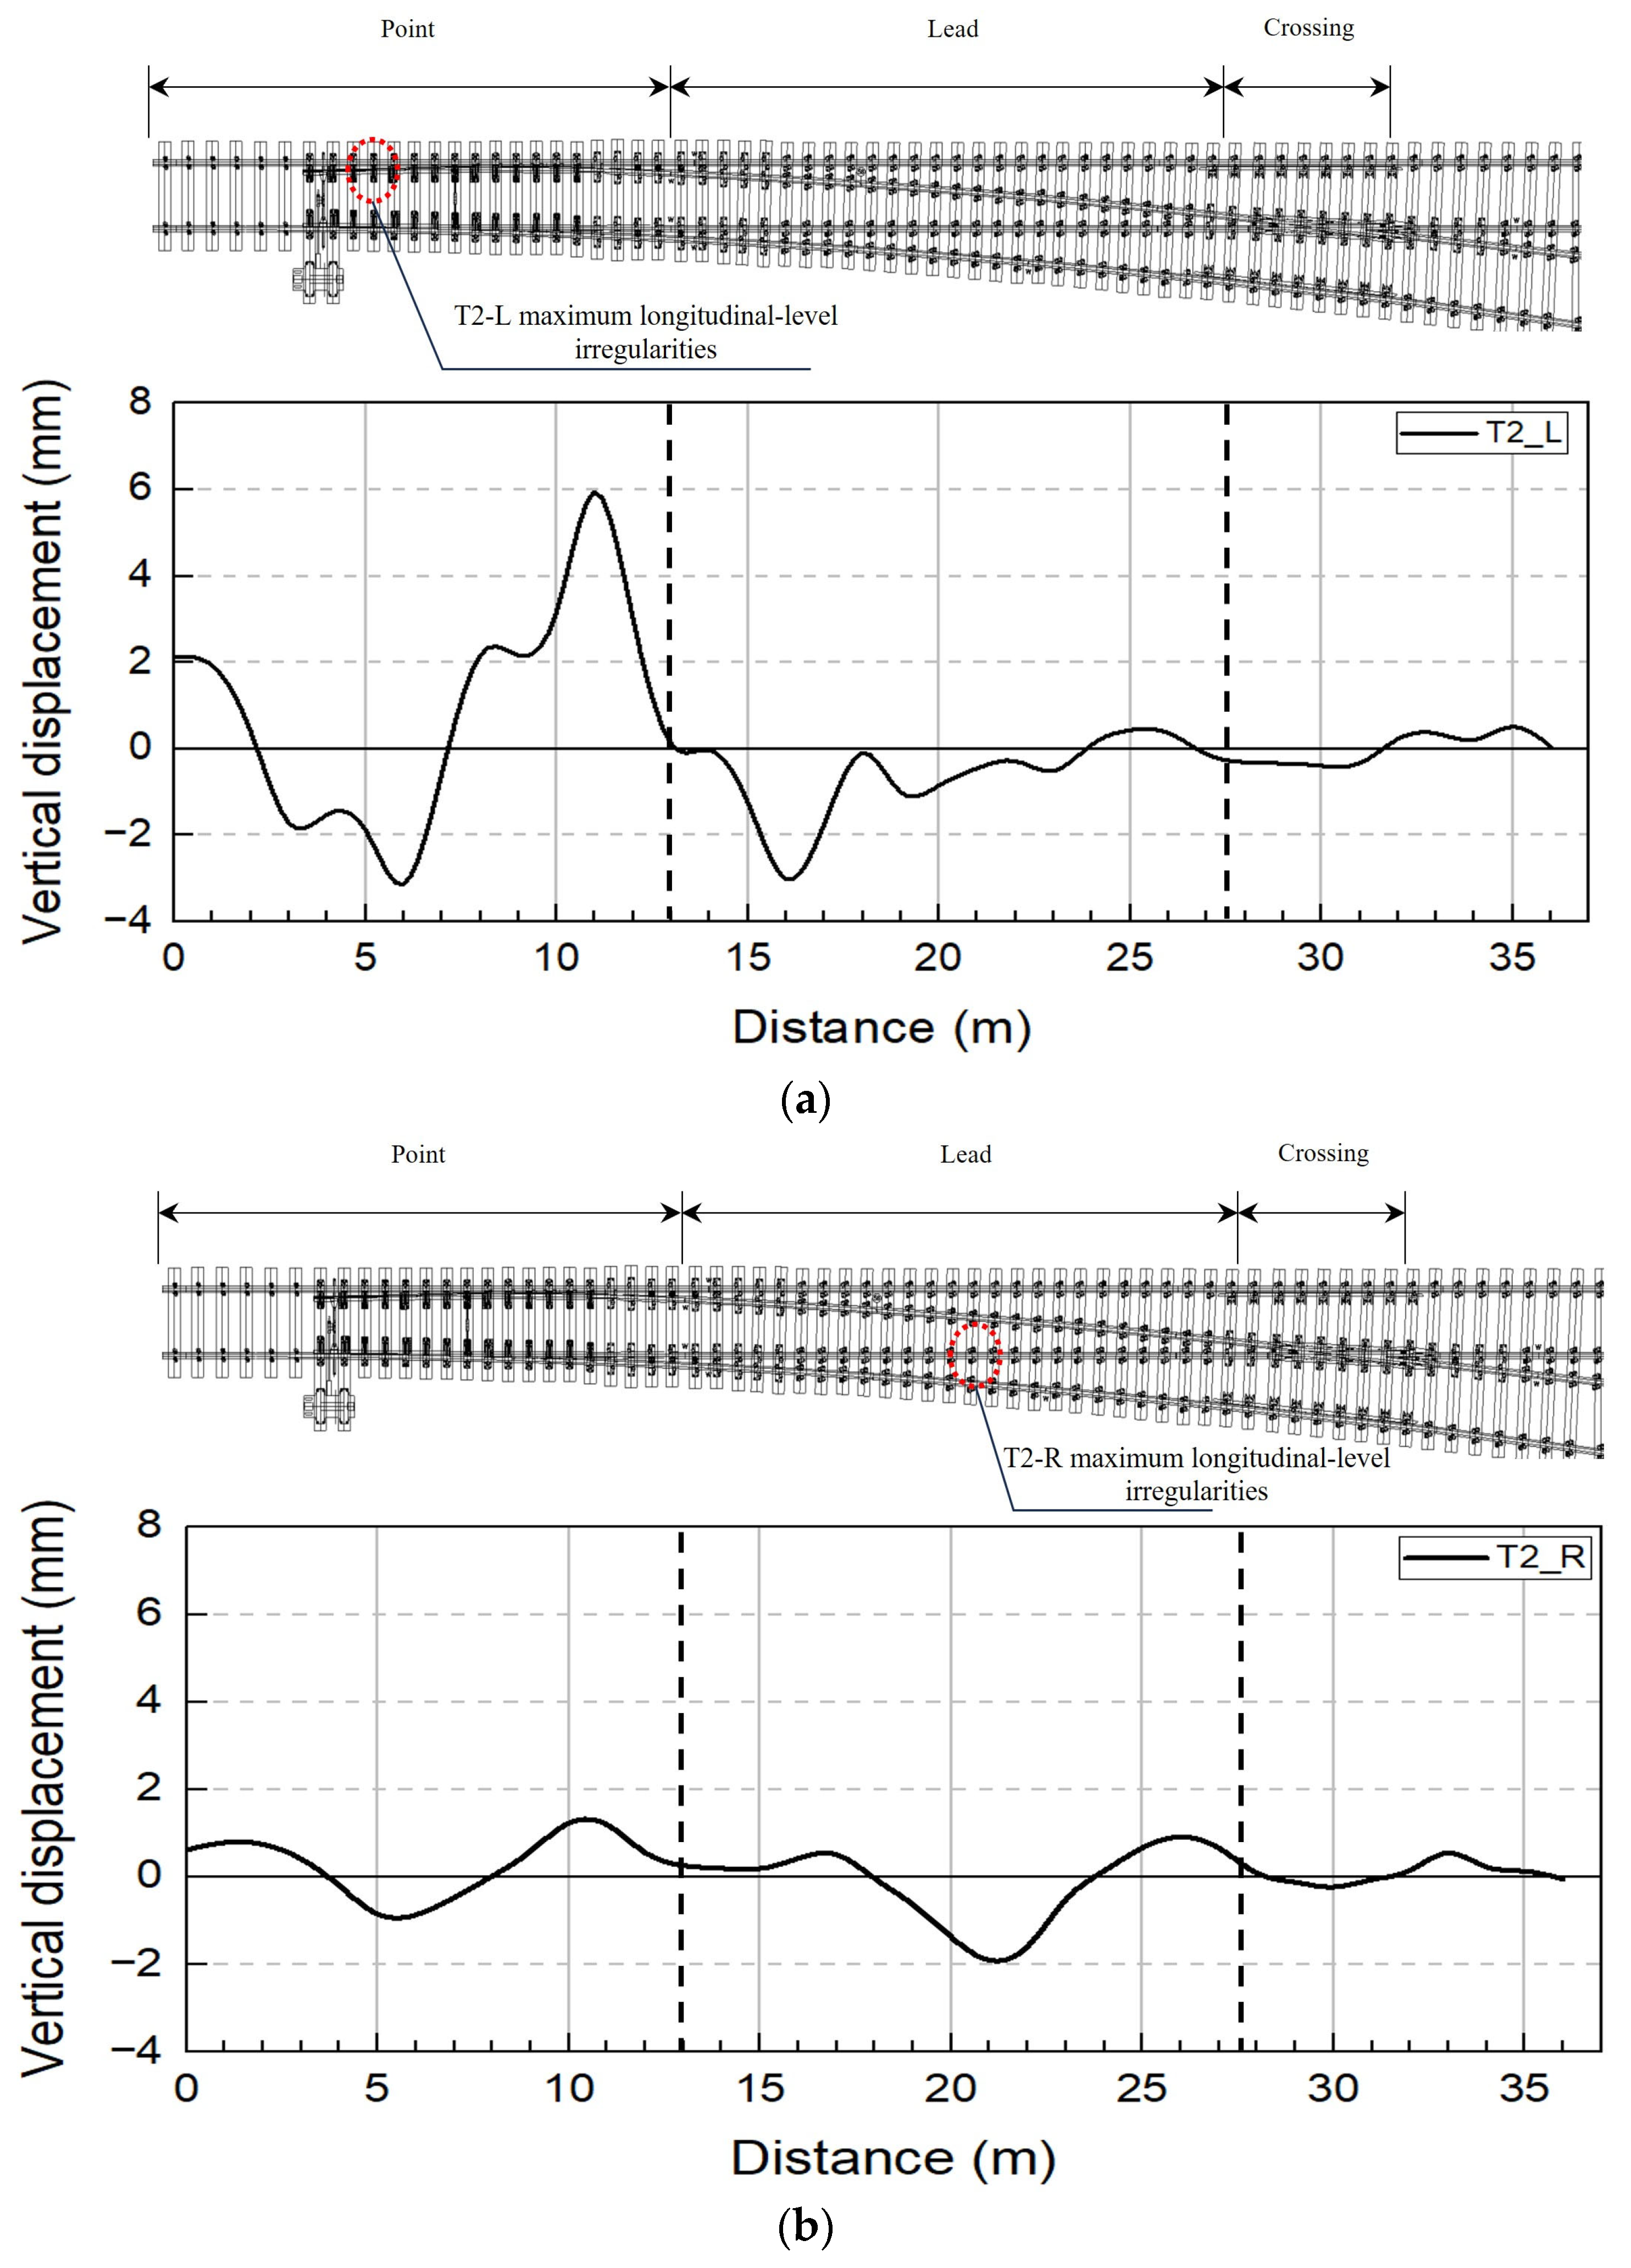
Figure 12a,b show the longitudinal-level irregularity measurement results for the T2 track. It can be seen that the maximum longitudinal-level irregularity was −3.125 mm for the left rail and −1.904 mm for the right rail. The locations of the maximum longitudinal-level irregularity were found to be 6 m from the end of the turnout (point part) for the left rail and 21 m (lead part) for the right rail. In particular, the left rail exhibited a large displacement amplitude of 9.069 mm, with the maximum subsidence (−3.125 mm) and maximum uplift (5.944 mm) adjacent to each other. In addition, a vertical step of approximately 9 mm was formed within a short section of approximately 5 m, indicating that the dynamic impact load is very likely to increase during train travel. The maximum displacement amplitude was concentrated at the rail joint installation point connecting the point and lead parts. This appears to be because the discontinuity of the part intensified the deflection caused by the ground deformation.
Figure 12.
Longitudinal-level irregularity measurement results from the track master system (T2 track): (a) left rail and (b) right rail.
3.1.2. Measurement Results for Cross-Level Irregularity
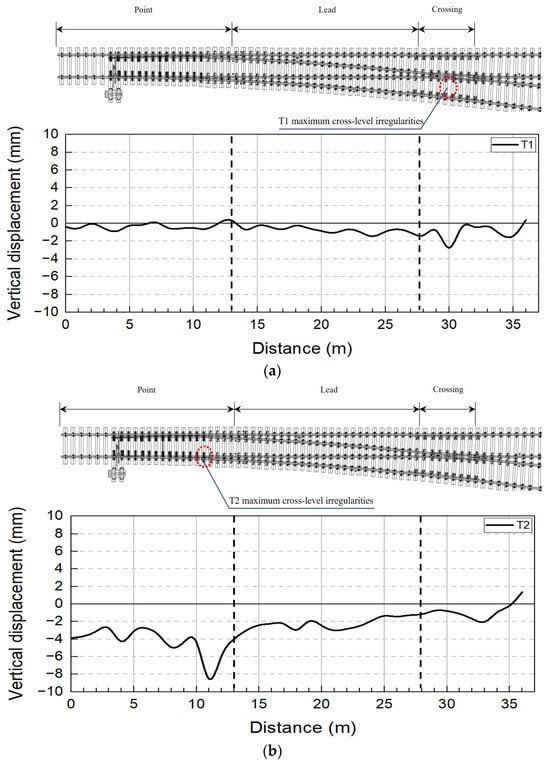
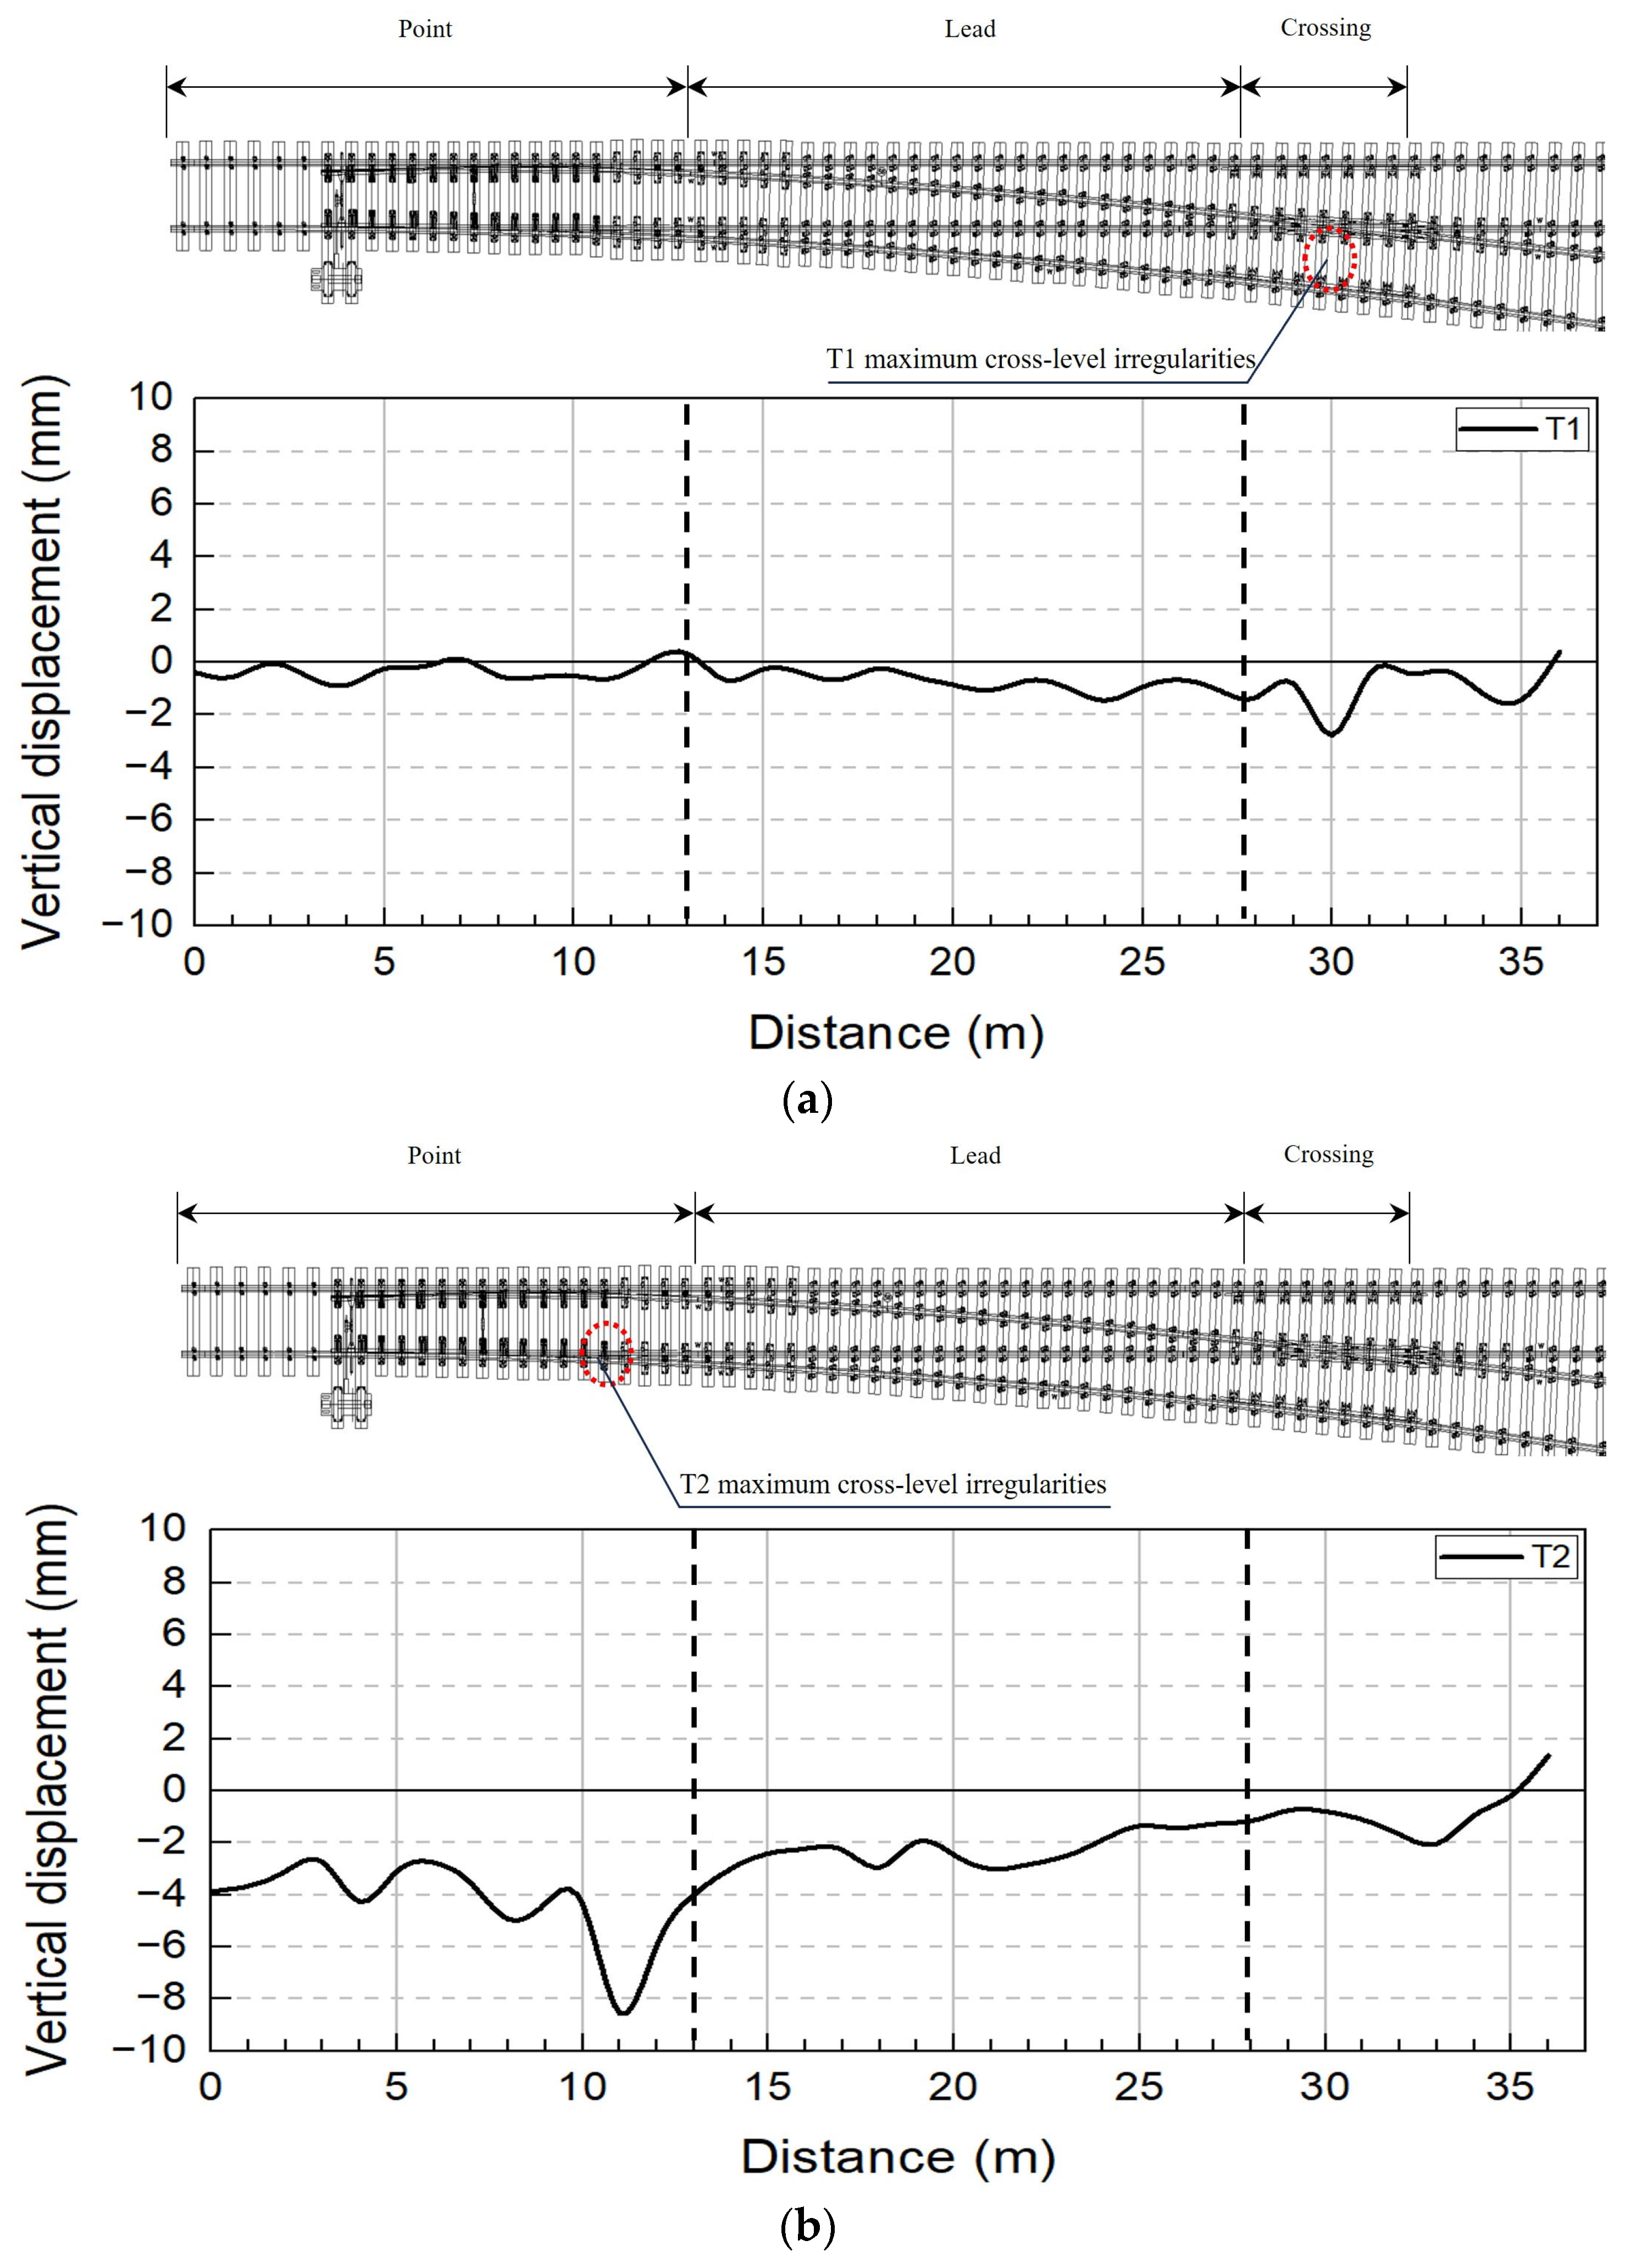
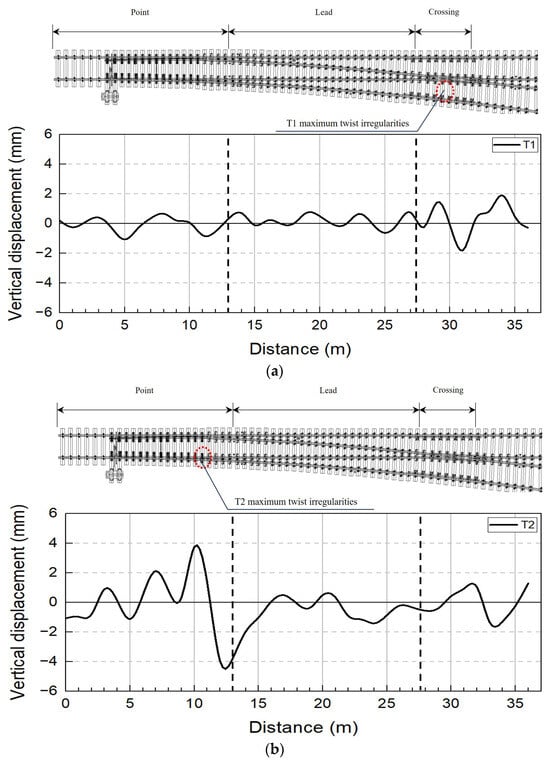
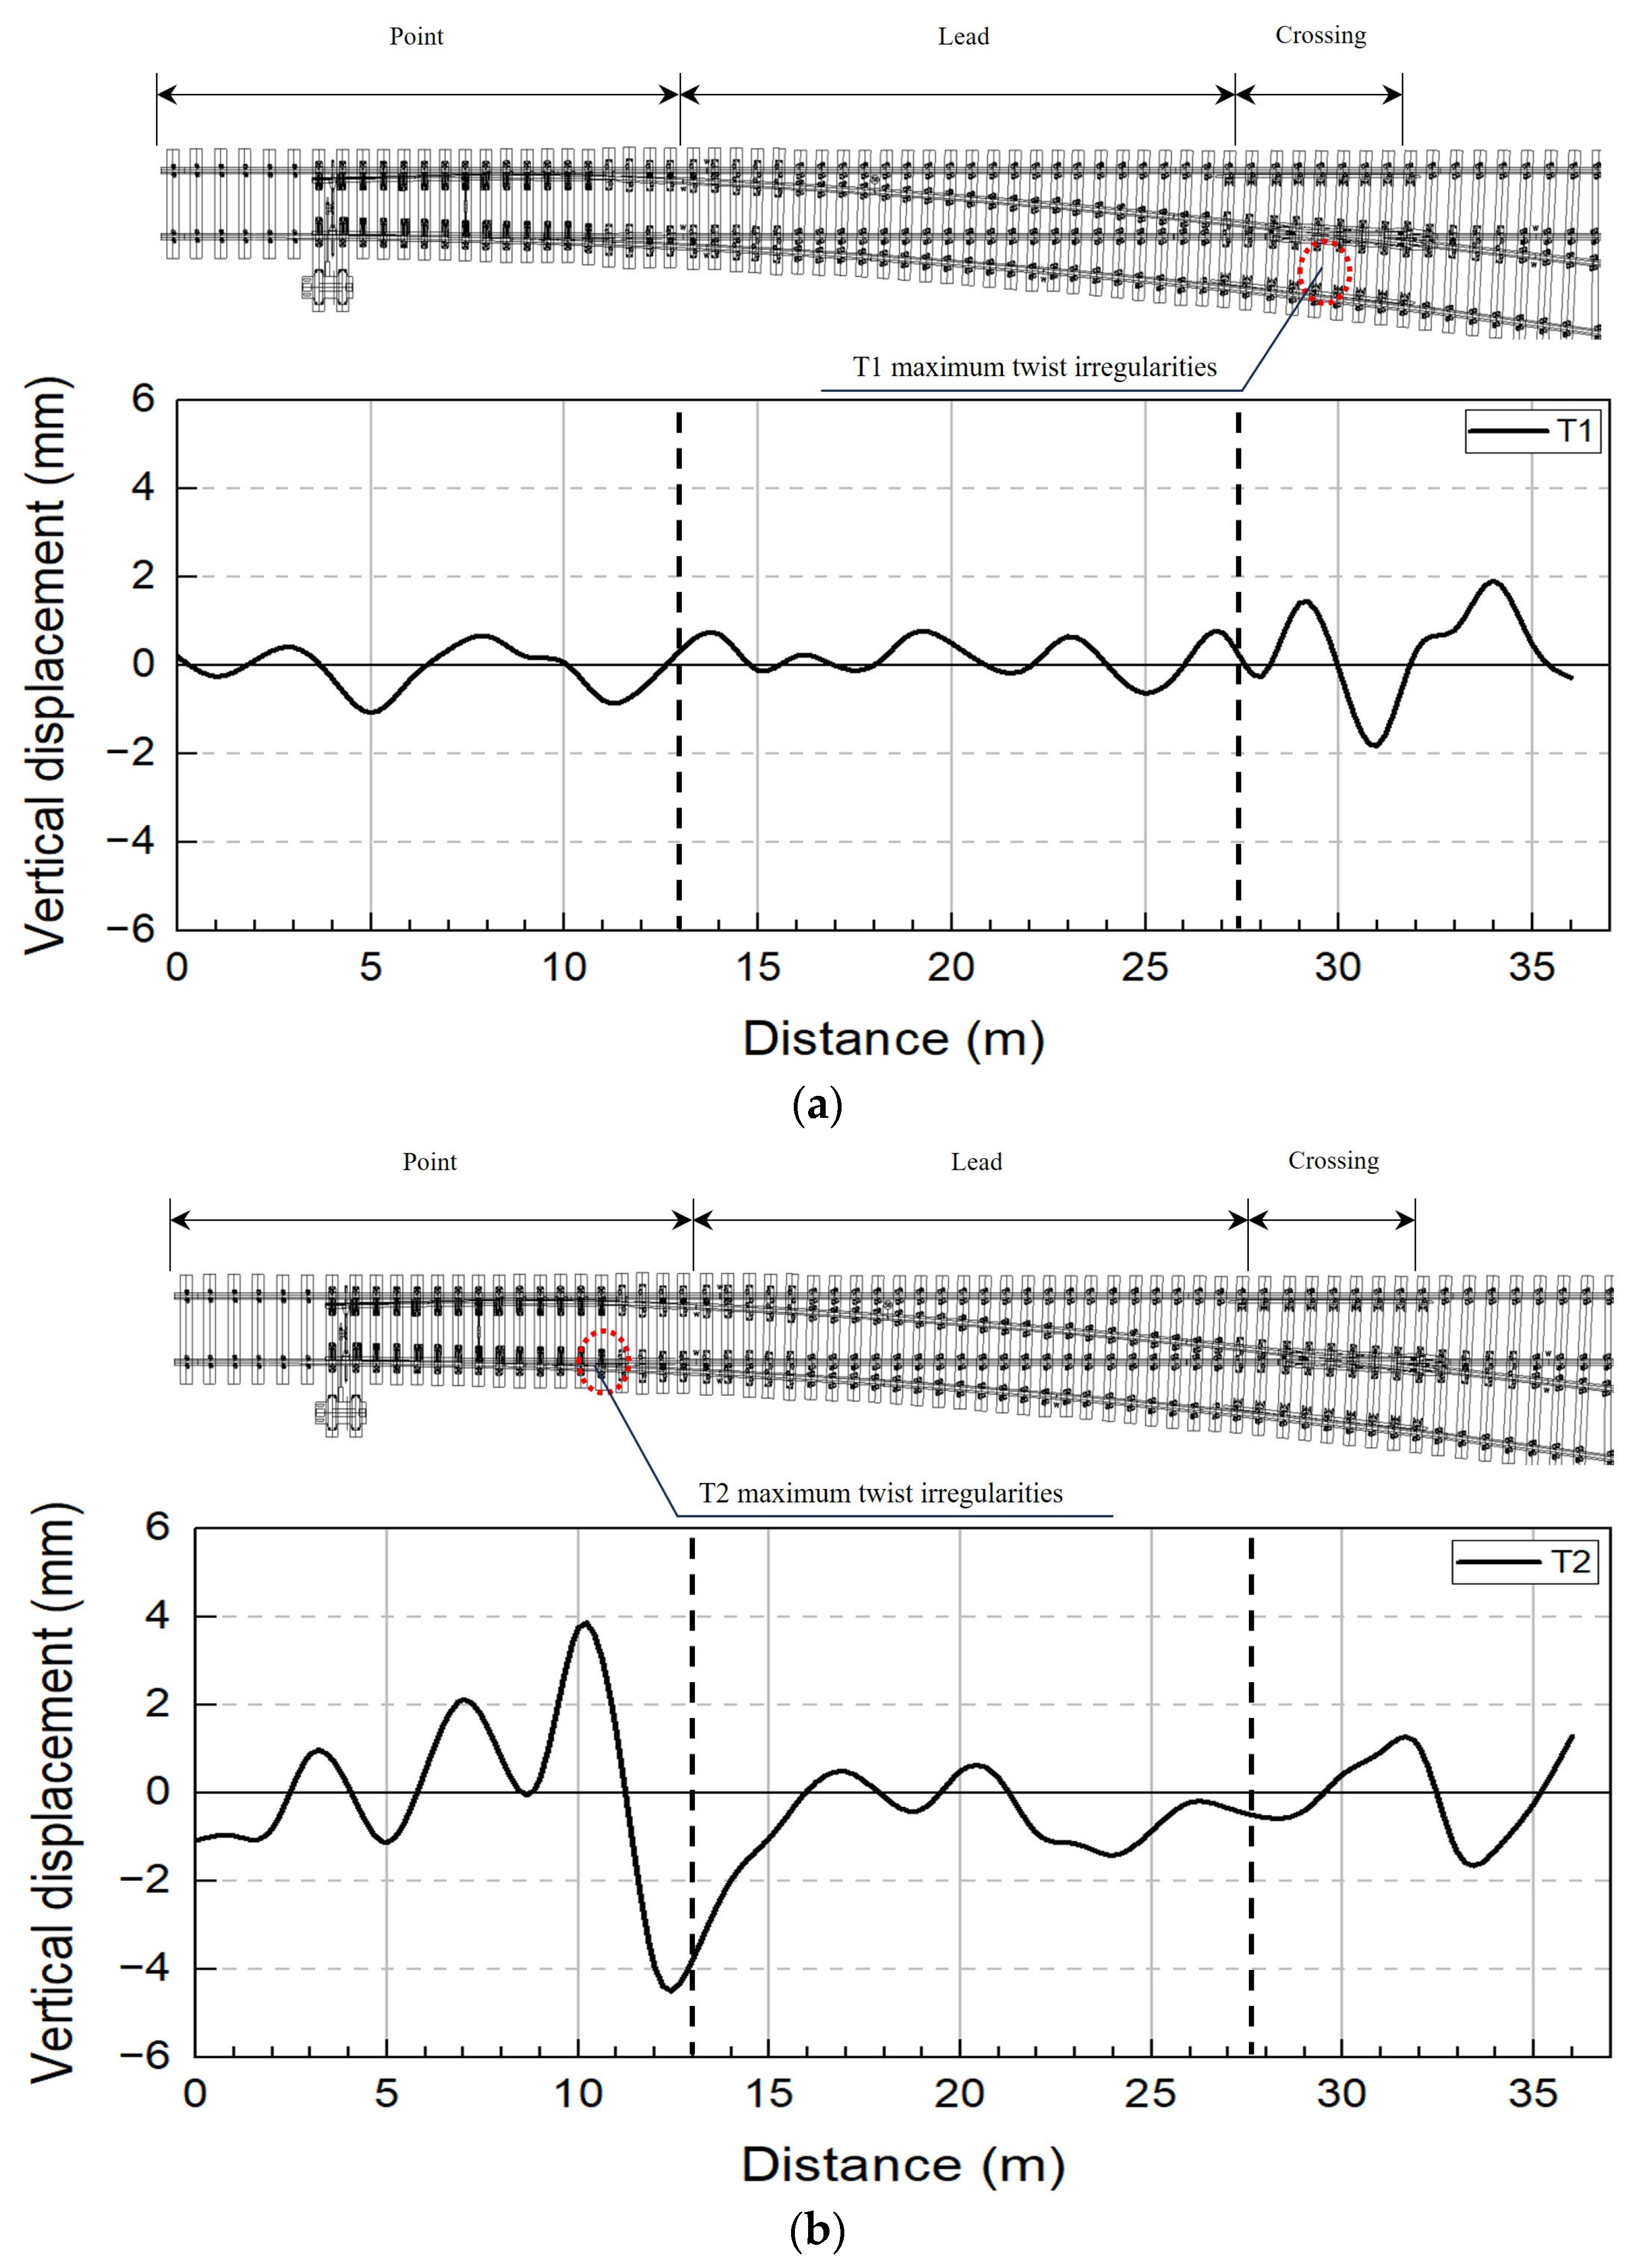
The cross-level and twist irregularities of the T1 and T2 tracks were analyzed using the track master system, as illustrated in Figure 13 and Figure 14.
Figure 13.
Cross-level irregularity measurement results from the track master system (T1 and T2 tracks): (a) T1 track and (b) T2 track.
Figure 14.
Twist irregularity measurement results from the track master system (T1 and T2 tracks): (a) T1 track and (b) T2 track.
Figure 13a,b show the cross-level irregularity measurement results for the T1 and T2 tracks. The maximum cross-level irregularity was found to be −2.752 mm for the T1 track and −8.546 mm for the T2 track. The maximum cross-level irregularities of the T1 and T2 tracks remained within the applicable 9 mm track geometry management criterion [18,20]. Regarding the deformation characteristics of the T1 track, the maximum subsidence was observed at the crossing part, together with subsidence of the tongue rail section. This appears to be due to the rail joint at the crossing part degrading the structural continuity by decreasing the restraining effect of the rail under sleeper displacement. The subsidence at the tongue rail of the point part and the maximum subsidence at the rear end of the point part were confirmed as T2 track deformation characteristics. Subsequently, a heave of 1.354 mm occurred at the rear end of the crossing. In particular, a sharp vertical step of 9.90 mm was formed between the maximum subsidence and heave points, thus maximizing the displacement amplitude.
In the measurement results from the track master, the maximum twist irregularities of the T1 and T2 tracks were −1.807 and −3.952 mm, as shown in Figure 14a and Figure 14b, respectively. The maximum twist irregularities of the T1 and T2 tracks remained within the applicable 9 mm track geometry management criterion [18,20]. The maximum displacement was observed at the crossing part for the T1 track and the point part for the T2 track. In the T2 track, the maximum subsidence (−3.952 mm) occurred at the rear end of the point part, and the subsequent sharp heave behavior extended to the rear end of the crossing part. The total displacement difference, including the maximum heave (3.756 mm), was found to be 7.708 mm.
3.2. Rail Displacement Sensor Measurement Results
3.2.1. Rail Displacement Sensor Measurement Results (T1 Track)
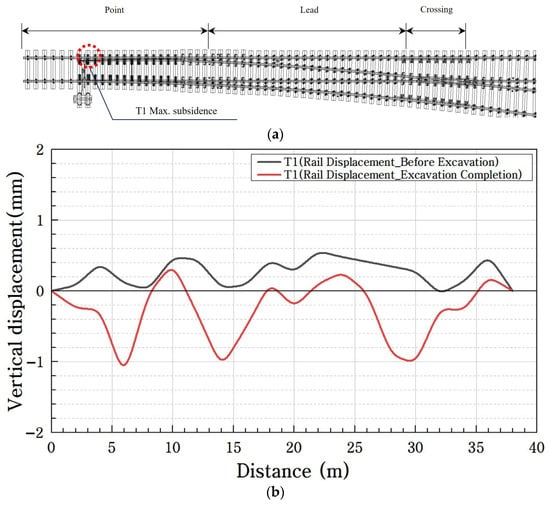
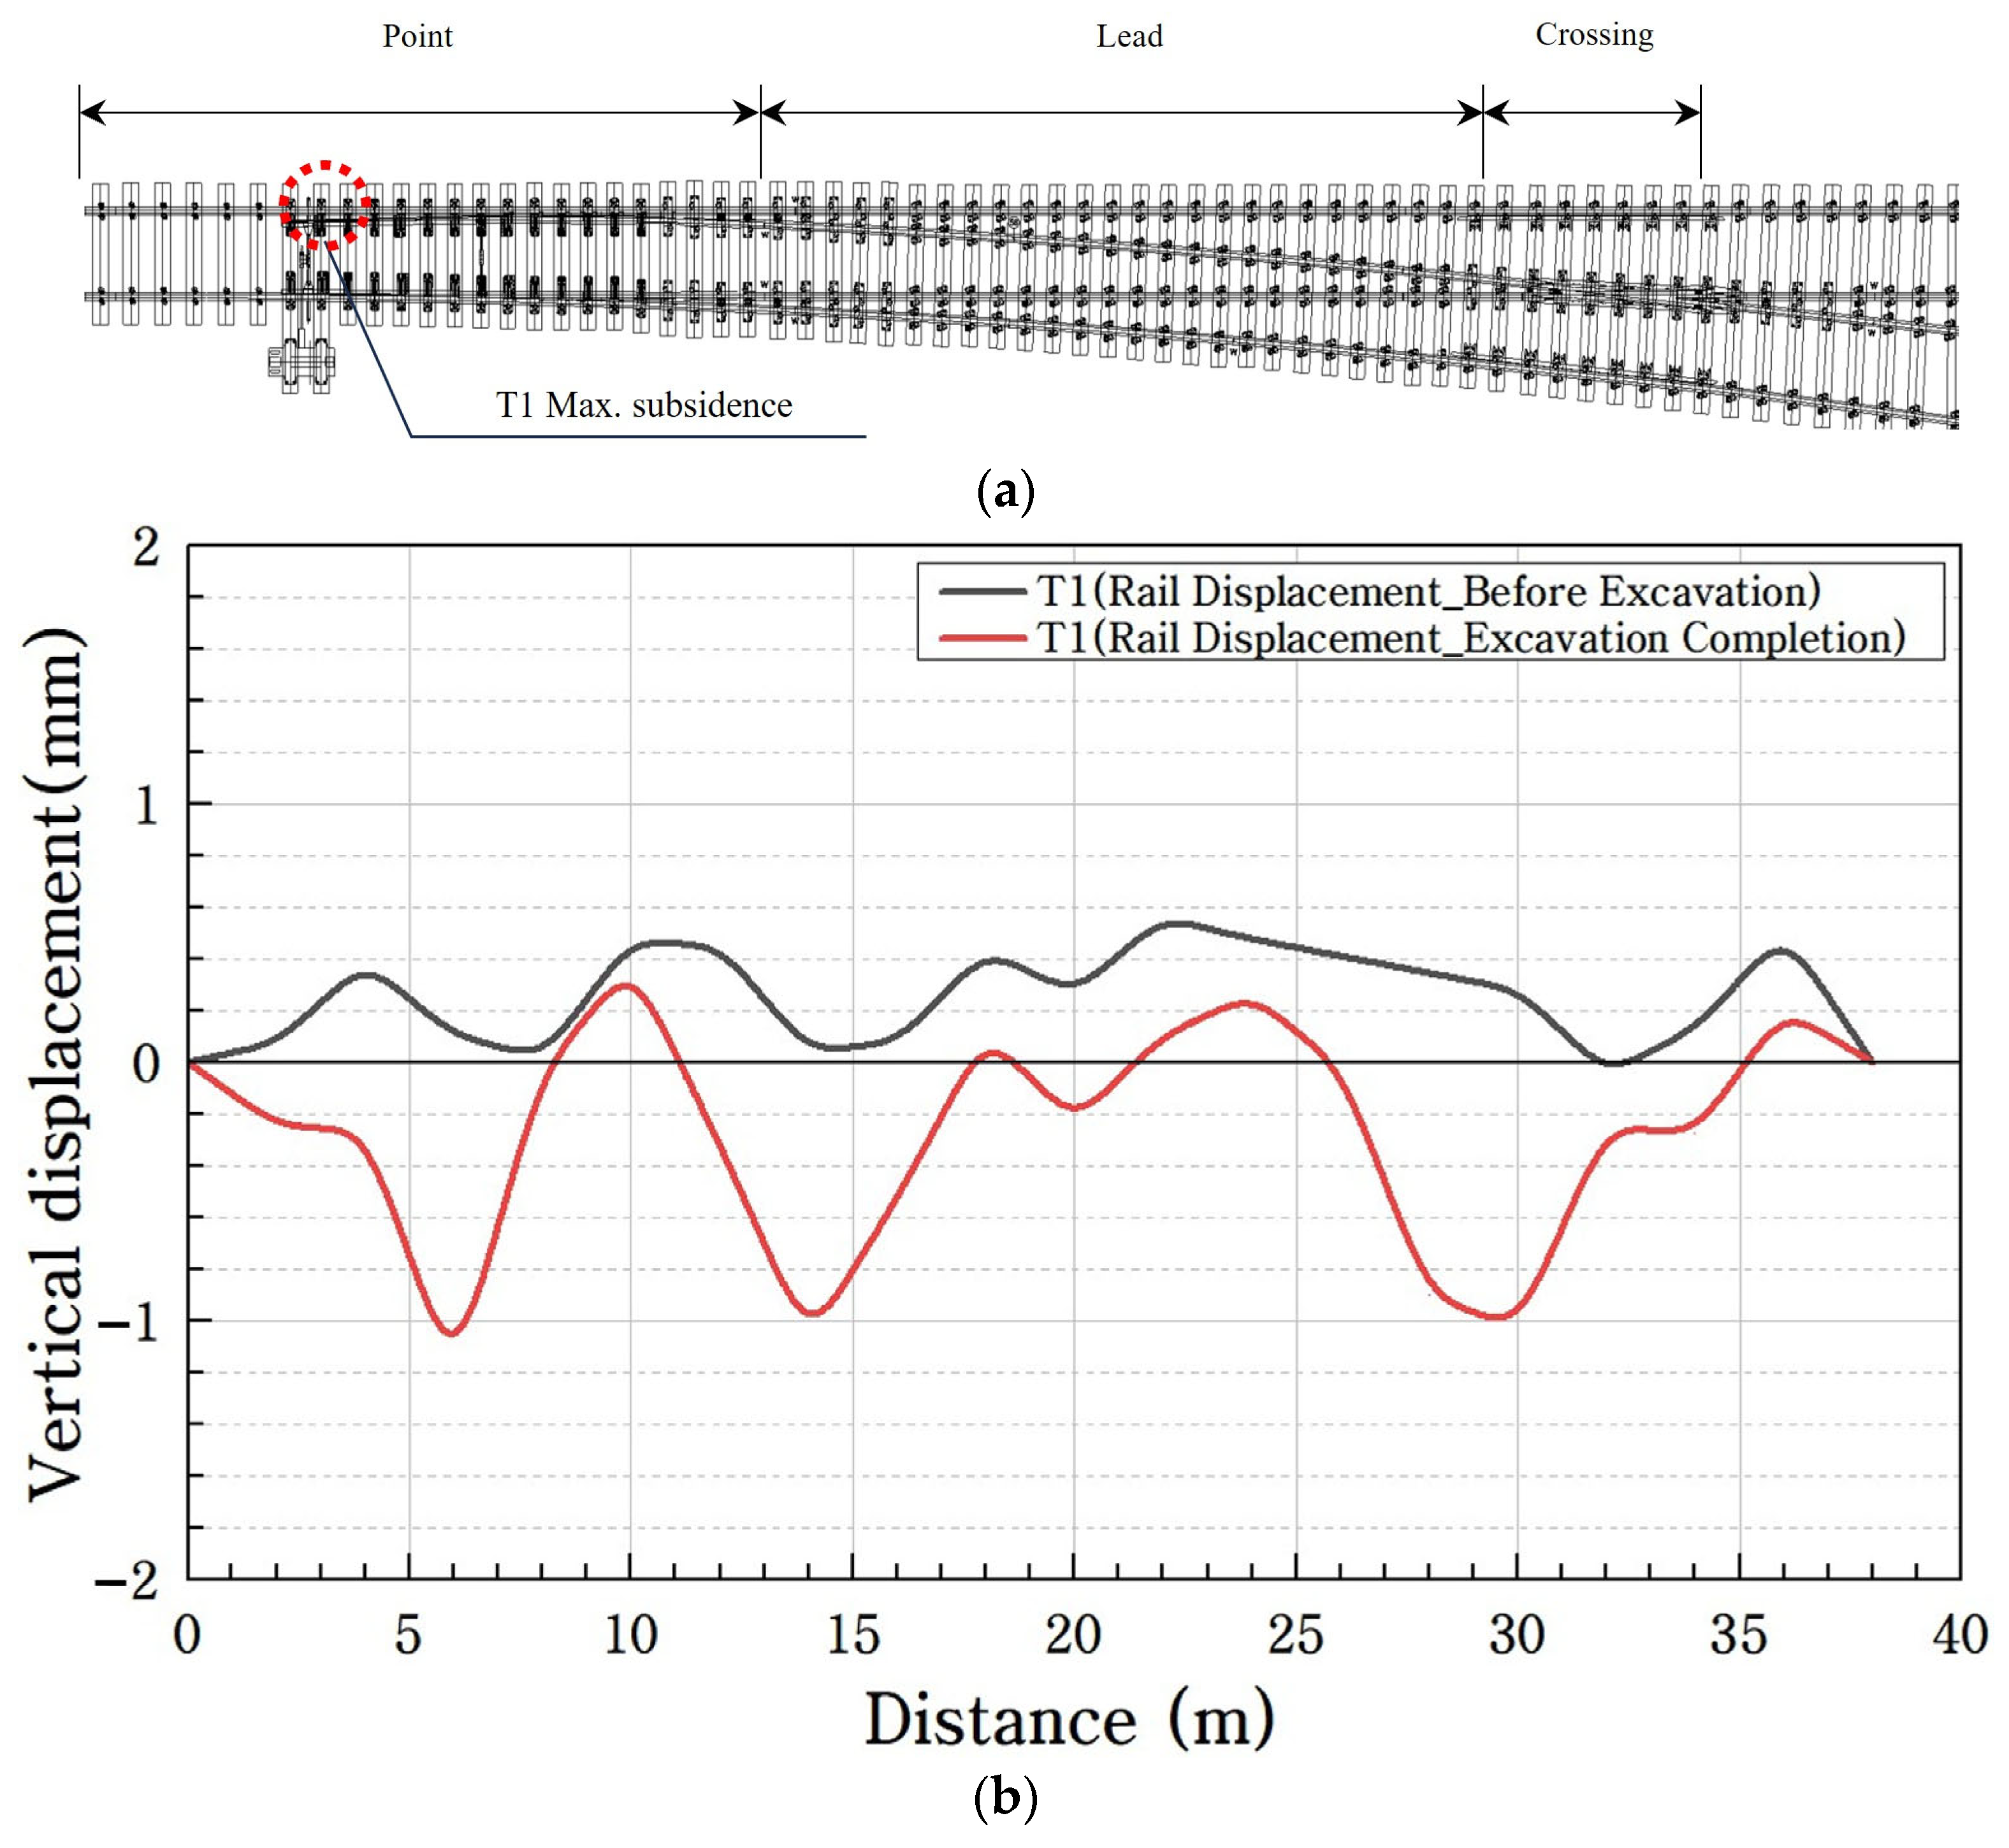
As shown in Figure 15, the vertical displacement of the T1 track rail was evaluated using rail displacement sensors to identify localized deformation characteristics.
Figure 15.
Vertical displacement measurement results from the rail displacement sensor (T1 track): (a) track location map; (b) comparison of measurement results.
Figure 15a shows the rail displacement sensor measurement results for the T1 track. The maximum local vertical rail displacement was −1.23 mm, which remained below the applicable 7 mm rail-displacement monitoring criterion [19,20]. The location of the maximum vertical displacement was found to be the point part, as shown in Figure 15b. A comparison of the displacement values before and after the excavation showed that subsidence occurred at the joints installed at each turnout part. It was found that deflection occurred owing to the insufficient bearing capacity of the sleepers on the left and right sides of the rail joints.
The rail displacement sensor measures the relative displacement of the rail. The vertical displacement measurement results showed subsidence of −1.02 to −1.28 mm. The insignificant displacement confirmed technical limitations in monitoring the behavioral characteristics of the turnout, which operates as a total system.
3.2.2. Rail Displacement Sensor Measurement Results (T2 Track)
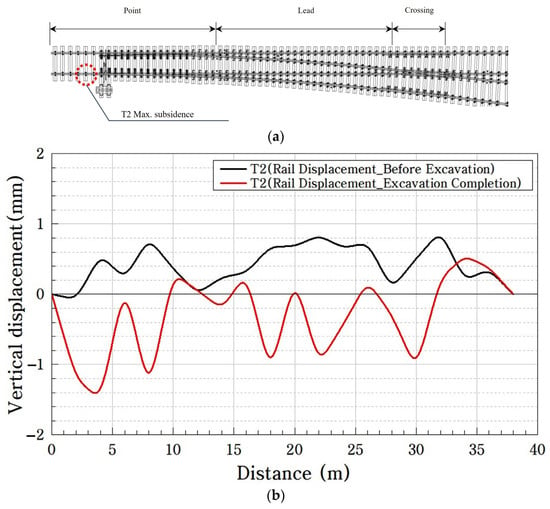
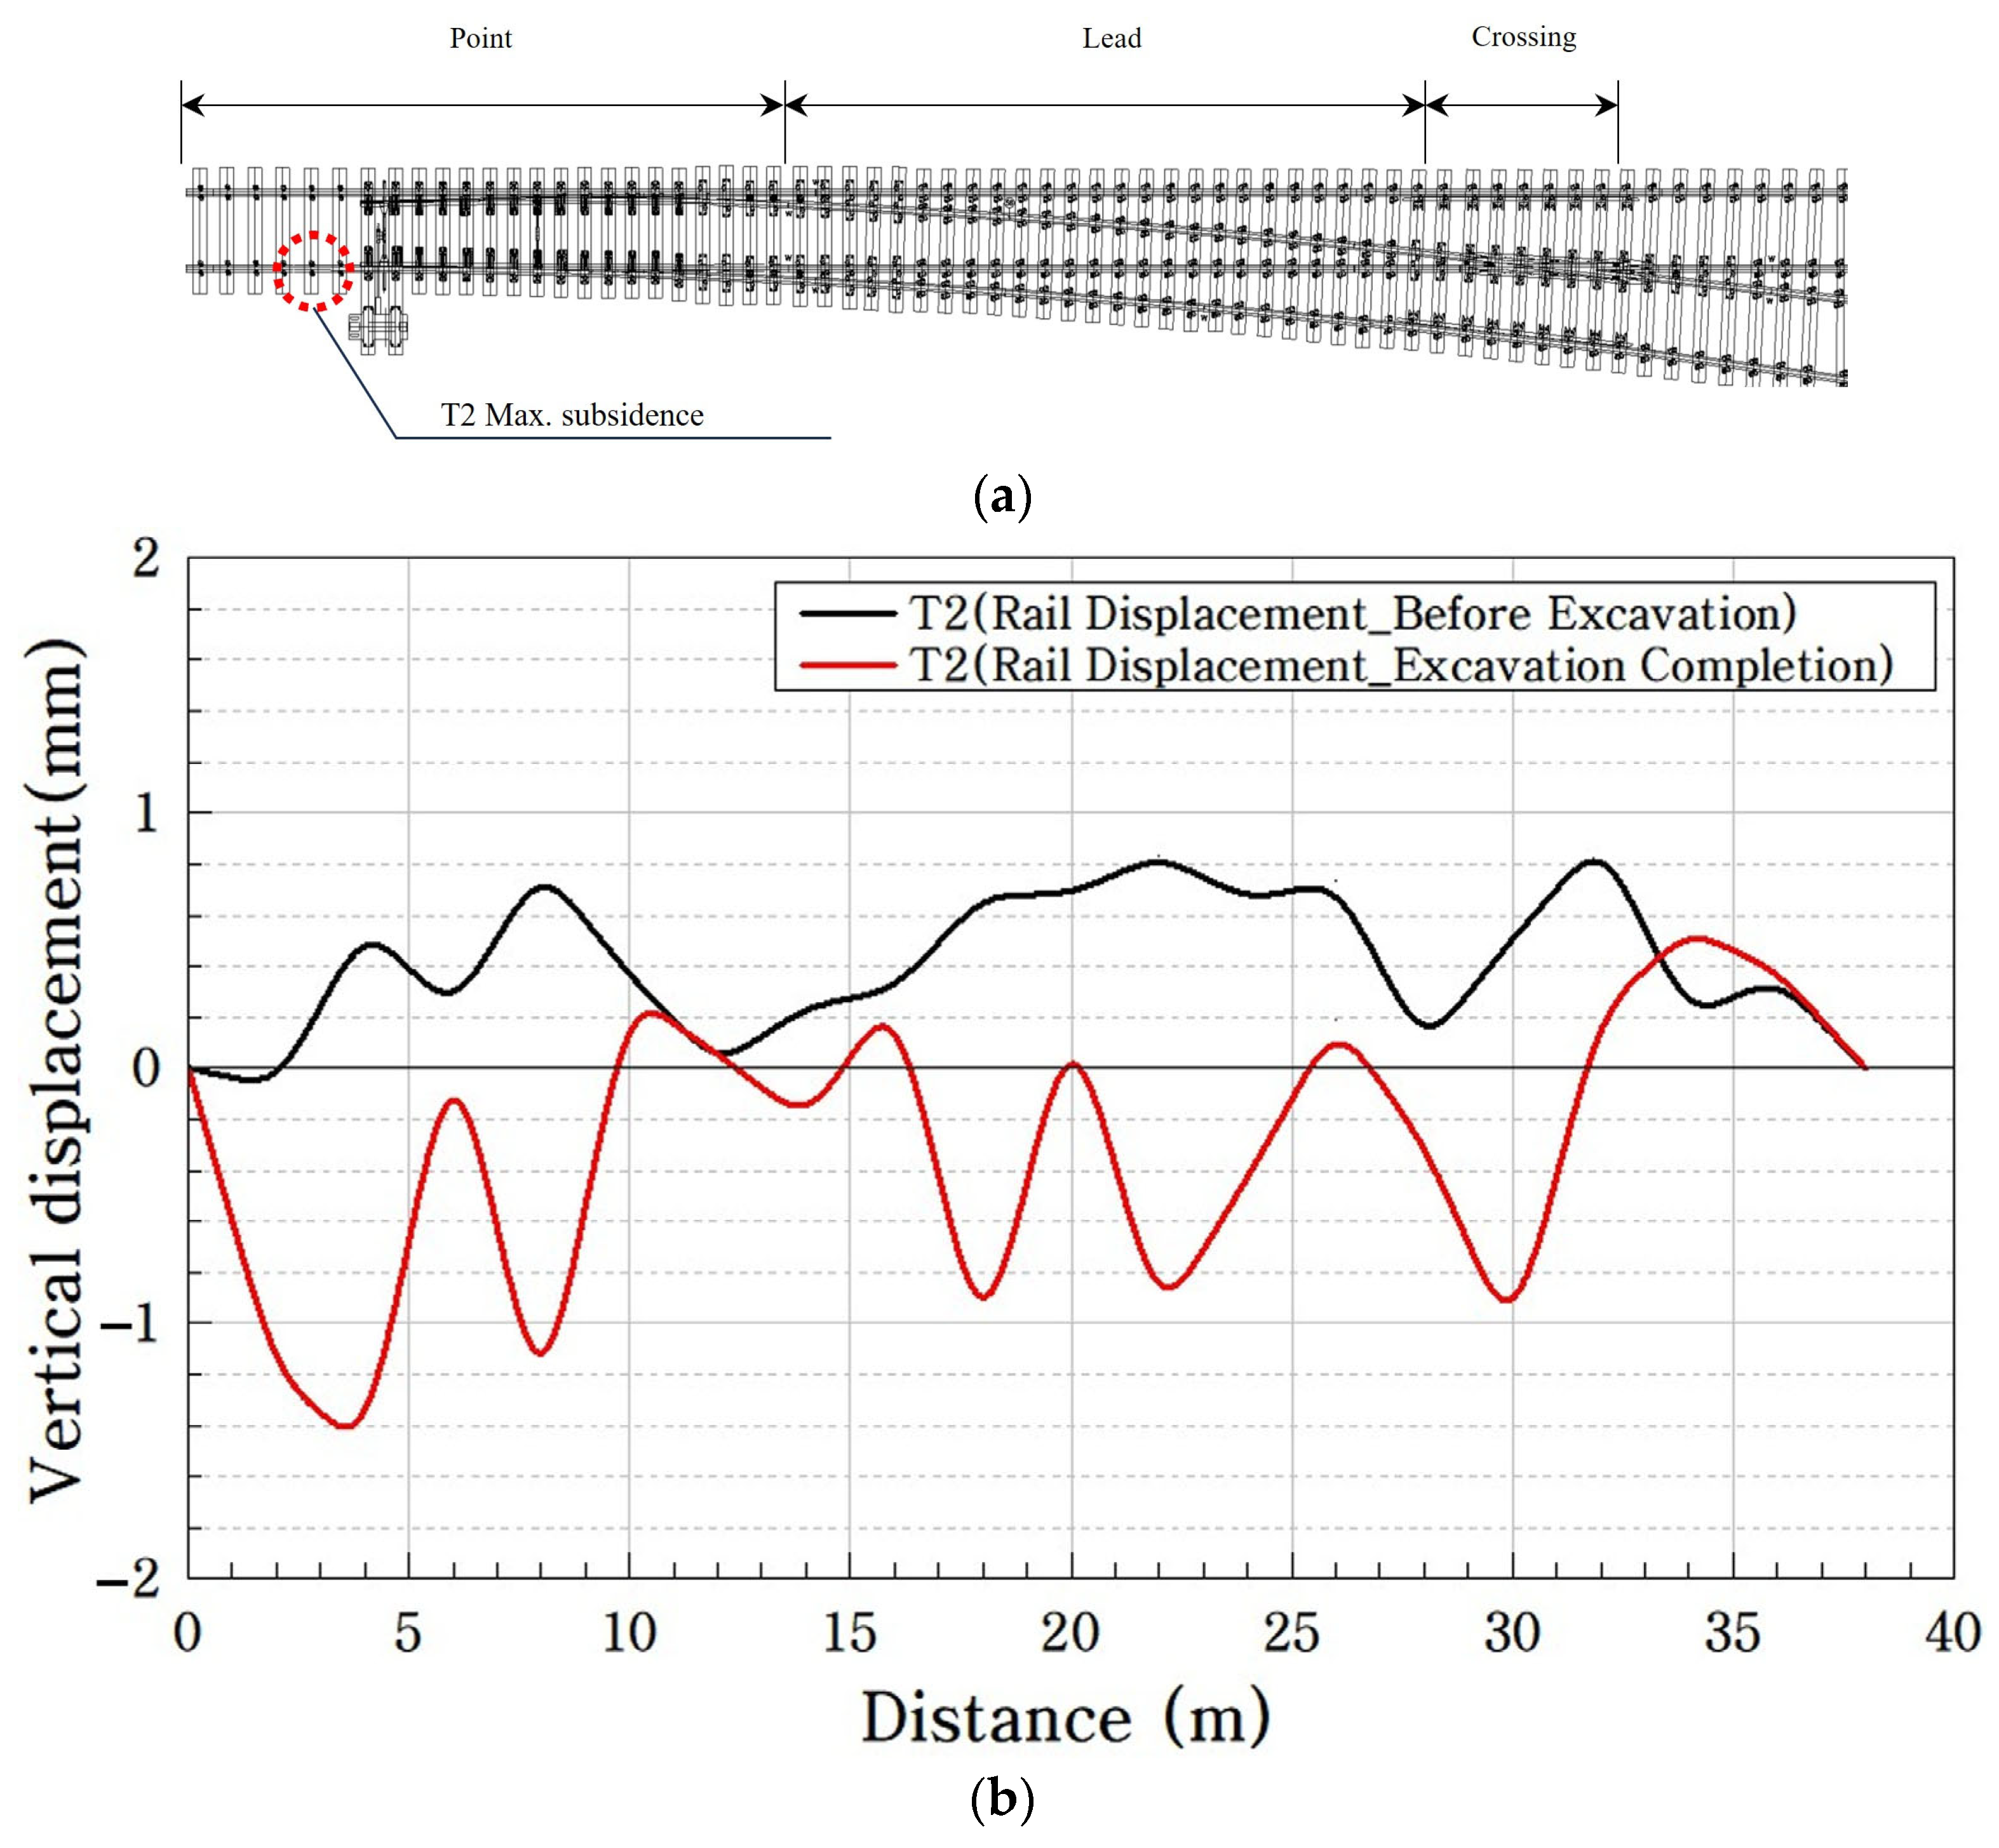
The vertical displacement of the T2 track rail was monitored using rail displacement sensors to evaluate its structural behavior, as illustrated in Figure 16.
Figure 16.
Vertical displacement measurement results from the rail displacement sensor (T2 track): (a) track location map; (b) comparison of measurement results.
Figure 16a shows the rail displacement sensor measurement results for the T2 track. The maximum local vertical rail displacement was −1.5 mm, which remained below the applicable 7 mm rail displacement monitoring criterion [19,20]. The location of the maximum vertical displacement was found to be at the point part, as shown in Figure 16b. The comparison of the displacement values before and after the excavation showed that subsidence occurred at the joints installed for each turnout part. Deflection was caused by the insufficient bearing capacity of the sleepers on the left and right sides of the rail joints. The vertical displacement measurement results showed subsidence of −1.07 to −1.5 mm. The insignificant displacement value confirmed technical limitations in monitoring the behavioral characteristics of the turnout, which operates as a total system.
3.3. Automatic Level Measurement Results
3.3.1. Automatic Level Measurement Results (T1 Track)
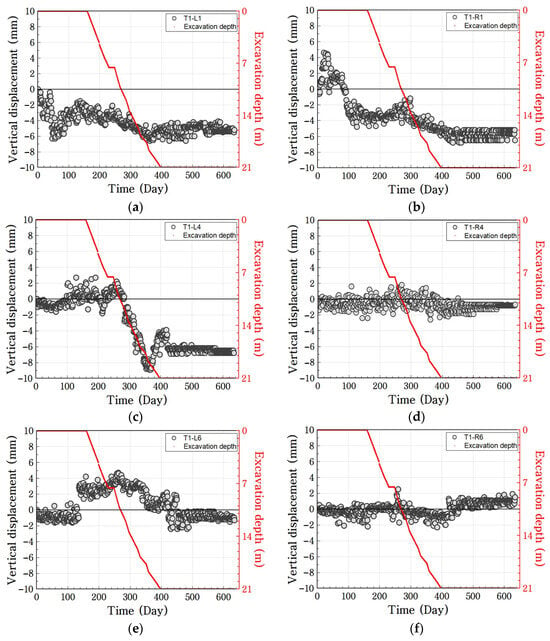
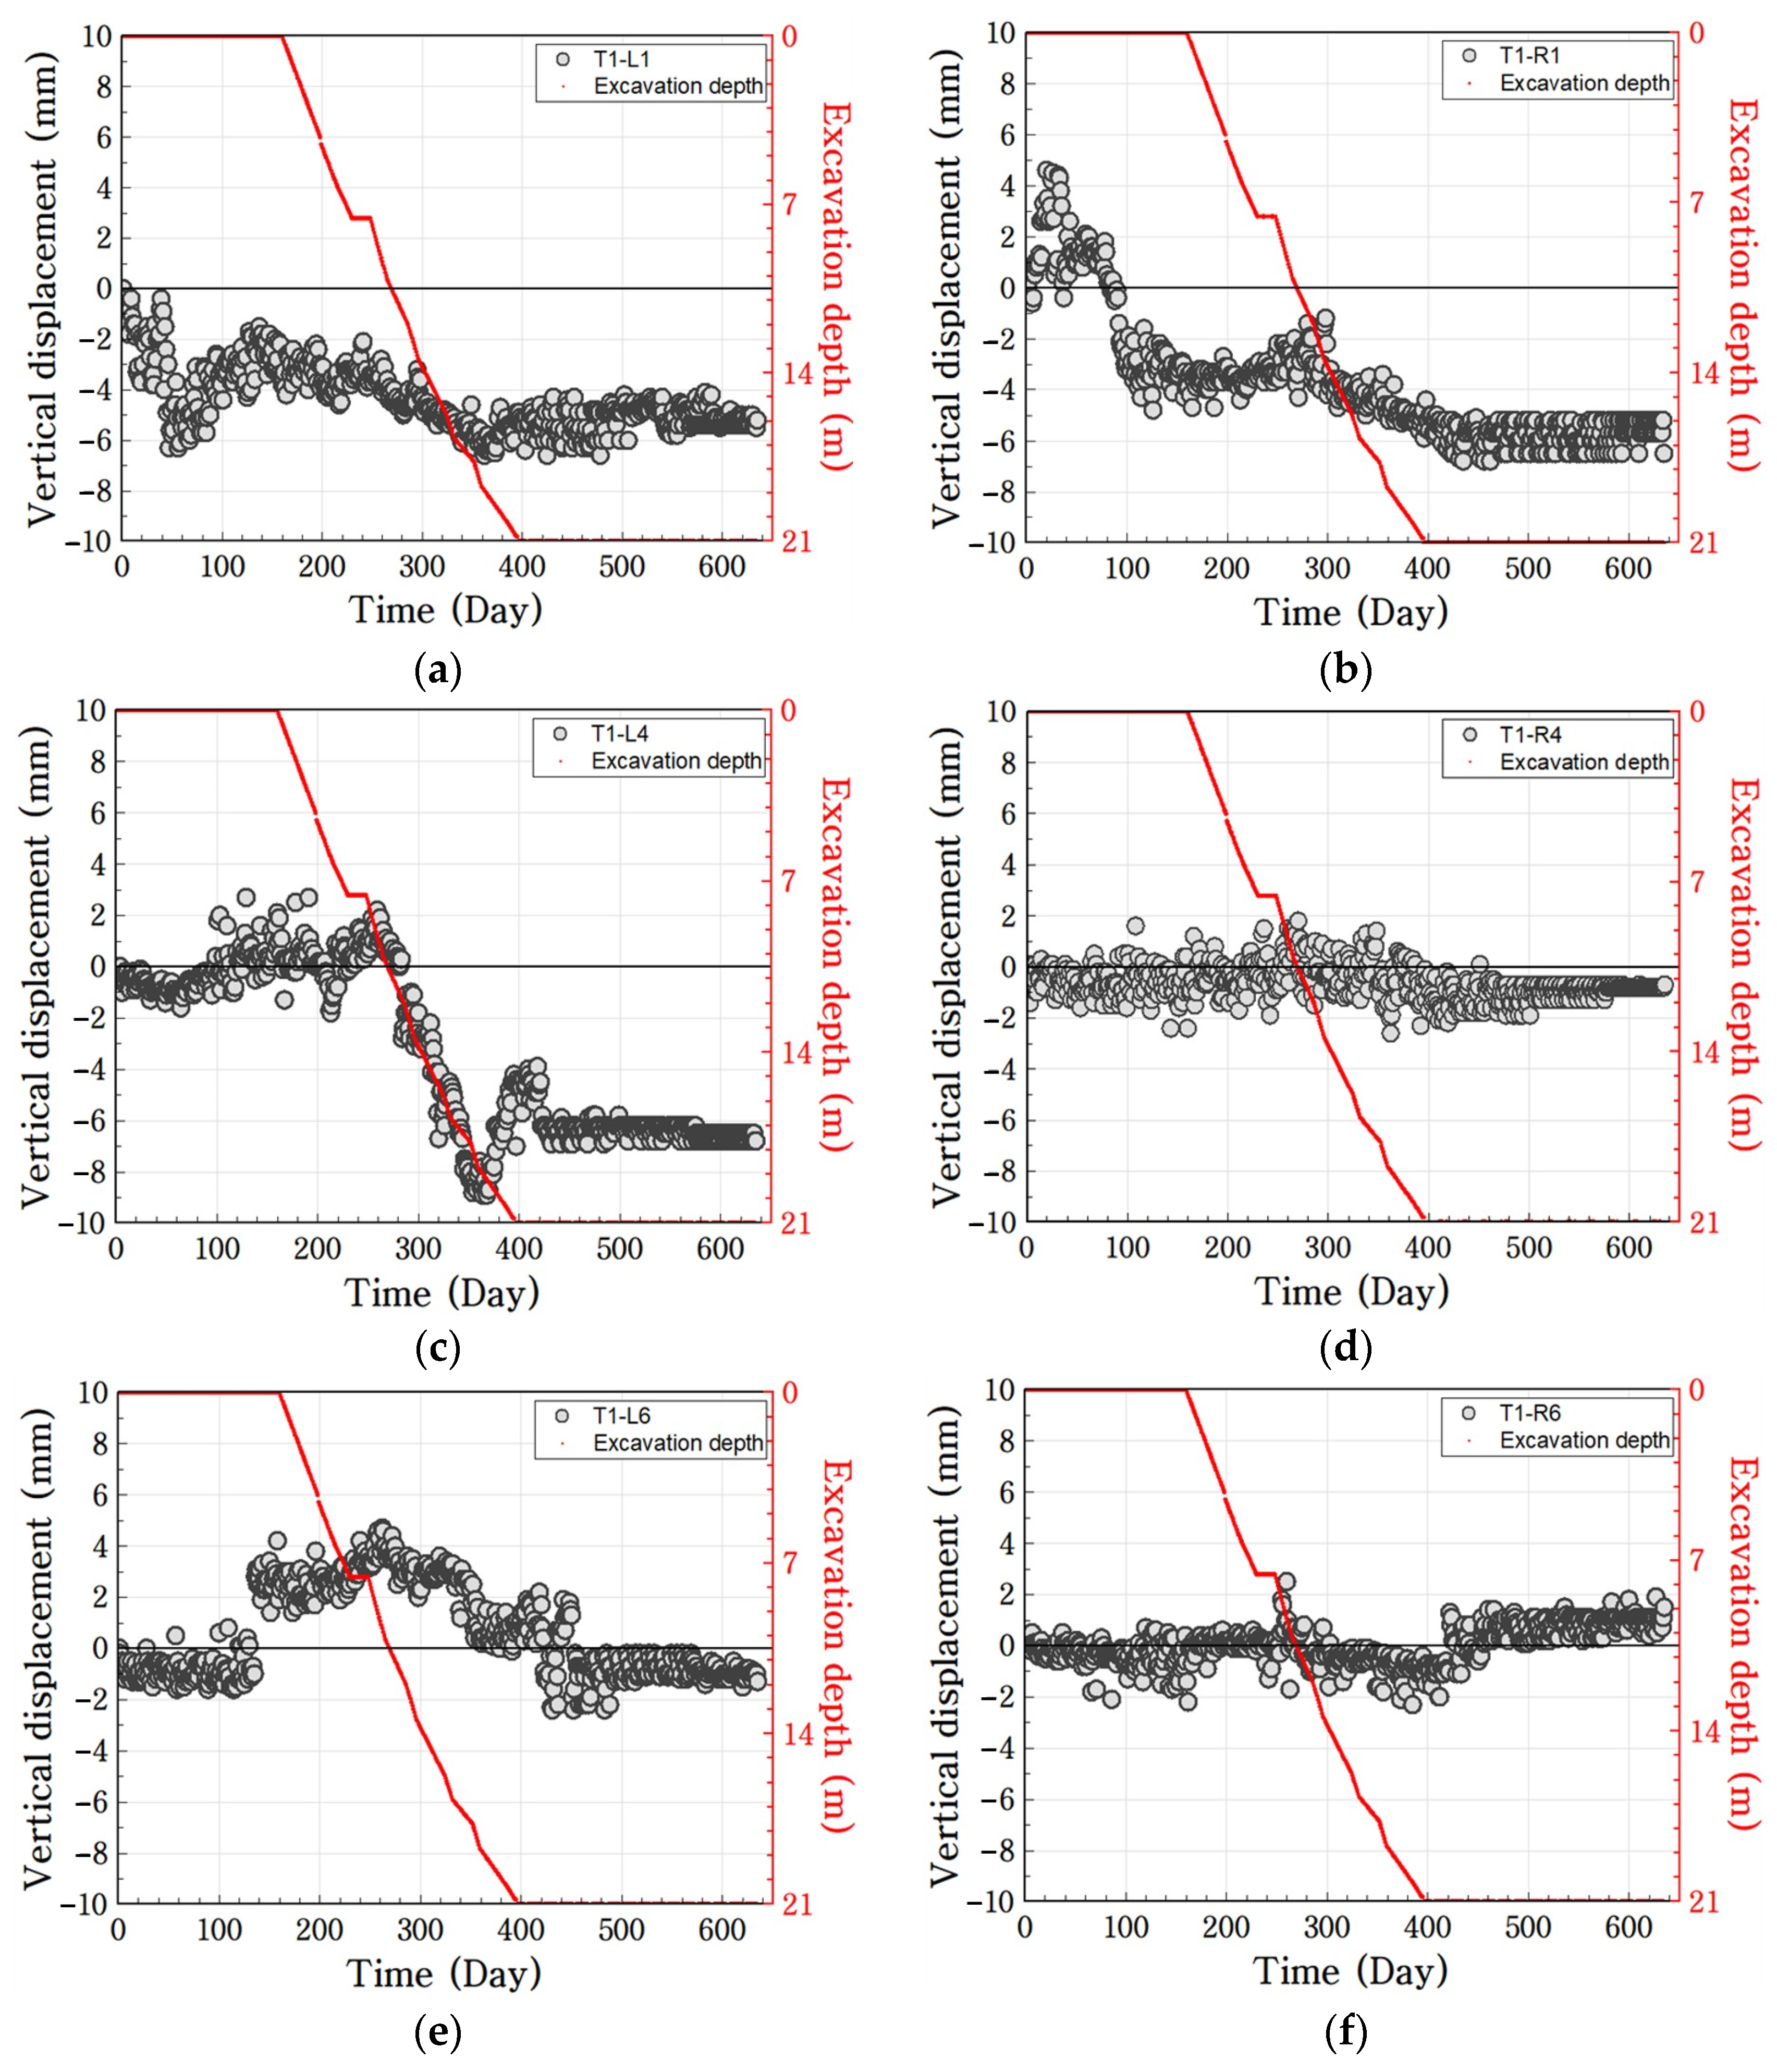
The sleeper displacements at the major turnout locations of the T1 tracks were analyzed using an automatic level measurement across various excavation stages, as illustrated in Figure 17.
Figure 17.
Vertical displacement measurement results from the automatic level measurement (T1 track): point part measurement results for (a) T1-L1 and (b) T1-R1; lead part measurement results for (c) T1-L4 and (d) T1-R4; crossing part measurement results for (e) T1-L6 and (f) T1-R6.
The automatic level measurement was used to analyze the sleeper displacement at the major turnout locations during the period from the slurry wall stage to the completion of the underground structure. As shown in Figure 17, for the left sleepers of the T1 track, the maximum absolute sleeper settlements at the lead and point regions were −8.9 mm and −6.6 mm, respectively, exceeding the applicable 6 mm sleeper displacement monitoring criterion [20] by 2.9 and 0.6 mm, respectively, when the excavation depth was 19 m, recording the maximum subsidence. In particular, the lead part showed a sharp displacement change of 11 mm for approximately 100 days. In addition, the right sleepers of the T1 track recorded the maximum subsidence at the point part (−7.8 mm) during the foundation slab installation stage. After a temporary uplift in the slurry wall stage, continuous subsidence behavior was observed from the PRD (Percussion Rotary Drill) construction stage. The crossing part exhibited uplift characteristics after the completion of the construction excavation, confirming contrasting behavior with that at the point part.
3.3.2. Automatic Level Measurement Results (T2 Track)
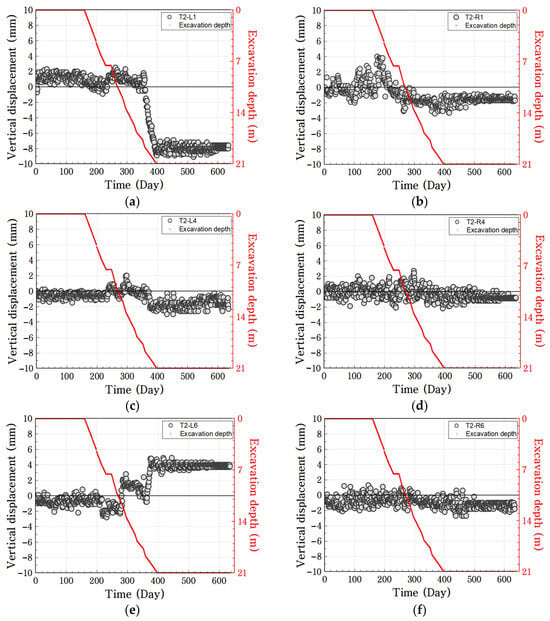
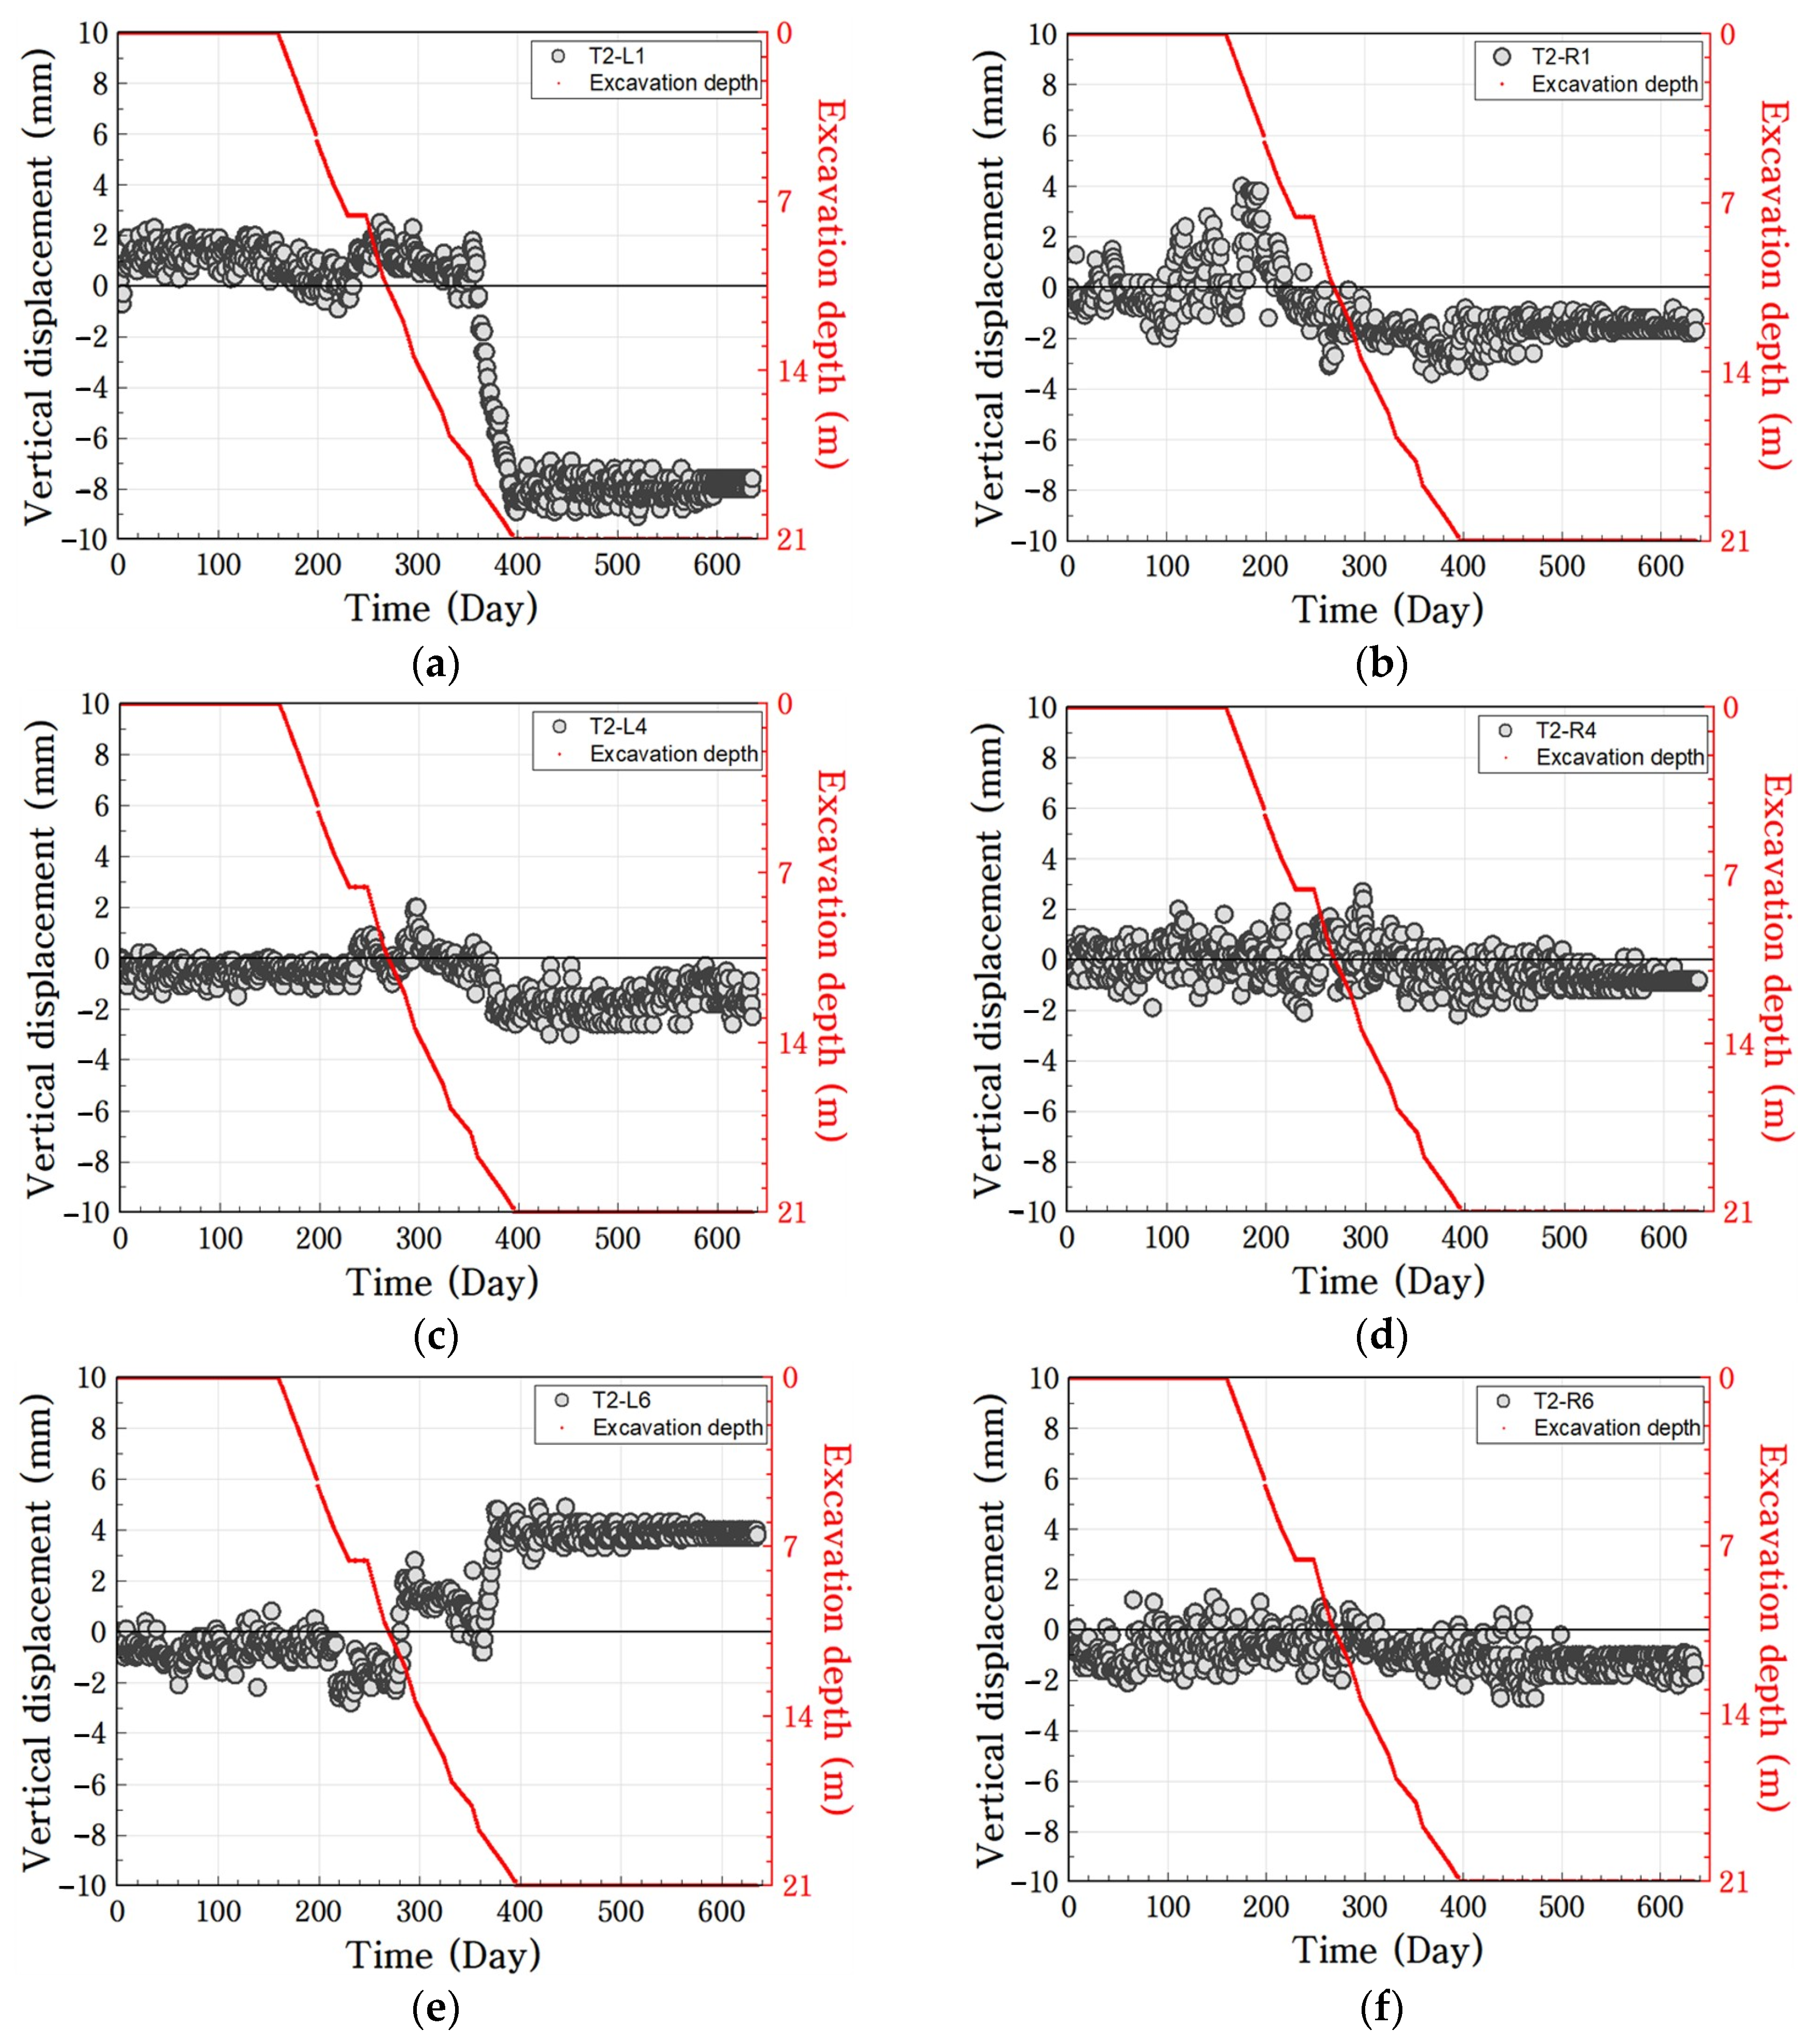
The sleeper displacements at the major turnout locations of the T2 tracks were analyzed using an automatic level measurement across various excavation stages, as illustrated in Figure 18.
Figure 18.
Vertical displacement measurement results from the automatic level measurement (T2 track): point part measurement results for (a) T2-L1 and (b) T2-R1; lead part measurement results for (c) T2-L4 and (d) T2-R4; crossing part measurement results for (e) T2-L6 and (f) T2-R6.
In the measurement results for the T2 track, the maximum absolute sleeper settlement at the T2 point region was −9.1 mm, exceeding the applicable 6 mm sleeper displacement monitoring criterion [20] by 3.1 mm, as shown in Figure 18. In the same construction stage, the crossing part exhibited a maximum heave of +4.9 mm. This experimentally confirmed that a severe longitudinal vertical step of 14 mm was formed between the point and crossing parts. By contrast, the value at the right sleeper-point part (R1) was within the management standard owing to gradual stabilization after a temporary heave of 4.0 mm at the beginning of the excavation.
4. Discussion
4.1. Comparison of Field Measurement Results
4.1.1. Comparison of Vertical Displacement Between Relative Displacement Measurement Techniques
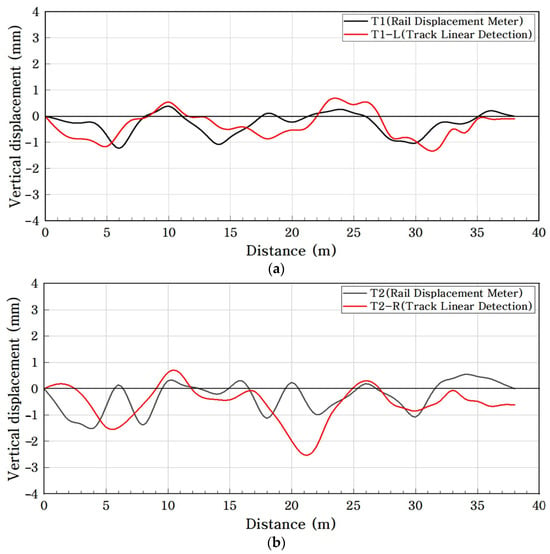
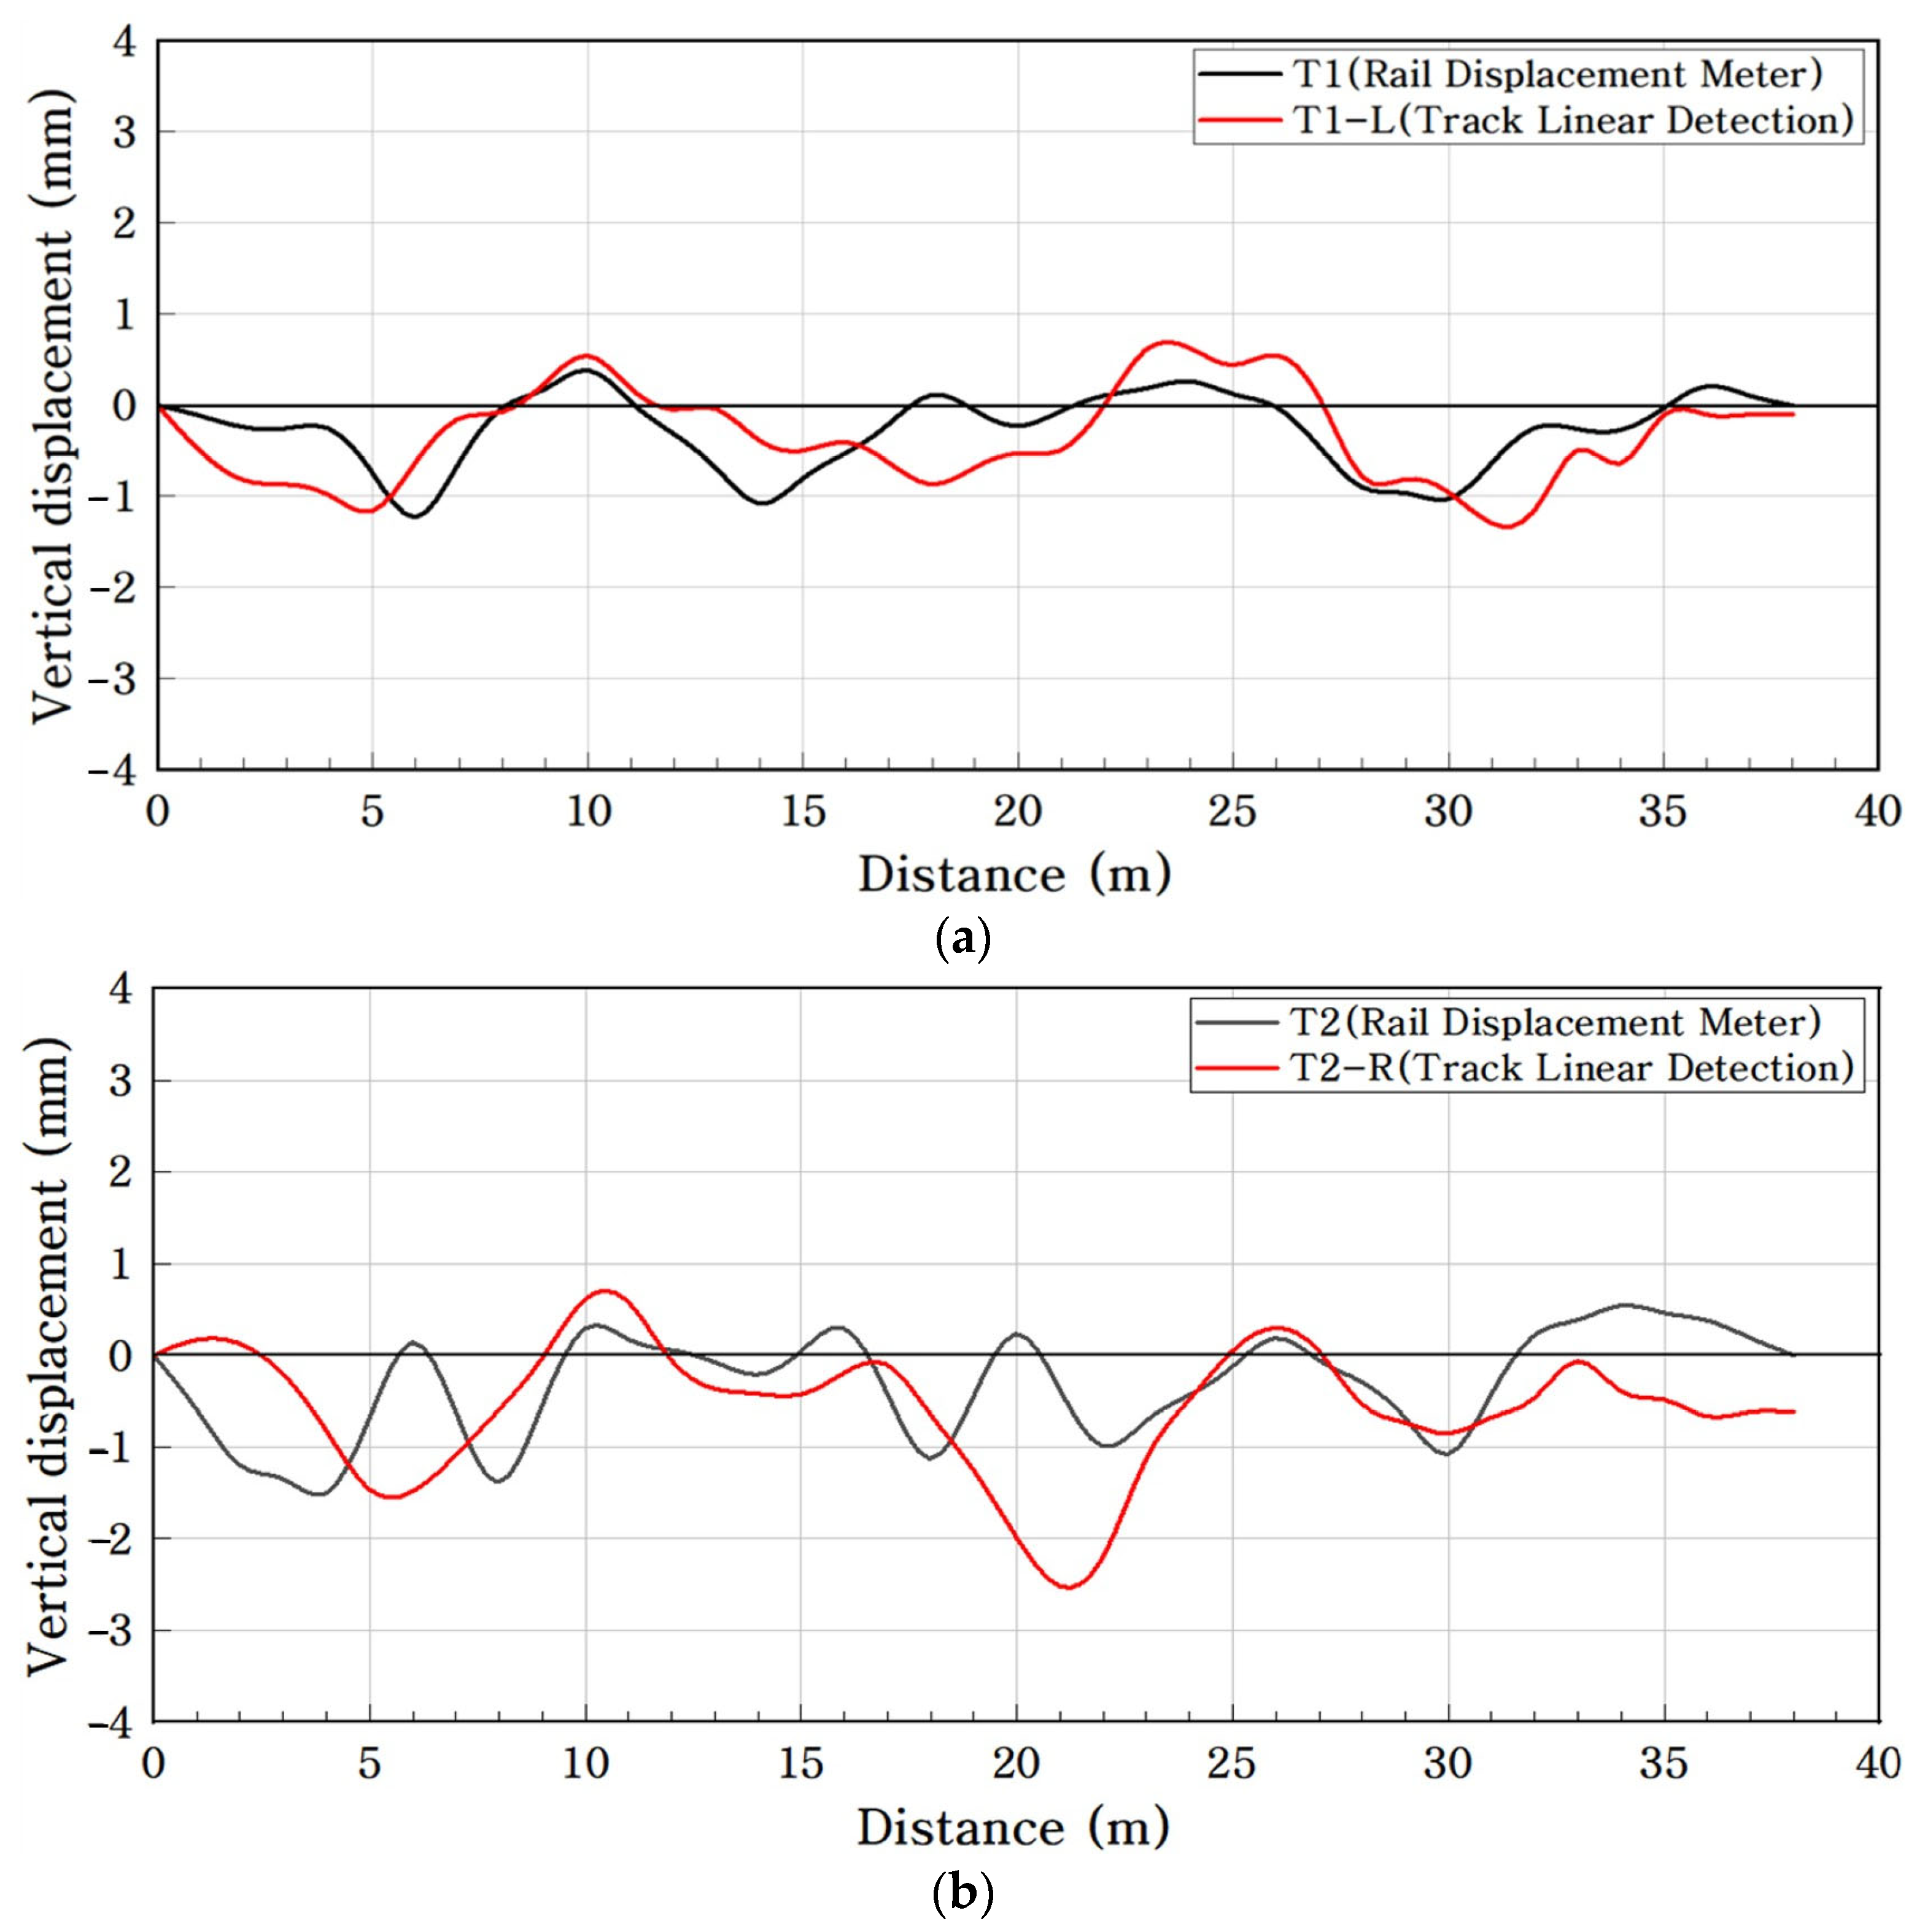
In this study, the measured displacement characteristics of two relative displacement measurement techniques were compared by fixing a measurement reference point at the target object (track master system and rail displacement sensor). Figure 19 shows the results of comparing the vertical displacement of the rail upon the completion of excavation. Figure 19 compares the net vertical displacement obtained between the common pre-excavation and post-excavation reference stages. For the track master system, the net displacement was calculated as the difference between the post-excavation and pre-excavation spatial measurements. For the rail displacement sensors, the displacement at the corresponding post-excavation stage was calculated relative to the initial pre-excavation reference value. Thus, the comparison represents a stage-matched spatial comparison of accumulated displacement rather than a direct comparison between discrete and continuous time-series measurements.
Figure 19.
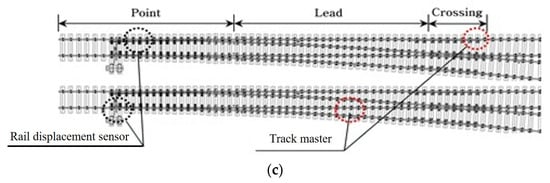
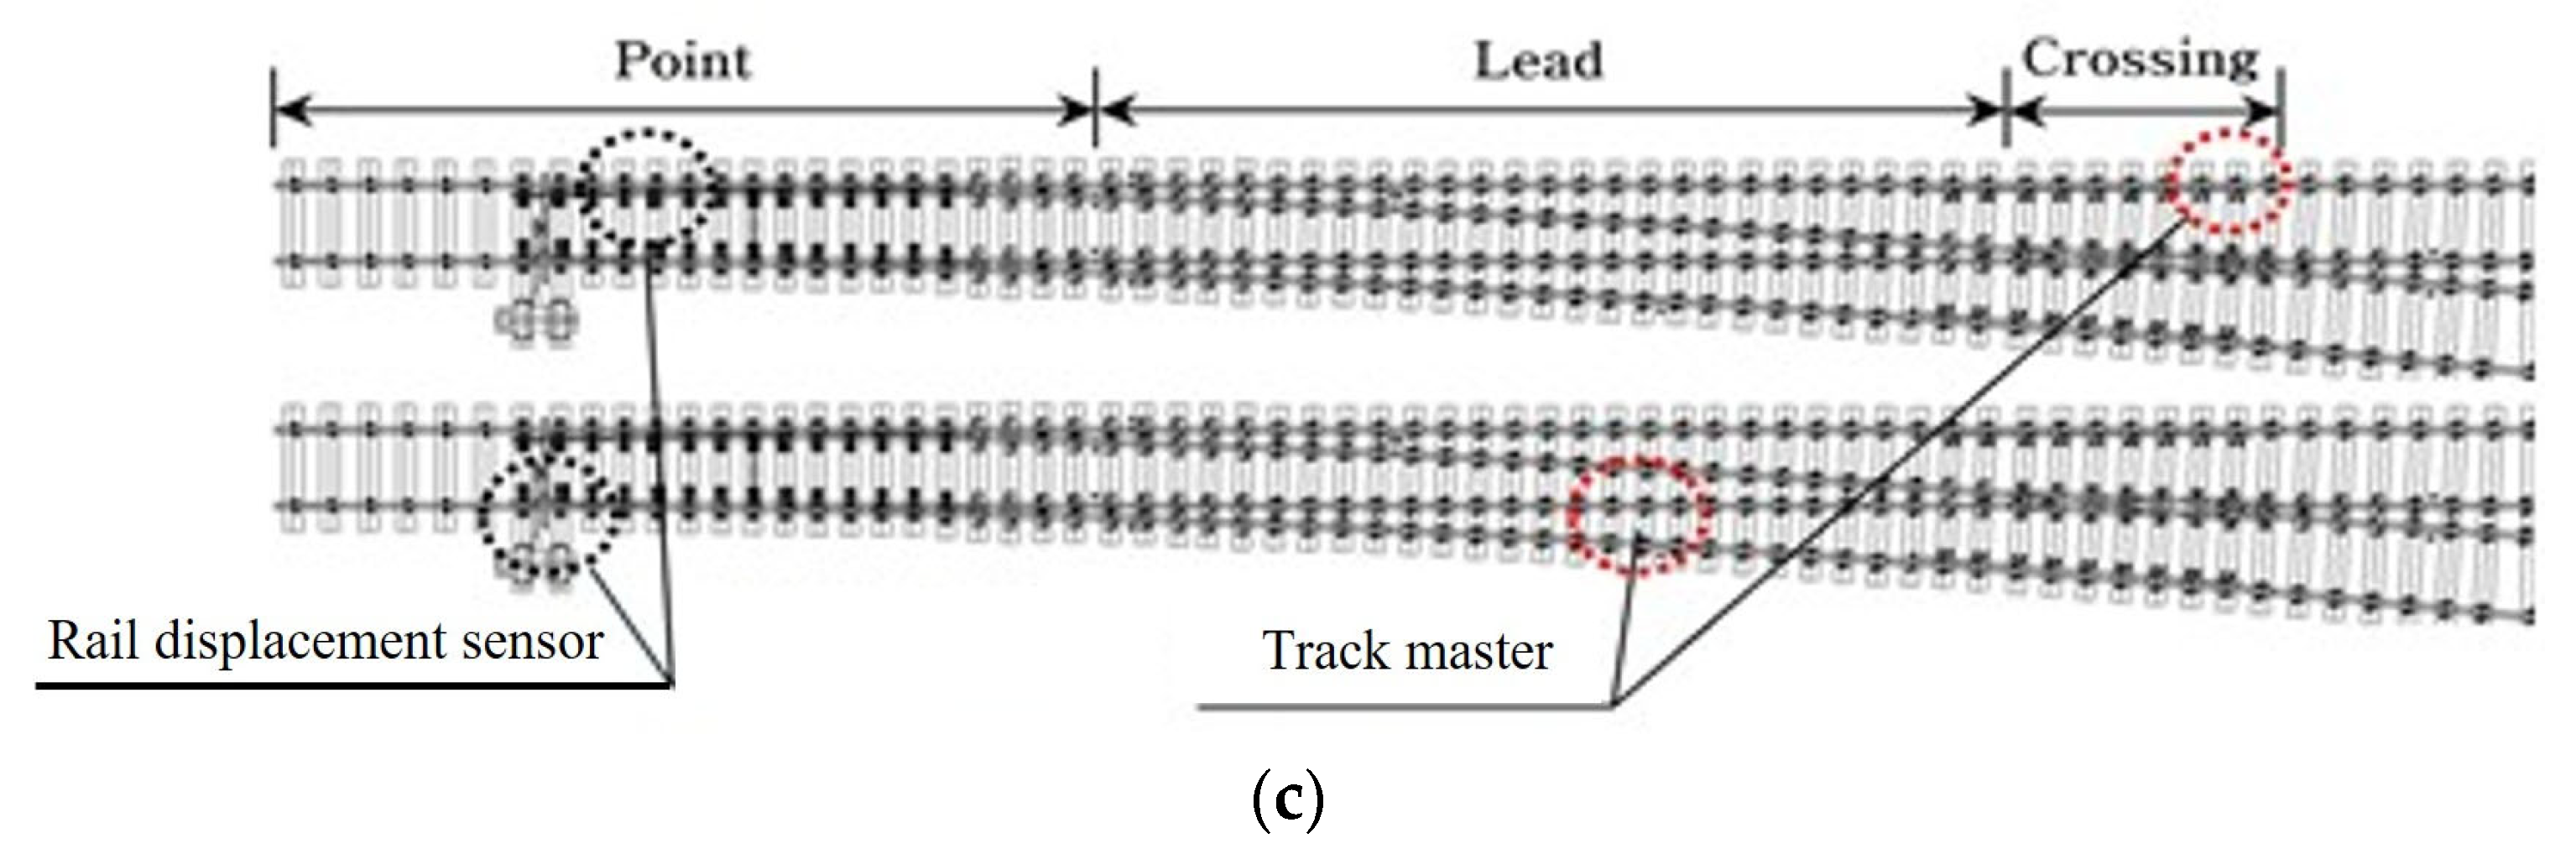
Vertical displacement analysis results for relative displacement measurement techniques (T1, T2): vertical displacement analysis results for (a) T1 track, left rail, and (b) T2 track, right rail; (c) maximum vertical displacement location map.
As shown in Figure 19, the maximum vertical displacement was measured to be −1.23 mm (point part) for the rail displacement sensor and −1.29 mm (crossing part) for the track master system, which are very similar results. In the T2 track analysis, the rail displacement sensor recorded −1.50 mm (point part) and the track master system recorded −2.20 mm (lead part) as the maximum displacement. Both techniques captured the local deformation points within the turnout but exhibited slight differences in the location of the maximum displacement. The track master and rail displacement sensor measurements obtained at the common post-excavation reference stage showed comparable spatial deformation tendencies, with the measured vertical displacements generally remaining within approximately ±2 mm. However, because the two monitoring systems differ in their measurement principles, spatial measurement locations, and temporal acquisition schemes, the observed similarity should not be interpreted as evidence of identical measurement performance or statistical equivalence. Therefore, the present comparison is limited to evaluating the consistency of the observed local deformation tendencies at corresponding turnout regions.
4.1.2. Comparison of Vertical Displacement Between Relative Displacement and Absolute Displacement Measurement Techniques
In this study, the techniques for measuring the irregularity in comparison with a reference point under the condition where the reference point is in contact with the rail (measurement target) were categorized as relative displacement measurement techniques. In addition, the techniques for measuring the displacement in comparison with a reference point located outside the measurement target to avoid direct contact (e.g., automatic level measurement) were categorized as absolute displacement measurement techniques.
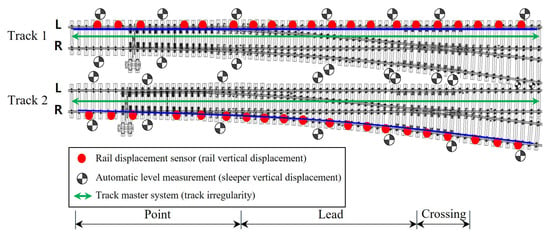
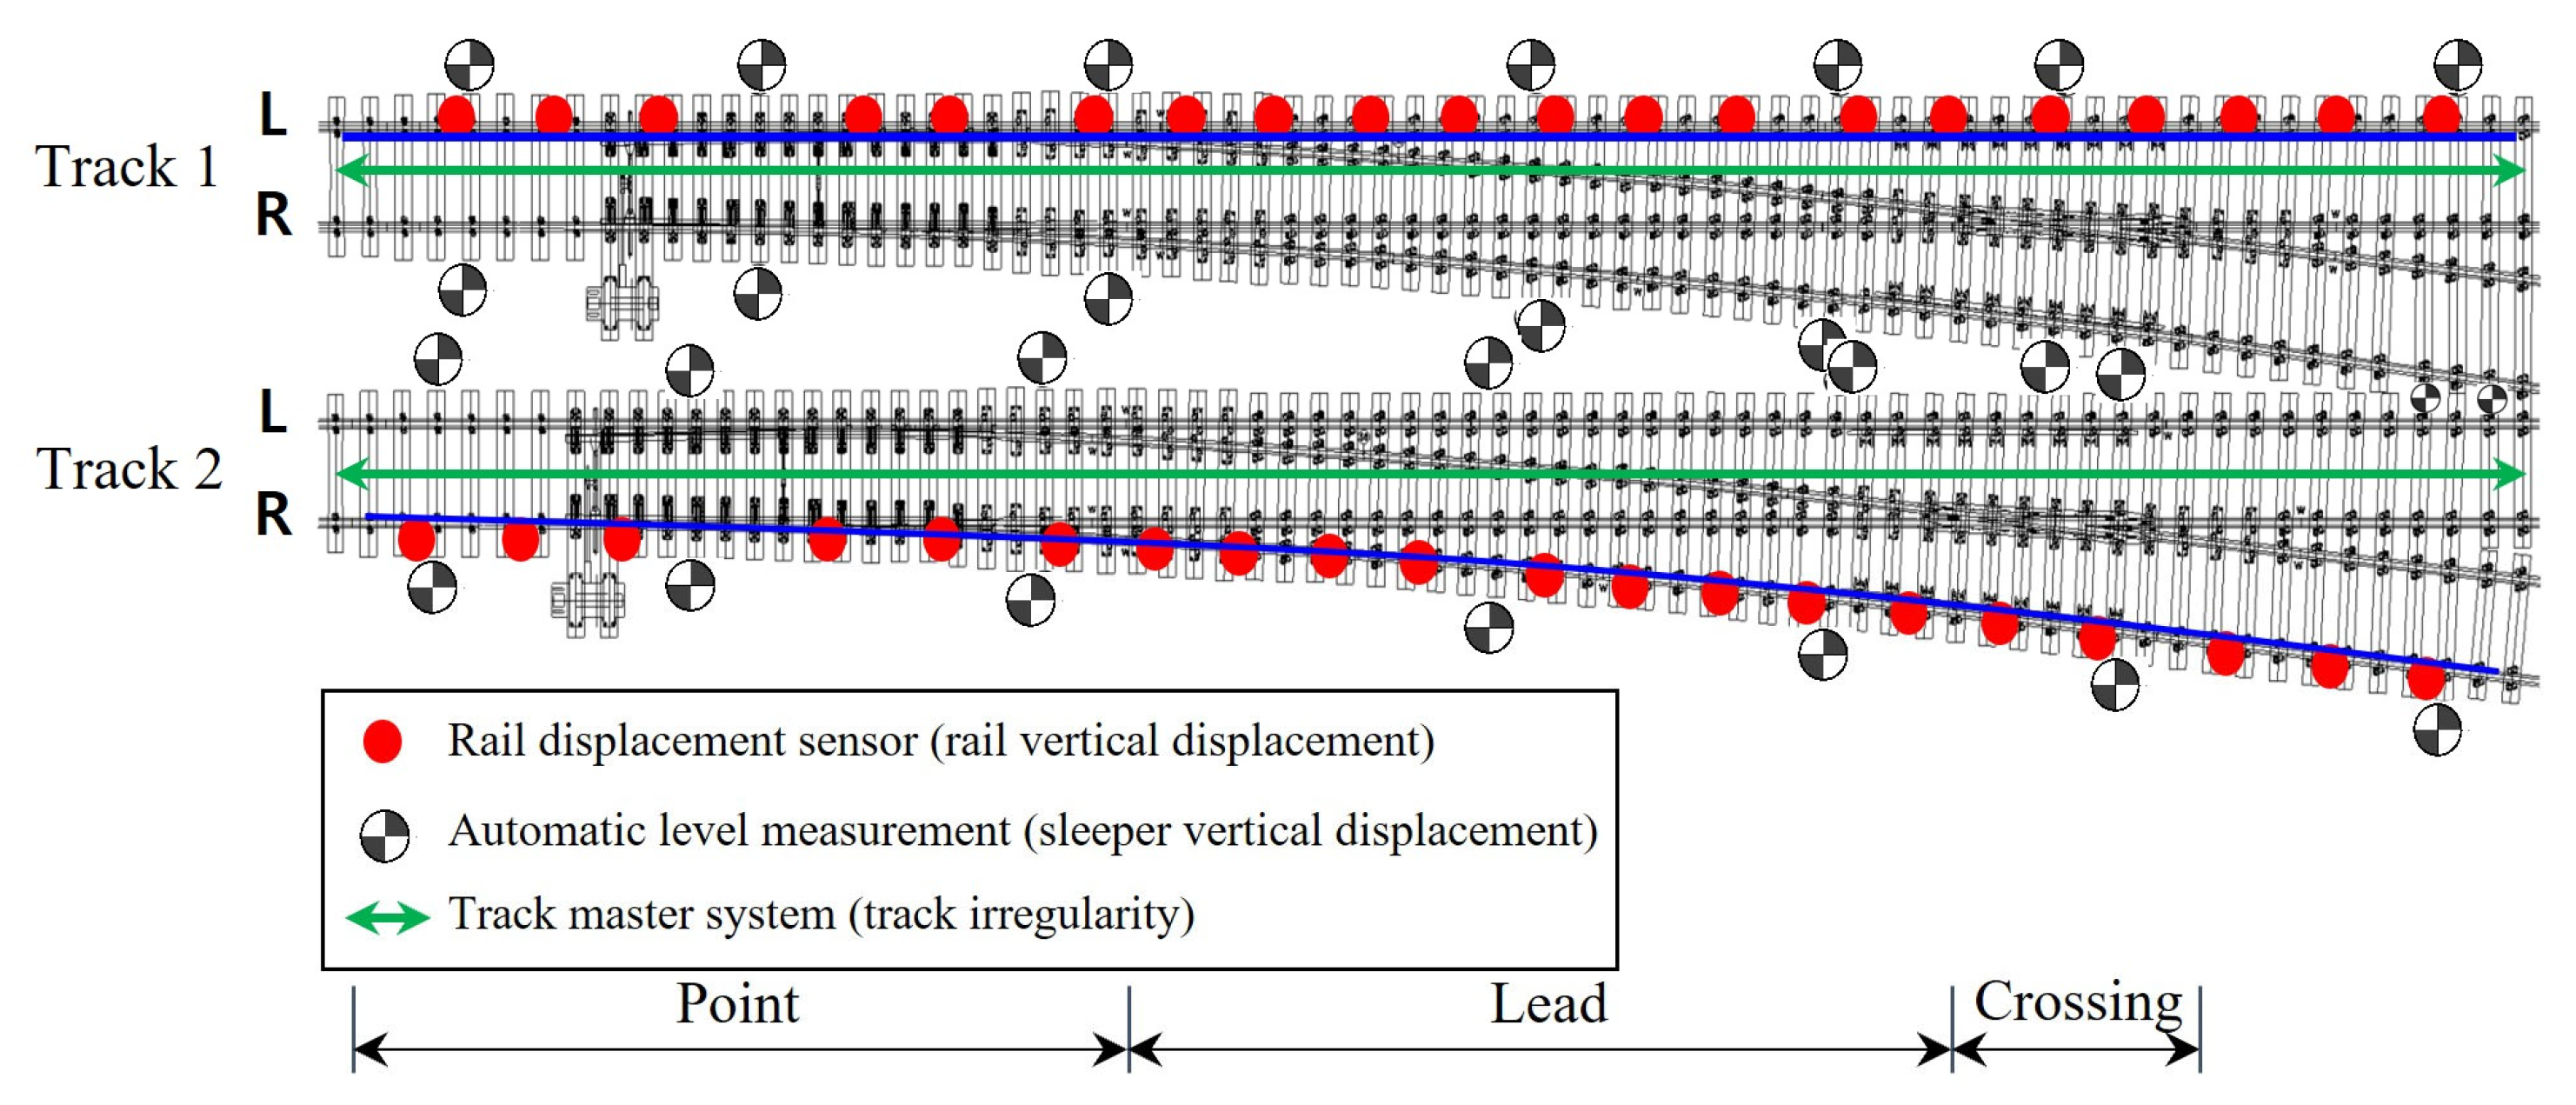
To analyze the displacement behavior of the turnout, the field measurement results of the relative displacement measurement techniques (track master system and rail displacement sensor) and an absolute displacement measurement technique (automatic level measurement) were compared and analyzed. In addition, like the blue line, the measurement results upon the completion of excavation were compared for the left rail of the T1 track and the right rail of the T2 track, which had identical sensor installation locations. The measurement locations for each measurement technique are shown in Figure 20.
Figure 20.
Measurement locations for relative displacement and absolute displacement measurement techniques.
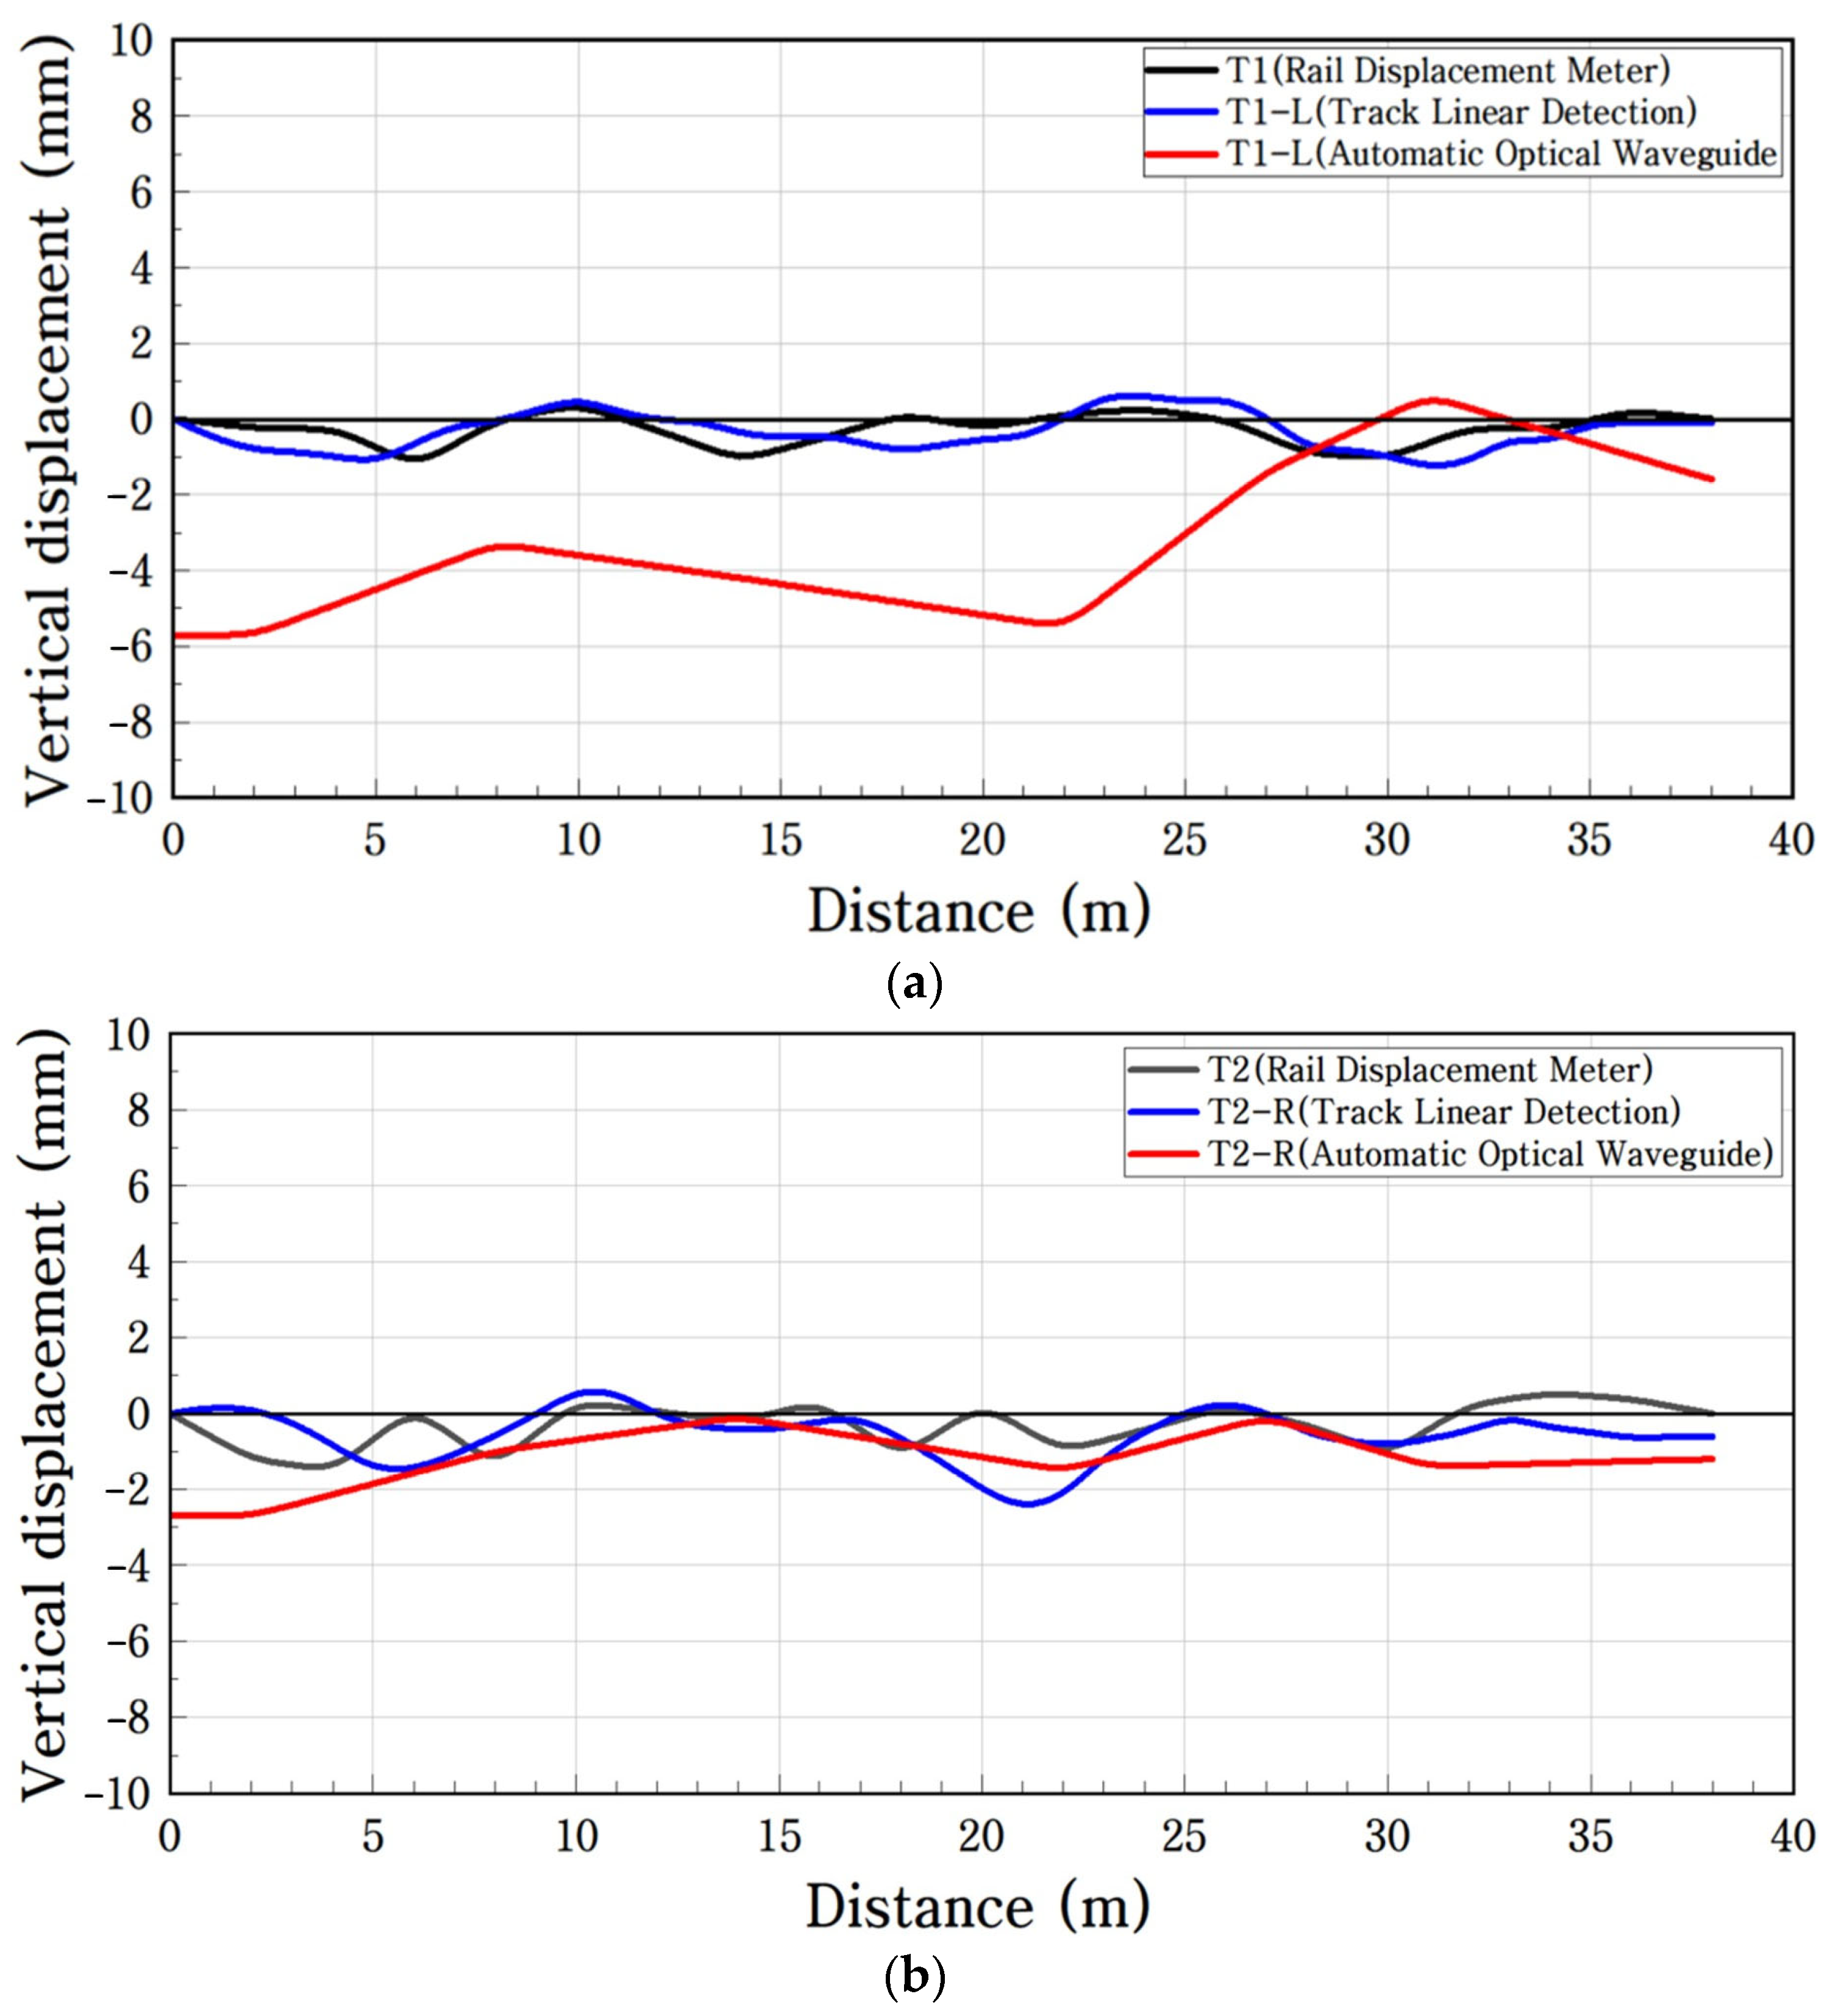
A comparison of the results of the track master system and rail displacement sensor for the T1 and T2 tracks showed that the displacement was within a range of ±1 to 2 mm, and the measurement tendencies were very similar, as shown in Figure 21. However, in the case of the automatic level measurement (absolute displacement measurement technique), subsidence and uplift occurred at the point part, which was the closest to the excavation site, after a maximum vertical displacement of approximately 6 mm. The differences in displacement magnitude among the three monitoring systems should not be interpreted as evidence that one technique underestimates the deformation or that another provides a uniquely correct measurement. The track master and rail displacement sensors primarily characterize local or relative changes in rail geometry, whereas the automatic leveling system measures the absolute vertical movement of the sleeper support system with respect to an external reference. Therefore, the different displacement magnitudes reflect, at least in part, differences in the physical quantities and reference frameworks of the monitoring systems. Instead, the systems characterize different components of the turnout response. Relative measurements primarily reflect local changes in rail geometry, whereas automatic leveling captures the absolute movement of the sleeper support system. Their combined interpretation therefore enables local track deformation to be distinguished from broader support system movement. The results also indicate that the selection of a monitoring system should be determined according to the engineering quantity of interest. The track master system is particularly suitable for periodic evaluation of track geometry parameters, such as longitudinal level, cross level, and twist, which are directly related to operational track condition. Rail displacement sensors are advantageous for continuous monitoring of localized rail displacement at predefined critical locations and are therefore useful when temporal changes in a specific rail section must be continuously observed. In contrast, the automatic leveling system is suitable for long-term monitoring of the absolute displacement of the turnout sleeper support system with respect to an external reference and is therefore effective for identifying global settlement and heave associated with surrounding ground movement. Consequently, the three monitoring systems should not be regarded as competing alternatives for measuring the same physical quantity. For turnouts affected by adjacent excavation, an integrated monitoring strategy is more appropriate: track geometry measurement can be used to evaluate operational irregularities, rail displacement sensors can monitor local critical locations continuously, and automatic leveling can identify global displacement of the sleeper support system. The monitoring equipment should therefore be selected according to the target deformation mode, required monitoring duration, spatial coverage, and measurement reference framework.
Figure 21.
Comparative analysis of relative displacement and absolute displacement measurement techniques: (a) T1 track; (b) T2 track.
4.2. 3D Analysis of Displacement Behavior of Turnout System
This study presented effective measurement techniques and 3D evaluation techniques to identify the overall deformation characteristics of the turnout.
The research results showed that the automatic level measurement, which measures the absolute displacement of the sleepers, would be useful in the 3D evaluation of the entire turnout system. The deformation of the entire turnout was analyzed in the post-excavation stage, which showed the maximum subsidence among the construction stages. Automatic level measurements were obtained from 28 points. The displacement values at the representative points for each location were examined. The analysis locations were points 1, 4, and 6, as shown in Figure 22.
Figure 22.
Automatic level measurement location map.
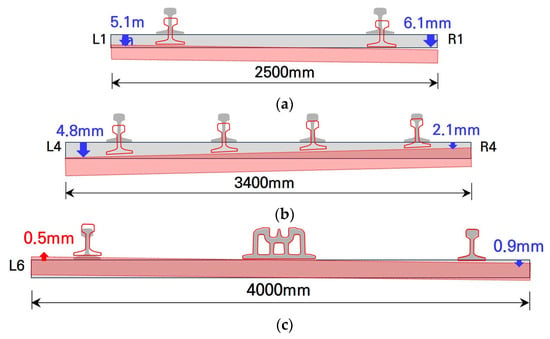
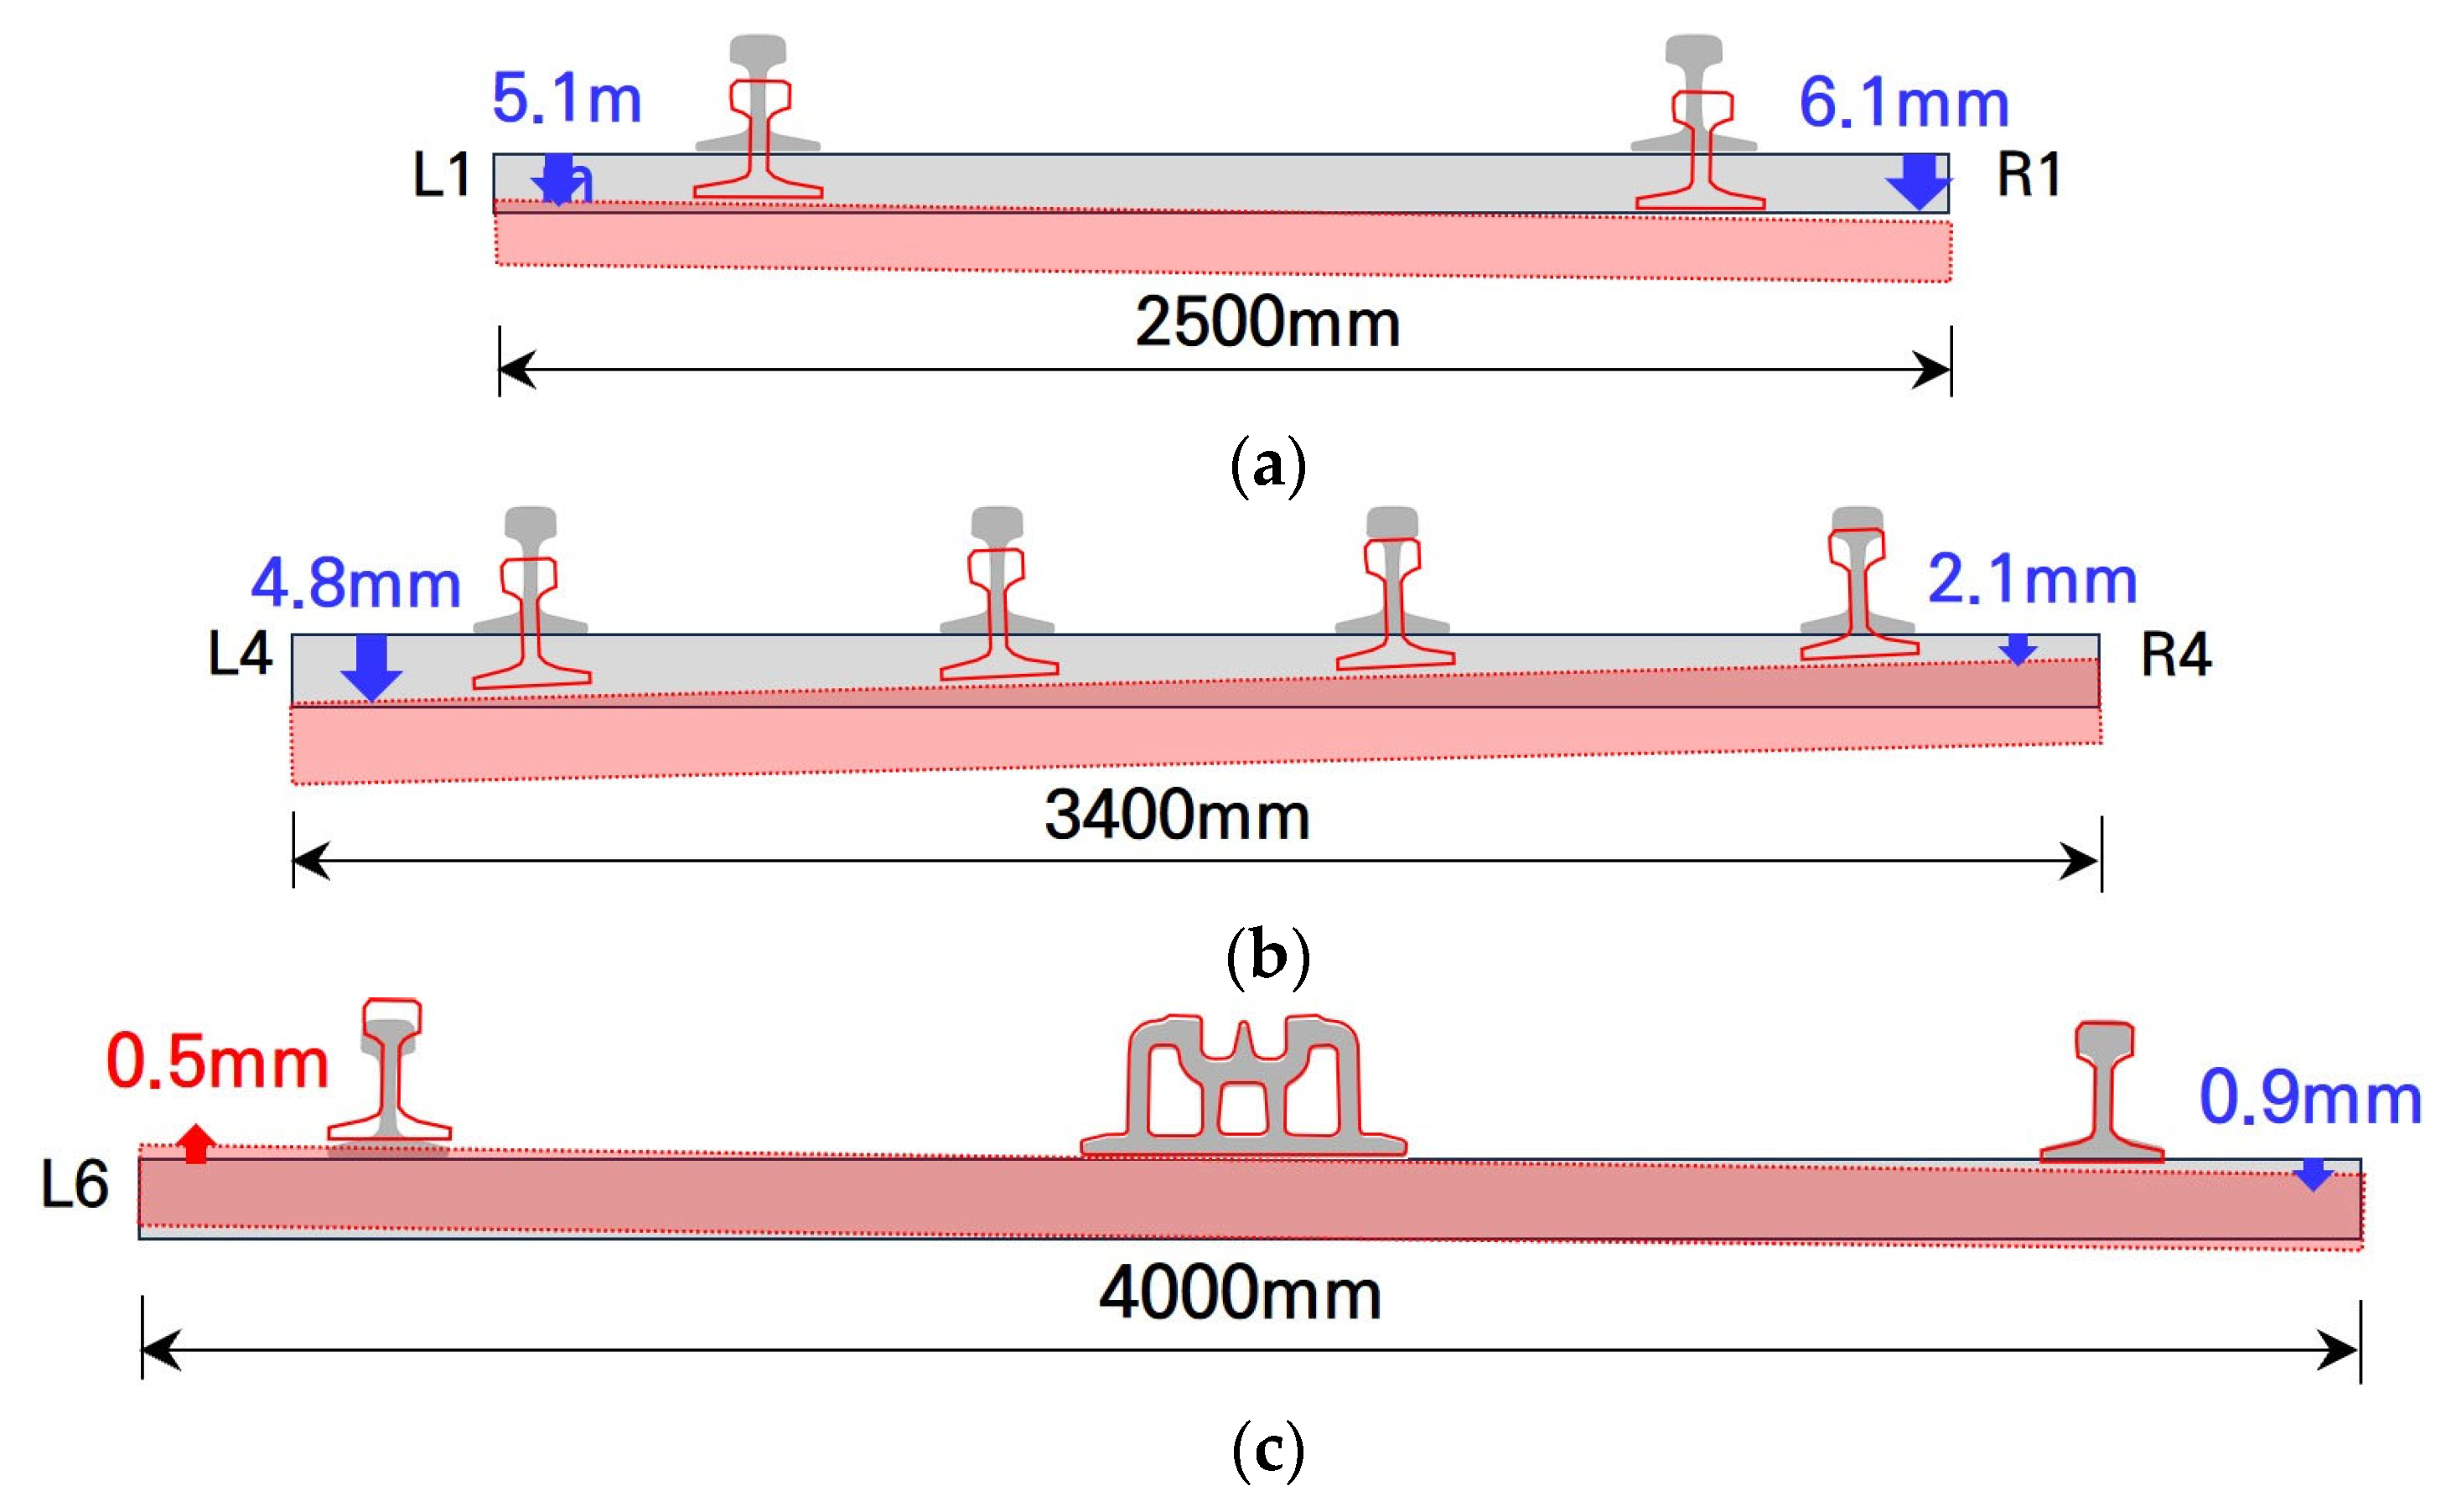
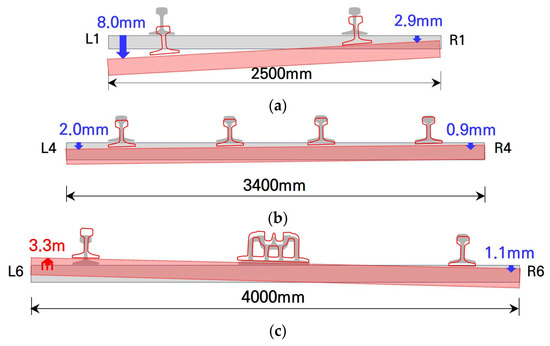
Figure 23 and Figure 24 show the left- and right-side vertical displacements of the T1- and T2-track sleepers, respectively, in the construction stage after the completion of excavation.
Figure 23.
Vertical displacement results for turnout sleepers (T1 track): (a) T1-L1, R1 (point part); (b) T1-L4, R4 (lead part); (c) T1-L6, R6 (crossing part).
Figure 24.
Vertical displacement results for turnout sleepers (T2 track): (a) T2-L1, R1 (point part); (b) T2-L4, R4 (lead part); (c) T2-L6, R6 (crossing part).
4.3. 3D Behavior Analysis Technique for the Turnout System
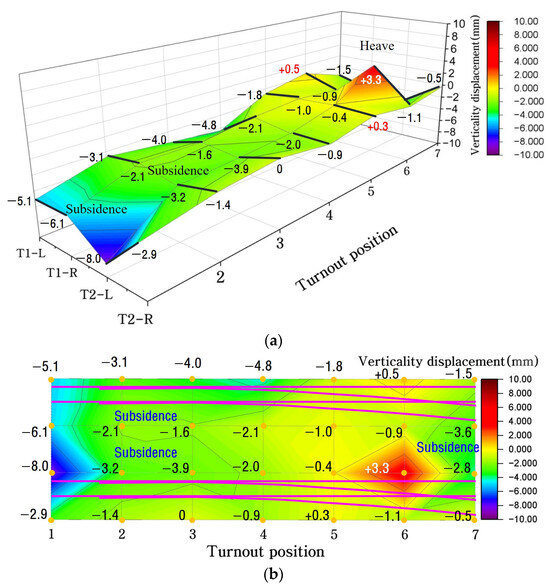
The spatial distribution of the measured vertical sleeper displacement of the T1 and T2 turnouts was visualized in three dimensions using the automatic level monitoring results, as shown in Figure 25. The three-dimensional representation shown in Figure 25 was constructed directly from the measured sleeper displacements at the monitored locations and was intended to visualize the overall spatial tendency of settlement and heave within the turnout. No spatial interpolation was applied because the monitoring network consisted of a limited number of discrete sleeper locations. Applying a continuous interpolation surface to such a sparse dataset could introduce artificial deformation gradients at unmeasured locations and may lead to overinterpretation of the field data. Therefore, the present figure is interpreted as a measured-point-based spatial visualization rather than a continuous deformation field. Multi-directional deformations, such as localized subsidence, heave, and twist irregularities, were observed. The results demonstrate that the adjacent excavation produced spatially non-uniform sleeper movement, including localized settlement, heave, and differential deformation. These observations complement the relative rail geometry measurements by providing information on the absolute movement of the turnout support system.
Figure 25.
Measured-point-based spatial representation of vertical sleeper displacement obtained from the automatic leveling system: (a) 3D visualization and (b) 2D representation.
In the 3D analysis results of the automatic level measurement for the left- and right-side sleepers of the T1 and T2 tracks, the overall deformation of the turnout was in the form of subsidence, as shown in Figure 25. A subsidence of 8 mm occurred at the point part adjacent to the excavation point, and a heave of 3.3 mm occurred at the crossing part. It was found that the subsidence and heave of the gravel track turnout occurred in the longitudinal and lateral directions during the excavation. It was also found that twist irregularity occurred owing to the height difference in the cross-level irregularity. It was confirmed that three-point support may cause derailment and stress concentration on the track system when twist irregularity occurs.
The deformation at the T2 track on the opposite side was larger than that at the T1 track adjacent to the excavation site. In addition, the point part that exhibited the maximum subsidence was found to be a location requiring careful management during the excavation because the point machine operating the tongue rail was located at this point.
No cant is required at a turnout, but it was found that cant may occur owing to the subsidence of one rail and heave of the opposite rail because of ground deformation during excavation. In particular, it was confirmed that measurement and site management are required during excavation because a negative cant on the lead rail of the branch line may cause a moving train to derail. In the case of the turnout, these results provide complementary information on the absolute movement of the sleeper support system that cannot be directly inferred from local rail geometry measurements alone, whereas the relative rail measurements reflected local track geometry changes. The combined use of these measurements enabled the spatial relationship between support movement and rail deformation to be interpreted more comprehensively.
4.4. Comparison of 3D Analysis According to the Construction Stage
The displacement behavior of the turnout was compared between the PRD construction stage (initial stage) shown in Figure 26a and the post-excavation stage shown in Figure 26b. A slight heave occurred at the point part at the beginning of the excavation, but subsidence occurred at the point part and heave at the crossing part after the completion of the excavation, confirming the occurrence of deformation in the longitudinal direction of the turnout.
Figure 26.
3D analysis technique comparison between construction stages: (a) PRD construction stage; (b) construction stage after the completion of excavation.
It was found that twist irregularity (twist) may occur during adjacent construction excavation owing to the difference in cross-level irregularity between the left and right rails of the turnout. This necessitates site management because the three-point support of the train may cause accidents (e.g., derailment) when twist irregularity occurs in the turnout.
The differential deformation observed in the turnout can be mechanically interpreted as the combined effect of excavation-induced ground movement and the spatial variation in structural stiffness along the turnout. During deep excavation, removal of the soil mass causes unloading and redistribution of the in situ stresses around the excavation. This stress redistribution can induce vertical settlement, localized heave, and lateral movement of the surrounding ground. The resulting ground deformation is subsequently transmitted through the subgrade and ballast layers to the turnout sleepers. Unlike a uniform tangent track, however, a turnout consists of structurally discontinuous regions, including the point, lead, crossing, rail joint, and tongue rail sections. These components have different rail configurations, sleeper geometries, restraint conditions, and load transfer mechanisms, resulting in spatial variations in the effective support stiffness. Consequently, even when excavation-induced ground deformation varies relatively gradually, the deformation transferred to the rail–sleeper system may become locally amplified at stiffness-transition or discontinuity regions. In particular, reduced structural continuity around rail joints and turnout components can decrease the restraint against sleeper movement and increase local flexibility. This mechanism is consistent with the measured deformation patterns, in which settlement and heave occurred simultaneously at different turnout locations. The resulting differential sleeper movement produces abrupt longitudinal and transverse elevation differences, which may subsequently appear as longitudinal-level, cross-level, and twist irregularities in the rail geometry. Therefore, the measured turnout response should be interpreted as a sequential interaction in which excavation-induced unloading causes ground and support layer deformation, ground deformation induces differential sleeper movement, and the discontinuous stiffness of the turnout modifies the transfer of this deformation to the rail system. This mechanism also explains why the location of the maximum absolute sleeper displacement does not necessarily coincide with the location of the maximum relative rail irregularity.
The tongue rail is located at the point part of the turnout. The tongue rail has an asymmetric cross section achieved by cutting a typical rail, which changes the direction of a train or vehicle by attaching its end to the basic rail. When deformation occurs at the tongue rail or a point machine that operates the tongue rail, trains may derail owing to poor attachment. Therefore, thorough site management is required from the pre-construction stage, including measuring instrument installation and preliminary investigation. To identify the deformation characteristics of the turnout, it is deemed necessary to determine the behavioral characteristics of the entire turnout system rather than analyze the implications of the displacement values of any point or left and right rails of the turnout. In addition, because two to four rails are installed on one sleeper owing to the nature of the turnout, it was experimentally verified that the heave of the sleepers on one side, caused by the subsidence of the sleepers on the opposite side, may occur in the longitudinal as well as lateral directions. It was experimentally confirmed that the deformation on the opposite side might be larger than that at the part adjacent to the excavation location. Proper measurement design and data analysis techniques are required to identify these behavioral characteristics. A limitation of the present spatial analysis is the relatively sparse distribution of automatic level monitoring points. Therefore, the three-dimensional representation should be interpreted as a visualization of the measured deformation tendency rather than as a continuous prediction of sleeper, ballast, or ground deformation between unmeasured locations. Future studies incorporating a denser monitoring network may allow spatial interpolation techniques to be applied with greater reliability. The present study was designed as a site-specific engineering monitoring investigation rather than a population-based statistical experiment. Accordingly, the measured deformation was evaluated primarily using location-specific extreme values, differential displacements, and management-limit exceedance. Statistical descriptors such as the overall mean and confidence interval may be useful for characterizing general variability; however, their interpretation should be made cautiously for spatially heterogeneous turnout deformation because averaging across structurally different point, lead, and crossing regions may mask localized critical responses. Future studies involving multiple turnout sites and repeated independent datasets may enable a more comprehensive probabilistic statistical assessment.
5. Conclusions
This study proposed a comprehensive field measurement technique and a three-dimensional (3D) analysis approach to evaluate the displacement behavior of a gravel track turnout adjacent to a large-scale construction excavation. The main conclusions are summarized as follows:
Relying solely on conventional single-point measurements or theoretical predictions can be insufficient to fully capture the actual complex structural responses due to uncertainties in real-time ground behavior and site conditions. This highlights the critical necessity of advanced multi-sensor field monitoring protocols to ensure track stability during adjacent construction.
The vertical displacement analysis using the track master system and rail displacement sensors—which represent relative measurement techniques—demonstrated technical limitations in monitoring the behavioral characteristics of the turnout operating as an integrated total system.
The automatic level monitoring captured the spatial distribution of absolute sleeper displacement across the turnout, including simultaneous settlement and heave in different turnout regions, experimentally verifying that adjacent excavations induce simultaneous subsidence and uplift across different turnout zones. It was confirmed that these localized multi-directional deformations within a short section can generate severe twist irregularities, increasing train derailment risks.
The Track Master and rail displacement sensors captured local changes in rail geometry, whereas the automatic leveling system captured the absolute movement of the sleeper support system. The different magnitudes and spatial patterns observed using these monitoring systems indicate that excavation-induced turnout deformation cannot be fully represented by a single measurement reference framework.
The principal contribution of this study is therefore the field-based clarification of the complementary relationship between relative rail-deformation measurements and absolute sleeper support displacement measurements. The measured-point-based spatial visualization combined with long-term displacement monitoring provides a practical means of identifying critical deformation locations during adjacent excavation.
Author Contributions
Conceptualization, J.-Y.C.; methodology, J.-Y.C.; software, H.-S.K. and J.-M.H.; formal analysis, J.-Y.C. and H.-S.K.; investigation, H.-S.K.; data curation, J.-Y.C., H.-S.K. and J.-M.H.; writing—original draft preparation, J.-Y.C., H.-S.K. and J.-M.H.; writing—review and editing, J.-Y.C., H.-S.K. and J.-M.H. All authors have read and agreed to the published version of the manuscript.
Funding
This research was supported by the ANCHOR program through the Gyeongbuk ANCHOR Center, funded by the Ministry of Education (MOE) and the Gyeongsangbuk-do, Republic of Korea (2026-ANCHOR-15-113).
Institutional Review Board Statement
Not applicable.
Informed Consent Statement
Not applicable.
Data Availability Statement
The data presented in this study are available on request from the corresponding author. The data are not publicly available owing to their confidential nature.
Conflicts of Interest
The authors declare no conflicts of interest.
References
- Kim, H.S. Evaluation of Displacement Behavior of Ballasted Track Turnout According to Adjacent Excavation. Ph.D. Thesis, Dongyang University, Yeongju, Republic of Korea, 2024. (In Korean) [Google Scholar]
- Choi, J.Y. Qualitative Analysis for Dynamic Behavior of Railway Ballasted Track. Ph.D. Thesis, Technical University of Berlin, Berlin, Germany, 2014. [Google Scholar]
- Siahkouhi, M.; Rashidi, M.; Miri, A. Ballasted Railway Track–Bridge Transition Zone Monitoring Methods: Recent Developments, Challenges, and Prospects. J. Transp. Eng. Part B Pavements 2025, 151, 03125001. [Google Scholar] [CrossRef] [Scilit]
- Park, D.R. Analysis of Track Irregularity Based on Load for Ballasted Track on Operating Lines. Ph.D. Thesis, Dongyang University, Yeongju, Republic of Korea, 2021. (In Korean) [Google Scholar]
- Kim, E.Y. A Study on the Influence of Train Traffic on Turnout Track Irregularity. Master’s Thesis, Ajou University, Suwon, Republic of Korea, 2016. (In Korean) [Google Scholar]
- Jeon, S.S.; Lee, S.S. Track Stability Assessment for Deep Excavations in Adjacent to Urban Railways. J. Korea Acad. Ind. Coop. Soc. 2018, 19, 614–627. (In Korean) [Google Scholar] [CrossRef]
- Lee, H.H. A Study on the Improvement of Automated Measurement Evaluation System for Subway Structures Due to Adjacent Excavation Construction. Ph.D. Thesis, Dongyang University, Yeongju, Republic of Korea, 2020. (In Korean) [Google Scholar]
- Choi, J.Y.; Kim, S.H.; Lee, H.H.; Chung, J.S. Improvement of automatic measurement evaluation system for subway structures by adjacent excavation. Materials 2021, 14, 7492. [Google Scholar] [CrossRef] [Scilit] [PubMed]
- Shi, C.; Zhou, Y.; Xu, L.; Zhang, X.; Guo, Y. A Critical Review on the Vertical Stiffness Irregularity of Railway Ballasted Track. Constr. Build. Mater. 2023, 400, 132715. [Google Scholar] [CrossRef] [Scilit]
- Heo, J. A Study on Improvement Plans for Vulnerable Factors of Turnouts. Master’s Thesis, Woosong University, Daejeon, Republic of Korea, 2016. (In Korean) [Google Scholar]
- Yoon, D.S. A Study on the Analysis of Causes and Countermeasures for Vulnerability of Mainline Railway Turnouts. Master’s Thesis, Woosong University, Daejeon, Republic of Korea, 2009. (In Korean) [Google Scholar]
- Hwang, S.J. Comparative Analysis of Track Performance and Track Running Safety Evaluation According to Railway Track Structures. Master’s Thesis, Seoul National University of Science and Technology, Seoul, Republic of Korea, 2021. (In Korean) [Google Scholar]
- Yang, G.N. Evaluation of Damage Impact According to Displacement Behavior of Subway Box Structures. Ph.D. Thesis, Dongyang University, Yeongju, Republic of Korea, 2022. (In Korean) [Google Scholar]
- Artagan, S.S.; Bianchini Ciampoli, L.; D’Amico, F.; Calvi, A.; Tosti, F. Non-destructive assessment and health monitoring of railway infrastructures. Surv. Geophys. 2020, 41, 447–483. [Google Scholar] [CrossRef] [Scilit]
- Wang, G.; Chen, W.; Cao, L.; Li, Y.; Liu, S.; Yu, J.; Wang, B. Retaining technology for deep foundation pit excavation adjacent to high-speed railways based on deformation control. Front. Earth Sci. 2021, 9, 735315. [Google Scholar] [CrossRef] [Scilit]
- Qin, H.; Zhang, D.; Tang, Y.; Wang, Y. Automatic recognition of tunnel lining elements from GPR images using deep convolutional networks with data augmentation. Autom. Constr. 2021, 130, 103830. [Google Scholar] [CrossRef] [Scilit]
- Lee, S.H. Evaluation of Track Impact Coefficient and Train Running Stability Using Track Alignment Inspection Data. Master’s Thesis, Dongyang University, Yeongju, Republic of Korea, 2023. (In Korean) [Google Scholar]
- Korea Rail Network Authority. Track Maintenance Management Guidelines; KRNA: Daejeon, Republic of Korea, 2016. (In Korean) [Google Scholar]
- Korea Rail Network Authority. Railway Design Standards (Roadbed Part); KRNA: Daejeon, Republic of Korea, 2017. (In Korean) [Google Scholar]
- Seoul Metro. Track Maintenance Regulations; Seoul Metro: Seoul, Republic of Korea, 2023. (In Korean) [Google Scholar]
- Choi, J.Y.; Park, D.R.; Chung, J.S.; Kim, S.H. Dynamic wheel-rail force-based track-irregularity evaluation for ballasted track on serviced railway by adjacent excavation. Appl. Sci. 2022, 12, 375. [Google Scholar] [CrossRef] [Scilit]

Disclaimer/Publisher’s Note: The statements, opinions and data contained in all publications are solely those of the individual author(s) and contributor(s) and not of MDPI and/or the editor(s). MDPI and/or the editor(s) disclaim responsibility for any injury to people or property resulting from any ideas, methods, instructions or products referred to in the content. |
© 2026 by the authors. Licensee MDPI, Basel, Switzerland. This article is an open access article distributed under the terms and conditions of the Creative Commons Attribution (CC BY) license.