


Abstract
When extracting representative paths from large-scale vehicle trajectory data, origin–destination (OD) pairs have typically been treated as a homogeneous unit of analysis. This study used ~2.5 million OD pair–day (OD-day) navigation records collected over 21 days in Bucheon City, Republic of Korea, and evaluated representative paths and links using weighted indices and cumulative explained travel (CET). The results showed that 86.9% of OD-days exhibited a single observed path, whereas 13.1% exhibited multiple paths. Within multipath OD-days, 96.8% (12.7% of all OD-days) were classified as path-dispersed (top-path share ≤ 0.8). Although comprising only 13% of OD-days, multipath cases averaged 8.3 times more observed vehicles than single-path cases and accounted for 55.7% of observed vehicle trips. CET analysis showed that representative-path selection was primarily meaningful for dispersed OD-days. Across all OD-days, a single path covered, on average, 92.9% of an OD-day’s vehicle-kilometers traveled (VKT); on dispersed OD-days, the mean coverage was 45.2%, increasing to 84.7% and 93.5% with two and three paths, respectively. Further, weighted indices aligned substantially closer with the official arterial hierarchy than frequency-based indices: among top-50 representative links, the proportion of high-speed arterials increased from 30% to 80%, against a network average of 4.2%. These findings suggest that representative-path and link extraction should account for OD-day path-structure heterogeneity.
1. Introduction
Large-scale vehicle trajectory data collected through commercial navigation services have fundamentally reshaped network-level travel analyses. Such data allow for the high-resolution observation of actual path use, enabling representative path inference grounded in empirical movement patterns rather than static assignment assumptions [1,2]. Large-scale trajectory data have been extensively surveyed in terms of their processing, analytics, and applications [2,3,4]. However, because raw trajectories are voluminous and redundant, they must be reduced to a manageable set of representative paths that preserve essential travel patterns. These representative paths serve as inputs to applications such as vehicle-kilometers-traveled (VKT) estimation, congestion diagnosis, and emission modeling; therefore, their reliability directly influences the accuracy of downstream analysis.
The underlying assumption that all origin–destination (OD) pairs exhibit a homogeneous path structure has rarely been examined. This homogeneity assumption implies that the OD-level path-count distribution is unimodal and concentrated around a single dominant path; however, the validity of this implication has not been tested on large-scale empirical data. If the path structure of OD pairs is heterogeneous, with only some OD pair–days (hereinafter referred to as OD-days) exhibiting multiple path alternatives and most being dominated by a single path, evaluating a method over all OD pairs is diluted by the many single-path observations and obscures the differences between methods. Therefore, the key question shifts from identifying the superior estimation algorithm to defining an evaluation framework that establishes exactly where and at which unit the representativeness of such large-scale data should be assessed. This study focused on redefining the evaluation framework rather than proposing a new extraction method. Accordingly, this study quantified the proportion of path-consistent versus path-dispersed OD-days and identified the regime in which representative-path methods provide analytical value.
The main contribution of this study lies in redefining the evaluation framework. First, using approximately 2.5 million OD-day records, it was established that the OD path structure can be divided into a single-path-dominant mode and a multipath minority and that the latter, despite representing a minority of observations, accounts for more than half (55.7%) of the observed vehicle trips and is where most path-selection problems arise. Second, on this basis, the evaluation framework was redefined such that representative-path results should be reported separately for the full dataset and for the dispersed subset, with the main emphasis on the latter. Moreover, a contrast in cumulative explained travel (CET) curves (mean within-OD-day coverage of 92.9% overall versus 45.2% for dispersed) empirically demonstrated how evaluation across OD-days obscured the differences between methods. Third, to illustrate this framework at the link level, length- and usage-weighted indices were used to identify administratively defined arterials and compare the results obtained using frequency-based indices against an external reference. The weighted indices are not contributions in themselves; rather, they serve as an illustrative example of how the redefined evaluation framework applies.
To clarify the distinction from the author’s prior work, three points should be explained first. First, the author’s previous study [5] proposed the length- and usage-weighted indices (Lw, ALw, and Ow) and demonstrated their use for representative route extraction; the indices themselves, including their definitions and computational procedures, were fully established in that study. Second, the novelty of this study lies in the unit of analysis and the evaluation framework: the OD pair–day is introduced as the observational unit, OD-days are empirically classified into path-consistent and path-dispersed regimes, and CET is proposed as the criterion for determining where representative-path methods should be evaluated. The previous study [5] did not examine path-structure heterogeneity, nor did it question the homogeneity assumption underlying whole-network evaluation. Third, as is discussed in Section 5, this advancement shows that evaluating methods over all OD pairs dilutes method differences owing to the predominance of single-path-dominant observations (86.9%); therefore, any future comparison of extraction methods, including that of [5], should be conducted on the dispersed subset, which comprised 12.7% of OD-days and accounted for 28.1% of network VKT. The weighted indices reappear here only as worked examples of the framework. The previous study was developed on a different trajectory dataset, whereas the present study applied the indices to an independent 21-day navigation dataset from Bucheon City to investigate a different research question.
The remainder of this paper is organized as follows. Section 2 reviews related work; Section 3 describes the data and characterizes OD path structures; Section 4 presents the indices, the identification of dispersed OD-days, and the evaluation metrics; Section 5 reports the results; and Section 6 discusses the implications and limitations.
2. Literature Review
2.1. Route Choice Modeling and Path Overlap
The starting point of representative-path analysis is the long-standing path overlap problem in route choice modeling [6,7]. When alternative paths share links, choice probabilities become distorted. Accordingly, the path size logit model and its extensions have been proposed [8]. Frejinger and Bierlaire [9] captured correlations through subnetworks, and subsequent studies emphasized data-driven approaches that derive structurally consistent choice sets from observed trajectories [10,11]. Choice-set generation from large GPS trajectory sets also considers road hierarchy preferences and route heterogeneity [12]. These overlap-correction studies have largely focused on behavioral modeling, whereas network-level representativeness has received less attention.
2.2. Trajectory Clustering and Similarity Metrics
Representative paths can be extracted from large-scale trajectory data through trajectory similarity measurements and clustering. Classical similarity measures, such as dynamic time warping and the longest common subsequence, have been widely used to compare spatiotemporal trajectories [13]. More recent work has proposed measures integrating spatiotemporal attributes [14] and clustering models incorporating road-network constraints [15]. Wang et al. [16] presented a scalable framework for discovering the most representative paths from massive trajectories, and the methodological scope was recently expanded to deep-learning-based trajectory analyses [4]. These methods typically assume the OD pair to be a homogeneous unit of analysis, and their clustering results are sensitive to the definition of path similarity and the choice of threshold.
2.3. Link-Level Representativeness and Key-Road Extraction
Many practical applications require link-level representations of network use, rather than path-level representations. Kim et al. [17] proposed a method for determining a representative path set from vehicle trajectory samples. Subsequent studies have identified critical roads from GPS data [18] or estimated the total VKT from large-scale trajectories [19,20]. Frequency-based indices, such as the link passing ratio (LPR), average link usage ratio (ALUR), and overlap ratio (OR), have been widely used [17]. However, they do not reflect link length or functional hierarchy and tend to overrepresent short local roads with high traversal counts. Length- and usage-weighted indices were proposed to address this limitation [5].
2.4. Research Gap and Study Contributions
Despite the methodological advances, these studies share a common premise: they treat the OD pair as a homogeneous unit and apply the same extraction procedure across the network. Heterogeneity in OD-level travel and path structure has only recently been considered [21,22,23], with studies reporting that OD characteristics and the share of expressway use affect route variability [21]. However, in real large-scale trajectories, the OD path structure is divided into consistent and dispersed regimes. The extent to which representative-path-extraction methods provide value across all OD-days has not been sufficiently examined. If most OD-days converge to a single path, evaluations conducted across all OD-days may be dominated by this majority, potentially masking meaningful differences in the performance of competing methods.
This study addresses the above gaps by (i) establishing, with large-scale real-world data, that the OD path structure can be classified into two operational regimes, namely consistent and dispersed; (ii) showing that the benefits of representative-path-extraction methods are primarily realized for dispersed OD pairs; and (iii) comparing, at the link level, the structural information captured by weighted indices with that captured by frequency-based indices within dispersed OD-days.
3. Data and Path-Structure Characterization
3.1. Data
This study used vehicle trajectory data collected from SK T-map (TMAP Mobility Co., Ltd., Seoul, Republic of Korea), South Korea’s commercial navigation service. The study area was Bucheon City, Republic of Korea, and data were collected in 2025 over 21 days: one week each in June (1–7), July (6–12), and August (3–9). The raw data comprised day-level records keyed to OD pairs, with each record containing per-vehicle link sequences, link lengths, and travel volumes for a given date and OD pair. The total number of OD-days was approximately 2.5 million (2,499,175).
The link sequence of each vehicle was ordered by the travel sequence (seq) and reconstructed into a complete path. The paths belonging to the same OD pair were aggregated to form a candidate path set for each OD pair. The analysis was conducted at two network scales: first, the full network including the Gyeongin Expressway (ROAD_NO = 100) and, second, the internal road network of Bucheon, excluding the expressway. Because expressway segments are structurally dominated by simple single paths and can distort the multipath characteristics of the internal network, the core analysis, which concerns the path dispersion structure, was conducted on the internal network. The internal network comprised 15,927 links, each characterized by road class (ROAD_CATE), road hierarchy (ROADLEVEL), lane count (LANE), and speed limit (SPEEDLH) attributes.
Map matching and preprocessing were performed by the data provider; therefore, this study did not have direct access to the details of the matching algorithm or to the dataset-specific matching accuracy. This represents a limitation of the data, as errors in the inferred link sequence may affect subsequent analyses. Nonetheless, all representativeness indices were computed on map-matched link sequences rather than on raw GPS coordinates, substantially reducing the direct effect of point-level positioning errors. Furthermore, the length-weighted indices used in this study structurally suppressed the influence of short, fragmented links, which are generally the most sensitive to matching uncertainty. Although these factors help mitigate the effects of matching errors, they do not eliminate them entirely, and this limitation should be considered when interpreting the results.
3.2. Basic Statistics of OD Path Configurations
At the OD-day level, the mean path count was 1.28, and the 25th, 50th, and 75th percentiles were all 1; the maximum was 307 paths, resulting in an extremely long-tailed distribution. In total, 86.9% of OD-days exhibited a single observed path, and the remaining 13.1% exhibited two or more. Multipath OD-days were strongly associated with observation intensity: they averaged 9.3 observed vehicles versus 1.1 for single-path OD-days (an 8.3-fold difference) and accounted for 55.7% of all observed vehicle trips. Part of this association is mechanical: an OD-day observed with a single vehicle can exhibit only one path. Therefore, these figures describe where multipath structure is observable rather than a behavioral classification. Table 1 compares OD-days by observed volume. Once at least two vehicles are observed, a multipath structure becomes the norm rather than the exception (49–76% across strata), and its prevalence declines with volume. This indicates that high-volume OD-days are anchored on dominant corridors rather than that dispersion is a small-sample artifact.
Table 1.
Share of path-dispersed OD-days by observed vehicle volume. Single-vehicle OD-days cannot exhibit multiple paths by construction. For OD-days with 2–5 vehicles, any path heterogeneity mechanically yields a top-path share of 0.8 or below.
On this basis, an operational classification was applied within multipath OD-days using the top-path share: an OD-day was classified as path-dispersed if its top-path share was 0.8 or below, and as path-consistent otherwise. Thus, 96.8% of multipath OD-days, representing 12.7% of all OD-days, are classified as dispersed (11.1% with a share of 0.5 or below; 1.6% between 0.5 and 0.8). These two regimes are operational analytical categories rather than statistically detected modes. Dispersed OD-days constitute the analytical target for which representative-path extraction is meaningful (see Section 5.1).
Throughout the paper, “single-path” and “multiple paths” describe the observed path count of an OD-day; “path-consistent” and “path-dispersed” denote the operational classification; and every reported share is identified as a share of OD-days, of observed vehicle trips, or of VKT.In principle, a single vehicle taking a different path could render an OD-day dispersed. In practice, the second most used path on dispersed OD-days carries an average volume share of 37.9% (median 50%), and in 96.5% of dispersed cases, it carries at least 10% of the volume. “Single-detour” cases, in which it carries less than 5%, account for only 1%. The dispersed regime therefore reflects travel genuinely splitting across multiple paths, not measurement noise or incidental detours.
3.3. Structural Context of Dispersed OD
Path dispersion is systematically associated with network composition. When the analysis included the expressway (Gyeongin Expressway), the travel concentration of representative paths (ALw) was approximately 0.64. However, this value reduced to approximately 0.38 when the analysis was restricted to the internal network. The expressway was used almost exclusively as a single dominant path for long-distance, direct OD pairs, thereby artificially inflating the dominance of the representative path. Consequently, including expressways in the overall analysis tended to mask the underlying path dispersion. Because the objective of this study was to examine the travel patterns in contexts where path selection actually occurs within the urban interior, expressways were excluded from the analysis. This ensured that the multipath characteristics of the internal network were not diluted by the single-path dominance of expressways. This choice excludes expressway-dependent OD pairs; therefore, the conclusions are explicitly confined to intra-urban travel.
However, even when the paths are dispersed, they are not entirely heterogeneous in space. The overlap (Ow) between the representative paths and the full link pool was approximately 0.65 in the internal network, indicating that multiple paths within the same OD shared a substantial portion of their link set. In other words, even in dispersed OD pairs, travel recurs in modified forms over a spatially similar set of links, which forms the structural basis explaining why path-level representative-path selection does not significantly change travel-distance aggregates (see Section 5.2).
4. Methodology
4.1. Length- and Usage-Weighted Indices
The analysis employs three length- and usage-weighted indices proposed by the author in a previous study [20]. Their role in this study is explained at the end of the Introduction. For self-containment, their definitions are restated below. All three indices weigh the link-passing frequency by link length to correct for the over-representation of short local roads. The weighted LPR (Lw) is defined, for link l of an OD pair (i → j), as the passing-frequency ratio multiplied by a link-length weight:
Here, is the total number of trajectories for the OD pair; is the number of trajectories passing through link ; is the length of link ; and is the mean length of all links for the OD pair. The first factor captures traversal frequency, and the second factor down-weights short but frequently traversed links. The weighted ALUR (ALw) jointly reflects usage frequency and within-path length contributions:
Here, is the total length of the path r; is the number of trajectories on path r; and is the number of trajectories across all paths containing the link . For a single-path OD, equals ; however, the two diverge when multiple paths exist, and low values across many links indicate high route diversity. The weighted OR (Ow) evaluates the similarity of two paths based on the length and usage of their shared links:
Here, and are the shared and union link sets of the two paths. The numerator is the usage-weighted cumulative length of shared links, and Ow lies between 0 and 1, with higher values indicating greater structural similarity. Detailed derivations are provided in [5].
A small example illustrates the computations. Consider an OD pair with T = 10 trajectories and two paths: = {a, b} with 6 vehicles and = {a, c} with 4 vehicles, where links a, b, and c are 800 m, 300 m, and 600 m long respectively (mean link length = 566.7 m; path lengths 1100 m and 1400 m). By Equation (1), = (10/10) (800/566.7) = 1.41, = (6/10) (300/566.7) = 0.32, and = (4/10) (600/566.7) = 0.42. The frequency-only ratio ranks b (0.6) above c (0.4), whereas Lw reverses this order: the longer, less frequently used link c outranks the short local link b, which is the intended correction. By Equation (2), = 1.41 × (1/10) [6(800/1100) + 4(800/1400)] = 0.94. By Equation (3), with the shared set {a}, (, ) = (1.41 × 800)/(800 + 300 + 600) = 0.66.
4.2. Identification of Path-Dispersed OD-Days
Rather than uniformly applying representative-path extraction to all OD-days, this study restricts the analytical target to path-dispersed OD-days, identified through the two stages described in Section 3.2. First, single-path OD-days (86.9%) are set aside: because only one observed path exists, the problem of representative-path selection does not arise. Second, within multipath OD-days, an OD-day is classified as dispersed if its top-path share is 0.80 or below. This threshold is an operational cut rather than a detected boundary. Its choice is, however, not consequential: varying the threshold from 0.50 to 0.90 changes the dispersed share of OD-days only from 11.1% to 13.0%, the dispersed share of VKT from 21.7% to 32.9%, and dispersed CET(1) from 42.7% to 45.9% (Table 2), leaving all conclusions unchanged. Section 5.1 further supports this separation.
Table 2.
Sensitivity of the two-regime classification to the top-path-share threshold t. Dispersed CET(N) is averaged over OD-days classified as dispersed at each t.
As a preprocessing step, nearly identical paths within each dispersed OD-day were merged by hierarchical agglomerative clustering with average linkage. The pairwise distance between paths Pa and Pb was defined as 1 − Ow(Pa, Pb), the dendrogram was cut at a distance of 1 − τ, and clustering was performed independently for each OD-day; within each cluster, the highest-volume path was retained as the representative, with the volumes of the merged paths assigned to it. The threshold τ = 0.6 was adopted because Ow ≥ 0.6 implies that the usage-weighted shared length exceeds 60% of the union length; therefore, the paths traverse essentially the same corridor. A sensitivity analysis over τ = 0.50–0.70, conducted on a random sample of 50 OD pairs observed over the study period (169 dispersed OD-day observations), showed that the mean number of clusters per OD-day varied only from 1.38 to 1.60 and CET(2) and CET(3) varied by less than 1.3 percentage points (Table 3). CET(1) decreased monotonically from 86.0% to 78.0% as τ increased. This decrease is a definitional consequence of stricter merging rather than instability, and it does not affect the path-consistent/path-dispersed classification (Section 3.2), which precedes clustering and is independent of τ. Clustering reduced the mean number of candidate paths per dispersed OD-day from 2.73 to 1.51 at τ = 0.6.
Table 3.
Sensitivity of the auxiliary clustering to the merge threshold τ (random sample of 50 OD pairs; 169 dispersed OD-day observations). CET(N) denotes the cumulative explained travel of the top-N clusters.
4.3. Evaluation Metrics
To assess how well a representative path set explains the travel pattern, this study adopted the CET metric introduced in a previous study [19]. Within each OD-day, paths are sorted in descending order of observed volume, and CET(N) is the cumulative VKT (path length × volume) of the top-N paths divided by the total VKT of that OD-day. The reported CET curve is the unweighted average of CET(N) across OD-days, so each OD-day contributes equally regardless of its volume. Paths are ranked by volume because the representative path is interpreted operationally as the path most frequently chosen. Ranking by per-path VKT instead changes the mean CET by at most 0.4 percentage points over all OD-days and 3.4 points for the dispersed subset; therefore, the results are robust to the ranking rule. CET is computed separately for all OD-days and for the dispersed subset (Section 5.1). At the link level, the top-N link sets from the frequency-based and Lw-based rankings are compared for N = 50, 100, 200, and 500 in terms of overlap rate, mean link length, speed limit, and concordance with the official road hierarchy (road class, speed limit, and lane count).
5. Results
5.1. Path-Structure Heterogeneity and Two Operational Regimes
The path structure of 2,499,175 OD-days was characterized in two stages (Section 3.2): 86.9% exhibited a single observed path, and within the 13.1% of multipath OD-days, 96.8% (12.7% of all OD-days) were classified as path-dispersed. Multipath OD-days averaged 9.3 observed vehicles versus 1.1 for single-path OD-days and carried 55.7% of observed vehicle trips. Accordingly, the CET analysis presented below focuses on the dispersed subset, where the path-selection problem actually occurs.
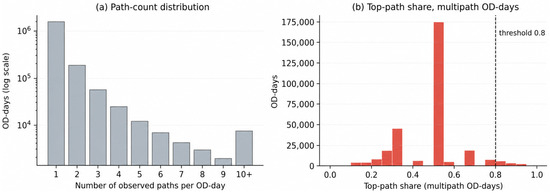
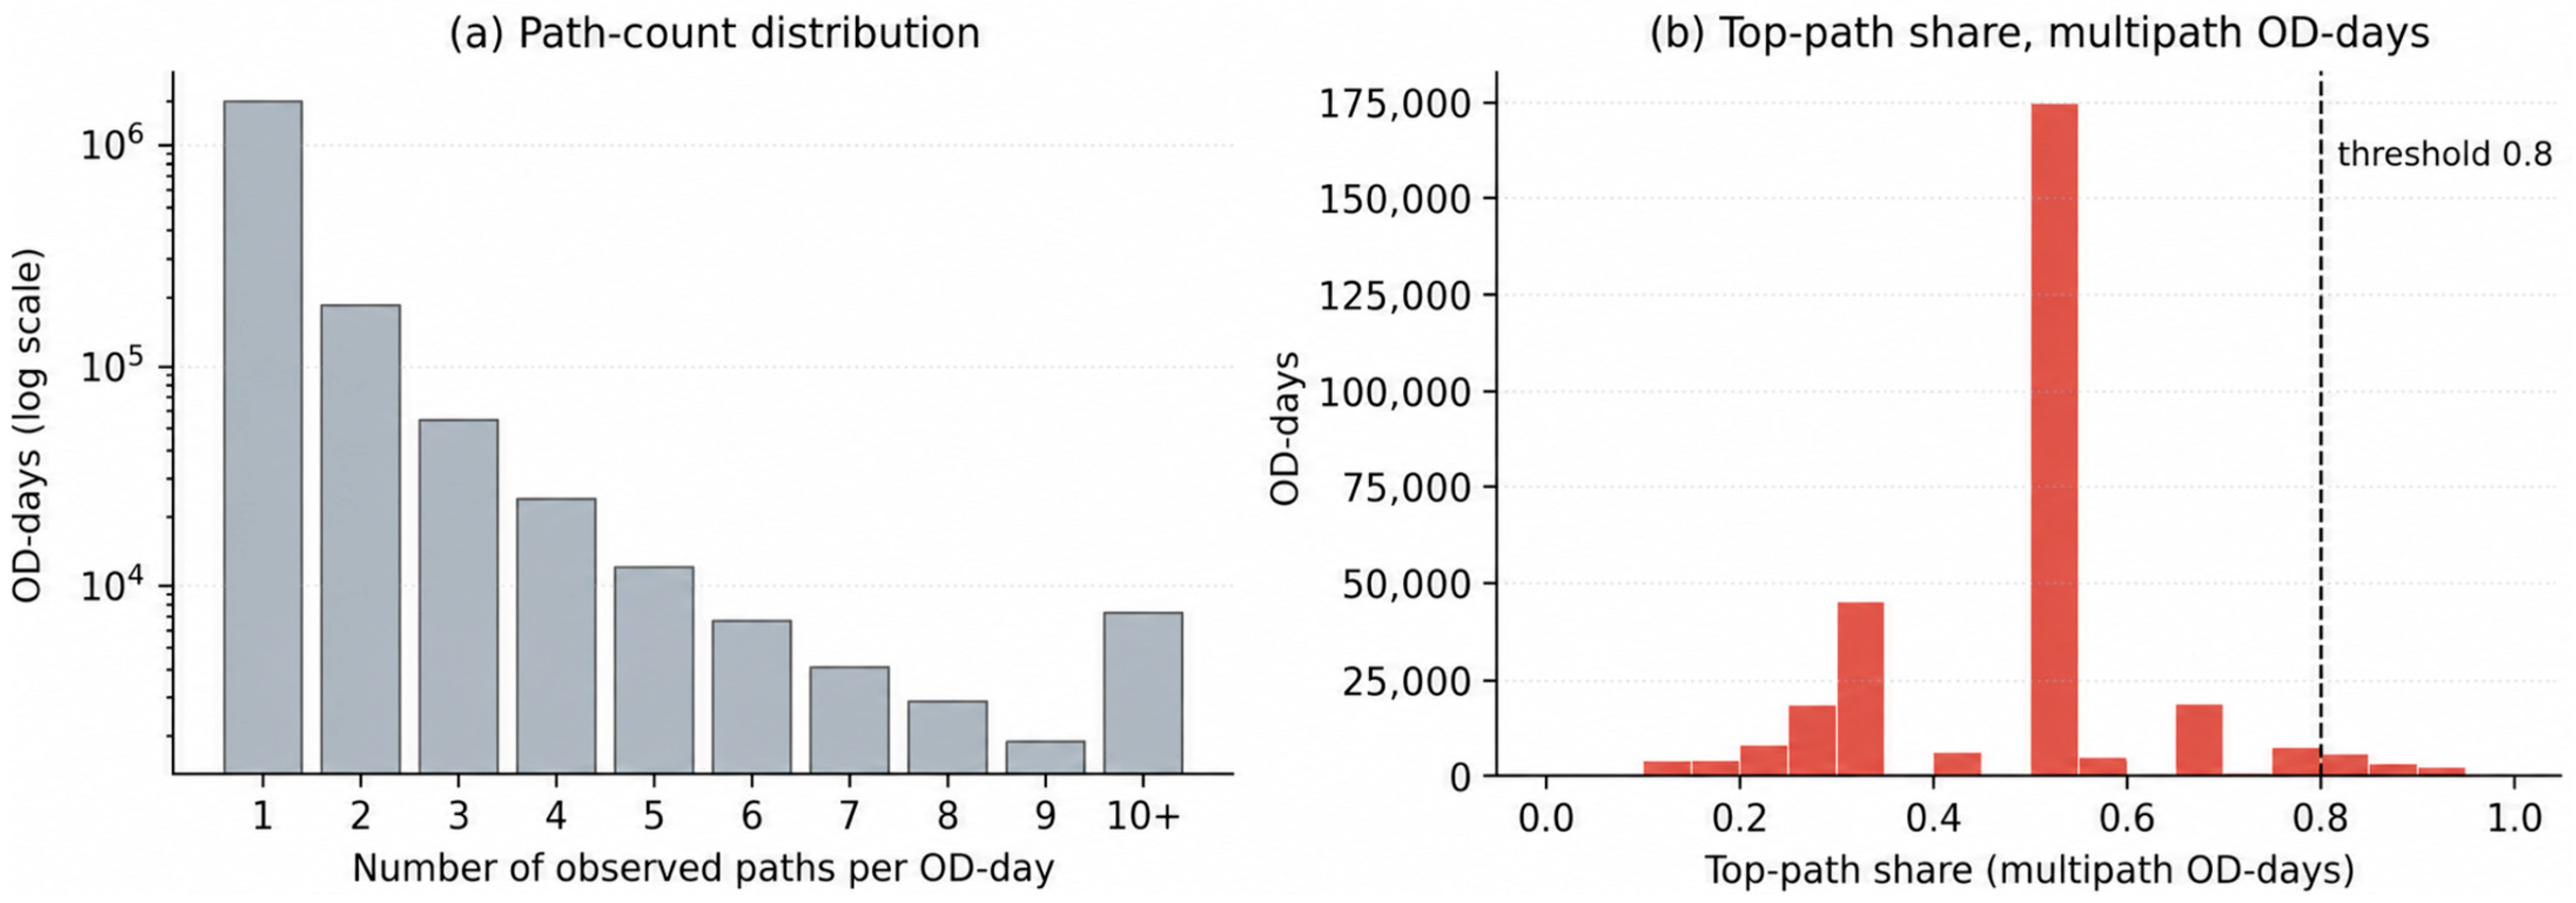
The distribution underlying this classification is shown in Figure 1. The path-count distribution is highly right-skewed, with most observations concentrated in the single-path category, and declines smoothly, with no natural separating gap. The consistent and dispersed regimes are therefore operational analytical categories imposed on this continuum, not statistically detected modes. Their usefulness is based on differences in the behavior of the two categories in terms of CET. Further, the classification is insensitive to the threshold choice (Table 2) and holds across volume strata (Table 1).
Figure 1.
Distribution of (a) the number of observed paths per OD-day and (b) top-path share among multipath OD-days. The mass is concentrated in the single-path category and declines smoothly, with no separating gap between the regimes.
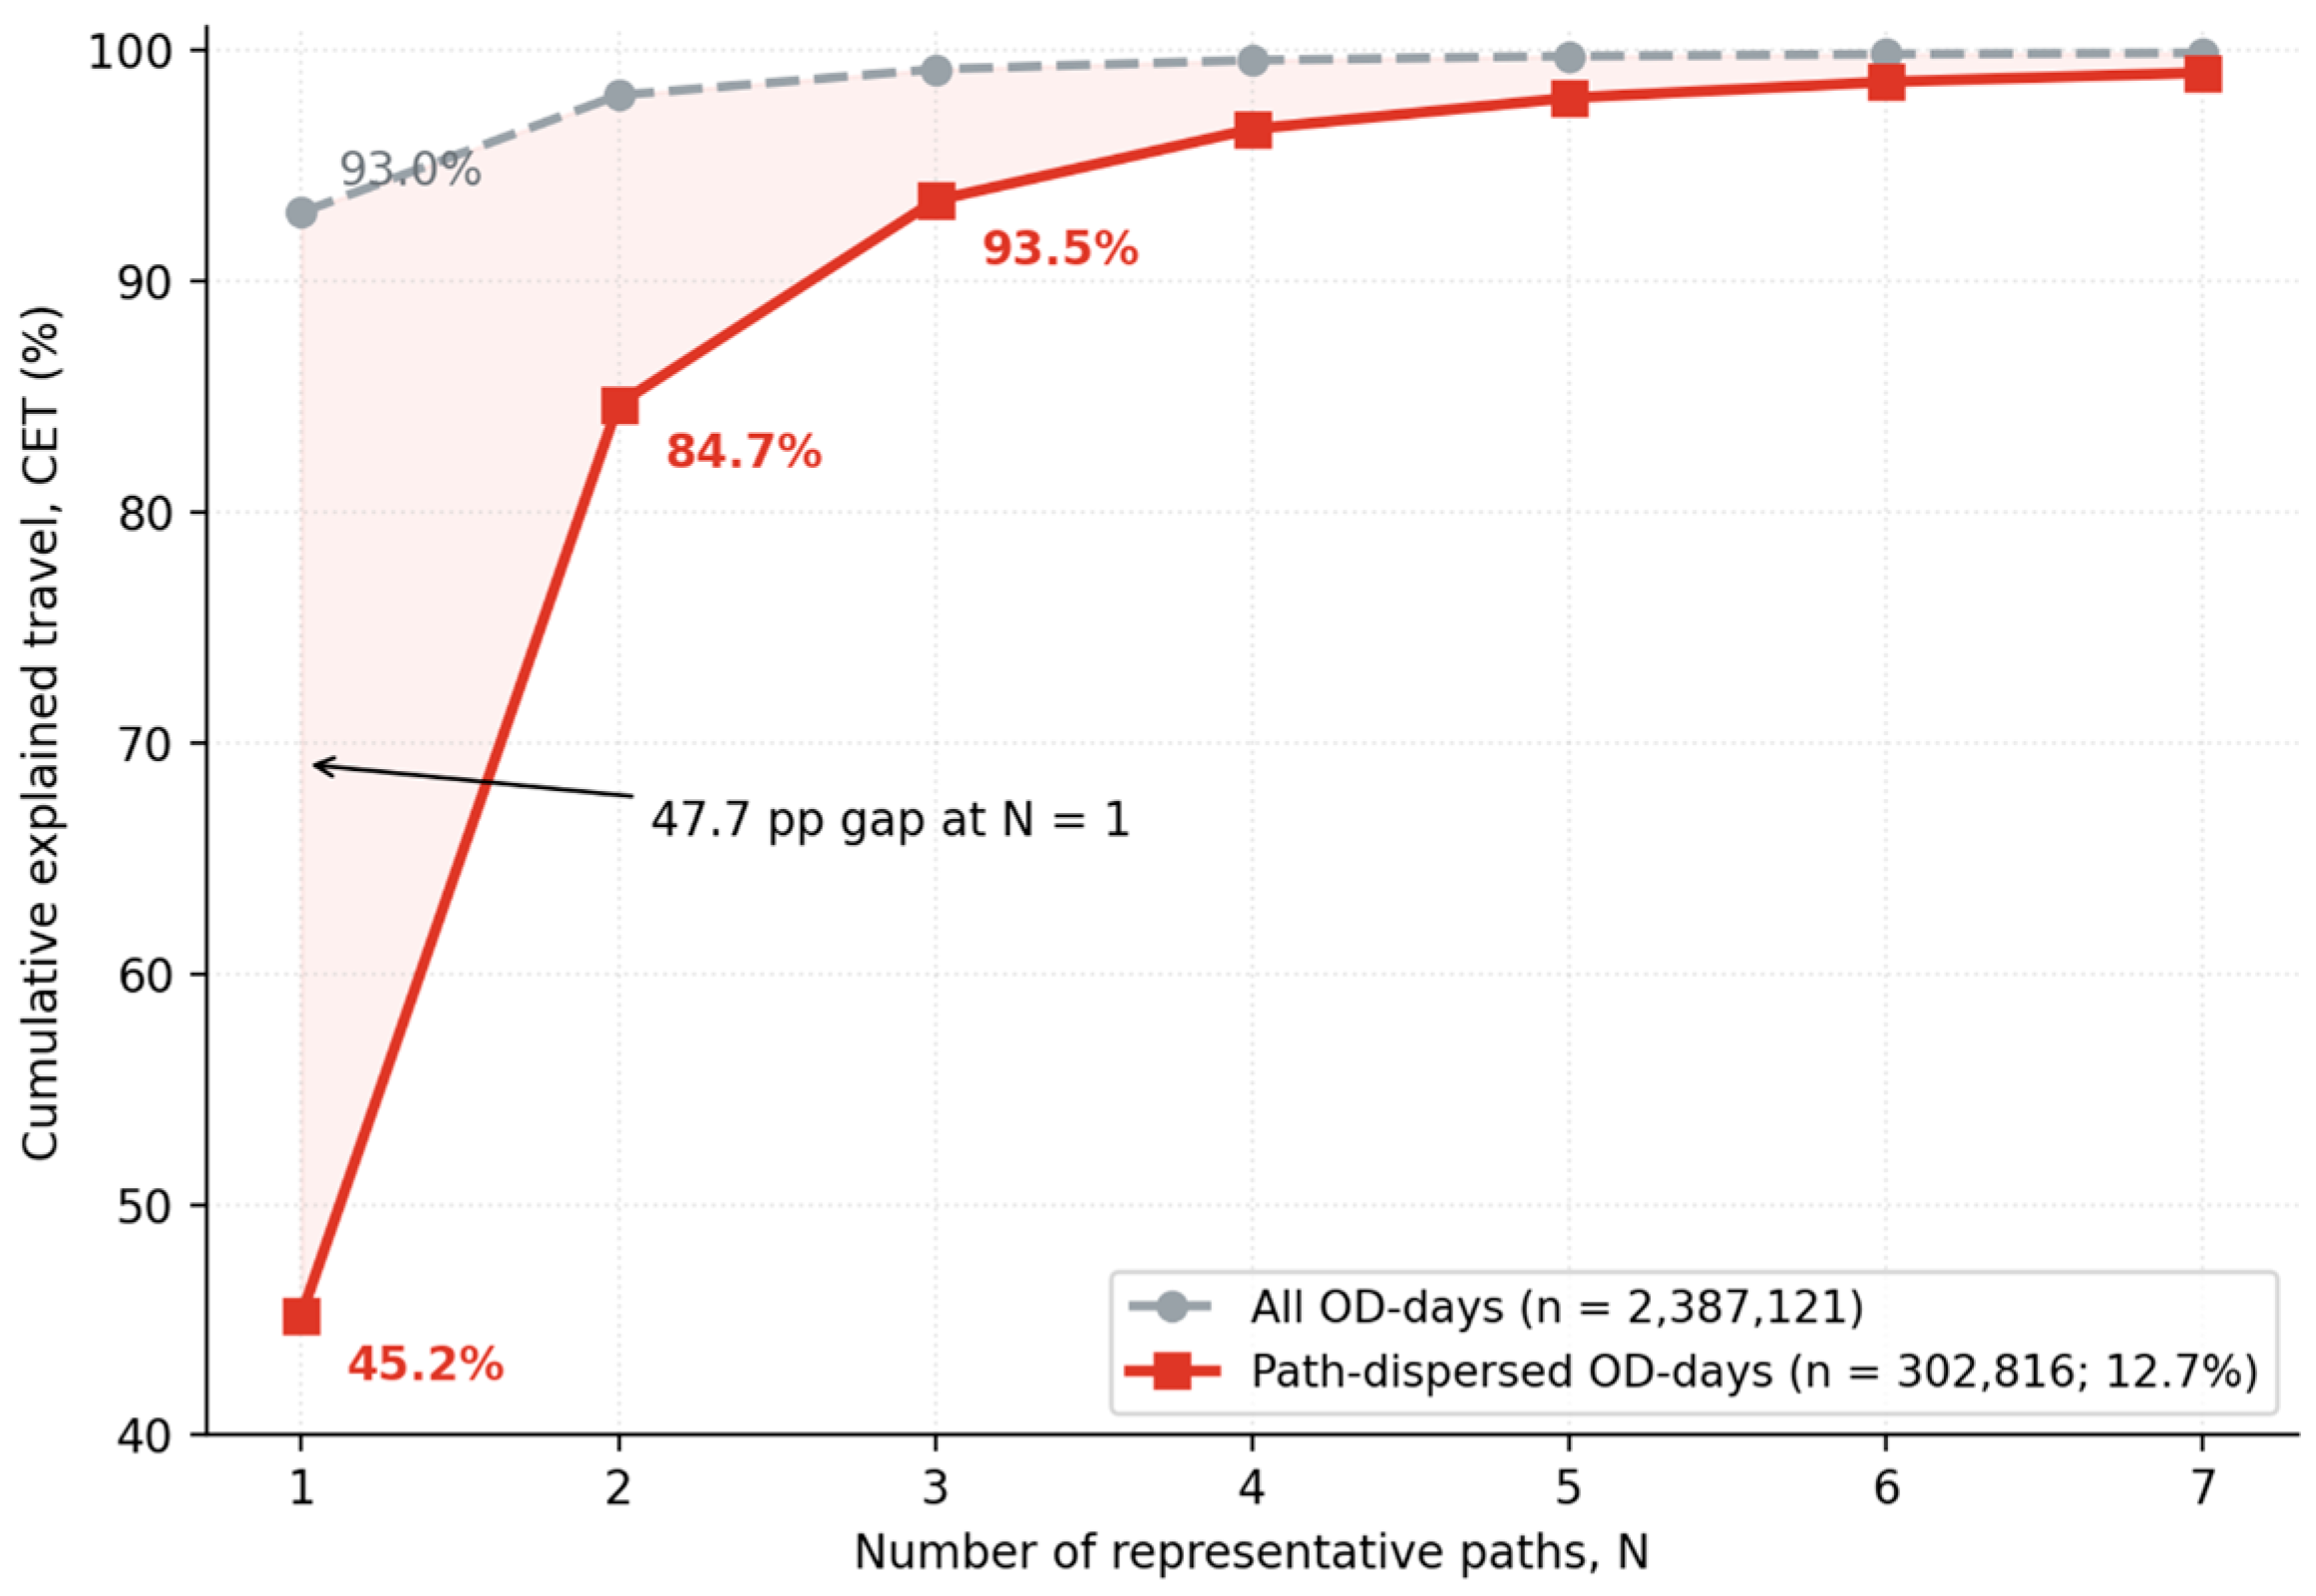
The CET dichotomy is shown in Figure 2. Averaged over all OD-days, a single representative path covers 92.9% of an OD-day’s VKT, and the curve is essentially saturated at N = 2 (98.0%). Restricted to dispersed OD-days, the mean CET(1) is only 45.2%, rising to 84.7% and 93.5% at N = 2 and N = 3, respectively. On a globally VKT-weighted basis, the corresponding single-path coverage is 81.5% overall and 40.8% within the dispersed subset—lower than the unweighted means because high-VKT OD-days are disproportionately multipath (Table 1). Representative-path selection is thus consequential mainly within the dispersed subset; accordingly, evaluations should report results for the full dataset and for the dispersed subset separately, with the main emphasis on the latter, since over the full dataset any extraction method yields near-identical aggregate coverage, diluted by the 87.3% of OD-days classified as consistent.
Figure 2.
Cumulative explained travel (CET) as a function of the number of representative paths (N). The mean within-OD-day VKT coverage of a single representative path is 92.9% over all OD-days; restricting to path-dispersed OD-days (12.7% of all OD-days) yields a steep curve, reaching 45.2%, 84.7%, and 93.5% at N = 1, 2, and 3, respectively.
Path dispersion is better viewed as a state of the OD-day than as a fixed property of the OD pair. Among OD pairs observed on at least three days, 54.3% were always consistent, 44.9% alternated between the two regimes, and only 0.7% were always dispersed. These findings indicate that the same OD pair can change between dispersion regimes with demand and congestion. Hence, the OD-day, not the OD pair, is the appropriate unit.
The analytical strategy of the study can be described as follows: representative-path extraction should be evaluated using dispersed OD-days, where the selection problem exists, rather than across the full population. The next section examines the link-level information that the weighted indices provide within this subset.
This finding defines the analytical strategy used in this study. The performance and methodological choices of representative-path extraction should be evaluated only on dispersed OD-days; an evaluation that considers all OD-days is diluted by the excessive consistent OD-days and hides the differences between methods. The next section examines how, within these dispersed OD-days, the length- and usage-weighted indices provide structurally different information at the link level that differs from that revealed by simple frequency-based indices.
5.2. Structural Validity of Weighted Indices at the Link Level
In Section 5.1, it was confirmed that the region in which representative-path selection was meaningful was confined to dispersed OD-days. However, even within a dispersed OD-day, representative-path selection at the path level showed no substantial difference between the length- and usage-weighted indices and simple frequency-based indices. This is because the alternative paths within the same OD-day were similar in terms of travel distance; the path-level aggregates remained relatively unchanged regardless of the chosen representative path. Therefore, the diagnostic value of the weighted indices lies at the link level, not in path selection.
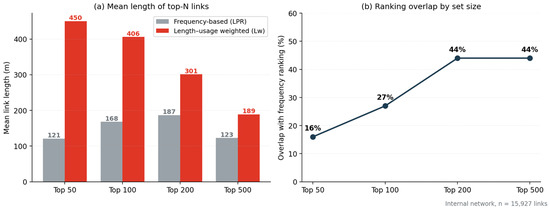
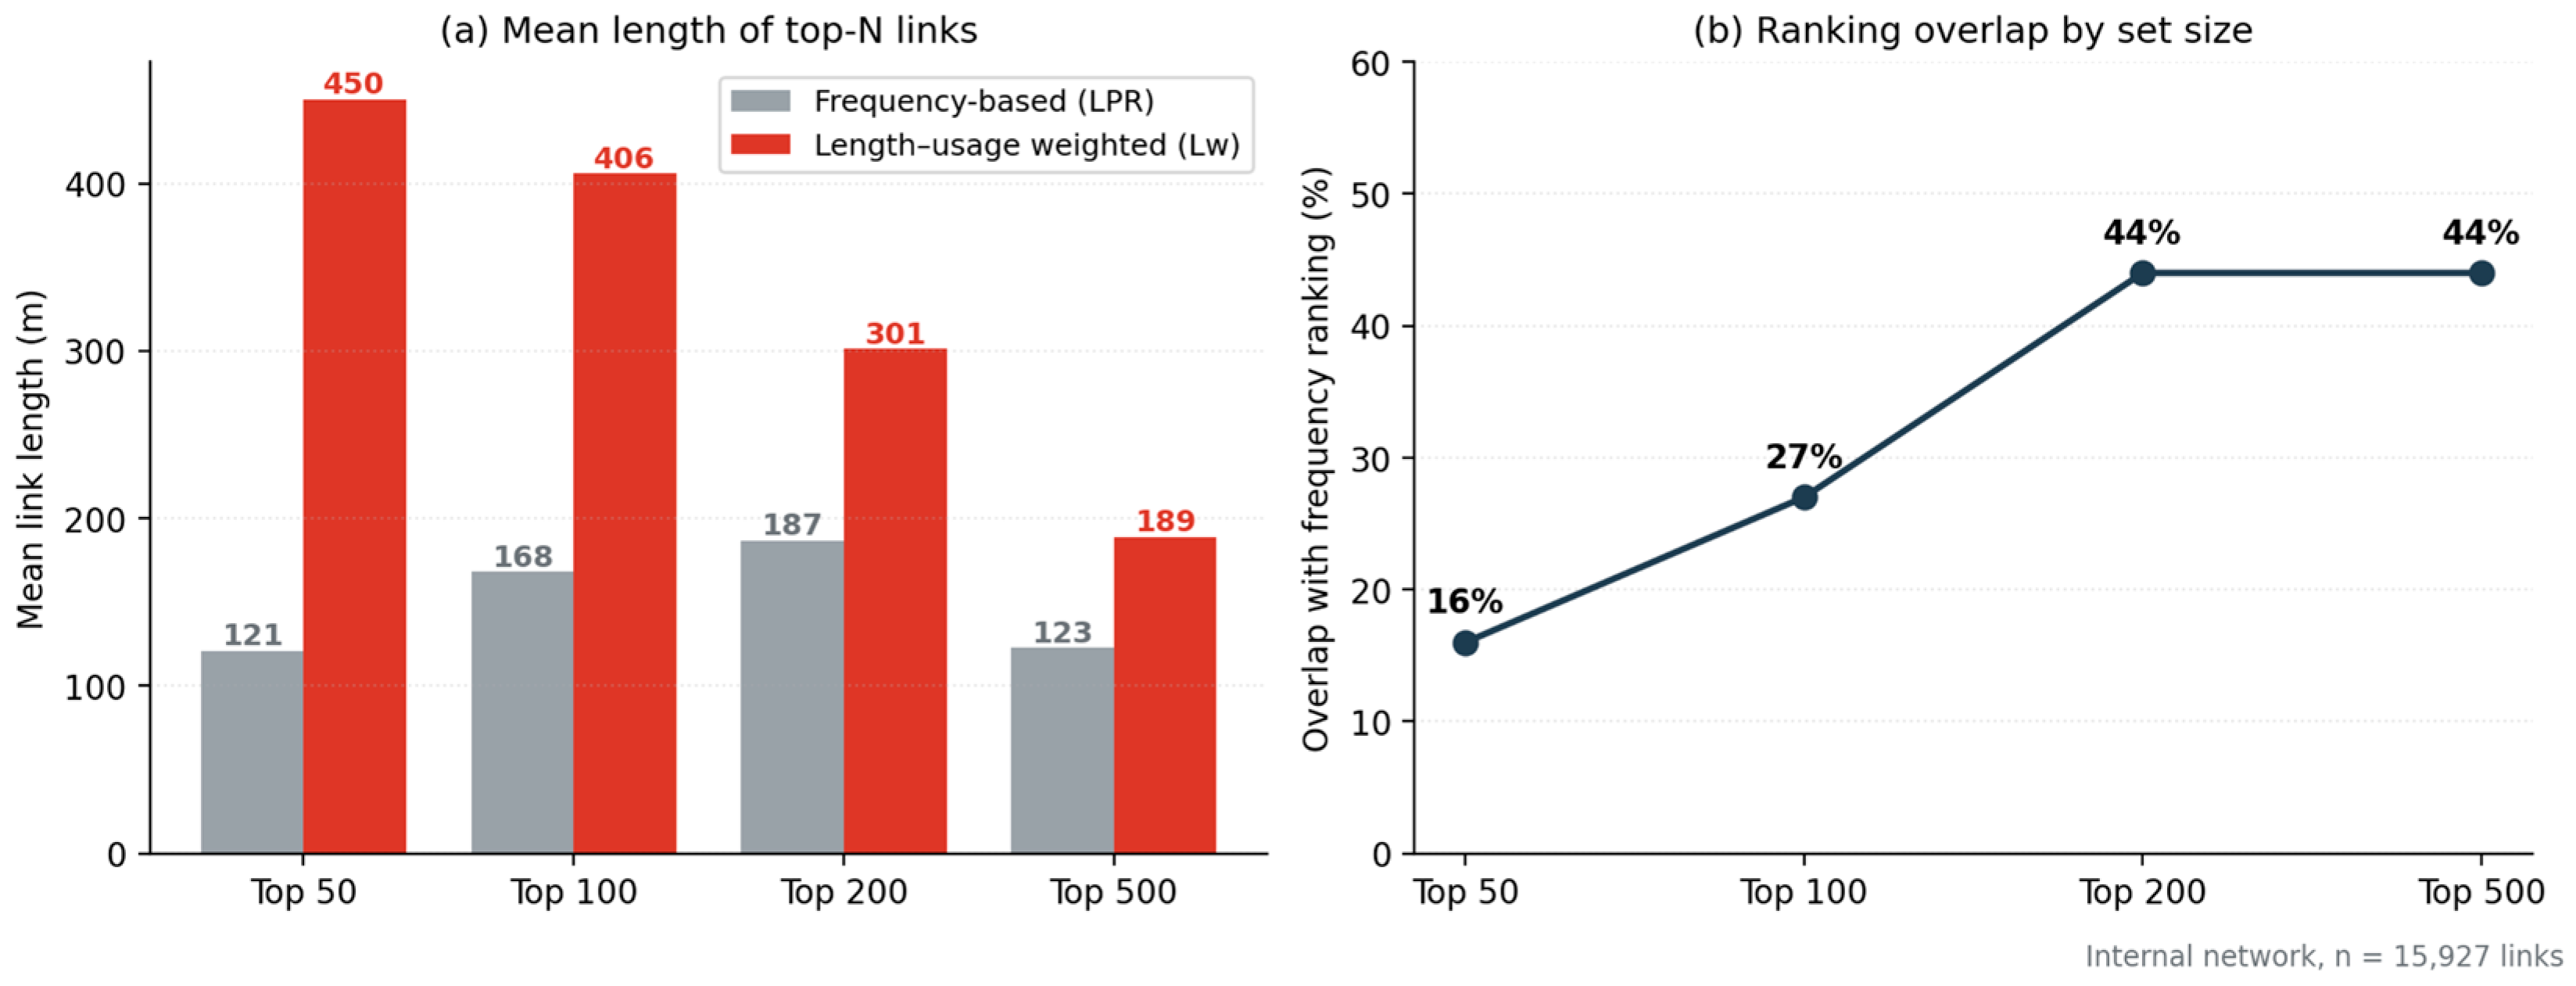
A comparison of the frequency-based ranking with the weighted-index (Lw) ranking at the link level showed that the representative link sets identified by the two indices diverged. Among the top-50 representative links, the overlap between the two rankings was only 16%, and even among the top 100, it was only 27% (Figure 3b). Expanding the comparison to the top-200–500 links increased the overlap to 44%, indicating that the difference between the two indices was concentrated in the most critical links within the network. Therefore, the weighted index is not merely a correlated variant of the frequency-based index but also provides distinct information regarding the most important representative links in the network structure.
Figure 3.
Link-level comparison of the frequency-based index and the weighted index (Lw): (a) Mean length of the top-N representative links; the weighted index identifies longer, higher-hierarchy arterial links. (b) Overlap with the frequency ranking; the difference between the two methods is highest among the top links.
The direction of this difference is consistent with the design intent of the weighted index (Figure 3a). The mean length of the top-50 representative links according to the frequency ranking was 121 m, whereas that of the top-50 representative links according to the weighted index was 450 m (approximately 3.7 times longer). The mean speed limit also increased from 55 to 80 km/h, showing that the weighted index identified long, high-grade arterial links instead of short backstreets or turning segments. This demonstrates that length weighting structurally corrects the tendency of frequency indices to overrepresent short links based on the traversal count alone.
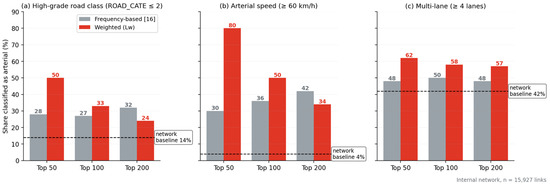
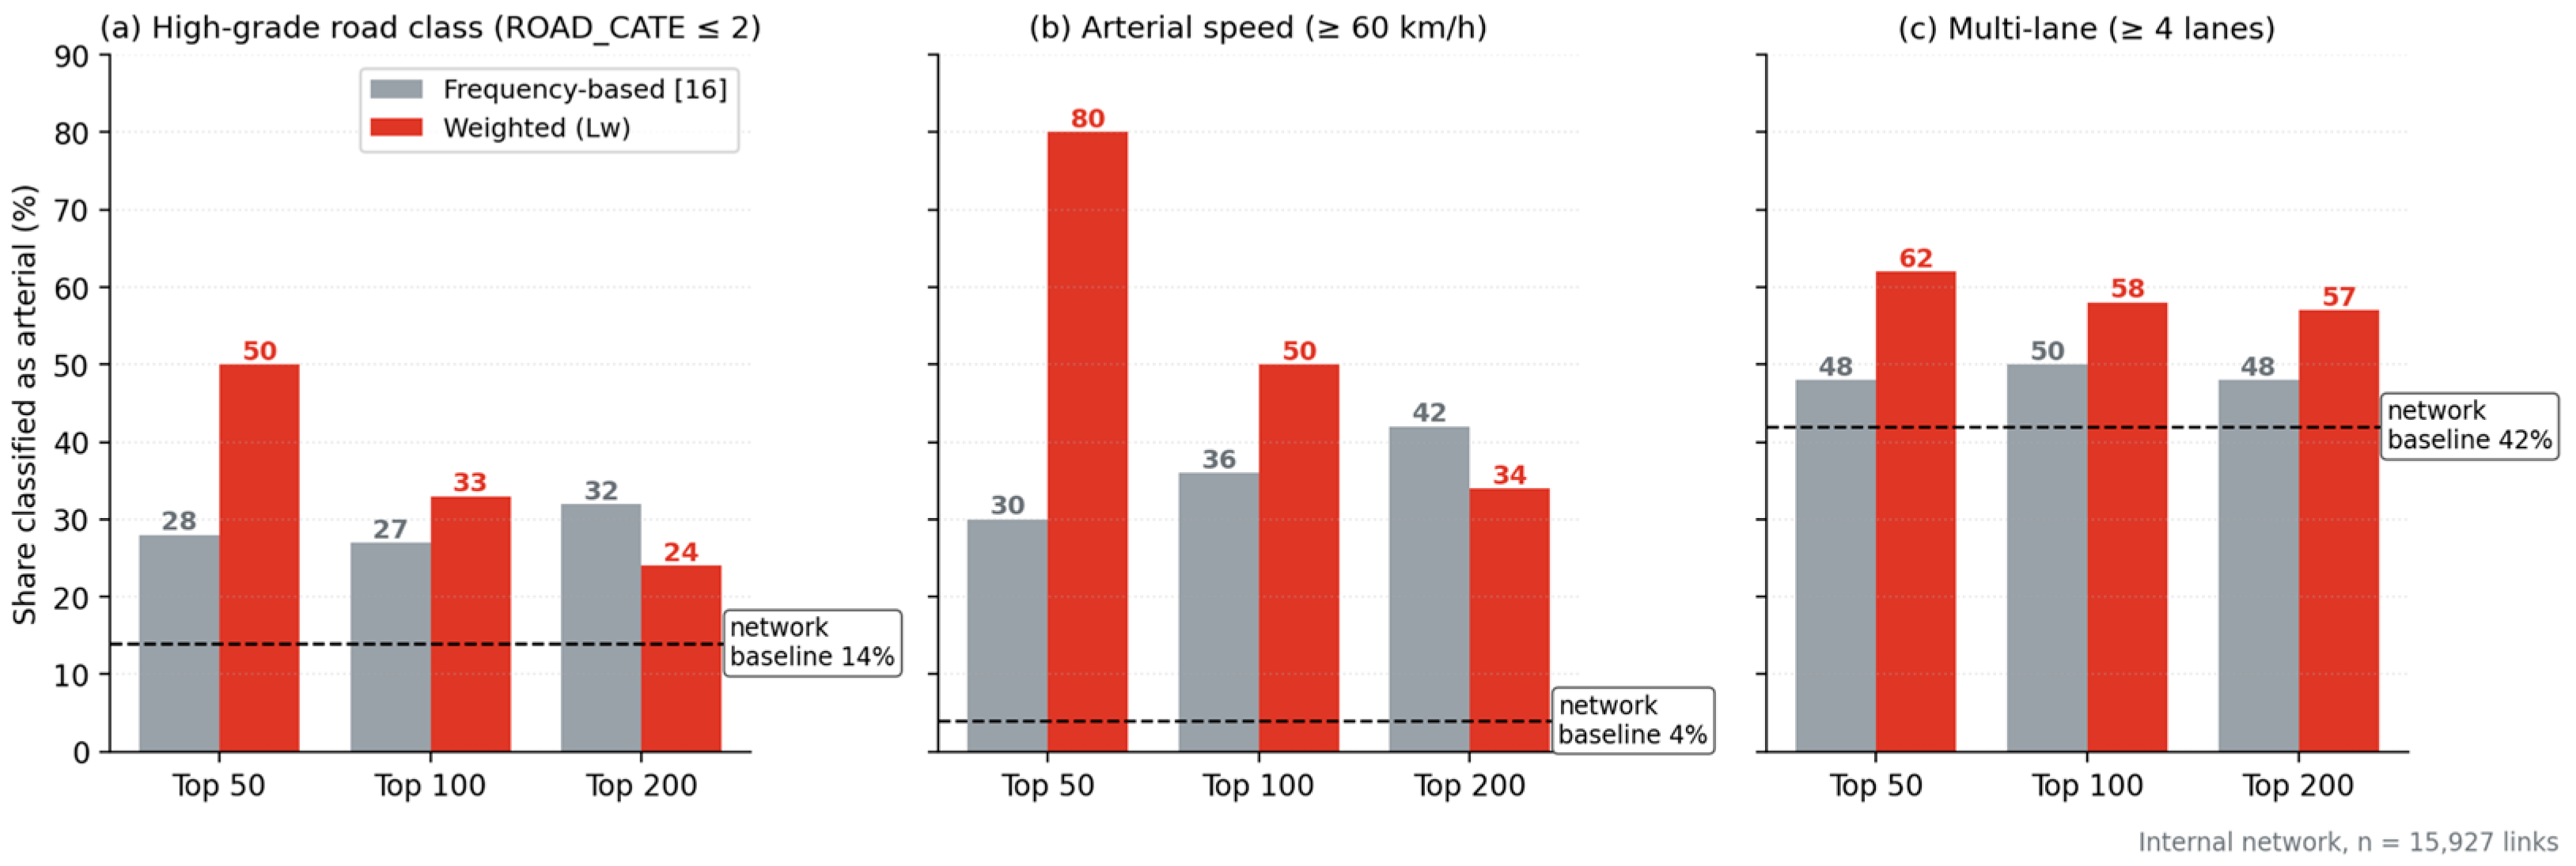
This difference is consistent with, though not independent of, the design of the index. Because Lw weights by length, its preference for longer links is expected by construction; the comparison against the official road hierarchy (Figure 4) should therefore be interpreted as a check of construct consistency rather than as an independent validation. High-speed arterials (speed limit ≥ 60 km/h) constitute 4.2% of network links, yet account for 30% of the top-50 frequency-based links and 80% of the top-50 links identified by Lw (Figure 4b). By road class (ROAD_CATE ≤ 2), the corresponding shares are 28% and 50% (Figure 4a); and by lane count (≥4 lanes), they account for 48% and 62%, respectively, compared with a network baseline of 42% (Figure 4c). Across all three attributes, the Lw selection concentrates more strongly on administratively defined arterials, indicating that the index behaves as intended; establishing superiority for downstream applications would require an external criterion independent of length, which is left to future work.
Figure 4.
Concordance of top representative links with the official road hierarchy: frequency-based [16] vs. weighted index (Lw). (a) Road class ROAD_CATE ≤ 2, (b) speed limit ≥ 60 km/h, and (c) number of lanes ≥ 4. Dashed lines represent the network-wide averages (baselines). Across all three attributes, the weighted selection concentrates more strongly on administratively defined arterials, consistent with its length-weighted construction; the difference narrows as the set expands to the top 200.
However, this effect was confined to the top links. At the top-500 level, the difference in the mean link length between the two rankings narrowed to 123 m vs. 189 m, and the overlap converged to 44%. Therefore, the structural identification ability of the weighted index was most pronounced when selecting a small number of representative links that formed the core skeleton of the network, and it gradually converged with the frequency-based index across the full link set. This study does not claim the weighted index as a replacement for the frequency index; rather, it positions it as an index that provides complementary and structurally valid information for identifying the most important links in the network structure.
5.3. Comparison with Existing Methods
To compare this proposed approach with existing representative-path/link-extraction methods, representative prior studies are reviewed in two categories: first, frequency-based representativeness methods that can be directly applied to the same data for quantitative comparison; and second, methods that, owing to differences in algorithm and data requirements, are difficult to apply directly and are instead compared at a structural and conceptual level. Therefore, the frequency-based ranking and the weighted index (Lw) ranking were directly compared using the same data (Bucheon internal network; Table 4).
Table 4.
Comparison of representative-link characteristics: frequency-based method [17] Kim et al., 2016) vs. this study’s weighted index (Lw).
The representative-path-set determination method proposed by Kim et al. [17] relies on frequency-based indices, such as the LPR, and has the same computational structure as the simple frequency criterion used in this study. For the top-50 representative links, the frequency-based method selected links with a mean length of 121 m and a mean speed limit of 55 km/h, whereas the weighted index selected links with a mean length of 450 m and a mean speed limit of 80 km/h. The overlap between the two rankings was only 16%, indicating that the weighted index identified a structurally different representative link set. This difference gradually narrowed as the set expanded to the top 200 (overlap of 44%), confirming that the distinction between the two methods was concentrated in the core skeleton of the network.
Table 5 summarizes their primary analytical focus, representativeness evaluation unit, and relationship to this study.
Table 5.
Comparison of the primary analytical focus and evaluation unit between existing representative-path methods and this study. The table reports differences in the primary analytical focus and the unit of representativeness evaluation; the relative superiority of the methods is not compared. This study complements existing methods at the level of the evaluation unit.
The key difference lies in the assumed conditions of application. Existing methods provide sophisticated path-discovery and clustering algorithms under the assumption of homogeneous OD pairs and are valid and precise. Rather than competing with such approaches, this study focuses on the OD-day region, where the homogeneity assumption no longer holds and path dispersion is present. In this sense, the proposed framework is complementary to existing methods rather than an alternative framework.
6. Discussion
6.1. Structural Implications
The central finding is that, in large-scale trajectory data, representativeness is not distributed homogeneously across the network but is localized to volume-concentrated dispersed OD-days. Two results support this finding. First, multipath OD-days constitute only 13% of observations yet account for 55.7% of observed vehicle trips, and nearly all of them are path-dispersed; the path-selection problem is therefore concentrated where demand is concentrated. Second, the same OD pair changes its dispersion status over time; therefore, representativeness should be understood as a state of the OD-day rather than a fixed property of the OD pair.
For evaluation design, this means that performance computed over all OD-days makes any technique appear highly explanatory (a mean within-OD-day coverage of 93% from a single path) and obscures differences among competing methods; evaluations should therefore report the full dataset and the dispersed subset separately, with the main emphasis on the dispersed subset, where path selection actually occurs. Algorithmic advances in choice-set generation [10,11,12], scalable path discovery [16], and network-constrained trajectory clustering [15] have improved extraction accuracy under an implicit homogeneity assumption; this study does not challenge their validity but identifies the regime in which they are most informative. The two-level selectivity of the framework (dispersed-OD identification at the path level and core-link selection at the link level) defines the asymmetric role of the weighted indices examined next.
6.2. Role and Limits of Weighted Indices
The role of the weighted indices is asymmetric across the levels of analysis. At the path-selection level, because the alternative paths of dispersed OD-days were similar in terms of travel distance (as indicated by the high Ow value reported in Section 3.3), the weighted-index-based representative-path selection showed no substantial difference from that of the simple frequency-based selection. In contrast, at the link level, the weighted index identified a representative link set distinct from that identified using the frequency-based index, and the direction of this difference (longer, higher-hierarchy arterial links) was consistent with the design intent. Therefore, the weighted index should not be understood as a universal replacement for the frequency-based index, but rather as a complementary tool for the structural identification of the most important representative links that form the core skeleton of the network.
6.3. Practical Applicability
Extracted representative paths/links serve as input for VKT estimation, congestion diagnosis, and emission assessment [18,19,24]. However, this study found that, in the Bucheon dataset, the effect of representative-path selection on OD-level VKT aggregates was limited, even for dispersed OD-days. Owing to the distance similarity among alternative paths, the total VKT estimation error for the network was negligible. This suggests that, for the specific application of VKT aggregation, the accuracy of the OD volume is a more decisive factor than the precise selection of representative paths. In contrast, for applications where link-level structural identification matters, such as key road monitoring, infrastructure prioritization, and congestion-link diagnosis, weighted-index-based representative-link selection may have a more direct value. In other words, the choice of method depends on the analytical level of the target application (path aggregation vs. link identification).
6.4. Limitations and Future Work
Whether these results are generalizable cannot yet be asserted. The observed 87:13 ratio and the magnitude of the weighted-index effects may vary with network structure, navigation-service penetration, and road-hierarchy composition. All conclusions are drawn from a single 21-day dataset for one mid-sized Korean city, which was collected from a single navigation provider whose map-matching accuracy could not be independently verified. Further, the sample does not capture seasonal or long-term variation. Future work should validate the two-regime structure across other networks, periods, and data sources; develop models that predict dispersed OD-days a priori from OD attributes (distance, road-hierarchy composition, and demand level); and test the weighted indices in applications where link-level structural identification is central.
7. Conclusions
This study established that the path structure of OD-days can be characterized by a single-path-dominant consistent regime (approximately 87%) and a multipath dispersed regime (approximately 13%). The CET analysis showed that the methodological value of representative-path extraction is mainly localized within dispersed OD-days; across all OD-days, a single representative path covered, on average, 92.9% of an OD-day’s VKT, leaving no room to distinguish among competing methods, whereas for dispersed OD-days, a single path explained only 45.2%, indicating that representative-path selection carries real meaning. Furthermore, at the link level within these dispersed OD-days, the length- and usage-weighted indices provided structural information that was distinct from that provided by frequency-based indices, identifying longer, higher-hierarchy arterial links.
The results have broader implications for the evaluation of large-scale trajectory-analysis methods. Aggregate performance measures computed across all OD-days may systematically overstate the explanatory capability of a method and conceal meaningful differences between competing methods. Consequently, evaluation protocols that ignore heterogeneity in OD-day path structures risk producing optimistic but non-discriminating assessments, with potential implications for applications such as VKT estimation, congestion diagnosis, and emission modeling that rely on representative-path inputs. These results suggest that, in large-scale trajectory data, representativeness is not a homogeneous network property but one that is confined to volume-concentrated dispersed OD-days. Although this study does not provide a new extraction algorithm, it redefines the evaluation framework. Specifically, representative-path/link extraction methods should be evaluated using dispersed OD-days where path selection actually occurs, with the OD-day serving as the unit of analysis rather than averaging across all OD-days. This perspective provides a basis for fairly evaluating representative-path methods in future large-scale trajectory-based network analyses. More broadly, it has implications for a wide range of trajectory-based applications beyond representative-path extraction, including travel-demand analysis, network monitoring, and mobility-system evaluation, where representativeness is often assumed to be uniform across the network. The present findings suggest that, across these domains, methodological development may benefit from first identifying the specific regime in which representativeness becomes a meaningful issue, rather than pursuing increasingly sophisticated extraction algorithms.
Funding
This research was funded by the Ministry of Land, Infrastructure and Transport and the Korea Agency for Infrastructure Technology Advancement (KAIA) (Grant No. RS-2023-00245781).
Institutional Review Board Statement
Not applicable.
Informed Consent Statement
Not applicable.
Data Availability Statement
The raw vehicle-trajectory data were provided by SK T-map (https://www.tmap.co.kr, 28 October 2025), a commercial navigation service, under a data-use agreement and cannot be shared publicly. Aggregated OD-day summary statistics, the derived tables underlying all figures and tables, and the preprocessing and analysis parameters (network definition, classification threshold, and clustering settings) are available from the author upon reasonable request.
Acknowledgments
During the preparation of this manuscript, the author used Claude Sonnet 4 (Anthropic, Anthropic PBC, San Francisco, CA, USA) to assist with data analysis and language drafting. The author has reviewed and edited all output and takes full responsibility for the content of this publication.
Conflicts of Interest
The author declares no conflicts of interest.
Abbreviations
| OD | Origin–destination |
| CET | Cumulative explained travel |
| ALUR | Average link usage ratio |
| VKT | Vehicle-kilometers traveled |
| LPR | Link passing ratio |
| OR | Overlap ratio |
References
- Calabrese, F.; Diao, M.; Di Lorenzo, G.; Ferreira, J., Jr.; Ratti, C. Understanding individual mobility patterns from urban sensing data: A mobile phone trace example. Transp. Res. Part C Emerg. Technol. 2013, 26, 301–313. [Google Scholar] [CrossRef] [Scilit]
- Wang, D.; Miwa, T.; Morikawa, T. Big trajectory data mining: A survey of methods, applications, and services. Sensors 2020, 20, 4571. [Google Scholar] [CrossRef] [Scilit] [PubMed]
- Yang, C.; Cho, S.; Kim, J.; Park, S. Vehicle trajectory data processing, analytics, and applications: A survey. ACM Comput. Surv. 2025, 57, 114. [Google Scholar] [CrossRef] [Scilit]
- Graser, A.; Jalali, A.; Lam, S.H.; Lim, M.J. MobilityDL: A review of deep learning from trajectory data. GeoInformatica 2025, 29, 14. [Google Scholar] [CrossRef] [Scilit]
- Yang, C. Length- and usage-weighted indices for representative route extraction from trajectory data. Sensors 2026, 26, 1114. [Google Scholar] [CrossRef] [Scilit] [PubMed]
- Bekhor, S.; Ben-Akiva, M.E.; Ramming, M.S. Evaluation of choice set generation algorithms for route choice models. Ann. Oper. Res. 2006, 144, 235–247. [Google Scholar] [CrossRef] [Scilit]
- Prato, C.G. Route choice modeling: Past, present and future research directions. J. Choice Model. 2009, 2, 65–100. [Google Scholar] [CrossRef] [Scilit]
- Duncan, L.C.; Watling, D.P.; Connors, R.D.; Rasmussen, T.K.; Nielsen, O.A. Path size logit route choice models: Issues with current models, a new internally consistent approach, and parameter estimation on a large-scale network with GPS data. Transp. Res. Part B Methodol. 2020, 135, 1–40. [Google Scholar] [CrossRef] [Scilit]
- Frejinger, E.; Bierlaire, M. Capturing correlation with subnetworks in route choice models. Transp. Res. Part B Methodol. 2007, 41, 363–378. [Google Scholar] [CrossRef] [Scilit]
- Yao, R.; Bekhor, S. A data-driven choice set generation and estimation of route choice models. Transp. Res. Part C Emerg. Technol. 2020, 121, 102832. [Google Scholar] [CrossRef] [Scilit]
- Liu, D.; Li, D.; Gao, K.; Song, Y.; Zhang, T. Enhancing choice-set generation and route choice modeling with data- and knowledge-driven approach. Transp. Res. Part C Emerg. Technol. 2024, 162, 104618. [Google Scholar] [CrossRef] [Scilit]
- Yao, R.; Bekhor, S. Experiments on route choice set generation using a large GPS trajectory set. arXiv 2020, arXiv:2006.04536. [Google Scholar] [CrossRef] [Scilit]
- Tao, Y.; Both, A.; Silveira, R.I.; Buchin, K.; Sijben, S.; Purves, R.S.; Laube, P.; Toohey, K.; Duckham, M. A comparative analysis of trajectory similarity measures. GISci. Remote Sens. 2021, 58, 643–669. [Google Scholar] [CrossRef] [Scilit]
- Dorosti, A.; Alesheikh, A.A.; Sharif, M. Measuring trajectory similarity based on the spatio-temporal properties of moving objects in road networks. Information 2024, 15, 51. [Google Scholar] [CrossRef] [Scilit]
- Advani, C.; Bhaskar, A.; Haque, M.M. Bi-level clustering of vehicle trajectories for path choice set and its nested structure identification. Transp. Res. Part C Emerg. Technol. 2022, 144, 103895. [Google Scholar] [CrossRef] [Scilit]
- Wang, T.; Huang, S.; Bao, Z.; Culpepper, J.S.; Arablouei, R. Representative routes discovery from massive trajectories. In Proceedings of the 28th ACM SIGKDD Conference on Knowledge Discovery and Data Mining, Washington, DC, USA, 14–18 August 2022; pp. 4059–4069. [Google Scholar] [CrossRef] [Scilit]
- Kim, H.; Nam, D.; Cheon, S.H. Determination of representative path set from vehicle trajectory samples. J. Comput. Civ. Eng. 2016, 30, 04015052. [Google Scholar] [CrossRef] [Scilit]
- Feng, H.; Bai, F.; Xu, Y. Identification of critical roads in urban transportation network based on GPS trajectory data. Phys. A 2019, 535, 122337. [Google Scholar] [CrossRef] [Scilit]
- Yang, C.; Moon, J. Development of representative link-based framework for estimating total vehicle travel distance: Simulation-based preliminary validation. J. Digit. Contents Soc. 2025, 26, 2191–2199. [Google Scholar] [CrossRef] [Scilit]
- Yang, C. Coverage-based framework for estimating total vehicle travel distance using point-to-point trajectory data. Appl. Sci. 2025, 15, 10325. [Google Scholar] [CrossRef] [Scilit]
- Deng, J.; Li, T.; Yang, Z.; Yuan, Q.; Chen, X. Heterogeneity in route choice during peak hours: Implications on travel demand management. Travel Behav. Soc. 2025, 38, 100922. [Google Scholar] [CrossRef] [Scilit]
- Rao, W.; Xia, J.; Wang, C.; Lu, Z.; Chen, Q. Investigating impact of the heterogeneity of trajectory data distribution on origin-destination estimation: A spatial statistics approach. IET Intell. Transp. Syst. 2020, 14, 1218–1227. [Google Scholar] [CrossRef] [Scilit]
- Deng, J.; Li, T.; Yang, Z.; Yuan, Q.; Chen, X. Unveiling route choice preferences and classifying travelers based on distinct travel patterns using trajectory data. Transp. Res. Interdiscip. Perspect. 2025, 29, 101342. [Google Scholar] [CrossRef] [Scilit]
- Tian, Y.; Chiu, Y.C.; Sun, J.; James, R. Advanced vehicle miles traveled estimation methods for non-federal aid system roadways using GPS vehicle trajectory data. Transp. Res. Rec. 2021, 2675, 111–123. [Google Scholar] [CrossRef] [Scilit]

Disclaimer/Publisher’s Note: The statements, opinions and data contained in all publications are solely those of the individual author(s) and contributor(s) and not of MDPI and/or the editor(s). MDPI and/or the editor(s) disclaim responsibility for any injury to people or property resulting from any ideas, methods, instructions or products referred to in the content. |
© 2026 by the author. Licensee MDPI, Basel, Switzerland. This article is an open access article distributed under the terms and conditions of the Creative Commons Attribution (CC BY) license.