


Abstract
Mechanomyography (MMG) records mechanical vibrations generated by active muscle contraction and may provide a simple field-applicable method for detecting post-loading muscle responses. This study aimed to characterize post-loading changes in multidimensional and time–frequency MMG features of the forearm flexor–pronator muscles after a repetitive gripping exercise. Eight healthy volunteers were assessed bilaterally, yielding 16 forearms for exploratory analysis. MMG signals were recorded before loading, immediately after loading, and 24 h after loading from the volar forearm region overlying the superficial flexor–pronator muscle group, anatomically corresponding to the flexor digitorum superficialis. The loading task consisted of repeated gripping using a 30 kg grip trainer. Multiple MMG trials at each time point were averaged within each subject-arm unit. Time-domain, envelope-based, spectral, band-power, wavelet-energy, and exploratory spectrogram-derived band-power features were extracted using a reproducible Python 3.12 pipeline (Google Colaboratory environment). Changes across time points were assessed using Friedman tests, followed by Wilcoxon signed-rank tests with a multiplicity adjustment. After the false discovery rate correction, 11 of 23 conventional MMG features showed significant time effects. These features were concentrated in amplitude- and energy-related domains, including RMS, envelope, peak-to-peak amplitude, signal energy, and wavelet energy. They decreased immediately after loading and increased at 24 h. An exploratory spectrogram analysis showed similar temporal changes in the absolute band power across predefined frequency bands, whereas the relative band-power distribution remained stable. These findings suggest that a multidimensional MMG feature analysis can detect post-loading changes in the superficial forearm flexor–pronator region after a repetitive gripping exercise.
1. Introduction
Baseball pitching is a high-load overhead motion that places excessive stress on the shoulder and elbow joints [1,2,3]. In particular, substantial valgus torque is generated on the medial aspect of the elbow from the acceleration phase to ball release. The native ulnar collateral ligament (UCL), the primary static stabilizer of the medial elbow, has been reported to fail at an ultimate valgus moment of approximately 32–34 Nm. However, the valgus torque generated during pitching often exceeds this failure threshold and has been reported to reach a peak instantaneous value of 80–120 Nm in professional pitchers [1,4,5,6]. This apparent discrepancy may be partially explained by the dynamic stabilizing function of the forearm flexor–pronator muscles (FPMs), which help prevent the structural failure of the elbow joint [7,8,9].
The FPMs consist of several muscles, including the pronator teres, flexor carpi radialis, palmaris longus, flexor digitorum superficialis, and flexor carpi ulnaris, many of which originate from the medial epicondyle. Among these muscles, the flexor carpi ulnaris and flexor digitorum superficialis are located close to the UCL [10]. The appropriate contraction of these muscles may help resist valgus stress and reduce the direct load applied to the UCL [9]. However, repetitive pitching may impair the function of these dynamic stabilizers, thereby increasing the risk of UCL injury.
In sports and clinical settings, muscle condition is often evaluated using a manual examination, subjective symptoms, subjective tightness, or local tenderness. Although useful, these assessments are difficult to standardize and may not capture early load-induced changes. Ultrasound shear wave elastography (USWE) can quantify muscle stiffness and has been used to evaluate exercise-induced changes in muscle tissue [11,12,13]. A recent study demonstrated that the tissue elasticity of the flexor–pronator muscles increased immediately after pitching and remained elevated 24 h after pitching, suggesting that forearm muscle properties may be altered even after a short-term recovery period [14]. However, USWE requires specialized equipment and technical expertise, which limits its routine use in field settings.
To address this issue, we focused on mechanomyography (MMG). MMG is a noninvasive method that records mechanical vibrations generated by contracting muscle from the skin surface [15,16,17,18]. Unlike electromyography, which captures electrical activity, MMG reflects the mechanical consequences of muscle contraction, including lateral muscle fiber oscillation, motor unit recruitment and firing behavior, contraction dynamics, and changes in viscoelastic muscle properties [15,16,17,18]. Because MMG sensors can be small, inexpensive, and simple to use, MMG has potential as a field-deployable method for monitoring muscle condition. However, the behavior of MMG features after the repetitive loading of the forearm flexor–pronator muscles remains insufficiently understood.
Previous MMG studies have shown that fatigue and repetitive dynamic tasks can influence both amplitude- and frequency-domain MMG parameters [15,16,18,19,20]. In particular, recent work focusing on the flexor digitorum superficialis during moderate-intensity dynamic grasping demonstrated that MMG features can change in association with declines in maximal voluntary contraction and increases in perceived exertion [20]. These findings support the use of MMG to capture load-related changes in the forearm. Nevertheless, most clinical applications have relied on a limited number of frequency-domain features, and it remains unclear whether broader time-domain, envelope, energy, spectral, wavelet, and time–frequency features can more sensitively characterize post-loading responses.
The purpose of this study was to characterize post-loading changes in the multidimensional and time–frequency MMG features of the superficial forearm flexor–pronator region after a repetitive gripping exercise and to compare these changes with the USWE-derived tissue elasticity. We hypothesized that amplitude- and energy-related MMG features would change across pre-loading, immediate post-loading, and 24 h post-loading time points, and that these changes would provide exploratory information on local forearm muscle responses that may be relevant to future post-throwing monitoring studies.
2. Materials and Methods
2.1. Participants
This study was approved by the Ethics Committee of Kobe University Graduate School of Medicine (approval number: B210009). Written informed consent was obtained from all participants. Eight healthy volunteers were included in this exploratory laboratory study. Both forearms were evaluated, yielding 16 subject-arm units for repeated-measures analysis. Participants with a history of upper-extremity musculoskeletal disorder, neurological disease, or current forearm pain were excluded. The mean age of the participants was 38.9 ± 10.03 years, with a range of 27–55 years. Sample size was determined by feasibility rather than a priori power calculation, consistent with the exploratory, hypothesis-generating design of this study.
2.2. Experimental Protocol and Loading Task
Measurements were performed at three time points: pre-loading, immediately after loading, and 24 h after loading. Before each MMG recording, participants performed active flexion and extension movements of the proximal interphalangeal joints in time with a metronome set at 60 beats per minute. Each movement was repeated 10 times. The loading task consisted of repeated gripping exercise using a 30 kg grip trainer. Participants performed 3 sets of 30 repetitions. This protocol was designed to apply repetitive local loading to the forearm flexor–pronator muscle group, including the flexor digitorum superficialis. An identical absolute load (30 kg) was used for all participants rather than a load individually normalized to each participant’s maximal voluntary contraction (MVC); therefore, the relative loading intensity likely varied among individuals. Because maximal voluntary contraction, perceived exertion, and muscle soreness were not assessed, the present protocol was defined as a repetitive loading task rather than a validated fatigue-induction protocol.
2.3. Data Acquisition
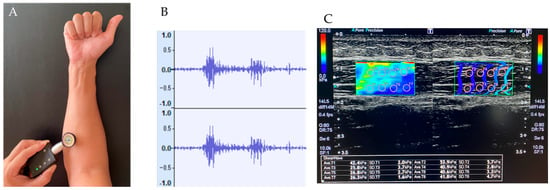
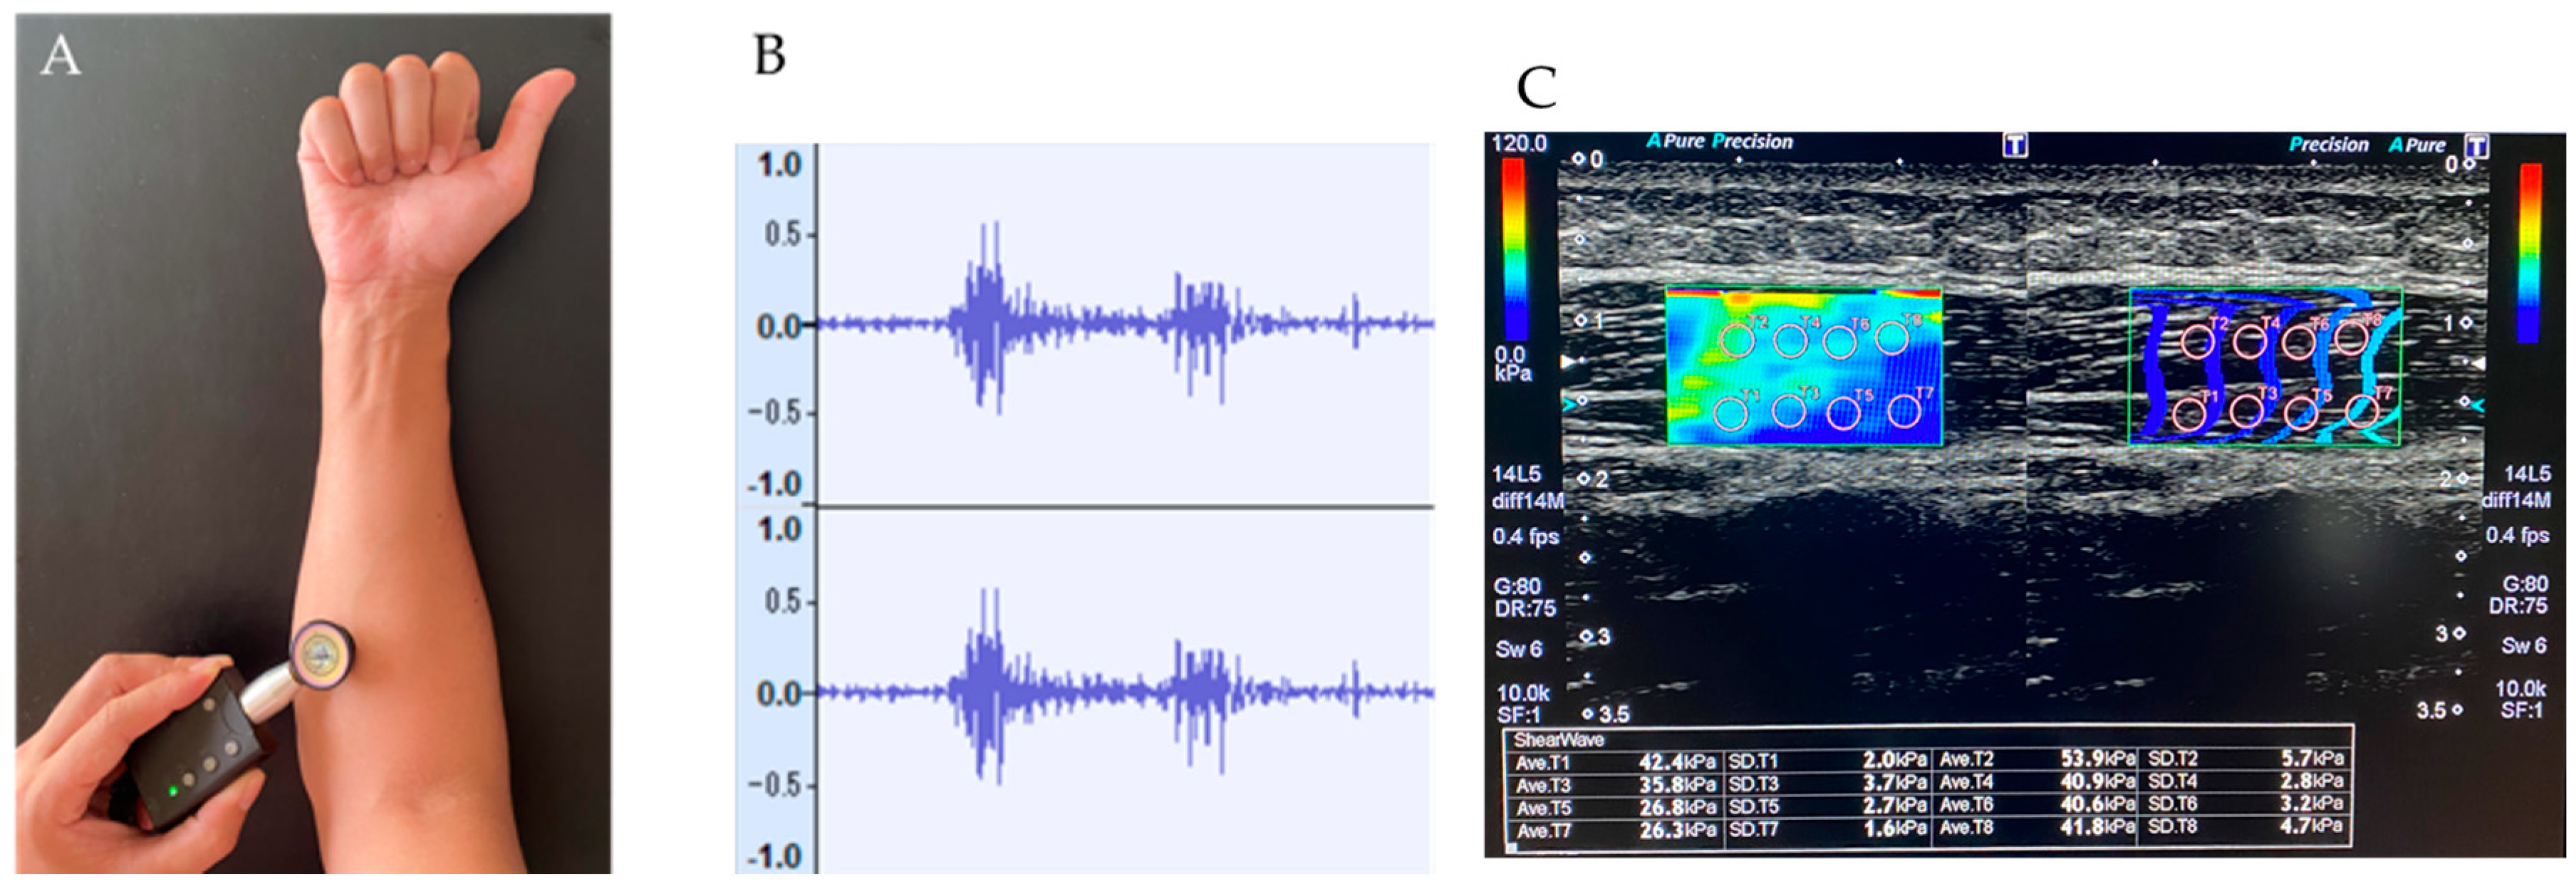
Muscle sounds from the region corresponding to the flexor digitorum superficialis were recorded using a digital stethoscope (Nexteto, ShareMedical, Nagoya, Japan) [21]. The stethoscope was placed on the volar aspect of the forearm over the muscle belly of the superficial forearm flexor–pronator muscles, approximately 5 cm distal to the medial epicondyle of the humerus. The same anatomical site was used as consistently as possible across time points. The measurement site was marked on the skin to guide repositioning across time points, the same examiner performed all MMG and USWE measurements at all time points, and the sensor was secured with tape to maintain consistent contact throughout each recording. Because several superficial forearm flexor–pronator muscles are anatomically adjacent, the recorded signal should be regarded as a composite mechanical response of this muscle group rather than an isolated signal from a single muscle. Multiple trials were recorded for each subject-arm unit at each time point. Trials affected by recording failure were excluded before feature extraction; no processing failures occurred in the present dataset. At the same time points, tissue elasticity of the forearm flexor muscles was evaluated using ultrasound shear wave elastography (USWE). Measurements were obtained using a linear-array transducer (14L5) with an Aplio 500 Platinum ultrasound machine (Toshiba Medical Systems, Ohtawara, Japan). USWE measurements were performed at the same site as MMG recording. The transducer was oriented longitudinally along the muscle fibers, and tissue elasticity was measured in kilopascals. Eight valid measurements were obtained from the region of interest, and the mean value was used for analysis [14] (see Figure 1).
Figure 1.
Measurement of MMG signals and ultrasound shear wave elastography. (A) The digital stethoscope was positioned approximately 5 cm distal to the medial epicondyle of the humerus. (B) Representative MMG waveforms acquired during the task. (C) Representative ultrasound shear wave elastography image showing tissue elasticity measurement over the superficial forearm flexor–pronator muscle region, anatomically corresponding to the flexor digitorum superficialis, at the same site as MMG recording.
2.4. Signal Processing and Feature Extraction
All audio data were processed using a reproducible Python 3.12 pipeline implemented in the Google Colaboratory environment. The pipeline recursively searched the specified MMG data folder, parsed subject, side, condition, and trial identifiers from the folder structure and file names, and generated quality-control tables documenting processed and excluded files. WAV files were read using the SoundFile library and converted to mono signals by averaging channels when necessary. The DC component was removed by subtracting the mean value of each waveform. The analysis notebook used a fourth-order Butterworth low-pass filter with a cutoff frequency of 200 Hz, implemented in second-order sections (scipy.signal.butter, output = “sos”). Zero-phase forward-backward filtering was performed using scipy.signal.sosfiltfilt when applicable; if zero-phase filtering failed for a specific waveform, one-pass second-order-section filtering (scipy.signal.sosfilt) was used as a fallback. No high-pass filter was applied. The same preprocessing procedure was applied to all WAV files before conventional feature extraction and spectrogram analysis. Time-domain and envelope-related features included RMS mean, RMS variability, envelope mean, envelope variability, peak-to-peak amplitude, and signal energy. RMS and zero-crossing rate were calculated from frames of 2048 samples with a 512-sample hop. Envelope features were calculated using the absolute value of the analytic signal obtained by the Hilbert transform. Spectral features were calculated using a Hann-window short-time Fourier transform with nperseg = 2048, nfft = 2048, hop length = 512 samples, no boundary extension, and no padding. Power spectral density features were calculated using Welch’s method with nperseg = min (32,768, signal length) and 50% overlap. Relative band powers were calculated for 5–15, 15–30, 30–45, and 45–60 Hz as the band-specific area under the power spectral density curve divided by total power. Wavelet features were extracted after resampling the signal to 1000 Hz using a level-4 Daubechies-4 discrete wavelet decomposition. Approximation and detail energies (A4 and D4–D1) and their relative energy proportions were calculated. For statistical analysis, multiple trials were first averaged within each subject-arm unit and time point, resulting in one representative value for each arm at each time point.
2.5. Spectrogram and Time–Frequency Band-Power Analysis
As an exploratory time–frequency analysis, short-time Fourier transform spectrograms were generated from the same preprocessed MMG signals. The same 200 Hz low-pass-filtered waveform was used for this analysis. Spectrogram parameters were prespecified to improve reproducibility: n_fft = 2048, hop length = 256 samples, maximum displayed frequency = 250 Hz, and lower display floor = −80 dB. Representative spectrograms for the three time points were selected automatically from a complete participant-arm unit using the trial closest to the median signal-energy value for each condition, thereby avoiding subjective selection of visually favorable examples. Absolute band-power time-series features were then extracted from four frequency ranges: 10–30, 30–60, 60–120, and 120–250 Hz. For each WAV file and frequency band, the mean, median, standard deviation, maximum, minimum, area under the curve, temporal slope, and early–middle-late third band powers were calculated. These spectrogram-derived features were summarized at the subject-arm-condition level in the same manner as the conventional MMG features.
2.6. Statistical Analysis
Statistical analyses were performed using GraphPad Prism version 11.0 (GraphPad Software, Boston, MA, USA) and Python 3.12 implemented in the Google Colaboratory environment. For USWE analysis, data normality was assessed using the D’Agostino–Pearson test. Changes in USWE parameters across the three time points were analyzed using repeated-measures one-way analysis of variance with Geisser–Greenhouse correction, followed by Tukey’s post hoc test when appropriate. For MMG analysis, each subject-arm unit was analyzed as a repeated-measures observational unit across the three time points. Because of the small sample size, expected non-normal distribution of several MMG features, and multiple extracted features, changes in MMG parameters were assessed using the Friedman test. Conventional MMG features were corrected for multiple testing using the Benjamini–Hochberg false discovery rate. Features with FDR-adjusted q values < 0.05 were considered to show significant time effects. Post hoc pairwise comparisons were performed using Wilcoxon signed-rank tests with Holm correction. Data are presented as mean ± standard deviation unless otherwise indicated. Statistical significance was set at p < 0.05.
3. Results
3.1. Overview of Significant USWE Features
The tissue elasticity measured by USWE significantly changed over time. The shear modulus increased from 25.79 ± 4.57 kPa before loading to 47.74 ± 13.56 kPa immediately after loading and remained elevated at 43.04 ± 11.51 kPa 24 h after loading. Post hoc analysis showed significant differences among all time-point comparisons (see Table 1).
Table 1.
Changes in USWE-derived shear modulus across time points.
3.2. Overview of Significant MMG Features
A total of 216 MMG trials were processed without failure. After averaging repeated trials within each subject-arm unit and time point, 16 complete arm-level repeated-measures datasets were available for analysis. Among 23 extracted conventional MMG features, 11 showed significant time effects after FDR correction. These significant features were all absolute amplitude- or energy-related variables: RMS mean, RMS variability, envelope mean, envelope variability, peak-to-peak amplitude, signal energy, and wavelet A4/D4/D3/D2/D1 energies. In contrast, PSD mean, median, and peak frequencies, relative band-power features, and relative wavelet-energy proportions did not remain significant after FDR correction.
Because several significant features are conceptually related amplitude- or energy-domain measures, they should be interpreted as convergent evidence for an amplitude-/energy-domain response rather than as independent biomarkers (see Figure 2).
Figure 2.
Temporal changes in representative MMG features. Representative amplitude- and energy-related features, including RMS mean, envelope mean, peak-to-peak amplitude, signal energy, and wavelet energy, decreased immediately after loading and increased at 24 h after loading. Individual subject-arm units (n = 16) are shown with connected lines. Thick lines and error bars indicate group mean ± standard deviation. p values were obtained using the Friedman test with Benjamini–Hochberg FDR correction, followed by Wilcoxon signed-rank tests with Holm correction for post hoc pairwise comparisons. Kendall’s W effect sizes for each feature are shown in Table 2.
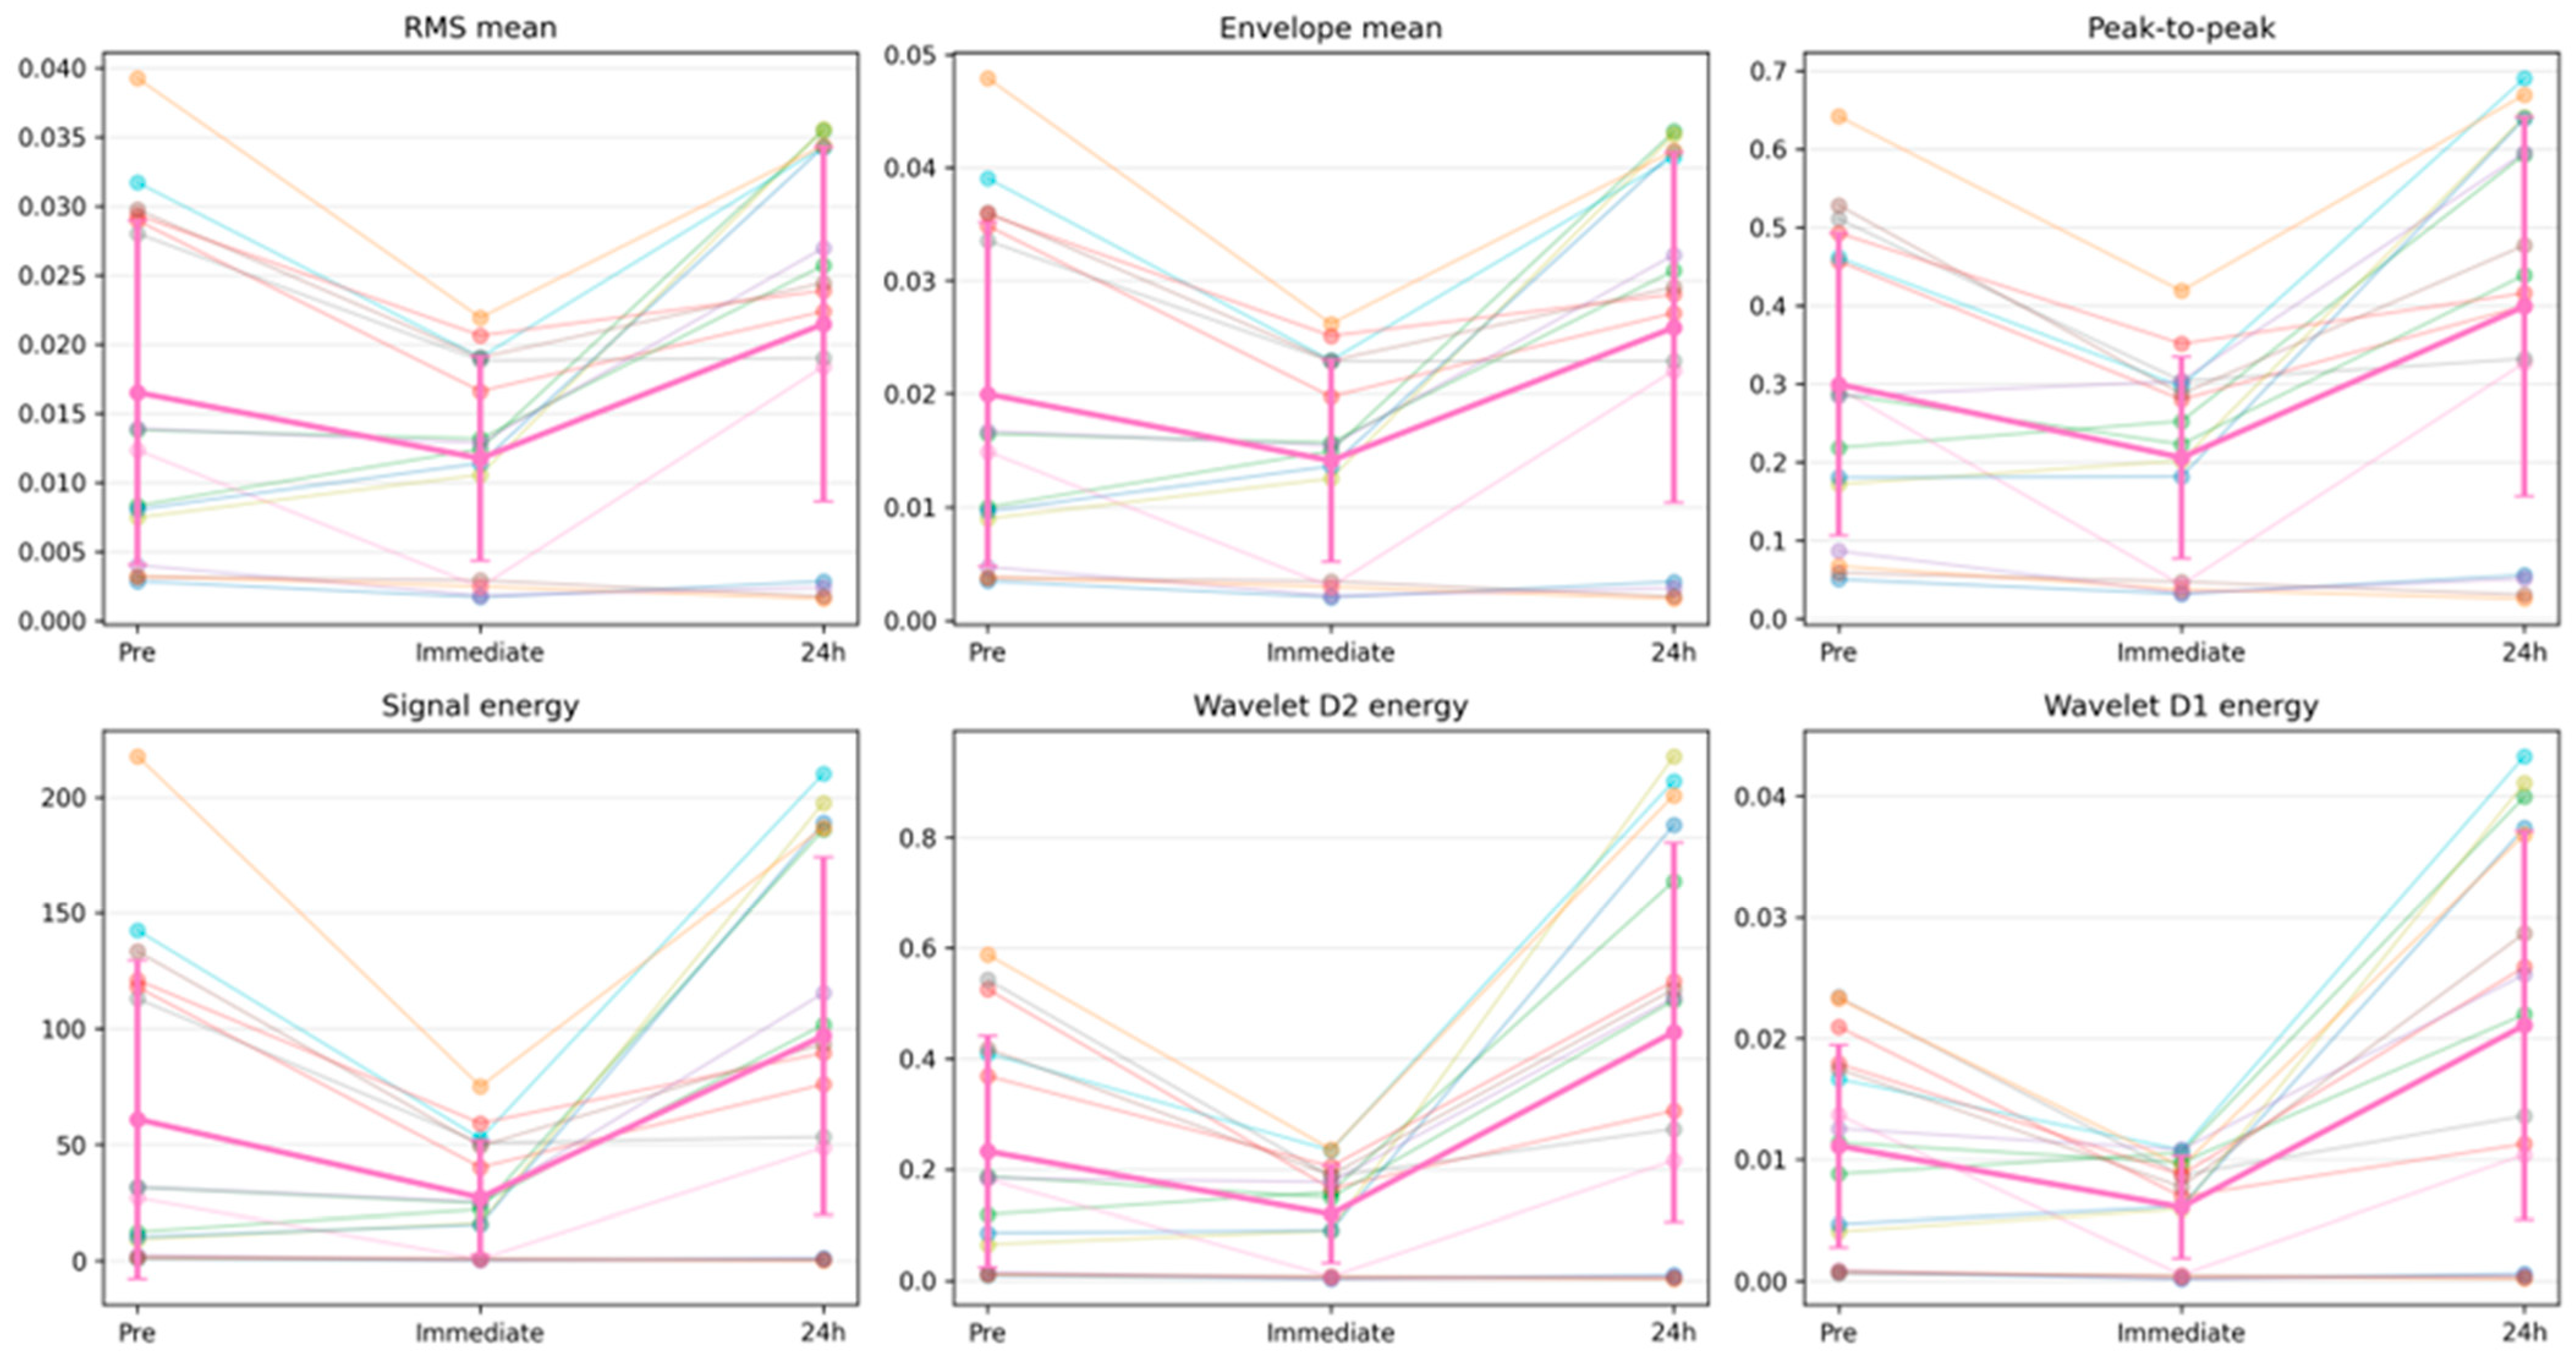
Table 2.
Conventional MMG features showing significant time effects after FDR correction.
3.2.1. Immediate Post-Loading Changes for MMG
Compared with pre-loading, significant decreases were observed immediately after loading in all 11 significant amplitude- and energy-related MMG features after within-feature Holm correction. The RMS mean decreased by 28.9%, RMS variability by 33.4%, envelope mean by 29.4%, envelope variability by 31.7%, peak-to-peak amplitude by 31.2%, and signal energy by 55.4%. Wavelet energies also decreased immediately after loading, with reductions of 69.7% for A4, 60.2% for D4, 52.7% for D3, 48.7% for D2, and 45.3% for D1. These results indicate a broad immediate suppression of the absolute MMG amplitude and energy after the repetitive gripping task.
3.2.2. Twenty-Four-Hour Post-Loading Changes for MMG
At 24 h after loading, the amplitude- and energy-related MMG features increased significantly compared with the immediate post-loading values. The RMS mean increased by 82.7%, RMS variability by 103.5%, envelope mean by 83.4%, envelope variability by 96.8%, peak-to-peak amplitude by 93.7%, and signal energy by 256.3%. Wavelet energies also increased markedly from the immediate post-loading condition, with increases of 209.2% for A4, 239.9% for D4, 259.3% for D3, 275.4% for D2, and 245.9% for D1. A direct comparison between pre-loading and 24 h post-loading values showed a significant difference only for wavelet D2 energy, which increased by 92.7%. Thus, the most consistent temporal pattern was an immediate decrease followed by 24 h of recovery toward the baseline or a slight rebound, rather than a uniform sustained elevation relative to the baseline (see Table 3).
Table 3.
Significant post hoc pairwise comparisons after within-feature Holm correction.
3.2.3. Non-Significant Frequency and Relative Energy Features for MMG
PSD-based frequency features did not show significant time effects after FDR correction. The PSD mean frequency was 94.2 ± 28.2 Hz before loading, 96.8 ± 30.3 Hz immediately after loading, and 95.4 ± 29.1 Hz at 24 h after loading. The PSD median frequency and PSD peak frequency showed similar non-significant patterns. The relative band-power features and relative wavelet-energy features were also not significant, suggesting that the post-loading response was characterized primarily by changes in the absolute signal amplitude and energy rather than by a consistent shift in the normalized spectral composition.
3.2.4. Spectrogram and Time–Frequency Band-Power Findings for MMG
An exploratory spectrogram analysis was performed for all 216 processed WAV files, producing 864 per-WAV band-power rows and 192 subject-arm-condition band-power summaries across the four frequency bands. Representative spectrograms demonstrated visible mechanical vibration energy across a broad range below 250 Hz at all three time points, without an obvious isolated shift to a single narrow frequency band. The absolute spectrogram band-power analysis reproduced the same temporal pattern observed in the conventional amplitude- and energy-domain features. The mean absolute band power decreased immediately after loading in the 10–30 Hz, 30–60 Hz, 60–120 Hz, and 120–250 Hz bands and increased again at 24 h. In contrast, the relative distribution of the band power was comparatively stable and did not show consistent corrected time effects. These findings support the interpretation that the primary load-induced MMG response was a broad change in the absolute vibration energy rather than the redistribution of power into a particular frequency band (see Figure 3).
Figure 3.
Representative MMG spectrograms for pre-loading, immediate post-loading, and 24 h post-loading conditions. Spectrograms were generated using fixed STFT parameters and displayed up to 250 Hz. These representative examples support the use of time–frequency analysis to visualize broadband post-loading changes in MMG power. Representative spectrograms are shown for visualization only; the quantitative band-power results are summarized in Table 4.
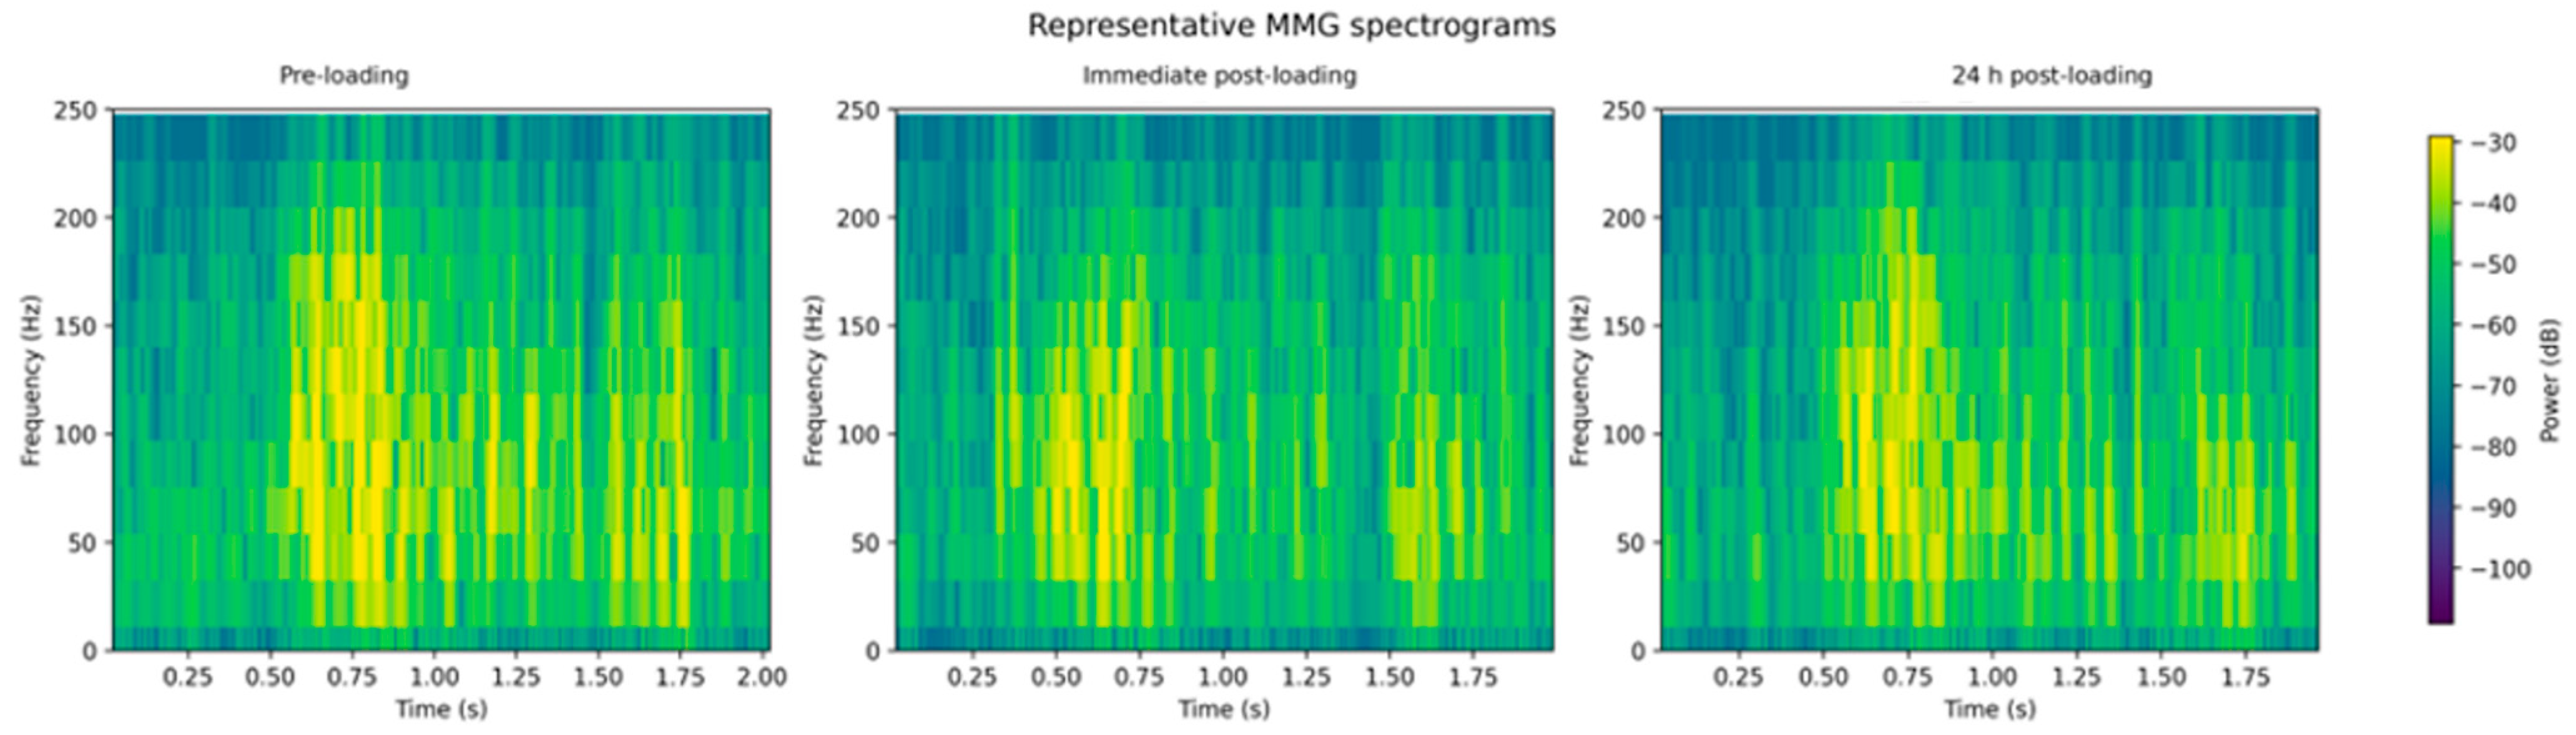
Table 4.
Exploratory spectrogram-derived absolute band-power features.
4. Discussion
The main finding of this exploratory study was that a repetitive gripping exercise induced distinct post-loading changes in both multidimensional MMG features and the USWE-derived tissue elasticity in the superficial forearm flexor–pronator region. After averaging repeated trials within each forearm and time point, the amplitude- and energy-related MMG features, including RMS, envelope, peak-to-peak amplitude, signal energy, and wavelet energy, showed significant temporal changes. These features decreased immediately after loading and increased at 24 h, whereas PSD-based frequency features and relative spectral-energy features did not show significant time effects. Importantly, these significant features should not be interpreted as independent biomarkers. Many of the significant variables, including RMS, envelope amplitude, peak-to-peak amplitude, signal energy, and wavelet energies, are conceptually and mathematically related measures of the absolute amplitude or energy of the MMG signal. Therefore, the present findings are best interpreted as convergent evidence for a single amplitude-/energy-domain post-loading response, rather than as multiple independent discoveries across unrelated MMG domains. Given the limited sample size, these null findings for frequency-domain and relative spectral features should be interpreted cautiously; they may reflect a true absence of frequency-domain change, but the possibility of a Type II error due to insufficient statistical power cannot be excluded. These non-significant relative frequency-domain and relative wavelet-energy measures may not solely reflect a low statistical power. As normalized measures, they are inherently insensitive to changes that scale the signal amplitude relatively uniformly across frequency components; only a frequency-selective shift in the underlying oscillatory sources, such as a shift in the motor unit firing rate or muscle fiber conduction velocity, would be expected to alter the relative spectral distribution. This suggests that the post-loading response in this task was primarily a broadband amplitude/energy change rather than a shift in frequency composition, although a smaller frequency-selective effect that fell below the detection threshold of this sample size cannot be excluded. An exploratory spectrogram-derived band-power analysis showed a similar broadband reduction in absolute power immediately after loading, followed by a recovery toward the baseline or a slight rebound at 24 h. These findings suggest that the most robust MMG signature in this protocol was not a shift in the dominant frequency but a transient change in the magnitude of the contraction-related mechanical vibration.
In addition to these MMG findings, USWE demonstrated a significant increase in tissue elasticity after loading. The shear modulus increased from 25.79 ± 4.57 kPa before loading to 47.74 ± 13.56 kPa immediately after loading and remained elevated at 43.04 ± 11.51 kPa 24 h after loading. This result indicates that repetitive gripping induced a clear increase in passive mechanical stiffness in the forearm flexor–pronator muscles, and that this stiffness did not fully return to baseline within 24 h. Notably, this temporal pattern was similar to that reported by Mukohara et al., who demonstrated that the tissue elasticity of the flexor–pronator muscles increased immediately after pitching and remained elevated 24 h after pitching in baseball players [14]. Repetitive gripping does not reproduce the kinetic chain or valgus/eversion stress of pitching, so this similarity should be regarded as descriptive rather than mechanistic. Grip-based loading may nonetheless serve as a simplified, controlled local-loading model for the forearm flexor–pronator muscles.
These USWE results provide important context for interpreting the MMG findings. MMG primarily reflects active contraction-related mechanical vibration, whereas USWE quantifies passive tissue stiffness. Therefore, the immediate decrease in MMG amplitude- and energy-related features and the simultaneous increase in the USWE-derived shear modulus may represent different aspects of the same post-loading muscle response. The reduction in RMS, envelope, peak-to-peak amplitude, signal energy, wavelet energy, and spectrogram-derived absolute band power may reflect the transient suppression of the contraction-related mechanical vibration after repetitive loading. At the same time, the increased shear modulus suggests that the loaded muscle became mechanically stiffer. Increased tissue stiffness may dampen muscle fiber oscillation or alter the transmission of mechanical vibration from the muscle to the skin surface, thereby contributing to the observed reduction in MMG amplitude and energy.
The persistence of the increased tissue elasticity at 24 h also provides additional insight into the temporal pattern of MMG recovery. In the present MMG analysis, amplitude- and energy-related features generally increased at 24 h compared with the immediate post-loading condition, suggesting a recovery toward the baseline or a slight rebound of contraction-related mechanical vibration. However, the USWE values remained elevated compared with pre-loading values. This discrepancy suggests that the recovery of active mechanical vibration and the normalization of passive tissue stiffness do not necessarily occur in parallel. In other words, MMG may return toward baseline while USWE still indicates increased passive stiffness. This may reflect residual post-loading changes in the muscle-tendon unit, such as altered viscoelastic properties, fluid-shift or edema-like responses, or the delayed recovery of passive mechanical characteristics. Changes in the neuromuscular activation strategy, such as altered motor unit recruitment or firing rate following repetitive loading, may also have contributed to the recovery pattern observed in MMG amplitude and energy features.
This finding substantially refines the interpretation of the earlier frequency-focused analysis. In the previous manuscript structure, MMG assessment was centered on the mean frequency, central frequency, spectral flatness, and zero-crossing rate. The present multidimensional and time–frequency analysis indicates that amplitude- and energy-related features are more sensitive to the load-induced response observed in this dataset. This is physiologically plausible because MMG reflects the mechanical oscillation of active muscle fibers, lateral muscle deformation, resonance properties, and the mechanical filtering effect of overlying tissues. Absolute amplitude and energy measures may therefore be more directly affected by transient changes in contraction mechanics, tissue stiffness, sensor coupling, and the magnitude of muscle fiber oscillation than normalized frequency-domain indices. This dissociation between absolute and relative MMG measures is consistent with the established mechanomyographic theory, in which the signal amplitude/energy predominantly reflects the number and mechanical output of active motor units together with local mechanical/tissue properties, such as the transient edema or fluid shift following loading, whereas the frequency content of the signal is more closely governed by the motor unit firing rate and muscle fiber conduction velocity. An increase in the number or mechanical output of recruited motor units, without a corresponding uniform shift in firing rate or conduction velocity, would be expected to increase the absolute MMG amplitude/energy while leaving its relative frequency-domain distribution largely unchanged. This recruitment- and mechanically driven interpretation represents a plausible physiological explanation for the present pattern of findings, although it remains to be directly confirmed, for example, using concurrent electromyographic recordings of the motor unit firing behavior.
Previous MMG literature has shown that the direction of amplitude and frequency changes during fatigue is not uniform and depends on the contraction type, intensity, joint motion, muscle, and task protocol. Beck et al. summarized that the MMG amplitude and frequency responses during dynamic muscle actions vary across protocols and should be interpreted in relation to the mechanical task being performed. Ibitoye et al. also emphasized that MMG is a mechanical counterpart to electromyography and may preserve information related to muscle contraction and neuromuscular function, but that the parameter selection should be protocol-specific. The present results are consistent with this framework. Rather than identifying one universal MMG marker of fatigue, the findings indicate that broad amplitude and energy features captured the post-loading state in the forearm flexor–pronator muscle group under this repetitive gripping protocol.
The recent work by Wang et al. provides important context for the present findings. They evaluated MMG signals from the flexor digitorum superficialis during moderate-intensity dynamic grasping at 30% MVC and 1 Hz and confirmed fatigue using both the MVC decline and Borg ratings. Their study demonstrated that FDS MMG features can change during repetitive dynamic grasping and may reflect fatigue progression. The present study differs in that the loading intensity was defined using an absolute 30 kg grip trainer and post-loading recordings were obtained before, immediately after, and 24 h after loading. Nevertheless, both studies support the concept that MMG can detect load-related changes in the FDS or superficial forearm flexor region during repetitive hand tasks. The lack of objective fatigue validation in the present study is important, but the observed time-dependent changes in amplitude, energy, spectrogram-derived band-power features, and USWE-derived tissue elasticity are consistent with the broader idea that MMG and USWE are sensitive to functional and mechanical changes in the loaded muscle.
Taken together, the present findings suggest that MMG and USWE may capture distinct, and potentially complementary, aspects of post-loading changes in the forearm flexor–pronator muscles; however, this study did not directly test the statistical relationship between MMG and USWE parameters, and this complementarity should be regarded as a hypothesis rather than a confirmed finding. MMG captures the active contraction-related mechanical vibration, while USWE reflects the passive stiffness of the muscle tissue. The combination of the immediate MMG amplitude and energy suppression with the sustained USWE stiffness elevation indicates that repetitive gripping induces both functional and mechanical changes in the loaded forearm muscles. Therefore, combining MMG with USWE may offer a more comprehensive approach for evaluating the post-loading forearm muscle responses, residual stiffness, and recovery status after repetitive hand tasks. This potential application should nonetheless be regarded as speculative, given that the present cohort consisted of healthy, non-throwing adults rather than pitchers.
Several limitations of this study should be acknowledged. First, the participants were healthy adults and not baseball players or pitchers. Therefore, it remains unclear whether the MMG and USWE changes observed in this study would occur similarly after actual pitching. In addition, the loading task used in this study was a repeated gripping exercise and did not reproduce the complex biomechanical demands of pitching. Pitching involves a coordinated motion of the shoulder, elbow, forearm, wrist, trunk, and lower extremities, as well as valgus stress on the medial elbow. Therefore, although the present loading task may be useful as a local loading model for the forearm flexor muscles, future studies should evaluate MMG and USWE changes after actual pitching. Second, because MMG records surface mechanical vibrations, the recorded signal may include vibrations from the surrounding muscles as well as the target muscle. This issue may be particularly relevant in the forearm, where several superficial flexor–pronator muscles are anatomically close to each other. Previous research has shown that cross-talk in forearm MMG signals can increase with the grip force during isometric gripping. Therefore, although the sensor in the present study was placed over the region corresponding to the FDS, the obtained MMG signal should be interpreted as a composite signal from the superficial forearm flexor–pronator muscle group rather than as an isolated FDS signal [22]. Third, objective measures of muscle fatigue, such as maximal grip strength, perceived exertion, or muscle soreness, were not assessed. In addition, the loading intensity was defined using an absolute 30 kg grip trainer rather than being normalized to each participant’s maximal voluntary contraction. Therefore, the relative loading intensity may have differed among participants. Future studies should use MVC-normalized loading protocols and include objective fatigue validation measures, such as the MVC decline and Borg ratings. Accordingly, the observed MMG changes should be interpreted as load-induced changes rather than direct evidence of muscle fatigue. This inter-individual variability in relative loading intensity may partly explain the considerable subject-arm variability observed in the MMG responses (Figure 2). Fourth, this study primarily evaluated changes in each parameter across time points and did not examine the direct correlations between USWE and MMG parameters. In addition, the predictive ability of MMG for changes in muscle stiffness was not assessed. Future studies should clarify which MMG features most strongly reflect USWE changes, load-induced functional alterations, or the degree of muscle fatigue. Consequently, the interpretation that MMG and USWE provide complementary information is based on parallel but statistically untested temporal patterns. Future studies should directly test this hypothesis using correlation or association analyses between the MMG features and USWE-derived shear modulus. Fifth, MMG measurements may be affected by several technical factors, including sensor contact, fixation method, skin-sensor friction, environmental noise, and slight differences in the measurement location. Although measurements were performed at the same site in the present study, the standardization of the measurement procedure, evaluation of reproducibility, and optimization of filtering conditions and feature extraction methods are essential before MMG can be implemented in clinical or sports-field settings. In addition, although multiple trials were recorded and averaged within each subject-arm unit and time point, the intra-session (trial-to-trial) reliability of MMG features was not formally quantified, and the repositioning error of the sensor across the three measurement time points was not directly assessed. Although the same anatomical landmark was used to guide the sensor placement at each time point, small differences in the sensor position or contact pressure across sessions cannot be excluded as a contributing factor to the observed temporal changes. Future studies should formally quantify the intra-session reliability, for example using intraclass correlation coefficients, and control for the inter-session repositioning error. Sixth, the sample size (8 participants, 16 forearms) was small relative to the number of extracted features and statistical comparisons performed. Although Benjamini–Hochberg FDR correction and effect-size reporting (Kendall’s W) were used to mitigate the multiple-comparison problem, the limited sample size reduces the statistical power and may affect the reliability of both significant and non-significant findings. Adequately powered confirmatory studies, ideally with a priori sample-size estimation and the inclusion of target athletic populations, are required. In addition, the two forearms of the same participant were treated as separate repeated-measures units; because both arms originate from the same individual, they are not fully statistically independent, and the nominal sample size of 16 may overstate the true amount of independent information. This within-subject correlation does not invalidate the within-arm time-point comparisons but may affect the generalizability of the effect-size estimates. Furthermore, many of the significant amplitude- and energy-related features (e.g., RMS, envelope, peak-to-peak amplitude, signal energy, and wavelet energy) are conceptually and mathematically related, and are therefore expected to be highly correlated. The consistent pattern observed across these related features should be interpreted as convergent evidence for a single underlying amplitude-/energy-domain response rather than as independent replication. The present multidimensional feature analysis should be regarded as an exploratory feature screening rather than a confirmatory testing of 23 independent endpoints. Although FDR correction was applied to the conventional MMG features, the sample size was small relative to the number of extracted features, and many of the significant amplitude- and energy-related variables were highly related by definition. Thus, the consistent direction of change across these features supports the presence of an amplitude-/energy-domain post-loading MMG response, but the specific feature set should be refined and validated in larger confirmatory studies. Future studies should consider prespecified primary MMG features, feature clustering, dimensionality reduction, or mixed-effects modeling to account for feature redundancy and within-participant correlation.
5. Conclusions
A repetitive gripping exercise induced significant post-loading changes in both MMG features and USWE-derived tissue elasticity in the superficial forearm flexor–pronator region. MMG showed a transient decrease in amplitude- and energy-related features immediately after loading, followed by a recovery toward the baseline or a slight rebound at 24 h, whereas USWE demonstrated the sustained elevation of tissue elasticity. These findings suggest that MMG and USWE may provide distinct and potentially complementary information regarding active contraction-related mechanical vibration and passive tissue stiffness after local forearm loading; this complementarity remains to be directly tested in future studies. Although the USWE time course resembled previous pitching-related findings, this study was not performed in pitchers. Digital-stethoscope–based MMG should therefore be regarded as an exploratory tool for monitoring local forearm post-loading responses, pending validation under actual throwing conditions.
Author Contributions
Conceptualization, S.O. and A.I.; methodology, S.O., Y.M., K.Y. and I.S.; software, A.I. and K.Y.; validation, K.Y., Y.E. and S.T.; formal analysis, S.O., S.T., D.N. and T.H.; investigation, S.T., R.N., T.H. and R.W.; resources, R.W. and T.D.; data curation, S.O., Y.E., S.T. and D.N.; writing original draft preparation, S.O.; writing review and editing, A.I., Y.M., I.S., K.N., S.H. and R.K.; visualization, K.Y. and I.S.; supervision, R.K.; project administration, A.I., Y.M., K.N. and S.H. All authors have read and agreed to the published version of the manuscript.
Funding
This research received no external funding.
Institutional Review Board Statement
The study was conducted in accordance with the guidelines of the Declaration of Helsinki and approved by the Kobe University Review Board (approval number: B210009; approval date: 21 April 2021).
Informed Consent Statement
Informed consent was obtained from all participants involved in the study. Written informed consent was obtained from the participants for the publication of this paper.
Data Availability Statement
Data presented in this study are available upon request from the corresponding author. The data are not publicly available due to confidentiality concerns.
Acknowledgments
During the preparation of this manuscript, the authors used ChatGPT (OpenAI) for English-language editing and improving readability. The authors reviewed and edited the output and take full responsibility for the content of this publication.
Conflicts of Interest
The authors declare no conflicts of interest.
Abbreviations
The following abbreviations are used in this manuscript:
| MMG | Mechanomyography |
| USWE | Ultrasound shear wave elastography |
| FPMs | Flexor–pronator muscles |
| UCL | Ulnar collateral ligament |
| FDS | Flexor digitorum superficialis |
| RMS | Root mean square |
| PSD | Power spectral density |
| FDR | False discovery rate |
| STFT | Short-time Fourier transform |
References
- Fleisig, G.S.; Andrews, J.R.; Dillman, C.J.; Escamilla, R.F. Kinetics of baseball pitching with implications about injury mechanisms. Am. J. Sports Med. 1995, 23, 233–239. [Google Scholar] [CrossRef] [Scilit] [PubMed]
- Bullock, G.S.; Menon, G.; Nicholson, K.; Butler, R.J.; Arden, N.K.; Filbay, S.R. Baseball pitching biomechanics in relation to pain, injury, and surgery: A systematic review. J. Sci. Med. Sport 2021, 24, 13–20. [Google Scholar] [CrossRef] [Scilit] [PubMed]
- Reiman, M.P.; Walker, M.D.; Peters, S.; Kilborn, E.; Thigpen, C.A.; Garrigues, G.E. Risk factors for ulnar collateral ligament injury in professional and amateur baseball players: A systematic review with meta-analysis. J. Shoulder Elb. Surg. 2019, 28, 186–195. [Google Scholar] [CrossRef] [Scilit]
- Werner, S.L.; Fleisig, G.S.; Dillman, C.J.; Andrews, J.R. Biomechanics of the elbow during baseball pitching. J. Orthop. Sports Phys. Ther. 1993, 17, 274–278. [Google Scholar] [CrossRef] [Scilit] [PubMed]
- Ahmad, C.S.; Lee, T.Q.; ElAttrache, N.S. Biomechanical evaluation of a new ulnar collateral ligament reconstruction technique with interference screw fixation. Am. J. Sports Med. 2003, 31, 332–337. [Google Scholar] [CrossRef] [Scilit] [PubMed]
- Bachmaier, S.; Wijdicks, C.A.; Verma, N.N.; Higgins, L.D.; Greiner, S. Biomechanical Functional Elbow Restoration of Acute Ulnar Collateral Ligament Tears: The Role of Internal Bracing on Gap Formation and Repair Stabilization. Am. J. Sports Med. 2020, 48, 1884–1892. [Google Scholar] [CrossRef] [Scilit] [PubMed]
- Tajika, T.; Oya, N.; Ichinose, T.; Hamano, N.; Sasaki, T.; Shimoyama, D.; Shitara, H.; Yamamoto, A.; Kobayashi, T.; Sakamoto, M.; et al. Flexor pronator muscles’ contribution to elbow joint valgus stability: Ultrasonographic analysis in high school pitchers with and without symptoms. JSES Int. 2020, 4, 9–14. [Google Scholar] [CrossRef] [Scilit] [PubMed]
- Cinque, M.E.; Schickendantz, M.; Frangiamore, S. Review of Anatomy of the Medial Ulnar Collateral Ligament Complex of the Elbow. Curr. Rev. Musculoskelet. Med. 2020, 13, 96–102. [Google Scholar] [CrossRef] [Scilit] [PubMed]
- Pexa, B.S.; Ryan, E.D.; Myers, J.B. Medial Elbow Joint Space Increases with Valgus Stress and Decreases When Cued to Perform a Maximal Grip Contraction. Am. J. Sports Med. 2018, 46, 1114–1119. [Google Scholar] [CrossRef] [Scilit] [PubMed]
- Davidson, P.A.; Pink, M.; Perry, J.; Jobe, F.W. Functional anatomy of the flexor pronator muscle group in relation to the medial collateral ligament of the elbow. Am. J. Sports Med. 1995, 23, 245–250. [Google Scholar] [CrossRef] [Scilit] [PubMed]
- Licen, U.; Kozinc, Z. Using Shear-Wave Elastography to Assess Exercise-Induced Muscle Damage: A Review. Sensors 2022, 22, 7574. [Google Scholar] [PubMed]
- Roots, J.; Trajano, G.S.; Fontanarosa, D. Ultrasound elastography in the assessment of post-stroke muscle stiffness: A systematic review. Insights Imaging 2022, 13, 67. [Google Scholar] [CrossRef] [Scilit] [PubMed]
- Saito, A.; Okada, K.; Shibata, K.; Sato, H.; Namiki, Y.; Terui, Y.; Kikuchi, T. Elasticity of the Forearm Flexor-Pronator Muscles as a Risk Factor for Medial Elbow Injuries in Young Baseball Players: A Prospective Cohort Study of 314 Players. Am. J. Sports Med. 2023, 51, 3409–3415. [Google Scholar] [CrossRef] [Scilit] [PubMed]
- Mukohara, S.; Mifune, Y.; Inui, A.; Nishimoto, H.; Kurosawa, T.; Yamaura, K.; Shinohara, I.; Hoshino, Y.; Matsushita, T.; Matsumoto, T.; et al. Assessing the Elasticity of the Flexor Pronator Muscles After Throwing Using Ultrasound Shear Wave Elastography. Orthop. J. Sports Med. 2024, 12, 23259671241298001. [Google Scholar] [CrossRef] [Scilit] [PubMed]
- Beck, T.W.; Housh, T.J.; Cramer, J.T.; Weir, J.P.; Johnson, G.O.; Coburn, J.W.; Malek, M.H.; Mielke, M. Mechanomyographic amplitude and frequency responses during dynamic muscle actions: A comprehensive review. Biomed. Eng. Online 2005, 4, 67. [Google Scholar] [CrossRef] [Scilit] [PubMed]
- Orizio, C.; Gobbo, M.; Diemont, B.; Esposito, F.; Veicsteinas, A. The surface mechanomyogram as a tool to describe the influence of fatigue on biceps brachii motor unit activation strategy. Historical basis and novel evidence. Eur. J. Appl. Physiol. 2003, 90, 326–336. [Google Scholar] [CrossRef] [Scilit] [PubMed]
- Ibitoye, M.O.; Hamzaid, N.A.; Zuniga, J.M.; Hasnan, N.; Wahab, A.K. Mechanomyographic parameter extraction methods: An appraisal for clinical applications. Sensors 2014, 14, 22940–22970. [Google Scholar] [CrossRef] [Scilit] [PubMed]
- Orizio, C.; Diemont, B.; Esposito, F.; Alfonsi, E.; Parrinello, G.; Moglia, A.; Veicsteinas, A. Surface mechanomyogram reflects the changes in the mechanical properties of muscle at fatigue. Eur. J. Appl. Physiol. Occup. Physiol. 1999, 80, 276–284. [Google Scholar] [CrossRef] [Scilit] [PubMed]
- Kimura, T.; Hamada, T.; Watanabe, T.; Maeda, A.; Oya, T.; Moritani, T. Mechanomyographic responses in human biceps brachii and soleus during sustained isometric contraction. Eur. J. Appl. Physiol. 2004, 92, 533–539. [Google Scholar] [CrossRef] [Scilit] [PubMed]
- Wang, S.J.; Guan, X.R.; Bai, Y.; Chang, B.; Shi, J.N.; He, L.; Zhou, Q. Fatigue analysis of the flexor digitorum superficialis muscle using mechanomyogram during moderate-intensity intermittent dynamic tasks. Sci. Rep. 2025, 15, 38041. [Google Scholar] [CrossRef] [Scilit] [PubMed]
- Nakabayashi, D.; Inui, A.; Mifune, Y.; Yamaura, K.; Kato, T.; Furukawa, T.; Hayashi, S.; Matsumoto, T.; Matsushita, T.; Kuroda, R. Quantitative Evaluation of Tendon Gliding Sounds and Their Classification Using Deep Learning Models. Cureus 2025, 17, e81790. [Google Scholar] [CrossRef] [Scilit] [PubMed]
- Islam, M.A.; Sundaraj, K.; Ahmad, R.B.; Sundaraj, S.; Ahamed, N.U.; Ali, M.A. Cross-talk in mechanomyographic signals from the forearm muscles during sub-maximal to maximal isometric grip force. PLoS ONE 2014, 9, e96628. [Google Scholar] [CrossRef] [Scilit] [PubMed]

Disclaimer/Publisher’s Note: The statements, opinions and data contained in all publications are solely those of the individual author(s) and contributor(s) and not of MDPI and/or the editor(s). MDPI and/or the editor(s) disclaim responsibility for any injury to people or property resulting from any ideas, methods, instructions or products referred to in the content. |
© 2026 by the authors. Licensee MDPI, Basel, Switzerland. This article is an open access article distributed under the terms and conditions of the Creative Commons Attribution (CC BY) license.