Article

Wind-Induced Vibration of UHV Wing-Expanded Transmission Lines with Different Coherence Functions


by
Wenwu Zhou
1,2,
Qian Gao
3,
Lei Yang
1,
Xueming Wang
1,
Qiongfei Du
3 and
Qing Sun
3,*
1
Northwest Electric Power Design Institute Co., Ltd., China Power Engineering Consulting Group, Xi’an 710075, China
2
School of Automation, Wuhan University of Technology, Wuhan 430070, China
3
College of Human Settlements and Civil Engineering, Xi’an Jiao Tong University, Xi’an 710049, China
*
Author to whom correspondence should be addressed.
Appl. Sci. 2026, 16(15), 7378; https://doi.org/10.3390/app16157378
Submission received: 25 June 2026 / Revised: 20 July 2026 / Accepted: 21 July 2026 / Published: 23 July 2026
(This article belongs to the Section Civil Engineering)

Abstract

With the continuous growth of electricity demand, the structural safety of transmission towers under wind loads has become crucial. The wind-resistant design of transmission towers is mainly analyzed through the wind-induced response and wind vibration coefficients of the structure, but the applicability of the coherence function selected in the wind load simulation process has been overlooked. This study investigates the applicability of the Davenport and Shiotani coherence functions in wind load simulation for long-span transmission towers and also analyses the influence of tower-line coupling effects on transmission towers. The research results show that (1) the displacement mean square deviation response and wind vibration coefficient of the Davenport coherence function are significantly larger than those of the Shiotani coherence function. The Shiotani coherence function is not applicable to wind resistance-related studies of long-span high towers, and the design parameters are insufficiently safe. (2) Under wind directions of 60° and 90°, the coupling effect increases the wind vibration coefficient; under wind directions of 0° and 45°, the coupling effect reduces the wind vibration coefficient. (3) Based on the current codes and simulation results, a modified formula for the wind vibration coefficient of transmission towers is proposed, which can reflect the wind vibration effect of “spread-wing” transmission towers, and the overall error of the wind vibration coefficient can be controlled within 10%. The research in this paper is of great significance to the wind-resistant design of long-span transmission towers.

1. Introduction

Over the past decade, global economic growth and increasing electricity demand have driven the rapid expansion of power transmission infrastructure. Long-span transmission tower-line systems are the main carriers for power transmission and have been constructed on a large scale in special terrains such as rivers, straits, and valleys [1]. However, special terrains lead to complex wind conditions and strong wind forces, resulting in a high frequency of wind disasters and frequent tower collapse accidents [2]. By studying the wind-induced responses and wind vibration coefficients of long-span transmission lines, the stress state of the structure under wind loads can be accurately determined [3,4]. This helps avoid accidents such as tower overturning and conductor breakage caused by insufficient estimation of wind vibration effects, thereby providing a quantitative basis for the wind-resistant safety of transmission lines [5].
Wind-induced responses can determine the actual dynamic reactions of a structure under wind loads, thereby enabling targeted structural design [6]. For example, exploring the wind-induced responses of high-rise buildings under strong winds has promoted the role of large eddy simulation (LES) in predicting wind effects on high-rise buildings [7,8,9], and can also be used to estimate the wind pressure distribution on the surface of high-rise buildings and wind force coefficients [10,11,12]. Additionally, studies have shown that the laws of wind-induced responses can also be applied to damage risk assessment [13,14], and wind-resistant design optimization of transmission towers [15].
To simplify the calculation of structural wind-resistant design, the wind vibration coefficient converts the dynamic effects in the wind-induced response of a structure into an amplification factor for equivalent static loads [16,17,18]. For example, Lou et al. [19] further studied the wind-induced vibration responses and wind vibration coefficients of transmission towers under wind field type B and typhoon wind fields, while Deng et al. [20] studied the wind vibration coefficient based on the aeroelastic model. Wang et al. [21] studied the tower-group wind vibration coefficient. Xie et al. [22] analyzed the influence of wind speed, ground roughness, and wind attack angle on the tower-line system through wind vibration coefficients.
Based on the aforementioned research methods for improving structural wind-resistant design through structural wind-induced responses and wind vibration coefficients, researchers have adopted various methods to simulate the effect of wind loads on structures. For example, Lu et al. studied the application of large eddy simulation (LES) models in structural wind-resistant design [23,24,25], and Tamura et al. used wind tunnel tests to investigate wind load distribution [26,27], while Lin et al. [28] adopted the harmonic superposition method and Davenport power spectrum to simulate fluctuating wind loads. Although existing studies have provided important insights for the wind-resistant design of long-span transmission towers, there are still gaps and limitations:
First, regarding the applicability of the spatial coherence function, previous studies have focused on simulating fluctuating wind speeds using a single coherence function. However, for long-span transmission towers, due to their special conditions such as large terrain height differences, variable wind fields, and relatively high tower types, the applicability of spatial coherence functions has not been considered. For the currently widely used downwind coherence functions, namely the Davenport coherence function and the Shiotani coherence function, a comparative analysis can be conducted based on the research background of long-span transmission line projects.
Second, regarding the influence of the tower-line coupling effect, there is still a research gap in studies related to spread-wing transmission towers, which are widely used in long-span transmission lines. Existing studies have shown that tower-line coupling can affect simulation results, so it is necessary to conduct research on this type of tower from the perspectives of bare towers and tower-line systems.
To overcome these limitations, this paper first establishes finite-element models of the single tower and the tower-line system and conducts analysis and verification on the models. Secondly, it simulates the random fluctuating wind time history using the two coherence functions, respectively, and further simulates the wind load time history. Then, based on the wind-induced response and wind vibration coefficient of the transmission tower, it studies the applicability of the spatial coherence function and the influence of tower-line coupling on the transmission tower. Finally, based on the current codes and simulation results, a modified formula for the wind vibration coefficient of long-span spread-wing transmission towers is proposed. This research provides important reference significance for the wind-resistant design of such long-span transmission projects.

2. Simulation Modeling and Modal Analysis

This section introduces the project background, establishes the finite-element models of the single tower and tower-line system, analyzes their modal characteristics, and validates the numerical models.

2.1. Project Overview

This paper takes the Yan’an Yellow River ±800 kV UHV long-span transmission line project as the research background, due to the fact that the Yan’an Yellow River crossing section is mainly canyon, it is necessary to deal with the variability of wind speed and direction changes in the canyon wind field, and the steel tower is located at the top of the mountain, with a height difference of 133 m from the average lowest water level of the Yellow River. Therefore, it is of great significance to study the wind-induced response and wind-induced vibration coefficient of this large-span transmission line with “variable wind conditions and complex terrain.
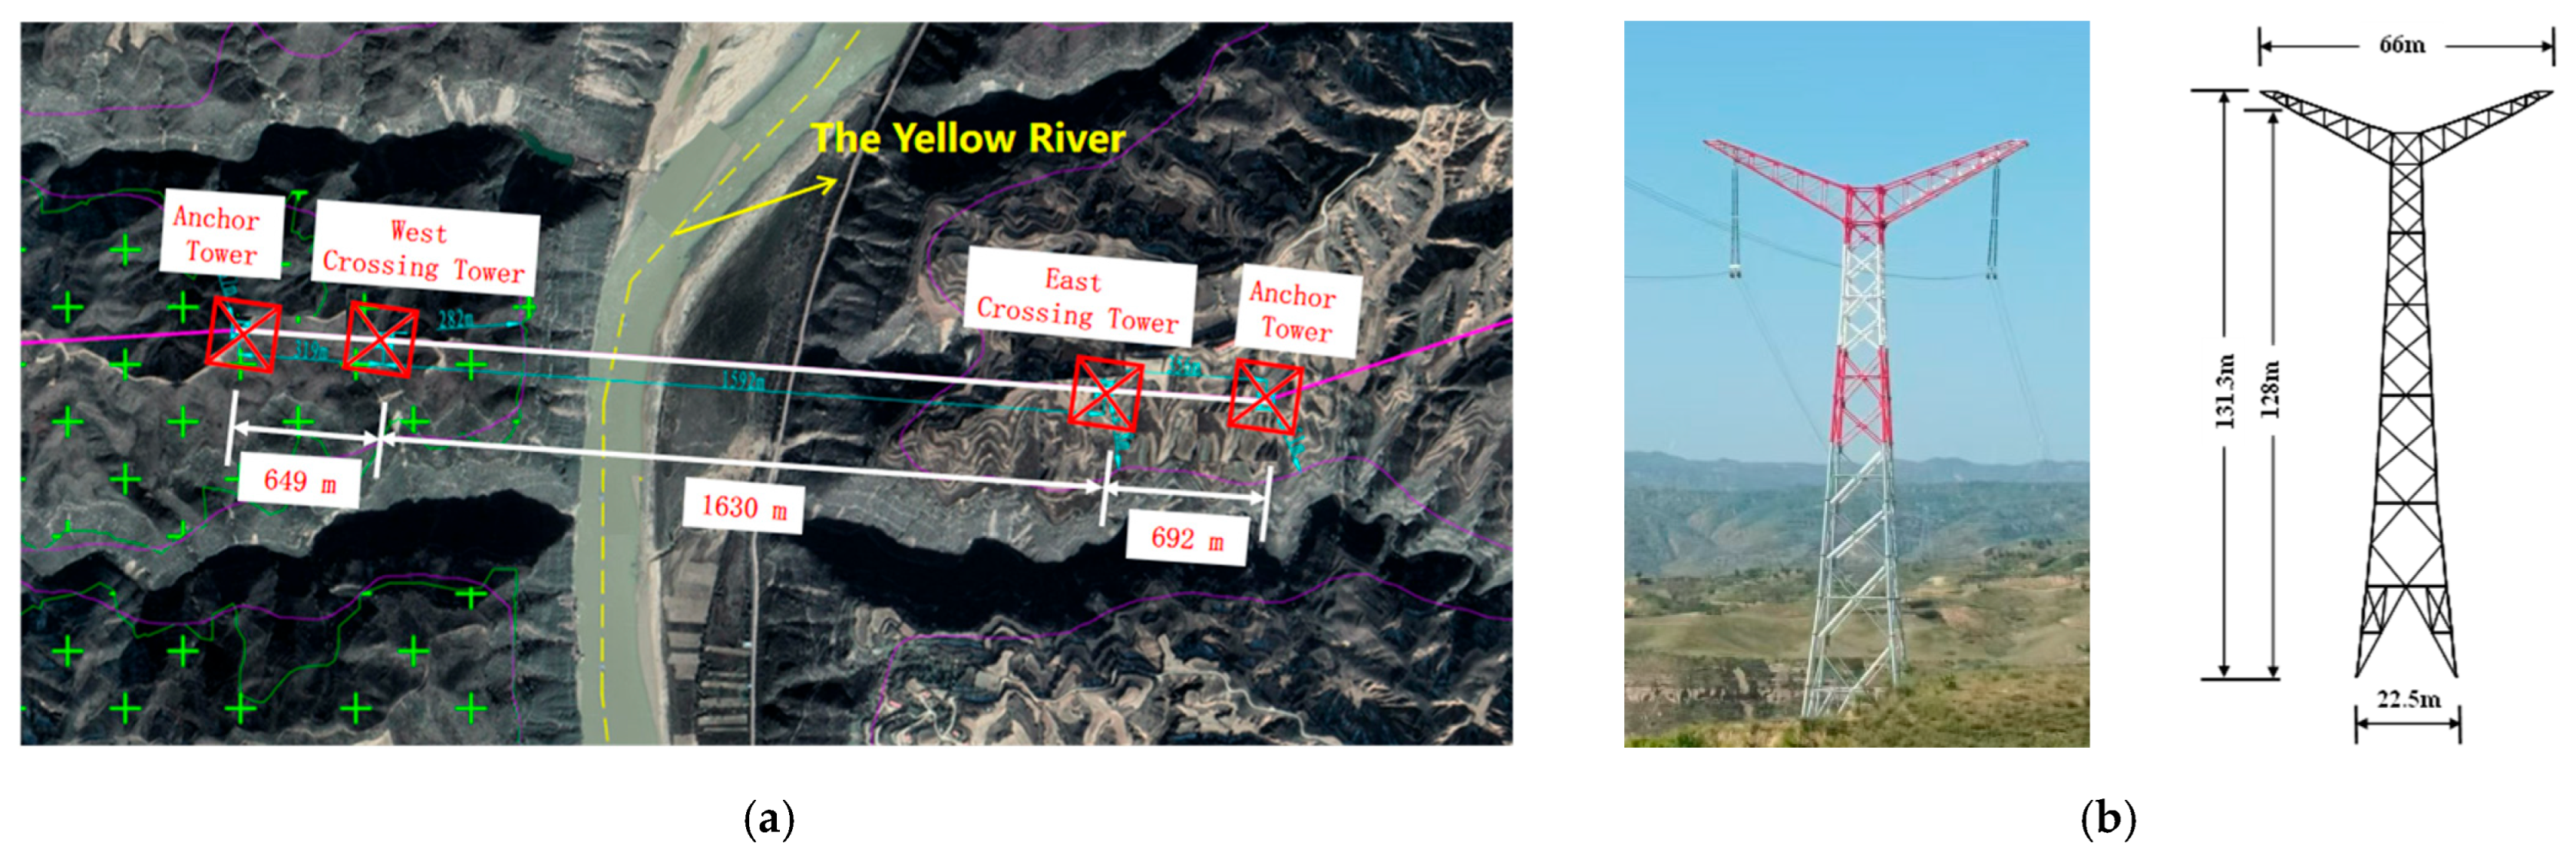
The crossing mode of this transmission line is “tension tower–straight tower–straight tower–tension tower”, with span distributions of 649 m–1630 m–692 m, as shown in Figure 1a. There are four newly built towers, among which the two straight-line crossing towers adopt “spread-wing type” steel pipe towers with a height of 131.3 m. The east crossing tower is the research object of this paper, and its dimension information is shown in Figure 1b.

2.2. Finite-Element Modeling and Modal Analysis

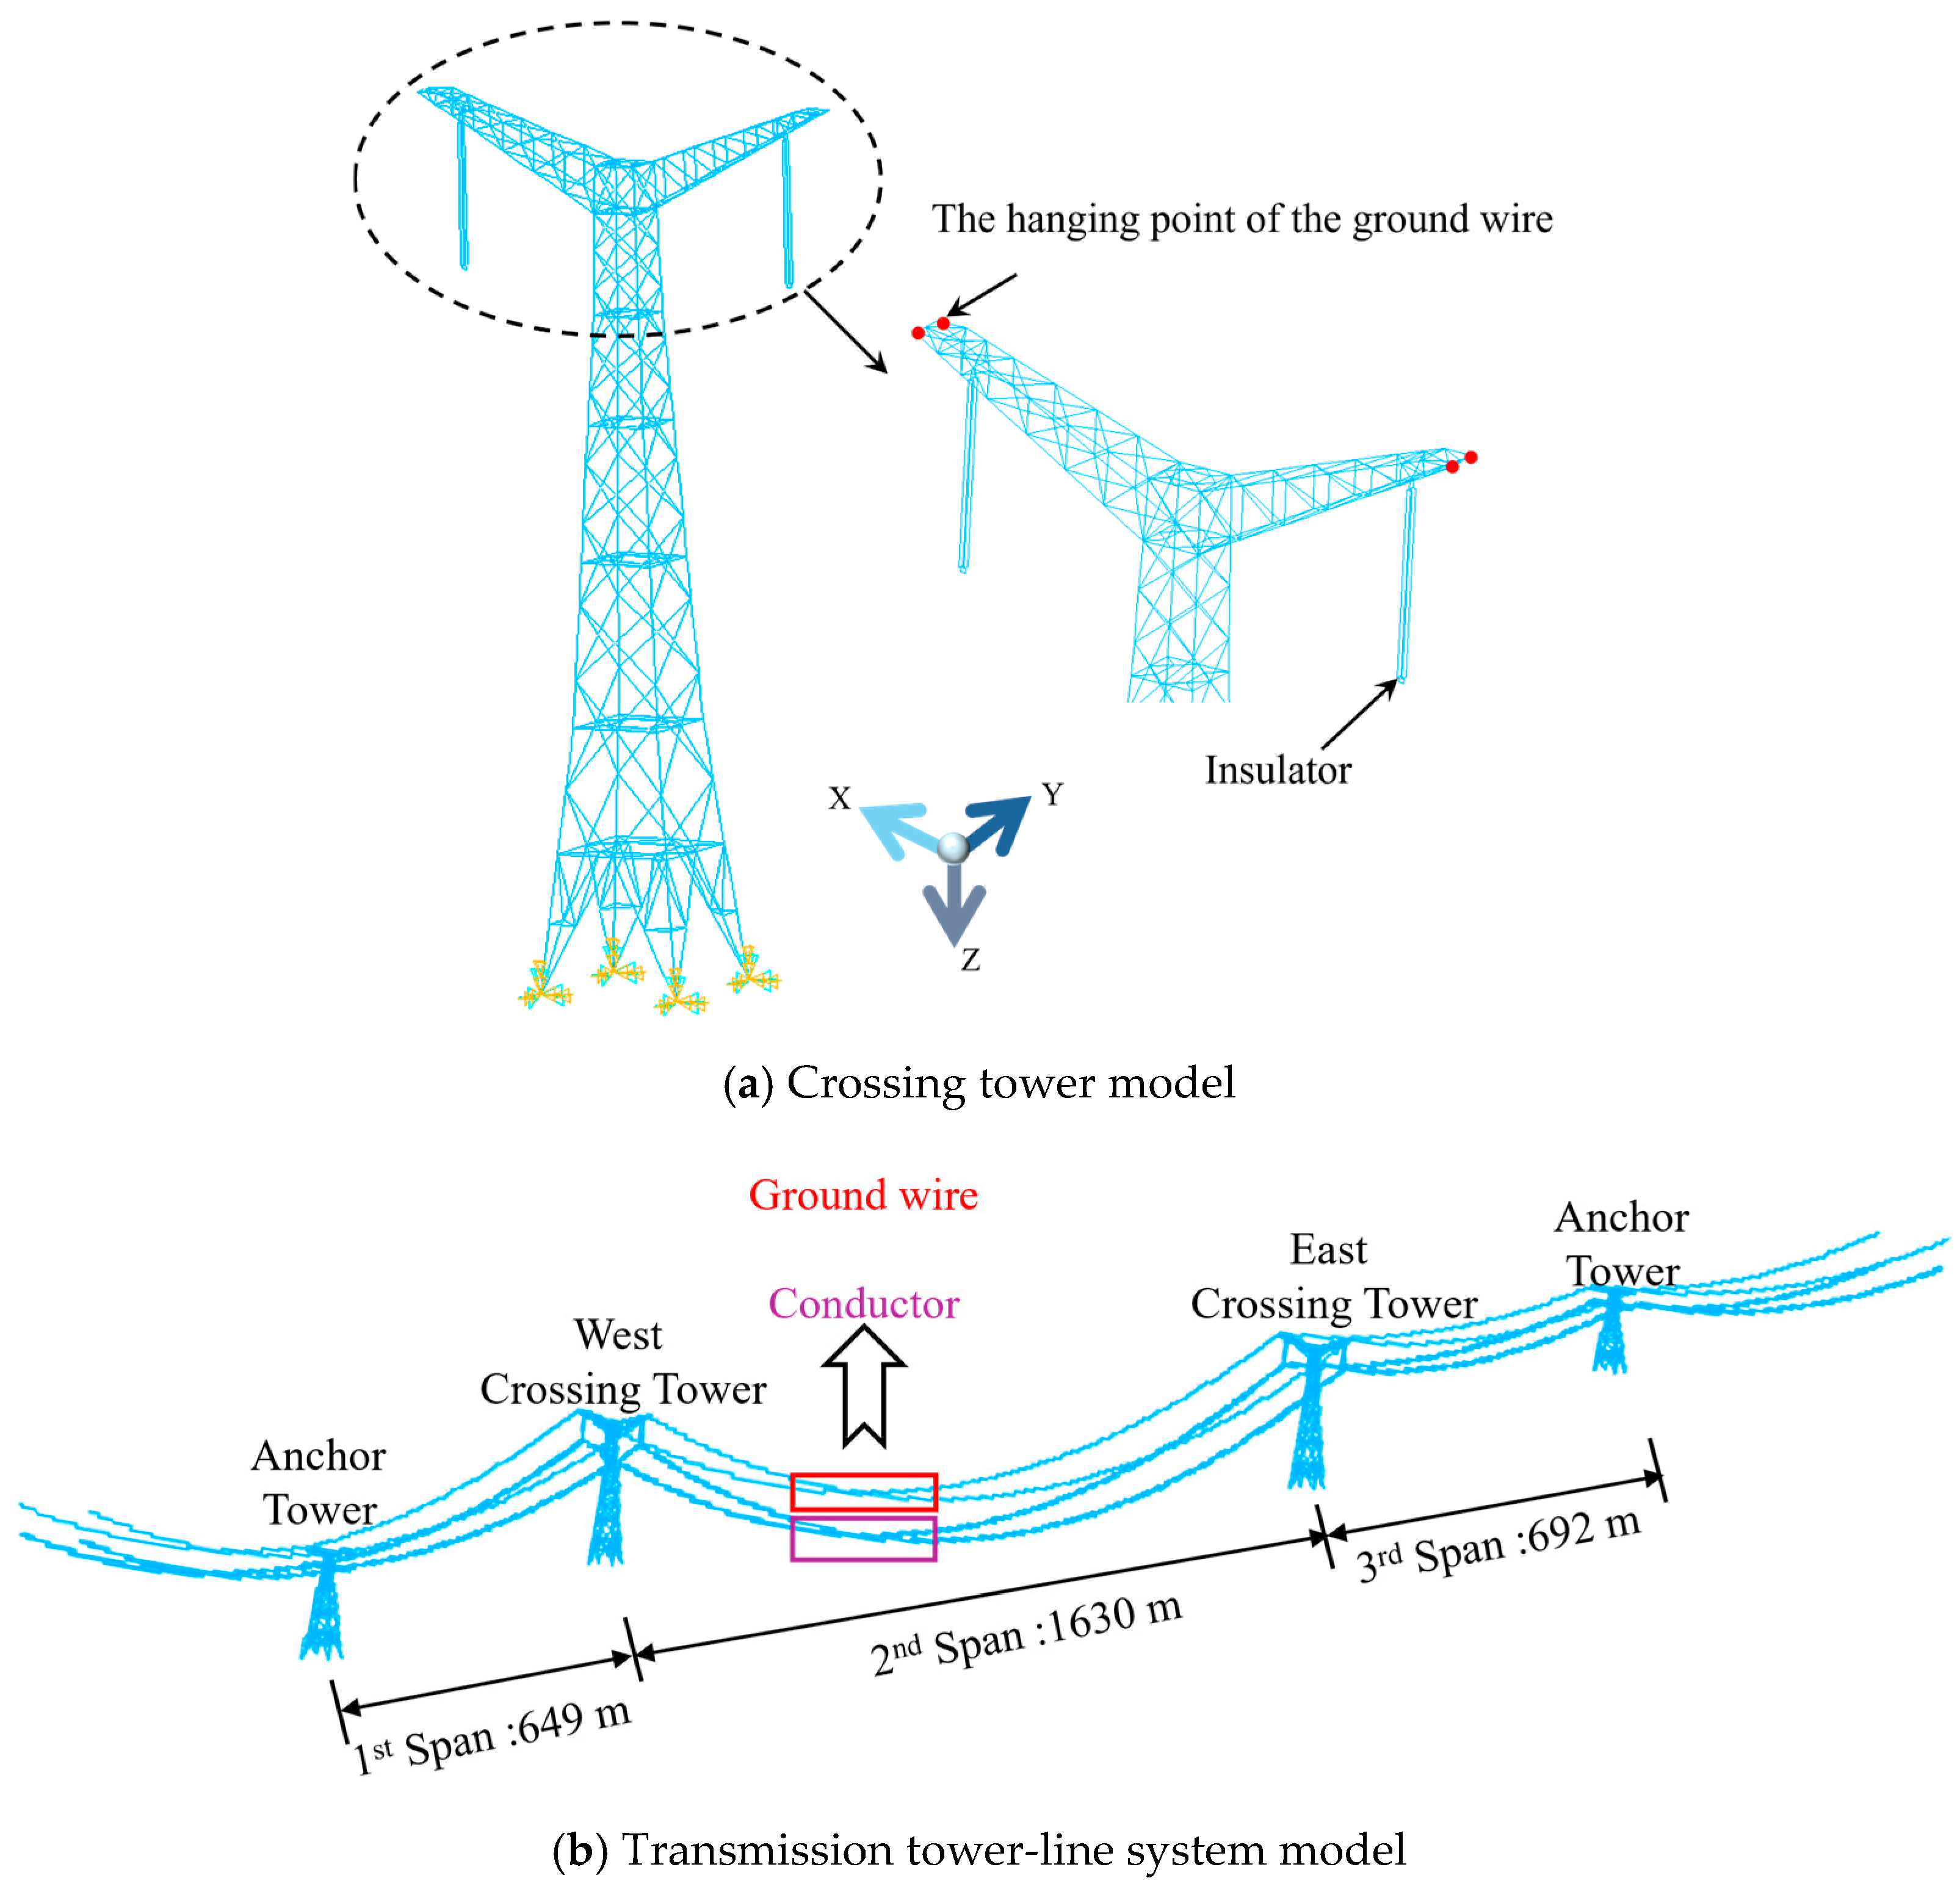
The finite-element models of the single tower and the “four-tower five-line” system were established using ANSYS Mechanical APDL 18.0 (ANSYS, Inc., Canonsburg, PA, USA) [29], as shown in Figure 2. The transmission lines are divided into two layers: the top layer consists of two ground wires, and the lower layer consists of four bundled conductors. Their parameters are listed in Table 1.
The model is based on the following simplifications and assumptions: when constructing the model, fixed supports are used to simulate rigid foundations for the tower legs, and hinge connections are adopted between the transmission lines and the insulator strings, as well as between the insulator strings and the transmission tower; using beam 189 to simulate steel pipes and angle steels, beam 188 to simulate insulator strings, and link 10 to simulate transmission lines. The structural damping ratio is taken as 0.03 in accordance with the code for seismic design of electrical installations [30]. The selection of material properties and geometric properties is based on the design parameters of the tower-line system.
It should be noted that the rigid-foundation and ideal-hinge assumptions may influence the dynamic characteristics of the tower-line system. However, identical boundary conditions and connection assumptions were adopted for all simulation cases in this study to ensure a consistent comparison of the effects of different coherence functions on wind-induced responses [31].

2.2.1. Modal Analysis of Single-Tower Model

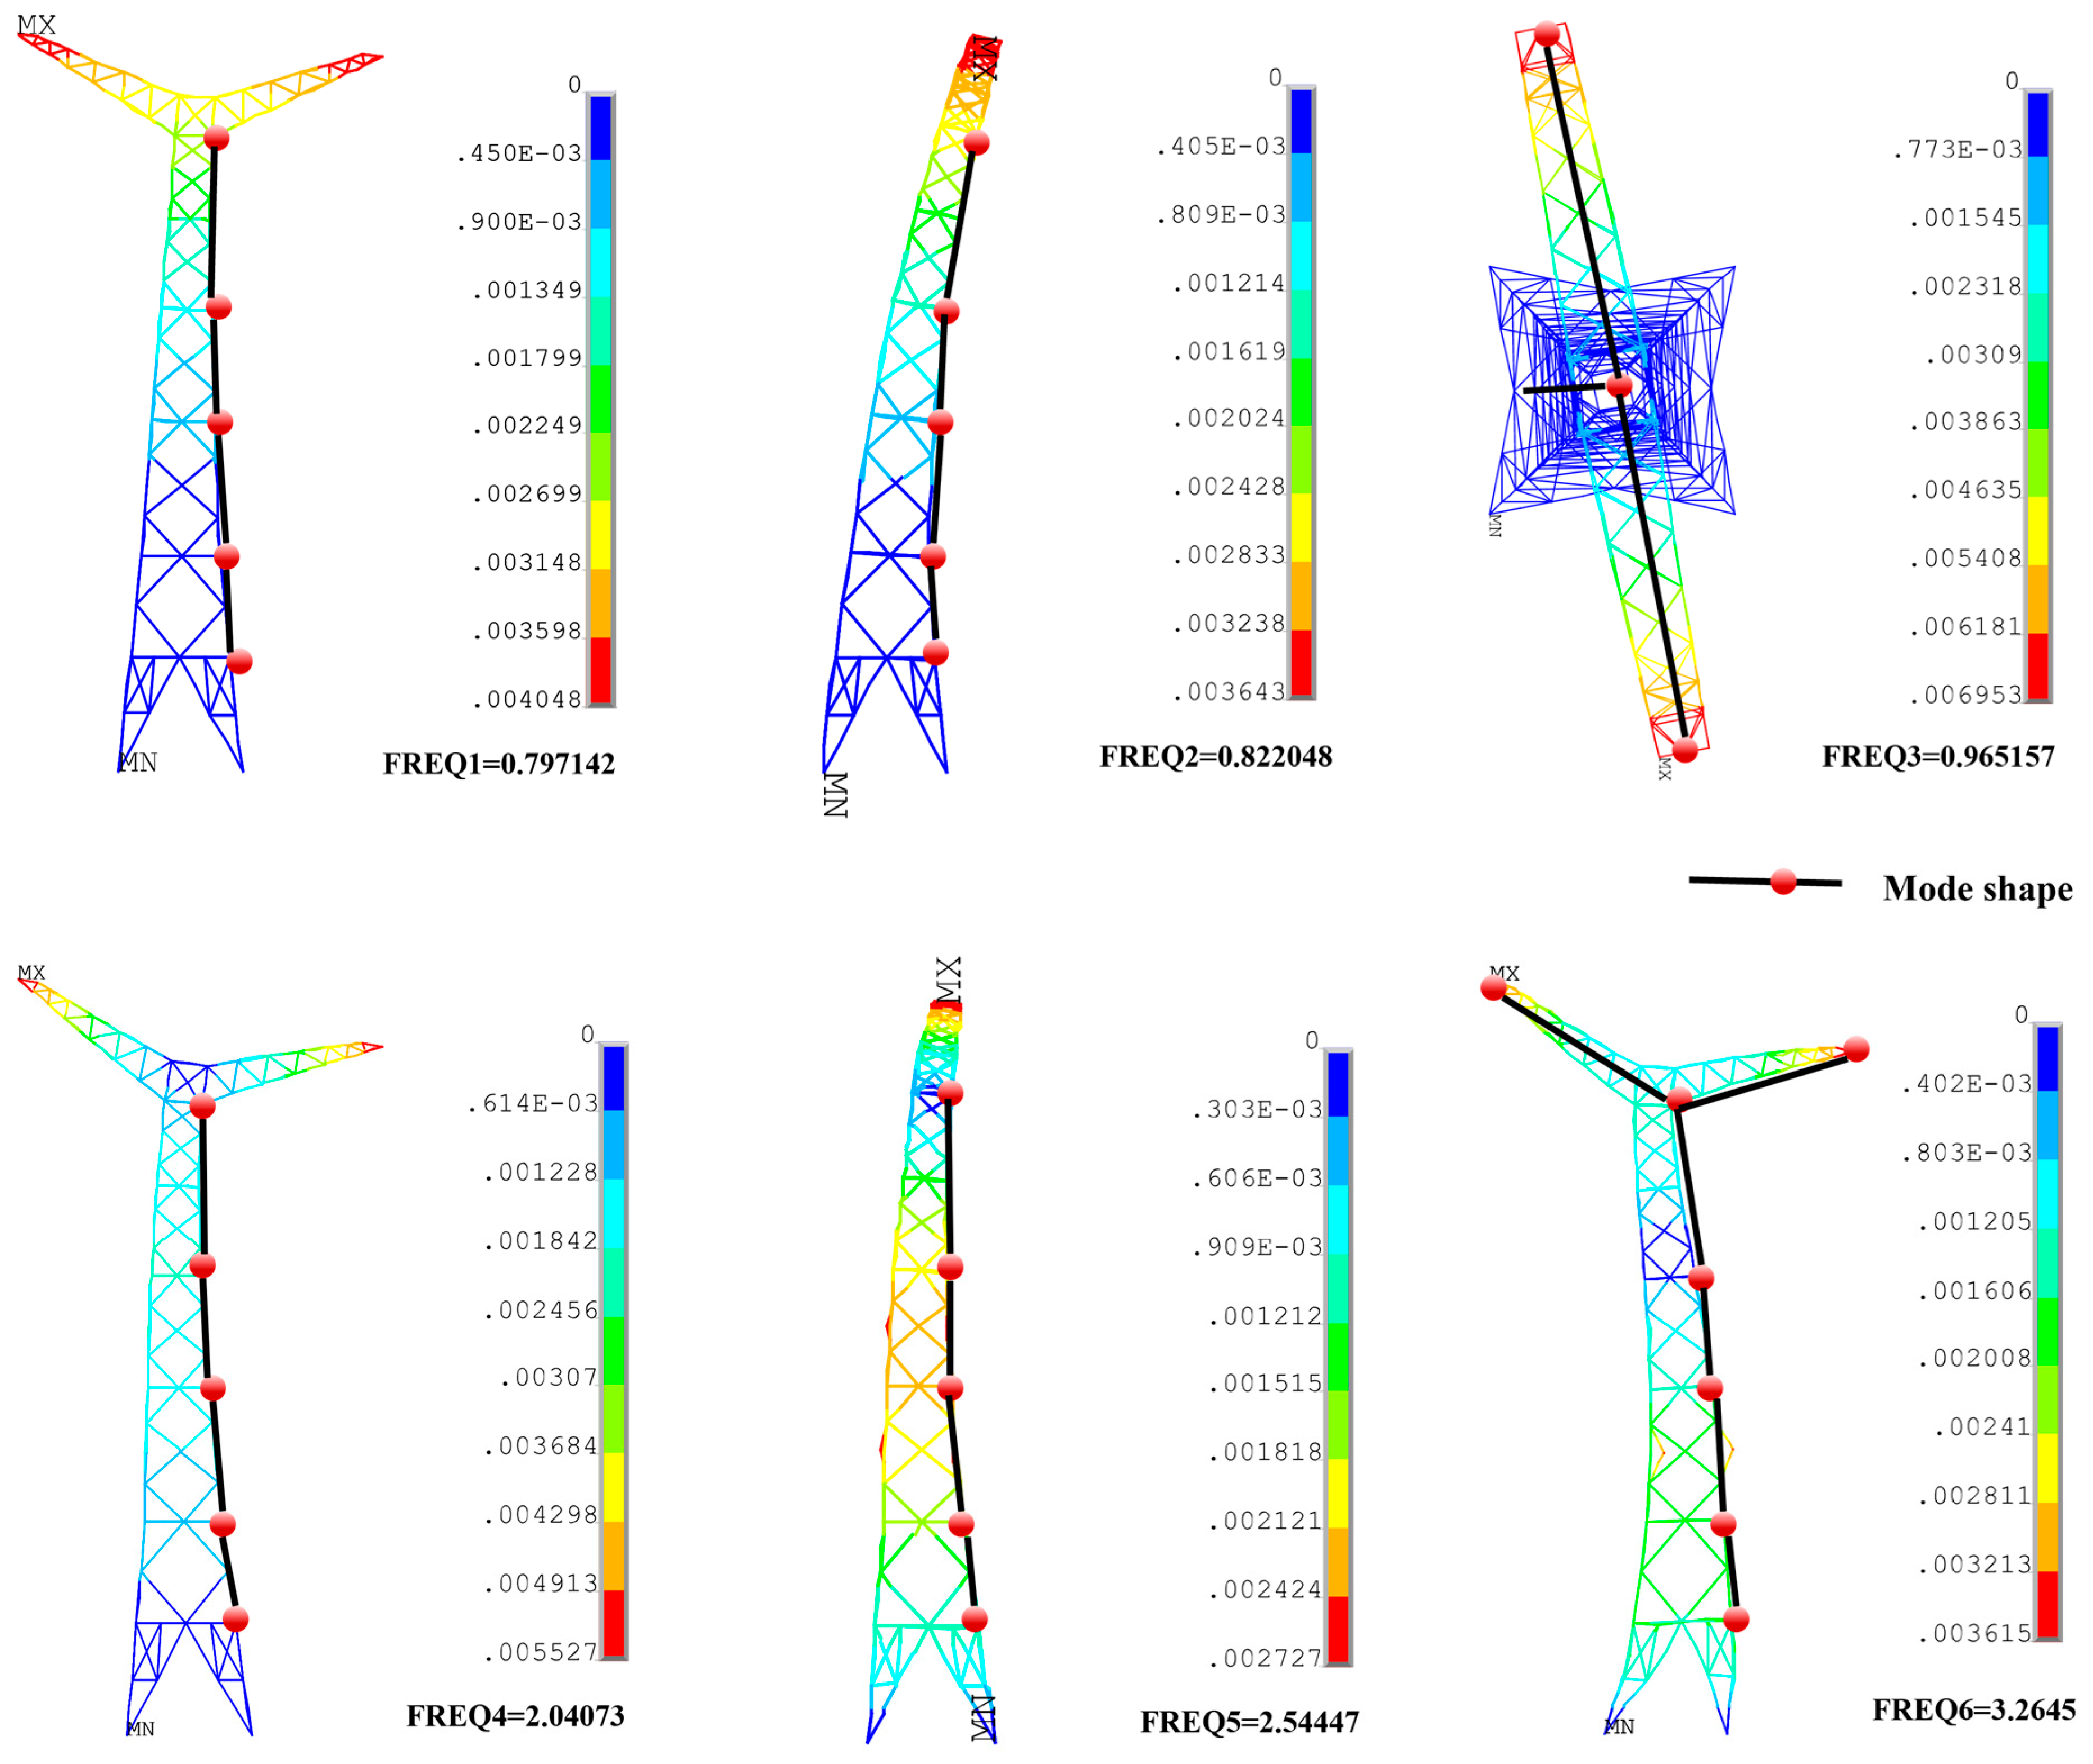
To understand the natural vibration characteristics of the single-tower model, a modal analysis was conducted on the crossing tower. The first six natural frequencies and vibration modes of the single tower are shown in Figure 3. In the first three vibration modes, the frequency of translational vibration in the X-direction is slightly lower than that in the Y-direction. This is because the main structure of the crossing tower body is a symmetric square, with changes in mass and stiffness only at the cross arm, leading to the stiffness in the Y-direction being slightly greater than that in the X-direction. The frequency of torsional vibration modes is relatively high, and no Z-direction torsion occurs in the last three vibration modes, indicating that the “top-heavy and bottom-light” phenomenon of the transmission tower is not obvious. Overall, the crossing tower is mainly characterized by translational movements in two directions. Due to its uniform stiffness and no obvious mass mutation, the integral deformation of the spread-wing steel tube tower presents a bending deformation.
Note: The X, Y, and Z directions in the figure refer to the direction perpendicular to the wire, along the wire, and along the height direction, respectively, as described later.
Figure 3. The first six mode shapes of the east-spanning tower model.
Applsci 16 07378 g003

2.2.2. Modal Analysis of the Tower-Line System Model

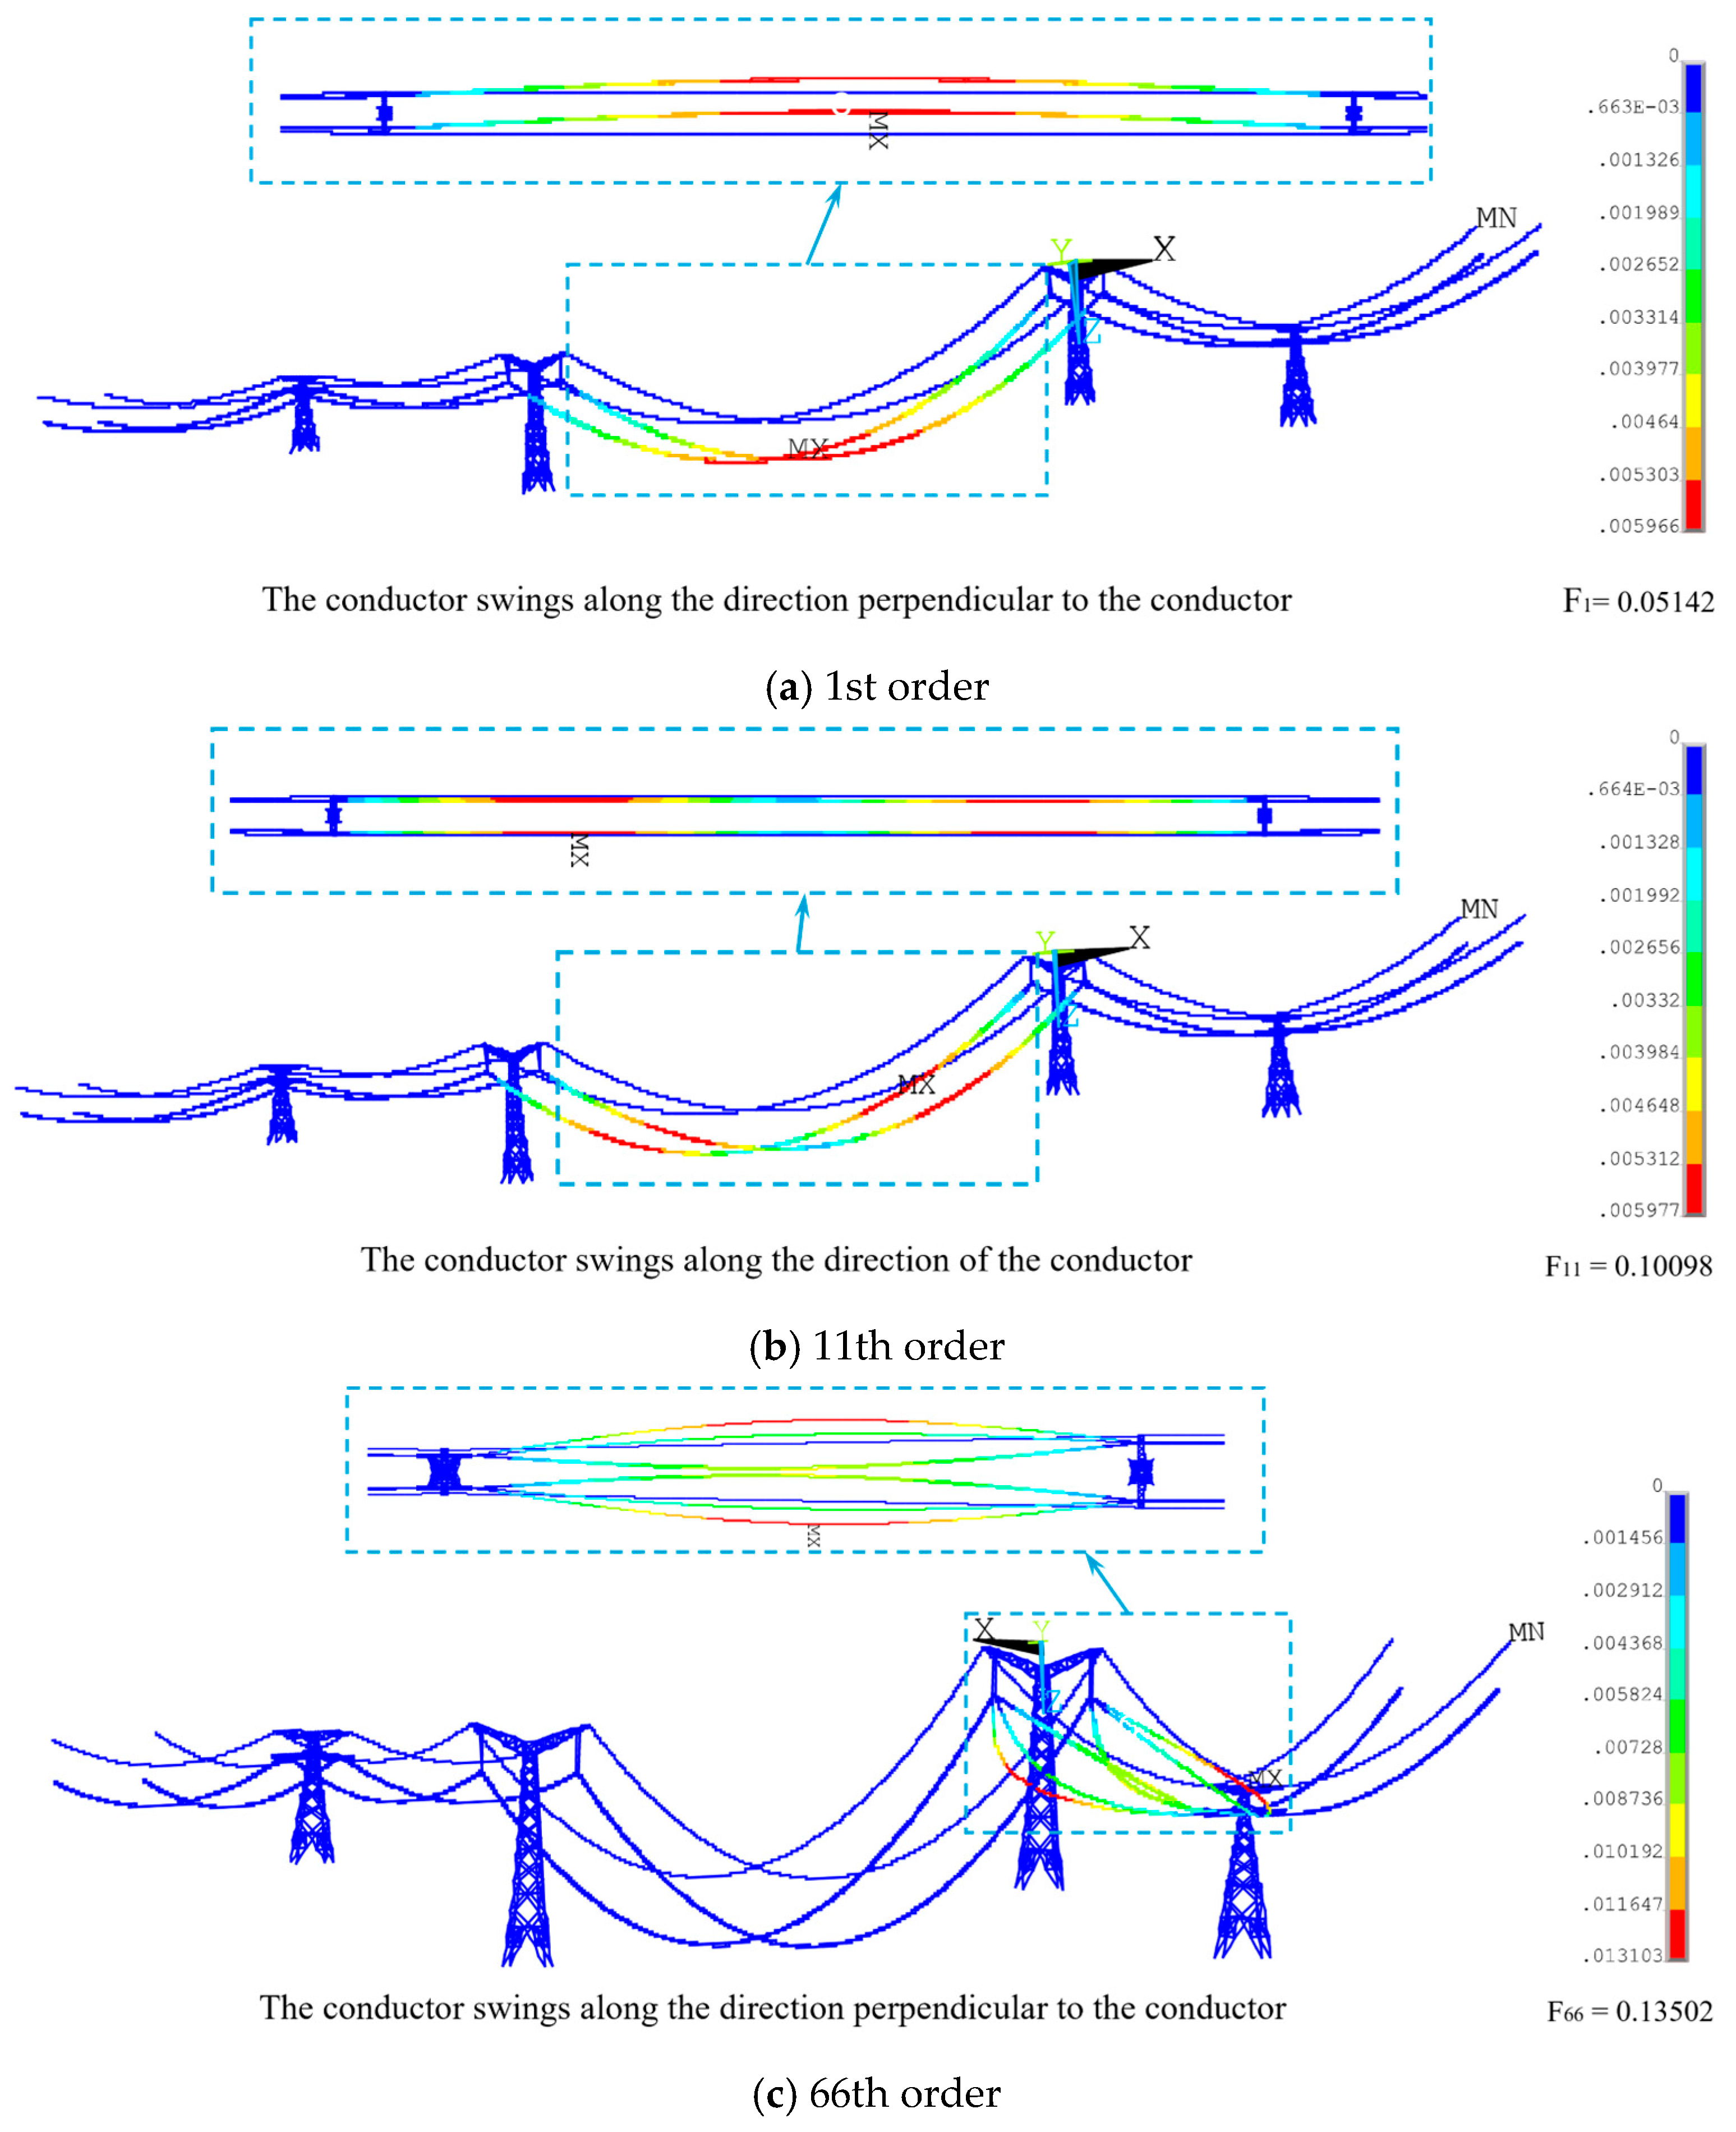
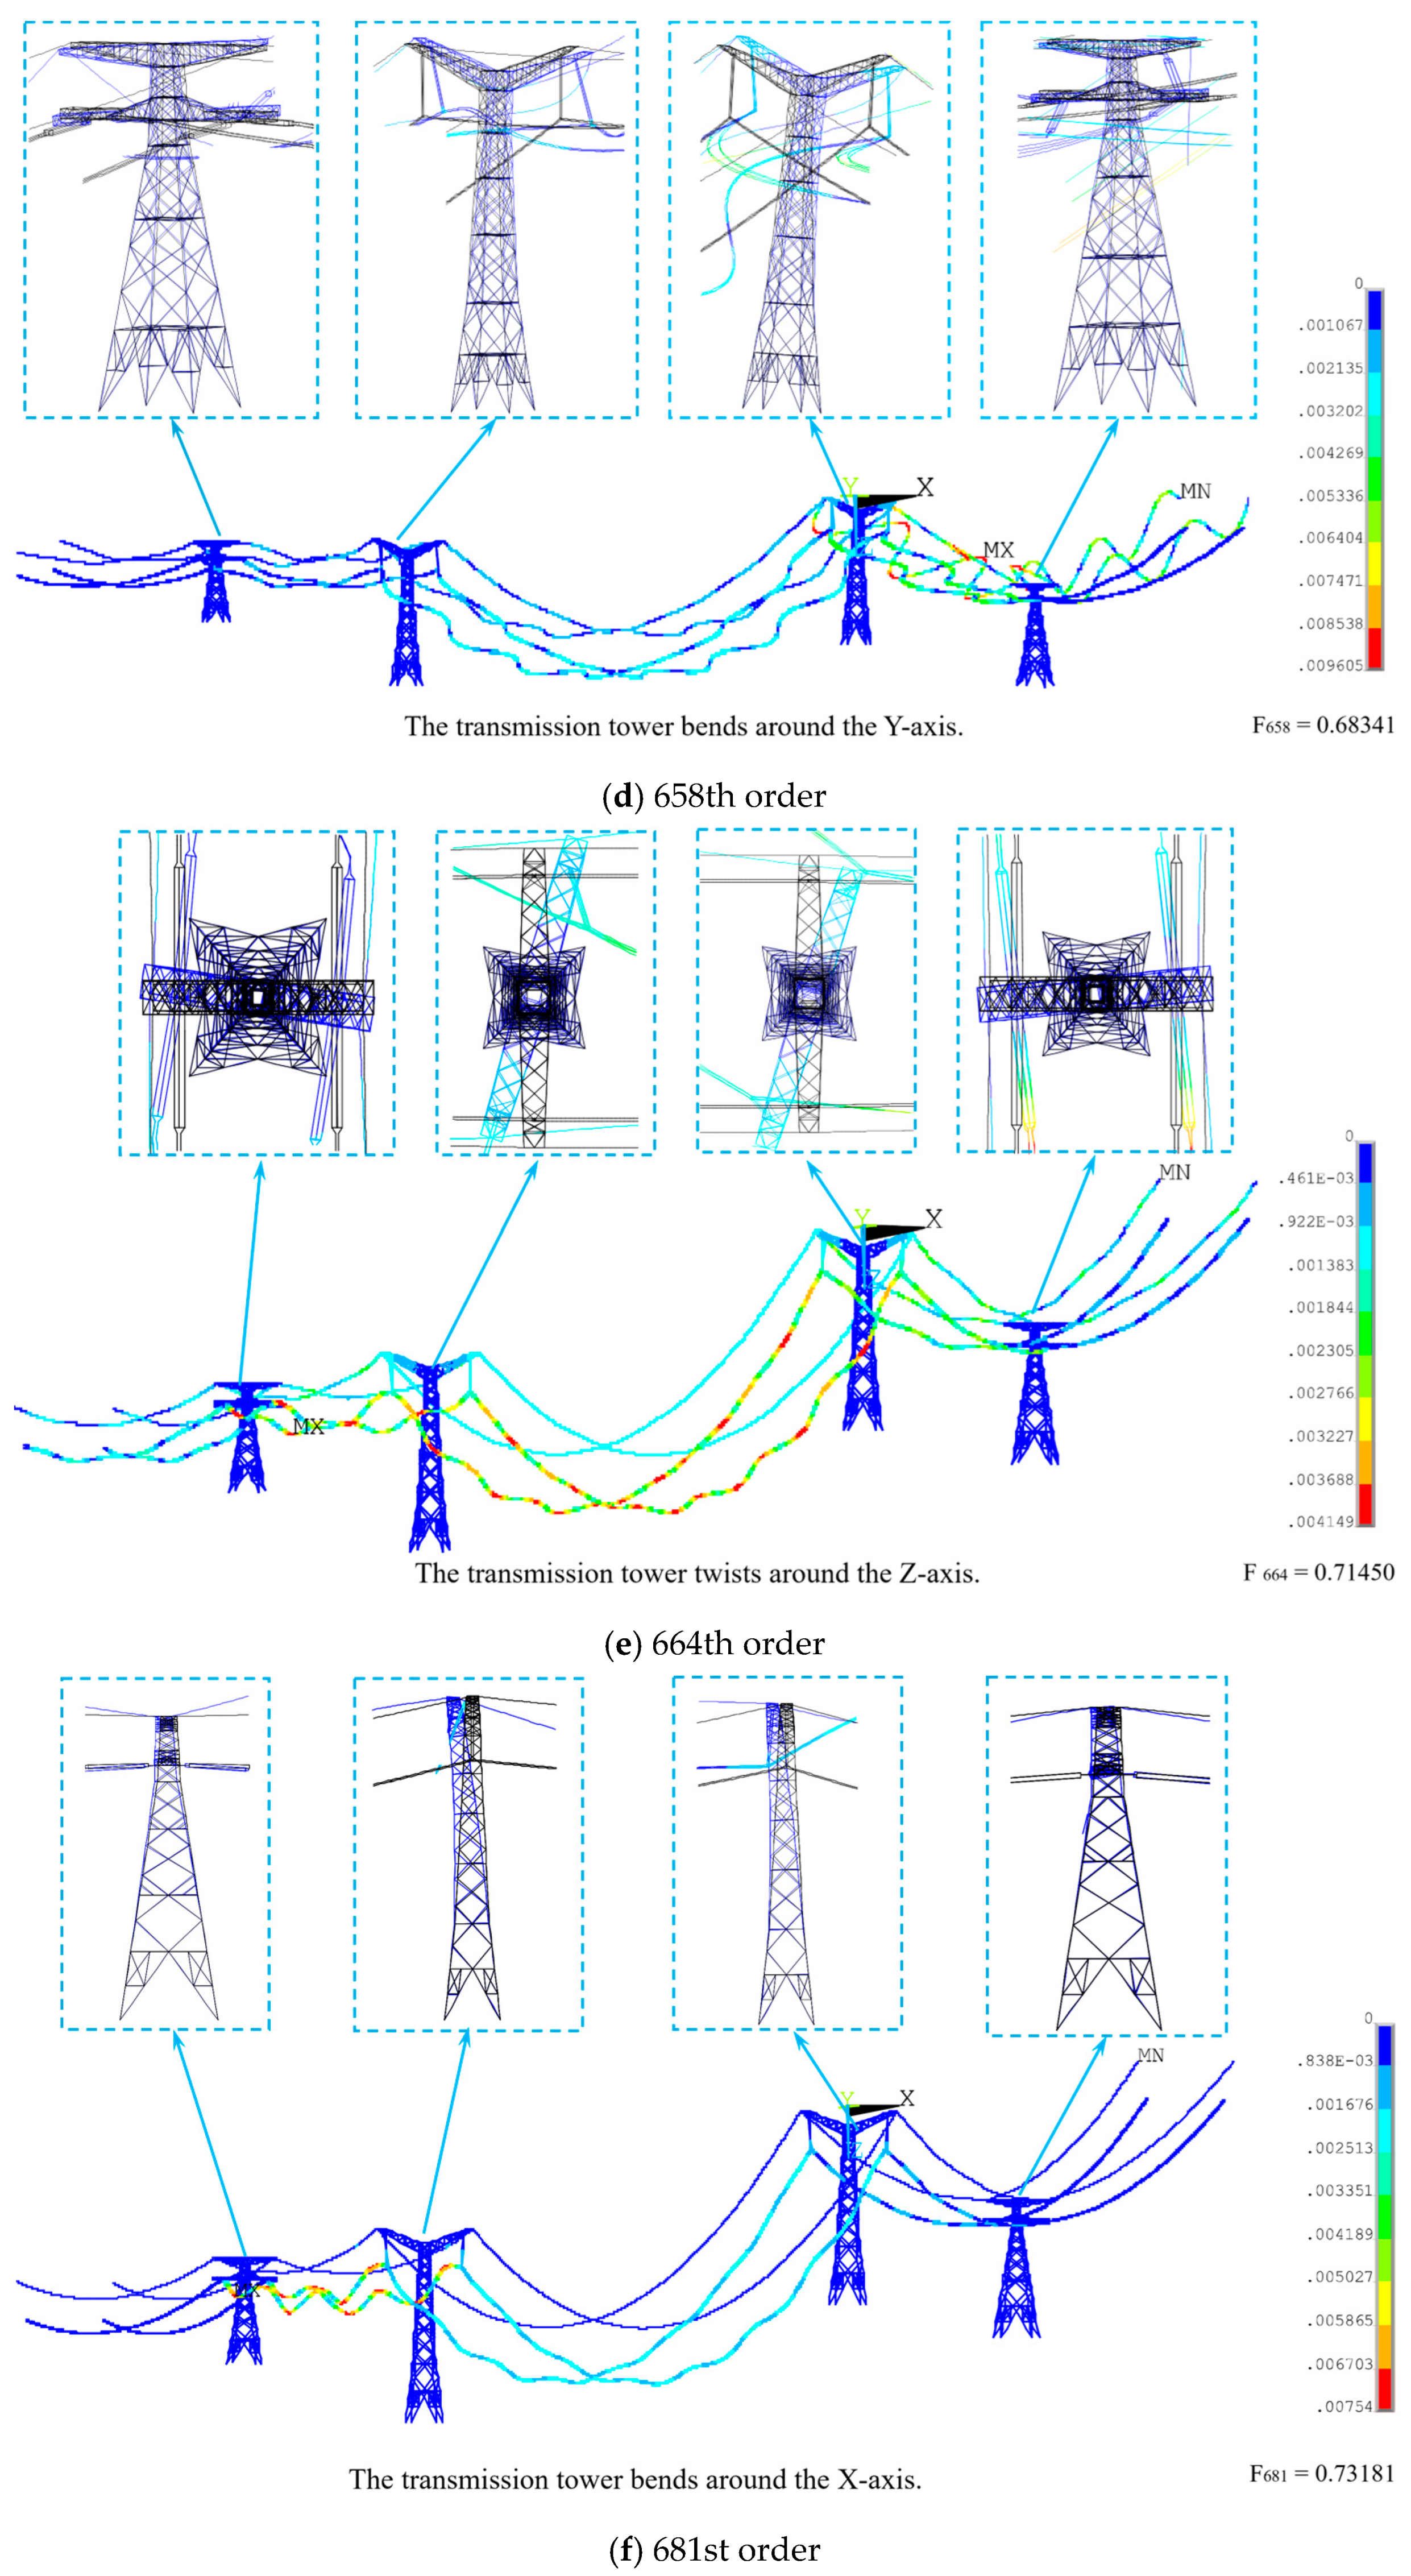
The typical vibration modes and frequencies of the “four-tower and five-line” model are shown in Figure 4. Due to the large mass and low stiffness of the transmission lines, the low-order vibration modes of the tower-line system are mainly manifested as the vibration modes of the transmission lines, with dense modal. In the tower-line system, the transmission tower exhibits obvious X-direction translation, Z-direction torsion, and Y-direction translation in the 658th, 664th, and 681st orders, respectively. The frequency of the transmission tower is lower than that of the single tower, and the torsional vibration mode appears ahead of schedule. This indicates that the conductor system introduces additional mass effect and geometric nonlinear constraints, which significantly reduce the stiffness of the overall structure. Moreover, the Z-direction torsional frequency of the tower-line system is more affected than the X-direction and Y-direction frequencies. Therefore, there are significant differences in the dynamic characteristics between the tower-line coupled system and the single-tower model. In particular, the sensitivity of the torsional vibration mode is enhanced, and its frequency is reduced. For this reason, it is necessary to perform modal analysis and calculate wind-induced vibration coefficients based on the tower-line system, so as to avoid underestimating the actual risk of wind-induced vibration.

2.3. Model Validation

To verify the reliability of the numerical models, the single-tower model and the tower-line system model are validated separately in the following subsections.

2.3.1. Validation of the Single-Tower Model

In the seismic and wind resistance analysis of structures, the first-order natural vibration mode and period of the structure are mainly considered. The load code for the design of building structures [30] provides an estimation formula for the first-order frequency of structures:
f 1 = 0.007 ~ 0.013 H 1
where f 1 is the first-order main frequency; and H is the total height of the tower frame.
The height of the spread-wing steel tube tower is 131.3 m, and its first-order main frequency should be in the range of 0.59~1.09 Hz. The simulation results of the transmission tower mentioned above show that the first-order frequency of the transmission tower is 0.7971 Hz, which falls within this range. Therefore, the rationality of the single-tower model is verified.

2.3.2. Tower-Line Model Validation

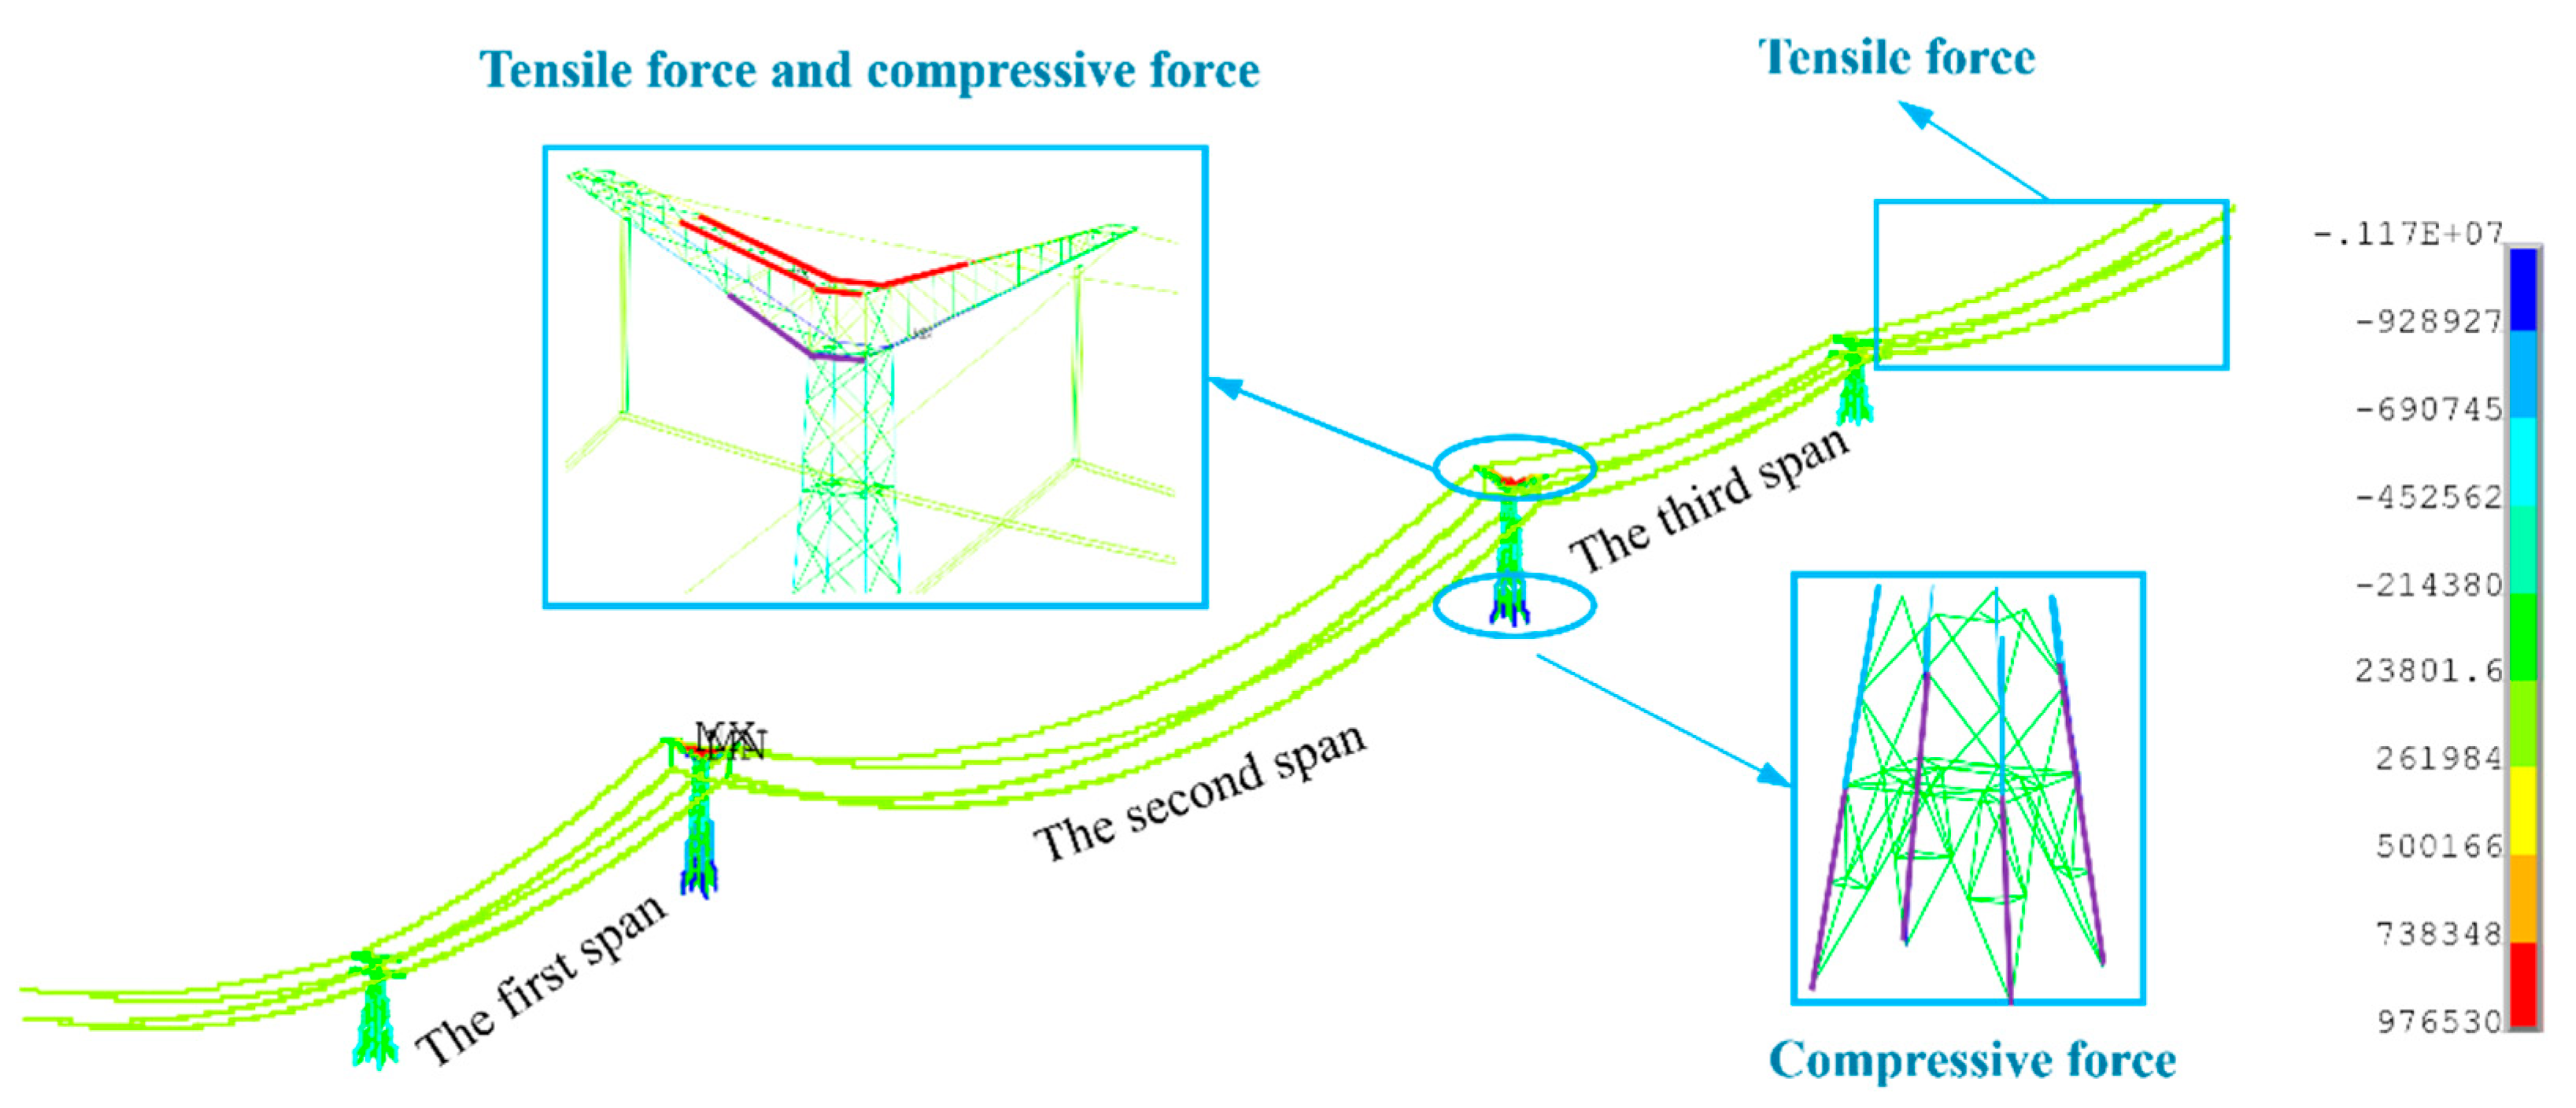
In this paper, the transmission line is subjected to shape-finding and modeling under its own weight. Therefore, the axial force cloud diagram of the tower-line system under self-weight is extracted, as shown in Figure 5. The tower body needs to bear its own weight, the vertical load of the conductors, etc. The axial force compresses the components, so the axial force of the tower body is a compressive force; The tension of the conductors on both sides of the cross arm causes both ends of the cross arm to be subjected to tension, while the middle supporting section is compressed due to load balance, with different members of the truss system being subjected either to tension or compression. Due to its own gravity and tension, the transmission line is always in a state of tension, and its axial force is tensile. Taking one of the conductors and ground wires in the 2nd span as an example, the axial forces of the elements at the endpoints and the middle part are extracted, and a comparison is made with the standard tension of the transmission line specified in the design requirements, as shown in Table 2. The error is within 2%, so the transmission line simulation is relatively consistent.

3. Wind Load Simulation

For the wind-field simulation of the Yan’an Yellow River project in China described in Section 2.1, the wind speed at a given height and time is represented as the sum of the mean wind speed and the fluctuating wind speed [32]:
v z , t = v ¯ z + v f z , t
where v ¯ z is the mean wind speed at height z , and v f z , t is the fluctuating wind speed.

3.1. Mean Wind Simulation

The variation law between the mean wind speed and height is called the wind profile, which can be simulated by the exponential law
v ¯ v ¯ 10 = h h 10 α
where h and v ¯ are the height and the mean wind speed at that height; h 10 and v ¯ 10 are the standard height and the reference mean wind speed at that height, and α is the ground roughness coefficient, which is 0.16 for terrain category B.

3.2. Fluctuating Wind Simulation

The fluctuating characteristics are of great significance in wind-load calculation and are closely related to the spatial coherence function [33]. Therefore, this paper examines the applicability of different coherence functions to long-span transmission lines.

3.2.1. Different Coherence Functions

(1) Davenport coherence function
The expression of the Davenport coherence function [33] is shown in Equation (4):
c o h r = exp ω 2 π C x 2 x 1 x 2 2 + C y 2 y 1 y 2 2 + C z 2 z 1 z 2 2 1 2 1 2 v z 1 + v z 2
where ω is the circular frequency, x 1 , x 2 , y 1 , y 2 and z 1 , z 2 are the lateral coordinates, longitudinal coordinates, and vertical coordinates of two points in space, v z 1 and v z 2 are the mean wind speeds at height z 1 and height z 2 , C x , C y and C z are the attenuation coefficients in the lateral, longitudinal, and vertical directions, respectively.
Following Zhang et al. [33], Cx = 16, Cy = 8, and Cz = 10 were adopted for the Davenport model, while Lx = 50, Ly = 50, and Lz = 60 were used for the Shiotani model. The former coefficients control the decay of coherence with frequency and spatial separation, whereas the latter represent characteristic correlation lengths. The formulations refer to Davenport [34], Shiotani and Arai [35], and GB 50009-2012 [36]. For the category-B canyon site, the terrain characteristics were represented by the mean wind-speed profile and surface roughness parameters, while the coherence parameters were kept fixed for comparison.
(2) Shiotani coherence function
The expression of the Shiotani coherence function [33] is as follows:
c o h r = exp x 1 x 2 2 L 2 x + y 1 y 2 2 L 2 y + z 1 z 2 2 L 2 z
The coherence function obtained by Shiotani is independent of the frequency of the fluctuating wind, in which both L x and L y are set to 50, and L z is set to 60 in its expression.

3.2.2. Wind Spectrum

Conduct research based on the Davenport wind spectrum; the Davenport wind spectrum [37] is shown in Equation (6):
S v f = 4 k v ¯ 10 2 x 2 f 1 + x 2 4 / 3
where S v f is the wind spectrum, x = 1200 f v ¯ 10 , f is the frequency, k is the Von Karman constant, usually taken as 0.4.

3.2.3. Simulation of Fluctuating Wind Speed Time History

Using the linear filtering method, based on an autoregressive (AR) model [38], in the present study, a MATLAB R2020a program has been formulated to simulate the tower at different heights fluctuating wind load time history.
When simulating wind speed time histories using the AR method while considering the influence of fluctuating wind coherence, assume that V X , Y , Z , t represents the random column vector of correlated fluctuating wind time histories at M spatial points. The AR model can be expressed as Equation (7). The parameters for AR-based simulation of fluctuating winds are detailed in Table 3.
V X , Y , Z , t = k = 1 p φ k · V X , Y , Z , t k Δ t + N t
where p denotes the order of the AR model, Δ t represents the time step, φ k is the autoregressive coefficient matrix, which is a square matrix of order M × M , N t is a random vector of independent processes.
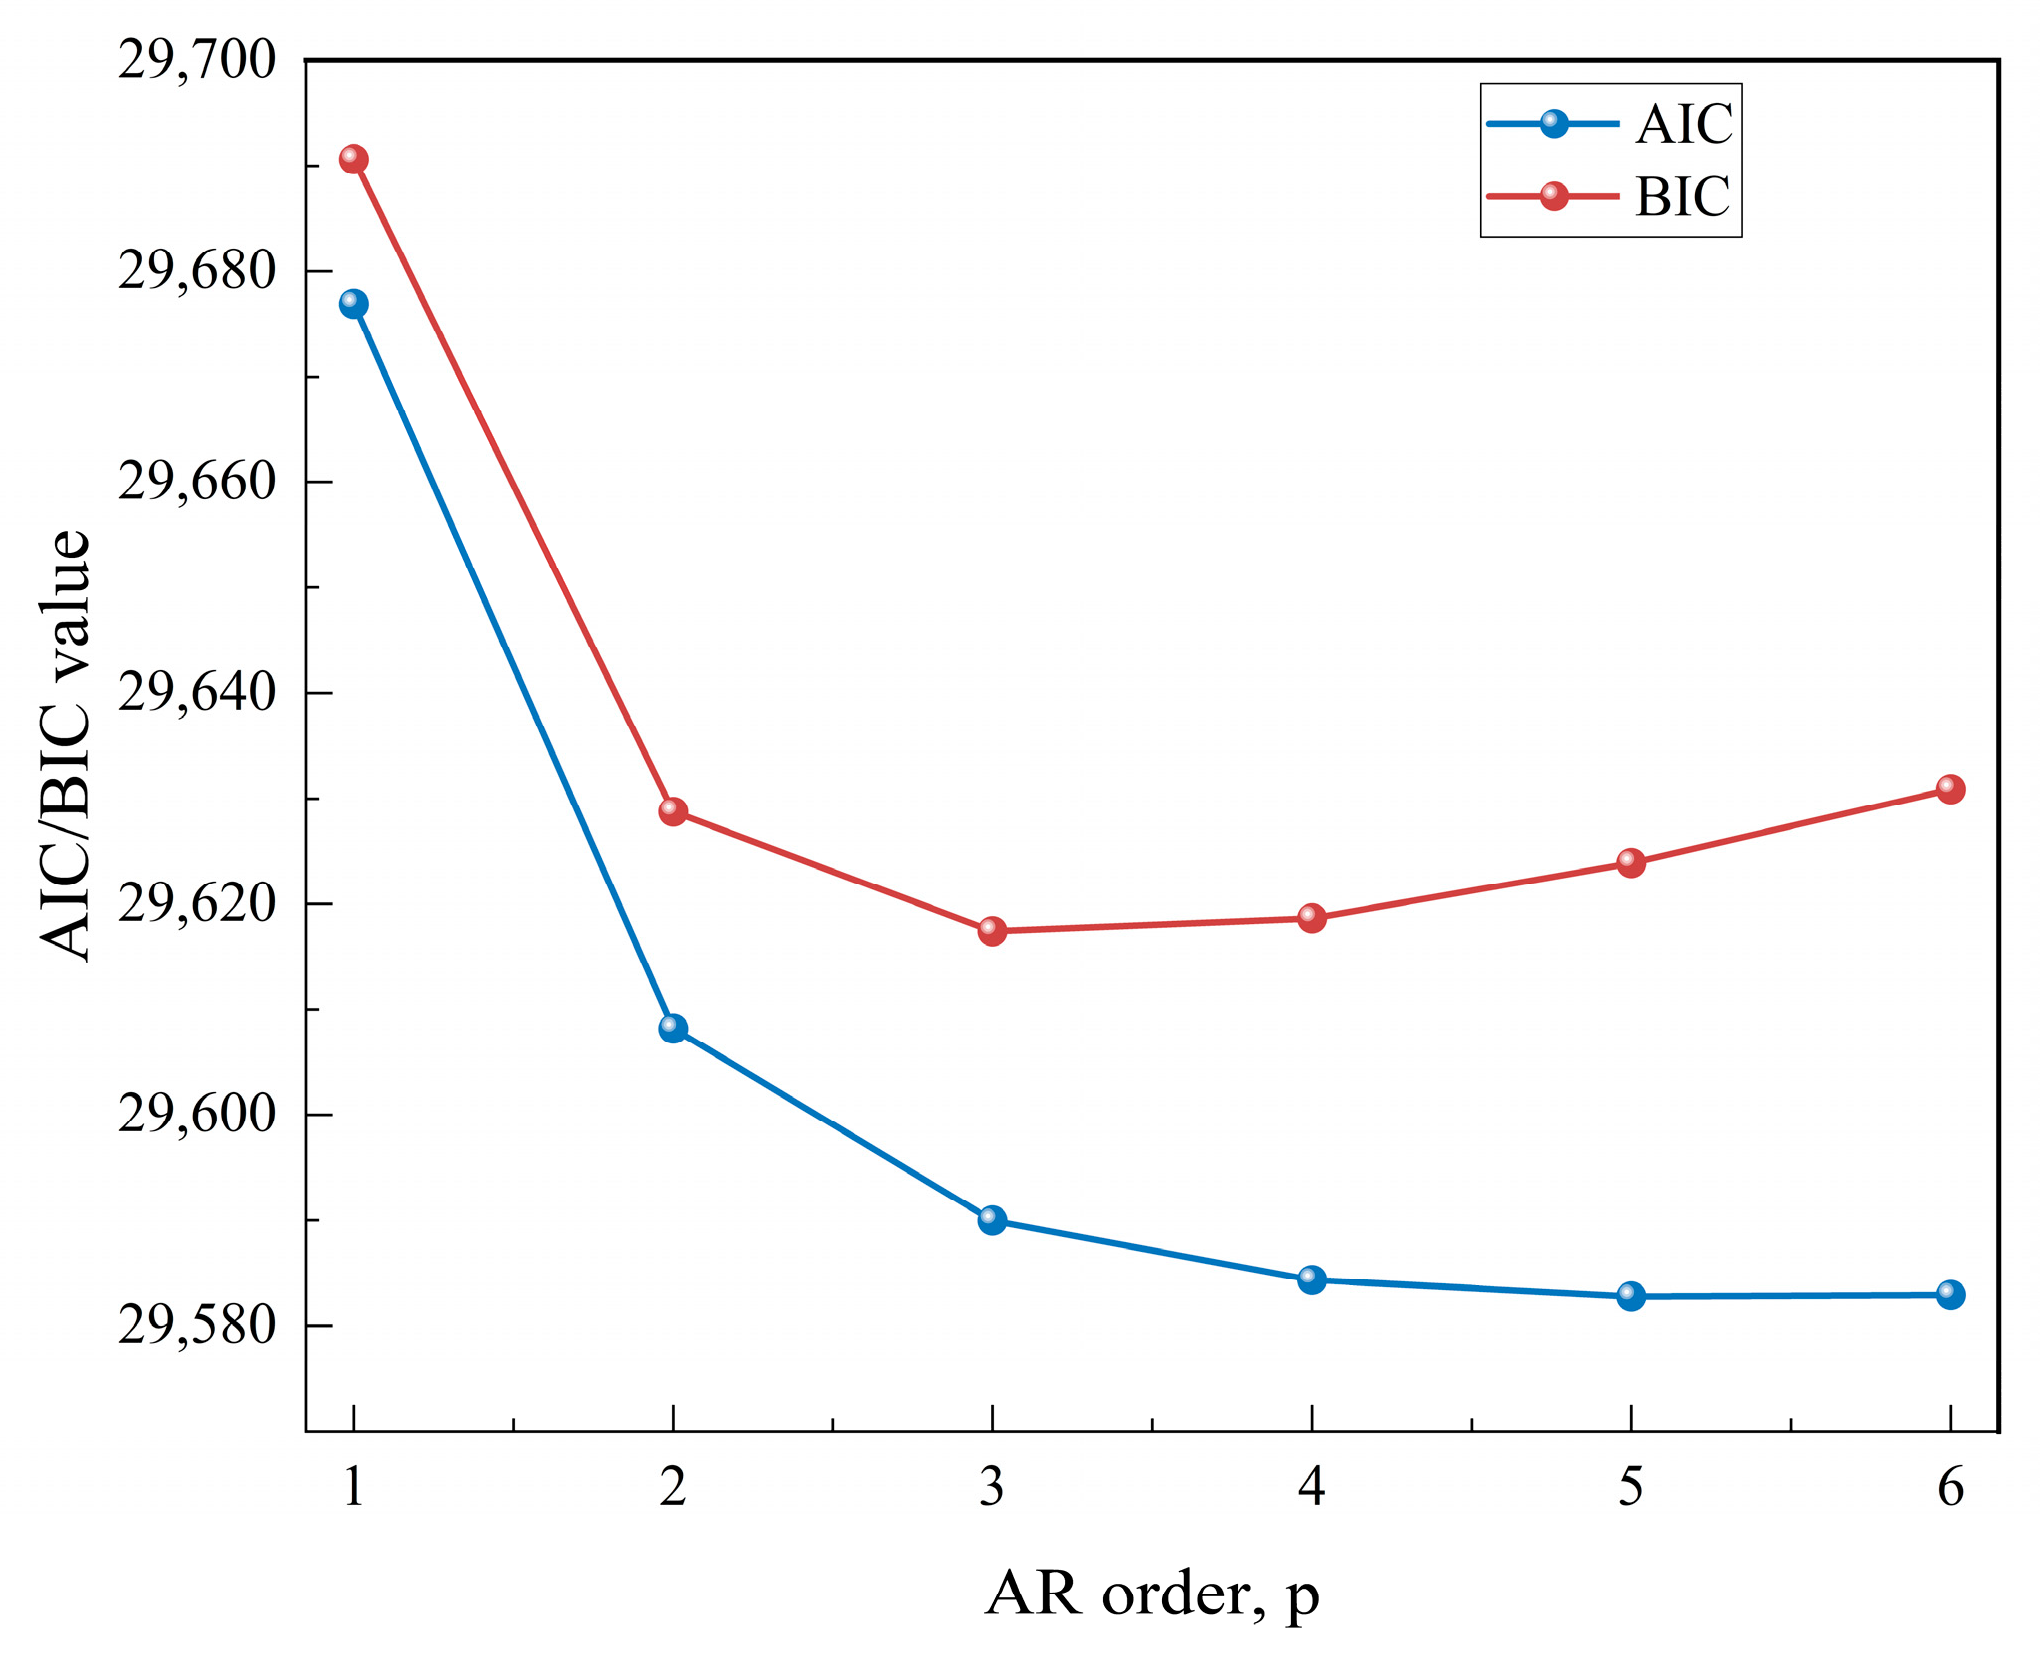
The AR model order was determined using the AIC and BIC criteria [39,40,41]. As shown in Figure 6, the minimum AIC and BIC values occurred at ρ = 5 and ρ = 3, respectively. For AR(4), ΔAIC = 1.57, and ΔBIC = 1.22, both within the range of 0–2. In contrast, AR(3) had ΔAIC = 7.21, whereas AR(5) had. ΔBIC = 6.5. Therefore, AR(4) was selected as a balanced choice between model fitting and complexity.
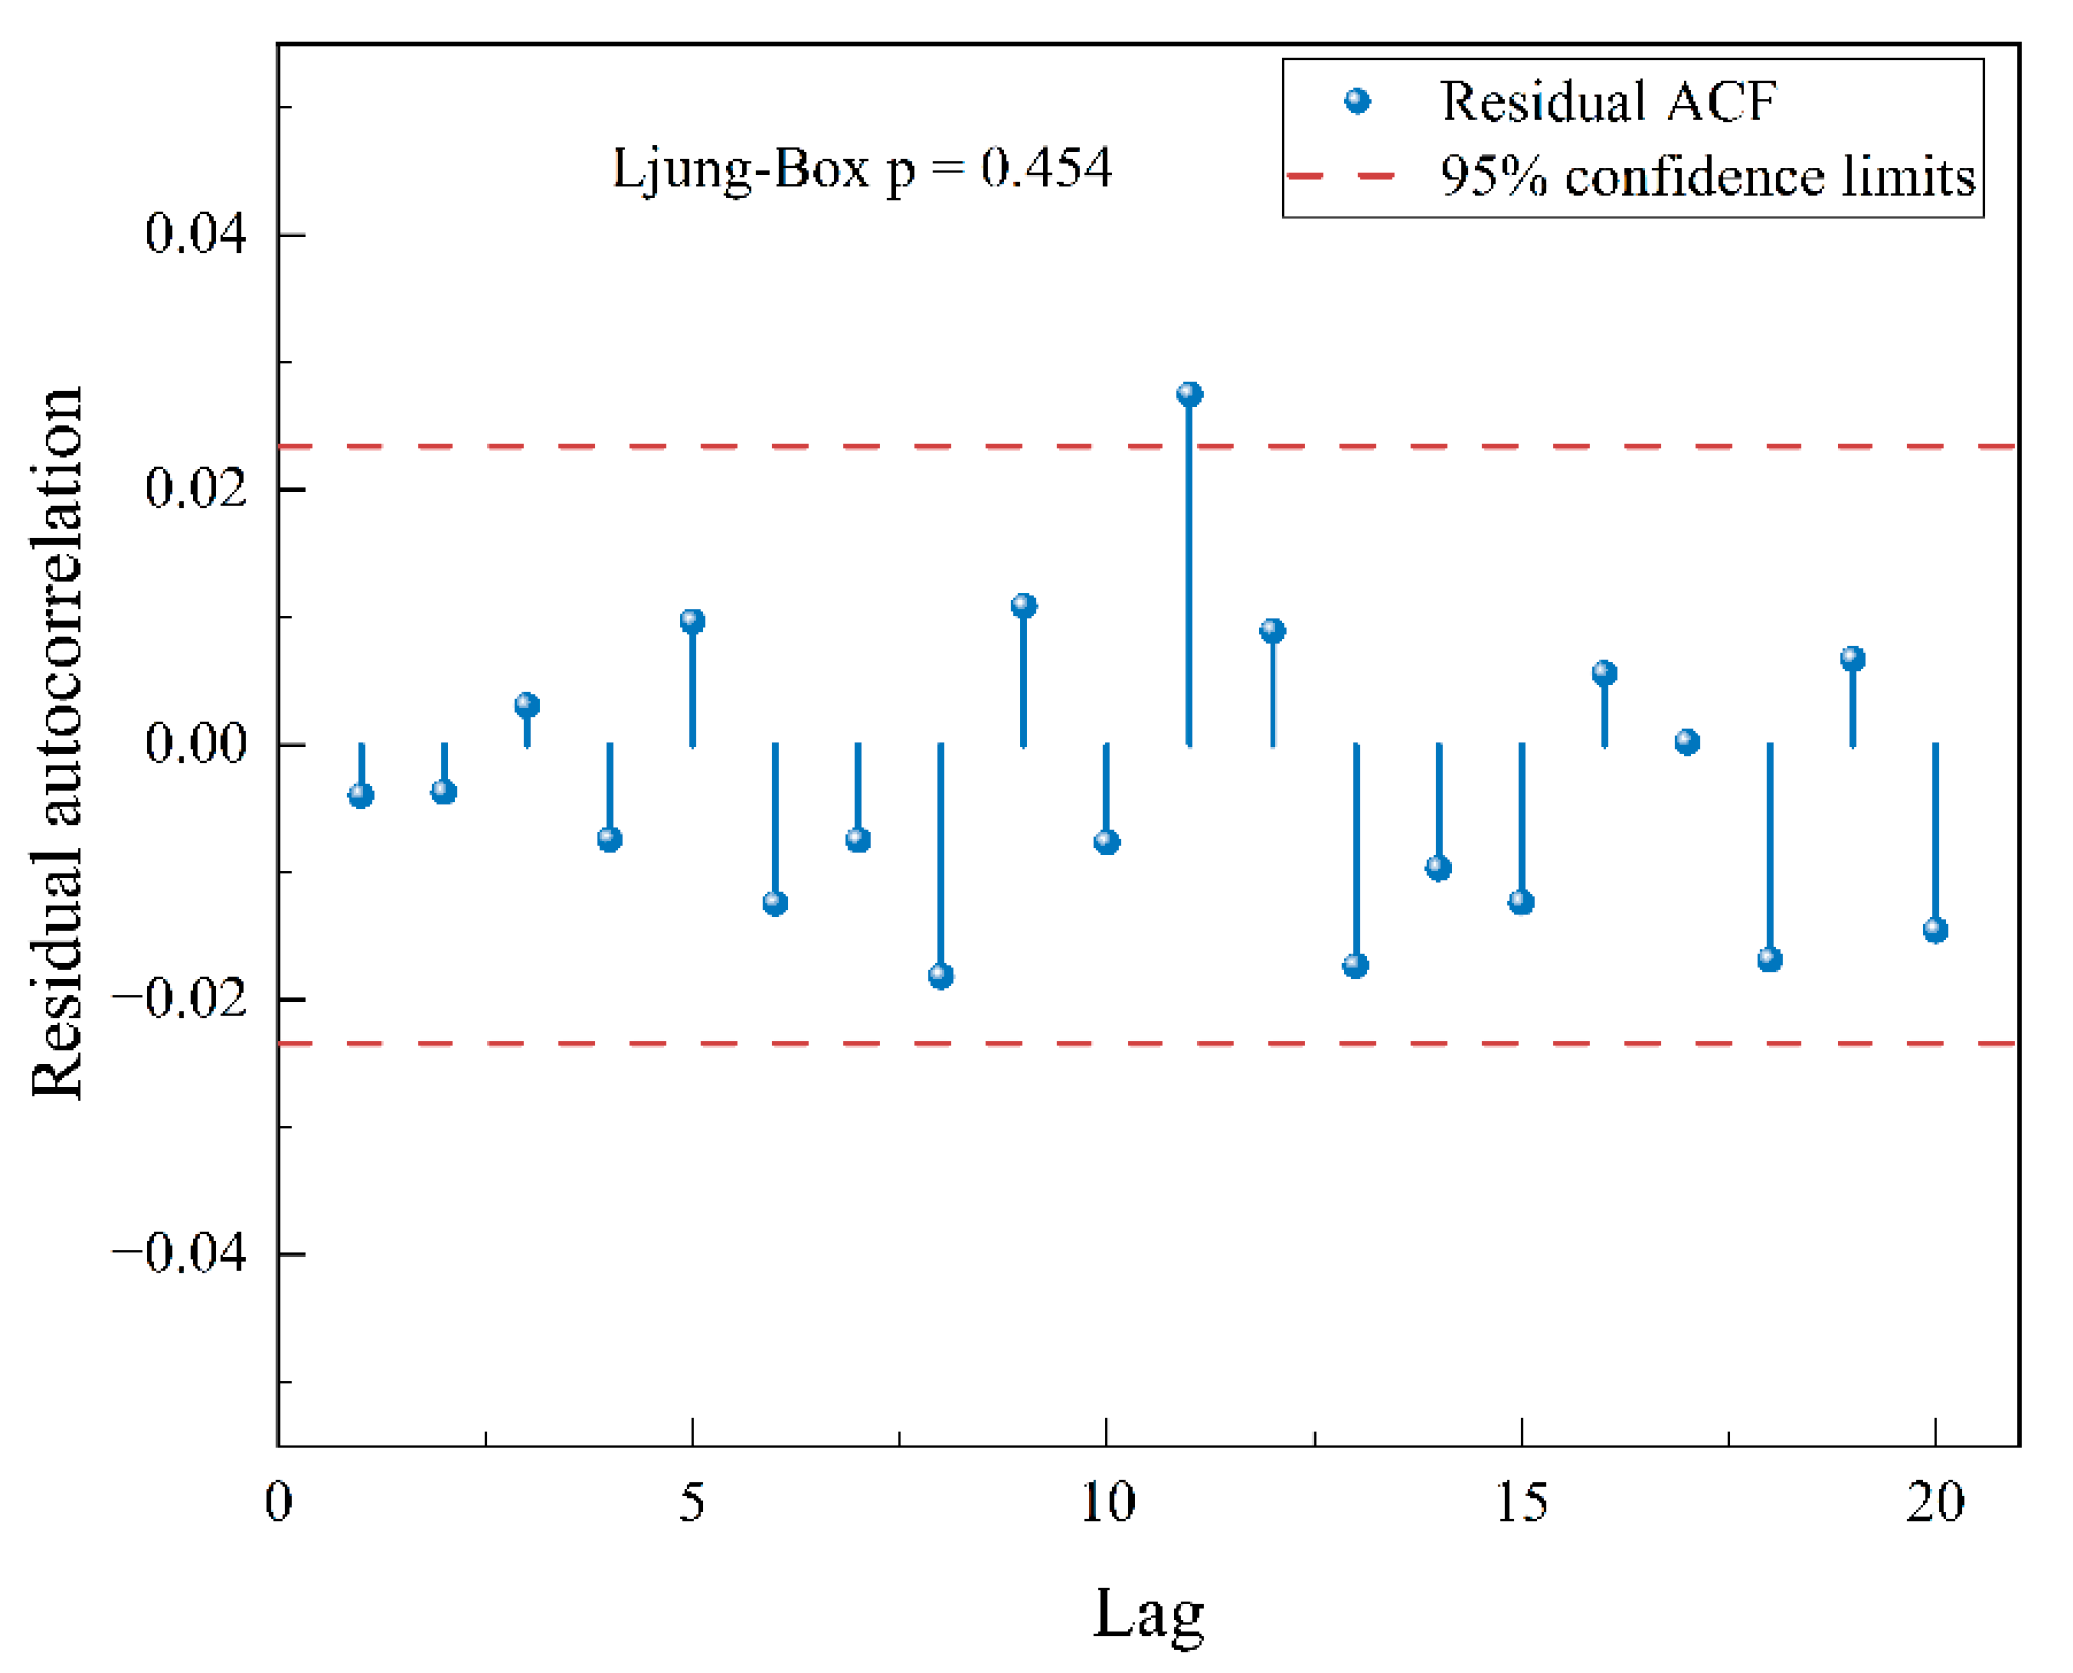
As shown in Figure 7, 19 of the first 20 residual autocorrelation coefficients lie within the 95% confidence limits, and the Ljung–Box test gives p = 0.454 > 0.05. These results indicate that the AR(4) model adequately represents the temporal correlation of the fluctuating wind process [42].
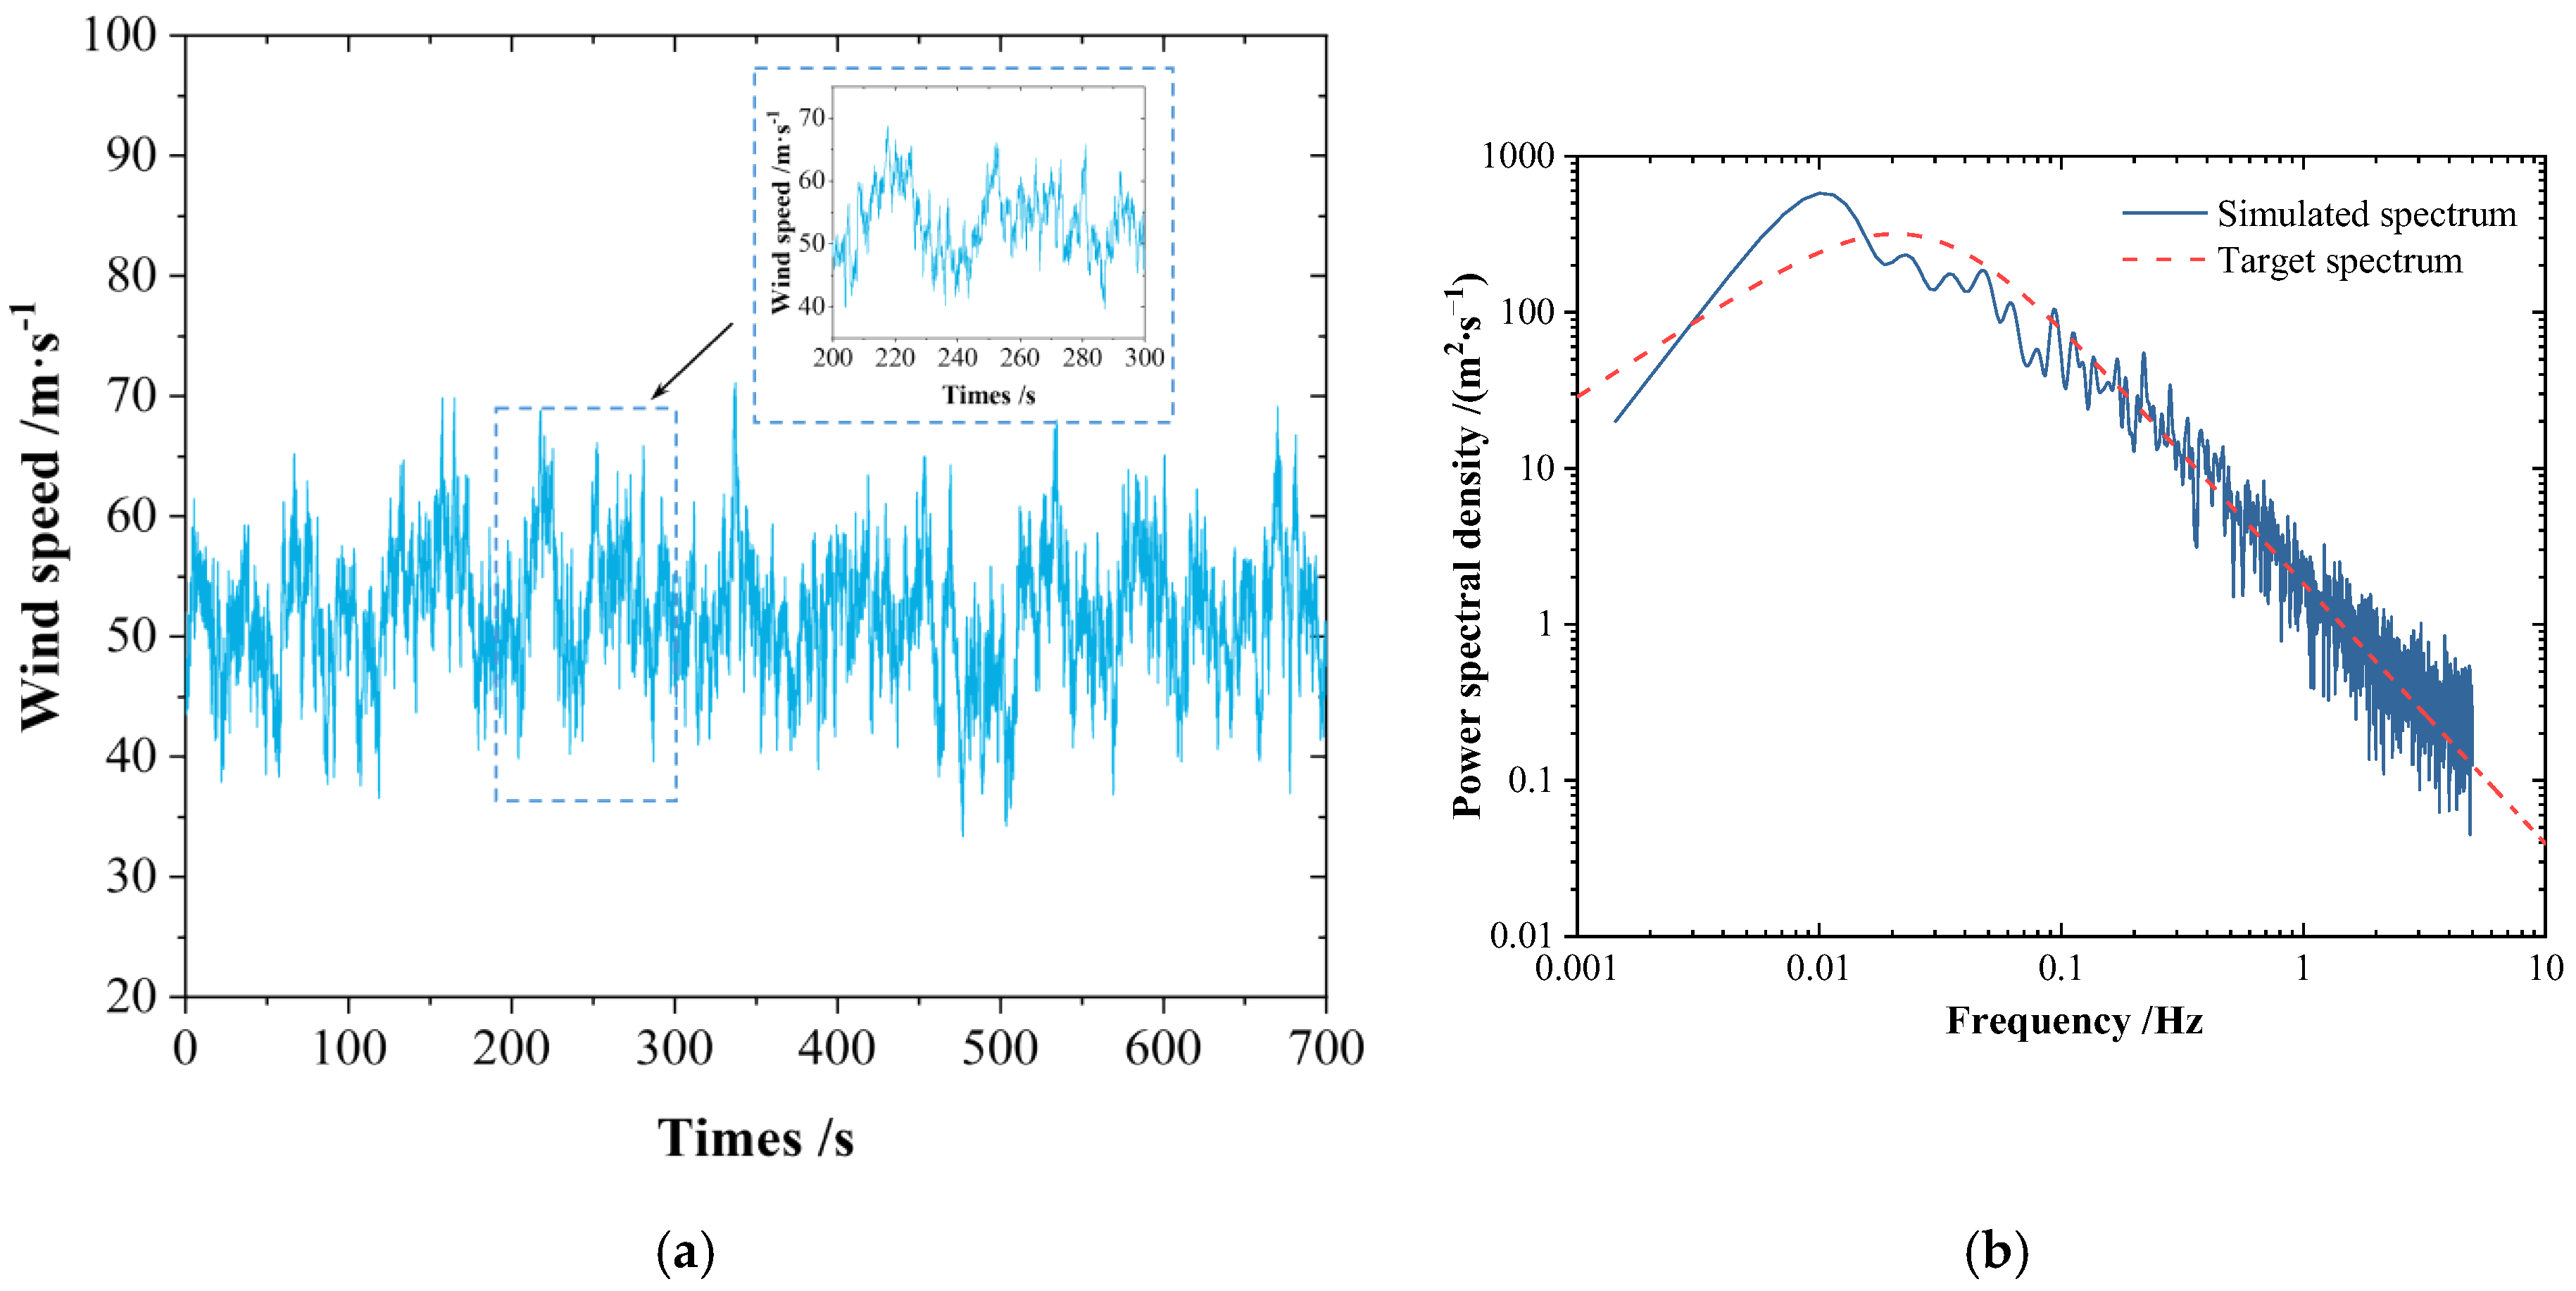
The wind speed time-history curve of the tower-top node simulated based on the Davenport spectrum with the Davenport coherence function is shown in Figure 8a. The verification and check of the power spectral density (PSD) curve of the simulated wind force are shown in Figure 8b. The simulated power spectrum is basically consistent with the target power spectrum, indicating that the wind-speed simulation method is reliable and can support subsequent research.

3.3. Wind Load Calculation

The wind loads acting on the transmission tower, conductors, and ground wires are calculated in accordance with DL/T 5551—2018 [43]. The wind load acting on the transmission tower is calculated as follows:
W s = W 0 · μ z · μ s · B 2 · A s · β z
The wind pressure exerted on the transmission cables and grounding cables can be calculated by Equation (9).
W s = W 0 · μ z · μ s c · B 1 · d · L
where W 0 is the basic wind pressure, μ z is the wind pressure height variation coefficient, μ s is the shape coefficient, B 1 and B 2 are the ice-covered wind load amplification coefficients, β z is the wind load adjustment coefficient, A s is the windward area of the structure, μ s c is the shape coefficient of the conductor, d is the diameter of the conductor and ground wire; and L is the length of the segmented conductor and ground wire.
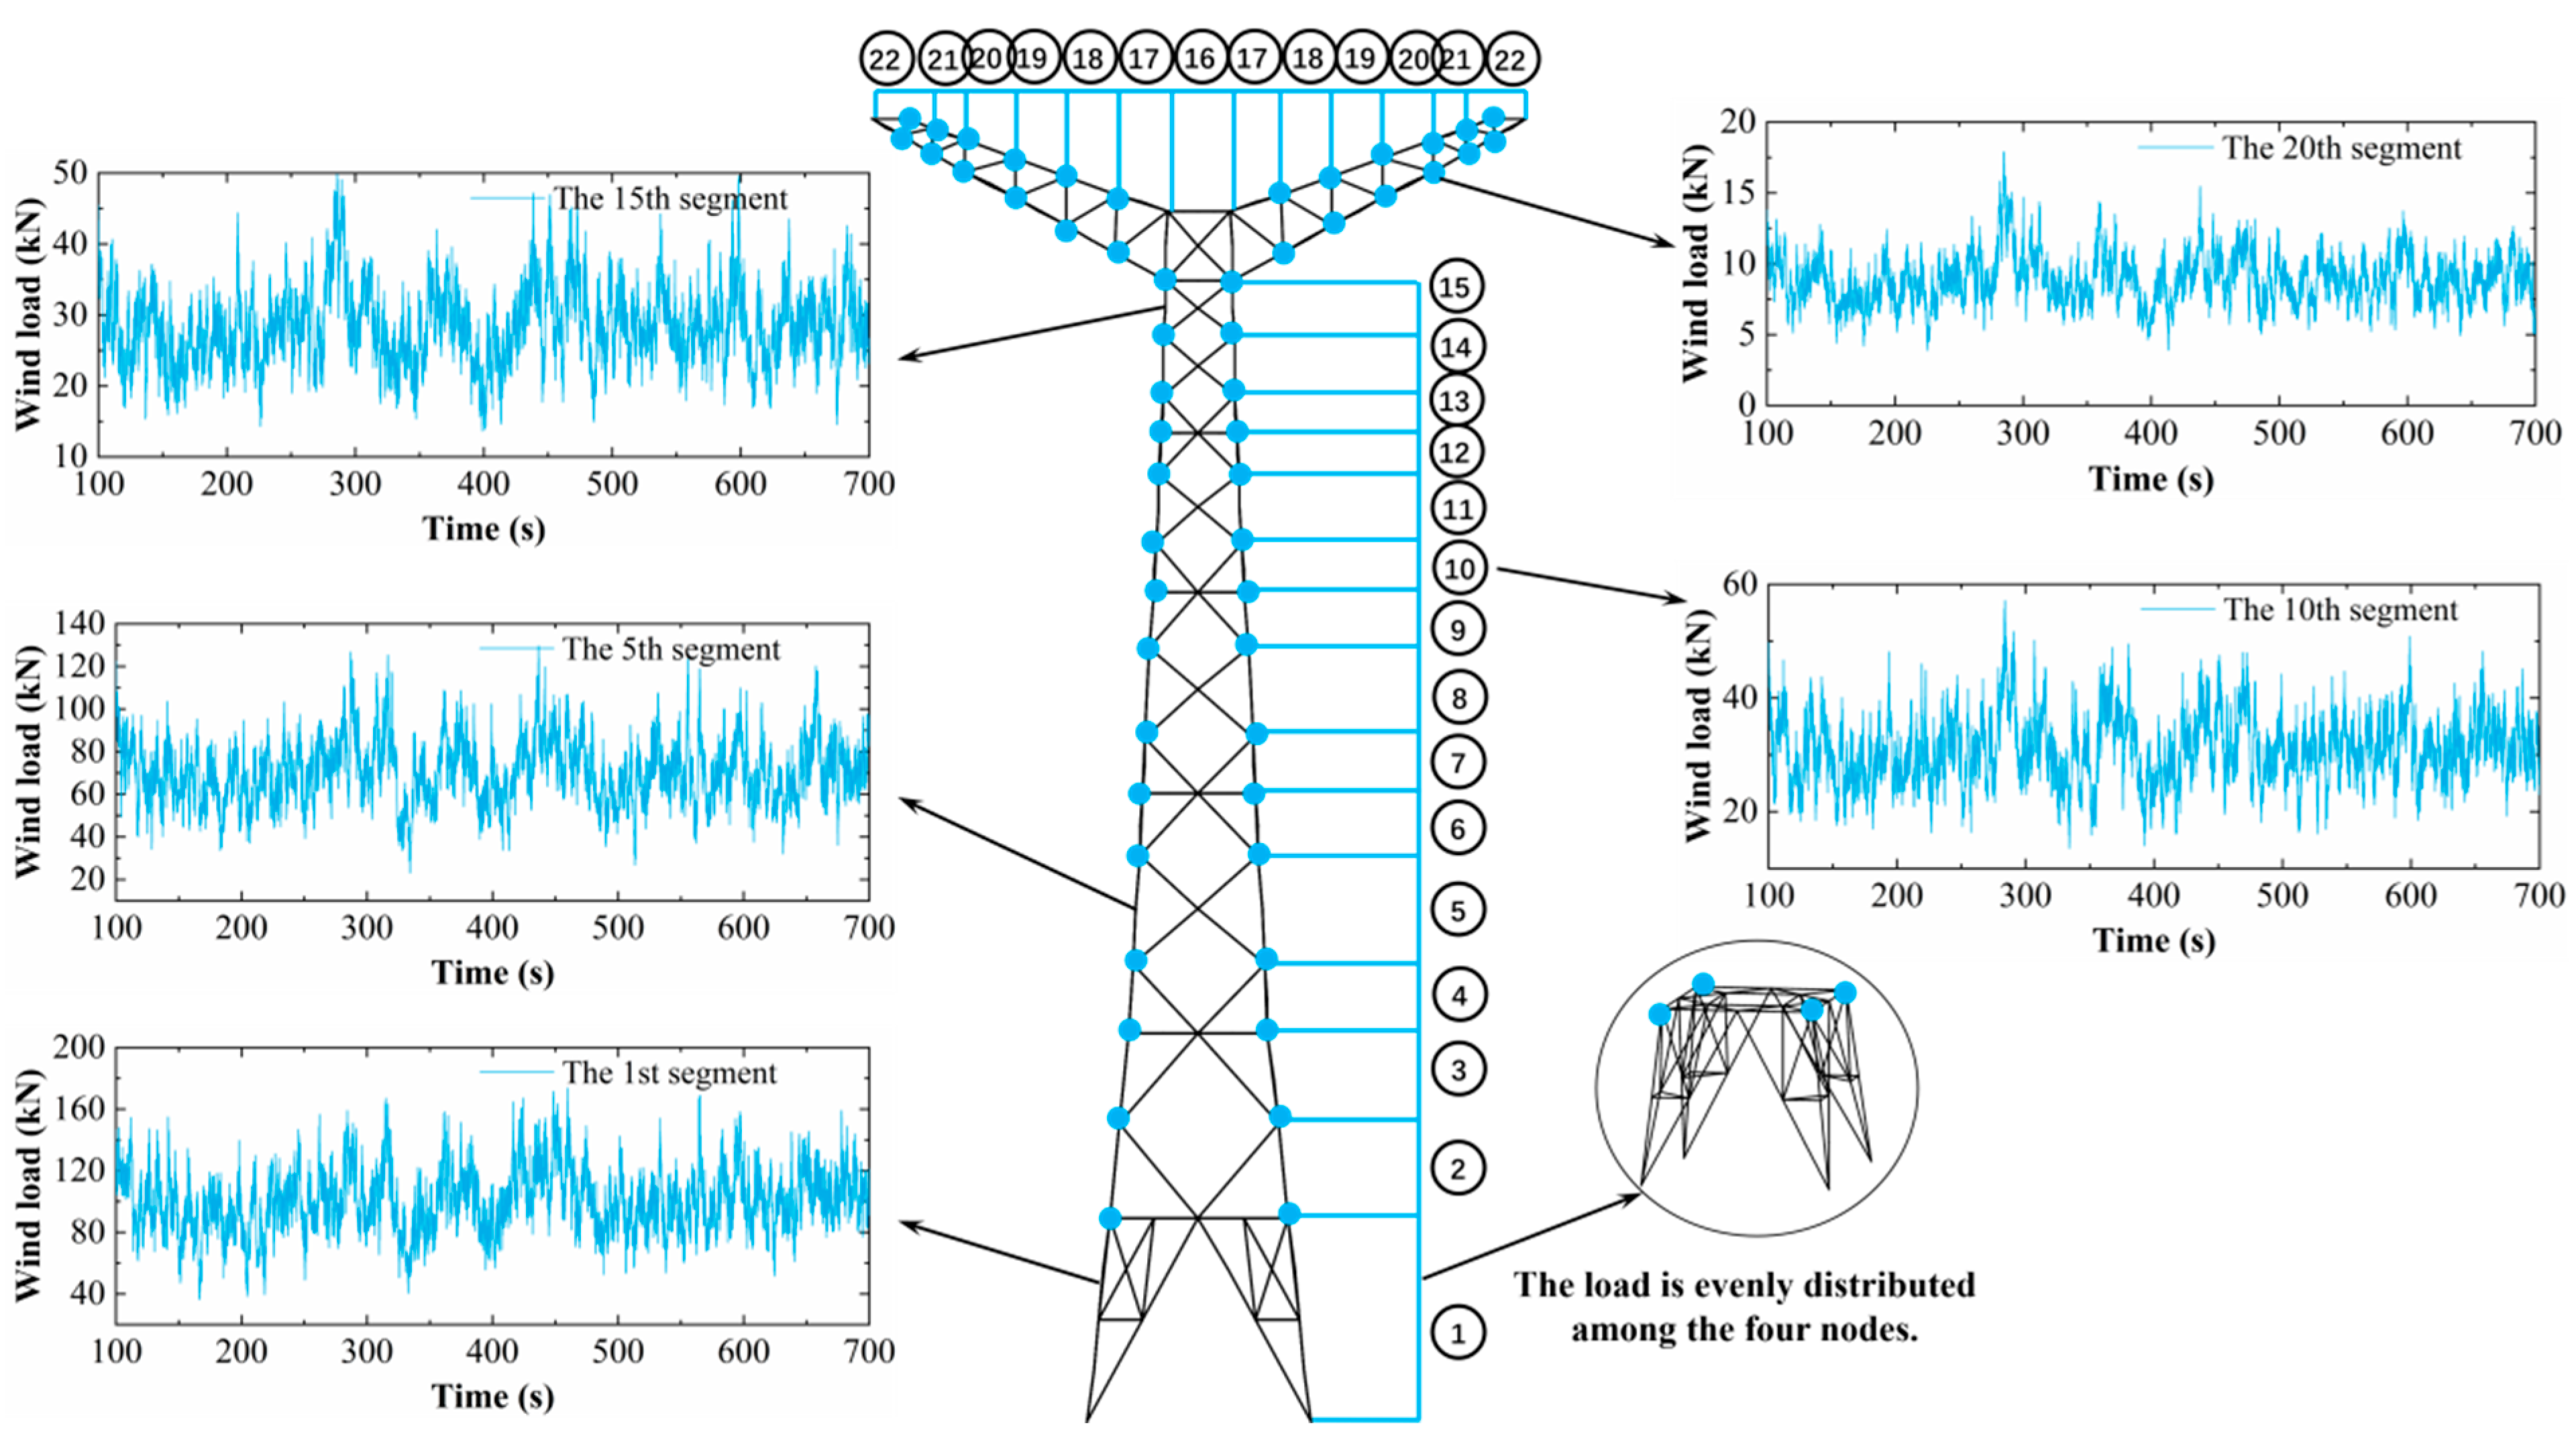
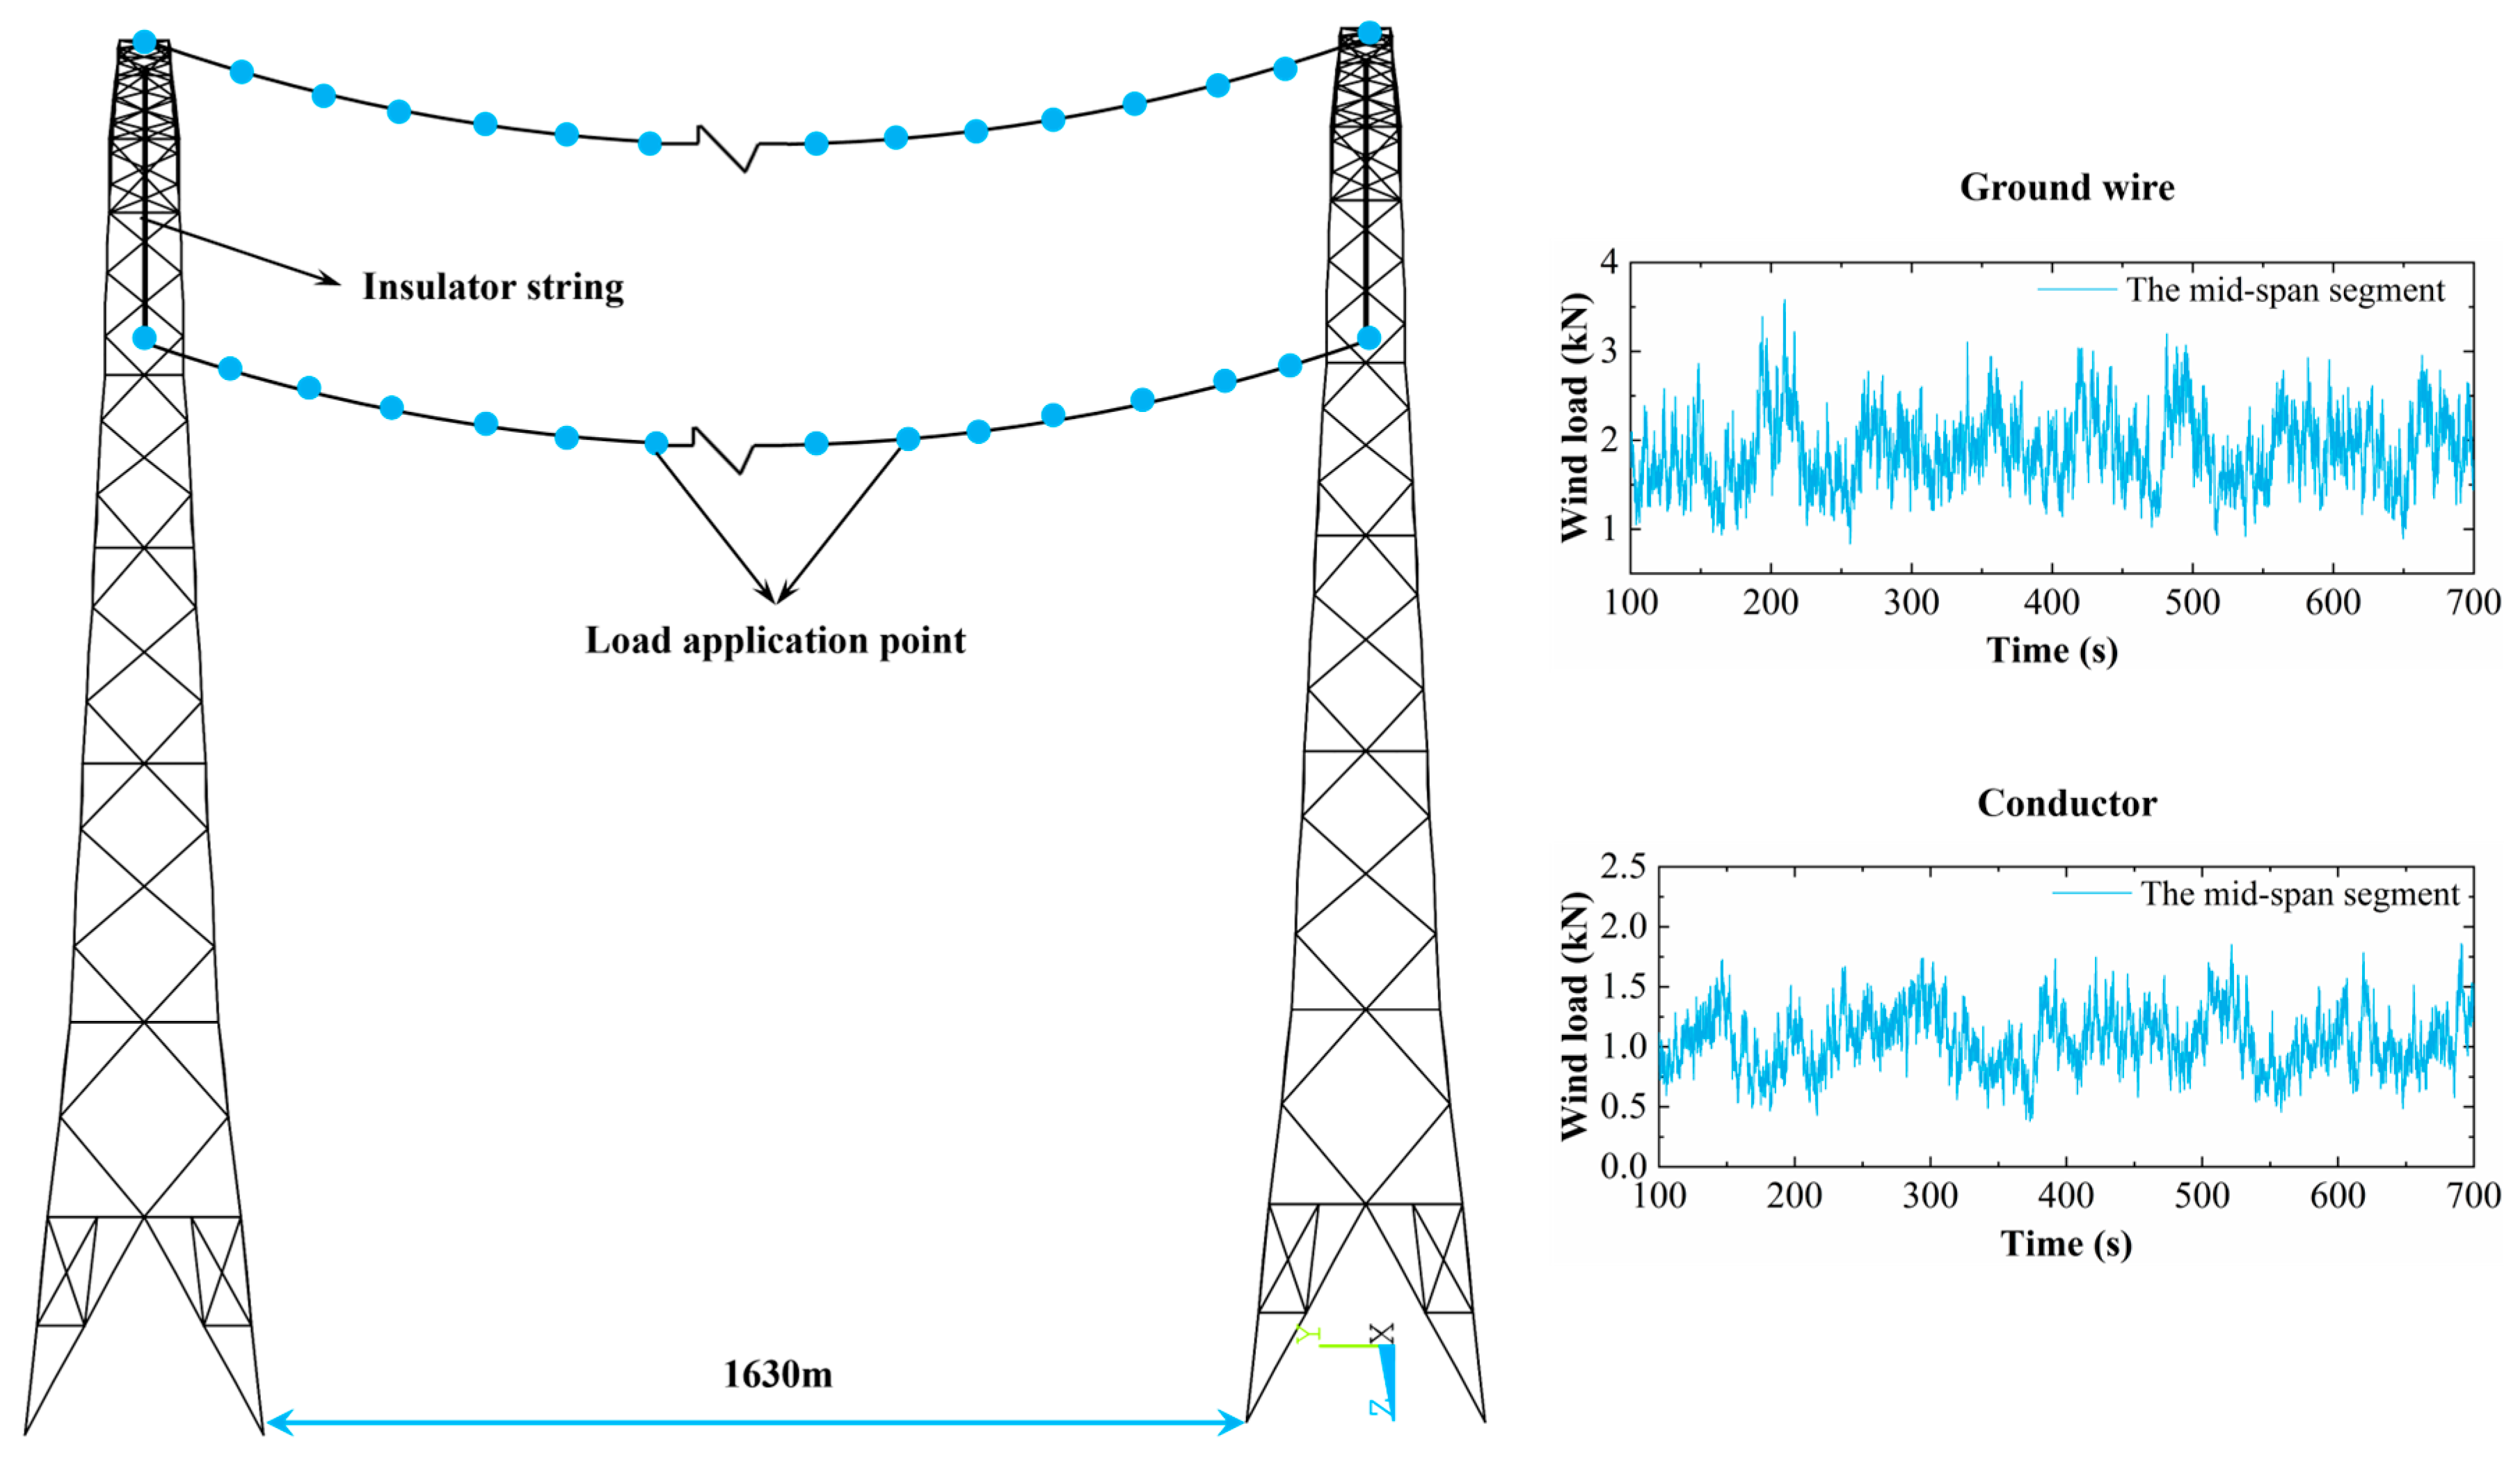
The transmission tower is simplified into a segmented loading model along its height, and the transmission lines are simplified into a segmented loading model along the direction of the conductors. The tower body and cross arm of the single tower are divided into a total of 28 wind pressure segments, with four loading points selected for each wind pressure segment. The division of wind pressure segments of the single tower and some wind load time-history diagrams under 90° wind directions are shown in Figure 9. A loading point is set every 30 m along the transmission line. The division of wind pressure segments for conductors and ground wires, as well as the wind load time-history diagrams of mid-span nodes under 90° wind direction, are shown in Figure 10. In accordance with the calculation principles of the overall space truss method [44], the simulated wind load values calculated for each wind pressure segment are evenly distributed to each selected loading point in that segment.

4. Analysis of Wind-Induced Vibration Response and Wind Vibration Coefficient of Transmission Tower

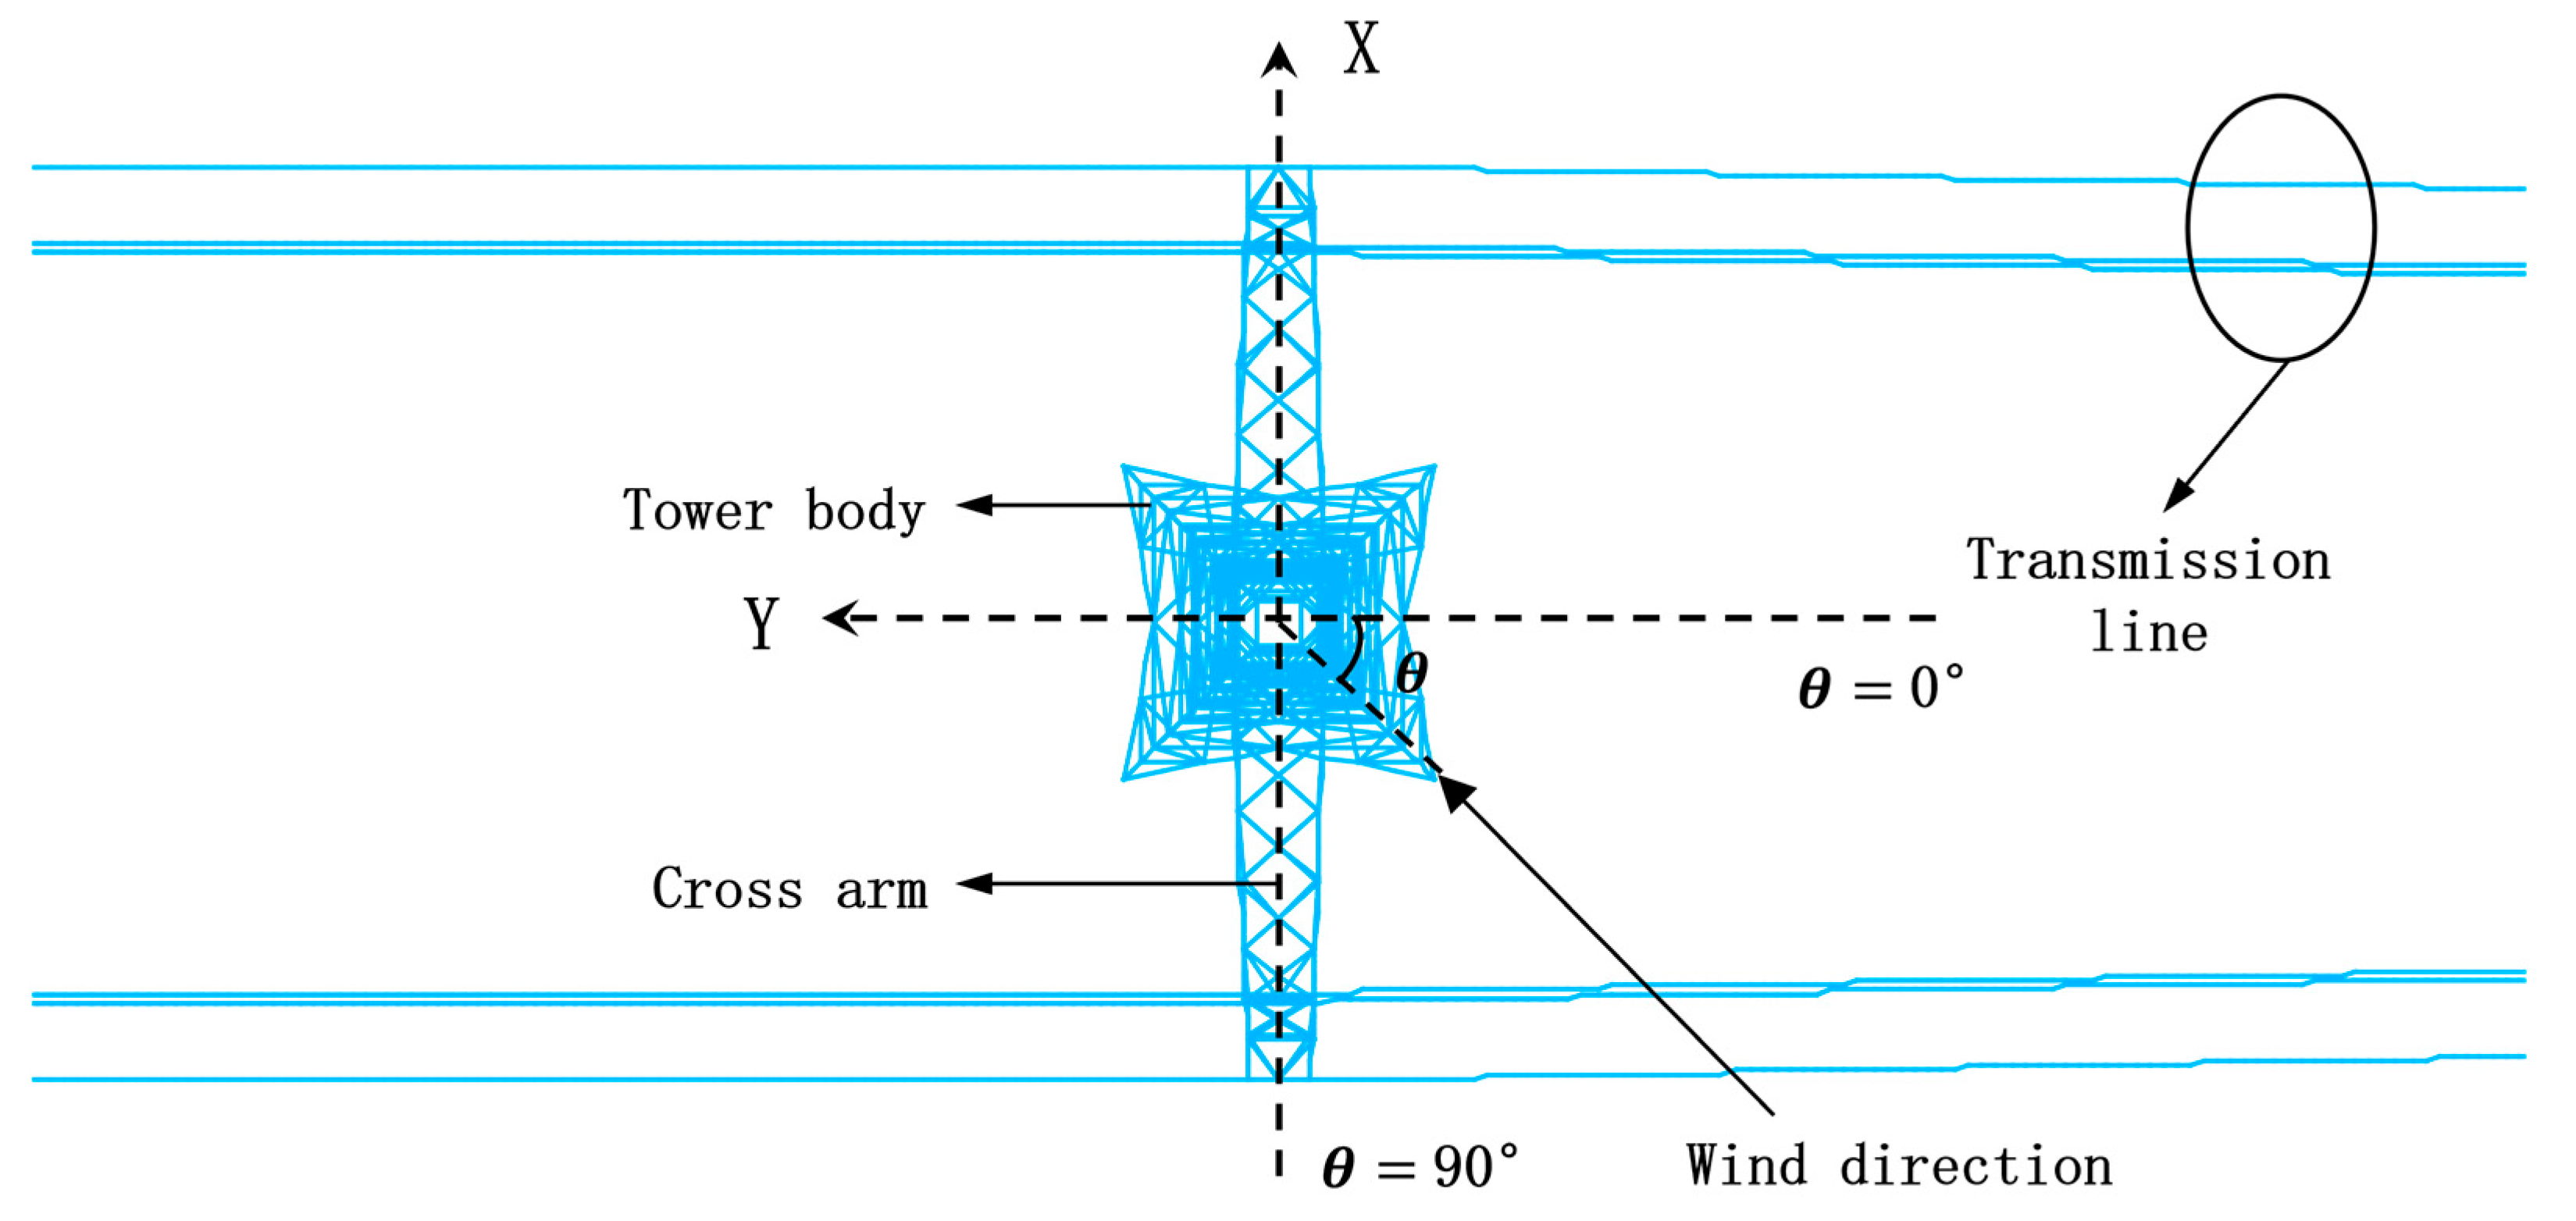
This paper analyzes the wind-induced vibration responses and wind vibration coefficients of the single tower and the tower-line system under four wind direction angles (0°, 45°, 60° and 90°), respectively, as shown in Figure 11.
The wind vibration coefficient β z can be expressed as the ratio of the combined static and dynamic wind loads to the static wind load alone. Its mathematical expression is as follows:
β z = p z p ¯ z = p ¯ z + p d z p ¯ z = 1 + p d z p z
where p z is the static-dynamic wind load, p ¯ z is the static wind load, p d z is the dynamic wind load.
Based on the random vibration theory [45], the wind vibration coefficient β z i at height z of the steel tower (where i represents the segment of the tower, i = 1, 2, n) is calculated by the following formula:
β z i = 1 + M i ω 1 2 y 1 i μ si μ z i w o A i = 1 + g M i ω 1 2 σ 1 i μ si μ z i w o A i
where M i is the mass of the tower segment, ω 1 is the first-order vibration circular frequency of the structure, σ 1 i is the displacement mean square deviation of point i at height z of the tower; other parameters are the same as before.

4.1. Comparison of Different Coherence Functions

Based on the Davenport spectrum, after the wind loads generated by the two coherence functions (Davenport and Shiotani) are applied to the transmission tower, the displacement mean value and mean square deviation responses are extracted and compared, respectively. Moreover, the random vibration theory is adopted to calculate the wind vibration coefficients, followed by a comparative analysis.

4.1.1. Comparison of Displacement Responses of a Single Tower

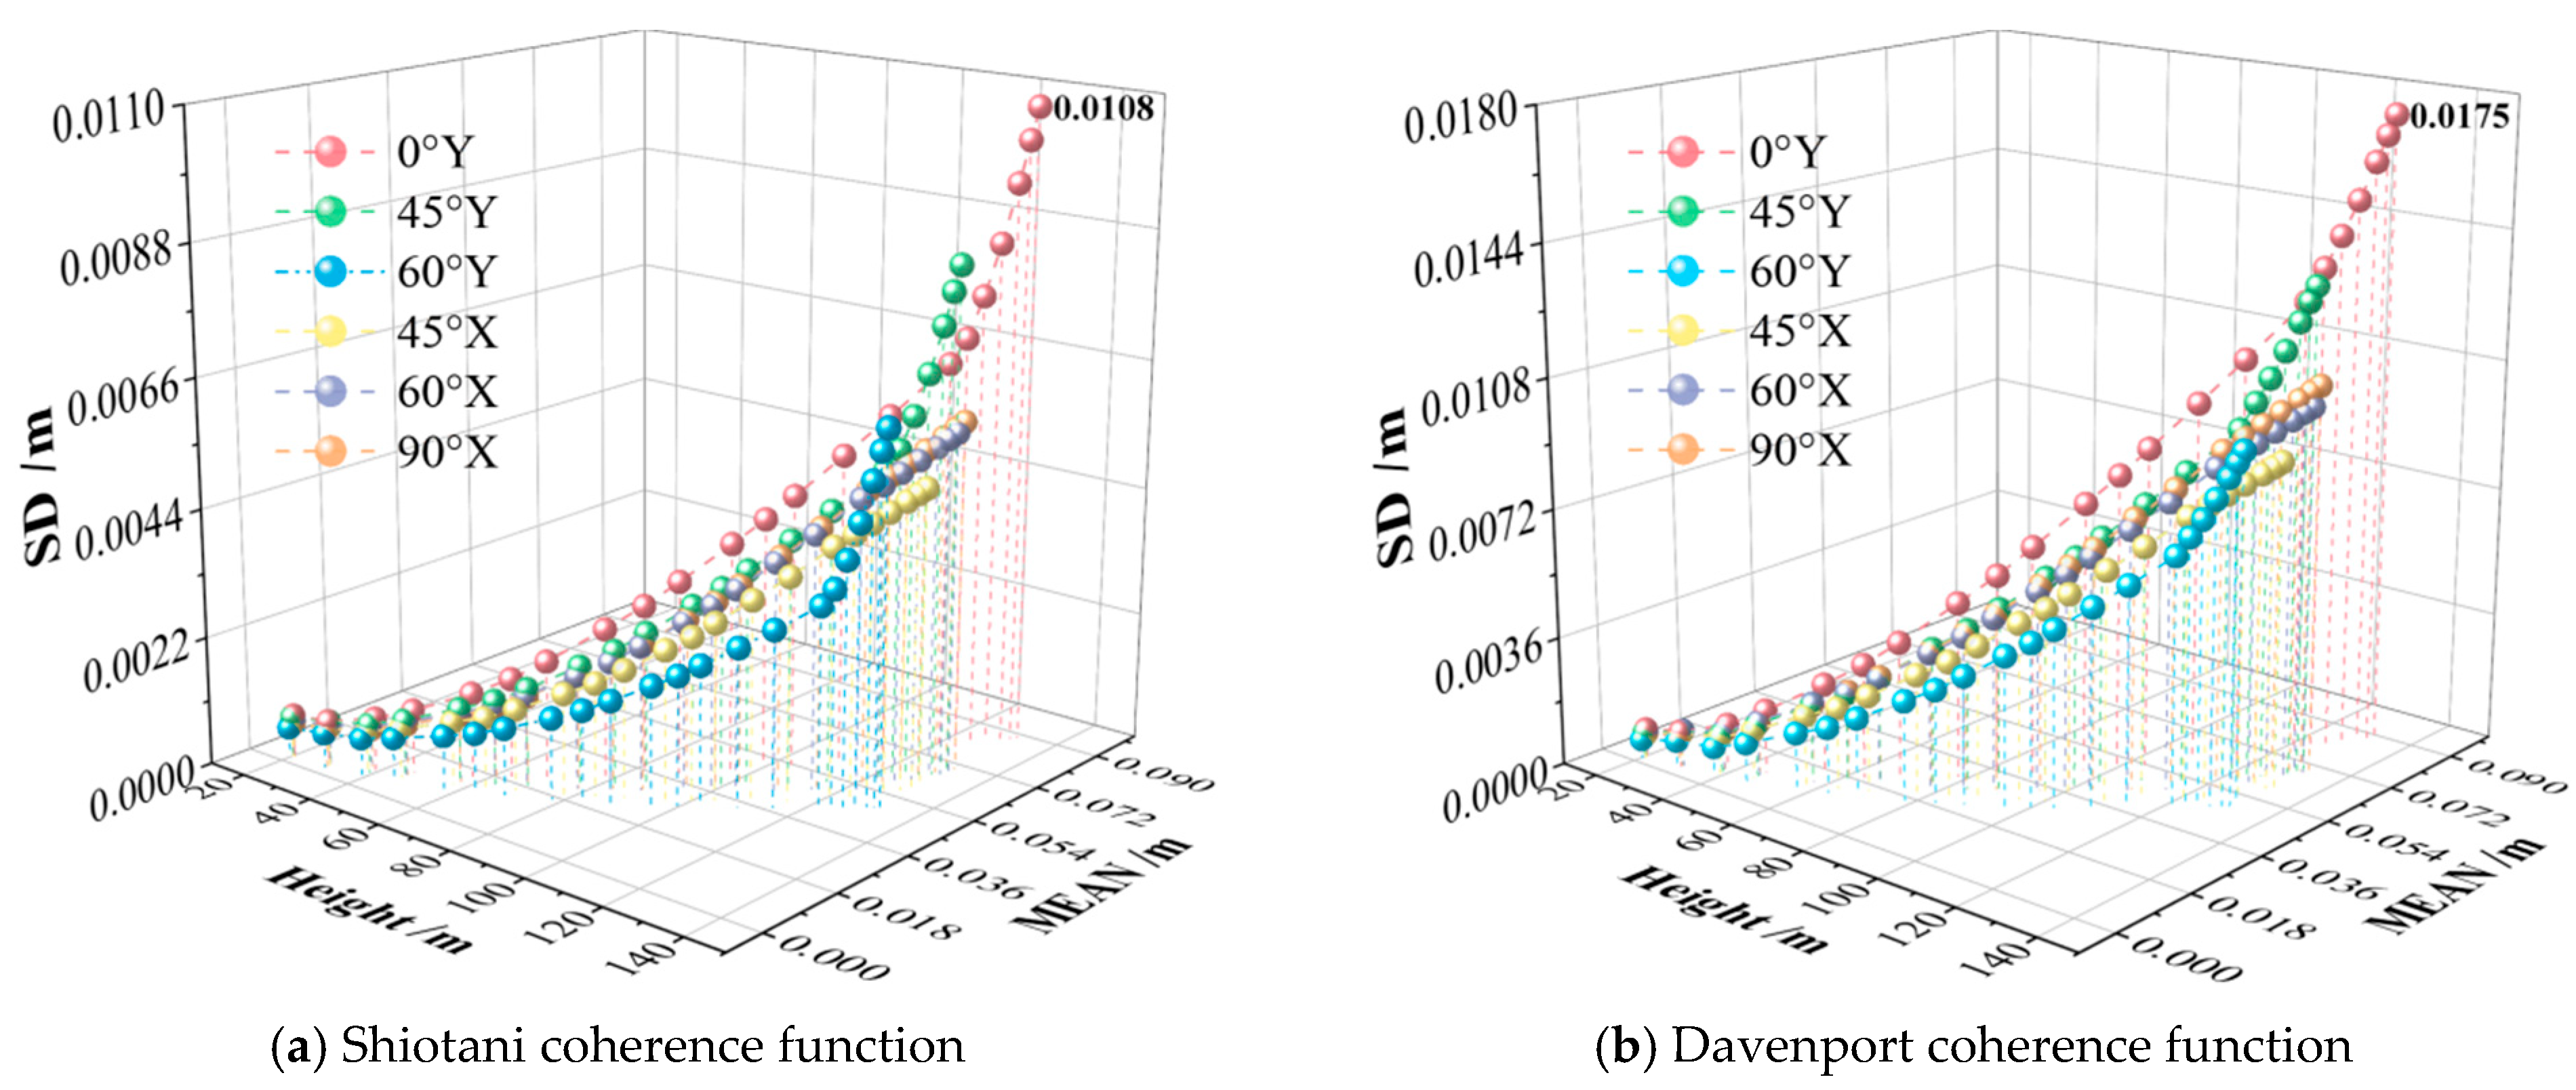
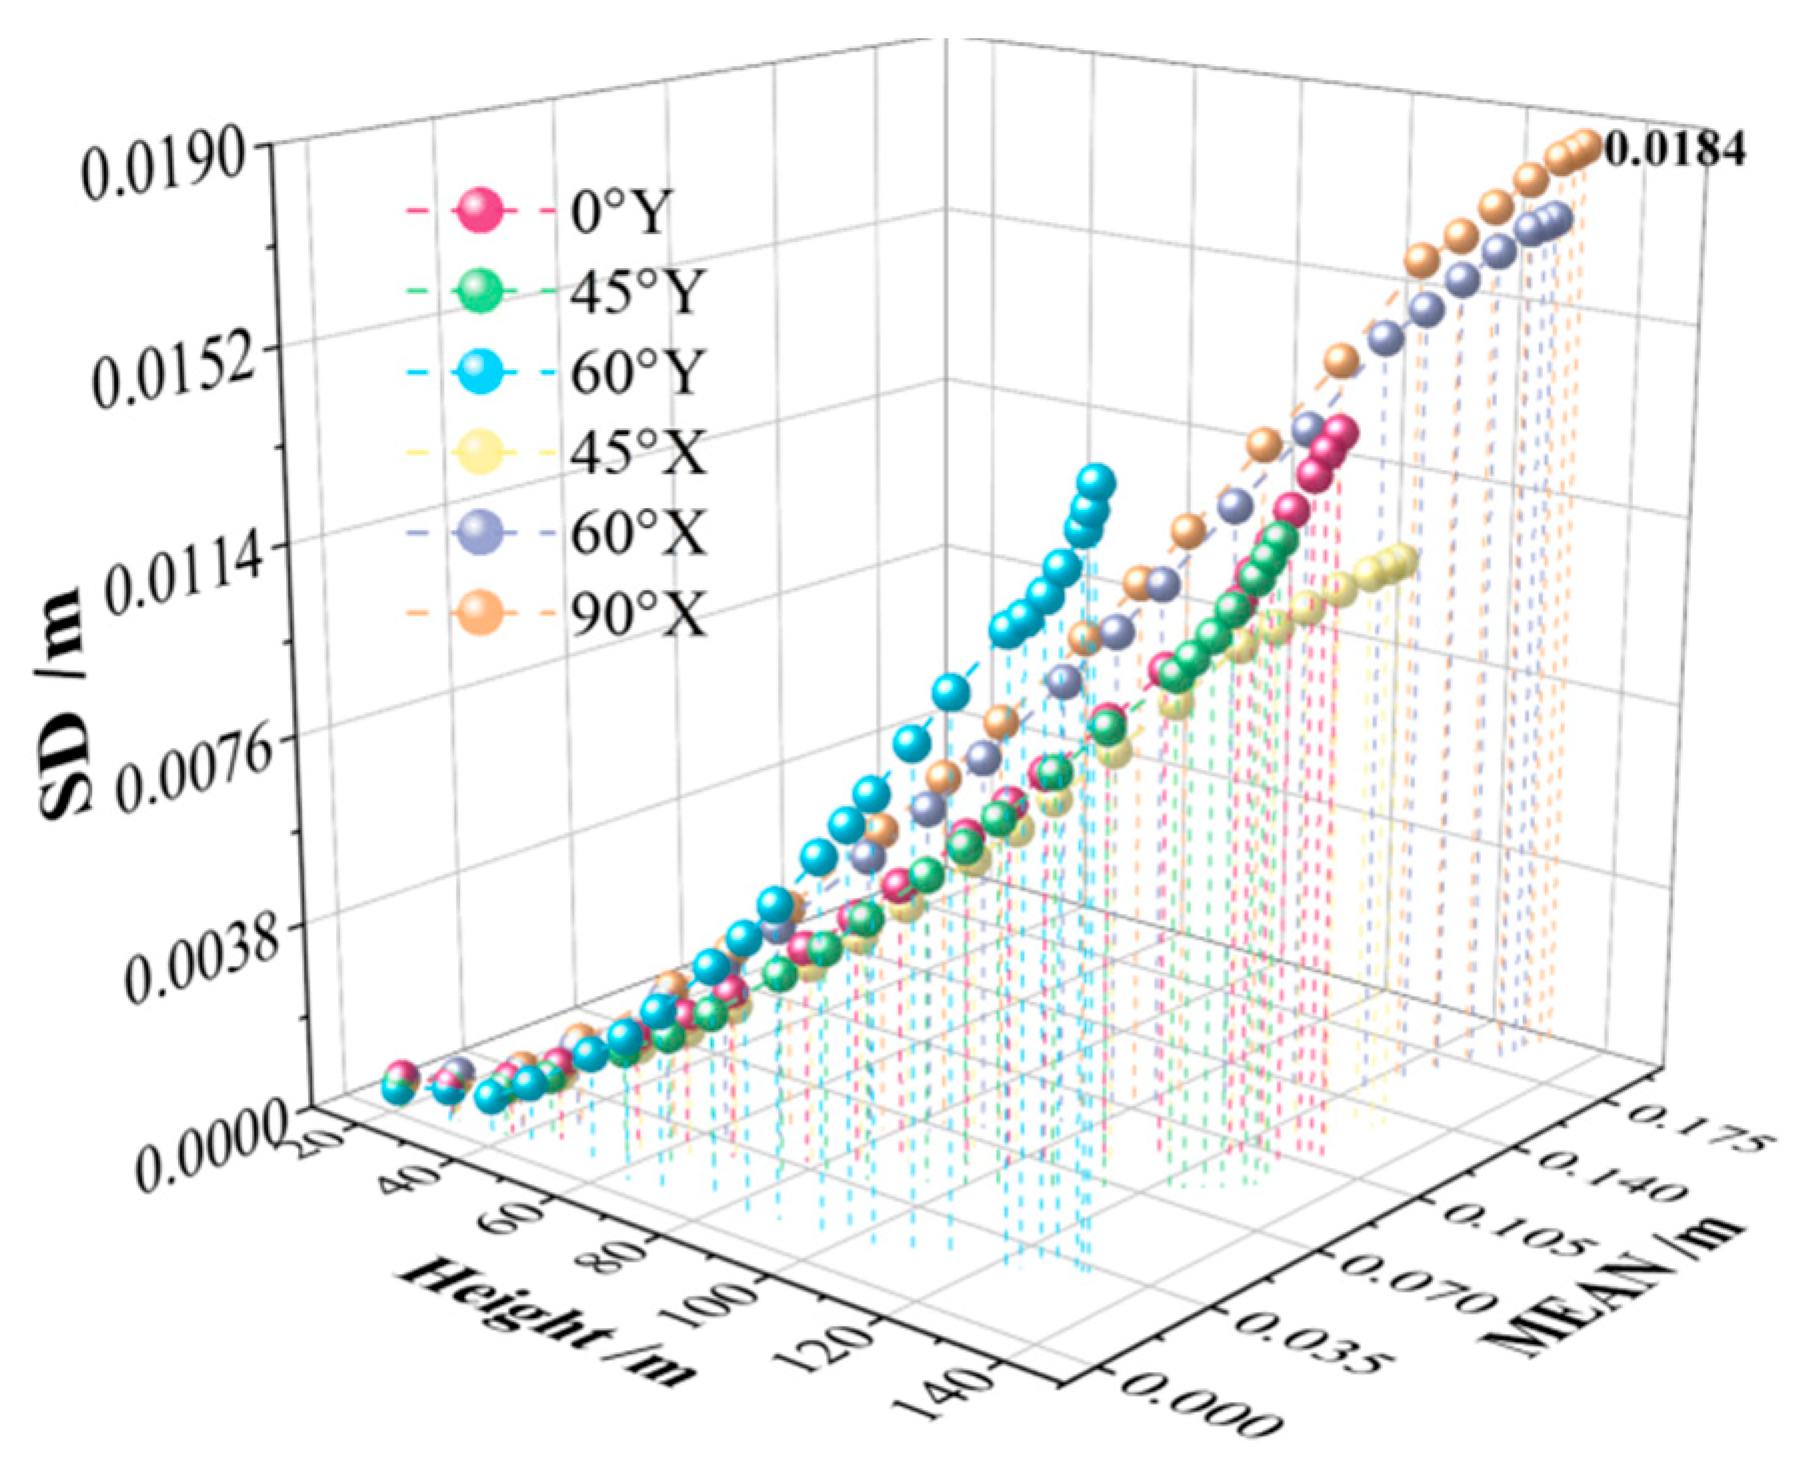
As shown in Figure 12, the common characteristics of the obtained displacement responses are as follows: the most unfavorable wind direction for displacement responses is the 0° Y-direction wind; the mean square deviation of the Y-direction displacement of the transmission tower is greater than that of the X-direction, which is related to the larger wind load distribution in the Y-direction wind pressure segments. The displacement response increases with the height of the nodes in each tower segment. Under random wind loads, the displacement response of the transmission tower exhibits bending deformation, which reflects the flexible characteristics of the transmission tower.
Note: Taking 0°Y as an example, it refers to the displacement response of the structure in the Y direction under the action of a 0° wind load.
The relative difference can be used to compare the discrepancies between the Davenport and Shiotani coherence functions. The calculation formula for the relative difference is as follows:
σ D σ S σ S × 100 %
where σ D is the simulation result of the Davenport coherence function, σ S is the simulation result of the Shiotani coherence function.
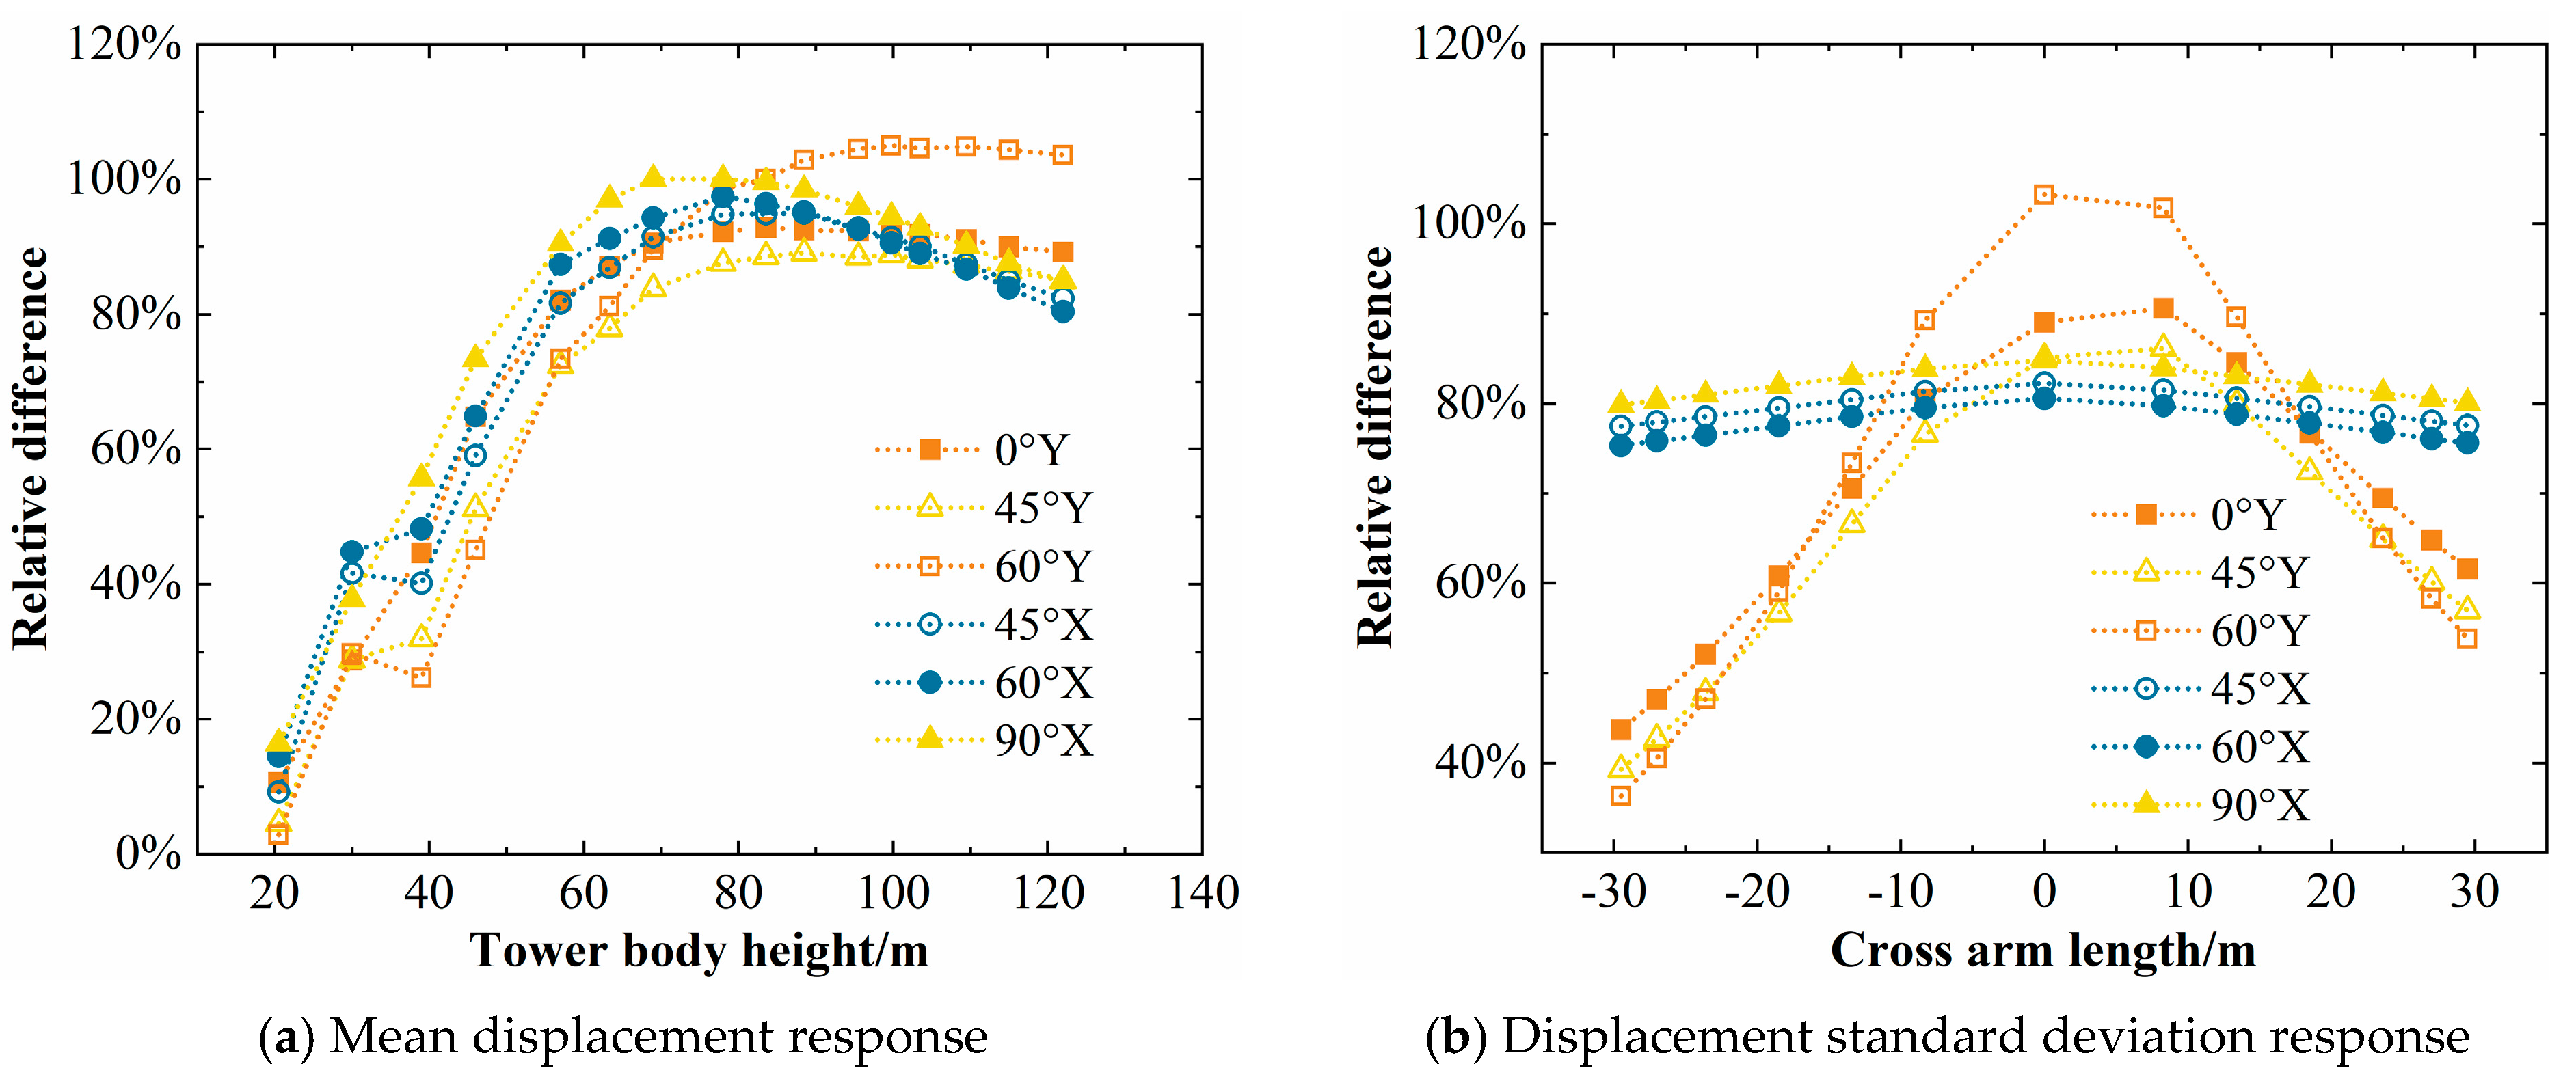
As shown in Figure 13, under different working conditions, the relative difference in displacement standard deviation responses induced by the Davenport and Shiotani coherence functions presents a trend of first increasing and then decreasing with the increase in the height of tower segments in the tower-body part, with the maximum difference reaching 105%; in the cross-arm part, the variation range of the relative difference in the X-direction of the cross arm is very small, generally around 80%. The relative difference in the Y-direction of the cross arm decreases with the increase in the length from the center of the cross arm. Therefore, the research results based on the Shiotani coherence function are generally smaller, which may lead to unsafe structural designs. Hence, it is not suitable for studying the wind-induced vibration responses of long-span transmission lines.

4.1.2. Comparison of Wind Vibration Coefficients of Single Tower

Based on the random vibration theory and displacement mean square deviation response, the wind vibration coefficients of each tower segment under different wind directions are calculated, and the variation laws of the wind vibration coefficients are studied along the two directions of the tower-body height and the cross-arm length, respectively.
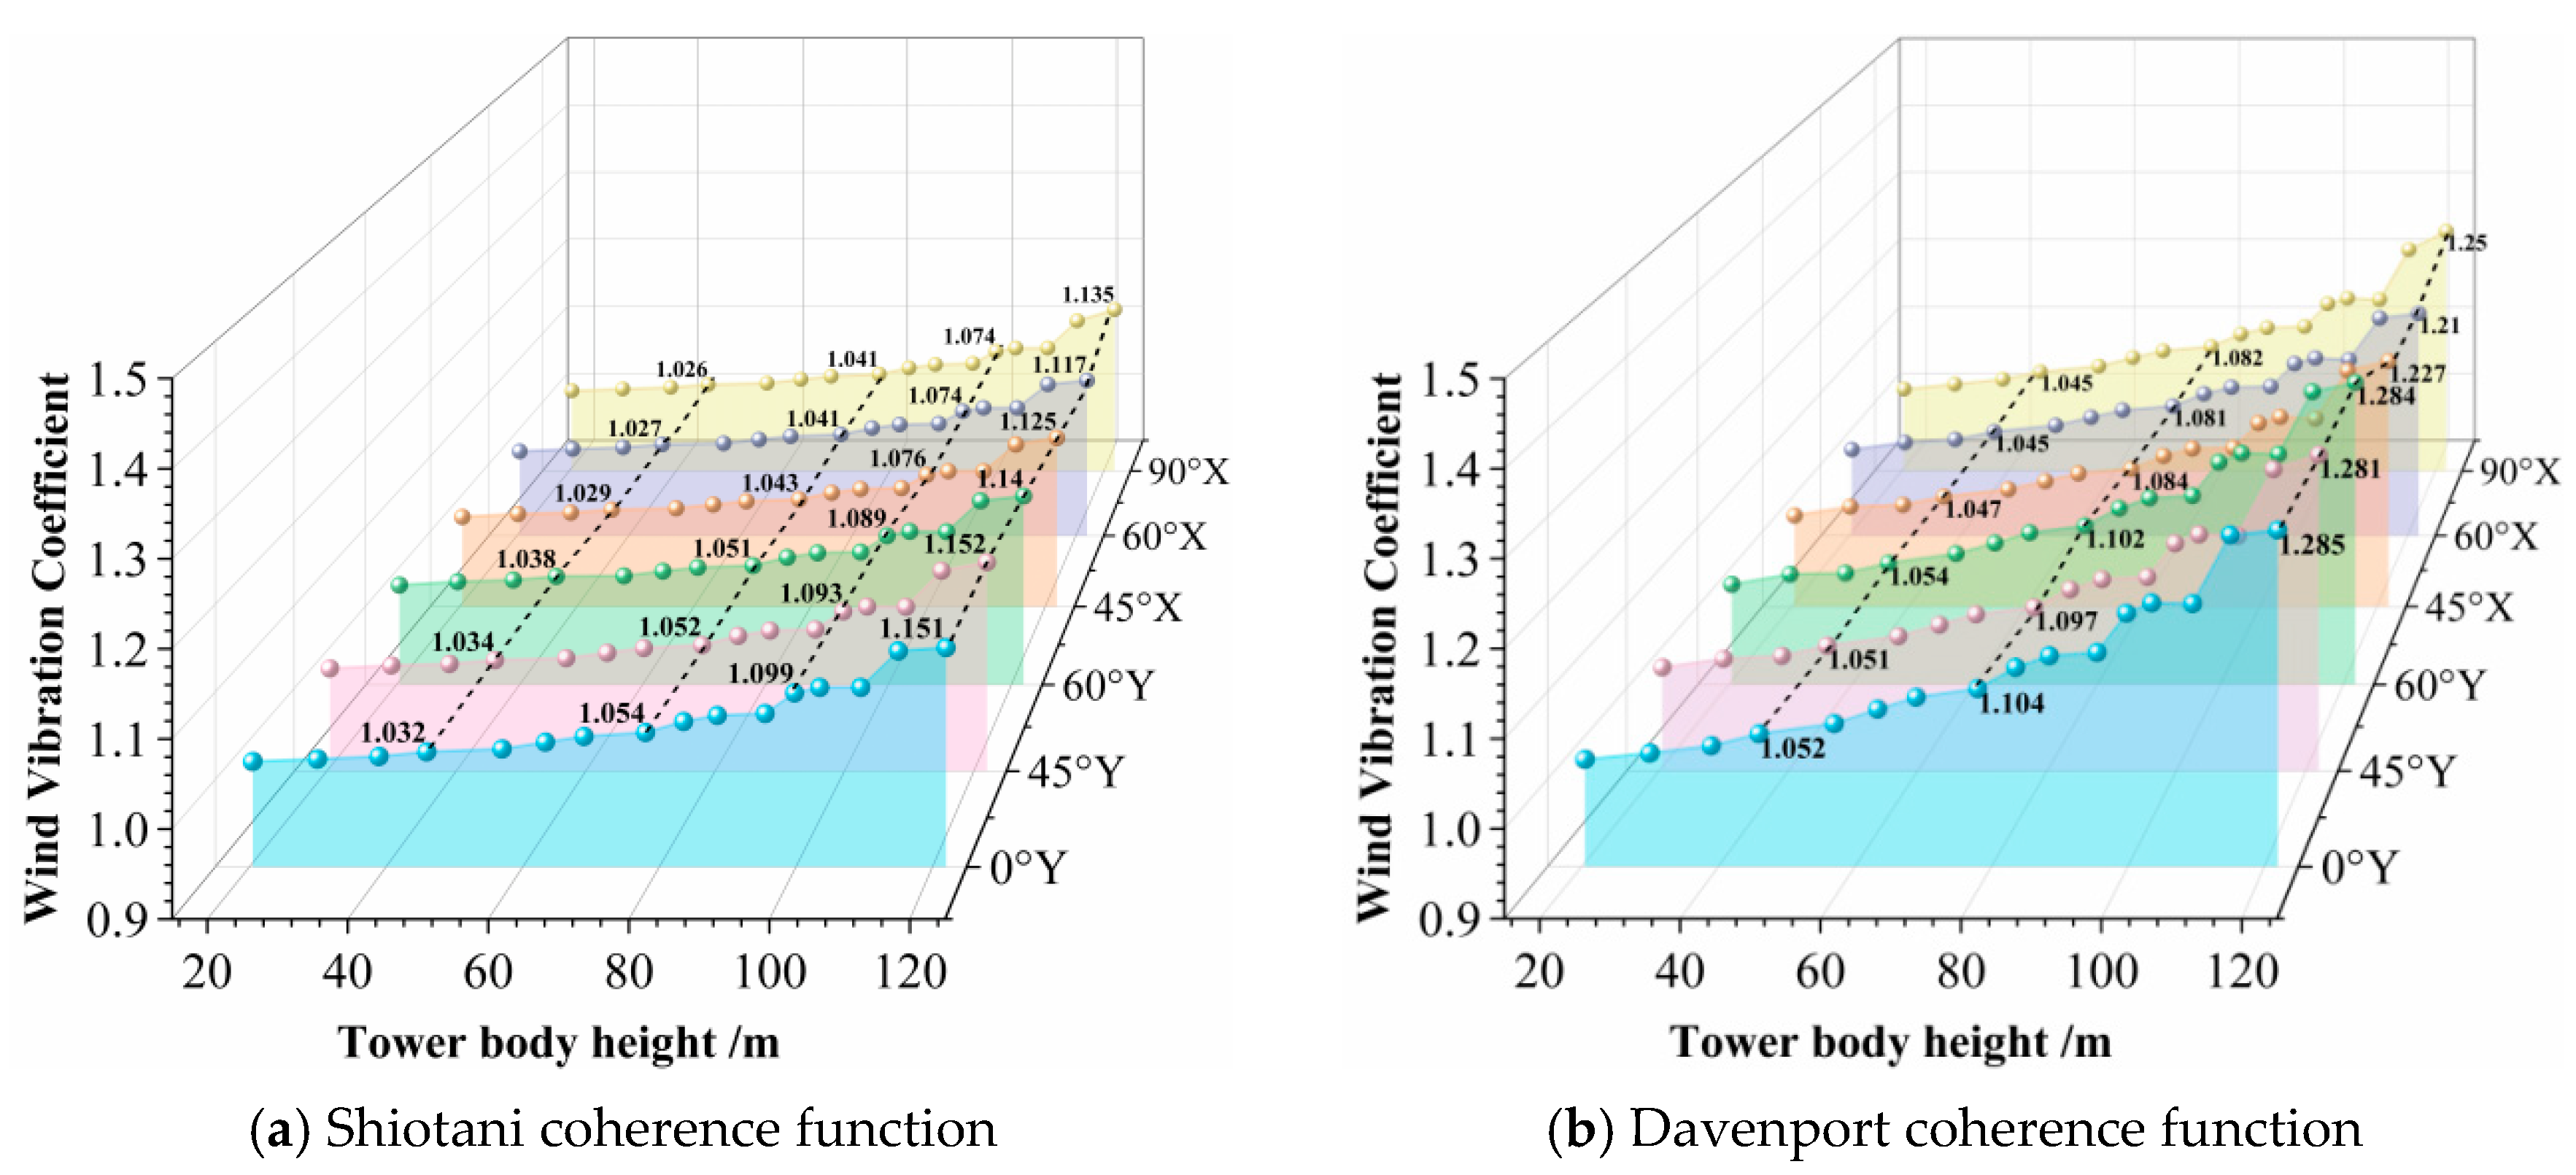
The wind vibration coefficients of the tower body calculated by the Shiotani and Davenport coherence functions increase with the increase in the tower-body height. The most unfavorable working conditions are 45°Y and 0°Y, respectively. The Y-direction wind vibration coefficient of the tower body is greater than that of the X-direction. This is because the Y-direction windward area of the transmission tower is larger than that of the X-direction, as shown in Figure 14a,b.
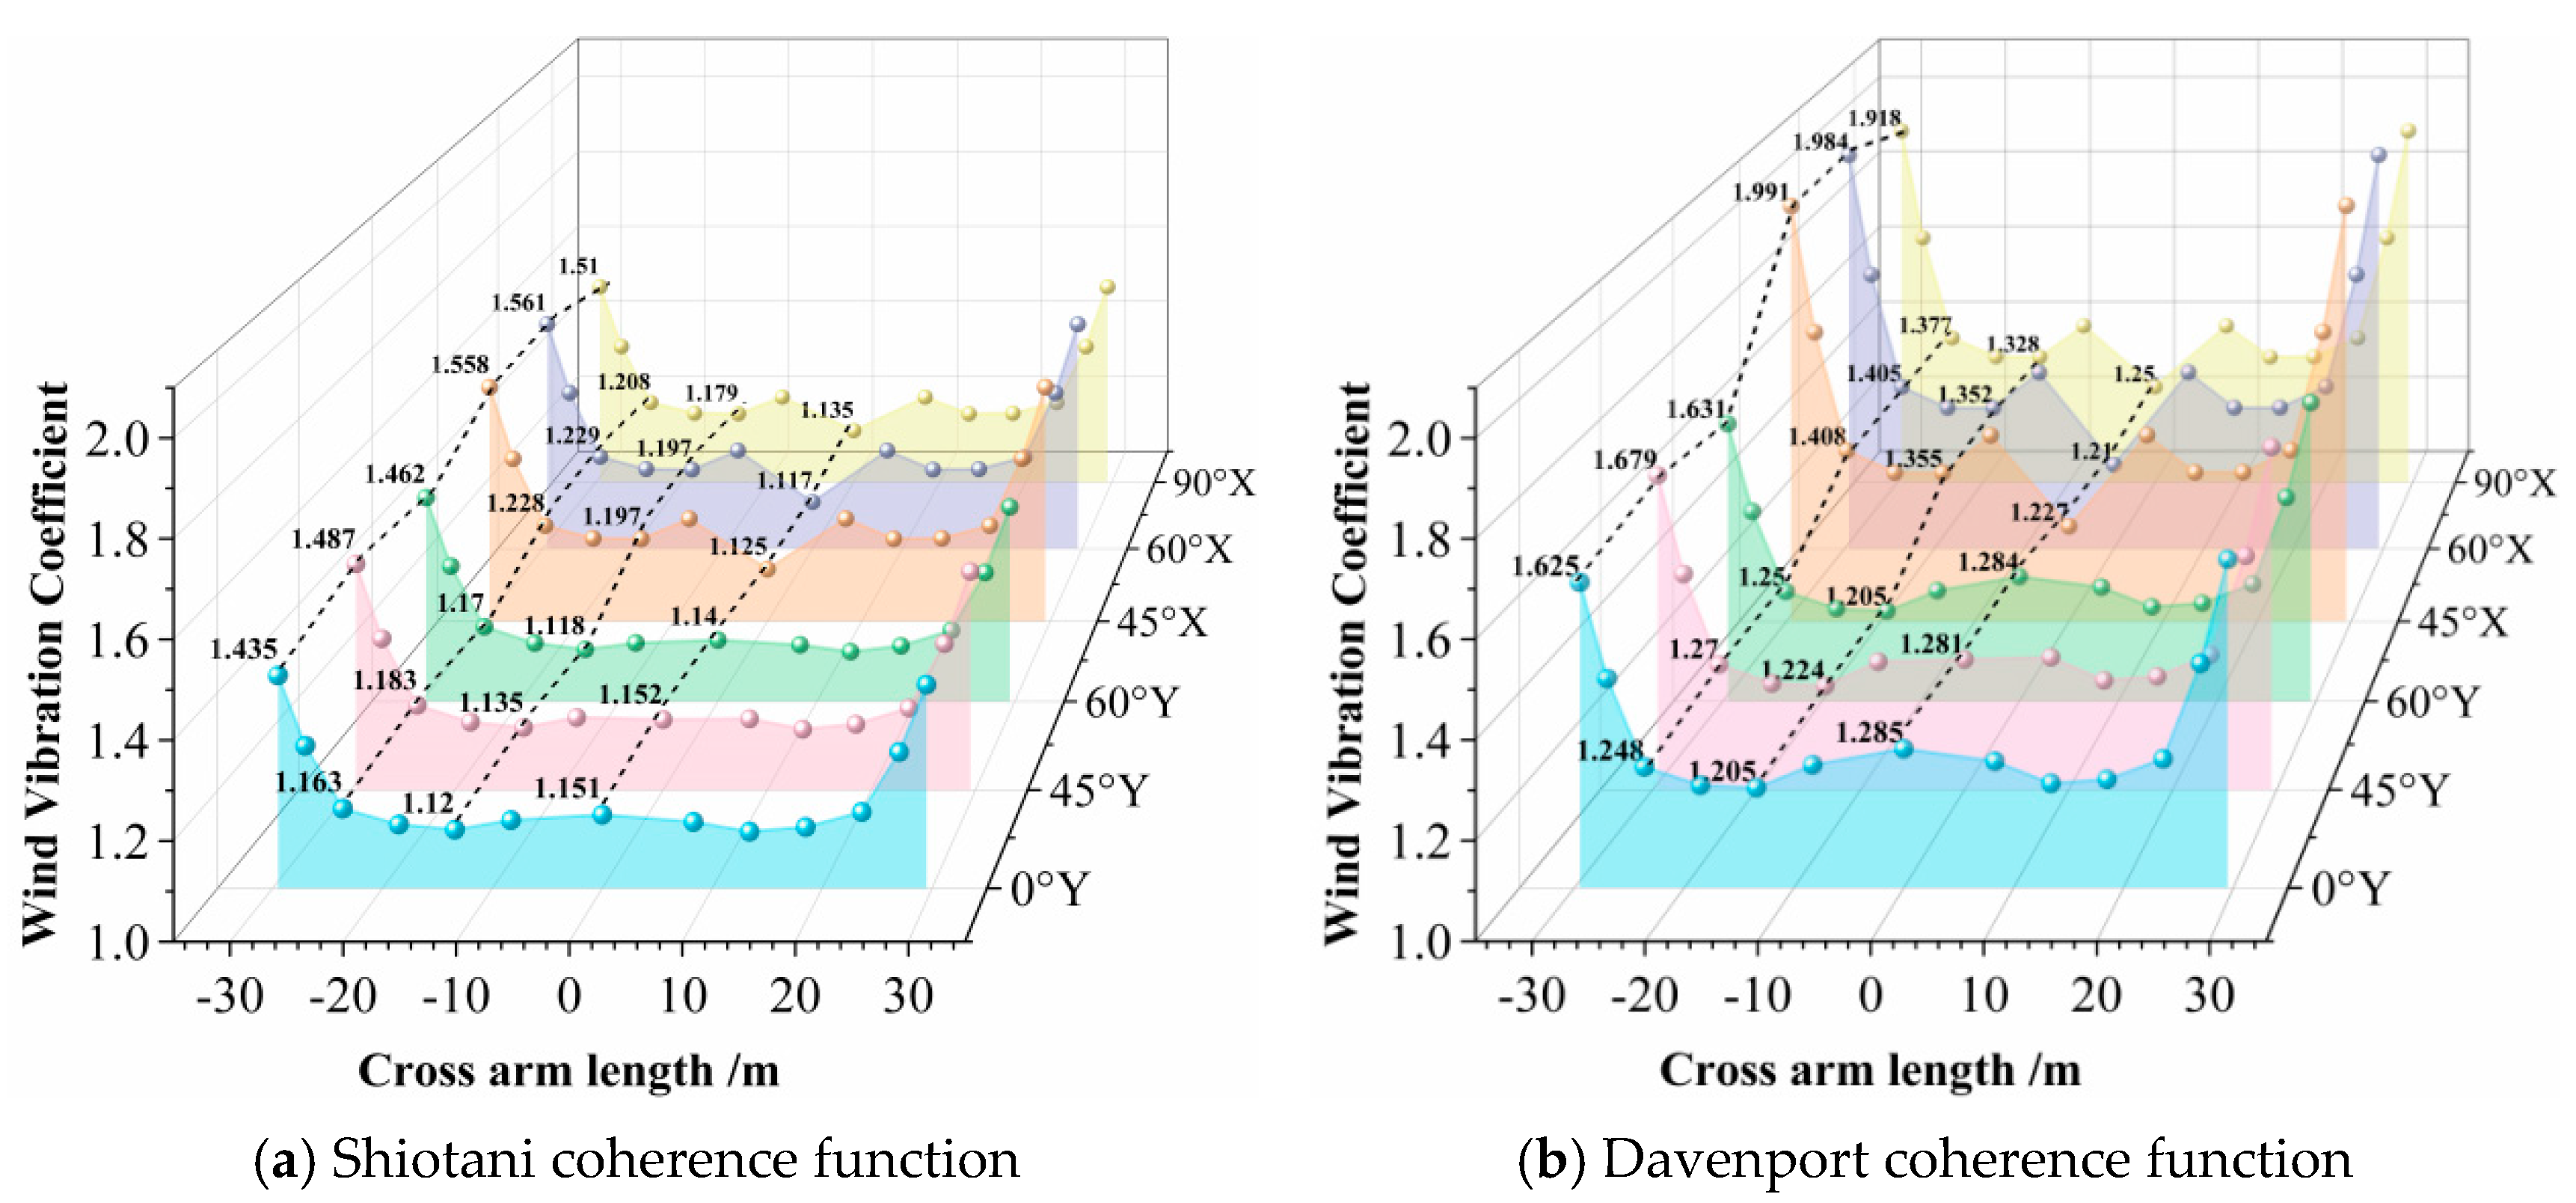
The wind vibration coefficient of the cross arm fluctuates with the increase in the length from the tower center. This is because the windward area and mass of the cross arm change unevenly: the part closer to the tower body is constrained by the tower, so its wind vibration coefficient is close to that of the tower body, while the wind vibration coefficient at the edge of the cross arm increases sharply. The most unfavorable working conditions for the cross-arm wind vibration coefficients calculated by the Shiotani and Davenport coherence functions are 60°X and 45°X, respectively. The wind vibration coefficient of the cross arm in the X-direction is greater than that in the Y-direction, as the Y-direction of the cross arm is usually rigidly connected to the tower body with strong constraints, which limits the vibration, as shown in Figure 15a,b.
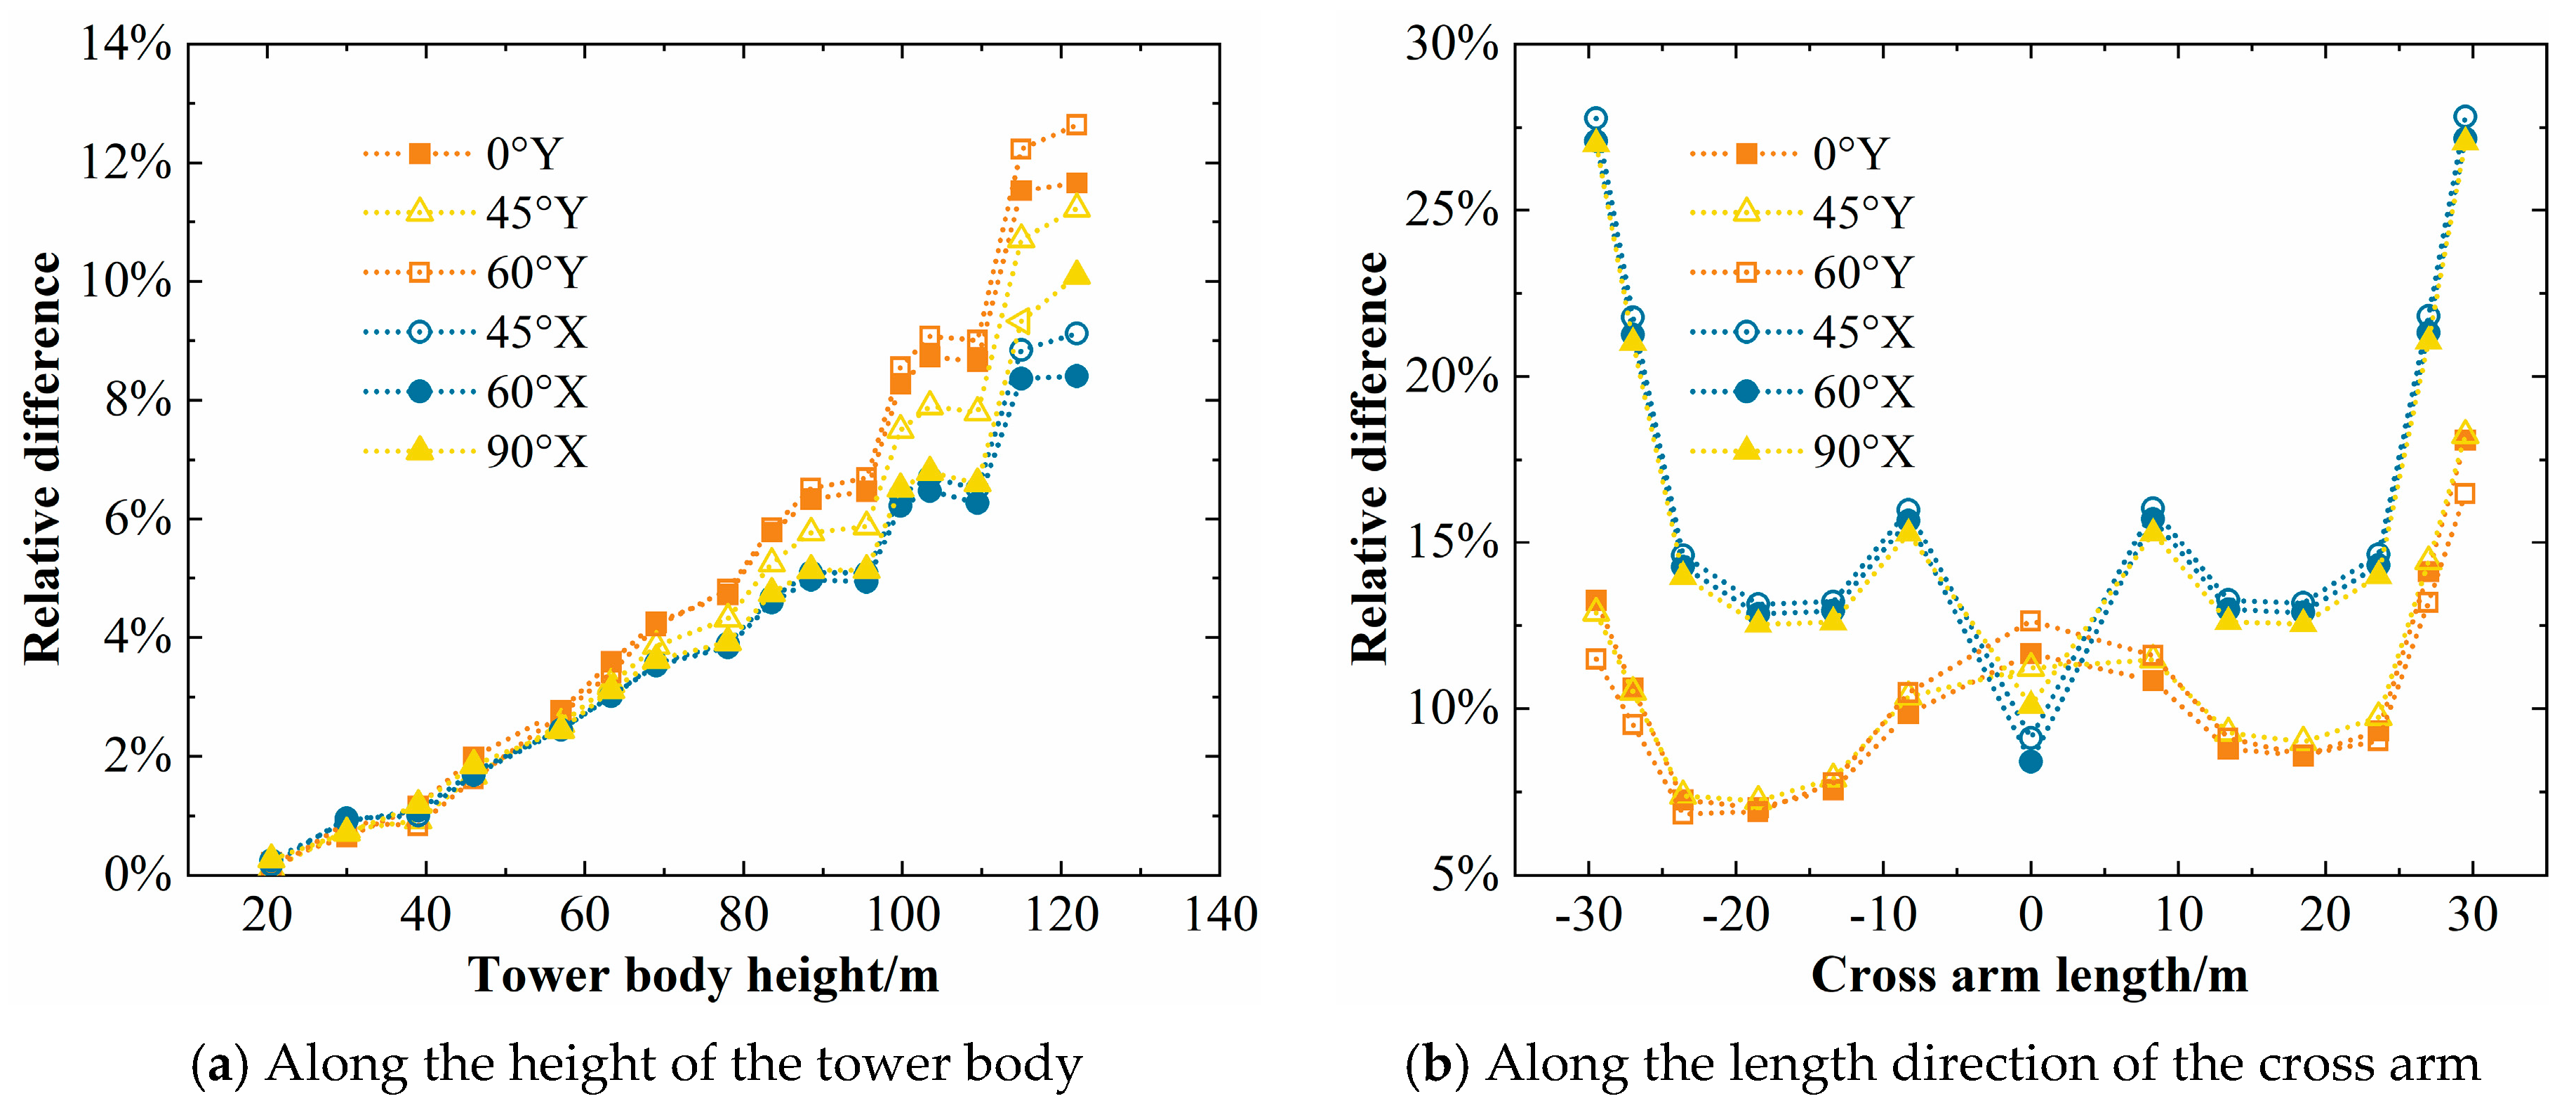
As shown in Figure 16, in the tower-body part, the relative difference in wind vibration coefficients calculated by the Davenport and Shiotani coherence functions increases with the height of the tower, with the maximum difference reaching 12.6%. In the cross-arm part, the relative difference in wind vibration coefficients fluctuates with the increase in the length from the tower center, and the relative difference in the X-direction of the cross arm is larger, with the maximum difference being 27.8%. Therefore, since the Shiotani coherence function does not consider the influence of height, it has strong practicality in the calculation and analysis of general transmission line towers with relatively low heights. However, for long-span high towers, due to their high tower type and large topographic height difference, it will underestimate the fluctuating wind vibration coefficient.

4.2. Comparison Between Single Tower and Tower-Line System

Based on the above analysis, the simulation results of the Davenport coherence function are more accurate. Therefore, a comparative study on the wind-induced responses and wind vibration coefficients between the bare tower and the tower-line system is conducted based on the Davenport coherence function.

4.2.1. Comparison of Displacement Responses

As shown in Figure 17, regarding the displacement response of the east-spanning tower in the tower-line system, the displacement response under the 90° wind direction is the most significant. This is because after tower-line coupling, under the 90° wind direction, the wind load borne by the conductors reaches the maximum, which causes an increase in their vibration amplitude. The inertial force generated by the vibration of the conductors is transmitted to the insulator strings through the suspension clamps, and finally to the tower body, forming an additional bending moment.
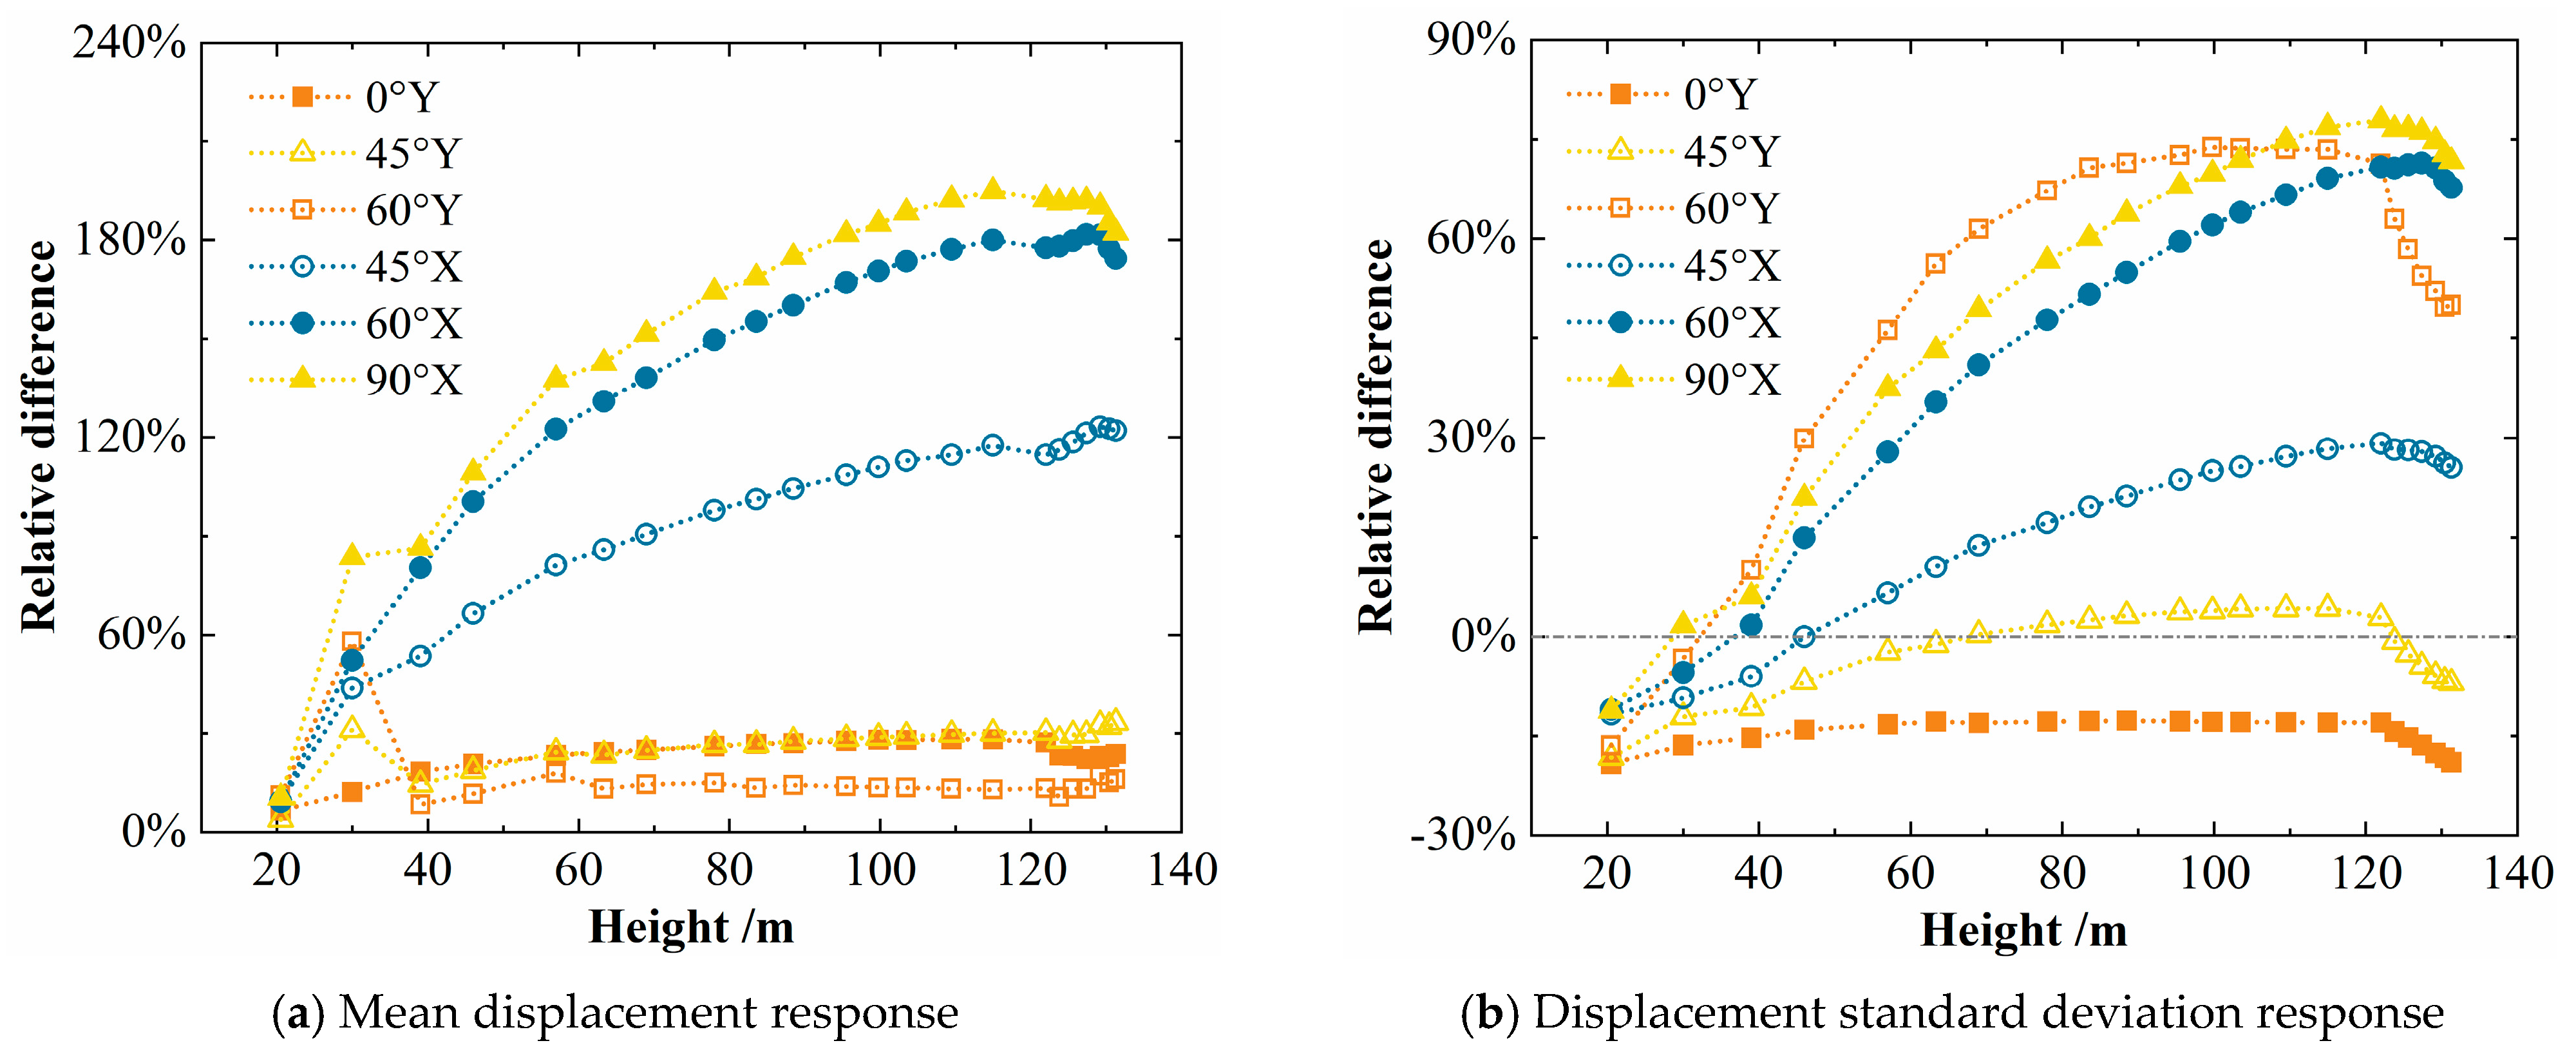
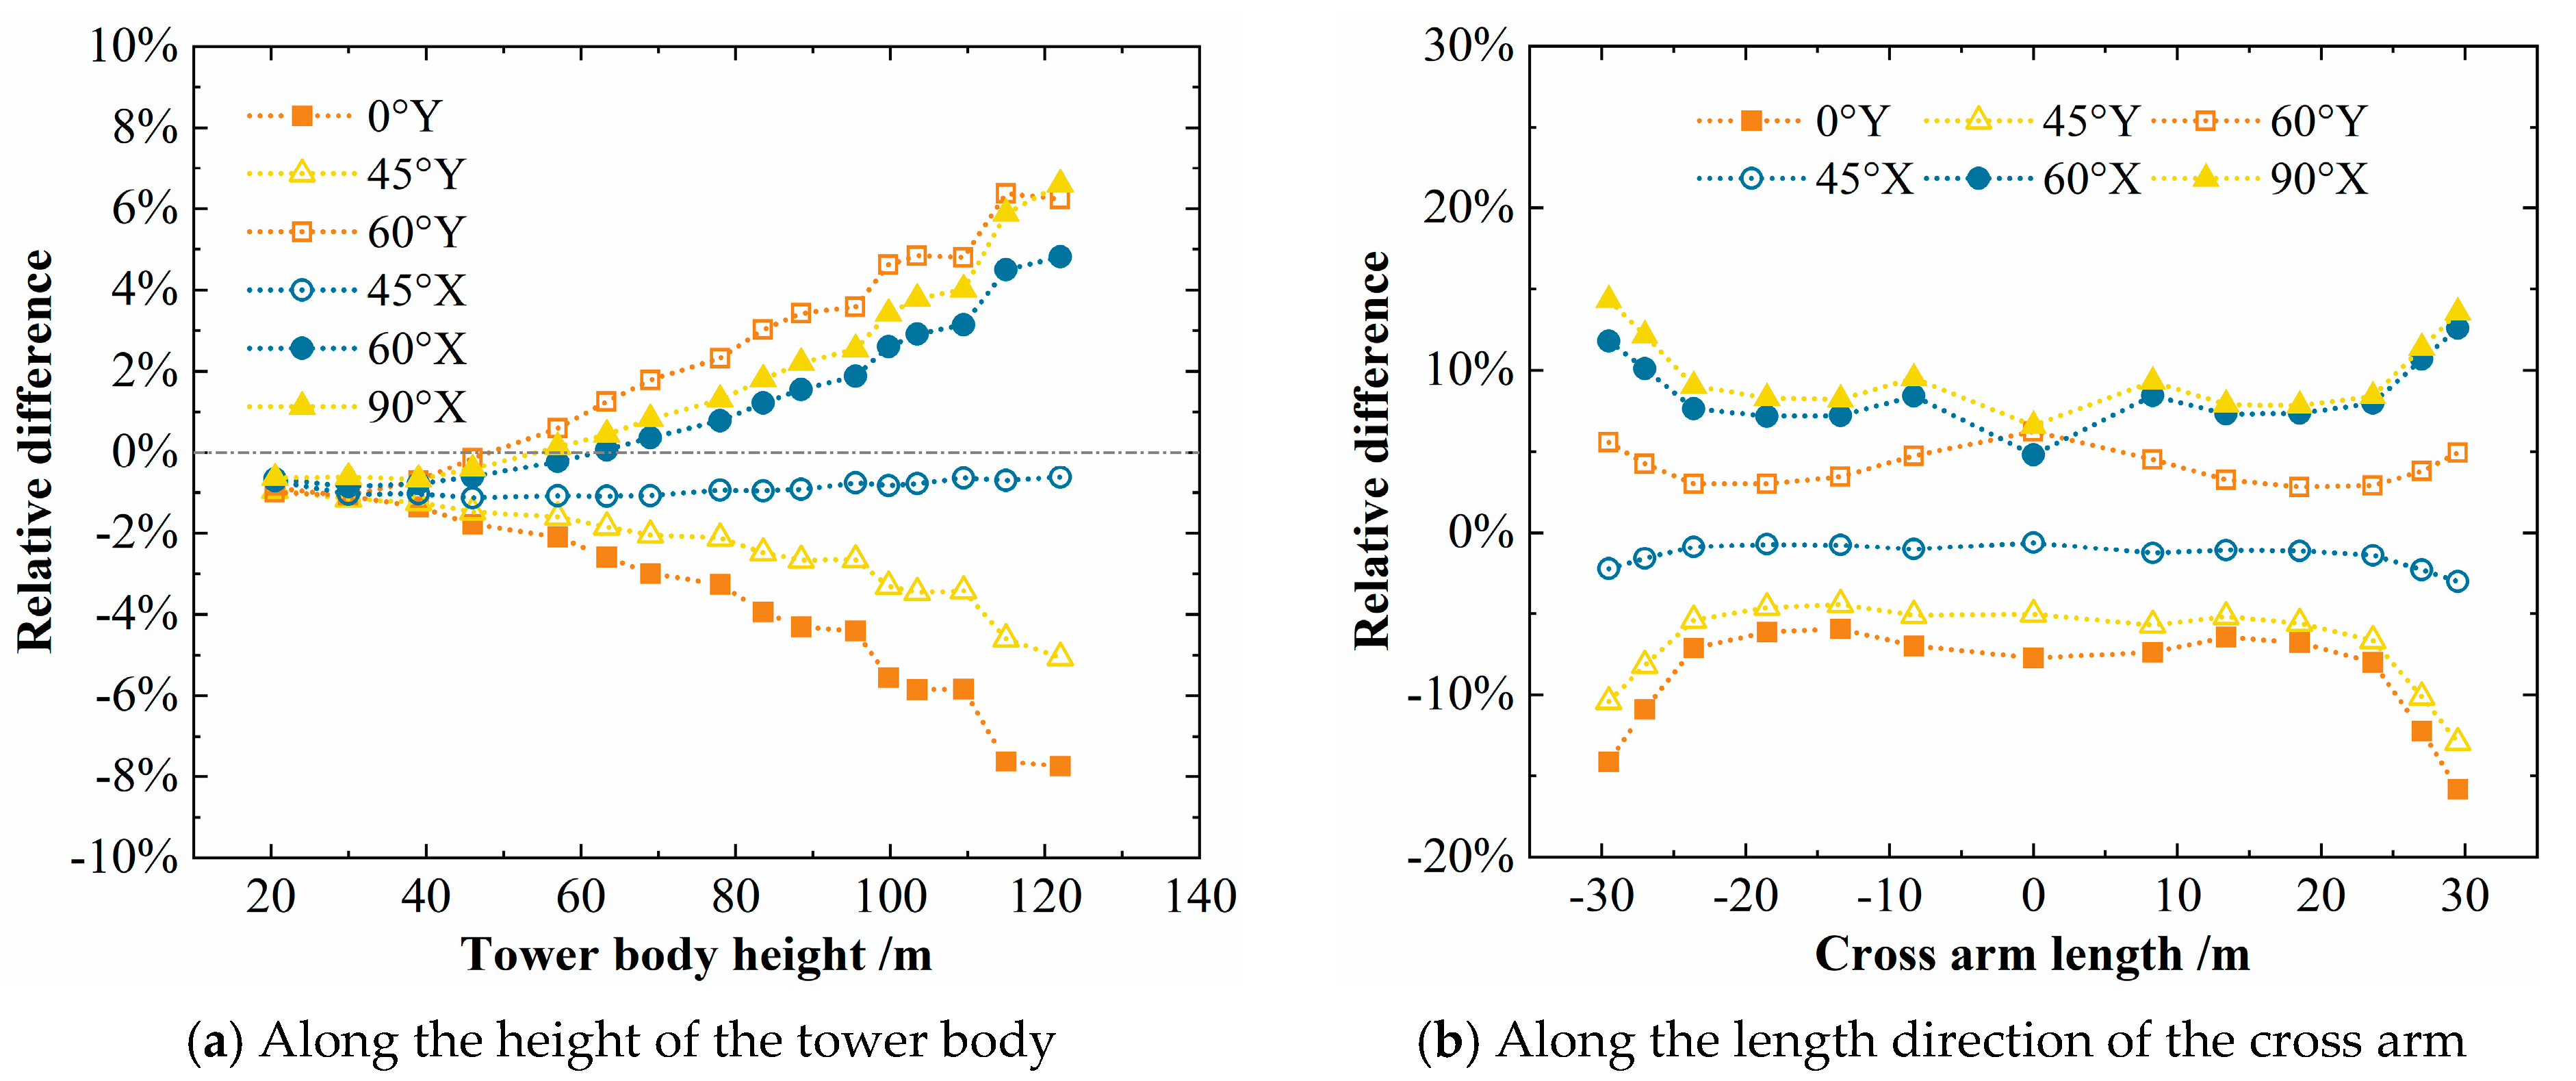
As shown in Figure 18a, after tower-line coupling, the mean displacement responses all increase. The transmission lines transfer part of the load they bear to the transmission tower, which leads to an increase in the total load borne by the transmission tower. According to the principles of structural mechanics, an increase in load will result in a corresponding increase in structural displacement. As shown in Figure 18b, after tower-line coupling, the displacement standard deviation responses all decrease near the tower legs, indicating that the coupling effect has enhanced the stability of this area. Under the 45°X, 60°, and 90° working conditions, the relative differences in displacement standard deviation between the east-spanning tower in the tower-line system and the bare tower generally increase with the increase in height, which is particularly significant under the 60° and 90° wind loads, with the maximum reaching 79%. This indicates that the upper part of the transmission tower is a “sensitive area” for the tower-line coupling effect, and the wind-induced vibration in this area should be focused on checking during the design.

4.2.2. Comparison of Wind Vibration Coefficients

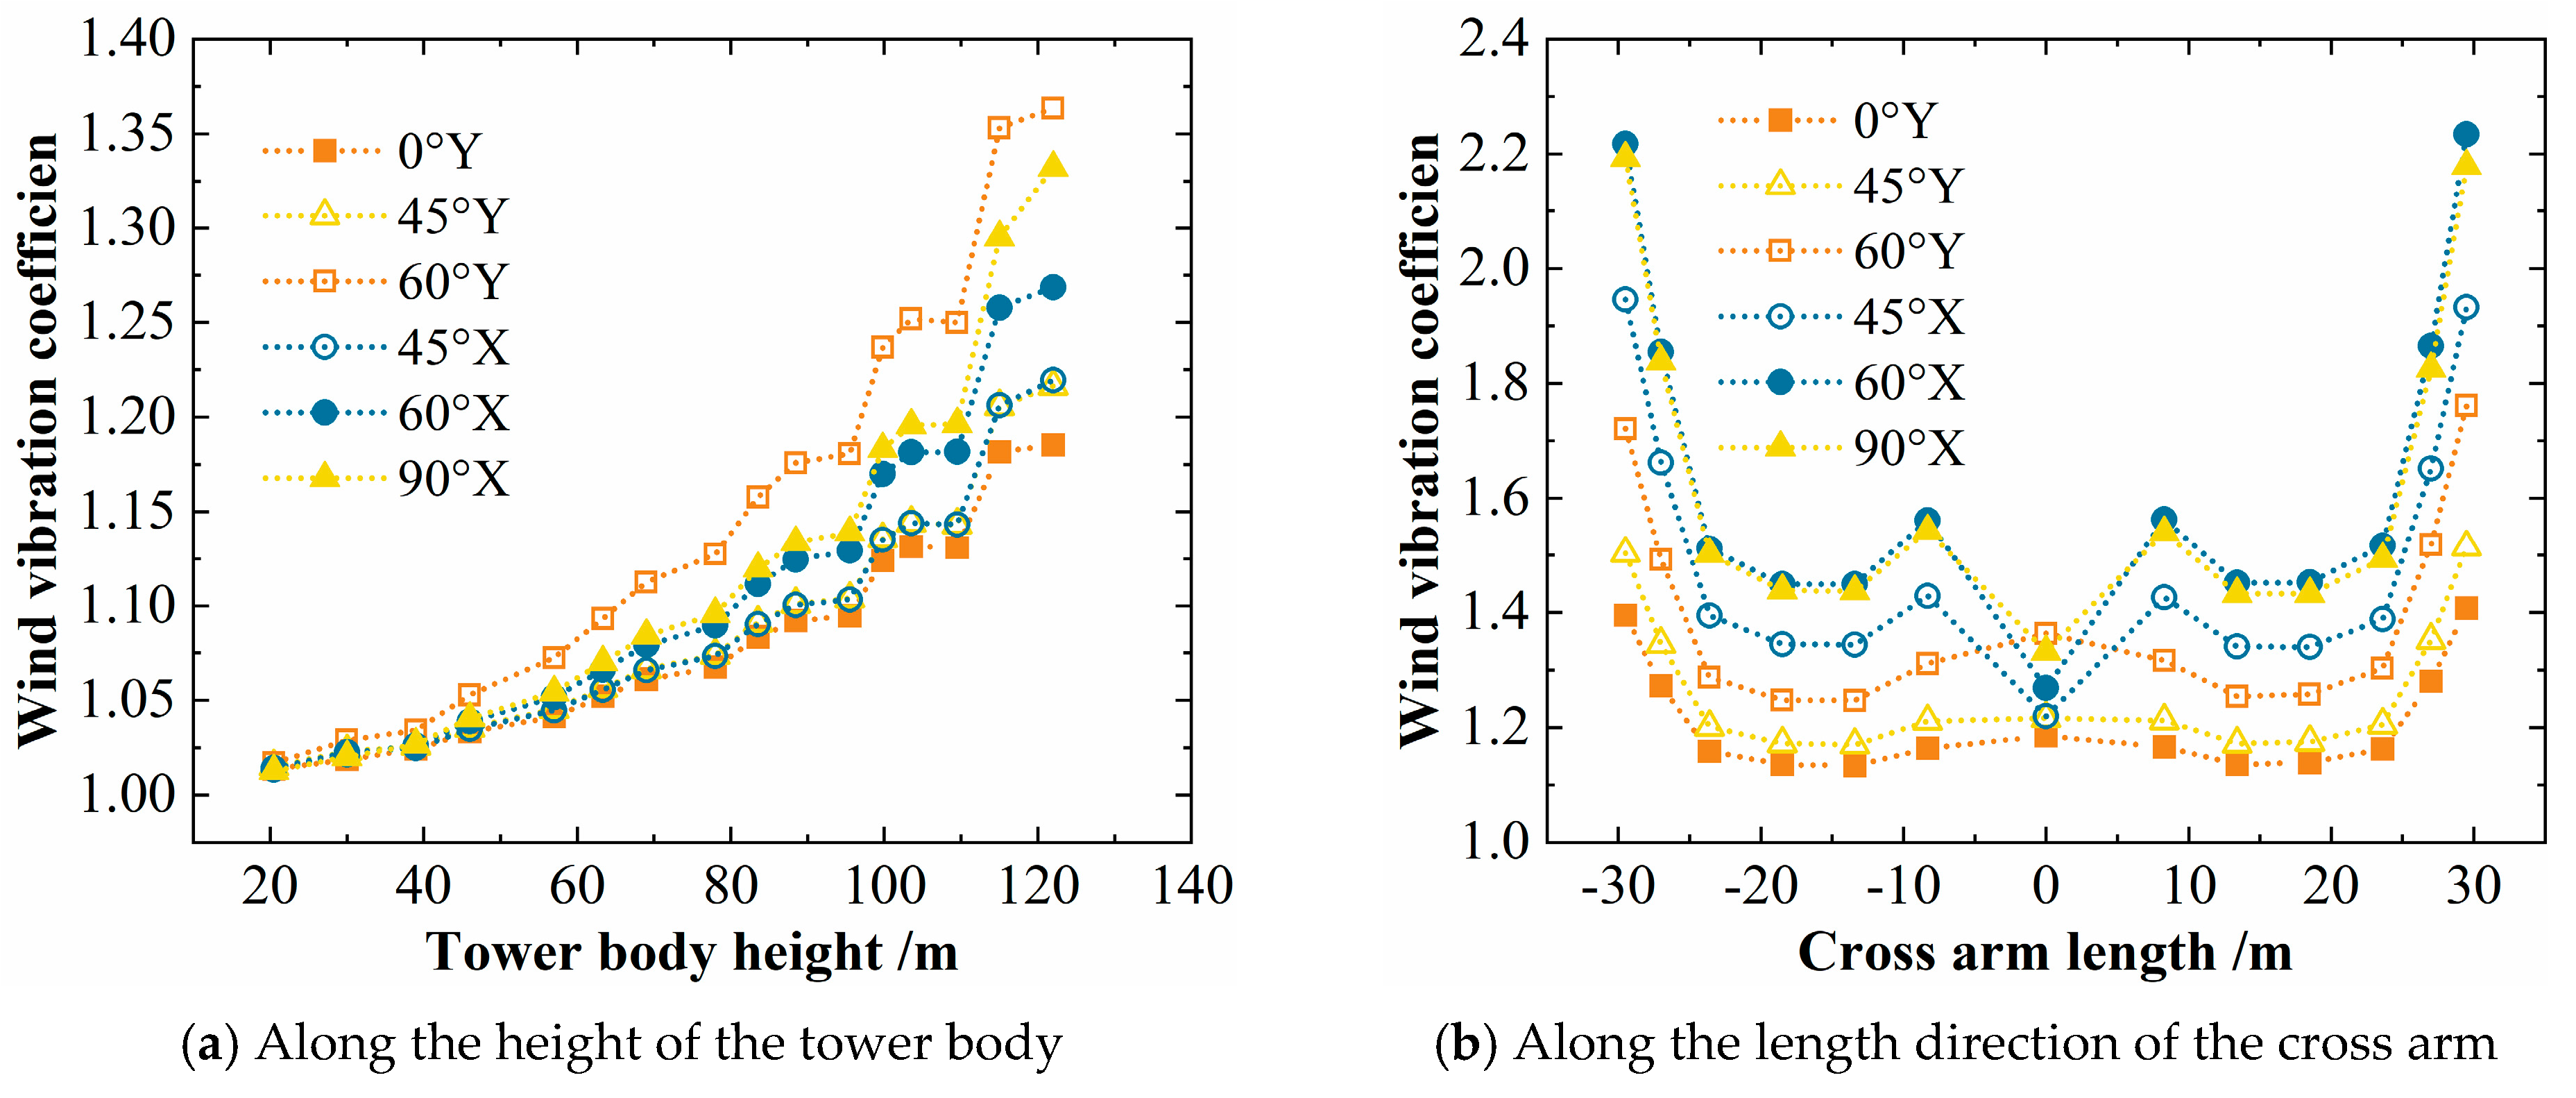
As shown in Figure 19, for the east-spanning tower in the tower-line system, the most unfavorable working conditions for the wind vibration coefficients of the tower body and cross arm are 60°Y and 60°X, respectively. After tower-line coupling, the stiffness and mass distribution of the tower body and cross arm are changed, which affects the natural frequency and vibration mode of the structure, thus causing changes in the vibration response of the structure under different wind angles.
As shown in Figure 20, by comparing the relative differences in wind vibration coefficients between the east crossing tower in the tower-line system and the bare tower in the tower-body and cross-arm parts, it can be found that in the part close to the tower legs, under the 60° and 90° wind directions, as the height of the tower body increases, the coupling effect increases the wind vibration coefficients, and the increasing effect strengthens, with a maximum increase of 14%. Under the 0° and 45° wind directions, the coupling effect reduces the wind vibration coefficients, and as the height of the tower body increases, the reducing effect strengthens, with a maximum reduction of 16%.
The relative difference is used to quantify the tower-line coupling effect rather than to define an angle-specific safety threshold. The values of 0°, 45°, 60°, and 90° represent the wind directions considered in the analysis. Under the 60° and 90° wind directions, the relative differences are positive, and the tower-line coupling effect increases the wind vibration coefficient by up to 14%, indicating that the bare-tower model may underestimate the corresponding response. Under the 0° and 45° wind directions, the relative differences are negative, and the wind vibration coefficient is reduced by up to 16%, indicating that the bare-tower result is relatively conservative for the investigated model. Therefore, the envelope of the tower-line-system responses under the considered wind directions should be adopted for wind-resistant design.

5. Recommended Values for the Wind Vibration Coefficient

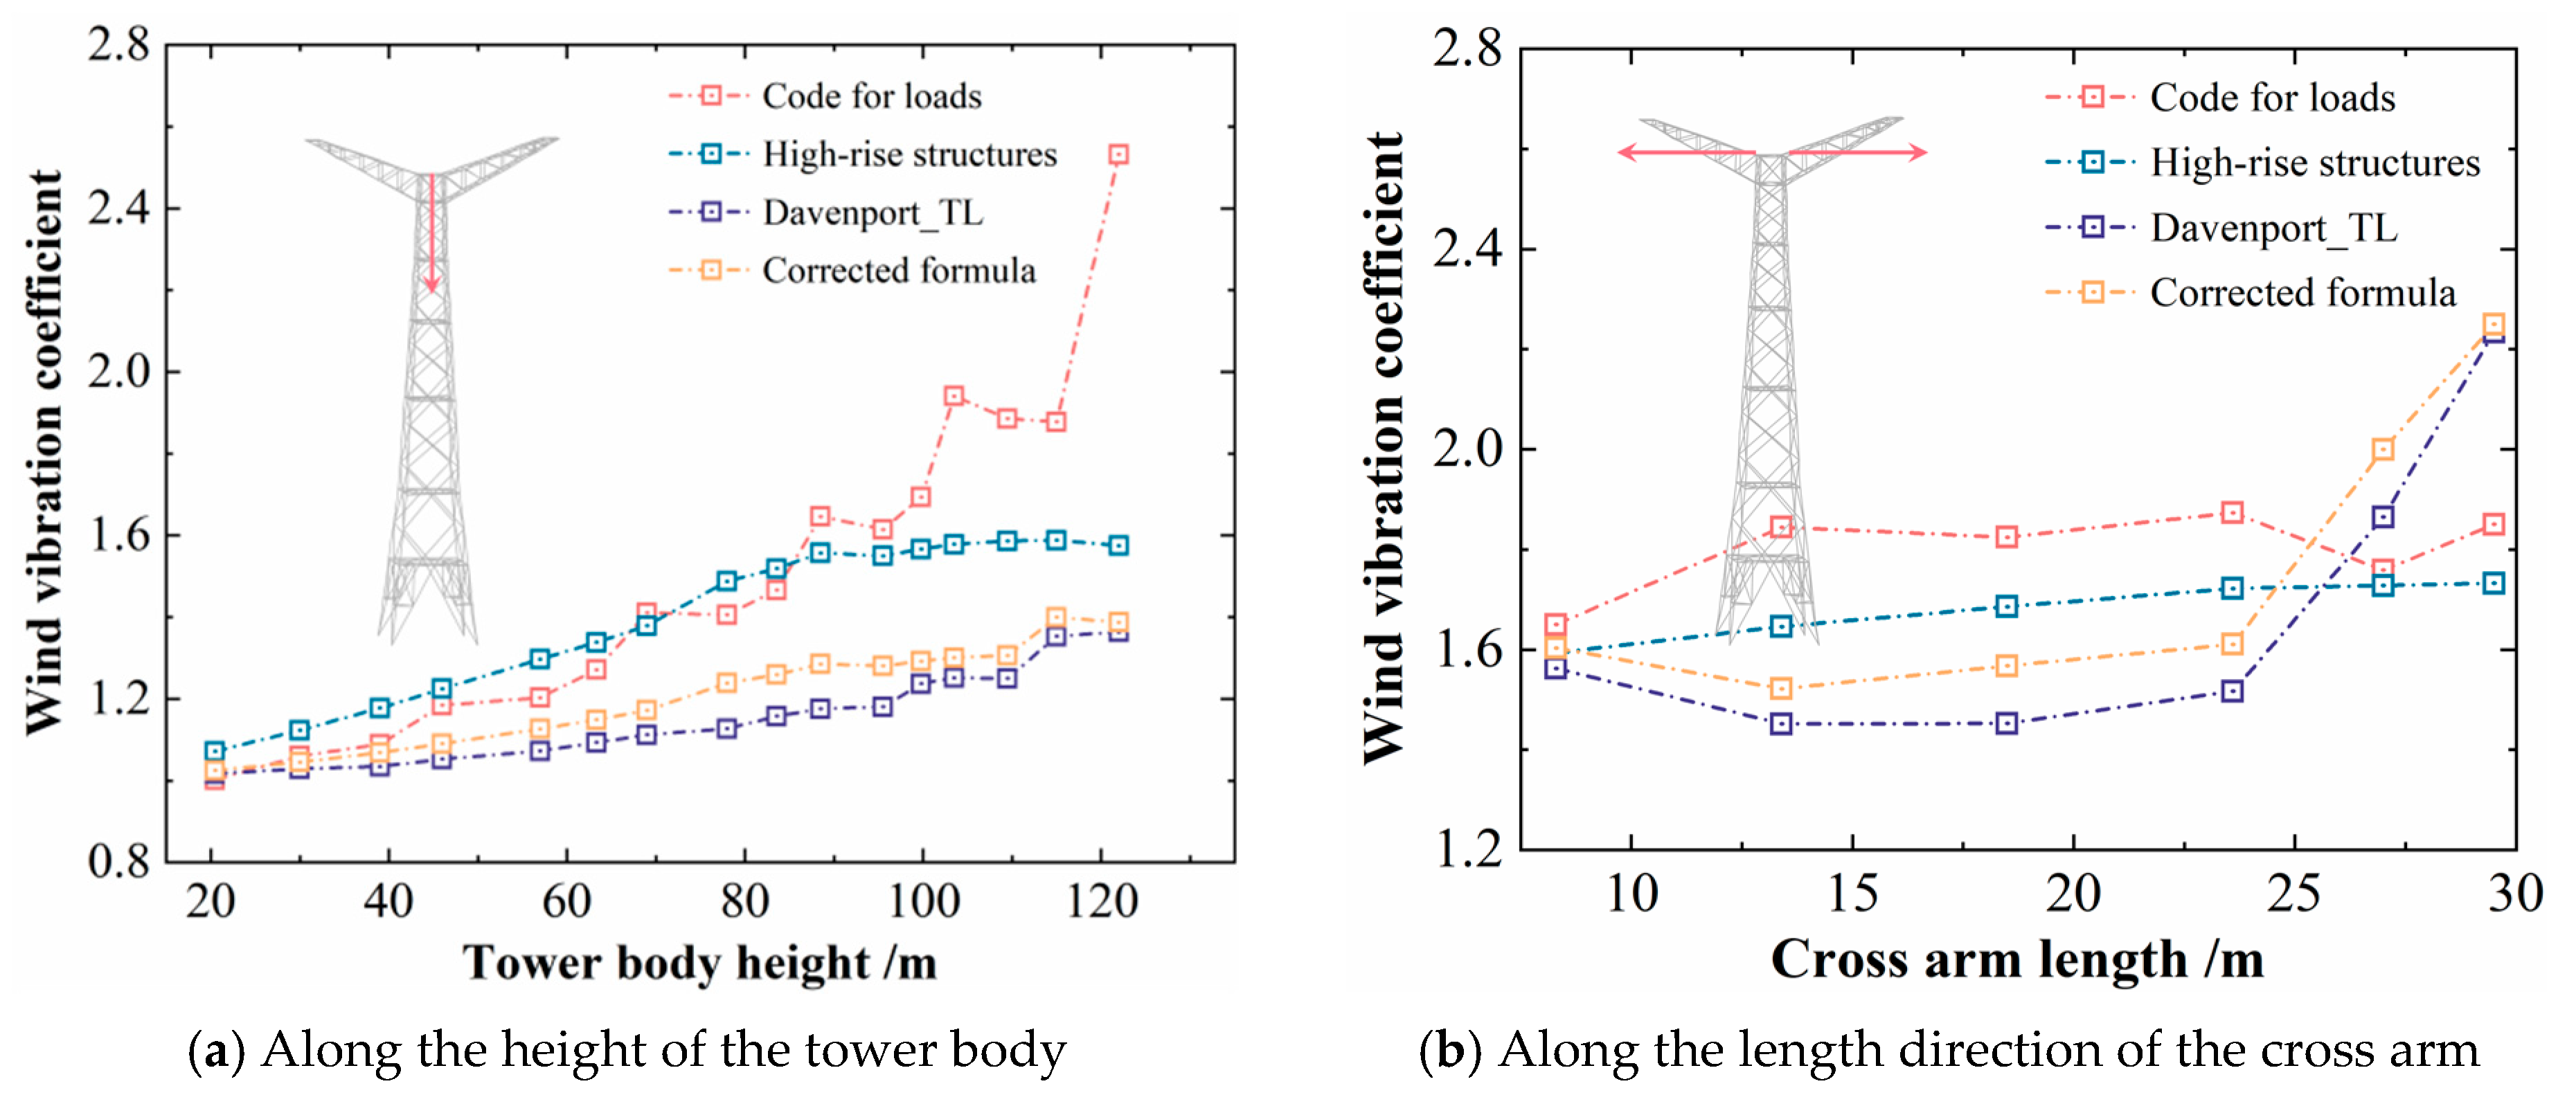
Figure 21 presents the curves of wind vibration coefficients varying with height under the most unfavorable wind direction, calculated in accordance with the load code, the high-rise structure code [46], and the random vibration theory. The wind vibration coefficients calculated using the high-rise structure code and the load code are overly conservative in the tower-body part and the cross-arm part near the tower body, while the wind vibration coefficients at the edge of the cross arm are insufficiently safe. Since the high-rise structure code is relatively close to the simulation calculation results, a method suitable for calculating the wind vibration coefficients of long-span spread-wing steel tube towers, which combines the high-rise structure code with the simulation calculation formula, is as follows:
(1)
Design formula for the wind vibration coefficient along the height as follows:
β z = 1 + τ h τ d ξ ε 1 ε 2
where ξ is the pulsation amplification factor. ε 1 is the influence coefficient of wind pressure pulsation, wind pressure variation, etc. ε 2 is the mode shape influence coefficient. τ h is the height direction correction coefficient, with a fitted value of 0.55. τ d is the correction coefficient near the top of the tower, with a value of 1.3.
(2)
Design formula along the width direction of the cross arm as follows:
β z = 1 + τ v τ b τ d ξ ε 1 ε 2
where τ v is the correction coefficient in the width direction, with a fitted value of 0.82. τ b is the correction coefficient at the edge of the cross arm, with a value of 2.0.
To verify the effectiveness of the modified formulas proposed in this paper, Equations (13) and (14) are substituted into the calculation of the transmission tower KYT, and the results are summarized in Figure 21. It can be seen that the modified formula enables reasonable design for the “spread-wing” transmission tower both along its height and width, and the overall error of the wind vibration coefficient can be controlled within 10%. They not only improve the problem of excessive conservatism in the designs specified in the load code and the high-rise structure code but also avoid some issues of insufficient safety. Therefore, they are recommended for the wind-resistant design of the “spread-wing” tower-line system.
The wind-field simulation procedure based on coherence functions is not inherently dependent on the transmission tower type or structural material. However, the structural-response model and the fitted modification coefficients are configuration-dependent. When the proposed framework is applied to another tower type, its geometry, member sections, connections, boundary conditions, conductor arrangement, modal properties, damping characteristics, and aerodynamic parameters should be re-established and validated. For a different material system, the corresponding material properties, mass density, damping, and connection behavior should also be considered. Since the present calibration and validation were conducted only for the investigated wing-expanded steel tubular tower, the fitted coefficients and the resulting modified formula should not be directly extrapolated to other tower configurations or material systems without independent numerical, experimental, or field verification.

6. Conclusions

Compared with conventional long-span transmission lines, the ±800 kV UHV long-span transmission line studied in this paper features “large terrain elevation difference and complex wind field”. Therefore, this paper conducts a study on the applicability of the Shiotani coherence function and the Davenport coherence function and also investigates the influence of the tower-line coupling effect on the simulation results. The main research contents are as follows:
(1)
The study on coherence functions shows that: the displacement standard deviation response and wind vibration coefficient of the Davenport coherence function are larger than those of the Shiotani coherence function. The Shiotani coherence function has strong practicability in the calculation and analysis of general transmission line towers with not very high heights, but it underestimates the fluctuating wind vibration coefficient for long-span high towers.
(2)
The tower-line coupling effect increases the mean displacement response of the east crossing tower; however, enhancing the stability of the tower leg position. Under wind directions of 60° and 90°, as the tower height increases, the coupling effect enlarges the wind vibration coefficient with a strengthening trend, reaching a maximum increase of 14%. Under wind directions of 0° and 45°, the coupling effect reduces the wind vibration coefficient; as the tower height increases, the reducing effect intensifies, with a maximum reduction of 16%.
(3)
Based on the wind vibration coefficients under the most unfavorable wind directions along the tower height and cross-arm length of the tower-line system, and in consideration of the deficiencies of the current codes, a modified formula for the wind vibration coefficients is developed for the investigated wing-expanded steel tubular transmission tower, and the overall error of the wind vibration coefficient can be controlled within 10%.

7. Future Work

The sensitivity analysis of different connection types is meaningful for improving the accuracy of tower-line system modeling. Future studies will further investigate the effects of rigid, hinged, and semi-rigid connections, as well as foundation flexibility, on the dynamic characteristics and wind-induced responses of the tower-line system.

Author Contributions

Conceptualization, W.Z.; methodology, W.Z. and Q.D.; formal analysis, W.Z. and Q.G.; investigation, W.Z., L.Y. and Q.D.; data curation, W.Z. and Q.G.; writing—original draft preparation, W.Z.; writing—review and editing, Q.G., X.W. and Q.S.; visualization, W.Z.; supervision, L.Y., X.W. and Q.S.; project administration, Q.S.; funding acquisition, X.W. and Q.S. All authors have read and agreed to the published version of the manuscript.

Funding

This research was funded by Northwest Electric Power Design Institute Co., Ltd., grant number NW-RD012-2023, and the Natural Science Foundation of China, grant number 51978570.

Institutional Review Board Statement

Not applicable.

Informed Consent Statement

Not applicable.

Data Availability Statement

The original contributions presented in this study are included in the article. Further inquiries can be directed to the corresponding author.

Conflicts of Interest

Authors Wenwu Zhou, Lei Yang, and Xueming Wang are employees of Northwest Electric Power Design Institute Co., Ltd., who provided funding and technical support for the work. The funder had no role in the design of the study; in the collection, analysis, or interpretation of data; in the writing of the manuscript; or in the decision to publish the results. The remaining authors declare that the research was conducted in the absence of any commercial or financial relationships that could be construed as a potential conflict of interest.

References

  1. Chen, Y.; Sun, H.; Feng, Z. Study on Seismic Isolation of Long Span Double Deck Steel Truss Continuous Girder Bridge. Appl. Sci. 2022, 12, 2567. [Google Scholar] [CrossRef] [Scilit]
  2. Liu, C.; Yan, Z. Fragility Analysis of Wind-Induced Collapse of a Transmission Tower Considering Corrosion. Buildings 2022, 12, 1500. [Google Scholar] [CrossRef] [Scilit]
  3. Ke, S.T.; Wang, T.G.; Ge, Y.J.; Tamura, Y. Wind-induced responses and equivalent static wind loads of tower-blade coupled large wind turbine system. Struct. Eng. Mech. 2014, 52, 485–505. [Google Scholar] [CrossRef] [Scilit]
  4. He, Y.; Han, X.; Li, Q.; Zhu, H.; He, Y. Monitoring of wind effects on 600 m high Ping-An Finance Center during Typhoon Haima. Eng. Struct. 2018, 167, 308–326. [Google Scholar] [CrossRef] [Scilit]
  5. Yan, C.; Xie, Q. An assessing framework for the structural functional states of transmission lines under wind loads. Wind Struct. 2024, 39, 381–393. [Google Scholar]
  6. Luo, X.; Pan, Z.; Ma, J.; Chen, Y.; Mou, W.; Lou, W. Analysis of dynamic response of a transmission tower under downburst wind-wave loads. Ocean Eng. 2025, 328, 121069. [Google Scholar] [CrossRef] [Scilit]
  7. Liu, S.; Li, Q.; Lu, B.; He, J. Impact of incoming turbulence intensity and turbine spacing on output power density: A study with two 5MW offshore wind turbines. Appl. Energy 2024, 371, 123648. [Google Scholar] [CrossRef] [Scilit]
  8. Dagnew, A.K.; Bitsuamlak, G.T. Computational evaluation of wind loads on a standard tall building using LES. Wind Struct. 2014, 18, 567–598. [Google Scholar] [CrossRef] [Scilit]
  9. Melaku, A.F.; Bitsuamlak, G.T. Prospect of LES for predicting wind loads and responses of tall buildings: A validation study. J. Wind Eng. Ind. Aerodyn. 2024, 244, 105613. [Google Scholar] [CrossRef] [Scilit]
  10. Ke, S.T.; Du, L.Y.; Ge, Y.J.; Zhao, L.; Tamura, Y. A study on the average wind load characteristics and wind-induced responses of a super-large straight-cone steel cooling tower. Wind Struct. 2017, 25, 433–457. [Google Scholar]
  11. Ke, S.T.; Yu, W.; Xu, L.; Ge, Y.J.; Tamura, Y. Identification of damping ratio and its influences on wind- and earthquake-induced effects for large cooling towers. Struct. Des. Tall Spec. Build. 2018, 27, e1488. [Google Scholar] [CrossRef] [Scilit]
  12. Song, J.; Tse, K.T.; Tamura, Y.; Kareem, A. Aerodynamics of closely spaced buildings: With application to linked buildings. J. Wind Eng. Ind. Aerodyn. 2016, 149, 1–16. [Google Scholar] [CrossRef] [Scilit]
  13. Guo, X.; Li, H.; Zhang, H. Damage risk assessment of transmission towers based on the combined probability spatial-temporal distribution of strong winds and earthquakes. Reliab. Eng. Syst. Saf. 2025, 261, 111078. [Google Scholar] [CrossRef] [Scilit]
  14. Guo, X.; Zhang, H.; Li, H.; Yuan, X.; Ding, Y. Multi-hazard performance assessment of low-rise cold-formed steel structures subjected to combined earthquake and wind. J. Constr. Steel Res. 2024, 214, 108501. [Google Scholar] [CrossRef] [Scilit]
  15. Meng, X.; Tian, L.; Liu, J.; Jin, Q.; Yang, F. Wind-ice-induced damage risk analysis for overhead transmission lines considering regional climate characteristics. Eng. Struct. 2025, 329, 119844. [Google Scholar] [CrossRef] [Scilit]
  16. Ke, S.T.; Du, L.Y.; Ge, Y.J.; Tamura, Y. Multi-dimensional wind vibration coefficients under suction for ultra-large cooling towers considering ventilation rates of louvers. Struct. Eng. Mech. 2018, 66, 273–283. [Google Scholar]
  17. Zhao, S.; Zhang, C.; Yue, J.; Yan, Z.; Liu, J.; Zhang, B.; Liu, B. Wind-Induced Vibration Coefficient of Landscape Tower with Curved and Twisted Columns and Spiral Beams Based on Wind Tunnel Test Data. Buildings 2022, 12, 1635. [Google Scholar] [CrossRef] [Scilit]
  18. Zhong, Y.; Liu, Y.; Li, S.; Yan, Z.; Liu, X. Study on Wind Vibration Response and Coupling Effect of Transmission Tower-Line System Under Downburst. IEEE Access 2024, 12, 100120–100133. [Google Scholar] [CrossRef] [Scilit]
  19. Lou, W.; Xia, L.; Jiang, Y.; Jin, X.; Wang, Z. Wind-induced response and wind load factor of transmission tower under terrain B wind field and typhoon wind field. J. Vib. Shock 2013, 32, 13–17. [Google Scholar]
  20. Deng, H.Z.; Si, R.J.; Hu, X.Y.; Duan, C.Y. Wind Tunnel Study on Wind-Induced Vibration Responses of a UHV Transmission Tower-Line System. Adv. Struct. Eng. 2013, 16, 1175–1185. [Google Scholar] [CrossRef] [Scilit]
  21. Wang, H.; Ke, S.; Wang, T.; Ge, Y.; Zhu, R. Comparison of wind-induced dynamic property of super-large cooling tower considering different four-tower interferences. Struct. Des. Tall Spec. Build. 2020, 29, 1749. [Google Scholar] [CrossRef] [Scilit]
  22. Xie, W.; Li, Z.; Du, W.; Fu, X. Coupling vibration characteristics and wind-induced responses of large-span transmission lines under multi-dimensional wind. Buildings 2024, 14, 3462. [Google Scholar] [CrossRef] [Scilit]
  23. Lu, B.; Li, Q.; Wang, X.; Han, X.; He, J. Large eddy simulation of wind pressures on a 600-m-high skyscraper and comparison with field measurements during super myphoon mangkhut. J. Build. Eng. 2024, 92, 109750. [Google Scholar] [CrossRef] [Scilit]
  24. Wang, X.; Li, Q.; Lu, B. Large-scale turbulence effect on streamwise surface pressures in separated and reattaching flows. Phys. Fluids 2025, 37, 055122. [Google Scholar] [CrossRef] [Scilit]
  25. Yan, B.; Li, Q. Large-eddy simulation of wind effects on a super-tall building in urban environment conditions. Struct. Infrastruct. Eng. 2016, 12, 765–785. [Google Scholar]
  26. Kim, W.; Tamura, Y.; Yoshida, A. Interference effects on aerodynamic wind forces between two buildings. J. Wind Eng. Ind. Aerodyn. 2015, 147, 186–201. [Google Scholar] [CrossRef] [Scilit]
  27. Tamura, Y.; Kim, Y.C.; Kikuchi, H.; Hibi, K. Correlation and combination of wind force components and responses. J. Wind Eng. Ind. Aerodyn. 2014, 125, 81–93. [Google Scholar] [CrossRef] [Scilit]
  28. Lin, Y.X.; Fu, X.; Li, H.N. Influence of Pendulum on Vibration Response of Transmission Tower under Wind Load. AMM 2013, 353–356, 2319–2322. [Google Scholar] [CrossRef] [Scilit]
  29. ANSYS, Inc. ANSYS Mechanical APDL Documentation, Release 18.0; ANSYS, Inc.: Canonsburg, PA, USA, 2017.
  30. GB 50260; Code for Seismic Design of Electrical Installations. China Planning Press: Beijing, China, 2013.
  31. Song, P.; Lang, X.; Zhang, S.; Yang, B.; Zhang, S.; Rong, K.; Tian, L. Study on Windage Response Suppression of Large-Span Transmission Tower-Line System Using a Spring-Pendulum Dynamic Vibration Absorber. Energies 2024, 17, 5638. [Google Scholar] [CrossRef] [Scilit]
  32. He, J. Coherence and cross-spectral density matrix analysis of random wind and wave in deep water. Ocean. Eng. 2020, 197, 106930. [Google Scholar] [CrossRef] [Scilit]
  33. Zhang, X.; Ju, Y.; Wang, F. Statistical analysis of wind-induced dynamic response of power towers and four-circuit transmis-sion tower-line system. Shock Vib. 2018, 2018, 5064930. [Google Scholar] [CrossRef] [Scilit]
  34. Davenport, A.G. The spectrum of horizontal gustiness near the ground in high winds. Q. J. R. Meteorol. Soc. 1961, 87, 194–211. [Google Scholar] [CrossRef] [Scilit]
  35. Shiotani, M.; Arai, H. Lateral structures of gusts in high winds. In Proceedings of the Conference on Wind Effects on Buildings and Structures; University of Toronto Press: Toronto, ON, Canada, 1967; pp. 20–26. [Google Scholar]
  36. GB 50009; Load Code for the Design of Building Structures. China Architecture & Building Press: Beijing, China, 2012.
  37. Isyumov, N.; Alan, G. Davenport’s mark on wind engineering. J. Wind Eng. Ind. Aerodyn. 2012, 104, 12–24. [Google Scholar] [CrossRef] [Scilit]
  38. Zhu, K.; Li, W.K.; Yu, P.L.H. Buffered autoregressive models with conditional heteroscedasticity: An application to exchange rates. J. Bus. Econ. Stat. 2017, 35, 528–542. [Google Scholar] [CrossRef] [Scilit]
  39. Akaike, H. A new look at the statistical model identification. IEEE Trans. Autom. Control 1974, 19, 716–723. [Google Scholar] [CrossRef] [Scilit]
  40. Schwarz, G. Estimating the dimension of a model. Ann. Stat. 1978, 6, 461–464. [Google Scholar] [CrossRef] [Scilit]
  41. Perivolaropoulos, L.; Skara, F. A Reanalysis of the Latest SH0ES Data for H0: Effects of New Degrees of Freedom on the Hubble Tension. Universe 2022, 8, 502. [Google Scholar] [CrossRef] [Scilit]
  42. Ljung, G.M.; Box, G.E.P. On a measure of lack of fit in time series models. Biometrika 1978, 65, 297–303. [Google Scholar] [CrossRef]
  43. DL/T 5551; Load Code for the Design of Overhead Transmission Line. China Planning Press: Beijing, China, 2018.
  44. Avci, M.S.; Yavuz, D.; Ercan, E.; Nuhoglu, A. Efficient sizing and layout optimization of truss benchmark structures using ISRES algorithm. Appl. Sci.-Basel 2024, 14, 3324. [Google Scholar] [CrossRef] [Scilit]
  45. Faghidian, S.A.; Elishakoff, I. A consistent approach to characterize random vibrations of nanobeams. Eng. Anal. Bound. Elem. 2023, 152, 14–21. [Google Scholar] [CrossRef] [Scilit]
  46. GB 50135; Standard for Design of High-Rising Structures. China Planning Press: Beijing, China, 2019.
Figure 1. Engineering information graph. (a) Distance distribution of large-span transmission lines. (b) Dimension information diagram of east crossing tower.
Applsci 16 07378 g001
Figure 2. Finite-element model.
Applsci 16 07378 g002
Figure 4. Typical vibration modes of tower-line system model.
Applsci 16 07378 g004aApplsci 16 07378 g004b
Figure 5. Axial force cloud diagram of tower-line system under deadweight.
Applsci 16 07378 g005
Figure 6. AIC and BIC criteria for AR order selection.
Applsci 16 07378 g006
Figure 7. Residual ACF and Ljung–Box test for AR(4).
Applsci 16 07378 g007
Figure 8. Wind speed time history and spectrum verification. (a) Davenport spectrum fluctuating wind speed time history. (b) Spectrum verification.
Applsci 16 07378 g008
Figure 9. The schematic diagram of segmented loading on the single tower.
Applsci 16 07378 g009
Figure 10. The schematic diagrams of segmented loading for conductors and ground wires.
Applsci 16 07378 g010
Figure 11. Schematic diagram of wind direction.
Applsci 16 07378 g011
Figure 12. Displacement response of different coherence functions.
Applsci 16 07378 g012
Figure 13. Relative difference in displacement responses between the two coherence functions.
Applsci 16 07378 g013
Figure 14. Wind vibration coefficients of a single tower along the height of the tower body.
Applsci 16 07378 g014
Figure 15. Wind vibration coefficients of a single tower along the length direction of the cross arm.
Applsci 16 07378 g015
Figure 16. Relative difference in wind vibration coefficients between the two coherence functions.
Applsci 16 07378 g016
Figure 17. Displacement response of the east crossing tower in the tower-line system.
Applsci 16 07378 g017
Figure 18. Relative difference in displacement responses between bare tower and tower-line system.
Applsci 16 07378 g018
Figure 19. Wind vibration coefficient of the east crossing tower in the tower-line system.
Applsci 16 07378 g019
Figure 20. Relative difference in wind vibration coefficients between the bare tower and the tower-line system.
Applsci 16 07378 g020
Figure 21. Comparison chart of wind vibration coefficient.
Applsci 16 07378 g021
Table 1. List of parameters for conductors and ground wires.
ParametersConductorsGround Wires
TypeJLHA1/G4A-900/240OPGW-300
Cross-sectional area/mm21142.48599.24
Outer diameter/mm44.0222.90
Elastic modulus/GPa83.1170.0
Operating tension at 10 °C/N126,12770,145
Self-weight/kg·km−14381.92205
Table 2. Tension of the 2nd span transmission line.
Tension/NEnd Tension/NMid-Span Tension/NAverage Tension/NDesign Standard Value of Tension/NDifference Value
Conductor124,310126,250125,280126,1270.67%
Ground wire68,34969,73769,04370,1451.57%
Table 3. Parameters of fluctuating wind simulated by AR method.
ParametersDavenport
Basic wind speed v ¯ 10 / m · s - 1 32
Terrain categoryB
Roughness coefficient K0.005
AR model order4
Time step/s0.1
Total duration of wind speed time series/s700
Number of frequency divisions1024
Initial frequency/Hz0.001
Frequency increment/Hz0.001
Cutoff frequency/Hz10
Disclaimer/Publisher’s Note: The statements, opinions and data contained in all publications are solely those of the individual author(s) and contributor(s) and not of MDPI and/or the editor(s). MDPI and/or the editor(s) disclaim responsibility for any injury to people or property resulting from any ideas, methods, instructions or products referred to in the content.