


Abstract
Grape pomace (GP) is the main residue of the winemaking process; it is rich in phenolics with great bioactive potential. This study applied subcritical water extraction (SWE) to GP at 120, 140, and 160 °C to fractionate it into value-added products. The extraction performed at 120 °C and 1.3 bar (E-120) was the most efficient, resulting in the highest soluble fraction yield (61 g/100 g GP) with high phenolic content (4.1 g GAE (gallic acid equivalent)/100 g extract solids) and strong antioxidant capacity (EC50: 0.79 mg extract/mg DPPH (2,2-Diphenyl-1-picrylhydrazyl)), while it inhibited the growth of Listeria innocua at 325 mg/mL. The insoluble extraction residue (38 g/100 g GP) also retained substantial phenolic content (10 g GAE/100 g), with high antioxidant activity (EC50: 1.5 mg residue/mg DPPH) and a fibre-rich composition, supporting its value as a functional ingredient. To improve handling and stability, the E-120 extract was encapsulated in maltodextrin or pectin. For both polymers, a 40% polymer ratio with respect to the extract solids yielded a stable, single-phase, glassy powder (Tg ~50 °C), with thermal stability extending up to 200 °C. Therefore, SWE constitutes an efficient and sustainable technique for obtaining functional ingredients from GP, allowing for its valorisation.
1. Introduction
The winemaking industry is one of the most productive and profitable agricultural sectors globally. According to the International Organisation of Vine and Wine (OIV), global wine production reached 225 million hectolitres in 2024, with Europe leading as the main producer, accounting for 148 million hectolitres (~66% of total production), followed by the Americas (~21%), Oceania (~6%), Africa (~4%), and Asia (~3%). Throughout the entire production chain, from grape cultivation to bottling, the winemaking sector generates substantial quantities of by-products and residues, which account for approximately 30% of the processed grapes [1,2]. The most common winemaking residues include grape stems, seeds, wine lees, and grape pomace, the quantities of which vary according to the grape cultivar and ripeness, environmental conditions, and the specific winemaking technologies applied [3]. Instead of being considered as agro-industrial waste, grape and winemaking residues are a valuable source of phenolic compounds, dietary fibre, and other bioactive metabolites with antioxidant and antimicrobial properties. The extraction and fractionation of these compounds enable their incorporation into high-value applications, such as natural preservatives, functional food ingredients, and biodegradable or active packaging materials. Converting winemaking residues or by-products into functional ingredients and materials, these strategies not only reduce the environmental impact of wine production but also promote efficient circular economy practices [4].
Grape pomace (GP) is a by-product obtained during the grape pressing step and accounts for 62% of the total waste generated during the winemaking process, followed by lees (~14%), stems (~12%), and winery sludge (~12%) [5]. GP consists of skins, seeds, stems, and pulp, comprising 15–30% of the total grape input [6,7]. The chemical composition of GP depends on the variety and origin of the grape, as well as the cultivation and processing conditions [8]. The phenolic profile of red vs. white grape pomace differs mainly due to the winemaking process (fermentation with skins in red wines vs. early separation in white wines), which determines the extent of phenolic extraction into the must, while anthocyanins present in red pomace are practically absent in white pomace.
GP is typically composed of dietary fibre (43–75%), structural carbohydrates, such as cellulose (10–30%) and hemicellulose (6–30%), and other components, including lignin (26–50%), proteins, unsaturated fatty acids, and pectic polysaccharides (3–8%) [9,10,11,12]. Likewise, GP contains high levels of polyphenols, including phenolic acids, flavonoids, and anthocyanins (in red GP). The phenolic acids include gallic, ferulic, caffeic, and p-coumaric acids, while the flavonols comprise catechin, epicatechin, epicatechin gallate, and epigallocatechin gallate. High levels of anthocyanins are present in the GP matrix, such as malvidin-3-O-glucoside, malvidin-3-(acetyl)-glucoside, and malvidin-3-(coumaroyl)-glucoside [13]. Phenolic compounds obtained from GP exhibit a wide variety of benefits, including antioxidant, antimicrobial, anti-glycation, and cytotoxic effects against tumour cells [4,14]. Additionally, they contribute to reducing the risk of developing chronic diseases, such as diabetes, as well as inflammatory and cardiovascular diseases [15]. Therefore, the recovery of active phenolic-rich extracts from GP represents a valorisation strategy for this waste, with wide potential application in the food, pharmaceutical, and cosmetic industries.
Subcritical water extraction (SWE) has emerged as a sustainable and efficient alternative to conventional extraction systems, which often employ organic solvents and prolonged heating that promote the degradation of target compounds and increase environmental and economic costs [13,16]. SWE operates by heating water above its boiling point while applying sufficient pressure to maintain it in the liquid state, specifically between 100 and 374 °C and between 1 and 22.1 MPa, respectively [17]. Under these conditions, water exhibits reduced polarity, viscosity, and surface tension, together with an increased ionisation constant, which collectively enhance mass transfer, promote cell wall disruption and enable the solubilisation of less polar compounds, such as phenolics [7,18]. However, some thermolabile compounds, such as anthocyanins, could be degraded at the high temperature applied. Compared to organic solvent extraction or microwave- and ultrasound-assisted techniques, SWE can yield higher phenolic content and antioxidant capacity while avoiding toxic solvents and minimising environmental impact [19,20]. Previous studies have demonstrated that the SWE process enabled clear fractionation of the biomass, with hemicellulose and other polymers partially hydrolysed and solubilised in the liquid phase, and cellulose and lignin retained in the solid residue, confirming its selectivity and biomass valorisation potential. Pedras et al. [7,21] demonstrated the effectiveness of SWE in obtaining extracts rich in carbohydrates and phenols, as well as solid residues rich in cellulose and lignin, from GP obtained from red and white wine production, using a semi-continuous reactor at 100 bar and temperature ramps up to 190 °C. The extracts obtained at the highest temperature range (100–190 °C) exhibited lower phenolic content and bioactive properties, while hydrolysed carbohydrates increased in the liquid phase as the temperature rose. Although these studies demonstrated the potential of SWE for the recovery of phenolic compounds from GP, the integrated utilisation of both the soluble extract and the insoluble residue have received comparatively less attention, despite its potential to maximise biomass valorisation.
The aim of this work was to fractionate GP by applying SWE at a constant temperature to obtain bioactive extracts and active, fibre-rich insoluble fractions, optimising the extraction temperature to maximise the phenolic content while avoiding thermal degradation. Three extraction temperatures (120, 140, and 160 °C) were tested, and both extracts and solid residues were characterised as to their respective mass yield, phenolic content, anthocyanin content and antioxidant activity. In a second stage, the best extracts with the highest phenolic content were encapsulated into maltodextrin or pectin matrices to produce more stable powdered formulations, ensuring a glassy state, powder flowability, and enhanced thermal stability. To this end, different polymer:extract ratios were tested. This approach enables the sustainable fractionation of GP for the development of functional ingredients.
2. Materials and Methods
2.1. Materials
Red grape pomace (GP) produced from the red-wine-making process, using the Bobal grape variety (2024 vintage), from the Requena region (Spain) (39.4896° N, 1.1003° W), was used in the study. The GP samples were stored in sealed plastic bags and frozen at −18 °C until further use. Folin–Ciocalteu reagent (2 N), 2,2-Diphenyl-1-picrylhydrazyl (DPPH), ethanol (99.0%), and methanol (>99.9%) were purchased from Sigma-Aldrich (St. Louis, MO, USA). Sodium carbonate (Na2CO3), diphosphorus pentoxide (P2O5, 98%) and hydrochloric acid (HCl, 37%) were supplied by Panreac Química S.L.U (Castellar del Vallés, Barcelona, Spain). Pectin (E440) was obtained from Laguilhoat (Fuenlabrada, Madrid, Spain). Maltodextrin 12 DE was supplied by Sosa Ingredients S.L.U. (Navarcles, Barcelona, Spain). For microbiological analyses, trypticasein soy broth (TSB) was purchased from Labkem (Barcelona, Spain). Bacteriological agar was obtained from Scharlab (Barcelona, Spain). The strains of Listeria innocua (CECT 910) and Escherichia coli (CECT 101) were obtained from the Spanish Collection of Type Cultures (CECT, University of Valencia, Valencia, Spain).
2.2. Plant Material Preparation
The partially frozen GP were ground in a Thermomix TM-5 homogeniser (Vorwerk Spain M.S.L., S.C., Madrid, Spain) at 10,200 rpm for 6 min until a homogeneous paste was obtained. Afterwards, the initial moisture content of GP was determined by drying samples in a forced-air oven at 105 °C for 24 h until constant weight. Prior to SWE extraction, the homogenised GP paste was diluted with water to achieve a 1:10 (w/v) solids-to-water ratio, based on the GP moisture content (60 g water/100 g GP).
2.3. Subcritical Water Extraction
The GP liquid extracts (E) and solid residues (R) were obtained by SWE treatments of diluted GP, using a pressure reactor (model 1-T-A-P-CE, 5 L capacity, Amar Equipments PVT. LTD, Mumbai, India). Three extraction conditions were applied: 120 °C and 1.3 bar; 140 °C and 3.4 bar; and 160 °C and 6.3 bar, all at 150 rpm for 30 min. After the SWE treatment, the liquid extracts were separated by vacuum filtration of the plant dispersion using a qualitative filter (Filter-Lab S.A., Catalonia, Spain) and then freeze-dried (Telstar, model Lyoquest-55) at −65 °C and 0.8 mbar for 72 h. The insoluble residues obtained after filtration were washed with distilled water and then vacuum-dried for 48 h at 60 °C. The yield of the extraction residues was determined as the weight of dry residue per 100 g of GP solids. The yield of the extracts (g extracted solids/100 g of GP solids) was determined by analysing the solids-to-water ratio in the extracts (by drying in a vacuum oven at 60 °C until constant weight) and multiplying this ratio by the total water content in the reactor.
2.4. Phenolic Extraction in GP and SWE Extraction Residues
In order to determine the total phenolic content of the GP and the remaining phenolics in the SWE residues, an extraction process was optimised, using water or methanol–water (60:40 (v/v)) mixtures, at a 1:10 solids-to-solvent ratio, based on previous studies [22]. To promote the extraction yield, an ultrasound-assisted process at low temperature was applied. To this end, a probe-based high-intensity ultrasonic homogeniser (Vibra CellTM VCX750, Sonics & Material, Inc., Newtown, CT, USA), applying a frequency of 20 kHz, power of 750 W and sonication amplitude of 40%, was used. Four extraction treatments were performed, with extraction times of 30 and 60 min for the water and water–methanol solvents, respectively. For this, 10 g of wet GP was mixed with 34 mL of solvent and sonicated continuously throughout the extraction time. The sample was kept in an ice bath to prevent temperature increase (~25 °C). Afterwards, the obtained extracts were vacuum-filtered (Filter-Lab S.A., Catalonia, Spain) and characterised as to their total mass yield, total phenolic content, anthocyanin content, and antioxidant capacity. The process that yielded a higher phenolic content was also applied to the extraction residues, and the extracts obtained were also characterised in the same terms.
2.5. Analysis of Functional Properties
2.5.1. Total Phenolic Content
The total polyphenol content (TPC) of the samples was determined using the Folin–Ciocalteu method, as previously described [23]. A volume of 0.5 mL of extract and 6 mL of distilled water were mixed in a glass tube, followed by the addition of 0.5 mL of Folin reagent (2 N). After 1 min, 1.5 mL of sodium carbonate solution (20%, w/v) was added; the mixture was brought up to 10 mL with distilled water and incubated for 2 h at room temperature in a dark place. The absorbance was measured spectrophotometrically at 750 nm using a UV–vis spectrophotometer (Evolution 201, Thermo Scientific, Waltham, MA, USA) to calculate the concentration of gallic acid equivalent (GAE). To this end, gallic acid aqueous solutions were used to obtain the calibration curve. The TPC was expressed as GAE per 100 g of dried sample. All measurements were performed in triplicate.
2.5.2. Anthocyanin Content
The anthocyanin content (AC) was quantified in the liquid extracts using the Puissant–Léon methodology [24]. A volume of 0.2 mL was mixed with 3.8 mL of 1 M hydrochloric acid solution and left to stand for 3 h. The absorbance was then measured at 520 nm using 1 M HCl as a blank. The AC was determined as malvidin-3-glucoside using Equation (1), where A is the absorbance at 520 nm, FD is the dilution factor (20), and 20 corresponds to the specific absorbance of a 1% (w/v) solution of malvidin-3-glucoside.
2.5.3. Antioxidant Capacity
The antioxidant capacity of the samples was analysed using the free radical 2,2-diphenyl-1-picrylhydrazyl (DPPH·) assay [25]. Different amounts of liquid extract were mixed with the DPPH methanolic stock solution (0.06 mM, initial absorbance at 515 nm of 0.7 ± 0.02) to a final volume of 4 mL, the extract concentrations being in the 6–70 µg extract/mL range. The initial and final (after 12 h reaction time) concentrations of DPPH were determined using the calibration equation (R2: 0.9992) at 515 nm (). The EC50 parameter was determined as the amount of antioxidant required to reduce the initial DPPH concentration to 50% when the reaction reached stability. This value was obtained graphically by plotting the remaining DPPH percentage (Equation (2)) as a function of the ratio of mg of extract solids/mg DPPH. A lower EC50 value indicates greater antiradical power of the extract and, therefore, greater antioxidant capacity.
where [DPPH]t is the DDPH concentration upon reaching stability, and [DPPH]t=0 is the initial DPPH concentration.
2.5.4. Antibacterial Activity
The antibacterial activity of the obtained extract with the highest phenolic content (E-120) was also analysed in duplicate using standard 96-well microtitre plates [26]. Prior to analysis, stock solutions of Listeria innocua and Escherichia coli were activated by transferring quantities of each bacterial strain (previously stored at −20 °C) to 10 mL of TSB, followed by incubation at 37 °C for 24 h. A working bacterial suspension was then prepared by transferring 10 μL of this incubated culture to 10 mL of TSB, followed by further incubation under the same conditions. Afterwards, this suspension was serially diluted in TSB until an estimated concentration of 105 CFU/mL was reached, which was confirmed by plate count after seeding 100 μL in TSA (mixture consisting of bacteriological agar and TSB at a 1:1 w/w ratio) and incubating at 37 °C for 24 h. For each bacterium, a volume of 100 μL of the 105 CFU/mL suspension was transferred to each well with different volumes of extract solution. Subsequently, each well was filled with TSB to a final volume of 200 μL, with the concentrations of the extract being known. The plates were then incubated at 37 °C for 24 h. The extract concentrations evaluated ranged from 15 to 325 mg dry extract/mL, with a 15 mg/mL increase in each subsequent well. Three control wells with broth were included in the plates: inoculated wells without extract (negative) and non-inoculated wells with or without extract (to detect potential contaminations). After the incubation time, the final bacterial counts were determined by seeding 100 μL of the contents from each well onto TSA plates, followed by further incubation at 37 °C for 24 h. Afterwards, the colony counts were performed for each evaluated condition. Each test was carried in duplicate for each bacterium.
2.6. Encapsulation of the Most Active SWE Extract
To ensure the glassy state of the extract at room temperature, as well as its thermal stability and controlled antioxidant and antibacterial performance, the extract with the highest phenolic content (E-120) was encapsulated by freeze-drying in polymeric matrices of maltodextrin 12 DE (MD) or pectin (P). The polymer–extract solids ratio was optimised to minimise the dilution effect of the bioactive components. In this regard, the minimum amount of polymer necessary to form a homogeneous amorphous matrix in a glassy state at room temperature was sought. Thus, aqueous extract with an initial concentration of 5.5 g of solids/100 g was used to prepare solutions for encapsulation, adding different proportions of maltodextrin (1, 5, 10, 20, 30, 40, 50 and 60 g of polymer per 100 g of extract solids) or pectin (only up to 40 g of polymer per 100 g of extract solids, due to its lower solubility). The mixtures were introduced in closed bottles with a nitrogen atmosphere to prevent oxidation and were kept under magnetic stirring and darkness until they were completely dissolved (~16 h). Afterwards, the obtained solutions were placed in a freezer at −40 °C, and freeze-dried using a freeze dryer (Telstar, model LyoQuest-55) at −60 °C and 0.8 mbar for 72 h. The powdered samples were stored in a desiccator with P2O5 until analysis, assuming a theoretical relative humidity of 0%. Table 1 shows the mass fractions of the polymer and extract solids in the solid blend for the different proportions used.
Table 1.
Mass fraction of the polymer (xPolymer: maltodextrin (MD) or pectin (P)), and extract solids (xExtract) in the different encapsulated extracts with maltodextrin or pectin.
2.7. Characterisation of the Encapsulated Extracts
2.7.1. Fourier-Transformed Infrared Spectroscopy (FTIR)
FTIR of the powdered extracts was performed using a spectrometer (Agilent Cary 630 FTIR, Agilent Technologies, Santa Clara, CA, USA) equipped with an attenuated total reflectance accessory (with diamond crystal). For each sample, the FTIR spectra were obtained in the wavelength range of 4000–650 cm−1 at a resolution of 6 cm−1 and with 128 scans for each spectrum. The FTIR spectra were obtained in triplicate for each formulation.
2.7.2. Thermal Behaviour
The thermal stability of each polymer–extract mixture was evaluated by thermogravimetric analysis (TGA). For this, 3–5 mg of the conditioned samples (P2O5 for 1 week) was weighed in alumina crucibles. The samples were then heated from 25 to 900 °C at a heating rate of 10 °C/min under a nitrogen atmosphere with a flow rate of 10 mL/min using a thermal analyser (TGA 1 Stare System, Mettler-Toledo GmbH, Greifensee, Switzerland). The thermal stability of the samples was evaluated by analysing the TGA and their first derivative (DTGA) curves. All measurements were performed in duplicate.
The glass transition of the polymer–extract blends was evaluated by differential scanning calorimetry (DSC) using a calorimeter (Mettler-Toledo GmbH, Switzerland). Approximately 5–10 mg of dried, conditioned samples (P2O5 for 1 week) was sealed in aluminium crucibles. The samples were subjected to a first heating cycle from −30 to 160 °C, followed by cooling from 160 to −30 °C at a cooling rate of 10 °C/min, annealing for 2 min at −30 °C, and a second heating cycle from −30 to 160 °C, both with a heating rate of 10 °C/min. The analyses were performed under a continuous nitrogen flow of 10 mL/min. All determinations were performed in duplicate for each formulation. The thermograms of the samples were analysed to determine their respective glass transition temperatures (Tg).
2.8. Statistical Analysis
The experimental data were subjected to analysis of variance (ANOVA) and Tukey’s studentised range HSD (honestly significant difference) tests using Minitab Statistical Software (version 17). The analyses were conducted with a significance level of 5% (α).
3. Results and Discussion
3.1. Phenolic and Anthocyanin Content of GP
The low-temperature extraction of phenolics from GP using different solvents and extraction times yielded the values shown in Table 2. The mass yields of extraction, and especially the total phenolic content (expressed as gallic acid equivalent, GAE) of the extracts, were higher in those obtained with water–methanol mixtures than in pure water, as also reported by other authors [22]. However, the extraction time did not have a notable effect, as in water, an even lower yield of phenolics was obtained after 60 min of extraction than after 30 min. This could be attributed to the degradation of some compounds at longer times under these extraction conditions. This was especially remarkable for anthocyanins that are highly sensitive to oxidation [27]. In contrast, the methanol–water mixture slightly promoted the extraction of phenolic compounds and anthocyanins after 30 min, although the differences in their extract content (TPC1 and AC1 in Table 2) between 30 and 60 min were not significant. Therefore, 30 min extraction with methanol–water (60:40) could be considered an optimal extraction process for obtaining total phenolic and anthocyanin contents from the GP, which represented 7.9 and 0.042 g per 100 g of GP solids, respectively. This extract also showed the greatest antioxidant activity (EC50: 0.69 mg of dried extract/mg DPPH), near the values of typical antioxidants, such as ascorbic acid (EC50: 0.12 mg/mg DPPH) or α-tocopherol (0.26 mg/mg DPPH) [25]. This reflects the high antioxidant power of the GP phenolic compounds and their potential as an active ingredient for use in food, pharmaceuticals, or cosmetics.
Table 2.
Mass yield, total phenolic content (TPC1 and TPC2), anthocyanin content (AC1 and AC2), and antioxidant capacity of the GP extracts obtained at low temperature, using ultrasound and different solvents (water or water:methanol), and times (30 and 60 min) (mean ± standard deviation).
3.2. GP Fractionation by Subcritical Water Extraction
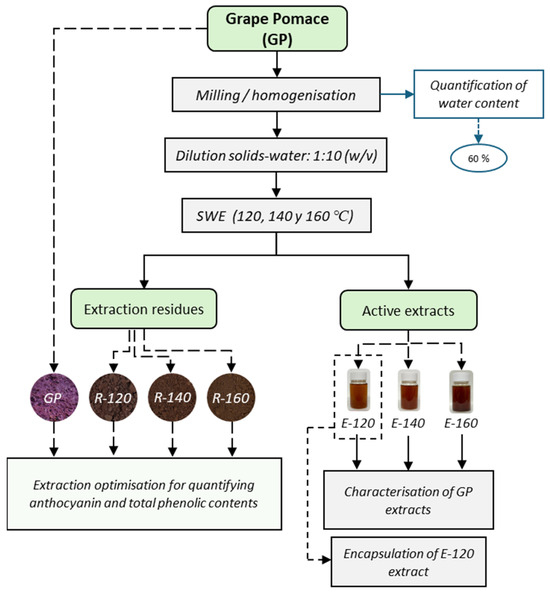
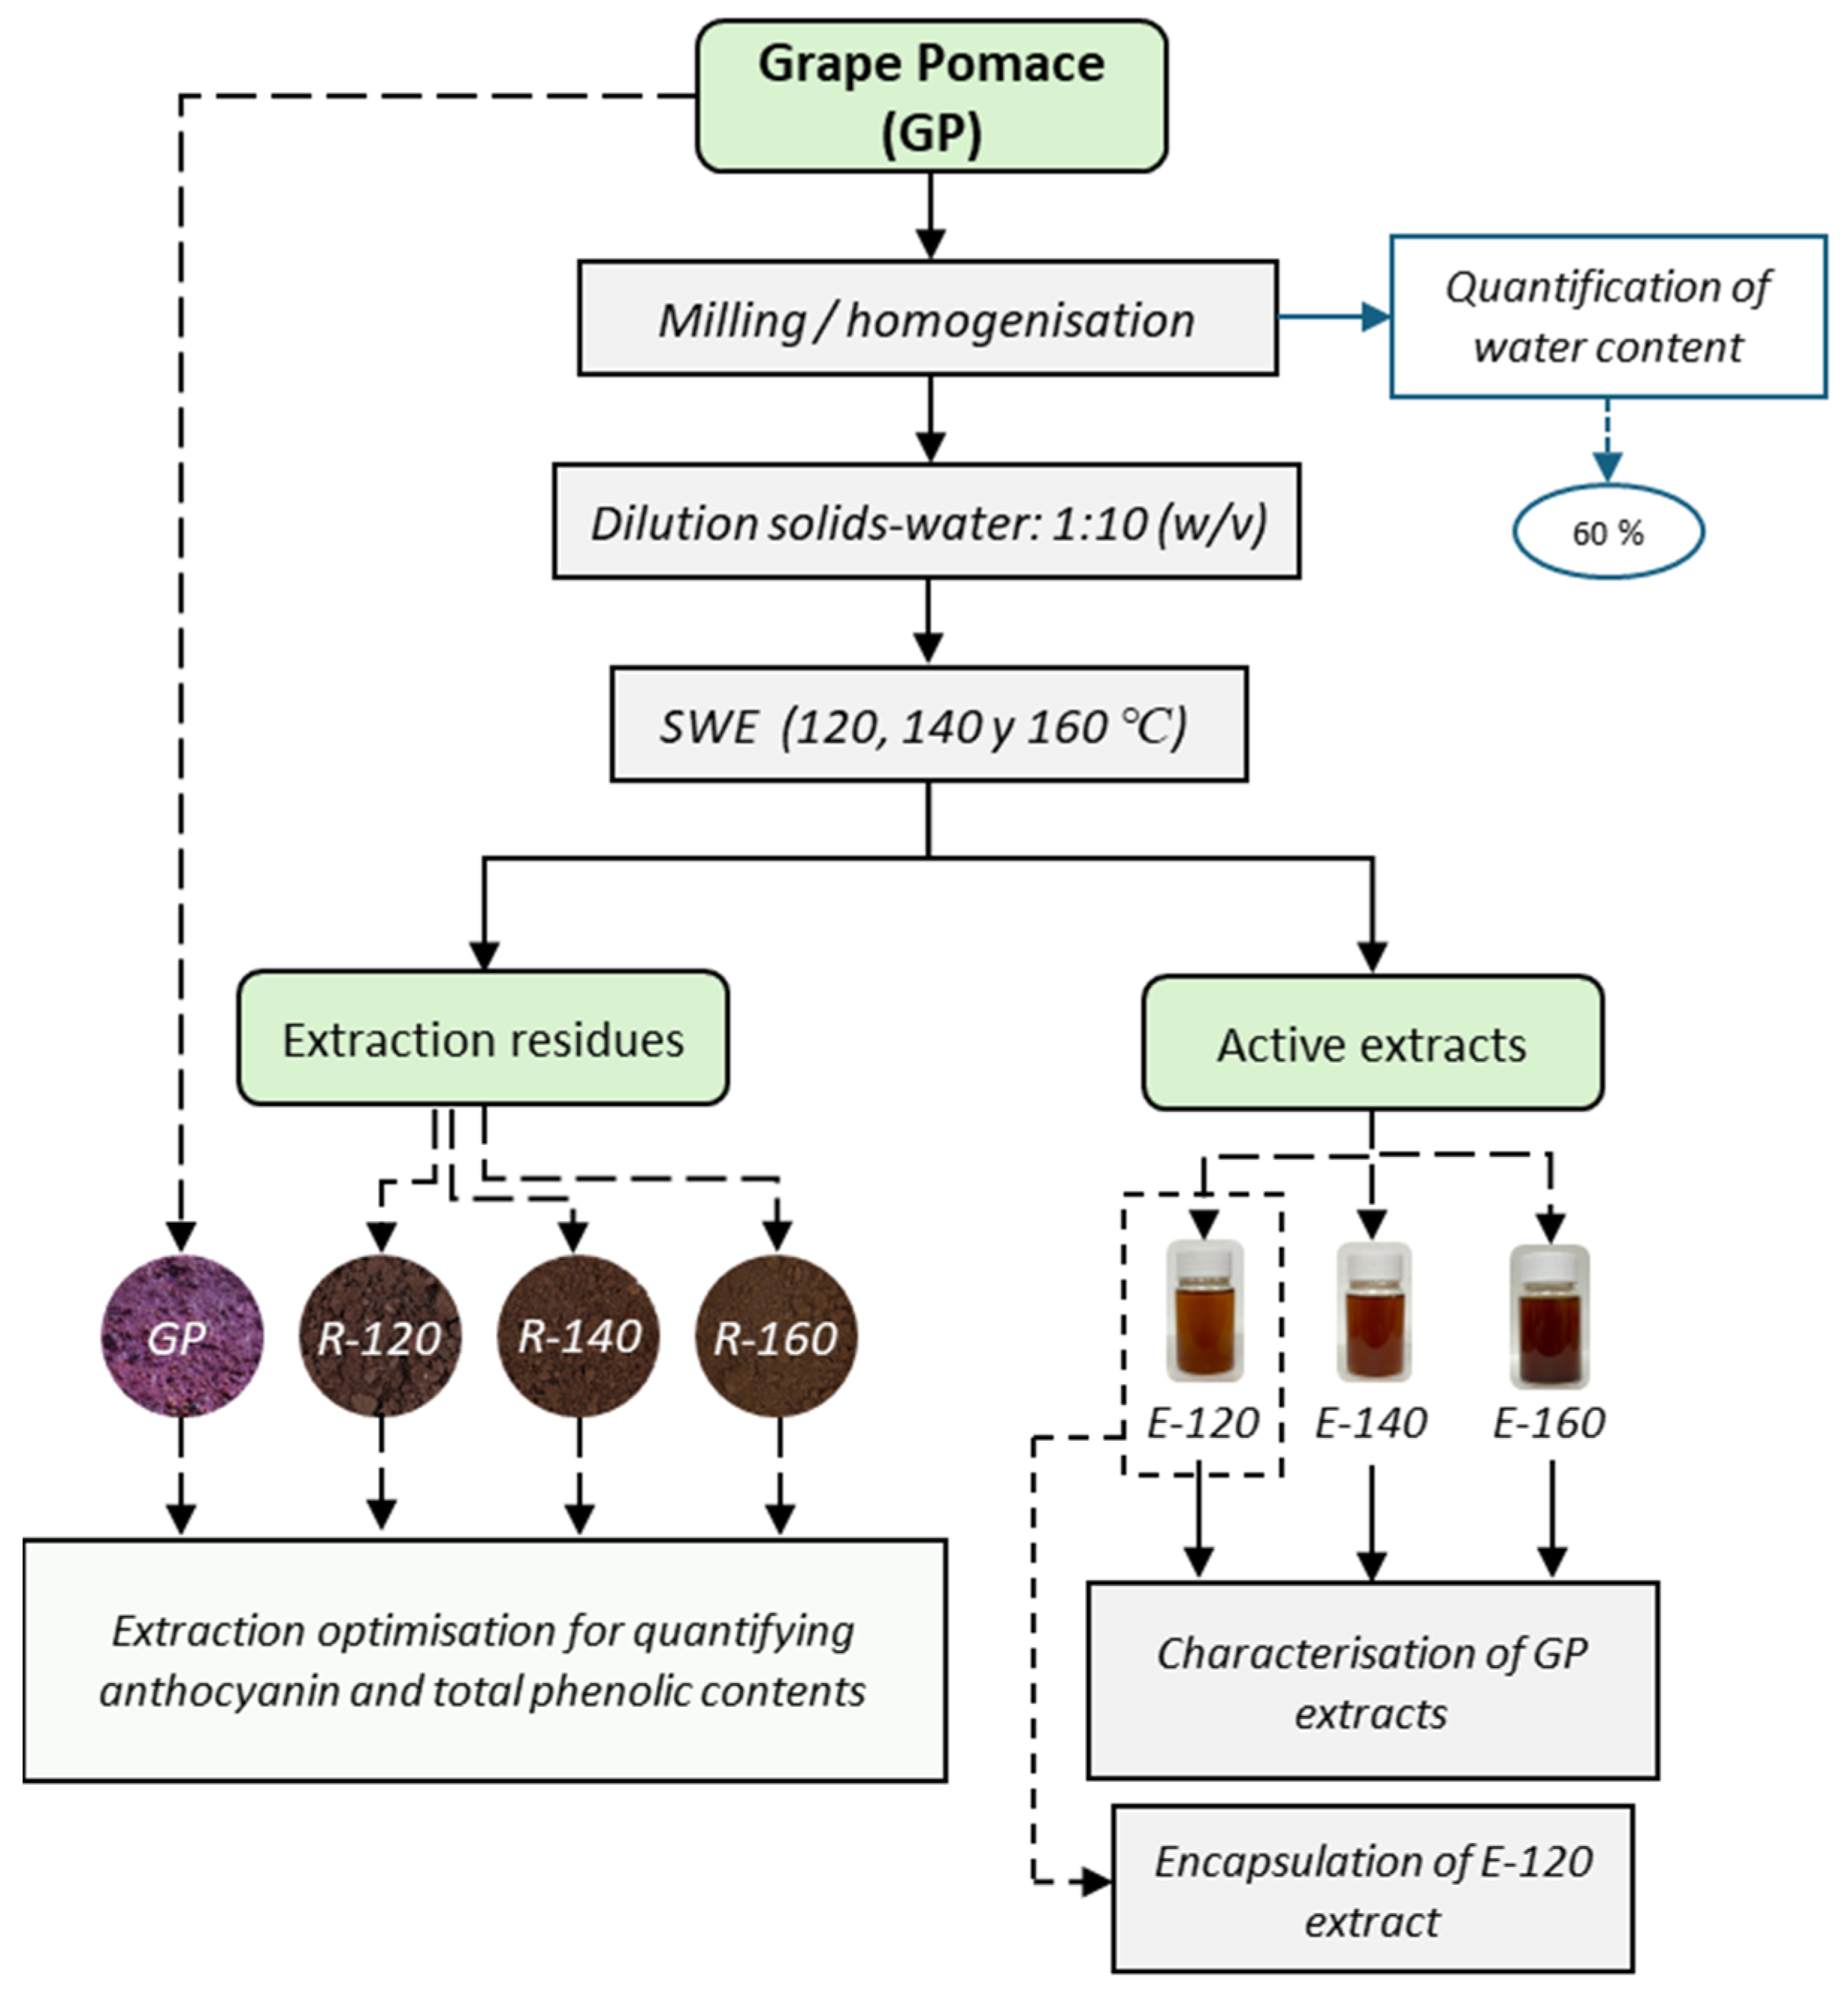
Figure 1 shows the flowchart of the process applied to GP for fractionation, obtaining active extracts and solid residues by SWE. It can be observed that the extracts and residues obtained after the extraction process showed a brownish appearance as the extraction temperature increased, as also reported by other authors for different plant matrices [28]. This can be attributed to non-enzymatic browning reactions that occur in the reactor, such as sugar caramelisation and Maillard reactions, which are favoured by higher extraction temperatures [29,30].
Figure 1.
Flowchart of the GP fractionation by SWE at different temperatures (120, 140, and 160 °C), obtaining extracts (E-120, E-140, and E-160) and extraction residues (R-120, R-140, and R-160).
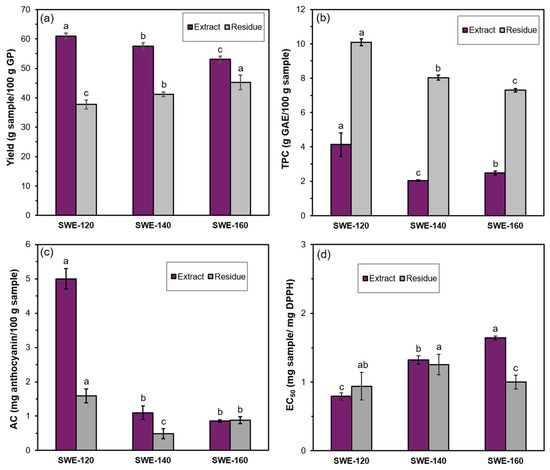
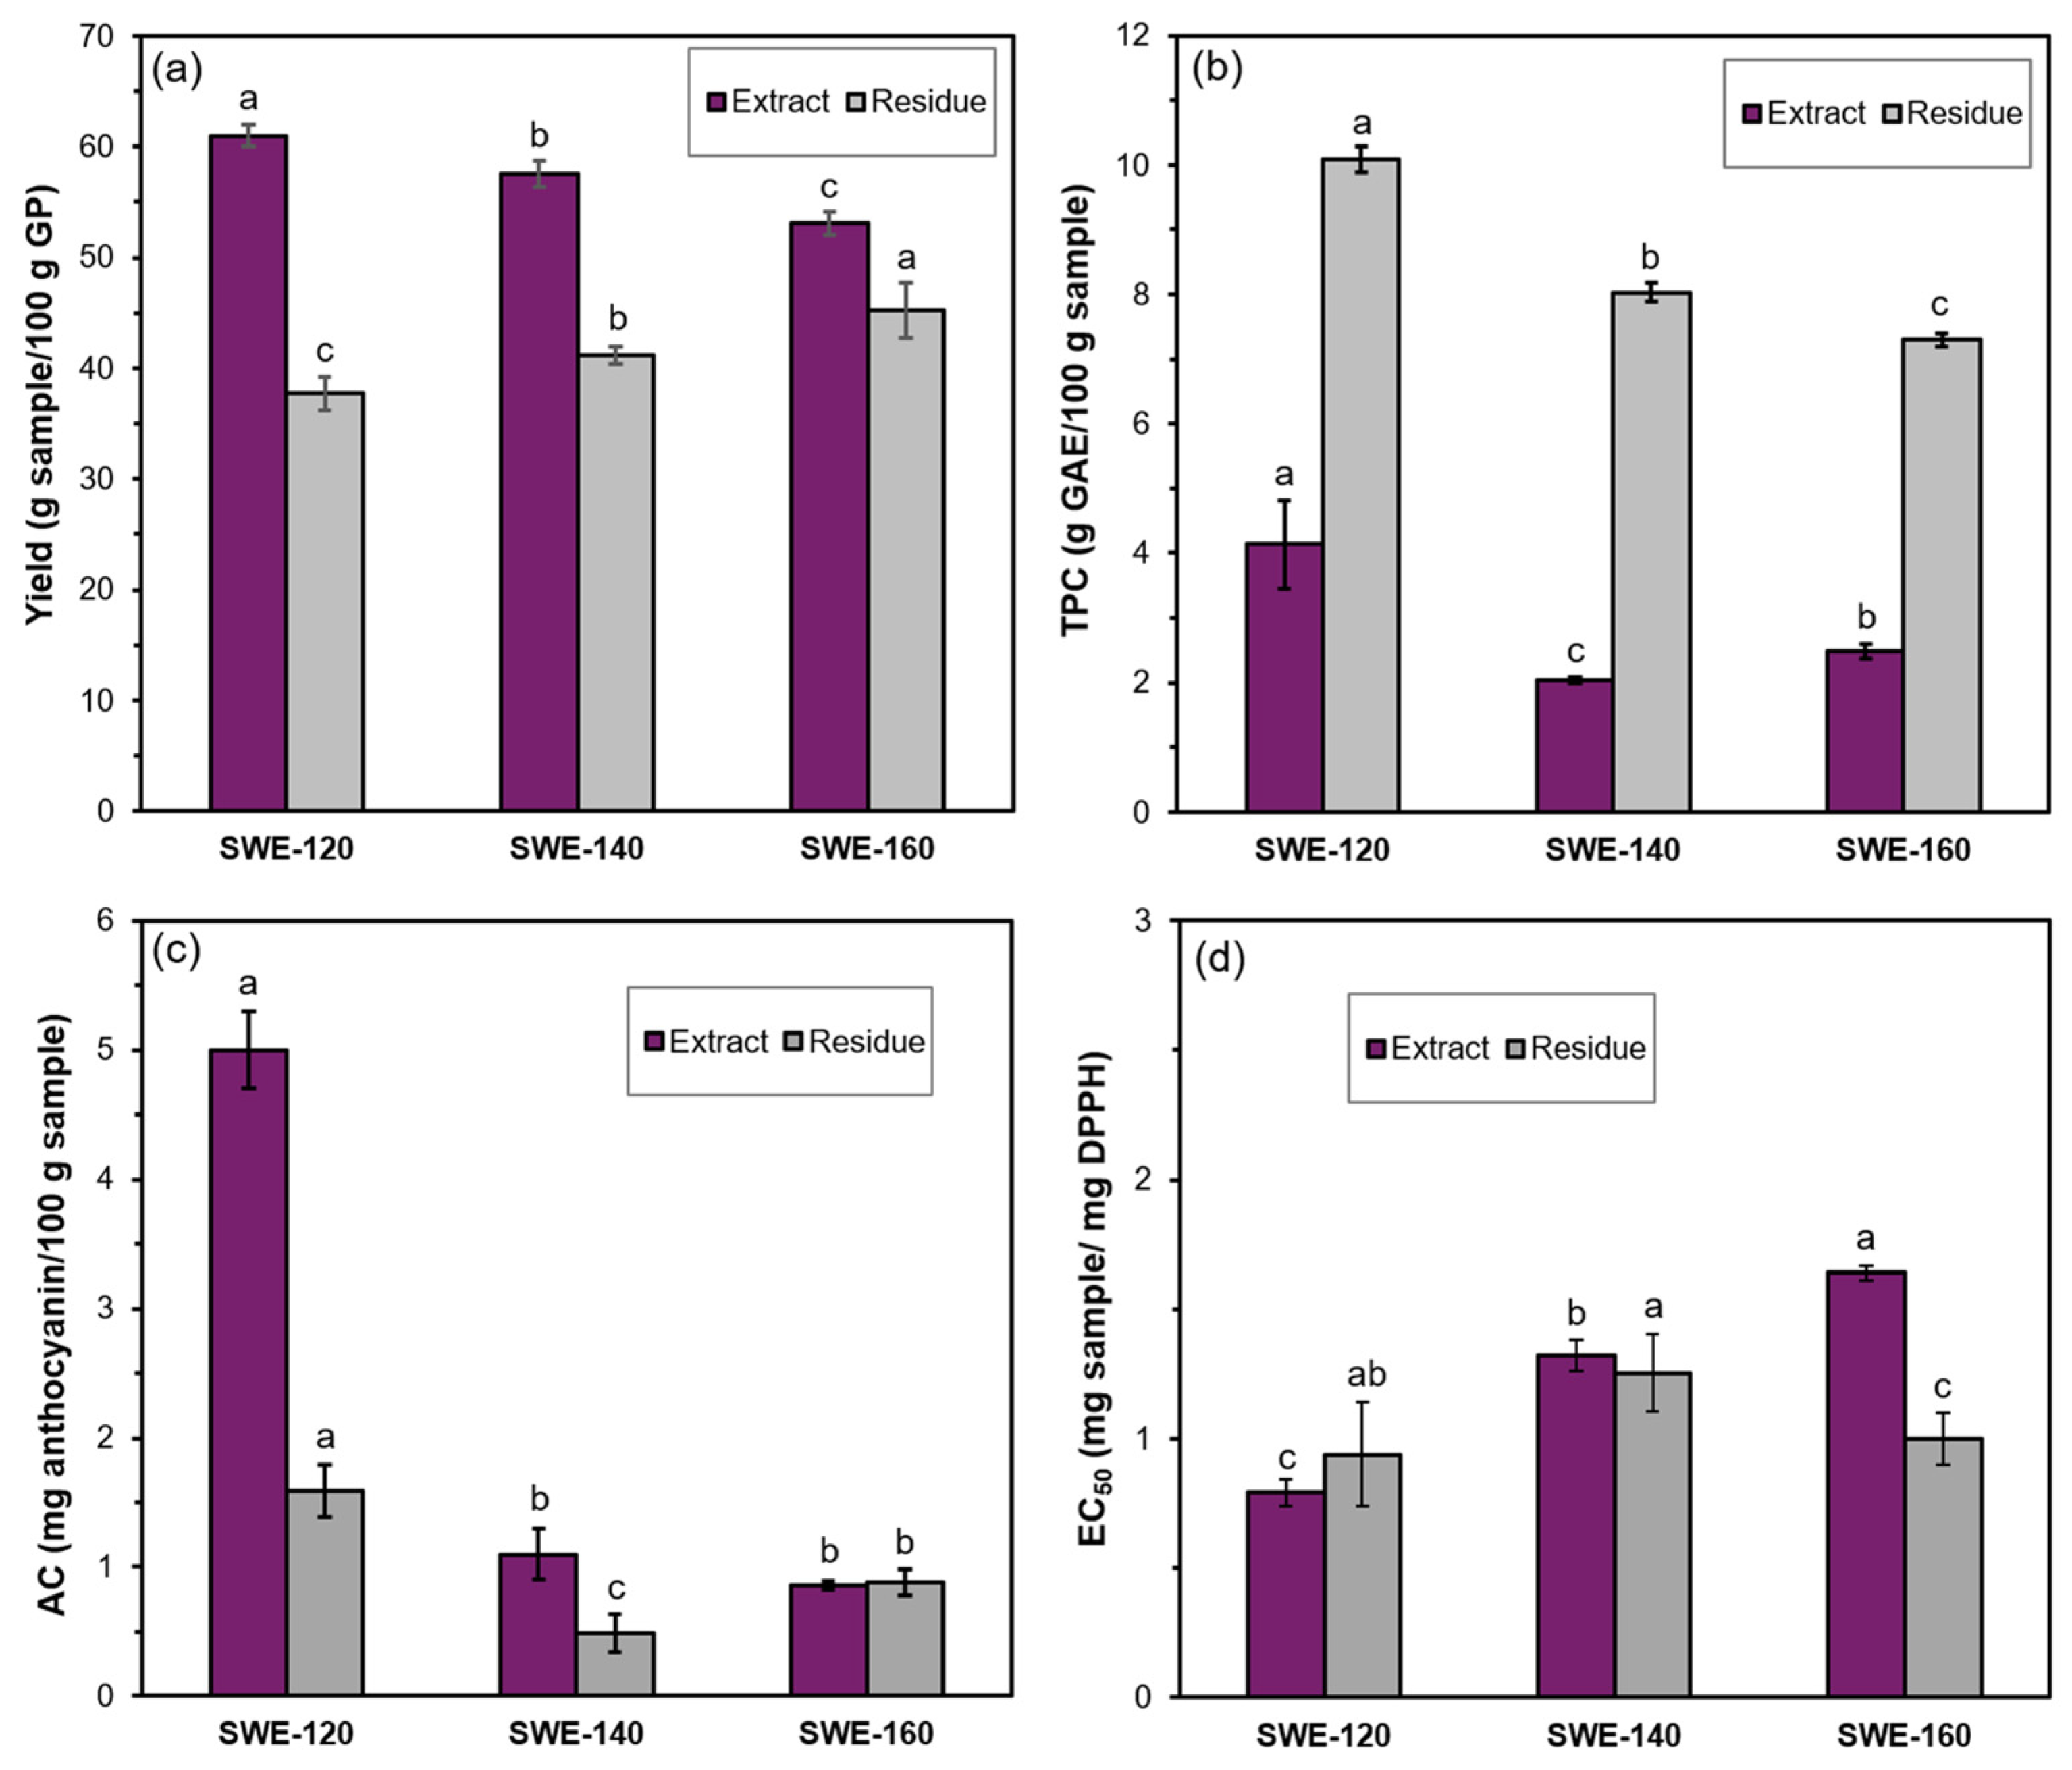
Figure 2 shows the mass yield of the extracts and the solid residues obtained at each temperature. A high extraction yield was achieved for all subcritical conditions, with 55–60% of the GP solids being solubilised. Nonetheless, the extraction yield decreased when the temperature rose from 120 °C to 160 °C. The yield of the extraction residue consistently increased when the temperature rose, achieving approximately 98% mass balance in all cases. This suggests that within the applied temperature range, no significant losses of volatile compounds, such as formic or acetic acids, occurred due to hydrolysis promoted by SWE. As reported by other authors, soluble carbohydrates (free sugars and oligomers from hemicellulose or pectin), minerals and phenols would be present in the extracts, whereas structural components, such as cellulose and lignin, will be enriched in the solid residues [10,21].
Figure 2.
Mass yield (a), total phenolic content (TPC) (b), anthocyanin content (AC) (c), and antioxidant capacity (EC50) (d) of the GP extracts and solid residues obtained by SWE at 120, 140 and 160 °C (mean ± standard deviation). Different letters in the same column indicate a significant difference between the samples (extract or residue) due to the process temperature.
Figure 2 also shows the total content of phenols (TPC), anthocyanin content (AC), and antioxidant activity (EC50) of both SWE extracts and extraction residues, reported per mass unit of each sample. The values for the residues were deduced from the analysis of their ultrasound-assisted extracts, whose respective extraction yield, TPC, AC, and EC50 values are shown in Table 3 (reported per mass unit of extract and GP solids). As expected, these extraction yields were lower than those obtained from the GP raw material, due to the exhaustion caused by the previous SWE. Nevertheless, these were 23–24% with respect to the GP solids, indicating that a substantial fraction of the residue was still solubilised in the methanol–water mixture when ultrasound was applied. Moreover, the phenolic content of the SWE residues was very high, indicating a significant retention of phenolic compounds within the solid matrix after the SWE process.
Table 3.
Yield, phenolic content and antioxidant capacity of the extracts obtained from the different SWE residues by applying ultrasound at 25 °C with a methanolic mixture for 30 min (mean ± standard deviation).
The TPC values of SWE extracts and solid residues, reported per mass unit of sample (Figure 2), reflected the phenolic richness of each fraction. Increasing the SWE extraction temperature did not enhance phenolic compound extraction from GP, but it reduced the TPC of both extracts and extraction residues. This suggests heat-induced degradation of these compounds, which affects both the liquid phase and the plant matrix inside the reactor. The highest amount of phenolics was extracted at 120 °C (4.1 g/100 g of extract solids), but considering the extraction yield, this TPC represented 2.6% of the total solids of the GP. This content was similar to that reported by Aliakbarian et al. (2012) [31] for SWE of GP from the Italian Croatina cultivar in the same temperature range. Nevertheless, the TPC values of the SWE extracts were lower than those found by Drosou et al. [32] for GP extracts obtained by different methods (Soxhlet, microwave, and ultrasound-assisted extraction). This must be attributed to the mass yield obtained with SWE, which was higher than that obtained with other methods, suggesting that the phenolic compounds were more diluted in the SWE extracts. Xu et al. (2016) [33] also obtained higher phenolic content in the GP extracts from different varieties obtained with 80% acetone in water, but the extract mass yield was also lower. Therefore, SWE greatly promotes the extraction of phenols, but they are diluted in the extracts due to the high carbohydrate content.
The decrease in phenol content of the extracts at high temperature was also reported by Pedras et al. [7,21] when a continuous SWE process, with different temperature ramps and a water flow rate of 5–10 mL/min, was applied to GP from red and white wine. The maximum phenolic content was obtained in the extracts collected between 50 and 100 °C, whereas the maximum carbohydrate extraction occurred between 100 and 190 °C. In this continuous process, both temperature and time defined the extraction yield of the different components. The results obtained at a constant temperature indicated that the extractive potential of subcritical water for GP compounds, especially phenols, decreased between 120 °C and 160 °C.
The TPC values of the extracts showed low correlation with their EC50 values (r = −0.833), with EC50 values lower than those expected from the phenolic content at 160 °C. This could indicate that the neo-formation of compounds resulting from the sugar caramelisation or Maillard reactions also contributes to the antioxidant capacity of the extracts. These neo-formed compounds also exhibit antioxidant properties, as reported by other authors for model solutions with sugars and amino acids [29,30], and have been observed in the SWE extracts of other plant matrices [31,34].
As shown in Figure 2, the thermal degradation of anthocyanins greatly affected their content in both SWE extracts and residues. The E-120 extract also exhibited higher anthocyanin content and lower EC50 values (p < 0.05). The remarkable reduction in anthocyanin content as the extraction temperature rose could be explained by the high thermal sensitivity of these pigments, which undergo degradation during heat-intensive processes commonly used in food systems [35]. In fact, the AC values of the ultrasound-assisted GP extract (Table 2) were substantially higher than those reached in the SWE extracts (20–45 vs. 3.1–0.4 mg/100 g GP solids). This indicates that the anthocyanins present in the GP undergo extensive thermal degradation during SWE. The mechanisms associated with the degradation of these compounds include glycosylation, nucleophilic attack by water, cleavage of the molecular structure, and polymerisation, contributing to pigment loss and formation of brown pigments and polymeric fractions, all of which affect the colour intensity of the product [36].
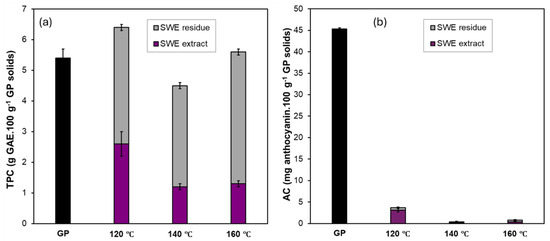
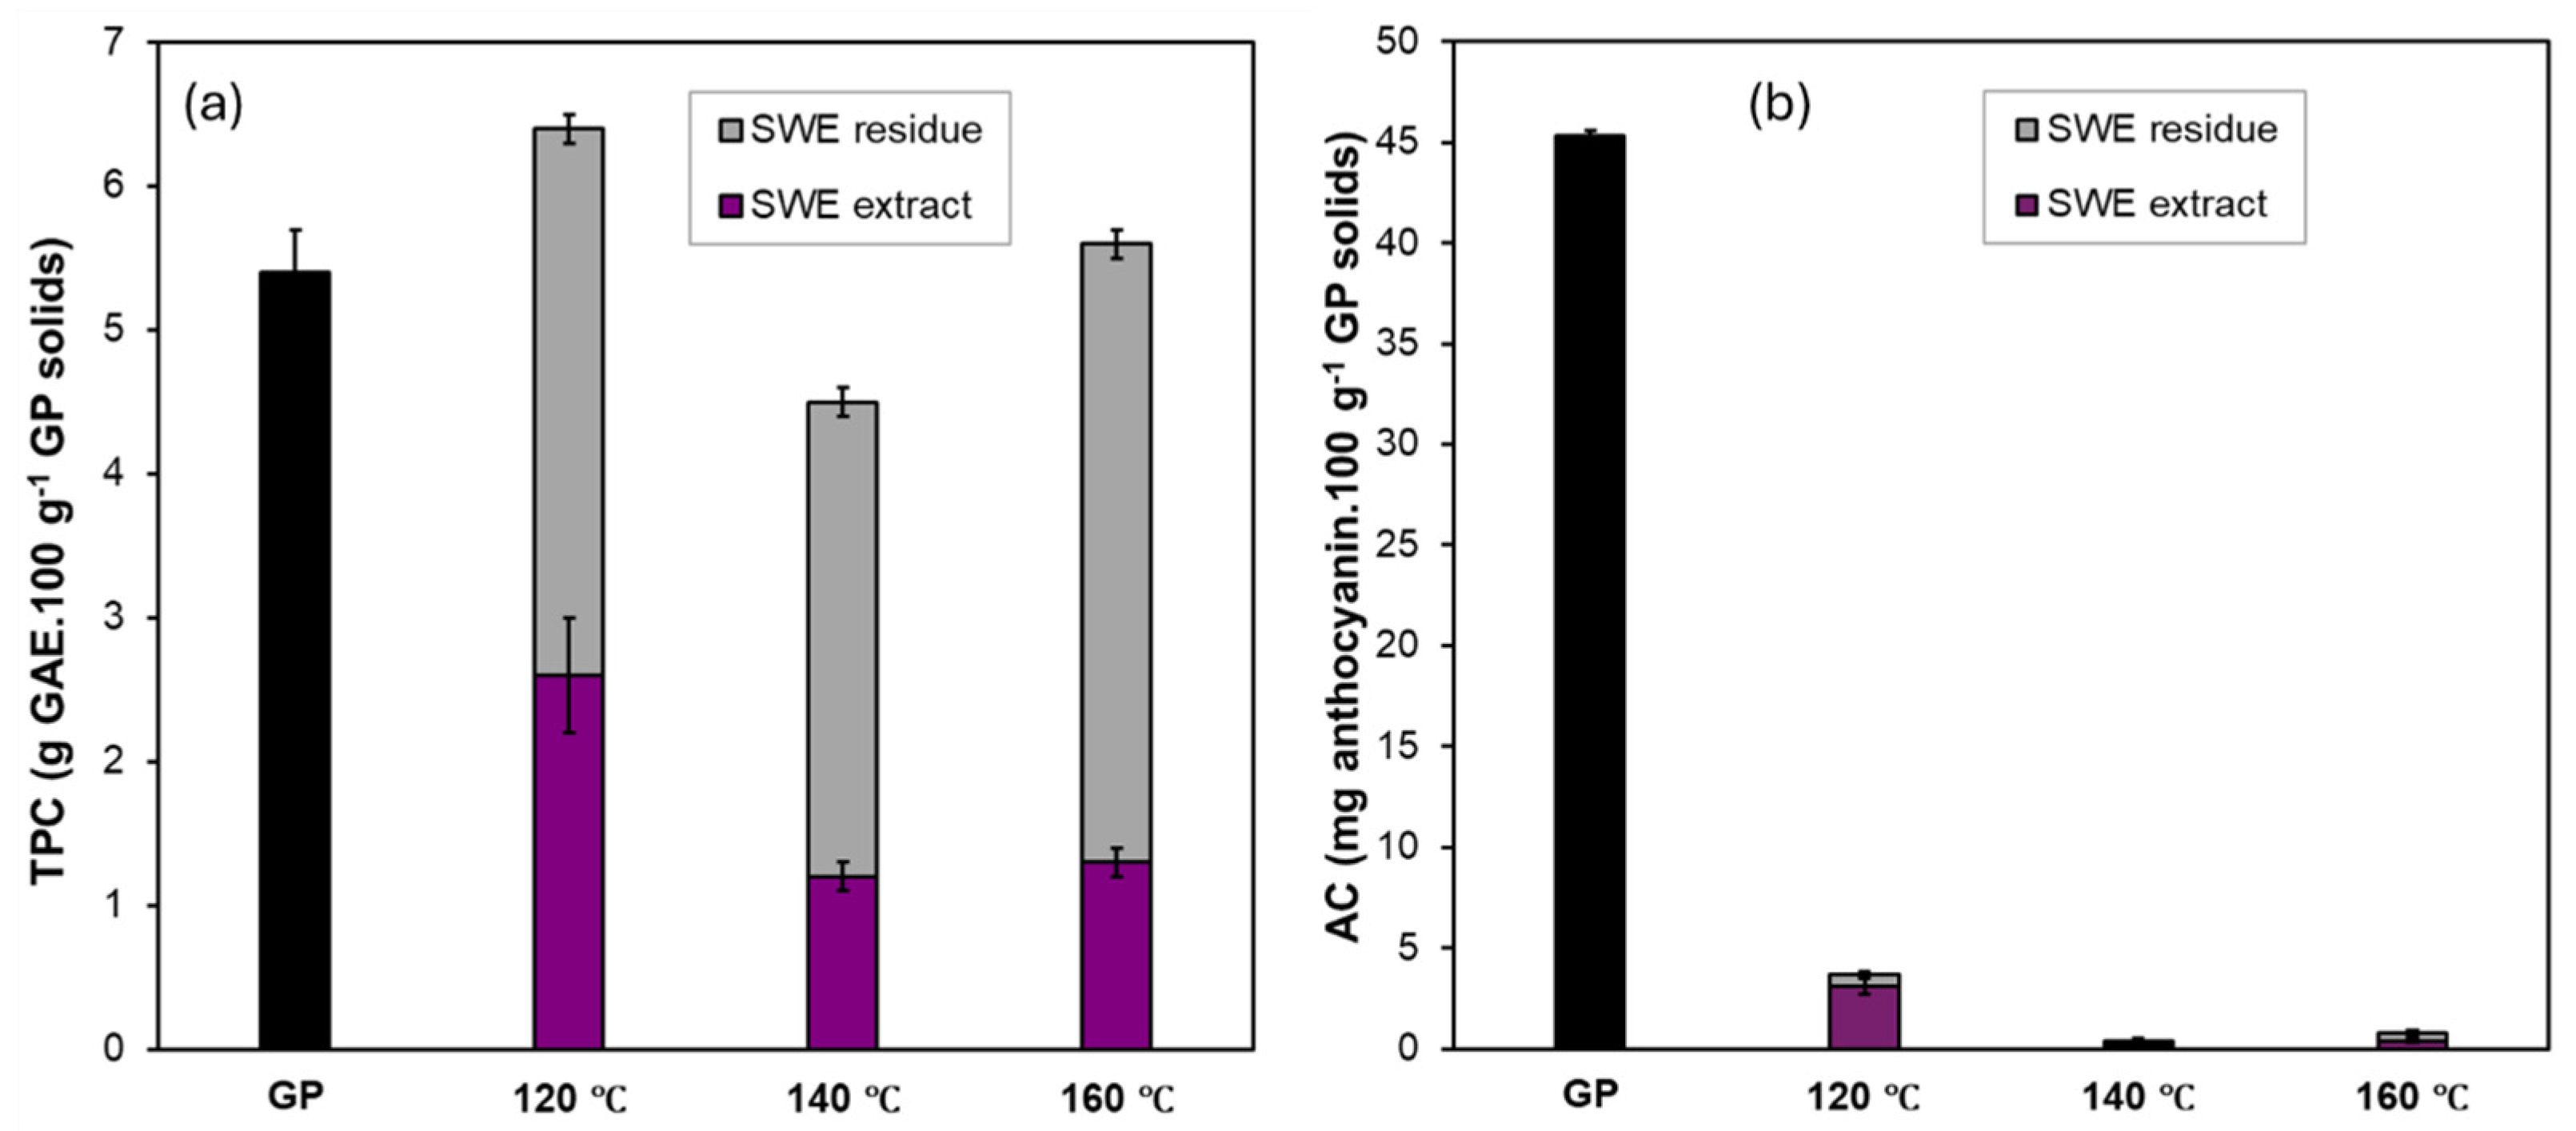
Partition of phenolic and anthocyanin compounds of GP during the SWE process can be observed in Figure 3, where the contents of both fractions (reported per mass unit of GP) were plotted, in comparison with the contents determined in raw GP. The TPC of the SWE residues ranged from 3 to 4 g of GAE/100 g of GP, compared with 1.2–2.6 g/100 g of GP in the SWE extracts. This reflects the great retention of these compounds in the solid matrix during the SWE process. The sum of contents for both fractions was near the values determined in the GP, with small differences that can be attributed to several factors: the neo-formation of compounds reactive to the Folin–Ciocalteu reagent, the partial degradation of some phenolics (e.g., anthocyanins), or structural modifications of the plant matrix during SWE that may facilitate subsequent extraction by other techniques. Nevertheless, the differences between the phenolic content determined in the raw GP and the sum of the contents of the extracts and residues from SWE were about ±1 g of GAE/100 g of GP solids.
Figure 3.
Total phenolic content (TPC) (a) and anthocyanin content (AC) (b) of GP extracts and extraction residues obtained with SWE at 120, 140 and 160 °C, in comparison with those determined in the raw GP (all expressed per 100 g of GP solids) (mean ± standard deviation).
As concerns the AC values of the SWE residues, these were lower than those determined in SWE extracts, and both values were markedly lower than those measured in the raw GP (Figure 3b). This agrees with the extensive degradation of these pigments in a plant matrix subjected to the high temperatures used in the SWE process. The extract obtained at 120 °C had a significantly higher AC value than those obtained at higher temperatures (Figure 3b) and was higher than that obtained in the extraction residue at the same temperature. This indicated that the anthocyanins were preferentially dissolved in the aqueous phase during SWE but underwent substantial degradation as the extraction temperature rose.
Based on the obtained results, fractionation of grape pomace by SWE shows promising industrial scalability and economic viability due to the use of water as a low-cost, non-toxic solvent and its compatibility with continuous or semi-continuous flow reactors already established at pilot scale. The process benefits from short extraction times and tuneable selectivity (through temperature control), enabling efficient recovery of high-value bioactive compounds such as antioxidant polyphenols, which can offset operational costs. Capital investment is mainly associated with high-pressure equipment and energy input for heating, but these costs can be mitigated through heat recovery systems and integration into existing wineries. This study demonstrates that the residual solid fraction also constitutes a high-value product as an antioxidant ingredient, improving overall process economics in a circular economy framework. However, large-scale implementation still requires optimisation of energy efficiency, corrosion resistance of materials, and downstream purification costs to ensure the technology competitiveness.
Bioactive Properties of the SWE Fractions
The antioxidant capacity of the methanol–water extracts of SWE residues presented very low EC50 values (Table 3), which were lower than those of the SWE extracts. This indicates that the compounds retained in these solid fractions exhibit a high DPPH radical-scavenging capacity. This capacity decreased when treated at 140 °C, but increased again at 160 °C, probably due to the contribution of the neo-formed antioxidant compounds. When expressed with respect to the GP solids, for better comparison, it was similar to that of SWE extracts obtained at 140 and 160 °C, but lower than that of SWE extract obtained at 120 °C. Therefore, more bioactive compounds can be assumed in the SWE extracts obtained at 120 °C (E-120). Based on this result, E-120 was also evaluated in terms of its antibacterial activity against Listeria innocua and Escherichia coli. The E-120 extract did not exhibit bactericidal activity against the tested bacteria at the maximum concentration tested (325 mg/mL), since the counts following incubation and plating were not zero for any of the bacteria. However, a growth inhibition of 2 log CFU with respect to the initial counts was observed for L. innocua at this concentration. Therefore 325 mg/mL can be considered the MIC value of the extract for L. innocua, while the growth of E. coli was not affected by the extract at this concentration range. Pedras et al. [7] also observed a higher antibacterial effect of GP extracts for Gram-positive bacteria.
Nevertheless, the freeze-dried extract obtained at 120 °C exhibited a rubbery, sticky state at room temperature (about 20 °C), and its encapsulation using high-molecular-weight carriers (maltodextrin and pectin) was studied to improve its handling properties and stability. This strategy enables the production of more stable solid materials that can be incorporated as a solid ingredient into different matrices.
3.3. Encapsulation of the SWE Bioactive Extract
3.3.1. DSC
Different solid matrices were obtained by freeze-drying of aqueous solutions containing the E-120 extract and different ratios of MD or pectin. These dry samples were submitted to DSC analysis to determine the minimum carrier amount required to obtain a homogeneous solid matrix with a glass transition temperature (Tg) above room temperature, ensuring a glassy state of the powdered material with greater flowability and stability. The amount of polymer added must be kept as low as possible to avoid excessive dilution of the active components while still ensuring suitable encapsulation of the extract.
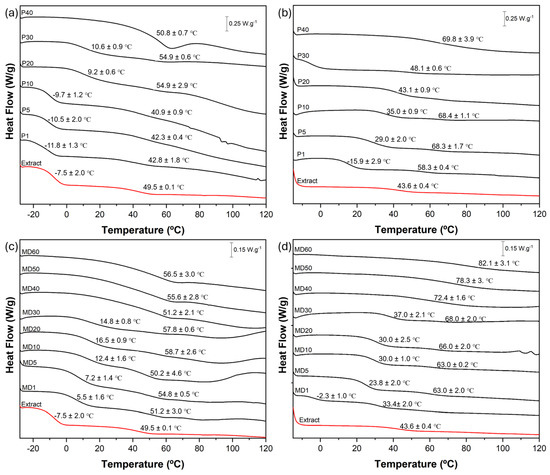
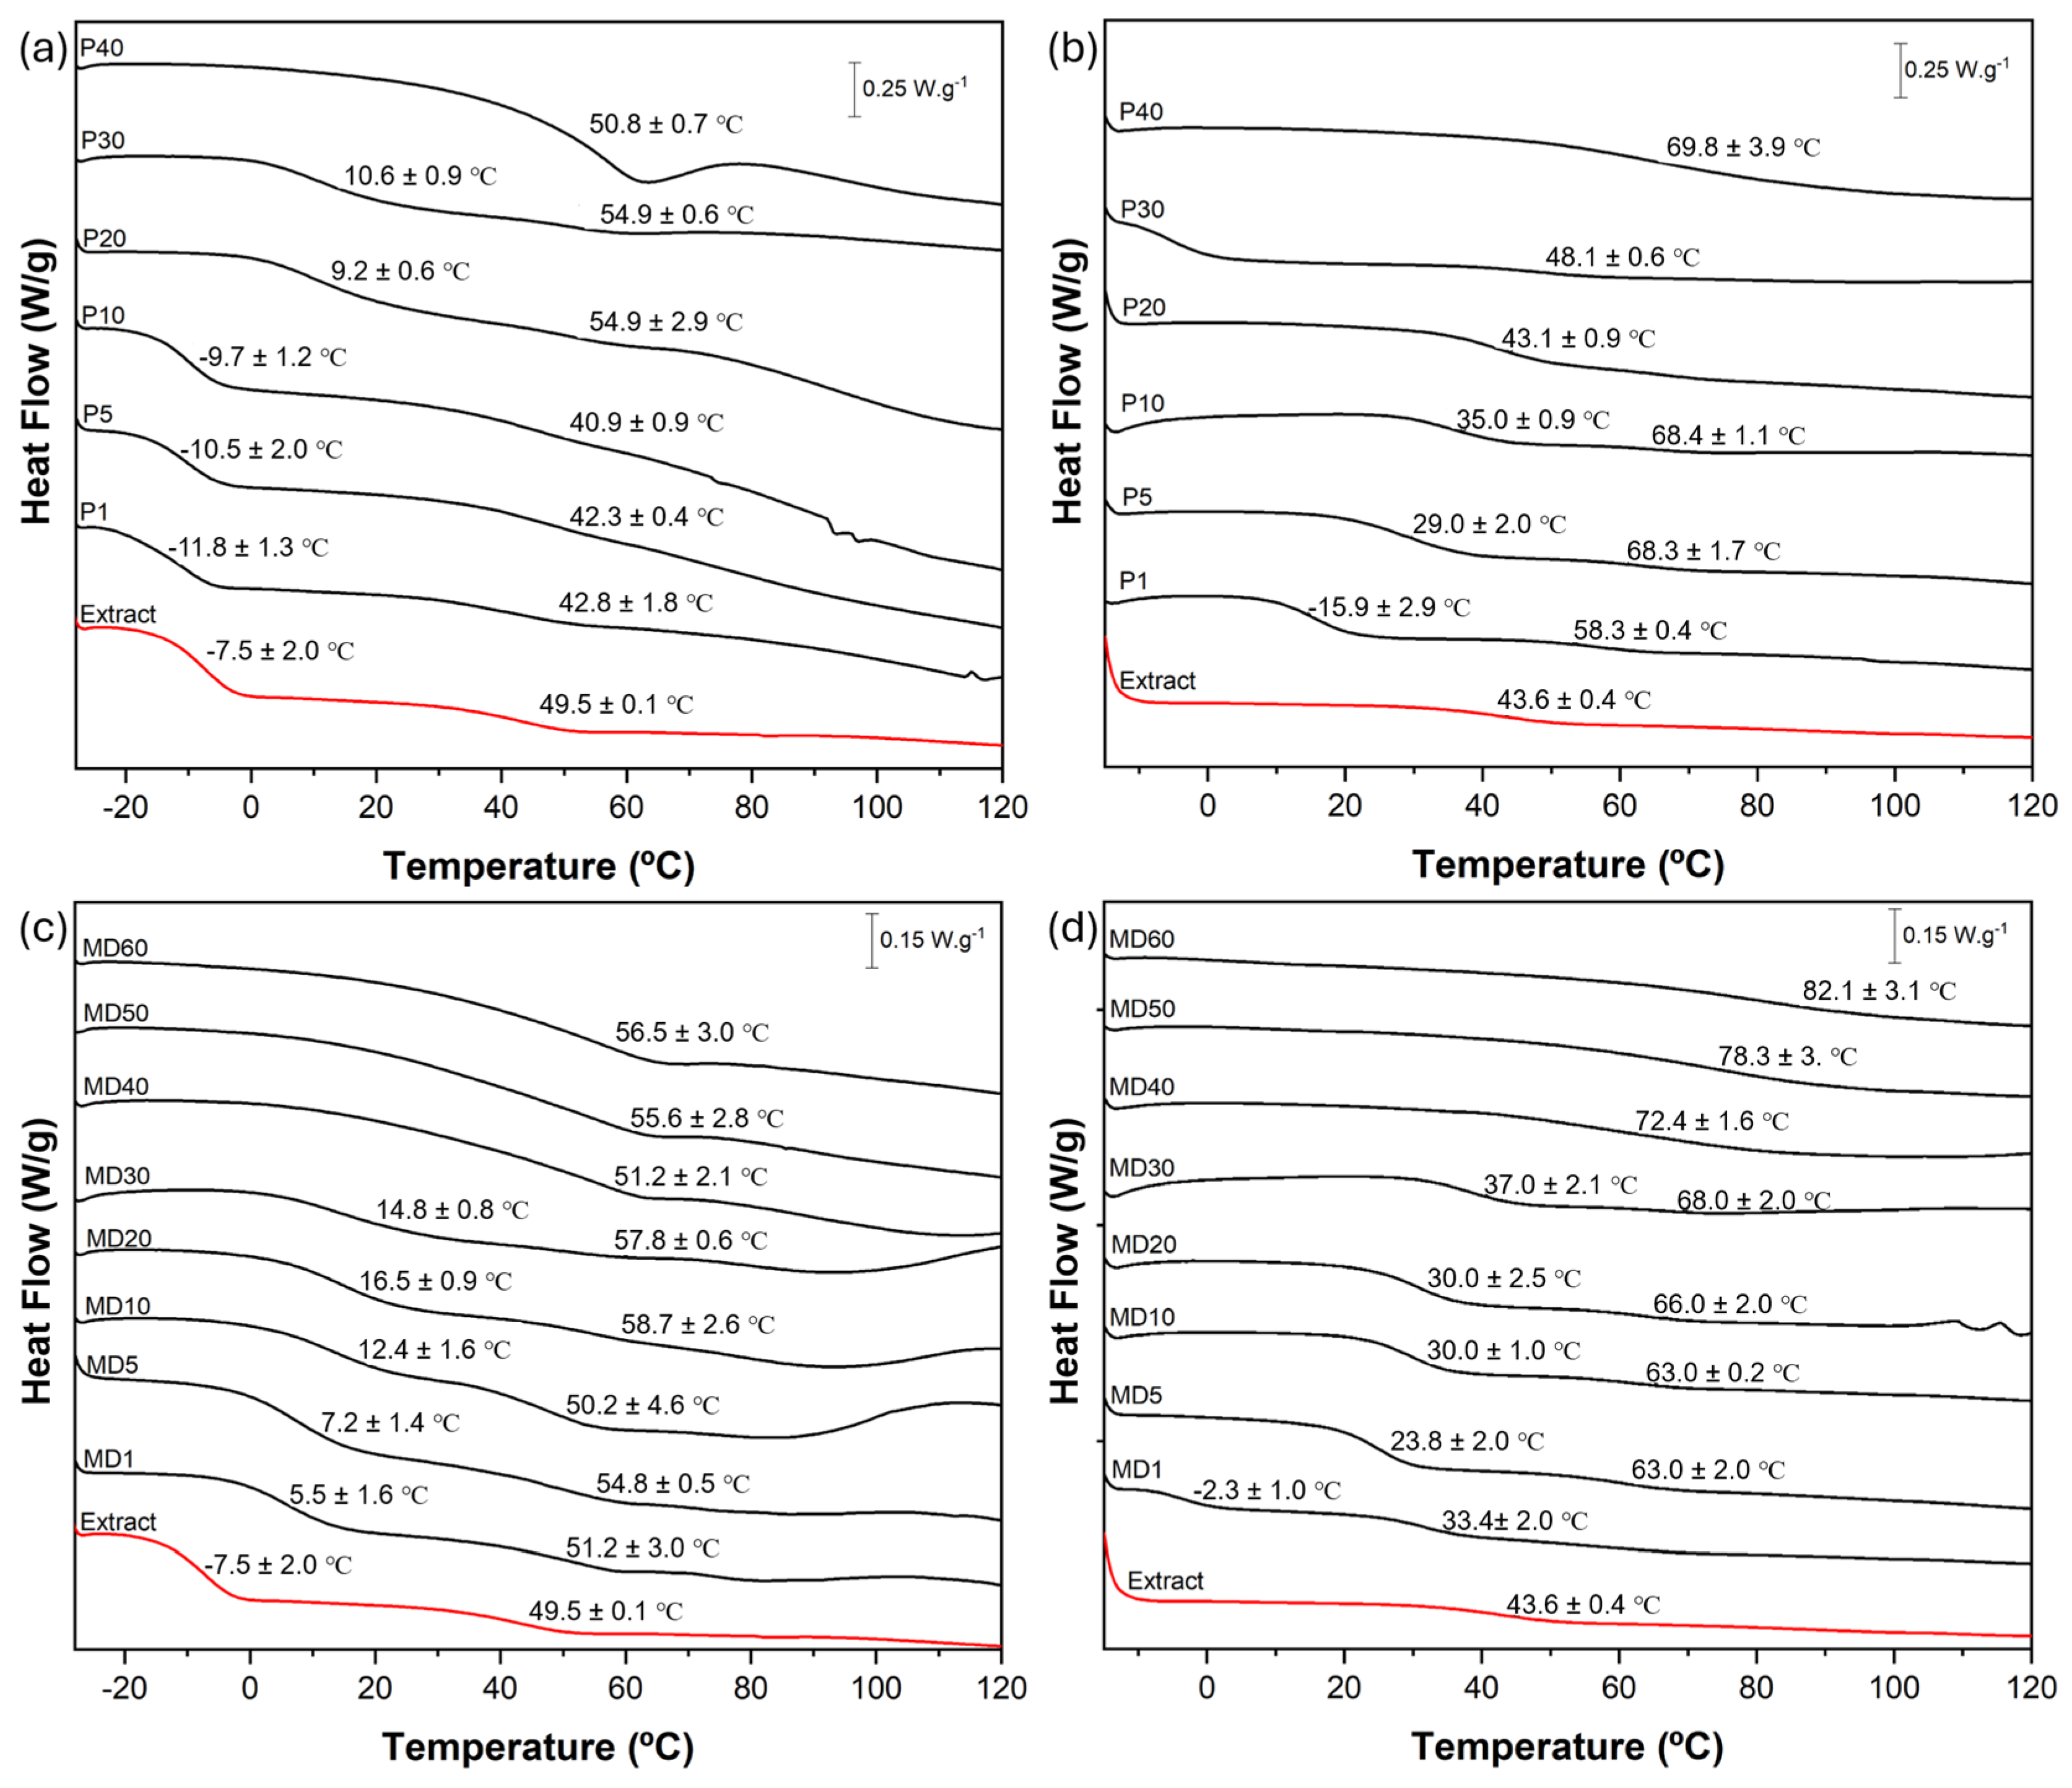
Figure 4 shows the DSC thermograms (first and second heating steps) of the pure E-120 extract and its different formulations with pectin or maltodextrin at different ratios (Table 1). The first heating thermogram of the powdered extract exhibited two glass transitions with midpoint temperatures (Tg) of −7.5 and 49 °C, respectively. This indicates that this was not a homogeneous matrix but rather two separated phases with different mean molecular weights (MWs) formed during freezing, with Tg1 and Tg2, respectively. These two phases must be related to the prior separation of the most water-insoluble components of high MW during cryoconcentration of the aqueous phase, while the cryoconcentrated phase was enriched in the most water-soluble compounds with lower MW, and lower Tg. In the second heating thermogram, only one glass transition was observed, with a Tg of 43.6 °C, indicating melt blending of the components, while reaching a higher mean MW. This suggests that melt blending of the powder components could serve as an alternative stabilisation strategy. Nonetheless, partial caramelisation of sugars and phenol degradation could occur during this process [37].
Figure 4.
DSC thermograms of the pure extract and different extract–polymer mixtures at different ratios: pectin in the first (a) and second (b) heating, maltodextrin in the first (c) and second (d) heating. The midpoint temperatures of the glass transitions observed are indicated.
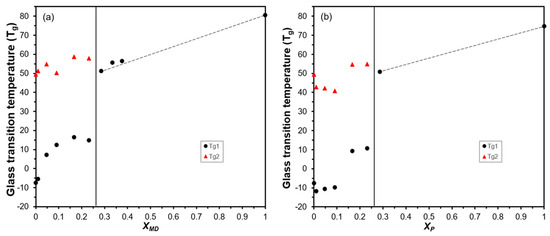
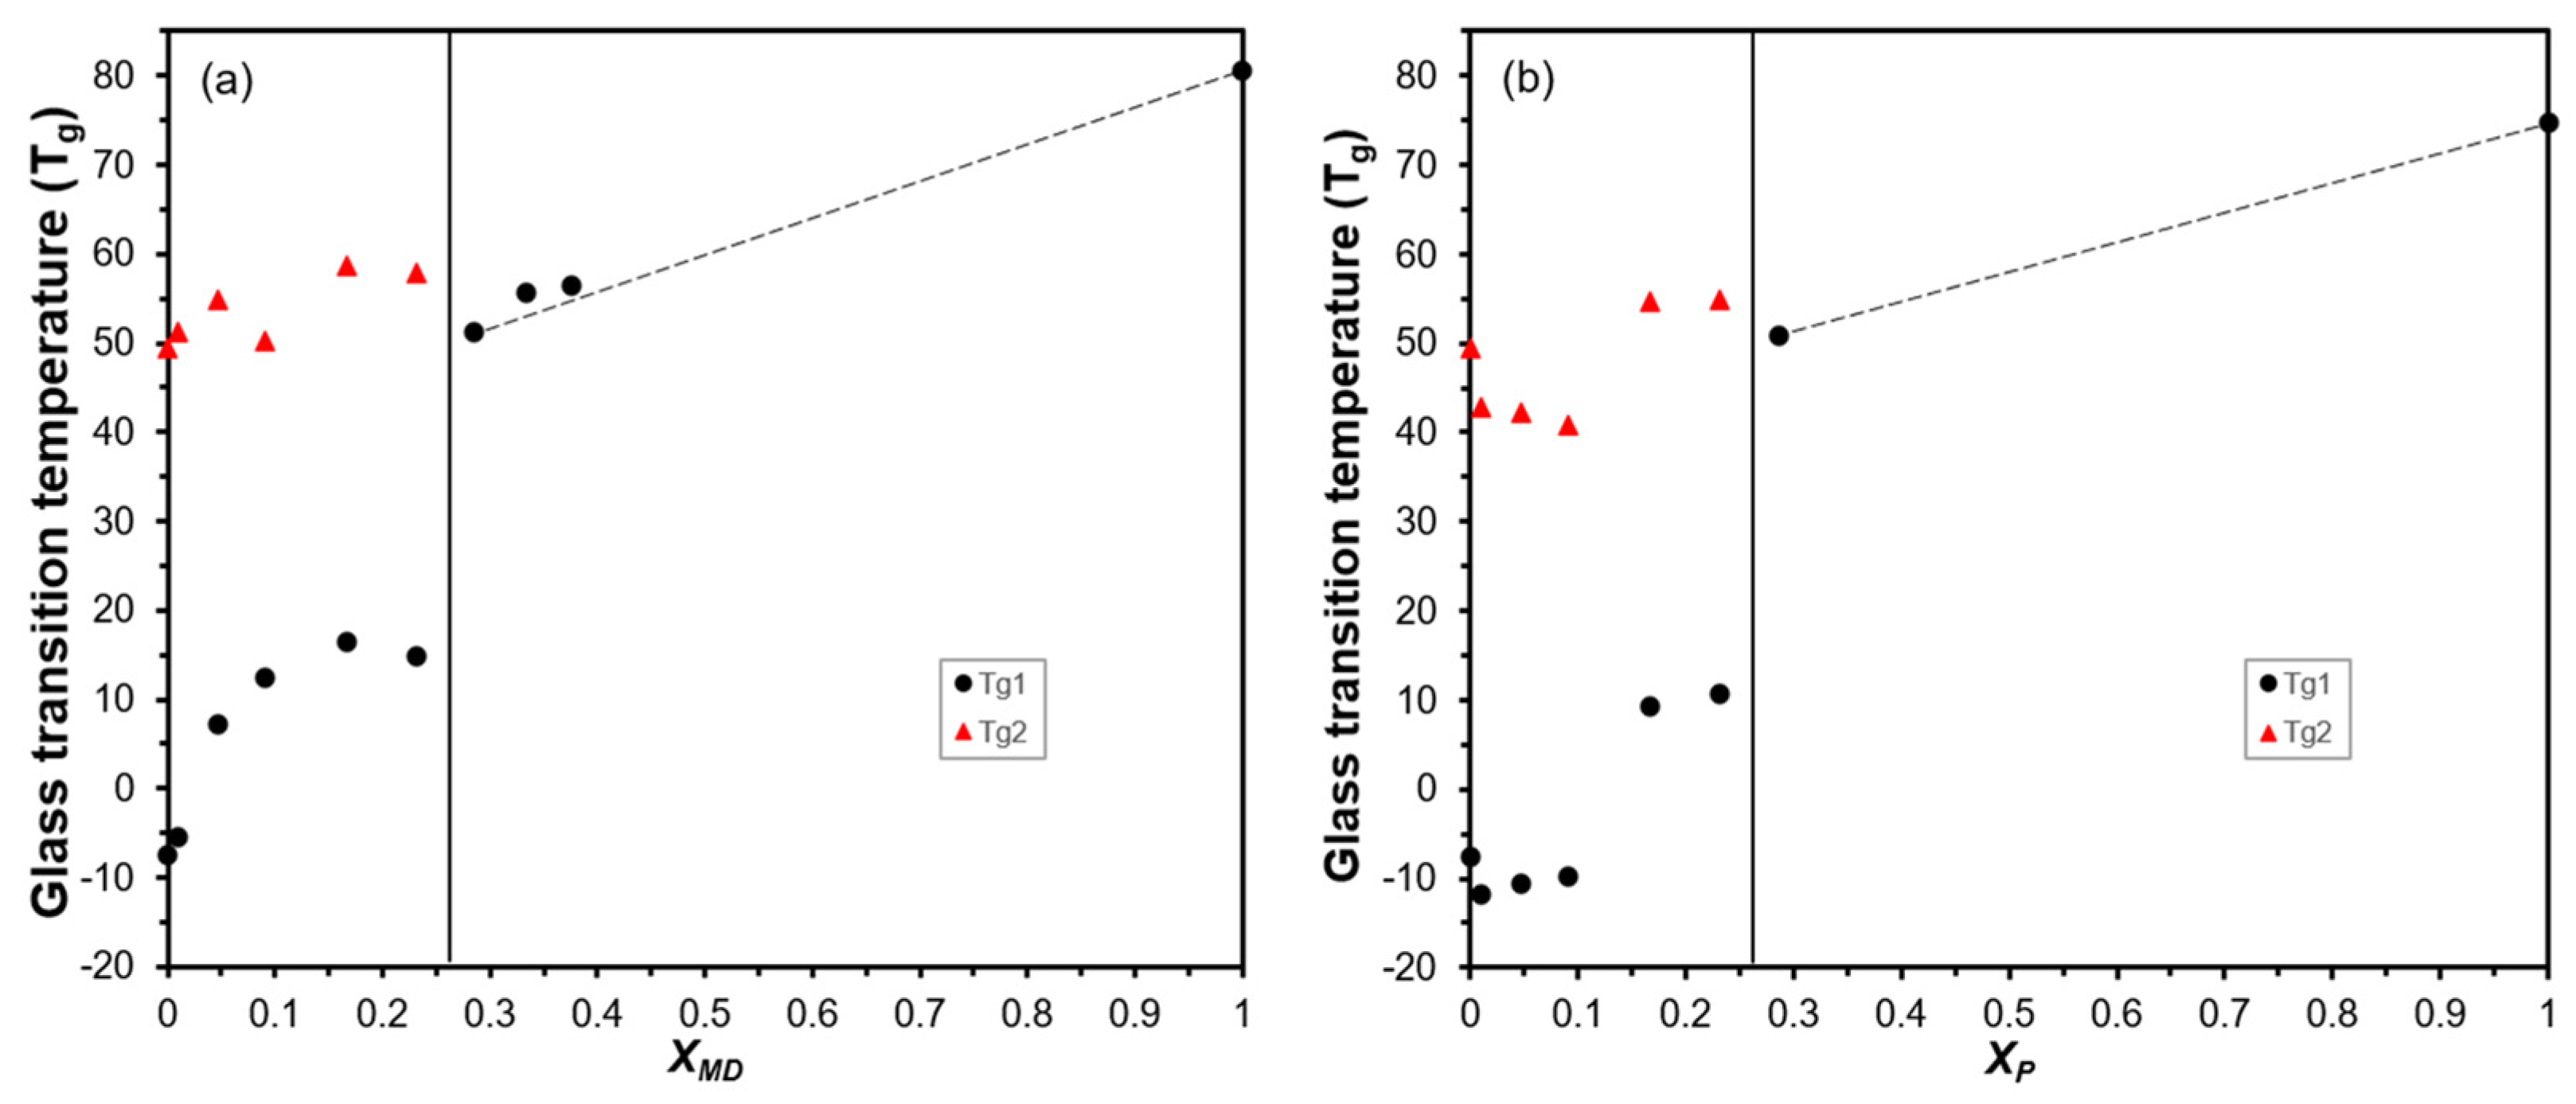
The MD–extract powders also exhibited two-phase separation over the 1–30% polymer ratio, as reflected by the two glass transitions. The Tg values of both phases increased with increasing MD ratio (Figure 5a), indicating the partitioning of this polymer between the phases. However, at an MD ratio of 40%, a single Tg of 51 °C was observed during the first heating (Figure 5a), suggesting that a single amorphous phase was formed. This can be attributed to a sufficient increase in the viscosity of the aqueous phase, which inhibits phase separation during freezing. The Tg values of the MD–extract powders did not show noticeable changes when the polymer proportion exceeded 40% wt. Therefore, incorporating 40% MD allowed for an effective encapsulation of the extract solids, providing the powder with suitable homogeneity (a single amorphous phase), stability, and flowability at room temperature.
Figure 5.
Values of glass transition temperature (Tg) of the encapsulated extracts, as a function of the mass fraction of maltodextrin (XMD) (a) or pectin (XP) (b), obtained in the first heating of the DSC analysis.
The observed glass transitions in the second heating step increased in temperature with respect to the first heating scan, reflecting the partial melt blending of the powder components initially separated during freezing, the possible degradation of low-MW compounds during first heating or the loss of bound water in the powder phases. Similar to the first heating, a single amorphous phase appears from 40% MD onwards, with a higher Tg (72 °C) than that obtained in the first scan (Figure 5b).
As observed for the MD-encapsulated extracts, the pectin blends exhibited phase separation at polymer proportions between 1% and 30%, with two glass transitions (Figure 5b). The pectin incorporated also provoked changes in Tg1 or Tg2 in the 1–30% range. With 40% pectin, a single glass transition at about 51 °C appeared during the first heating, indicating the formation of a single amorphous phase. This was the highest proportion tested, due to more limited pectin solubilisation. However, this concentration proved adequate, as the resulting Tg was well above room temperature. Therefore, a pectin content of 40% relative to the extract solids is sufficient to obtain a homogeneous free-flowing powder, encapsulating the extract. The second heating step also revealed changes in the Tg values of the powder phases due to the factors commented on above.
3.3.2. Thermal Stability
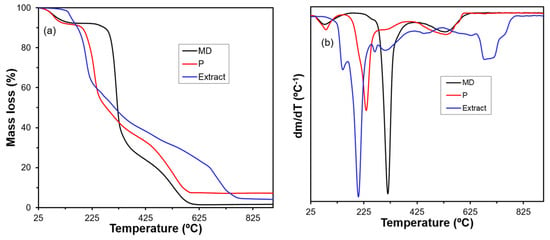
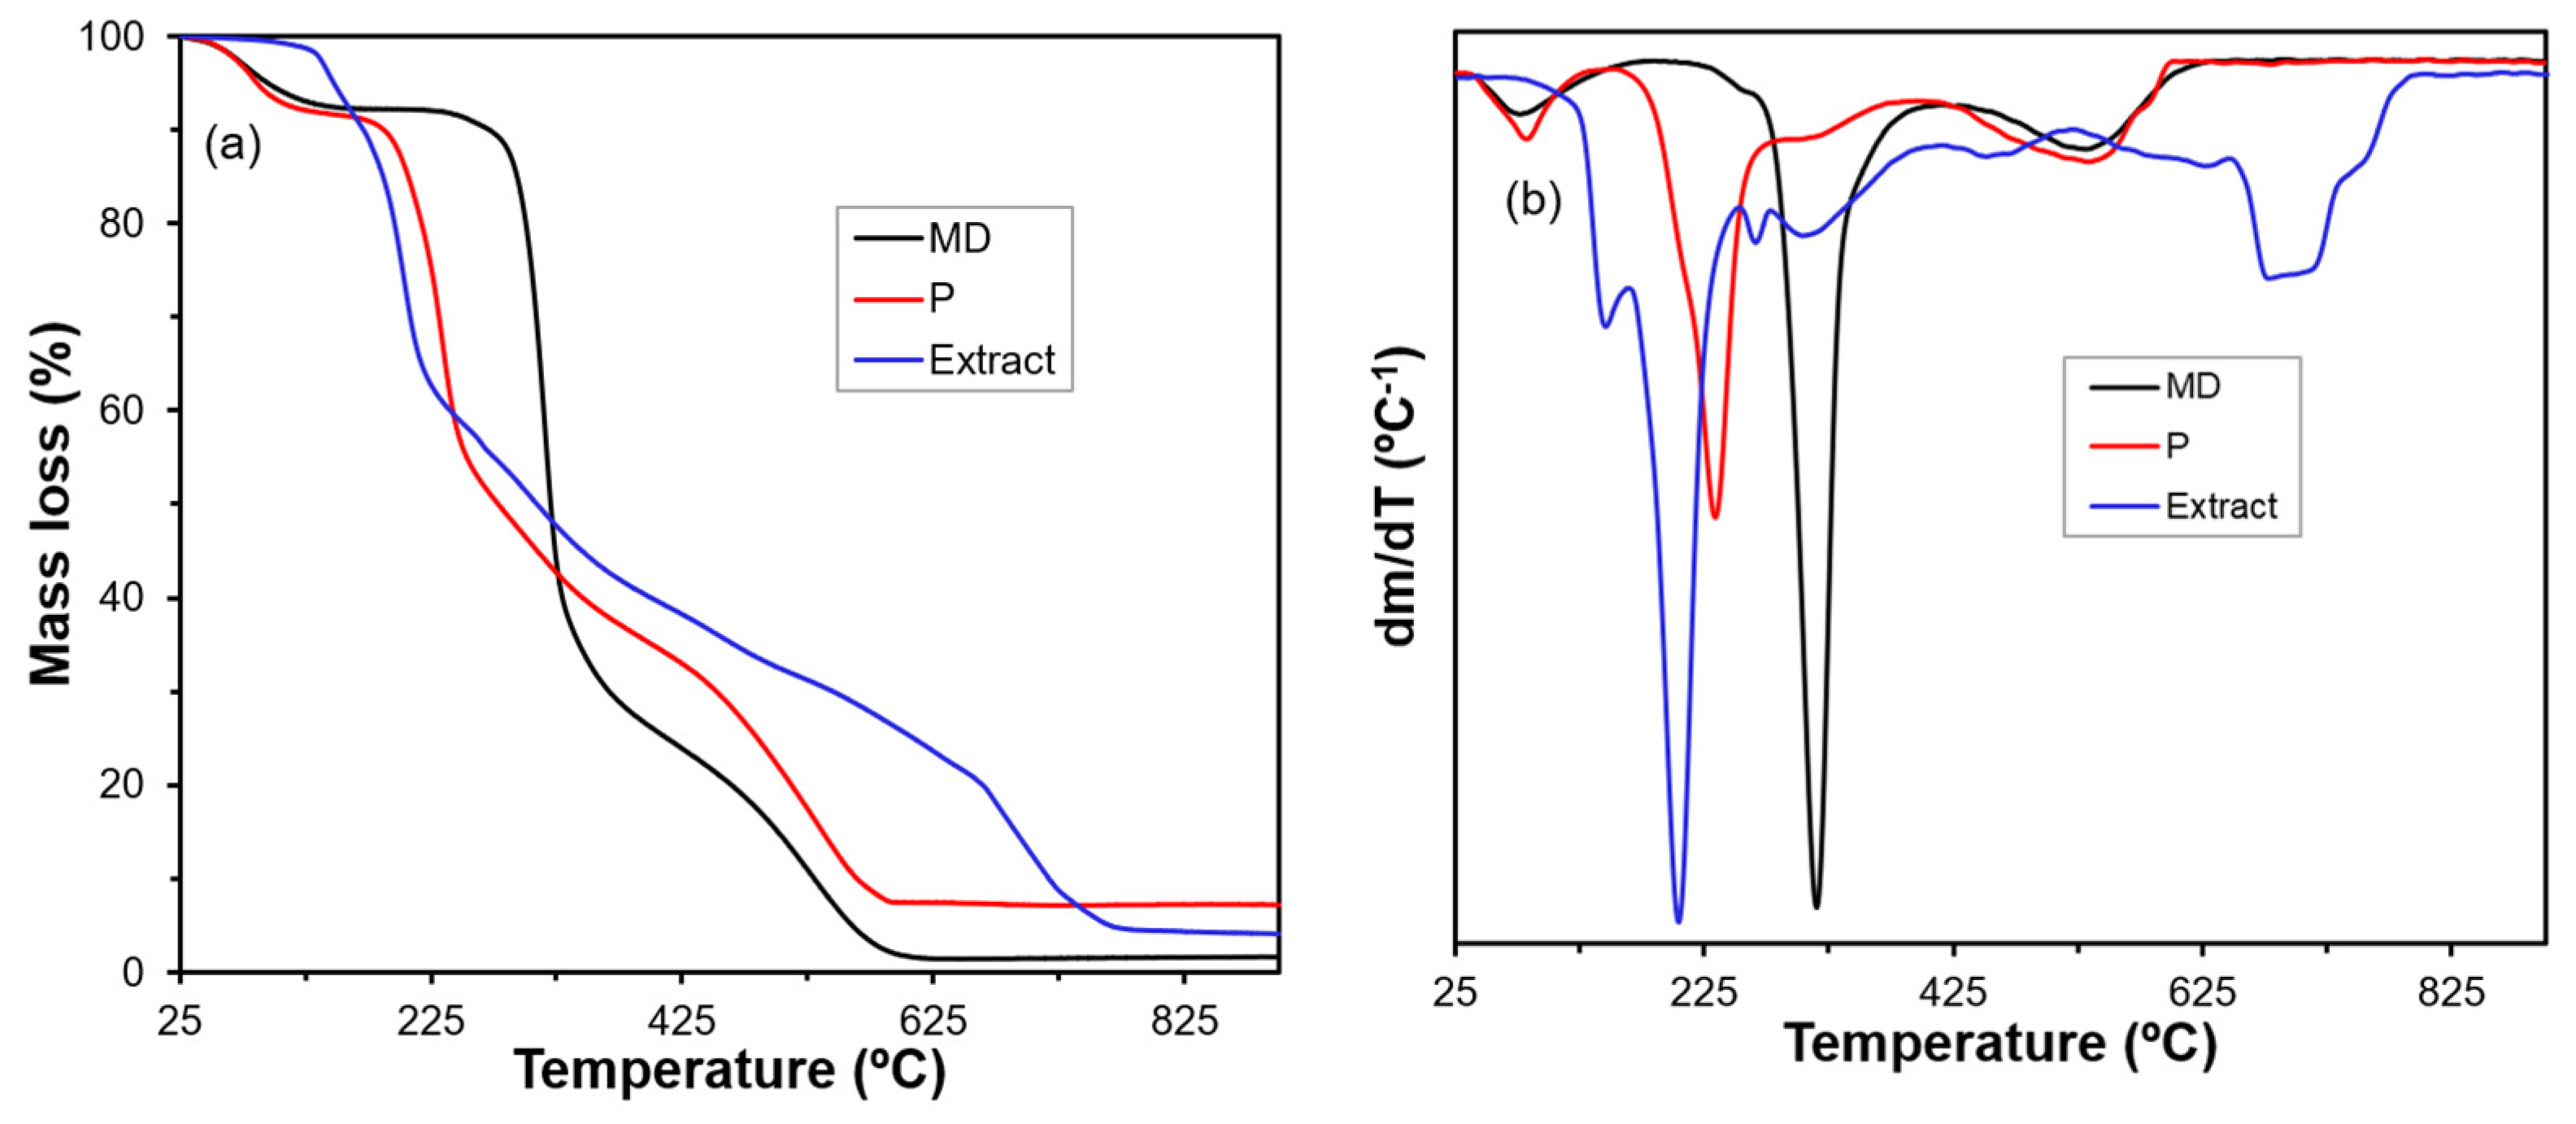
The thermal stability of the pure E-120 extract, polymers, and polymer–extract powders was analysed by TGA. Figure 6 shows the TGA and first DTGA curves for pure maltodextrin, pectin, and extract, where mass losses associated with the thermal degradation of the components are observed. In both polymers, an initial mass loss of approximately 10% wt. was observed at temperatures around 100 °C, corresponding to the loss of bound water. MD showed greater thermostability than pectin, with degradation onset temperatures (To) of 176 and 276 °C for pectin and MD, respectively, and maximum degradation rate temperatures (Tp) of 233 and 315 °C for pectin and MD, respectively. Einhorn-Stoll et al. [38] reported a similar pectin degradation range of 214–253 °C, with a Tp of 237 °C. The thermal stability of MD is affected by its average MW and moisture content. Saavedra-Leos et al. [39] also found similar To and Tp values for MD 10 DE with low water activity. The third stage of mass loss (with Tp values 531 °C and 574 °C for pectin and MD, respectively) corresponds to the decomposition of the degradation products formed in the first stage.
Figure 6.
TGA curves of the percentage mass loss as a function of temperature (a) and its first derivative DTGA (b) of the extract and pure polymers: maltodextrin (MD) and pectin (P).
The active extract exhibited progressive weight loss with several peaks from 130 °C onwards, reflecting its compositional complexity. This behaviour is related to the overlapping degradation of the different components, starting with those of low MW, such as monosaccharides, followed by compounds with higher MW, including hemicellulose, pectin and lignin, among others. Calderón-Santoyo et al. [40] also reported similar behaviour for active extracts obtained from different plant matrices. The first thermodegradation peak at 147 °C (Tp), with ~15% mass loss, was mainly attributed to the degradation of free sugars that caramelise within this temperature range, depending on the conditions of the medium. The second degradation step between 190 (To) and 225 °C, with the maximum degradation rate at 204 °C (Tp), can be associated with the degradation of hemicellulose and pectin naturally present in GP and extracted by SWE [41]. Yang et al. [42] reported the degradation of pure hemicellulose between 220 (To) and 315 °C, with a degradation peak at 268 °C (Tp). The degradation of these components may occur at slightly different temperatures, as their molecular interactions can modify the thermal behaviour of the material. The following steps, characterised by reduced degradation rates, can be attributed to lignin degradation, which occurs over a wide temperature range (100–900 °C [43]) and other compounds, included those formed by previous degradation steps.
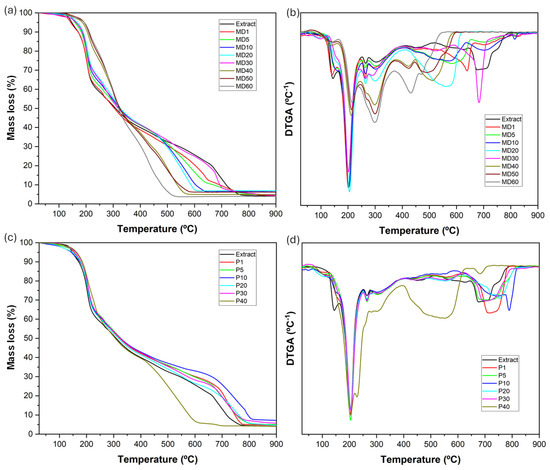
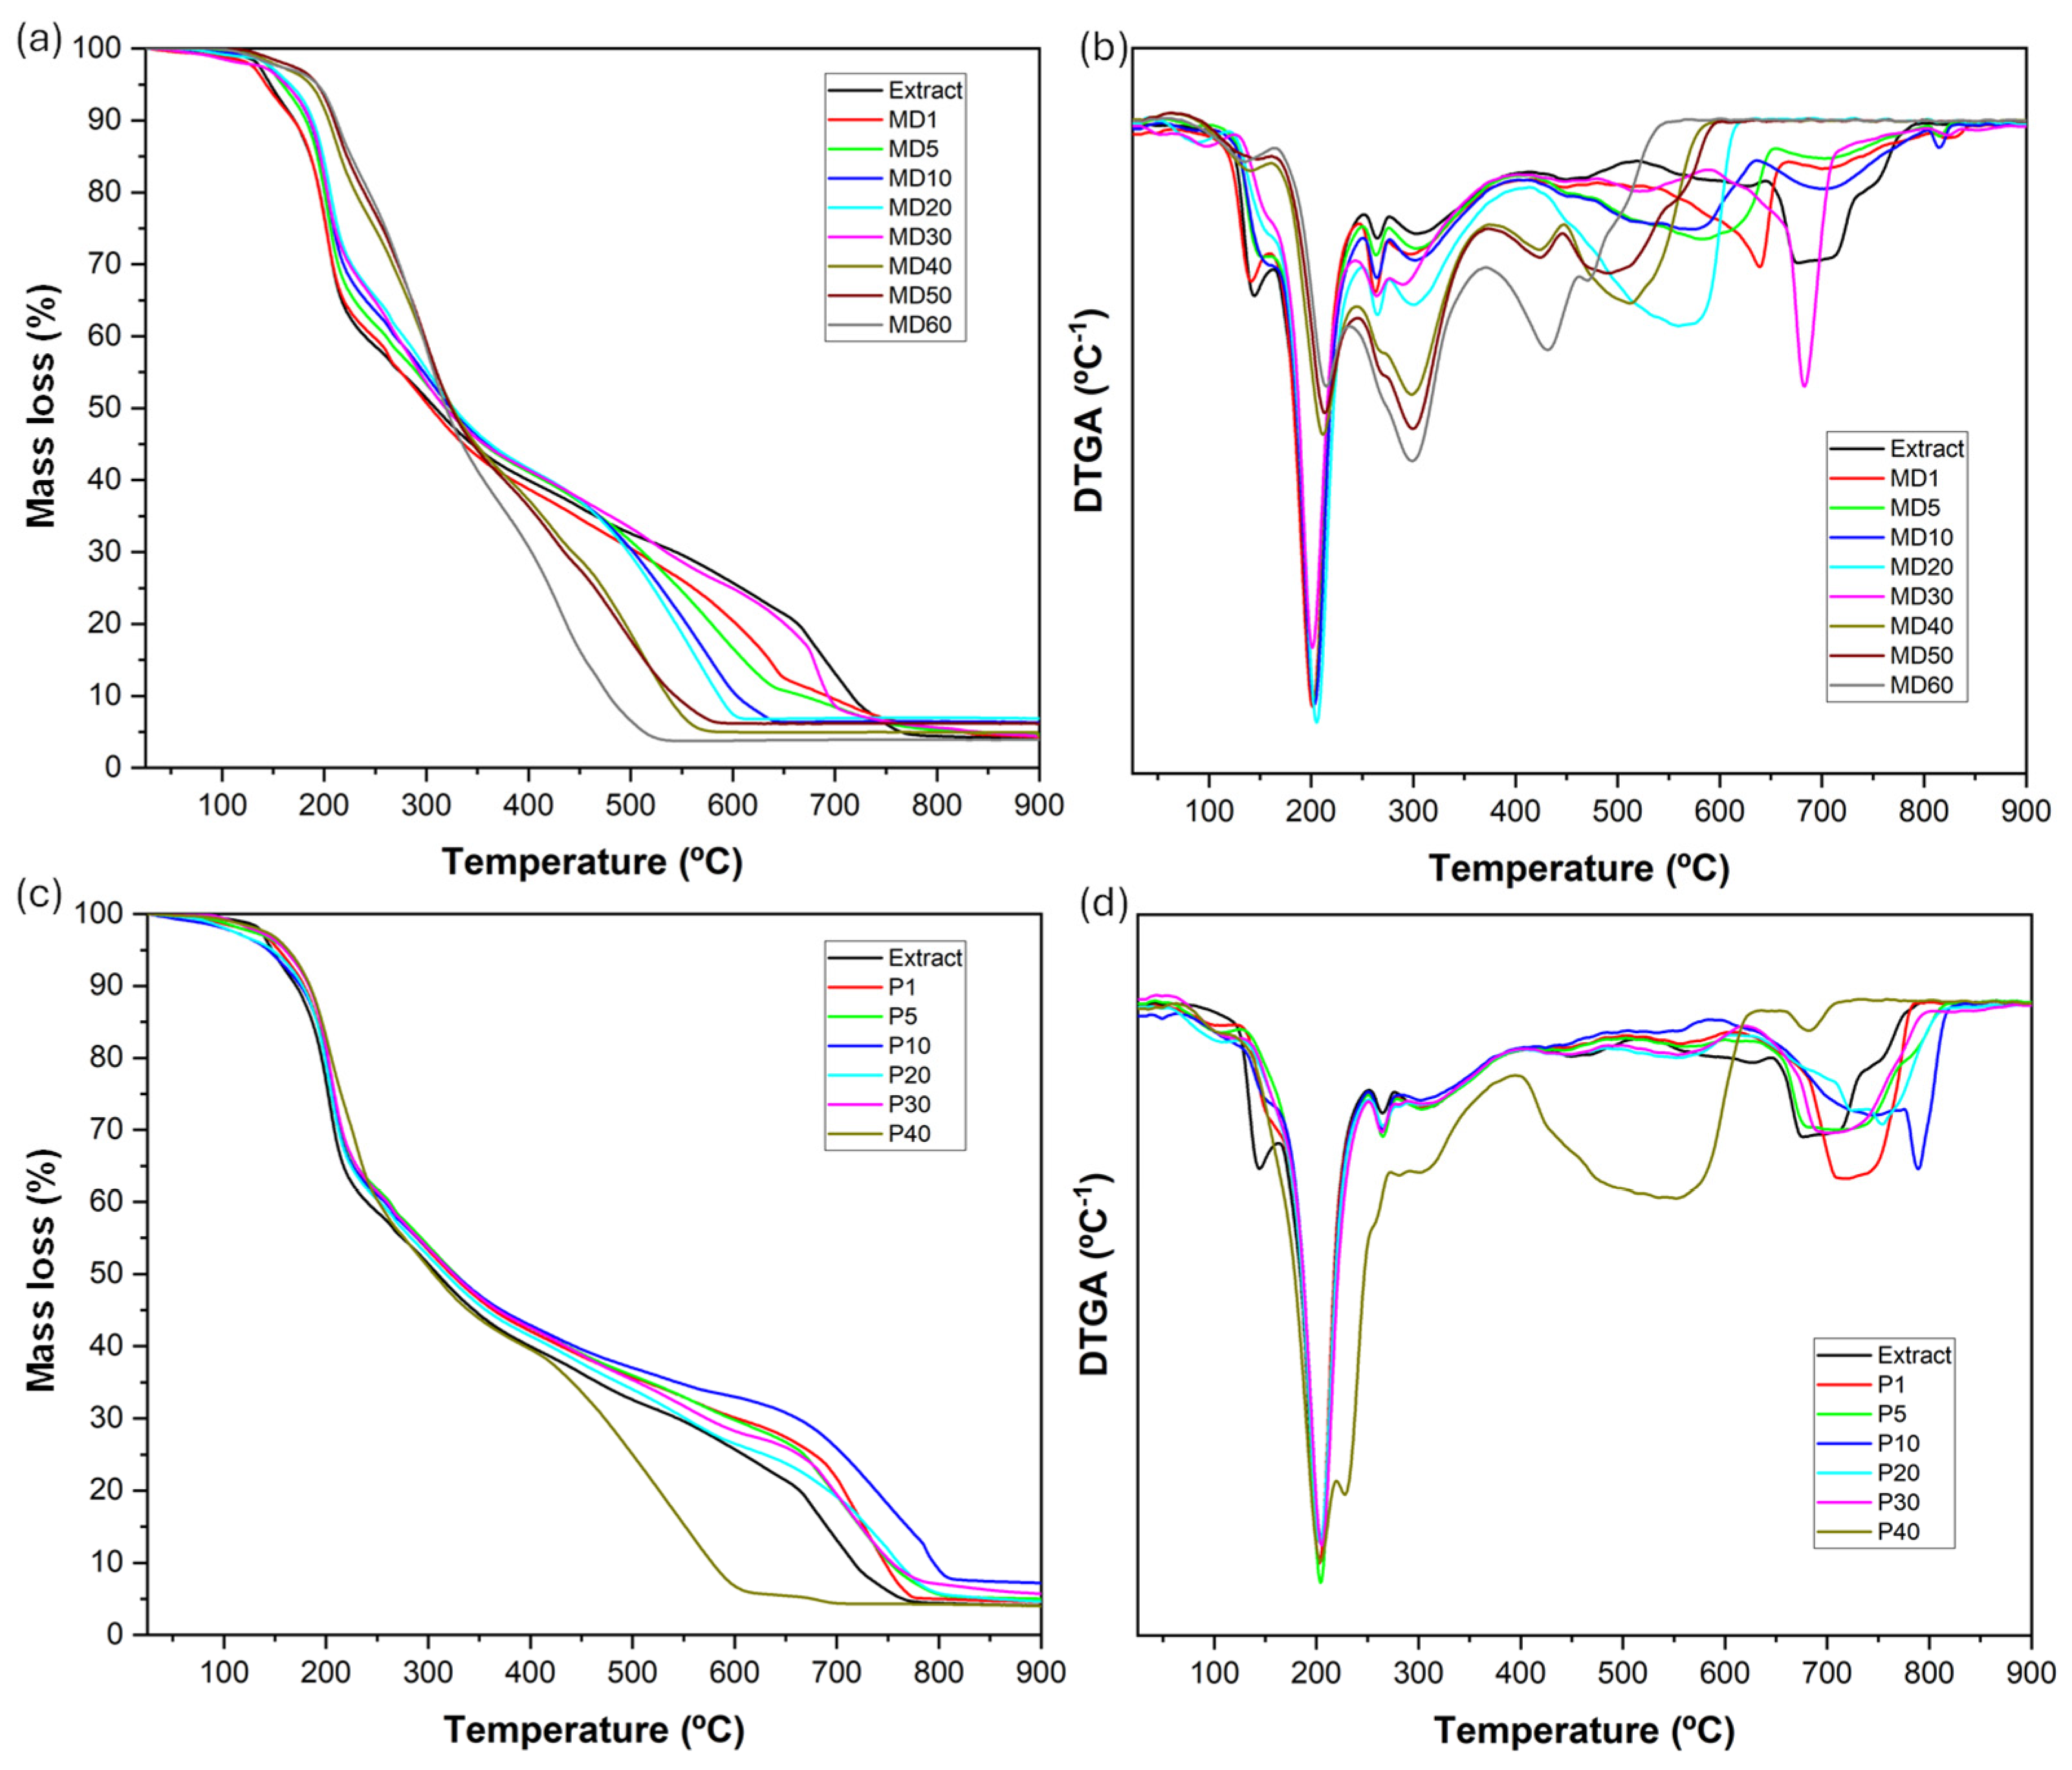
Figure 7 shows the TGA and DTGA curves of the samples encapsulated with different proportions of maltodextrin or pectin. As expected, polymer incorporation modified the degradation profile of the mixtures, depending on their mass fraction and interactions with the extract components. At low polymer proportions (1–30% wt.), the thermal behaviour remained similar to that of the pure extract. Nevertheless, the peak associated primarily with free-sugar degradation at 147 °C was reduced, indicating a protective effect of the polymers against the caramelisation reactions.
Figure 7.
TGA (a) and first derivative (DTGA) (b) curves of extract and maltodextrin–extract encapsulates (1–60% wt.); TGA (c) and DTGA (d) curves of extract and pectin–extract encapsulates (1–40% wt.).
The MD–extract encapsulates exhibited a decrease in mass loss in the first degradation step between 125 and 190 °C. This thermal degradation represents ~4% for the MD60 sample, while the theoretical mass loss in the absence of MD, considering the mass fraction of extract in the mixture, would be ~10%. In this sense, MD provided thermal stability to the encapsulated extract. The highest thermostability was conferred by the incorporation of MD at 40% and above, as the DTGA curves of these samples were similar to the degradation pattern of pure MD (Figure 7b). This was reflected in the intensity of peak at 147 °C (Tp), associated with degradation of low-MW compounds, which was markedly minimised with MD proportions of 40–60%. This suggests strong molecular interactions between the MD chains and the extract components, which increase the overall cohesive forces in the powder, increasing its Tg and thermal stability.
The incorporation of pectin led to similar effects to those observed for the MD–extract encapsulates. The DTGA curves showed attenuation of the degradation peak of low-MW compounds (Tp = 147 °C). Specifically, the sample with 40% pectin exhibited a change in the thermodegradation profile, which was similar to that of pure pectin, with a main peak at 231 °C. This thermal event was practically overlapped with that mainly assigned to the hemicelluloses and pectin in the extract. Nevertheless, the thermal behaviour of the pectin-containing samples between 1 and 30% wt. and the pure extract was very similar. Therefore, 40% pectin, with respect to the extract solids, conferred thermostability to the low-MW compounds in the extract, which are mainly responsible for its antioxidant properties.
3.3.3. FTIR Spectra
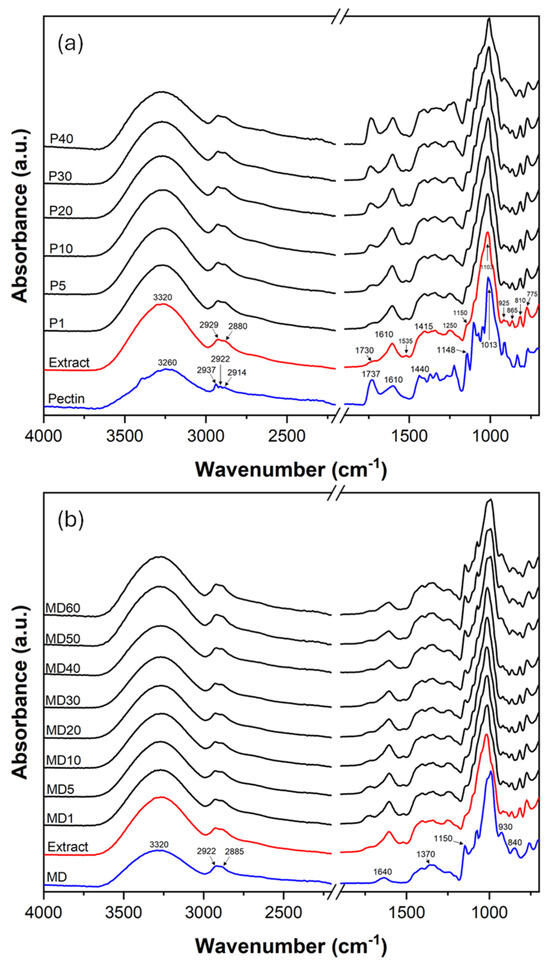
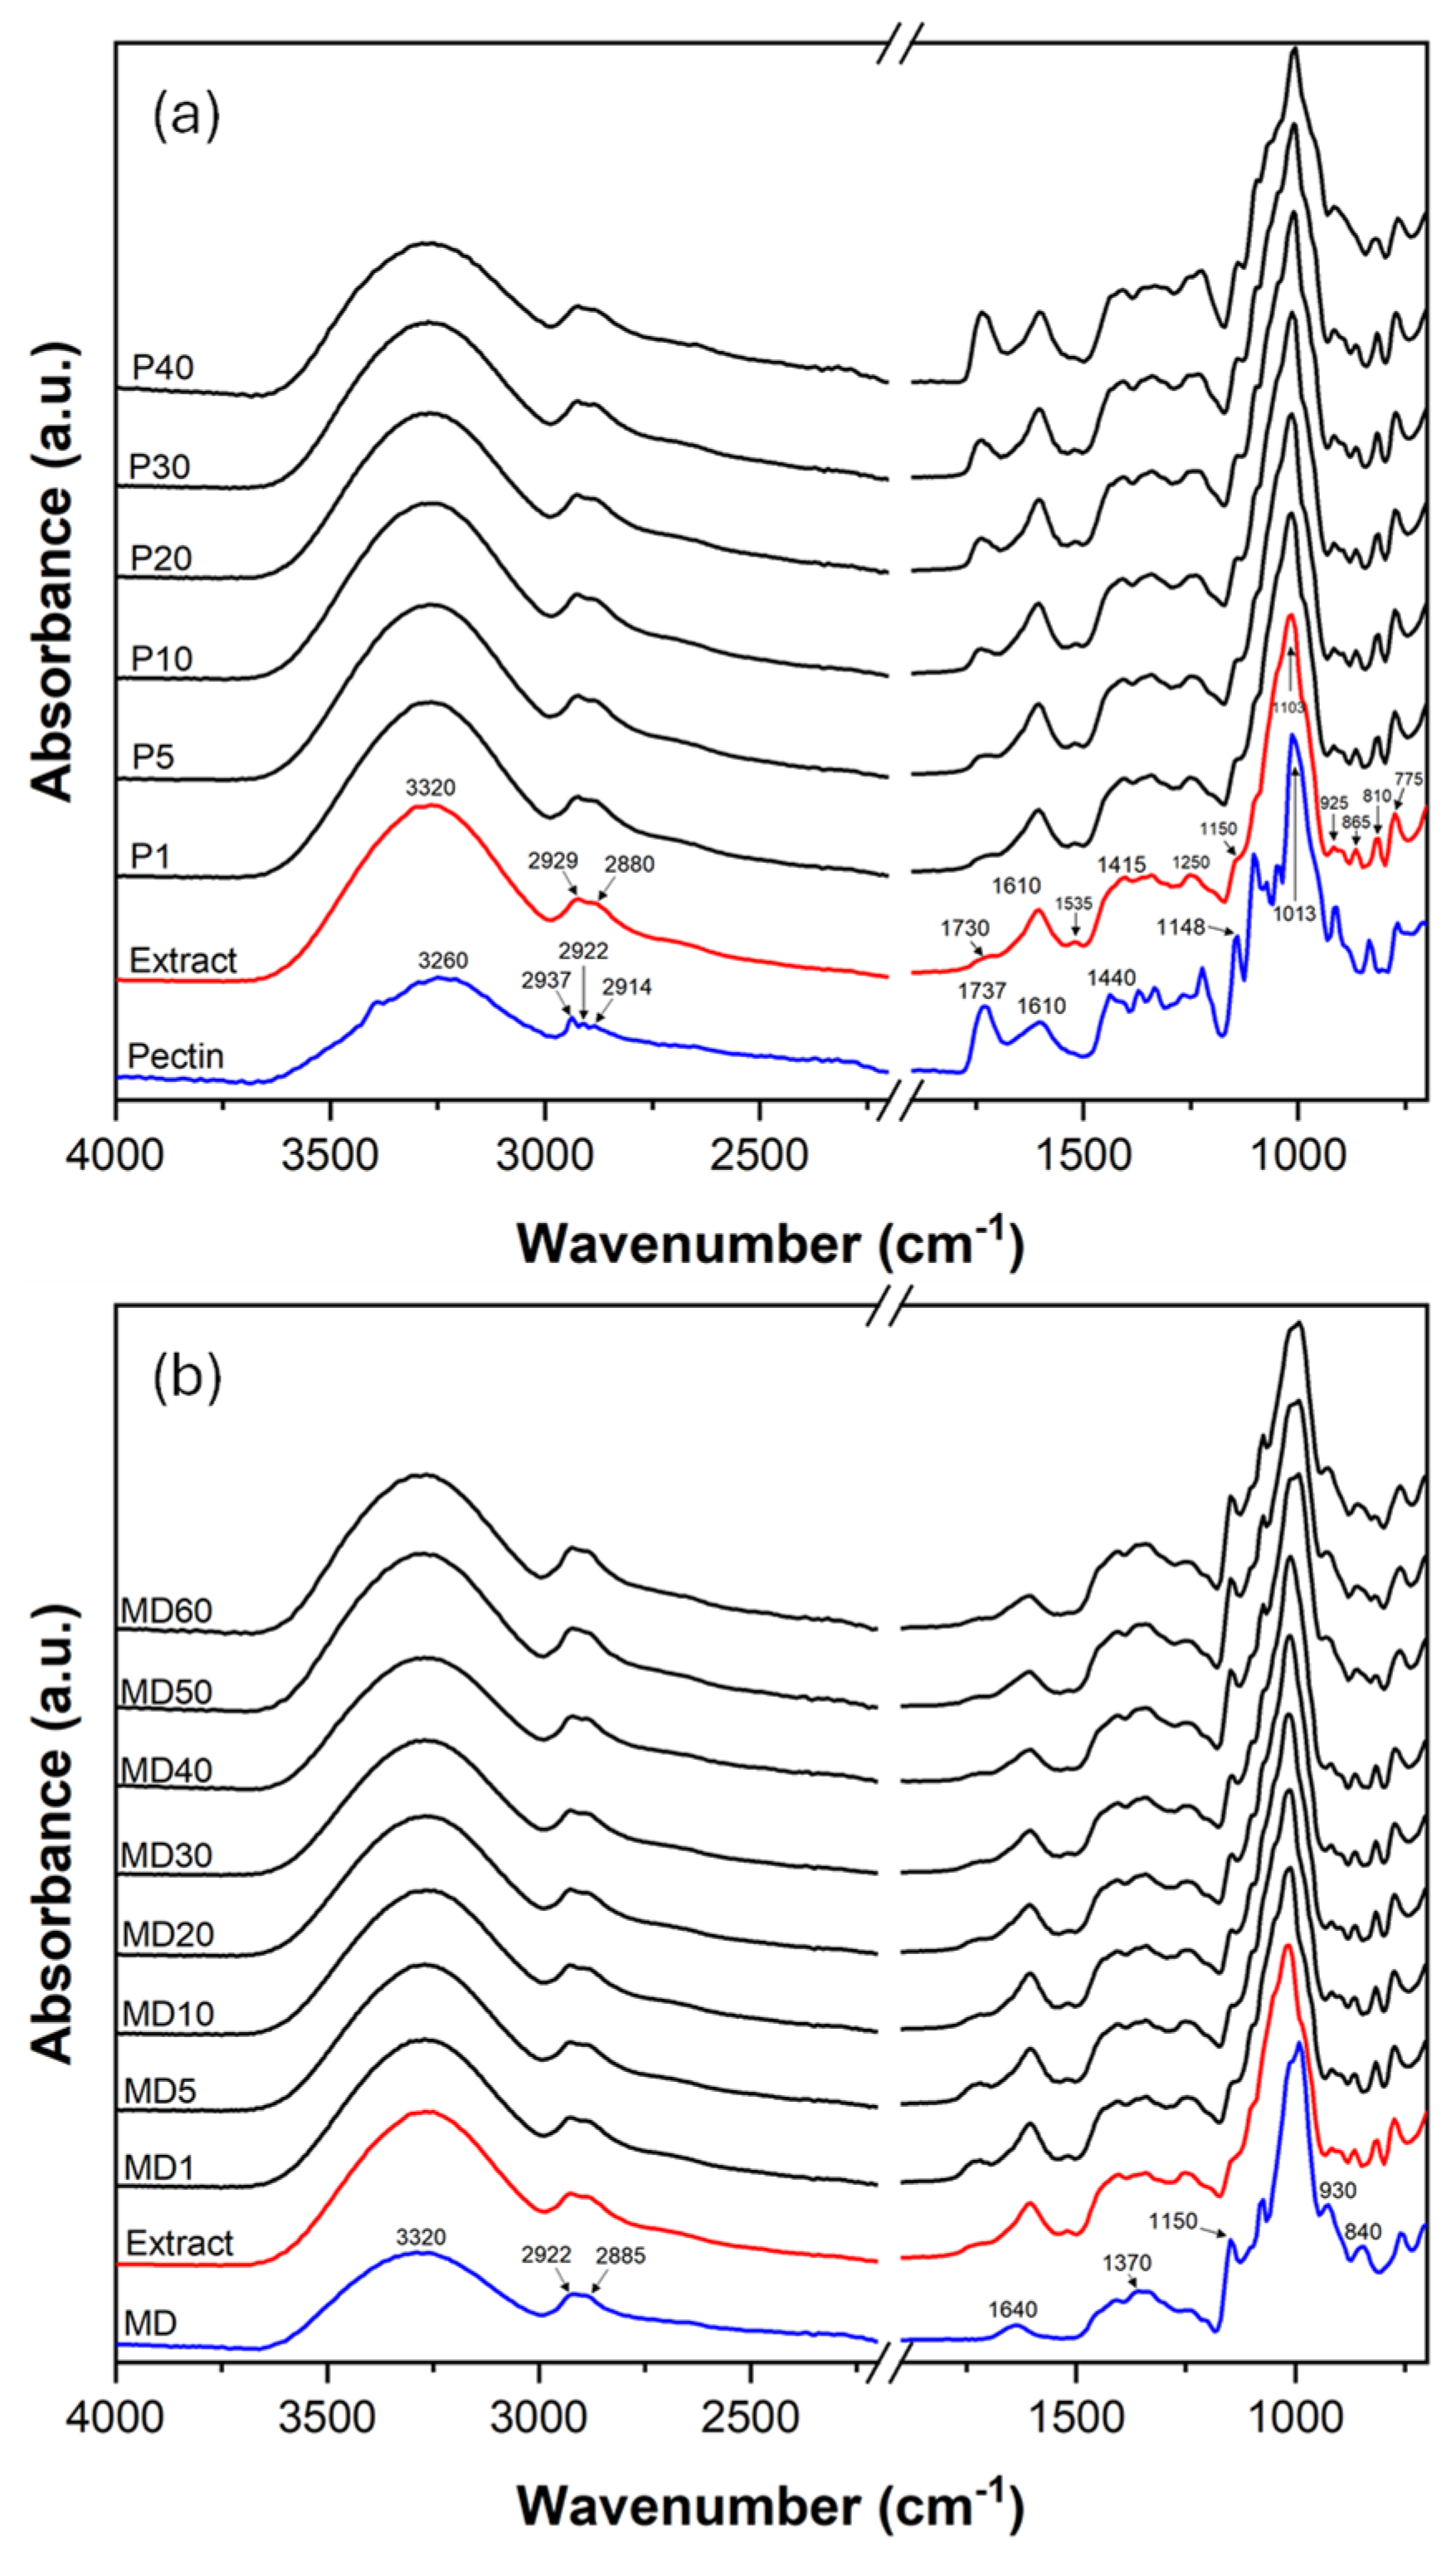
The vibrational pattern of the functional groups presents in the active extract and pure polymers, as well as the possible molecular interactions in the extract–polymer mixtures, was analysed by FTIR in the range of 4000–550 cm−1. Figure 8 shows the FTIR spectra of E-120 extract, maltodextrin, pectin, and the encapsulated powders with different proportions of polymers. The extract exhibited a broad, bell-shaped absorption band at 3320 cm−1, corresponding to the stretching vibration of O-H groups involved in hydrogen bonds. The bands at 2929 and 2860 cm−1 are associated with the C-H symmetric and asymmetric stretching vibrations of CH, CH2, and CH3 groups. The slight peak at 1730 cm−1 is attributable to the C=O stretching vibration of carboxylic and ester groups of phenolic and uronic acids that are present in lignin and hemicellulose chains [44,45]. The absorption peaks at 1610, 1535, and 1415 cm−1 correspond to the C=C stretching vibrations of the aromatic skeleton of the phenols present in the extract [46]. The strong absorption bands at 1250, 1150, 1103, 1021, and 925 cm−1 are associated with C-O asymmetric and symmetric stretching of alcohols, carboxylic acids, phenols, ethers, and esters found in flavonols and lignin chains, as well as the acetal linkage found in the hemicellulose structure [47,48]. The absorption peaks at 915, 865, 810, and 775 cm−1 are attributable to the C-H and C=C out-of-plane bending of mono- or disubstituted aromatic rings [49]. Therefore, the FTIR spectrum of the E-120 extract confirms the presence of phenolic compounds and polymers, also revealed by TGA.
Figure 8.
FTIR spectra of the (a) pure pectin, extract, and pectin–extract encapsulated powders at different pectin proportions (P1 to P40), and (b) maltodextrin (MD), extract, and maltodextrin–extract encapsulated powders at different maltodextrin proportions (MD1 to MD40).
The pure pectin exhibited its characteristic absorption peaks: a bell-shaped band at 3260 cm−1 (stretching vibration of O-H involved in hydrogen bonds); 2937, 2922, and 2914 cm−1 (C-H symmetric and asymmetric vibration) [50]; 1737 cm−1 (C=O stretching vibration of ester groups) [51]; 1610 and 1440 cm−1 (COO asymmetric and symmetric vibration of carboxylate groups, respectively) [52]; and 1103–1148 cm−1 (C-O-C vibrations) [53]. Likewise, the pure maltodextrin also showed peaks characteristic of its structure, typically absorption bands at 3320 cm−1 (O-H stretching associated with hydrogen bonds), 2922 and 2885 cm−1 (C-H symmetrical and asymmetrical stretching), 1640 cm−1 (bending vibration of adsorbed water), 1370 cm−1 (CH3 angular deformation), 930–1150 cm−1 (C-O stretching of C-O-C present in the α-(1,4) glycosidic bonds and C-O-H groups), and 840 cm−1 (O-H stretching of the α-(1,4) glycosidic bond) [54,55,56].
The incorporation of pectin or maltodextrin resulted in changes in the FTIR spectra of the encapsulated powders, in accordance with their ratio in the mixture. The pectin–extract mixtures exhibited a progressive increase in the peak at 1740 cm−1 (C=O stretching of ester groups) as the pectin ratio rose. The band at 1535 cm−1 (C=C stretching vibration of the aromatic rings) decreased in relative intensity in both types of blends as the polymer content increased, becoming almost undetectable at high polymer proportions. This was clearly appreciated in the 40%-pectin-containing powders, whereas in the maltodextrin blends, this was observed from 20% polymer. Maltodextrin–extract encapsulates also showed a gradual reduction in the relative intensity of the 1610 cm−1 band (C=C stretching of aromatic rings) from 30% polymer onwards. Furthermore, the absorption peaks corresponding to the C-H and C=C out-of-plane bending vibrations of aromatic rings exhibited notable changes in their relative intensities for both polymer–extract mixtures. All these changes can be attributed to the possible formation of O–H···π interactions between the aromatic rings of the phenolic compounds and the hydroxyl groups present in the incorporated polymers, indicating supramolecular coupling between these components [57,58]. This can explain the higher thermal stability of the low-molecular-weight compounds present in the active extract as the polymer proportion increased. Likewise, the extract dilution effect was observed through the attenuation or disappearance of characteristic peaks of the extract components.
4. Conclusions
SWE of GP at 120 °C and 1.3 bar was the most efficient condition for obtaining both phenol-rich soluble extracts and fibre-rich residues with antioxidant activity. This temperature better preserved anthocyanins, mainly in the soluble extract, while both fractions showed higher antioxidant capacity. At 120 °C, the soluble fraction represents 61% of the GP solids with a phenolic richness of 4.1 g GAE/100 g of extract and a high DPPH radical scavenging capacity of 0.79 mg/mg of DPPH. The insoluble extraction residue (38% of GP solids) was also rich in fibre and phenolic compounds (10 g GAE/100 g of residue) and possess antioxidant capacity (EC50: 1.5 mg/mg of DPPH). Both fractions may be used as functional ingredients in the food industry, depending on their final application.
Encapsulation of the E-120 extract in a maltodextrin or pectin matrix at a 40% polymer-to-extract solids ratio produced stable, homogeneous powders in a glassy state at room temperature. Regardless of the polymer, the Tg of the powdered extracts was around 50 °C, with thermal stability up to ~200 °C, thereby ensuring the better preservation of bioactive compounds and powder flowability. These results demonstrate the feasibility of SWE for sustainable valorisation of GP into high-value products: phenolic-rich water-soluble extracts and phenolic- and fibre-rich powders, useful as ingredients in the food, pharmaceutical and cosmetic sectors.
Author Contributions
P.A.V.d.F.: Conceptualisation, methodology, formal analysis, investigation, writing—original draft preparation, and writing—review and editing; C.G.-M.: conceptualisation, methodology, investigation, writing—original draft preparation, and writing—review and editing; A.C.: conceptualisation, methodology, investigation, writing—original draft preparation, and writing—review and editing. All authors have read and agreed to the published version of the manuscript.
Funding
This research was funded by AGROALNEXT programme (AGROALNEXT/2022/026) and was supported by MCIN with funding from the European Union NextGenerationEU programme (PRTR-C17.I1) and the project CIPROM/2021/071 (Generalitat Valenciana).
Institutional Review Board Statement
Not applicable.
Informed Consent Statement
Not applicable.
Data Availability Statement
The original contributions presented in the study are included in the article, further inquiries can be directed to the corresponding author.
Conflicts of Interest
The authors declare no conflicts of interest.
References
- Rondeau, P.; Gambier, F.; Jolibert, F.; Brosse, N. Compositions and Chemical Variability of Grape Pomaces from French Vineyard. Ind. Crops Prod. 2013, 43, 251–254. [Google Scholar] [CrossRef] [Scilit]
- Troilo, M.; Difonzo, G.; Paradiso, V.M.; Summo, C.; Caponio, F. Bioactive Compounds from Vine Shoots, Grape Stalks, and Wine Lees: Their Potential Use in Agro-Food Chains. Foods 2021, 10, 342. [Google Scholar] [CrossRef] [Scilit] [PubMed]
- Teissedre, P.-L.; Catarino, S.; Comuzzo, P. Wine Quality Production and Sustainability. In Improving Sustainable Viticulture and Winemaking Practices; Elsevier: Amsterdam, The Netherlands, 2022; pp. 187–199. [Google Scholar]
- Wang, C.; You, Y.; Huang, W.; Zhan, J. The High-Value and Sustainable Utilization of Grape Pomace: A Review. Food Chem. X 2024, 24, 101845. [Google Scholar] [CrossRef] [Scilit] [PubMed]
- Ruggieri, L.; Cadena, E.; Martínez-Blanco, J.; Gasol, C.M.; Rieradevall, J.; Gabarrell, X.; Gea, T.; Sort, X.; Sánchez, A. Recovery of Organic Wastes in the Spanish Wine Industry. Technical, Economic and Environmental Analyses of the Composting Process. J. Clean. Prod. 2009, 17, 830–838. [Google Scholar] [CrossRef] [Scilit]
- Brenes, A.; Viveros, A.; Chamorro, S.; Arija, I. Use of Polyphenol-Rich Grape by-Products in Monogastric Nutrition. A Review. Anim. Feed. Sci. Technol. 2016, 211, 1–17. [Google Scholar] [CrossRef] [Scilit]
- Pedras, B.M.; Regalin, G.; Sá-Nogueira, I.; Simões, P.; Paiva, A.; Barreiros, S. Fractionation of Red Wine Grape Pomace by Subcritical Water Extraction/Hydrolysis. J. Supercrit. Fluids 2020, 160, 104793. [Google Scholar] [CrossRef] [Scilit]
- Mangione, R.; Simões, R.; Pereira, H.; Catarino, S.; Ricardo-da-Silva, J.; Miranda, I.; Ferreira-Dias, S. Potential Use of Grape Stems and Pomaces from Two Red Grapevine Cultivars as Source of Oligosaccharides. Processes 2022, 10, 1896. [Google Scholar] [CrossRef] [Scilit]
- Castro, L.E.N.; Sganzerla, W.G.; Barroso, T.L.C.T.; Maciel-Silva, F.W.; Colpini, L.M.S.; Bittencourt, P.R.S.; Rostagno, M.A.; Forster-Carneiro, T. Improving the Semi-Continuous Flow-through Subcritical Water Hydrolysis of Grape Pomace (Vitis vinifera L.) by pH and Temperature Control. J. Supercrit. Fluids 2023, 196, 105894. [Google Scholar] [CrossRef] [Scilit]
- Contreras, M.D.M.; Romero-García, J.M.; López-Linares, J.C.; Romero, I.; Castro, E. Residues from Grapevine and Wine Production as Feedstock for a Biorefinery. Food Bioprod. Process. 2022, 134, 56–79. [Google Scholar] [CrossRef] [Scilit]
- Gowman, A.C.; Picard, M.C.; Rodriguez-Uribe, A.; Misra, M.; Khalil, H.; Thimmanagari, M.; Mohanty, A.K. Physicochemical Analysis of Apple and Grape Pomaces. BioResources 2019, 14, 3210–3230. [Google Scholar] [CrossRef] [Scilit]
- Rodrigues, R.P.; Sousa, A.M.; Gando-Ferreira, L.M.; Quina, M.J. Grape Pomace as a Natural Source of Phenolic Compounds: Solvent Screening and Extraction Optimization. Molecules 2023, 28, 2715. [Google Scholar] [CrossRef] [Scilit] [PubMed]
- Portilla Rivera, O.M.; Saavedra Leos, M.D.; Solis, V.E.; Domínguez, J.M. Recent Trends on the Valorization of Winemaking Industry Wastes. Curr. Opin. Green Sustain. Chem. 2021, 27, 100415. [Google Scholar] [CrossRef] [Scilit]
- Perra, M.; Leyva-Jiménez, F.-J.; Manca, M.L.; Manconi, M.; Rajha, H.N.; Borrás-Linares, I.; Segura-Carretero, A.; Lozano-Sánchez, J. Application of Pressurized Liquid Extraction to Grape By-Products as a Circular Economy Model to Provide Phenolic Compounds Enriched Ingredient. J. Clean. Prod. 2023, 402, 136712. [Google Scholar] [CrossRef] [Scilit]
- Sanhueza, L.; Tello, M.; Vivanco, M.; Mendoza, L.; Wilkens, M. Relation between Antibacterial Activity against Food Transmitted Pathogens and Total Phenolic Compounds in Grape Pomace Extracts from Cabernet Sauvignon and Syrah Varieties. Adv. Microbiol. 2014, 4, 225–232. [Google Scholar] [CrossRef]
- Milinčić, D.D.; Stanisavljević, N.S.; Kostić, A.Ž.; Gašić, U.M.; Stanojević, S.P.; Tešić, Ž.L.; Pešić, M.B. Bioaccessibility of Phenolic Compounds and Antioxidant Properties of Goat-Milk Powder Fortified with Grape-Pomace-Seed Extract after In Vitro Gastrointestinal Digestion. Antioxidants 2022, 11, 2164. [Google Scholar] [CrossRef] [Scilit] [PubMed]
- Ruiz, H.A.; Galbe, M.; Garrote, G.; Ramirez-Gutierrez, D.M.; Ximenes, E.; Sun, S.-N.; Lachos-Perez, D.; Rodríguez-Jasso, R.M.; Sun, R.-C.; Yang, B.; et al. Severity Factor Kinetic Model as a Strategic Parameter of Hydrothermal Processing (Steam Explosion and Liquid Hot Water) for Biomass Fractionation under Biorefinery Concept. Bioresour. Technol. 2021, 342, 125961. [Google Scholar] [CrossRef] [Scilit] [PubMed]
- Duba, K.S.; Casazza, A.A.; Mohamed, H.B.; Perego, P.; Fiori, L. Extraction of Polyphenols from Grape Skins and Defatted Grape Seeds Using Subcritical Water: Experiments and Modeling. Food Bioprod. Process. 2015, 94, 29–38. [Google Scholar] [CrossRef] [Scilit]
- Cheng, Y.; Xue, F.; Yu, S.; Du, S.; Yang, Y. Subcritical Water Extraction of Natural Products. Molecules 2021, 26, 4004. [Google Scholar] [CrossRef] [Scilit] [PubMed]
- Monrad, J.K.; Howard, L.R.; King, J.W.; Srinivas, K.; Mauromoustakos, A. Subcritical Solvent Extraction of Anthocyanins from Dried Red Grape Pomace. J. Agric. Food Chem. 2010, 58, 2862–2868. [Google Scholar] [CrossRef] [Scilit] [PubMed]
- Pedras, B.; Salema-Oom, M.; Sá-Nogueira, I.; Simões, P.; Paiva, A.; Barreiros, S. Valorization of White Wine Grape Pomace through Application of Subcritical Water: Analysis of Extraction, Hydrolysis, and Biological Activity of the Extracts Obtained. J. Supercrit. Fluids 2017, 128, 138–144. [Google Scholar] [CrossRef] [Scilit]
- Artiushenko, O.; Zaitsev, V. Competing Ligand Exchange-Solid Phase Extraction Method of Polyphenols from Wine. Microchem. J. 2023, 191, 108917. [Google Scholar] [CrossRef] [Scilit]
- Singleton, V.L.; Orthofer, R.; Lamuela-Raventós, R.M. [14] Analysis of Total Phenols and Other Oxidation Substrates and Antioxidants by Means of Folin-Ciocalteu Reagent. Methods Enzymol. 1999, 299, 152–178. [Google Scholar] [CrossRef] [Scilit]
- Puissant, A.; Léon, H. La Matière Colorante Des Grains de Raisins de Certains Cépages Cultivés En Anjou En 1965. Ann. Technol. Agric. 1967, 16, 217–226. [Google Scholar]
- Brand-Williams, W.; Cuvelier, M.E.; Berset, C. Use of a Free Radical Method to Evaluate Antioxidant Activity. LWT—Food Sci. Technol. 1995, 28, 25–30. [Google Scholar] [CrossRef] [Scilit]
- Freitas, P.A.V.; González-Martínez, C.; Chiralt, A. Application of Ultrasound Pre-Treatment for Enhancing Extraction of Bioactive Compounds from Rice Straw. Foods 2020, 9, 1657. [Google Scholar] [CrossRef] [Scilit] [PubMed]
- Zhou, Z.; Yang, D. Economical and Eco-Friendly Isolation of Anthocyanins from Grape Pomace with Higher Efficiency. Food Chem. X 2022, 15, 100419. [Google Scholar] [CrossRef] [Scilit] [PubMed]
- Fan, R.; Gao, Y. Maillard and Hydrolytic Reactions in Subcritical Water Extraction of Bioactive Compounds from Licorice. Molecules 2022, 27, 6851. [Google Scholar] [CrossRef] [Scilit] [PubMed]
- Plaza, M.; Amigo-Benavent, M.; Del Castillo, M.D.; Ibáñez, E.; Herrero, M. Facts about the Formation of New Antioxidants in Natural Samples after Subcritical Water Extraction. Food Res. Int. 2010, 43, 2341–2348. [Google Scholar] [CrossRef] [Scilit]
- Plaza, M.; Amigo-Benavent, M.; Del Castillo, M.D.; Ibáñez, E.; Herrero, M. Neoformation of Antioxidants in Glycation Model Systems Treated under Subcritical Water Extraction Conditions. Food Res. Int. 2010, 43, 1123–1129. [Google Scholar] [CrossRef] [Scilit]
- Aliakbarian, B.; Fathi, A.; Perego, P.; Dehghani, F. Extraction of Antioxidants from Winery Wastes Using Subcritical Water. J. Supercrit. Fluids 2012, 65, 18–24. [Google Scholar] [CrossRef] [Scilit]
- Drosou, C.; Kyriakopoulou, K.; Bimpilas, A.; Tsimogiannis, D.; Krokida, M. A Comparative Study on Different Extraction Techniques to Recover Red Grape Pomace Polyphenols from Vinification Byproducts. Ind. Crops Prod. 2015, 75, 141–149. [Google Scholar] [CrossRef] [Scilit]
- Xu, Y.; Burton, S.; Kim, C.; Sismour, E. Phenolic Compounds, Antioxidant, and Antibacterial Properties of Pomace Extracts from Four Virginia-grown Grape Varieties. Food Sci. Nutr. 2016, 4, 125–133. [Google Scholar] [CrossRef] [Scilit] [PubMed]
- Moll, E.; Freitas, P.A.V.; Chiralt, A. Effect of Active Rice Straw Extracts on the Properties and Migration of PHBV Films. Food Packag. Shelf Life 2025, 48, 101454. [Google Scholar] [CrossRef] [Scilit]
- Ursu, M.S.; Aprodu, I.; Milea, Ș.A.; Enachi, E.; Râpeanu, G.; Bahrim, G.E.; Stănciuc, N. Thermal Degradation Kinetics of Anthocyanins Extracted from Purple Maize Flour Extract and the Effect of Heating on Selected Biological Functionality. Foods 2020, 9, 1593. [Google Scholar] [CrossRef] [Scilit] [PubMed]
- Rodriguez-Amaya, D.B. Update on Natural Food Pigments—A Mini-Review on Carotenoids, Anthocyanins, and Betalains. Food Res. Int. 2019, 124, 200–205. [Google Scholar] [CrossRef] [Scilit] [PubMed]
- Jiang, B.; Liu, Y.; Bhandari, B.; Zhou, W. Impact of Caramelization on the Glass Transition Temperature of Several Caramelized Sugars. Part I: Chemical Analyses. J. Agric. Food Chem. 2008, 56, 5138–5147. [Google Scholar] [CrossRef] [Scilit] [PubMed]
- Einhorn-Stoll, U.; Kunzek, H.; Dongowski, G. Thermal Analysis of Chemically and Mechanically Modified Pectins. Food Hydrocoll. 2007, 21, 1101–1112. [Google Scholar] [CrossRef] [Scilit]
- Saavedra-Leos, Z.; Leyva-Porras, C.; Araujo-Díaz, S.; Toxqui-Terán, A.; Borrás-Enríquez, A. Technological Application of Maltodextrins According to the Degree of Polymerization. Molecules 2015, 20, 21067–21081. [Google Scholar] [CrossRef] [Scilit] [PubMed]
- Calderón-Santoyo, M.; Calderón-Chiu, C.; Ragazzo-Sánchez, J.A. Characterisation of Hydrophilic Bioactive Extracts of Fruits from Mexico: Phenolic Content, Thermal and Kinetic and Thermodynamic Analysis. Plant Foods Hum. Nutr. 2025, 80, 83. [Google Scholar] [CrossRef] [Scilit] [PubMed]
- Lu, Y.; Lu, Y.-C.; Hu, H.-Q.; Xie, F.-J.; Wei, X.-Y.; Fan, X. Structural Characterization of Lignin and Its Degradation Products with Spectroscopic Methods. J. Spectrosc. 2017, 2017, 8951658. [Google Scholar] [CrossRef] [Scilit]
- Yang, H.; Yan, R.; Chen, H.; Lee, D.H.; Zheng, C. Characteristics of Hemicellulose, Cellulose and Lignin Pyrolysis. Fuel 2007, 86, 1781–1788. [Google Scholar] [CrossRef] [Scilit]
- Yang, J.; Ching, Y.; Chuah, C. Applications of Lignocellulosic Fibers and Lignin in Bioplastics: A Review. Polymers 2019, 11, 751. [Google Scholar] [CrossRef] [Scilit] [PubMed]
- Abraham, E. Extraction of Nanocellulose Fibrils from Lignocellulosic Fibres: A Novel Approach. Carbohydr. Polym. 2011, 86, 1468–1475. [Google Scholar] [CrossRef] [Scilit]
- Do, N.H.; Pham, H.H.; Le, T.M.; Lauwaert, J.; Diels, L.; Verberckmoes, A.; Do, N.H.N.; Tran, V.T.; Le, P.K. The Novel Method to Reduce the Silica Content in Lignin Recovered from Black Liquor Originating from Rice Straw. Sci. Rep. 2020, 10, 21263. [Google Scholar] [CrossRef] [Scilit] [PubMed]
- Elhussieny, A. Valorisation of Shrimp and Rice Straw Waste into Food Packaging Applications. Ain Shams Eng. J. 2020, 11, 1219–1226. [Google Scholar] [CrossRef] [Scilit]
- Freitas, P.A.V.; González-Martínez, C.; Chiralt, A. Applying Ultrasound-Assisted Processing to Obtain Cellulose Fibres from Rice Straw to Be Used as Reinforcing Agents. Innov. Food Sci. Emerg. Technol. 2022, 76, 102932. [Google Scholar] [CrossRef] [Scilit]
- Olejar, K.J.; Ricci, A.; Swift, S.; Zujovic, Z.; Gordon, K.C.; Fedrizzi, B.; Versari, A.; Kilmartin, P.A. Characterization of an Antioxidant and Antimicrobial Extract from Cool Climate, White Grape Marc. Antioxidants 2019, 8, 232. [Google Scholar] [CrossRef] [Scilit] [PubMed]
- Esposito, T.; Paolucci, M.; Sansone, F.; Mencherini, T.; Pacifico, S.; Volpe, M.G. Exploitation and Valorization of Agro-Food Wastes from Grape Harvesting: Production, Characterization of MAE-Extracts from Vitis Vinifera Leaves and Stabilization in Microparticulate Powder Form. Appl. Sci. 2021, 11, 5827. [Google Scholar] [CrossRef] [Scilit]
- Lorevice, M.V.; Otoni, C.G.; Moura, M.R.D.; Mattoso, L.H.C. Chitosan Nanoparticles on the Improvement of Thermal, Barrier, and Mechanical Properties of High- and Low-Methyl Pectin Films. Food Hydrocoll. 2016, 52, 732–740. [Google Scholar] [CrossRef] [Scilit]
- Wei, H.; Pascall, M.A. Evaluation of Structural and Functional Properties of Citrus Pectin Film Enriched with Green Tea Extract. Polym. Eng. Sci. 2023, 63, 2522–2533. [Google Scholar] [CrossRef] [Scilit]
- Ribeiro, A.C.B.; Cunha, A.P.; Da Silva, L.M.R.; Mattos, A.L.A.; De Brito, E.S.; De Souza Filho, M.D.S.M.; De Azeredo, H.M.C.; Ricardo, N.M.P.S. From Mango By-Product to Food Packaging: Pectin-Phenolic Antioxidant Films from Mango Peels. Int. J. Biol. Macromol. 2021, 193, 1138–1150. [Google Scholar] [CrossRef] [Scilit] [PubMed]
- Singthong, J.; Cui, S.; Ningsanond, S.; Goff, H.D. Structural Characterization, Degree of Esterification and Some Gelling Properties of Krueo Ma Noy (Cissampelos pareira) Pectin. Carbohydr. Polym. 2004, 58, 391–400. [Google Scholar] [CrossRef] [Scilit]
- Ilaslan, K.; Ozgolet, M.; Karasu, S. Rapid Detection of Maltodextrin Adulteration in Pomegranate Sour Using ATR-FTIR Spectroscopy and Chemometrics. J. Food Compos. Anal. 2025, 140, 107313. [Google Scholar] [CrossRef] [Scilit]
- Kang, Y.-R.; Lee, Y.-K.; Kim, Y.J.; Chang, Y.H. Characterization and Storage Stability of Chlorophylls Microencapsulated in Different Combination of Gum Arabic and Maltodextrin. Food Chem. 2019, 272, 337–346. [Google Scholar] [CrossRef] [Scilit] [PubMed]
- Tabani, H.; Mahyari, M.; Sahragard, A.; Fakhari, A.R.; Shaabani, A. Evaluation of Sulfated Maltodextrin as a Novel Anionic Chiral Selector for the Enantioseparation of Basic Chiral Drugs by Capillary Electrophoresis. Electrophoresis 2015, 36, 305–311. [Google Scholar] [CrossRef] [Scilit] [PubMed]
- Le Bourvellec, C.; Renard, C.M.G.C. Interactions between Polyphenols and Macromolecules: Quantification Methods and Mechanisms. Crit. Rev. Food Sci. Nutr. 2012, 52, 213–248. [Google Scholar] [CrossRef] [Scilit] [PubMed]
- Liang, J.; Li, H.; Han, M.; Gao, Z. Polysaccharide-Polyphenol Interactions: A Comprehensive Review from Food Processing to Digestion and Metabolism. Crit. Rev. Food Sci. Nutr. 2025, 65, 3459–3475. [Google Scholar] [CrossRef] [Scilit] [PubMed]

Disclaimer/Publisher’s Note: The statements, opinions and data contained in all publications are solely those of the individual author(s) and contributor(s) and not of MDPI and/or the editor(s). MDPI and/or the editor(s) disclaim responsibility for any injury to people or property resulting from any ideas, methods, instructions or products referred to in the content. |
© 2026 by the authors. Licensee MDPI, Basel, Switzerland. This article is an open access article distributed under the terms and conditions of the Creative Commons Attribution (CC BY) license.