


Abstract
This paper utilizes only the anti-symmetric fundamental (A0) mode of Lamb waves for tactile sensing to realize a baseline-free ultrasound-based touchscreen. Disk-shaped piezoelectric transducers are mounted in pair on a glass plate to excite and detect pure A0 mode Lamb waves. When there is no finger touch, the symmetric nature of the boundary conditions ensures that the combined output wave signals from paired transducers are basically zero, which eliminates the need for reference or baseline signals. When there is a finger touch, the output wave signals can directly couple with a trained artificial intelligence (AI) model based on a convolutional neural network (CNN) to identify the touch and its touch position. Field tests show the accuracy for tactile position sensing is 96% and is not affected by environmental temperature variation. This demonstrates the effectiveness and robustness of the proposed baseline-free Lamb wave touchscreen as a human–machine interface.
1. Introduction
Touch recognition technology has marked a revolutionary shift in human–machine interaction from traditional buttons to touch recognition. Touchscreens are now widely used in various aspects of life and in numerous commercial electronic devices, including mobile phones, tablets, laptops, and display panels. Mainstream touch technology can be categorized into four major types based on sensor principles: resistive touch technology, capacitive touch technology, optical touch technology, and acoustic wave touch technology [1]. Among these, touchscreens based on acoustic waves have recently gained significant attention due to their potential advantages, such as relatively simplified sensing structures, lower fabrication costs, and broader applicability to a variety of solids.
Both surface acoustic waves (SAWs) and guided plate waves (or Lamb waves) have been utilized in acoustic wave touchscreens. Ultrasound touchscreens based on SAWs [2,3] have been proposed and implemented over three decades. The Rayleigh-type surface wave has energy concentrated in the near-surface region and hence can propagate on the surface of a solid for a long distance. However, a significant disadvantage of SAW-type touchscreens is their vulnerability to surface contamination. On the other hand, Lamb waves propagating in plates are now intensively investigated and applied to touch recognition [4,5,6,7,8,9,10,11,12,13,14,15,16]. There are many modes of Lamb waves with different characteristics that can be explored for realizing a Lamb wave touchscreen.
There are two basic types of Lamb wave touchscreens: passive and active. In passive touchscreens [4,5,6], the Lamb waves are generated directly by the impact of finger touch, and the induced wave signals are recorded and analyzed. The touch position is then inversely deduced from a source-locating algorithm based on the time-reversal method [4] or time arrival [5,6] of transient elastic waves. In active touchscreens, the Lamb waves are independently generated and detected by ultrasound transducers mounted on the plate. In most cases, piezoelectric transducers are used for generating and detecting Lamb waves in a plate. Since a finger touch can alter the wave propagation behaviors, monitoring and analyzing the acquired wave signals constantly allows detection of touch events and the localization of touch positions. Obviously, active Lamb wave touchscreens [7,8,9,10,11,12,13,14,15,16] are generally more reliable and robust than passive ones. Therefore, this paper focuses on active Lamb wave touchscreens based on piezoelectric transducers.
The most challenging issue in active Lamb wave touchscreens is how to extract key features from received wave signals and link these features to the touch event and its position. Various approaches have been adopted before to deal with this challenge. One method for determining the finger touch location involves identifying the time-of-flight of Lamb waves reflected by the finger touch and detected by wave-receiving transducers at multiple locations [7]. The touch locations can then be pinpointed based on the time-of-flight, locations of receiving transducers, and wave velocities. However, it is difficult to correctly identify the reflected wave signals from finger touch in reverberant, dispersive, and noisy wave signals.
Another approach for touch position localization involves wave pattern recognition algorithms. The basic idea is to establish the correlation between finger touch position and variation in received Lamb wave signals through a learning or training process [8,9,10]. Typically, the tactile sensing area is first divided into an array of grids or pixels. The wave signals without finger touch and with external touches by an object (e.g., pencil, phantom or artificial finger) on each grid or pixel are experimentally obtained and pre-stored in a computer. These signal waveforms serve as reference signals for comparison. When the plate is touched, the received Lamb wave signals are processed by an algorithm with the pre-stored reference signals to extract a correlation or similarity function on x-y coordinates, which is then used to estimate the touch position. Similar approaches based on analyzing the amplitude disturbed diffraction pattern [11,12,13] of Lamb waves induced by finger touch were also reported and have also been extended for determining touch force [13].
In recent years, emerging artificial intelligence (AI) and machine learning technologies have been introduced and adopted in Lamb-wave-based touchscreens [14,15,16]. The system configuration and basic idea are similar to what has been described in the previous paragraph, except that the pattern recognition or waveform comparison algorithm is replaced by a trained AI model. This model is based on a pre-collected dataset of wave signals acquired without or with an object touching each grid or pixel. Once the AI model is established and validated, touching events and their position can be determined by constantly feeding the received Lamb wave signals to the AI model, thus fulfilling the purpose of human–machine interfacing through the Lamb wave touchscreen.
It should be noted that, in reported cases of applying AI and machine learning to Lamb wave touchscreens [17,18,19], the input signals to the AI model from receiving transducers are actually the difference between received signals and their counterparts when there is no finger touch. The latter are known as the reference or baseline waveforms, which are experimentally measured beforehand, pre-stored in computer memory, and repeatedly used as references for waveform subtraction during touch sensing. A critical issue with this approach is that the AI model can be less accurate or even inaccurate if the baseline signals are drifting away due to long-term use or environmental impacts on the system.
To address the issue of baseline signal drift, this paper proposes a Lamb wave touchscreen that utilizes only the pure fundamental anti-symmetric mode (A0 mode) of Lamb waves in a glass plate. The Lamb waves are generated by a pair of identical piezoelectric transducers attached separately on both surfaces of the glass plate at the same location. The paired transducers are electrically energized in an anti-symmetric manner, ensuring that only anti-symmetric Lamb waves are excited. The operating frequency is set deliberately below the cut-off frequency of fundamental Lamb wave modes, allowing only the A0 mode to be excited. Furthermore, wave detection is also performed by another pair of piezoelectrical transducers placed on both the bottom and top surfaces of the glass plate in a symmetric manner. By adding the two signals, which are anti-symmetric with each other, differential measurement on the A0 mode Lamb waves can be performed, resulting in an output waveform signal that remains close to zero when there is no finger touch. This implies the baseline signals are effectively zero, eliminating the need for pre-stored reference signals. When the glass plate is touched by a finger, it locally alters the surface boundary conditions and their symmetry. This disturbance disrupts the anti-symmetric nature of the signal waveforms simultaneously received from paired transducers, generating a detectable output signal waveform when adding them together. This mechanism, coupled with an AI model, enables a very sensitive and robust Lamb wave touchscreen that operates in a baseline-free manner.
2. Experimental Setup
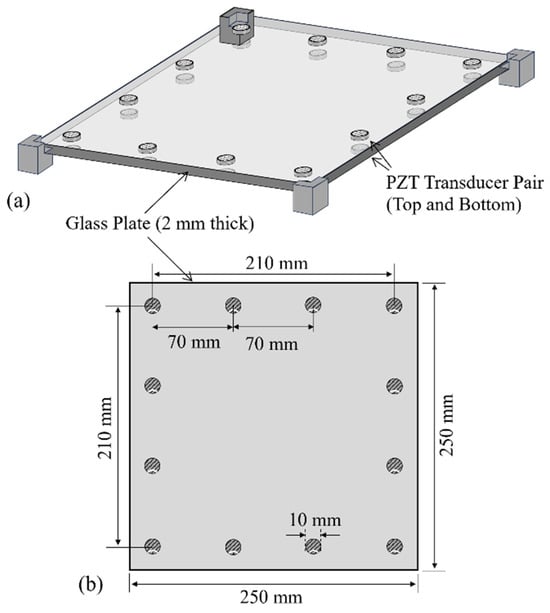
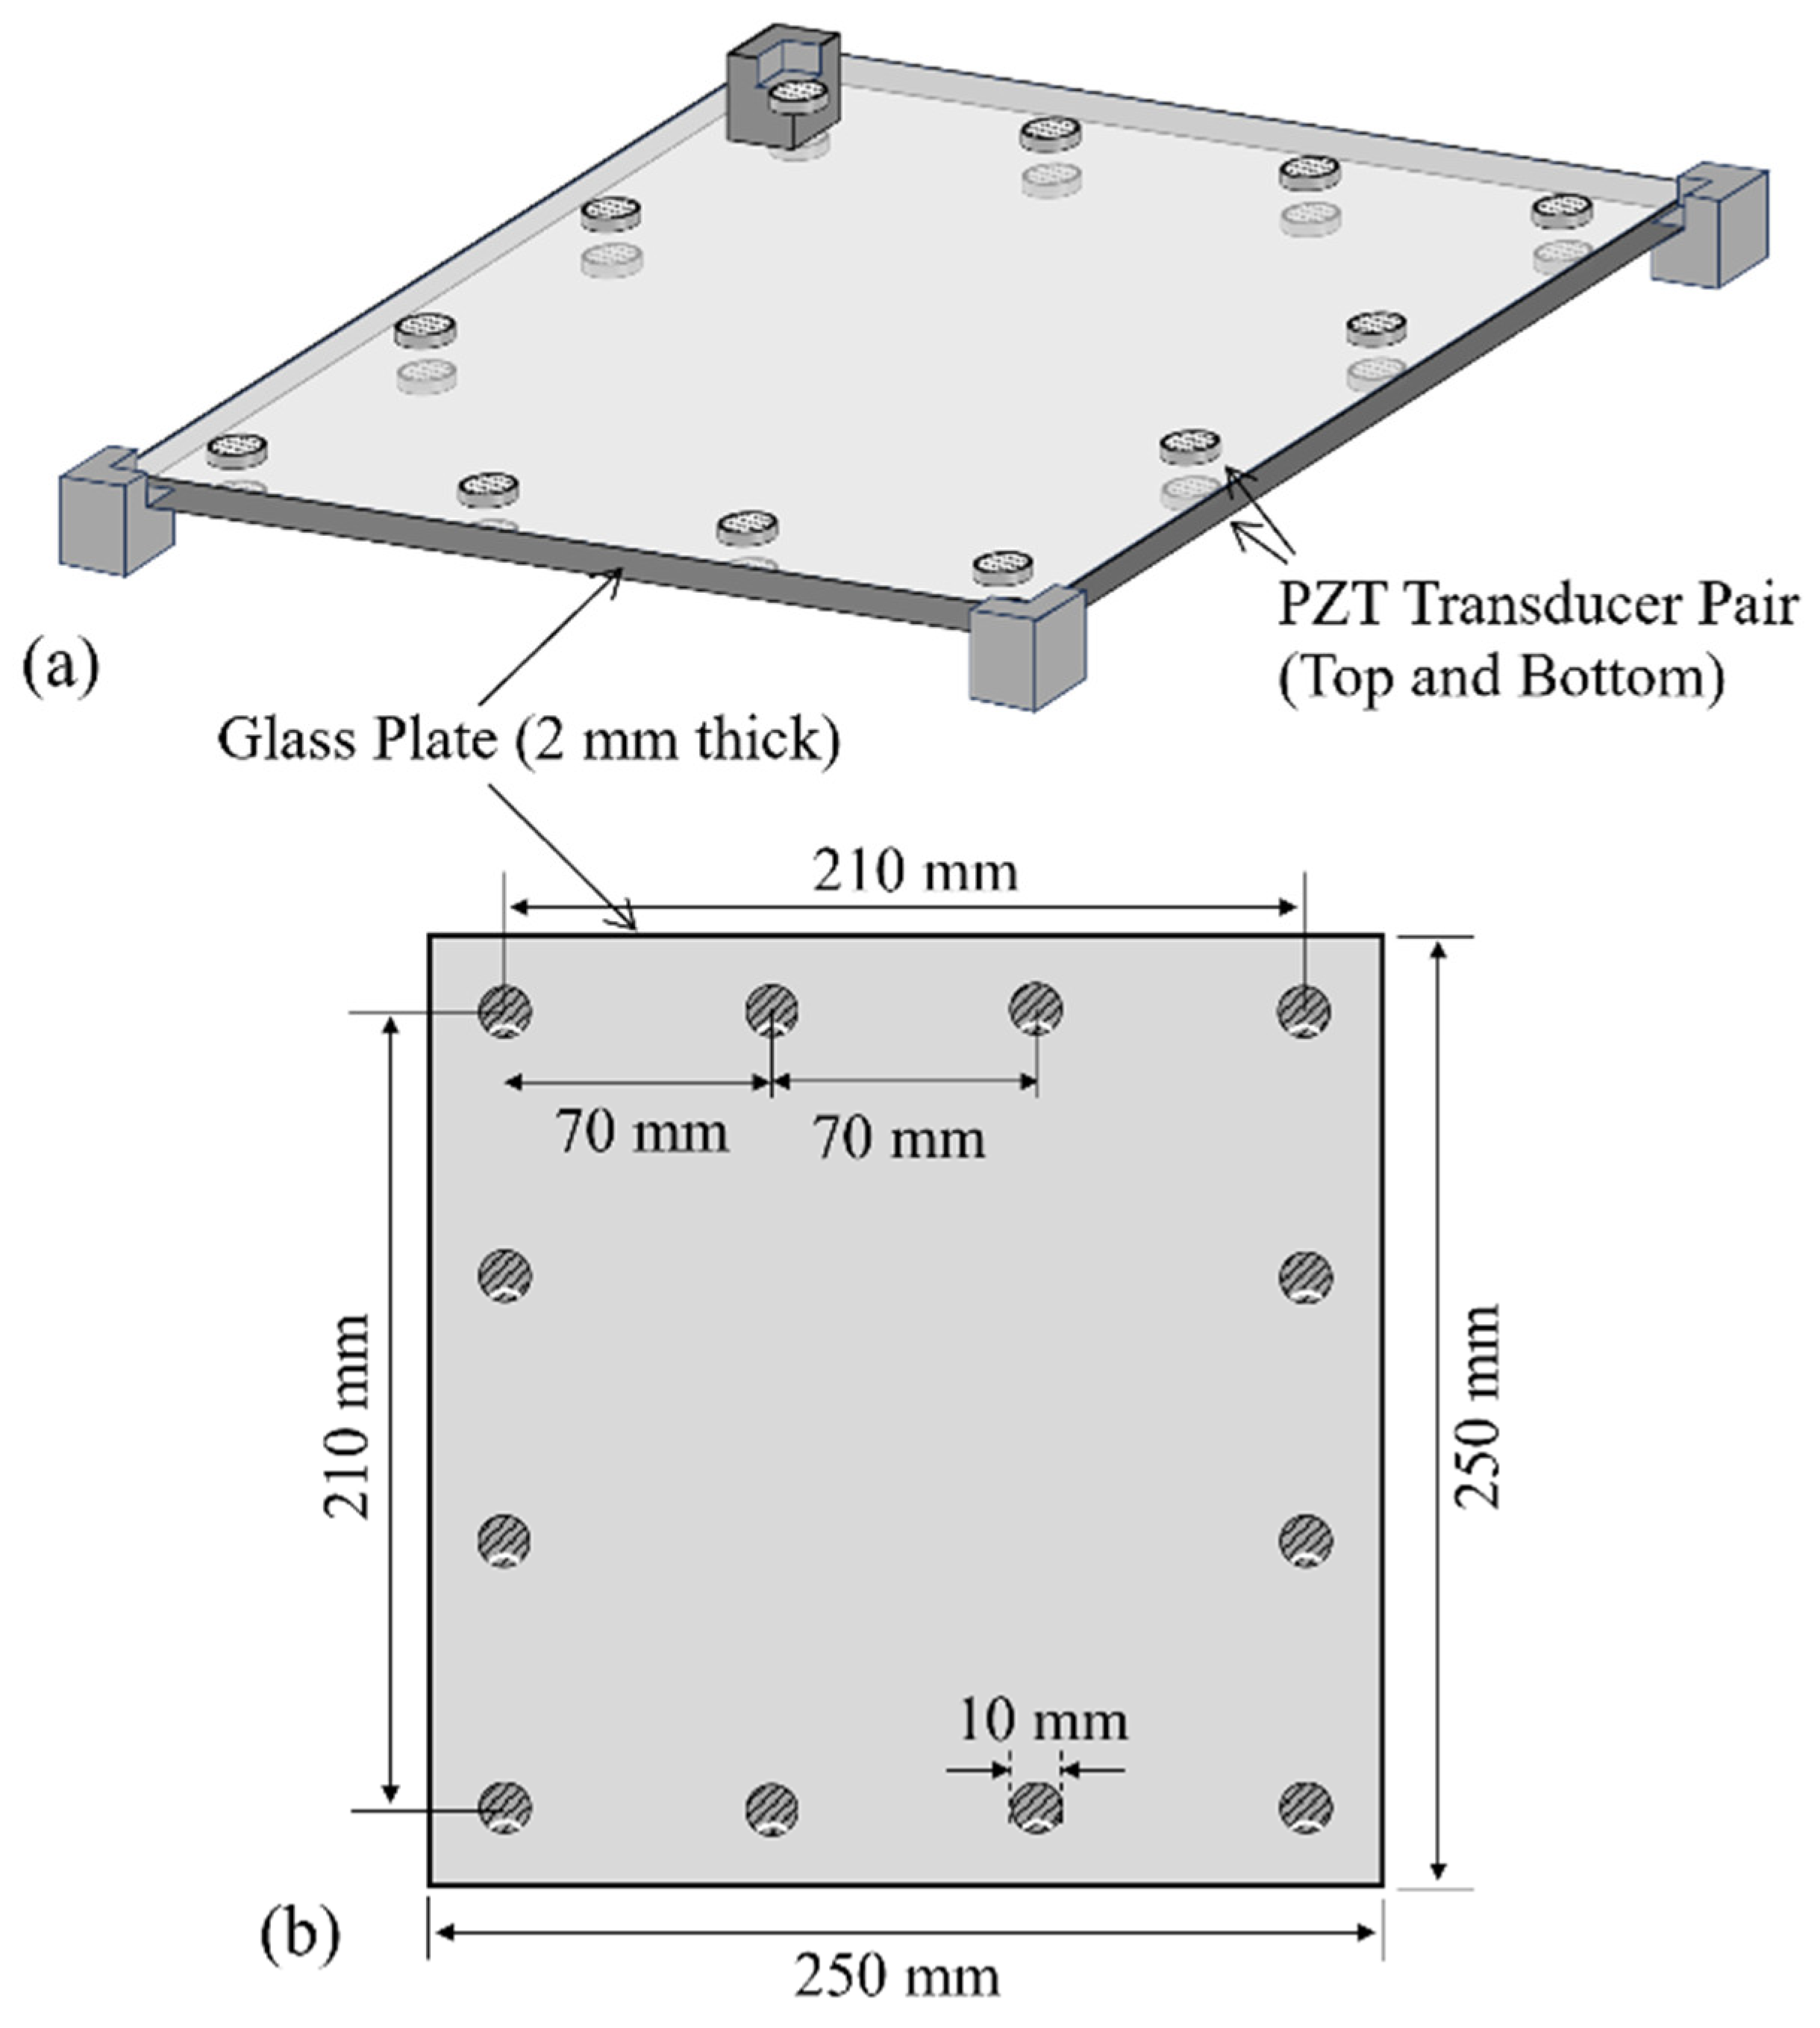
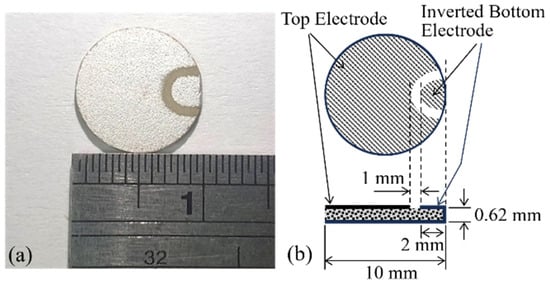
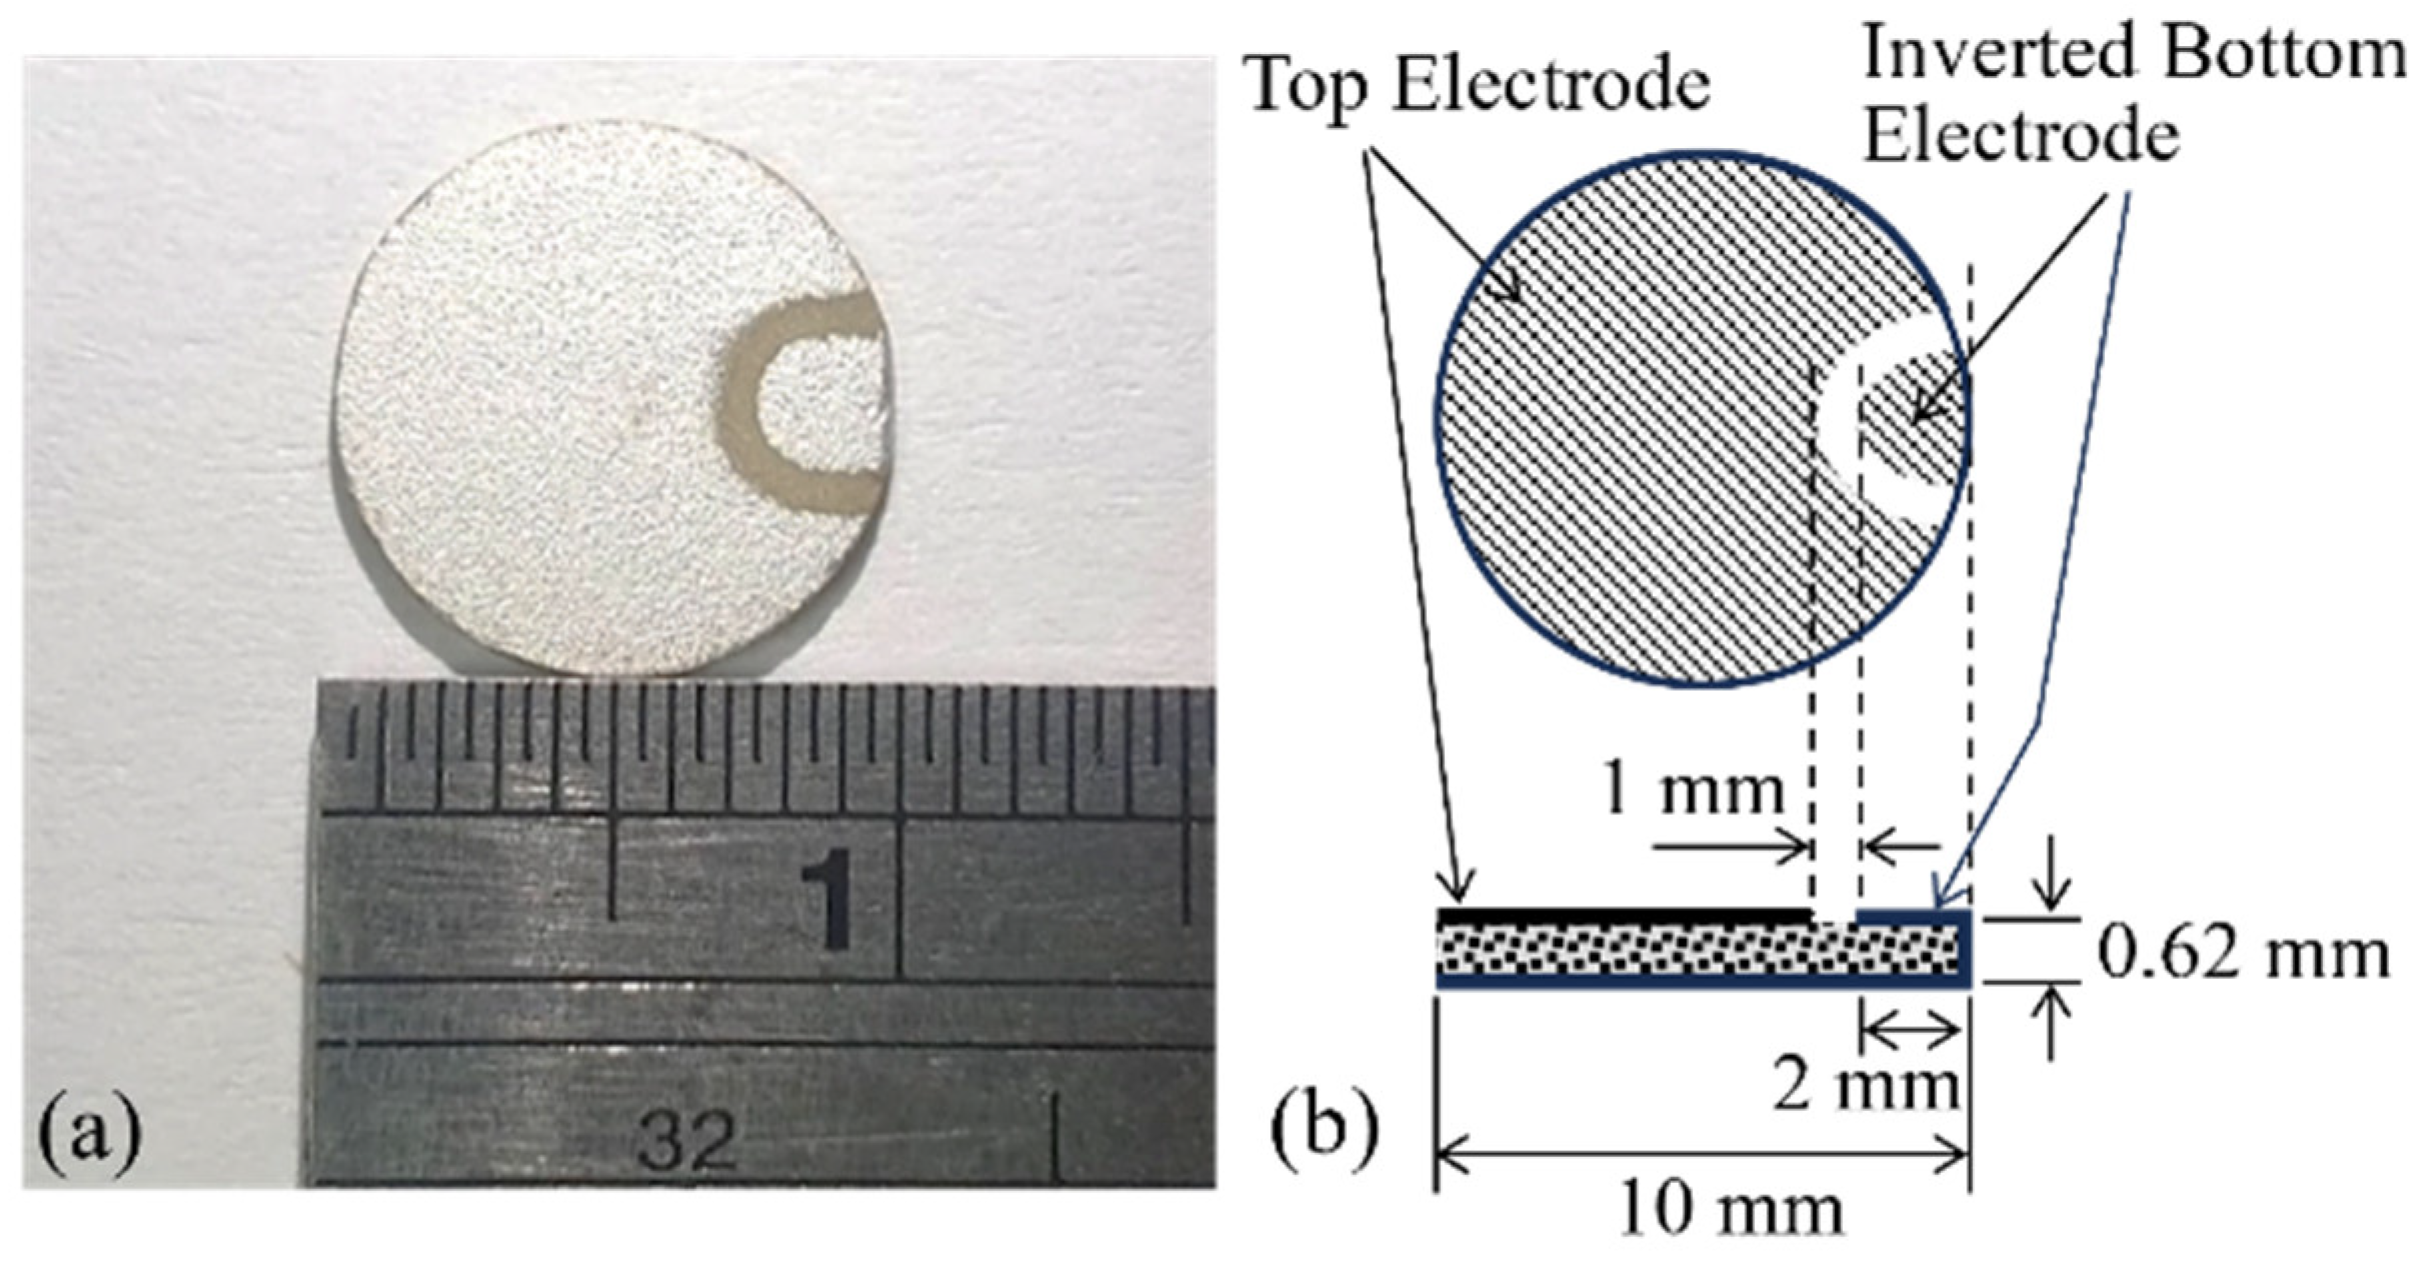
Figure 1a illustrates the configuration of a tactile sensing panel, which is a glass plate attached with paired piezoelectric transducers for generating and detecting Lamb waves. This transparent touch panel can overlay a screen to create a human–machine interface. Disk-shaped piezoelectric transducers are placed at the corners and along the four edges of the glass plate, which measures 2 mm in thickness and 250 × 250 mm2 in size. As depicted in Figure 1, the transducers are in pair, meaning identical piezoelectric transducers are mounted on the top and bottom surfaces of the glass plate at the same location. As shown in Figure 2, these disk-shaped transducers are made of PZT ceramics (PZT-5H, KeiYu NDT Supply Co., Taipei, Taiwan) with a 0.62 mm thickness and a 10 mm diameter. Each PZT disk transducer is coated with a top and an inverted bottom electrode, facilitating easy attachment to the glass surface using epoxy-based glue and enabling electrical connections for exciting and/or receiving waves propagating in the glass plate.
Figure 1.
Configuration of the tactile sensing panel based on Lamb waves, (a) a glass plate mounted with piezoelectric transducers in pairs at the corners and along the edges, and (b) the geometrical dimensions of the glass plate and the locations of mounted transducer pairs.
Figure 2.
(a) A photo and (b) the dimensions of a PZT disk-shaped piezoelectric transducer with top and inverted bottom electrodes.
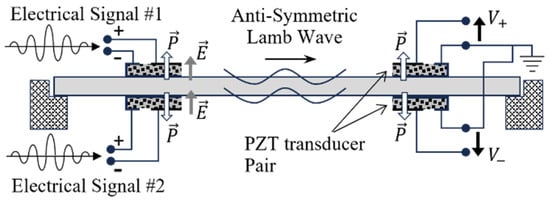
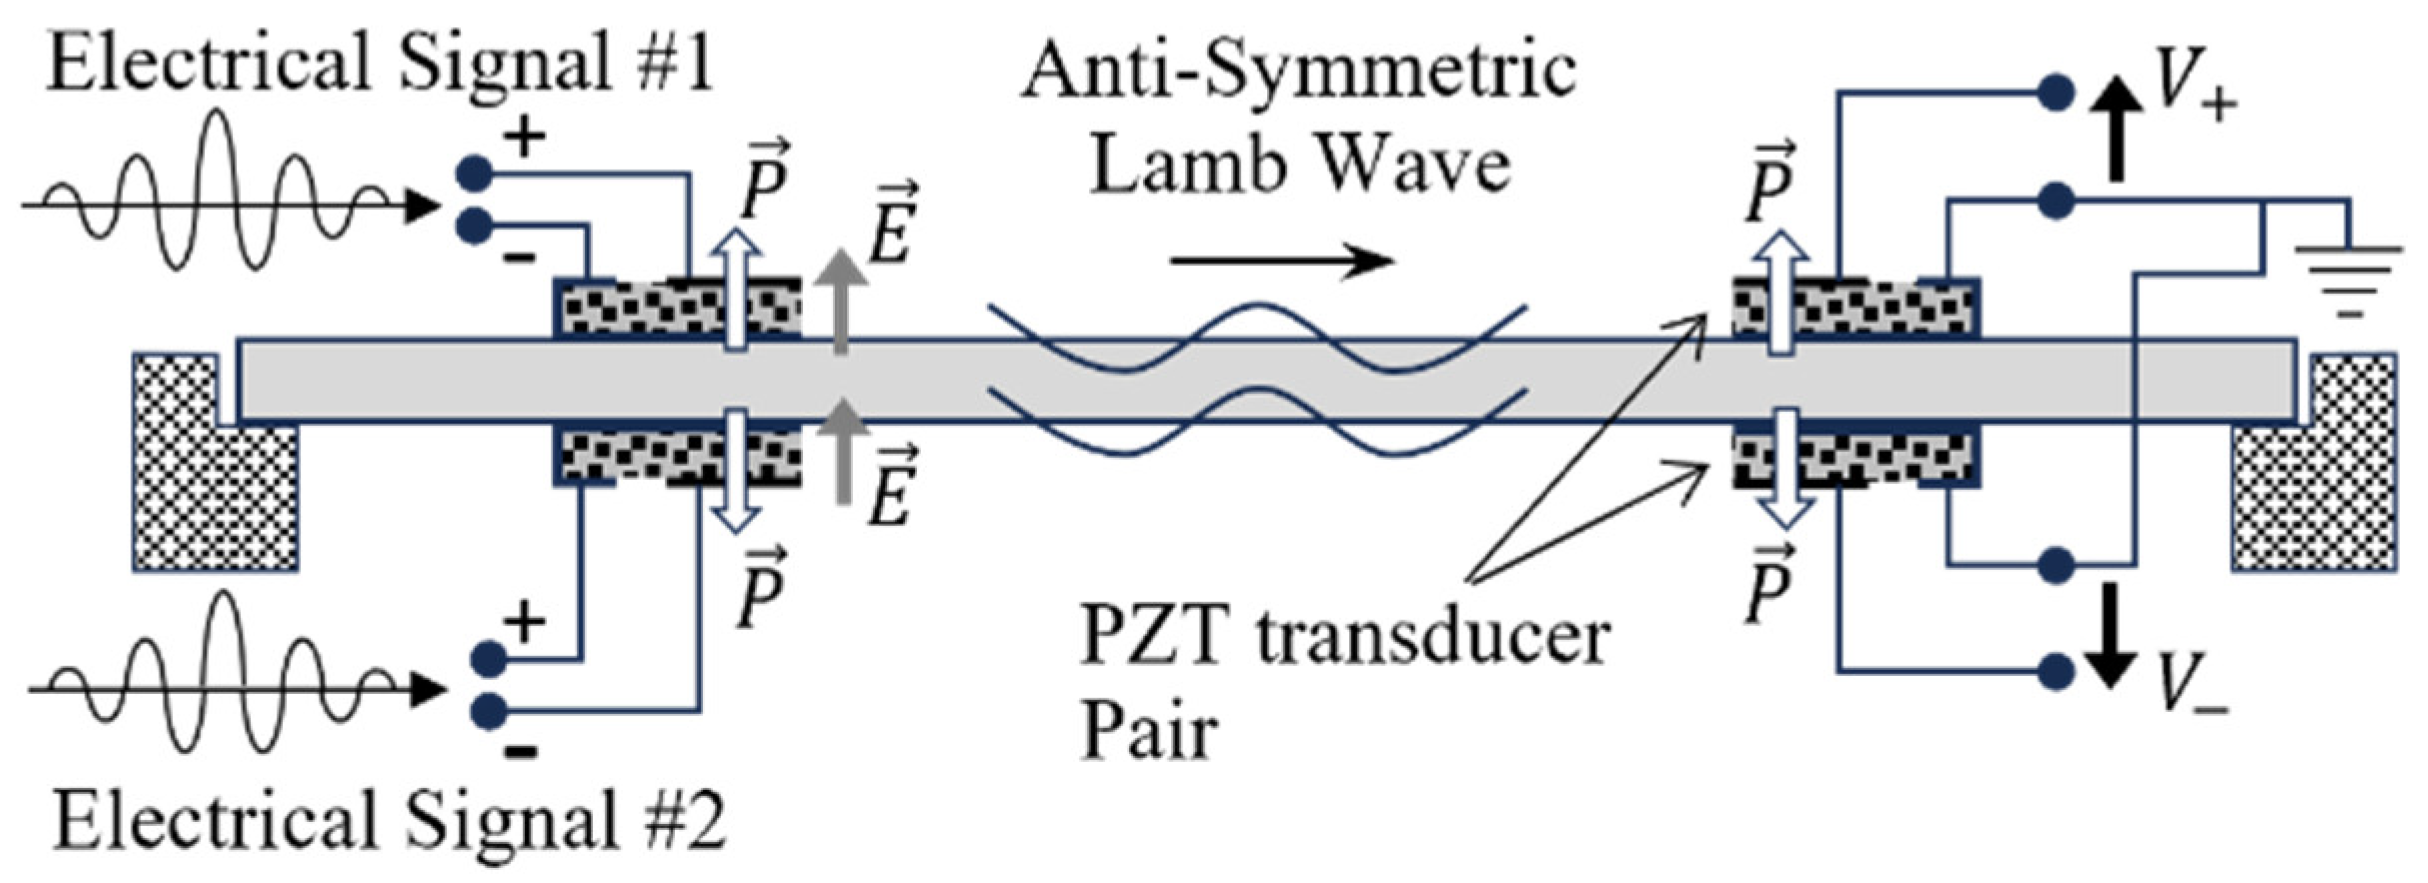
To create a baseline-free sensing system and enhance its sensitivity, our aim is to excite only the fundamental anti-symmetrical (Ao) mode of Lamb waves in the glass plate and then detect a pair of anti-symmetrical signal waveforms from the plate. It is also understood from earlier studies that the A0 mode Lamb wave is most sensitive to tactile sensing. The working principle is schematically presented in Figure 3. Initially, as shown in Figure 3, paired PZT transducers designated for Lamb wave excitation are symmetrically mounted on the glass plate’s left-hand side. In Figure 3, the vectors indicate the intrinsic polarization directions of the PZT transducer and are symmetrical with respect to the glass plate. Applying identical and in-phase electrical signals #1 and #2 to the top and bottom PZT transducers excites only the anti-symmetrical modes of Lamb waves as the electric fields ( in Figure 3) are anti-symmetrical with respect to the glass plate.
Figure 3.
Exciting and receiving pure anti-symmetrical modes of Lamb waves using pairs of PZT transducers symmetrically mounted on a plate.
As illustrated in Figure 3, another pair of PZT transducers is mounted on the right-hand side of the glass plate to receive the signal waveforms of Lamb waves. The wiring on the PZT transducers is arranged so that the voltage signals from the top and bottom transducers, denoted as and in Figure 3, respectively, are in-phase for symmetrical Lamb waves and 180° out of phase for anti-symmetrical ones. Adding these two voltage signals results in a differential signal (), which will be very close to zero when only anti-symmetrical modes are excited. This excitation and differential measurement of anti-symmetrical Lamb waves using paired PZT transducers form the basis of a baseline-free tactile sensing system with high sensitivity.
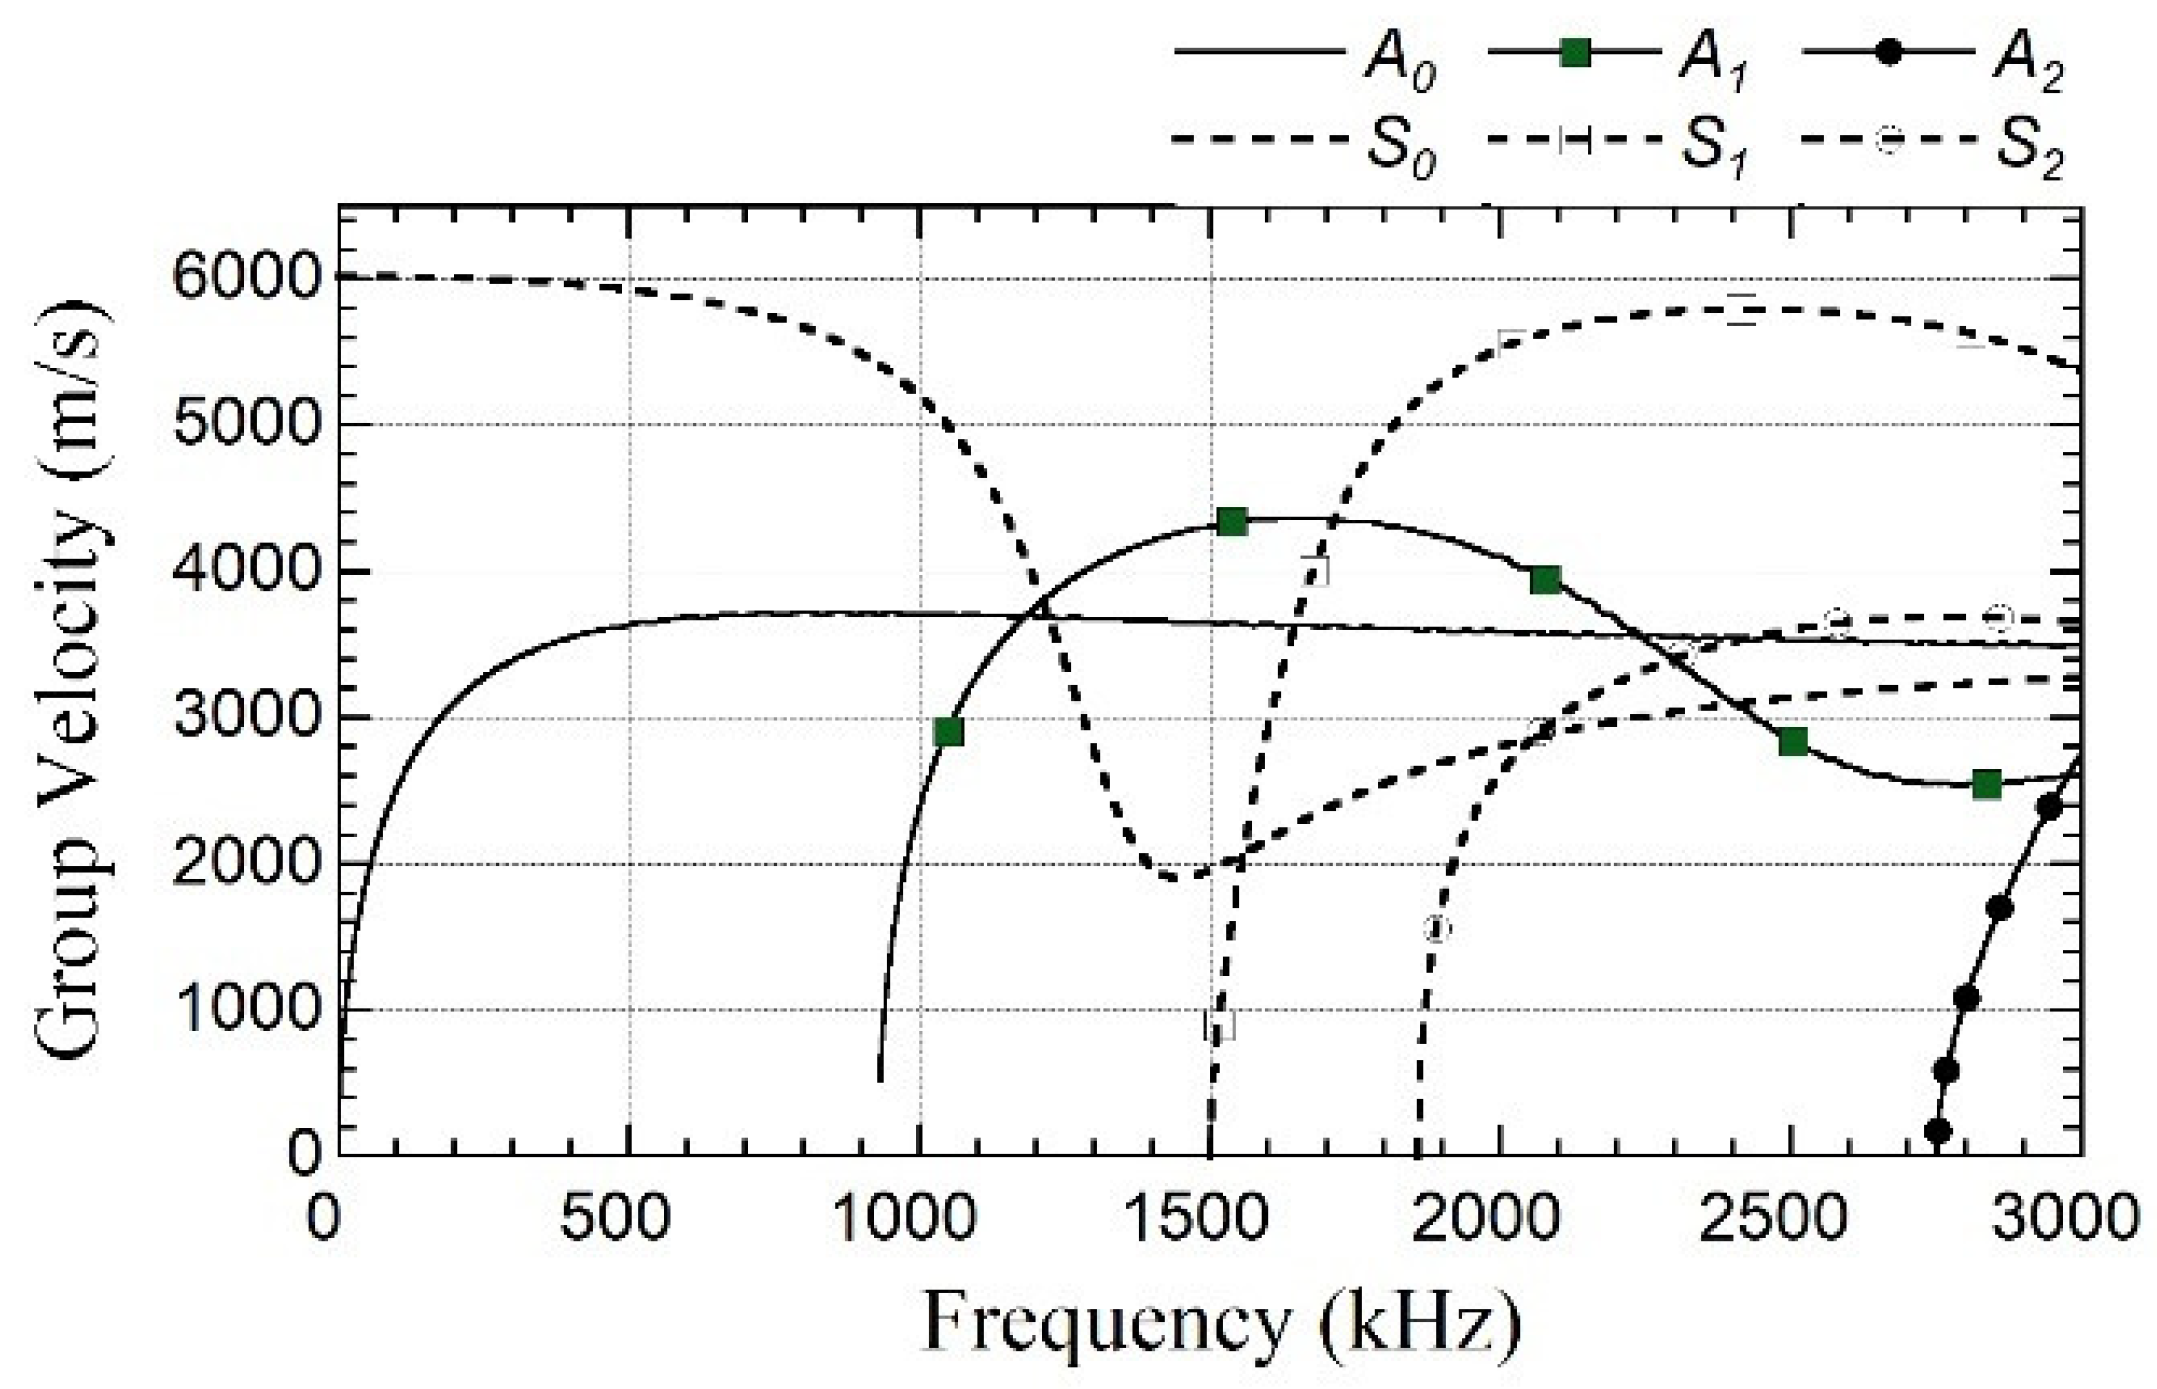
To exclusively excite the Ao mode, we analyze the dispersion curves of the 2 mm thickness glass plate, shown in Figure 4, based on the measured shear wave velocity of 3720 m/s and a Poisson’s ratio of 0.23. The shear wave velocity was measured by a 10 MHz normally incident shear wave transducer (V221-BA-RM, Olympus Co. Westborough, MA, USA) and a 200 MHz pulser/receiver (5900 PR, Olympus Co., MA, USA). The Poison’s ratio was measured by a laboratory-made tensile testing machine along with a dual-axis strain gauge. By ensuring the frequency bandwidth of the electrical signals applied to the transmitting PZT transducer pair remains below the cut-off frequencies of higher Lamb wave modes, only the fundamental modes are excited. The dispersion curves in Figure 4 indicate that the cut-off frequency for higher-order Lamb waves above the fundamental anti-symmetrical (Ao) and symmetrical (So) modes is approximately 920 kHz.
Figure 4.
Dispersion curves of group velocity for Lamb waves in a 2 mm thickness glass plate with a Poisson’s ratio of 0.23 and a shear wave velocity of 3720 m/s.
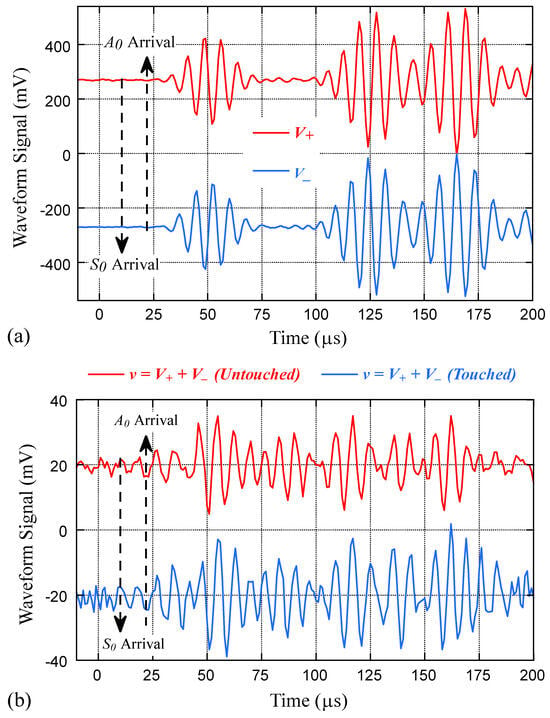
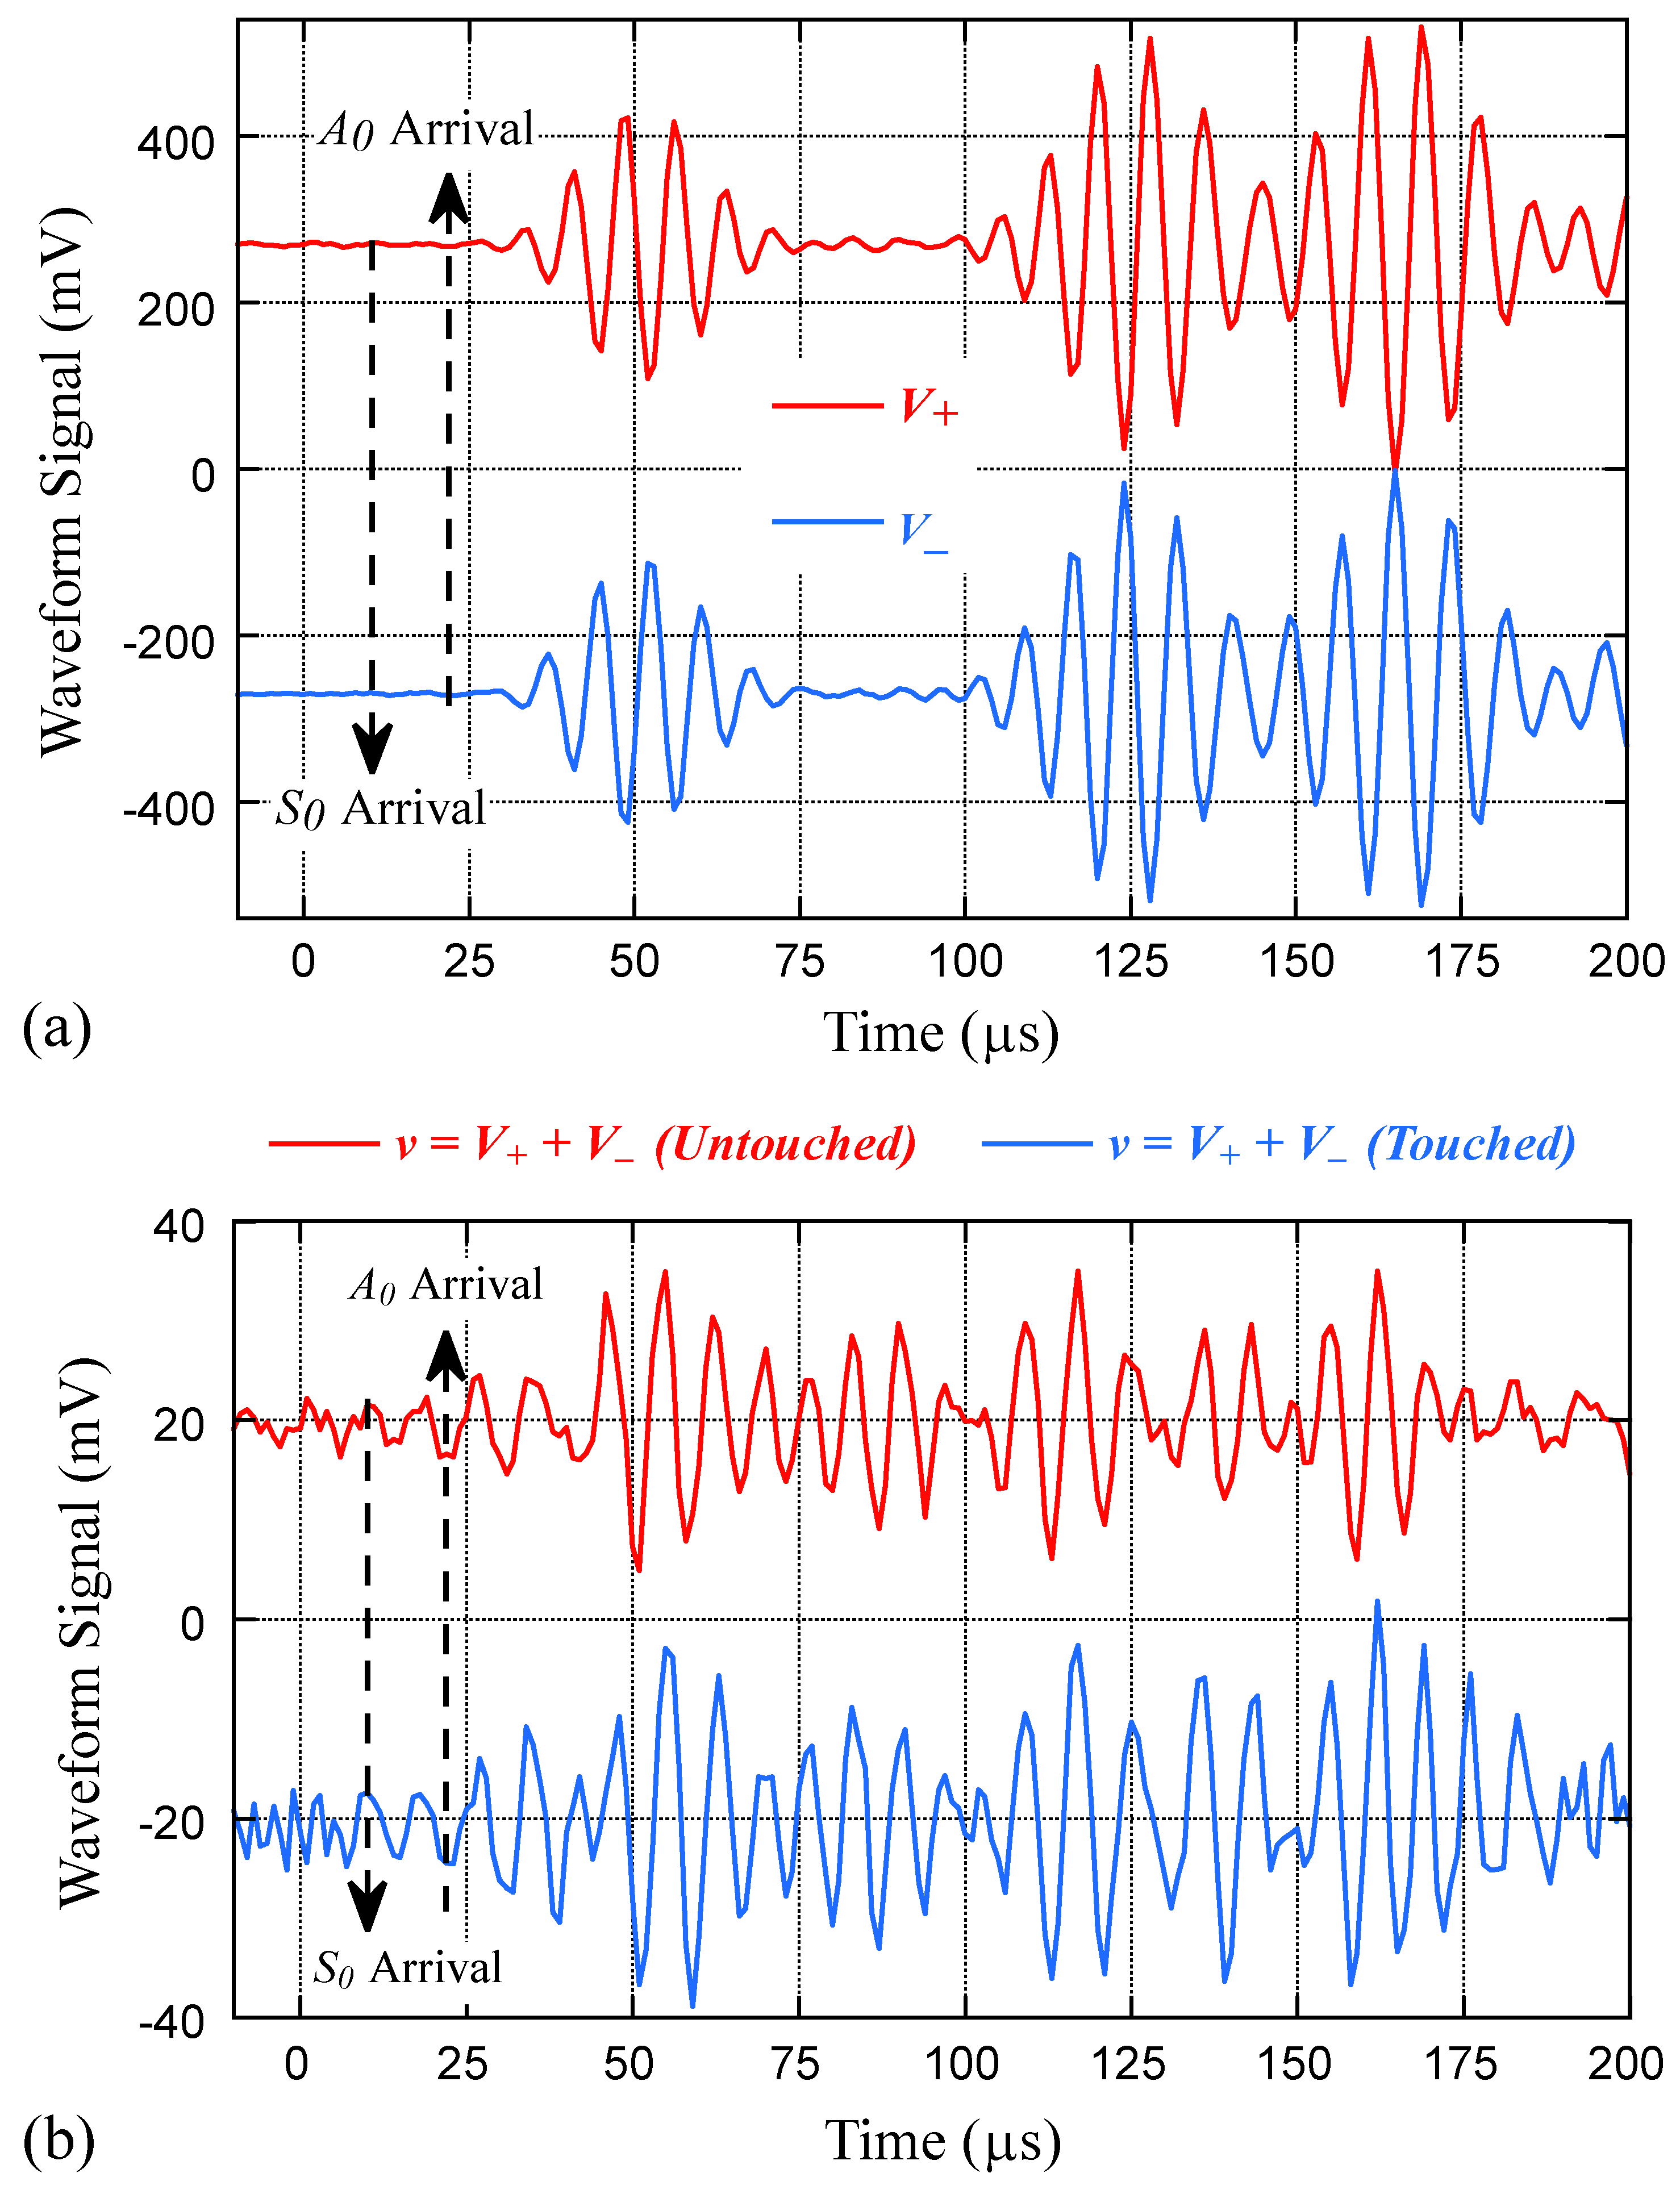
In a preliminary experiment to assess the performance of the proposed Lamb wave measurement system shown in Figure 3, a 125 kHz sinusoidal electrical signal, modulated by a five-cycle Hanning window, is applied to the transmitting PZT transducers. We experimentally scanned the frequency response of the PZT transducers and found that 125 kHz can most effectively generate the needed Lamb waves. This excitation, being fundamentally anti-symmetrical and well below the 920 kHz cut-off frequency, predominantly generates Ao mode Lamb waves. Figure 5a displays the received voltage signals, (red line) and (blue line), from the paired receiving PZT transducers. At 125 kHz frequency, the group velocities for Ao and So modes Lamb waves are 2708 m/s and 6015 m/s, respectively, based on the calculated dispersion curves shown in Figure 4. In this preliminary test, the two pairs of transducers are separated with a distance of 60 mm, and hence the arrival times for So and Ao Lamb waves are estimated to be 9.9 μs and 22.1 μs, respectively, which are marked by arrows in Figure 5a.
Figure 5.
(a) Voltage signals received by top (, the red line) and bottom (, the blue line) PZT transduces, and (b) the added signal of and when no finger touched (red line) and when finger touched (blue line).
From Figure 5a, one can see that the and signals are almost perfectly inverse to each other, confirming the anti-symmetrical nature of Lamb waves generated and detected in the glass plate. The first observed wave packet, modulated at 125 kHz with a 5-cycle Hanning window, arrives approximately at 22.1 μs, as expected for the Ao mode Lamb wave. The signals for the So mode Lamb waves are very small and not observed. This confirms successful excitation and detection of pure Ao mode Lamb waves using paired PZT transducers, as shown in Figure 3. Wave packets with similar characteristics are subsequently observed in Figure 3, which are Lamb waves reflected from the edges of the glass plate. This demonstrates the system’s potential for working under reverberating conditions.
In Figure 5b, the summation of and signals, or the differential signal waveform , is shown as the red line. Since the wave signals are taken when there is no finger touch on the glass plate, this signal waveform is denoted as “Untouched” in Figure 5b. The amplitude of the untouched signal stays within ±5 mV only up to the arrival of the Ao-mode Lamb wave, and can be viewed as background noise. This amplitude is roughly around 1/30 to 1/50 in ratio to the amplitude of Ao wave packets shown in Figure 5a. After the arrival of Ao waves, the amplitude of the signal surges to about ±10 mV, indicating a deviation from expected perfect anti-symmetry. This may be caused by intrinsic variances in the transducers’ material properties or differences in mechanical bonding and electrical wiring. It is not possible to achieve perfect anti-symmetry, and the obtained signal waveforms v(t) shown in Figure 5b will be used for detecting touch events.
Figure 5b also depicts a measured differential signal when a finger is touching the glass plate (the signal in blue color) and hence is denoted as “Touched”. The finger touch can locally disrupt the anti-symmetry in A0 mode Lamb waves and therefore result in signal waveform changes (notably increasing the amplitude) in the signal waveform of during certain periods of time. These changes in signal waveform over time strongly correlate with the touching position, forming the basis for a tactile position sensing on a glass plate equipped with paired PZT transducers, as shown in Figure 1.
Finger touch can affect the propagation of A0-mode Lamb waves in several ways. One mechanism is the absorption of wave energy, which results in signal attenuation. In addition, the touch point may locally reflect, scatter, or diffract the propagating waves, thereby redistributing the wave energy and altering the received waveform in the time domain. In essence, a finger touching one side of the glass plate introduces a localized perturbation that breaks the originally symmetric boundary conditions of the structure. This disturbance influences the propagation behavior of A0-mode Lamb waves through a combination of complex physical mechanisms.
Furthermore, as illustrated in Figure 1b, the geometric relationship among the transmitter, receiver, and finger-touch location can vary significantly, leading to highly diverse wave propagation paths. The situation is further complicated by multiple reflections and mode interactions caused by repeated wave bouncing at the four edges of the glass plate. Consequently, establishing a theoretical or numerical model that accurately correlates the finger-touch position with the resulting waveform variations becomes extremely challenging, if not practically infeasible.
For this reason, the present study adopts machine learning and artificial intelligence (AI) techniques to identify the finger-touch position based on the measured Lamb wave signals. By leveraging the pattern-recognition capability of AI algorithms, the complex relationship between touch location and waveform characteristics can be effectively learned without requiring an explicit analytical model.
3. Tactile Sensing System
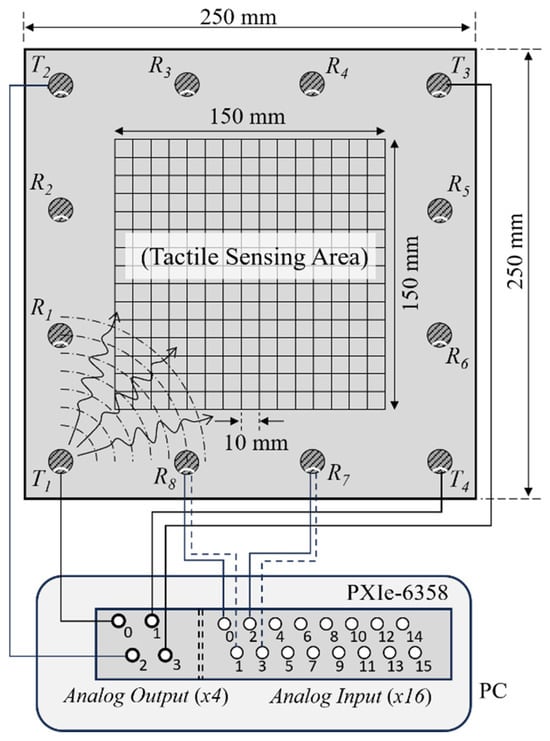
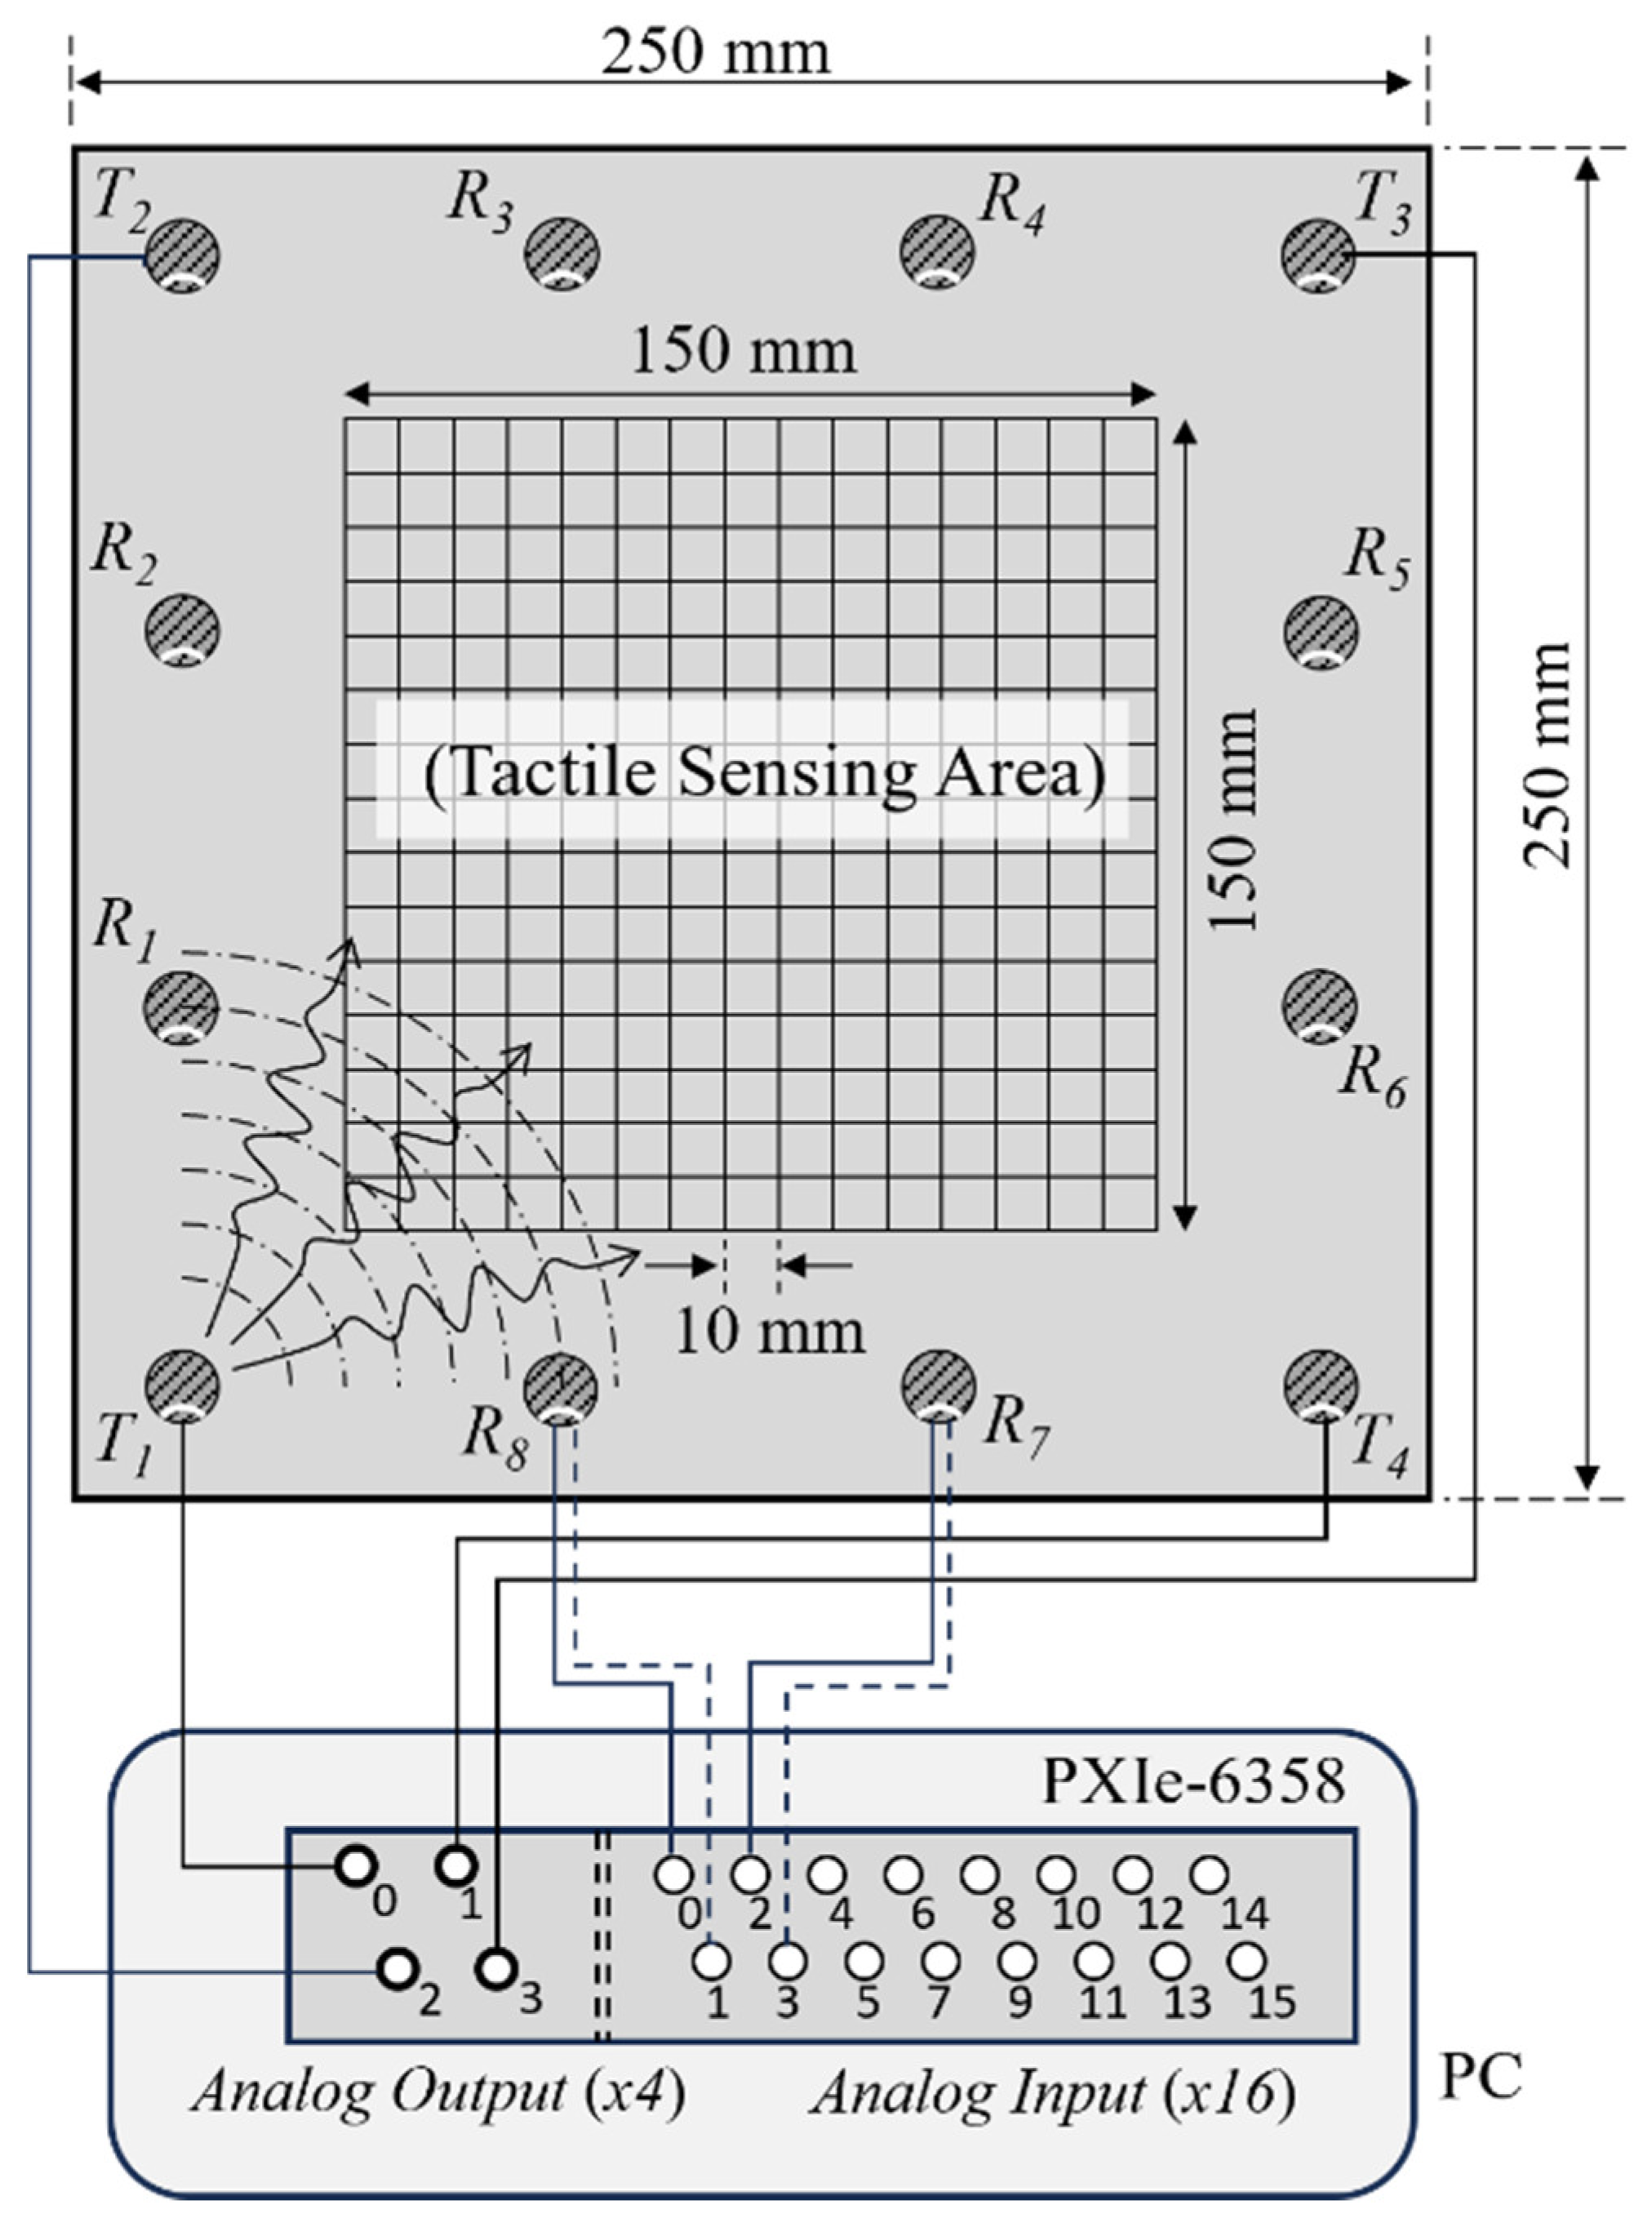
To construct a tactile sensing system based on differential measurement of Ao Lamb waves, a glass plate with 12 pairs of PZT transducers attached, as shown in Figure 1, is integrated with a data acquisition card (DAQ card, PXIe-6358, National Instrument Inc., Austin, TX) installed on a personal computer (PC) serving as the system controller. The system setup is schematically illustrated in Figure 6. The DAQ card features 4 analog output channels with a maximum output voltage of ±10 V, and 16 analog input channels with a top sampling rate of 1.25 MS/s and a vertical resolution of 16 bits. As shown in Figure 6, a tactile sensing area is designated at the center of the glass plate with an area of 150 × 150 mm2. The resolution for positioning a finger touch event is set to be 10 × 10 mm2, and hence there are a total of 225 (15 × 15) touch position outputs.
Figure 6.
The configuration of the tactile sensing system using a glass plate with mounted PZT transducer pairs driving/sensing by a data acquisition card (PXIe-6358, National Instrument) installed in a PC controller.
To operate the tactile sensing panel, the four PZT transducer pairs located at the corners of the glass plate are designated as the wave transmitting pairs and are labeled T1 to T4, as shown in Figure 6. Each pair is individually connected to one of the PXIe-6358’s four analog output channels, enabling electrical excitation of Lamb waves via PC commands. The remaining eight pairs of PZT transducers, labeled R1 to R8 in Figure 6, are connected to the 16 analog input channels, allowing digitization and recording of all received and voltage signals on the PC. For brevity, only the connections of R7 and R8 are depicted as examples in Figure 6.
To detect a touch event on the glass plate, the system initially excites Transmitter #1 (T1) with a 5-cycle, Hanning-windowed, 125 kHz sinusoidal voltage signal with peak voltages at ±10 V. Once the Lamb waves are generated in the glass plate, all 8 receiving PZT transducer pairs are subsequently triggered to record the arriving wave signals. After a delay of 4 ms, ensuring the dissipation of all elastic waves within the glass plate, Transmitter #2 (T2) is energized with the same electrical signal for another round of wave generation and detection. This cycle is sequentially repeated with T3 and T4 to complete one touch sensing event.
Therefore, for the detection of one single touch event, there will be a total of 32 (4 × 8) differential signal waveforms recorded, denoted as [n]. The first index i, running from 1 to 4, indicates the excited transmitter for launching waves to the glass plate, while the second index j, running from 1 to 8, refers to the receiving PZT transducer PZT pair, which outputs the differential signal. Since the distance between transmitting and receiving PZT transducers varies, the triggering time for acquiring the digital waveforms of and (and hence [n]) is adjusted to coincide with the first arrival time of the A0 mode Lamb wave. After being triggered, the waveforms are sampled at a sampling frequency of 1.25 MHz, and there is a total of 512 data points being acquired in one [n] waveform. This gives a total sampling time of 409.6 μs for one waveform. With a group velocity of 2708 m/s at 125 kHz, it amounts to a total travelling distance of 1109 mm for the A0 mode Lamb waves in this 250 × 250 mm2 glass plate. It means the acquired signals contain multiple trips of Lamb waves bouncing back and forth between the edges of the glass plate. It is hoped that under this reverberant condition, the measured wave signals can provide more useful information for the determination of finger-touch positions.
4. CNN Model for Tactile Sensing and Results
As described above, for each single touch event, a total of 32 signal waveforms of [n] with 512 data points for each waveform in the time domain are collected by the PC. These waveforms are arranged into a 16-bit grey-scaled digital image that contains an image pixel size of 32 × 512. This image will be input to a trained convolutional neural network (CNN) model for touch event detection and, if there is one, touch position sensing.
Convolutional neural networks (CNNs) have been rapidly developed in the past few decades and found widespread applications for image recognition. CNNs based on ultrasound or acoustic waves have also been successfully applied for structural health monitoring and non-destructive evaluation [17,18,19,20,21,22]. There are basically two types of CNN models. The unsupervised models are used for the classification of objects, and the supervised ones are designed to recognize particularly targeted features in an image through the use of supervised training data. In this paper, to detect a tactile event and pinpoint its touch position on a glass plate, the supervised CNN model is adopted and is trained through a process using collected training data.
Figure 7 illustrates the basic architecture of a CNN model. It contains an input layer, several convolution layers and their activation functions, pooling layers, fully connected (or dense) layers, and finally an output layer for output prediction. The input layer is the image with 32 × 512 pixels constructed from measured [n] waveforms. The convolution layers, which consist of different filters or kernels, convolute with the input image to extract spatial features. The pooling layers can downsize the extracted features while retaining important information. The fully connected or the dense layers contain a network of neurons to connect extracted features to classified outputs. As shown in Figure 6, since the 150 × 150 mm2 sensing area is divided into 15 × 15 touch positions with a resolution of 10 × 10 mm2, there will be a total of 226 outputs (225 positions plus “Untouched”) for the CNN model.
Figure 7.
A schematic diagram of a CNN model for tactile position sensing based on collected data of [n].
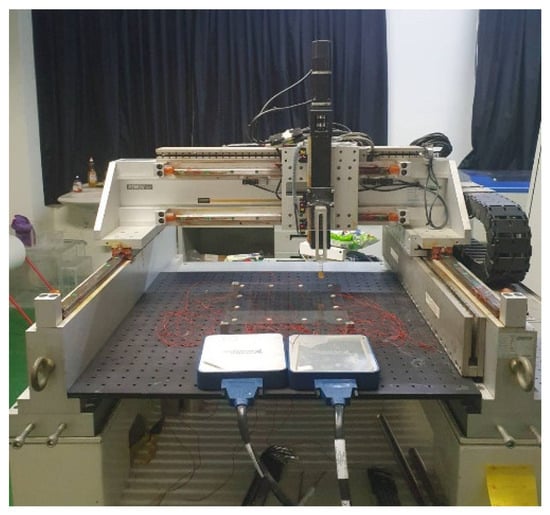
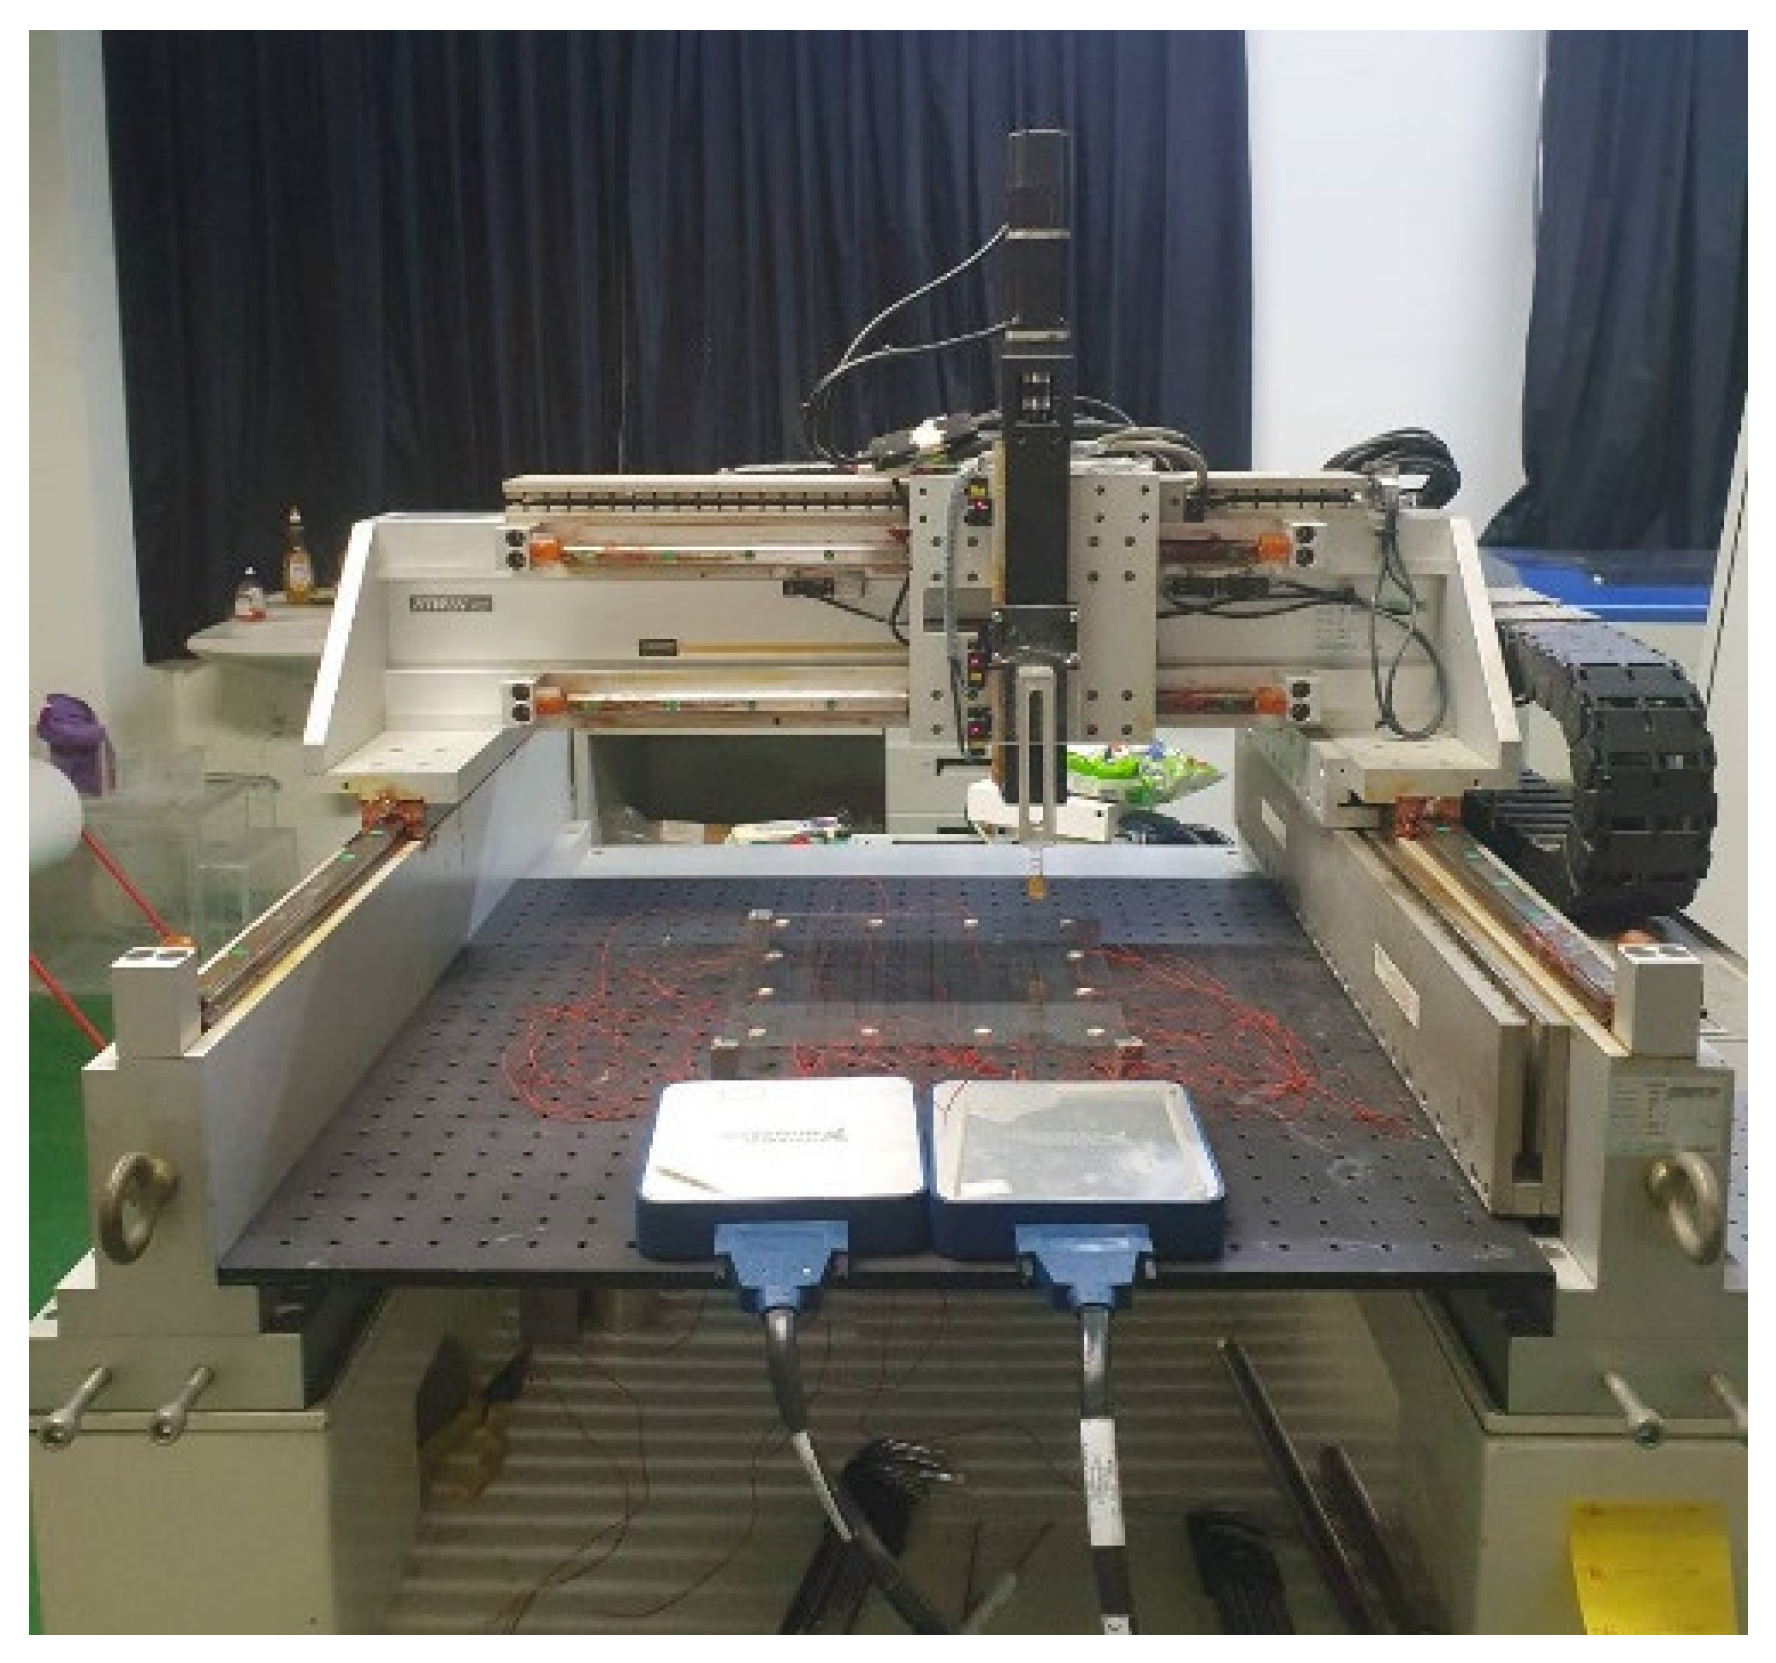
To effectively train the supervised CNN model, acquiring sufficient and adequate training data is paramount for ensuring the accuracy and robustness of the trained model. To achieve this objective, the glass plate and the tactile sensing system are positioned beneath a servo-controlled x-y-z stage, as shown in Figure 8. An artificial finger, which is a 20 mm long cylinder made of gelatin with a diameter of 10 mm, is vertically affixed to the z-axis via a spring so that it can move to any touch position and touch the glass plate with a controllable contact force of approximately 0.2 N. When the artificial finger is in contact with the glass plate, the DAQ card will carry out the four cycles of Lamb wave excitation and waveform detection, and the recording of the measured 32 [n] signal waveforms. To expand the training dataset for the CNN model, the data collection process is automatically repeated 50 times for each of the 225 (15 × 15) touch positions under PC control. To introduce diversity to the training data, the precise touching locations for 50 instances of data collection are randomly distributed within an area of 2 mm radius from the center of the 10 × 10 mm2 area.
Figure 8.
A photo of the glass plate and its tactile sensing system placed under an automated x-y-z stage for collecting training data corresponding to touch events at different touch positions.
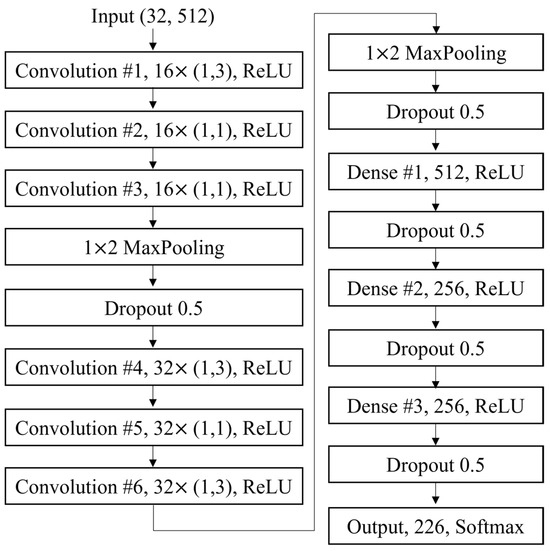
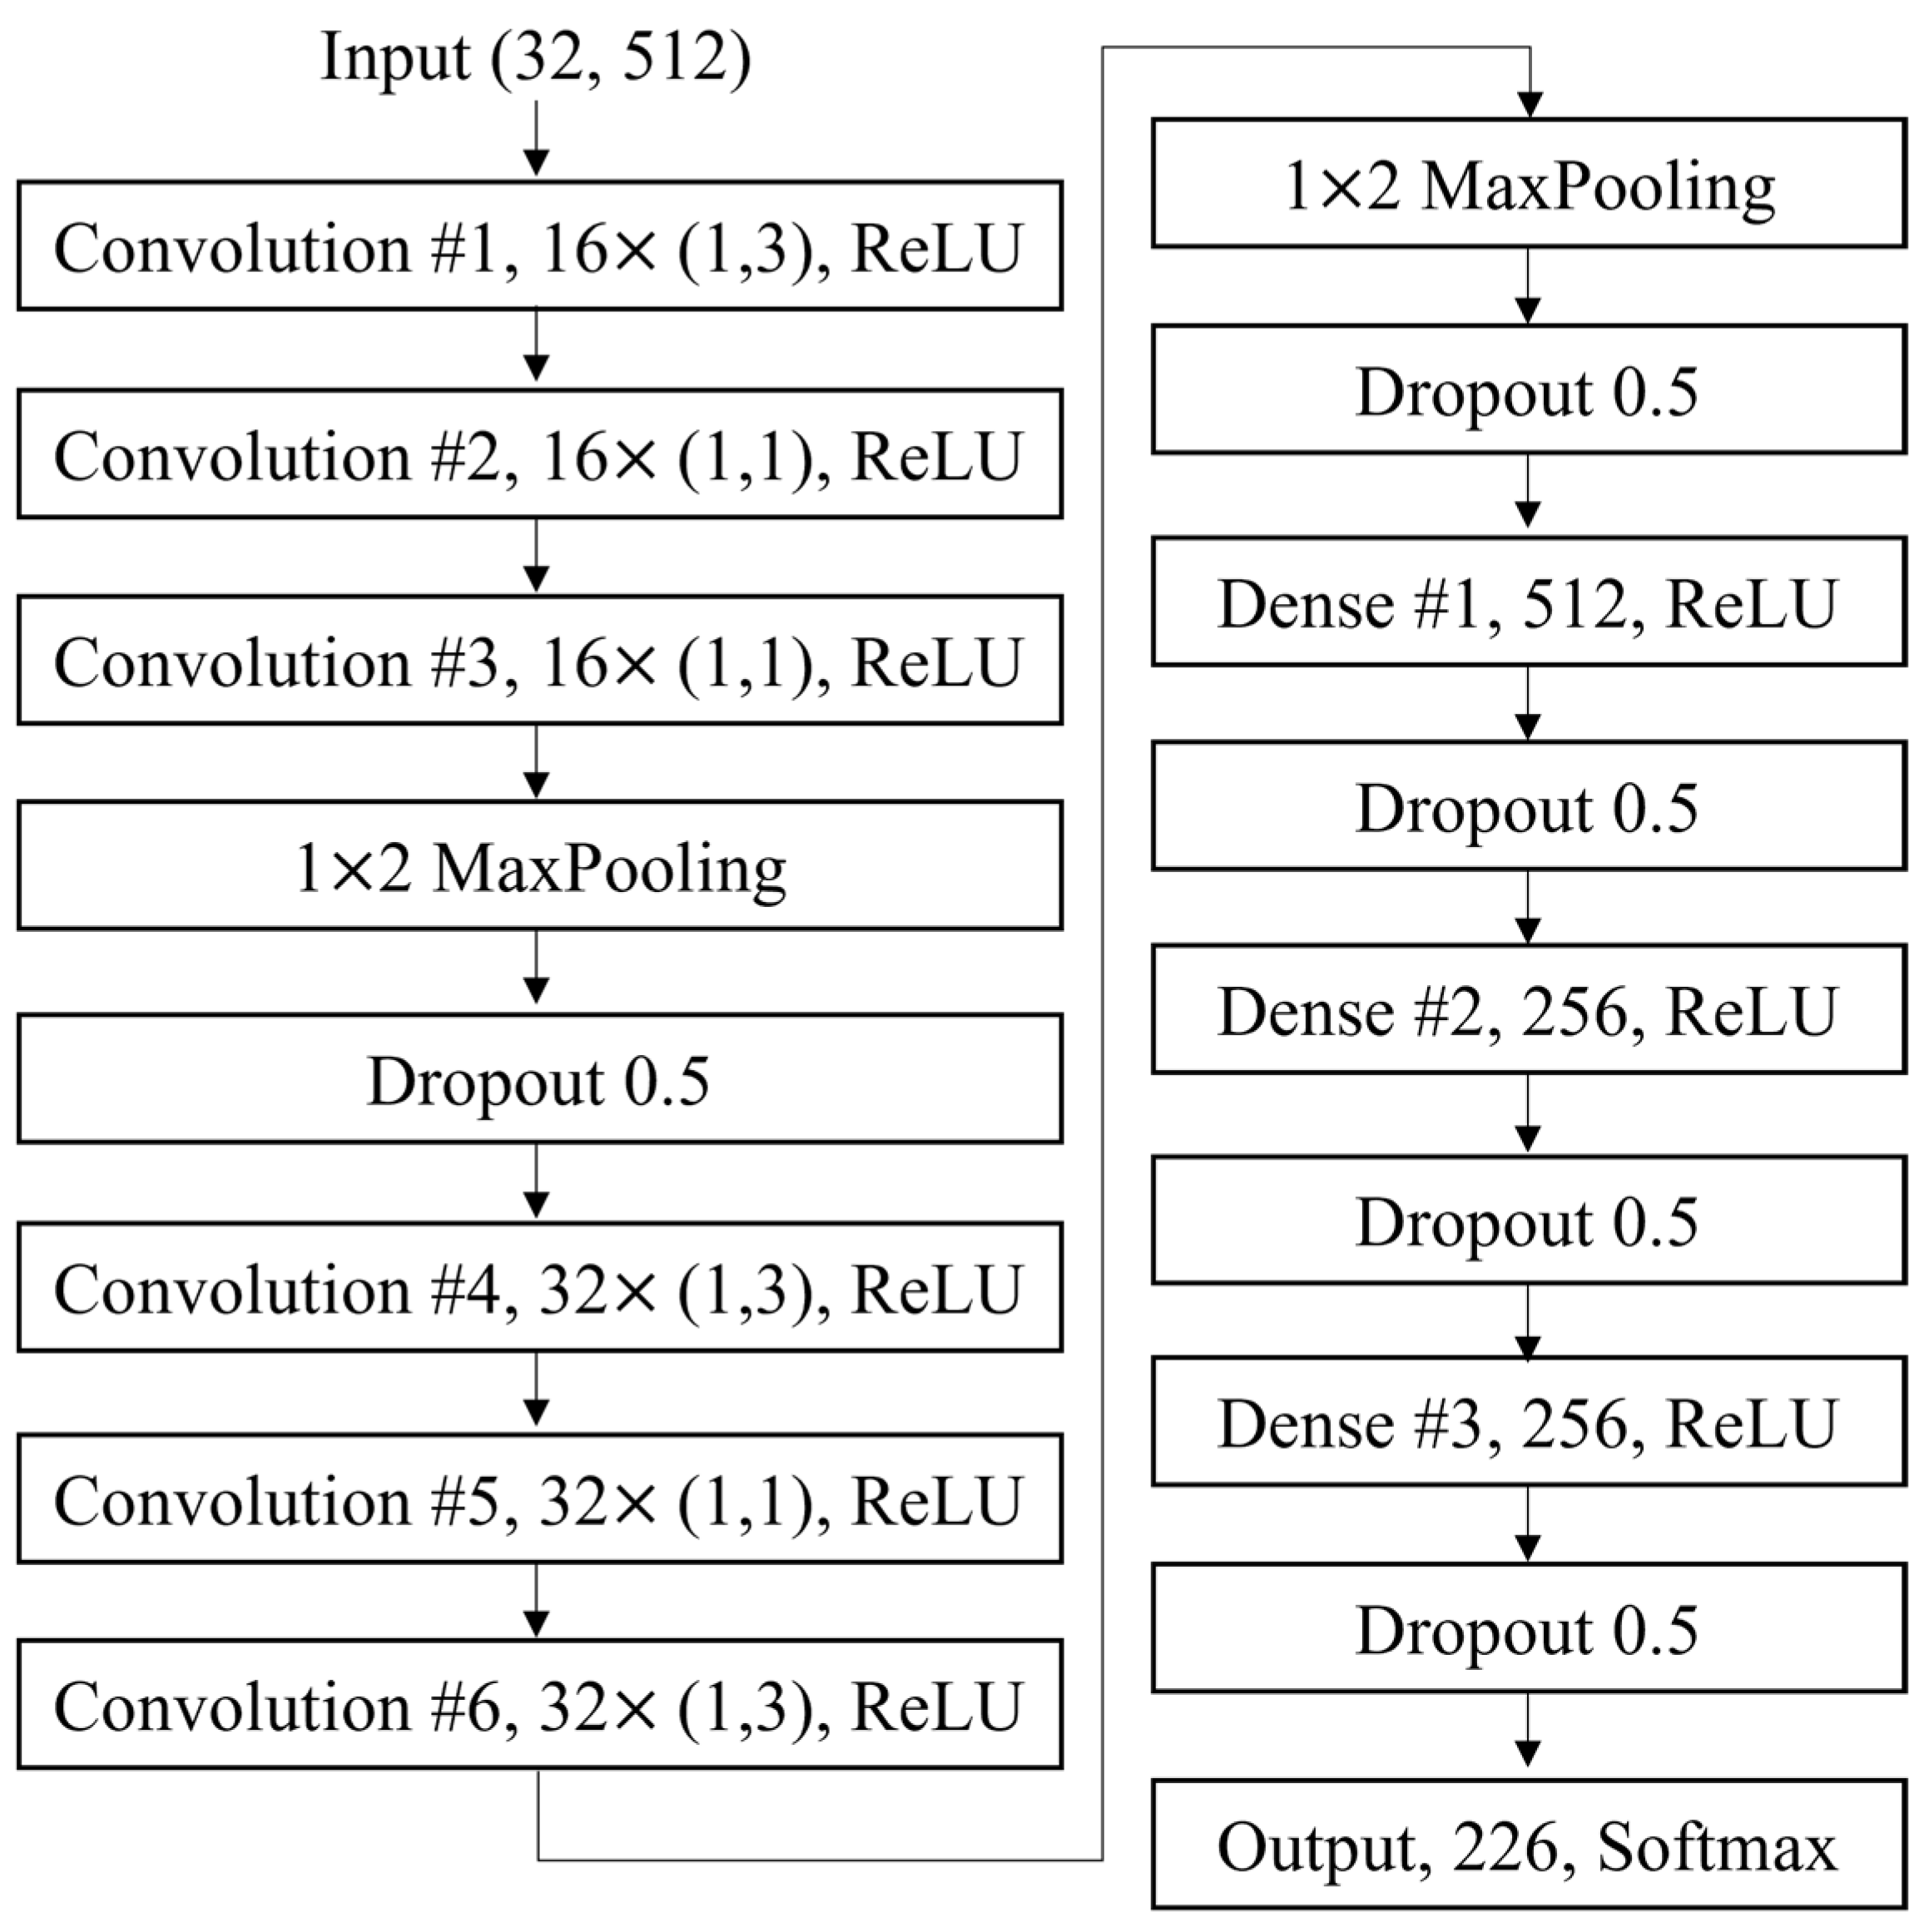
Based on the collected training data, a total of 226 × 50 images (each with 32 × 512 pixels), the optimal CNN architecture and its parameters for the tactile positioning sensing system are determined. The training process was performed using the cross-entropy loss function [23] and the Adam optimizer [24] using 80% of the collected training data. The other 20% of the training data is used as the internal testing data for the models. The testing process showed that the trained models achieved an accuracy of almost 100%. The final architecture of the CNN model and its parameters are displayed in Figure 9. It has an input layer, six convolution layers, six fully connected dense layers, and an output layer. The input image with 32 × 512 pixels was first processed by the six convolution layers to extract the key features related to tactile position sensing. The kernel filters used in the six convolution layers are shown in Figure 9 together with the associated activation and pooling methods. After the convolution layers, the data were fully connected with three dense layers. Finally, the data were passed to a fully connected output layer with 226 outputs, corresponding to one “Untouched” output and 225 touching position outputs, respectively.
Figure 9.
The architecture and parameters of the supervised CNN model obtained from the collected training dataset.
As mentioned before, the collected dataset consisted of 11,300 (50 × 226) samples, which were randomly divided into training, validation, and testing sets with a ratio of 80%, 10%, and 10%, respectively. The CNN model was implemented using TensorFlow and trained for 100 epochs with a batch size of 32. The Adam optimizer was employed with an initial learning rate of 0.001. The categorical cross-entropy loss function was used for model optimization. During training, the validation loss was continuously monitored. Early stopping was applied when the validation loss failed to improve for 10 consecutive epochs. In addition, a dropout layer with a dropout rate of 0.5 was incorporated into the fully connected layers to reduce overfitting. Data augmentation techniques were not applied in this work. The model converged after approximately 60 epochs, and no significant divergence between the training and validation was observed, indicating that overfitting was effectively mitigated.
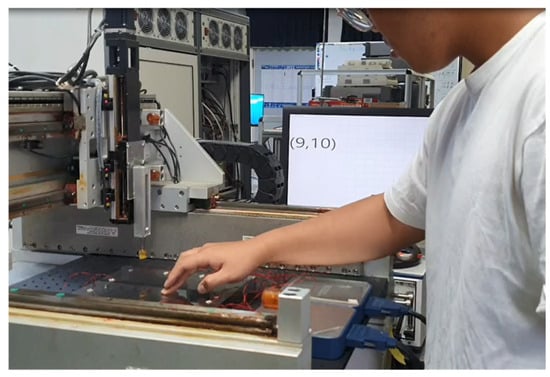
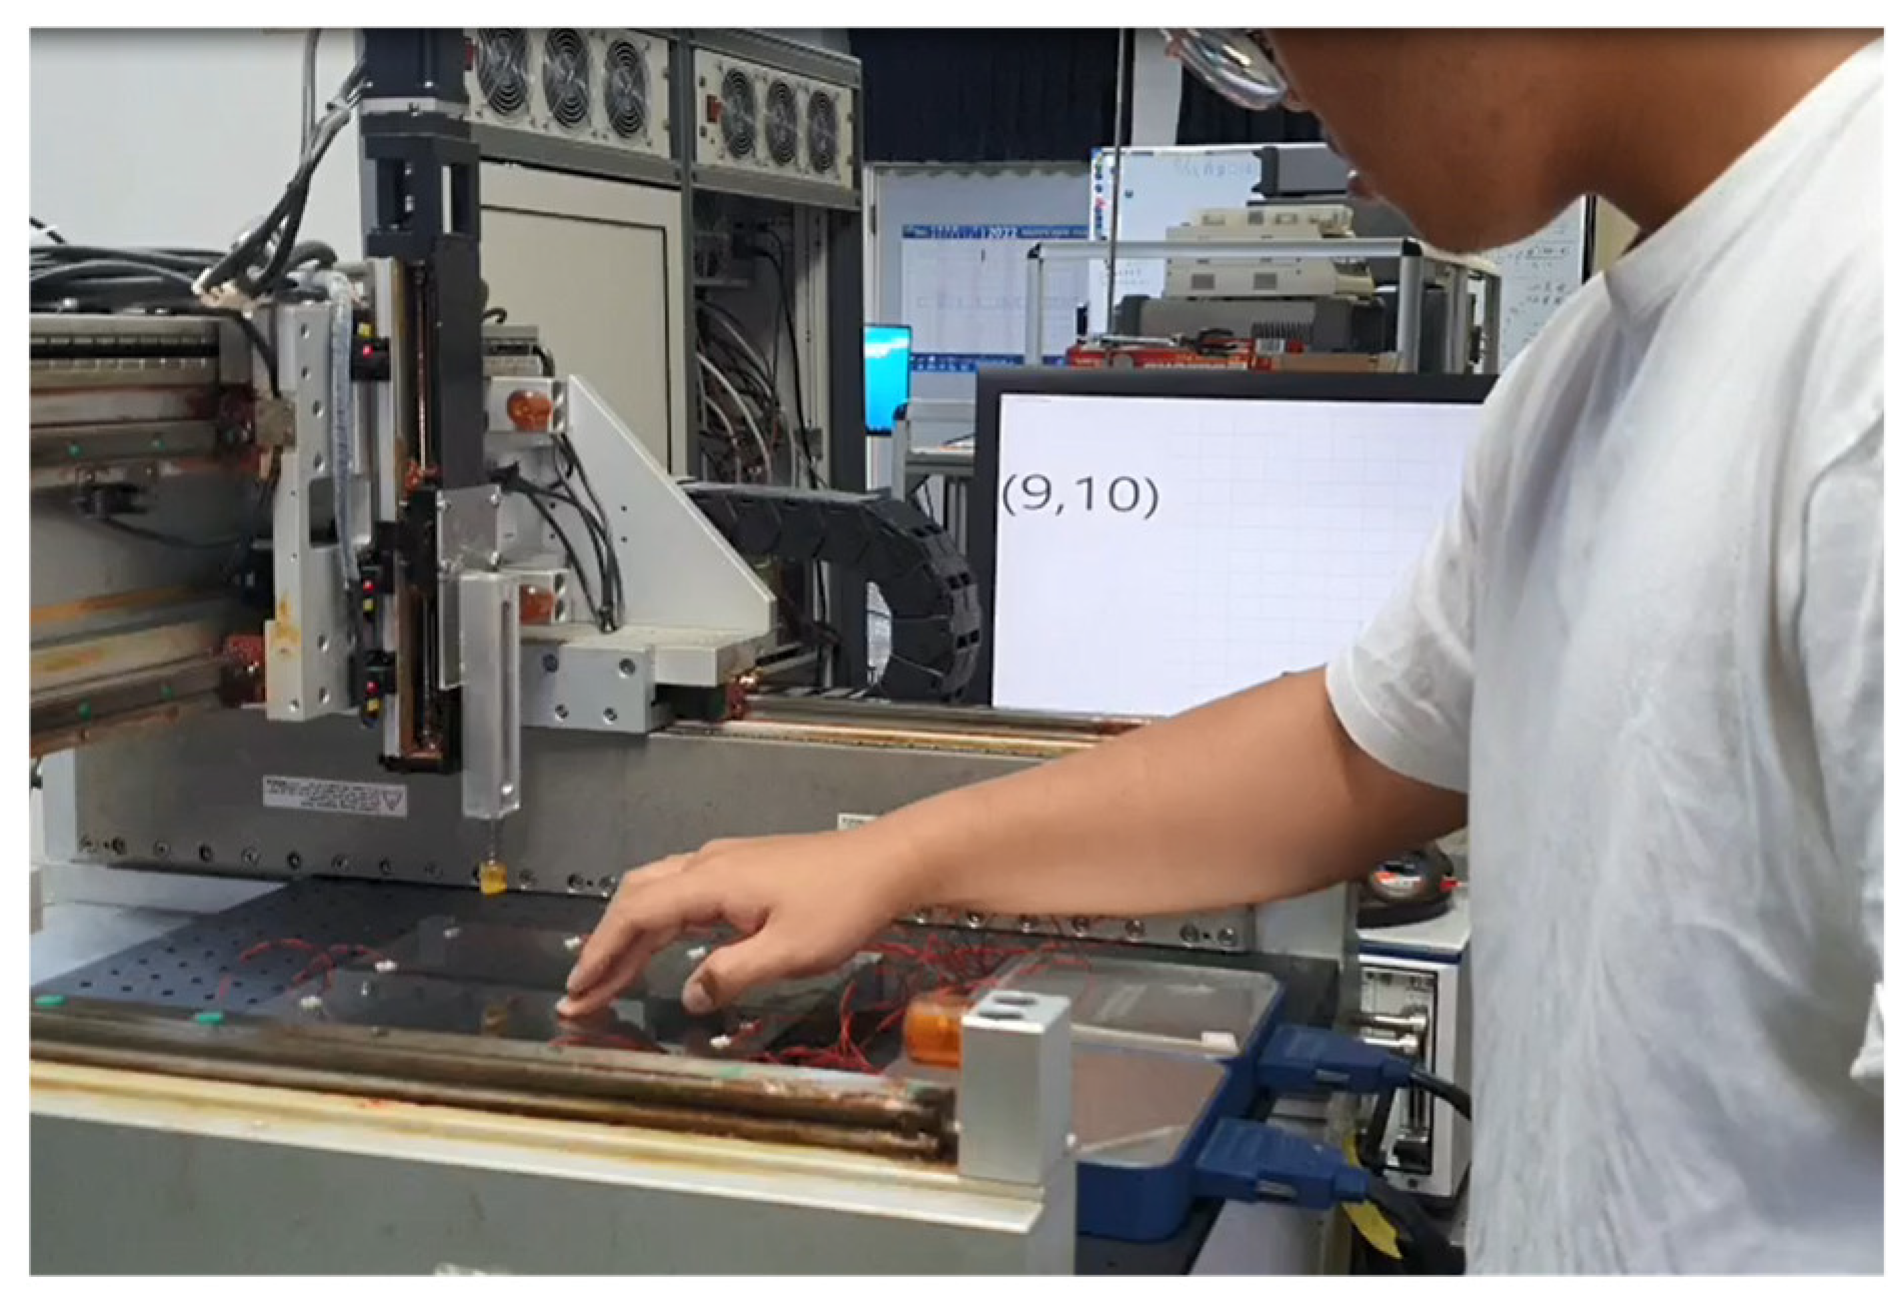
To evaluate the performance of the trained CNN models, a field test was conducted by 10 volunteers. Each volunteer was requested to touch the sensing area of the glass plate 100 times at randomly chosen locations. In the meantime, the system continuously outputs either “Untouched” or “Touched x- and y-coordinates” on the PC screen. A photo of the field testing performed by a volunteer is given in Figure 10. All 1000 test results were documented. In these 1000 touch test events, if the system output position (the x- and y-coordinates) perfectly matches the grid position of the volunteer’s finger touch, it is then treated as “accurate”. Finally, the test results show a tactile position sensing accuracy of 96%, which confirms the capability of the proposed baseline-free Lamb wave touchscreen. The total time for one touch sensing event, including Lamb wave launching, signal waveform acquisition, data processing, and CNN model calculation, was found to be 25 ms. In other words, the proposed baseline-free Lamb wave touchscreen can operate continuously at a refreshing rate of 40 Hz. In the field test, most misclassified samples were assigned to adjacent touch locations rather than distant locations, indicating that the CNN was generally able to localize the touch region correctly even when exact classification was not achieved.
Figure 10.
A photo showing field test on the tactile sensing glass plate by a volunteer.
In the field test described above, the room temperature is maintained at 25 °C. To evaluate if the surrounding temperature can affect its performance, the proposed Lamb wave touchscreen was tested again under the same conditions at room temperatures of 15 °C and 35 °C by cooling down and heating up the surrounding air atmosphere, respectively. The tactile sensing accuracy remained around 96% without any significant difference, demonstrating the thermal stability of the proposed baseline-free Lamb wave touchscreen.
5. Conclusions
We proposed a new type of acoustic wave touchscreen that utilizes only the anti-symmetric fundamental mode (A0 mode) of the Lamb wave in a thin glass plate. The glass plate is 2 mm in thickness and 250 × 250 mm2 in size. A total of 12 pairs of piezoceramic transducers are symmetrically attached to both the top and bottom surfaces of the plate. The four transducer pairs located at the four corners are, in turn, electrically excited at a relatively low frequency and in an anti-symmetric manner, ensuring that only A0 mode Lamb waves are excited in the glass plate. Another eight pairs of piezoelectric transducers, evenly deployed along the four edges of the plate, then detect the A0 mode Lamb waves in an anti-symmetrical or differential manner. This means the output signals from the 8 paired transducers remain zero when the glass plate is not touched. This fulfills the idea of baseline-free touch sensing.
To accurately determine the sensing position, a 150 × 150 mm2 tactile sensing area is designated on the central area of the glass plate. The sensing area is further divided into 15 × 15 touching zones with a touching resolution of 10 × 10 mm2. Each zone is touched by an artificial finger to disrupt the symmetry of boundary conditions on the glass plate and therefore to produce output wave signals from the 8 receiving transducer pairs. A CNN model is trained by the collected dataset of received wave signals. Finally, a Lamb wave touchscreen is established and operated with the CNN model and the directly received wave signals in a baseline-free manner. Field tests show the accuracy of the processed touchscreen is about 96% and is indifferent to temperature variation of ±10 degrees from the room temperature of 25 °C. This temperature range was selected based on the anticipated indoor usage scenario of the proposed ultrasonic touch panel. This range reflects typical environmental conditions in which such devices are expected to operate. Nevertheless, assessing the thermal stability of the proposed system over a broader temperature range is under investigation.
Since the proposed baseline-free system is based on the anti-symmetry of the pure A0 mode of Lamb waves, if the surface conditions on the glass plate are significantly changed after long-term use, it might affect the performance of the proposed ultrasound touch panel. In this case, the ultrasound touch panel may need to be recalibrated by collecting all the [n] signal waveforms again to re-establish the CNN model, as elaborated in Section 3 and Section 4. If the re-established CNN model is robust, the proposed ultrasound touch panel can be continuously used.
Finally, although this paper confirms the feasibility of creating a baseline-free touch sensing device, the demonstrated spatial resolution is only 1 × 1 cm2 with 15 × 15 touching points over an area size of 15 × 15 cm2. Improving the resolution or enlarging the total area size is possible, but may require increasing the number of PZT transducers and spending a longer time collecting waveform data and training the CNN model. Therefore, the proposed hardware and software may be better used for turning a solid plate into a keyboard rather than a high-resolution touch panel.
Author Contributions
Conceptualization, Y.-C.L.; Methodology, C.-Y.C.; Software, C.-Y.C.; Validation, C.-Y.C.; Investigation, C.-Y.C. and Y.-C.L.; Writing—original draft, Y.-C.L.; Supervision, Y.-C.L.; Project administration, Y.-C.L.; Funding acquisition, Y.-C.L. All authors have read and agreed to the published version of the manuscript.
Funding
This research was funded by the National Science and Technology Council of Taiwan under Project No. of MOST 111-2221-E-006-127-MY3.
Institutional Review Board Statement
Not applicable.
Informed Consent Statement
Not applicable.
Data Availability Statement
The original contributions presented in the study are included in the article, further inquiries can be directed to the corresponding author.
Conflicts of Interest
The authors declare no conflicts of interest.
References
- Walker, G. A review of technologies for sensing contact location on the surface of a display. J. Soc. Inf. Disp. 2012, 20, 413–440. [Google Scholar] [CrossRef] [Scilit]
- Adler, R.; Desmares, P.S. Economical touch panel using SAW absorption. IEEE Trans. Ultrason. Ferr. Frerroelect. Control 1987, 34, 195–201. [Google Scholar] [CrossRef] [Scilit]
- Takeuchi, M.; Tanaka, Y.; Aroyan, J.L.; Kent, J. Characteristics of SAW grating reflectors with arbitrary angles of incidence in ultrasonic touch sensors. In Proceedings of the 2006 IEEE Ultrasonics Symposium, Vancouver, BC, Canada, 2–6 October 2006; pp. 1778–1781. [Google Scholar]
- Ing, R.K.; Quieffin, N.; Catheline, S.; Fink, M. In solid localization of finger impacts using acoustic time-reversal process. Appl. Phys. Lett. 2005, 87, 204104. [Google Scholar] [CrossRef] [Scilit]
- Reis, S.; Correia, S.V.; Martins, M.; Barbosa, G.; Sousa, R.M.; Minas, G.; Lanceros-Mendez, S.; Rocha, J.G. Touchscreen based on acoustic pulse recognition with piezoelectric polymer sensors. In Proceedings of the 2010 IEEE International Symposium on Industrial Electronics, Bari, Italy, 4–7 July 2010; pp. 516–520. [Google Scholar]
- Reju, V.; Khong, A.W.H.; Sulaiman, A.B. Localization of taps on solid surfaces for human-computer touch interfaces. IEEE T. Multimed. 2013, 15, 1365–1376. [Google Scholar] [CrossRef] [Scilit]
- Kang, K.C.; Kim, Y.H.; Pyun, J.Y.; Park, K.K. Feasibility study on multi-touch ultrasound large-panel touchscreen using guided lamb waves. Measurement 2022, 190, 110755. [Google Scholar] [CrossRef] [Scilit]
- Firouzi, K.; Nikoozadeh, A.; Carver, T.E.; Khuri-Yakub, B.T. Lamb wave multitouch ultrasonic touchscreen. IEEE Trans. Ultrason. Ferr. Frerroelect. Control 2016, 63, 2174–2186. [Google Scholar] [CrossRef] [Scilit]
- Firouzi, K.; Nikoozadeh, A.; Carver, T.E.; Khuri-Yakub, B.T. Multitouch touchscreen using reverberant lamb waves. In Proceedings of the 2017 IEEE International Ultrasonics Symposium (IUS), Washington, DC, USA, 6–9 September 2017; pp. 1–4. [Google Scholar]
- Quaegebeur, N.; Masson, P.; Beaudet, N.; Sarret, P. Touchscreen surface based on interaction of ultrasonic guided waves with a contact impedance. IEEE Sens. J. 2016, 16, 3564–3571. [Google Scholar] [CrossRef] [Scilit]
- Liu, Y.; Nikolovski, J.P.; Mechbal, N.; Hafez, M.; Vergé, M. Tactile objects based on an amplitude disturbed diffraction pattern method. Appl. Phys. Lett. 2009, 95, 251904. [Google Scholar] [CrossRef] [Scilit]
- Liu, Y.; Nikolovski, J.P.; Mechbal, N.; Hafez, M.; Vergé, M. An acoustic multi-touch sensing method using amplitude disturbed ultrasonic wave diffraction patterns. Sens. Actuators A Phys. 2010, 162, 394–399. [Google Scholar] [CrossRef] [Scilit]
- Yang, Z.; Liu, X.; Wu, B.; Liu, R. Adaptability of ultrasonic lamb wave touchscreen to the variations in touch force and touch area. Sensors 2021, 21, 1736. [Google Scholar] [CrossRef] [Scilit] [PubMed]
- Chang, C.-S.; Lee, Y.-C. Ultrasonic touch sensing system based on Lamb waves and convolutional neural network. Sensors 2020, 20, 2619. [Google Scholar] [CrossRef] [Scilit] [PubMed]
- Bahrami, S.; Moriot, J.; Masson, P.; Grondin, F. Machine learning for touch localization on an ultrasonic Lamb wave touchscreen. Sensors 2022, 22, 3183. [Google Scholar] [CrossRef] [Scilit] [PubMed]
- Wan, H. Design of underwater acoustic touchscreen based on deep convolutional neural network. Appl. Acoust. 2023, 203, 109222. [Google Scholar] [CrossRef] [Scilit]
- De Fenza, A.; Sorrentino, A.; Vitiello, P. Application of artificial neural networks and probability ellipse methods for damage detection using Lamb waves. Compos. Struct. 2015, 133, 390–403. [Google Scholar] [CrossRef] [Scilit]
- Su, C.; Jiang, M.; Lv, S.; Lu, S.; Zhang, L.; Zhang, F.; Sui, Q. Improved damage localization and quantification of CFRP using Lamb waves and convolution neural network. IEEE Sens. J. 2019, 19, 5784–5791. [Google Scholar] [CrossRef] [Scilit]
- Liu, H.; Zhang, Y. Deep learning based crack damage detection technique for thin plate structures using guided lamb wave signals. Smart Mater. Struct. 2020, 29, 015032. [Google Scholar] [CrossRef] [Scilit]
- Rai, A.; Mitra, M. Lamb wave based damage detection in metallic plates using multi-headed 1-dimensional convolutional neural network. Smart Mater. Struct. 2021, 30, 035010. [Google Scholar] [CrossRef] [Scilit]
- Azuara, G.; Ruiz, M.; Barrera, E. Damage localization in composite plates using wavelet transform and 2-D convolutional neural networks. Sensors 2021, 21, 5825. [Google Scholar] [CrossRef] [Scilit] [PubMed]
- Yang, Z.; Yang, H.; Tian, T.; Deng, D.; Hu, M.; Ma, J.; Gao, D.; Zhang, J.; Ma, S.; Yang, L.; et al. A review in guided-ultrasonic-wave-based structural health monitoring: From fundamental theory to machine learning techniques. Ultrasonics 2023, 133, 107014. [Google Scholar] [CrossRef] [Scilit] [PubMed]
- de Boer, P.-T.; Kroese, D.P.; Mannor, S.; Rubinstein, R.Y. A Tutorial on the Cross-Entropy Method. Ann. Oper. Res. 2005, 134, 19–67. [Google Scholar] [CrossRef] [Scilit]
- Kingma, D.P.; Ba, J. Adam: A method for Stochastic Optimization. In Proceedings of the 3rd International Conference on Learning Representations, San Diego, CA, USA, 7–9 May 2015; pp. 1–13. [Google Scholar]


Disclaimer/Publisher’s Note: The statements, opinions and data contained in all publications are solely those of the individual author(s) and contributor(s) and not of MDPI and/or the editor(s). MDPI and/or the editor(s) disclaim responsibility for any injury to people or property resulting from any ideas, methods, instructions or products referred to in the content. |
© 2026 by the authors. Licensee MDPI, Basel, Switzerland. This article is an open access article distributed under the terms and conditions of the Creative Commons Attribution (CC BY) license.