


Abstract
Water scarcity in Chile has been exacerbated by a decline in precipitation and an increase in water demand. This has prompted a search for strategies to increase water supply, whether through aquifer recharge or reservoir construction. In this study, aquifer recharge was evaluated through rainwater harvesting systems (RWHS) and direct injection into rural wells in the Ñuble Region. Three wells were selected in the Ñuble Region (Ñiquén, San Carlos, and Coihueco) using hydrogeological and operational criteria. To characterize the hydrogeology of the area, local piezometric data, geophysical surveys using electrical resistivity tomography (ERT), and seismoelectric tests were considered. This enabled the identification of aquifers with water levels between 2.6 and 23 m depth across the different geological units of the territory. The hydrological design was based on a frequency analysis of annual precipitation (1991–2020), which yielded design rainfall values between 442 and 694 mm. The implemented RWHS demonstrated injection capacities between 0.9 and 1.4 L·s−1. The results show that rainwater harvesting combined with direct aquifer recharge represents a viable alternative for improving water security, with potential for territorial scaling through regional public policies.
1. Introduction
During recent decades, water resource management has become a significant challenge of high priority for many countries [1,2,3]. This is particularly apparent in regions which are experiencing declining water availability coupled with sustained increases in demand [4,5,6]. In Chile, this problem is especially acute in the central zone, where reduced precipitation has combined with increasing consumption, largely driven by demographic and economic expansion, and this has resulted in increasing pressure on available water sources [7,8,9]. Given the concern regarding this scenario, the identification of strategies that aim to improve water availability and ensure the sustainability of supply systems has become a priority for water management [10,11,12,13,14].
Among the various alternative strategies that are available to address this situation is aquifer recharge. Aquifer recharge can be understood as the process by which groundwater storage is increased from a variety of surface water or precipitation sources [15,16,17,18]. This process can occur both naturally as part of the hydrological cycle, but it can also be managed through various anthropogenic interventions aimed at increasing infiltration or the injection of water into aquifers. At the international level, Managed Aquifer Recharge (MAR), as it is termed, is a proven and effective tool for increasing groundwater reserves [19,20,21,22,23], thus improving resource quality, restoring piezometric levels, and also preventing processes such as saltwater intrusion in coastal areas [15,24].
Traditionally, initiatives for artificial recharge have largely relied on water infiltration through surface-built structures such as infiltration trenches, recharge wells, infiltration basins, or in some cases small check dams in natural watercourses [25]. However, these techniques have various limitations, which are mainly related to the implementation costs and uncertainty regarding their performance in the presence of saturated conditions and also their long-term functionality [26]. Significantly, water that infiltrates into the upper parts of catchments does not always recharge the targeted aquifer, since groundwater flows can follow complex pathways which are difficult to predict and furthermore have an associated high uncertainty [27,28].
To address these limitations, the concept of direct well recharge emerged as a solution whereby water is injected into the well at the same extraction points in order to partially restore aquifer storage [29]. A suitable water source is needed for this purpose, and one possibility is by using rainwater harvesting, which allows significant volumes to be collected during winter for subsequent use [30,31,32]. This alternative water source provides suitable water quality when appropriate systems are utilized, and more positively, is not subject to water-rights regulations, facilitating its implementation in experimental projects.
In this context, researchers from the Universidad de Talca, in collaboration with academics from the Universidad de Concepción and the Universidad Católica de la Santísima Concepción, initiated in 2023 the project “Rainwater harvesting and well recharge for agricultural use”, funded by the Regional Government of Ñuble. This research evaluates aquifer recharge through rainwater harvesting and direct injection into rural wells.
The initiative responds to the sustained decline in precipitation that central Chile has experienced in recent years and the subsequent drop in piezometric levels. This situation is particularly critical in the Ñuble Region, which is located in central Chile, approximately 400 km south of Santiago, and where agriculture, forestry, and tourism account for approximately 20% of regional employment [33]. The region forms part of Chile’s Mediterranean-climate zone, which has experienced significant reductions in precipitation during recent decades and has become one of the country’s most vulnerable areas in terms of water scarcity.
The impact of climate change is expected to further exacerbate this scenario, with almost all projections suggesting a greater water stress in Chile [8,9] and potential increases in the temporal concentration of rainfall events [34], although the magnitude and local characteristics of these projected changes remain uncertain. The rainwater harvesting systems (RWHS) described in this work are structures that comprise a catchment area (Ac), a conveyance system, and water storage [30,35], and represent a promising alternative for addressing the water crisis [36,37,38]. By combining this with direct aquifer recharge, the potential to support rural water security is improved, given a wide range of possible future climatic conditions or scenarios.
2. Materials and Methods
2.1. Study Area
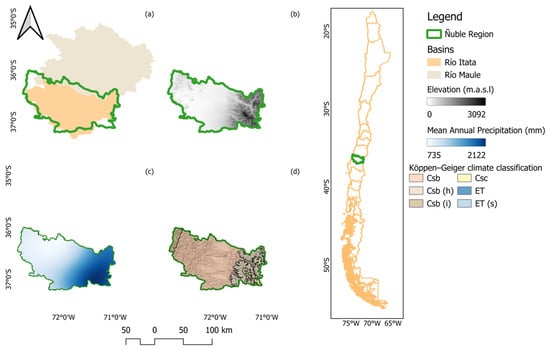
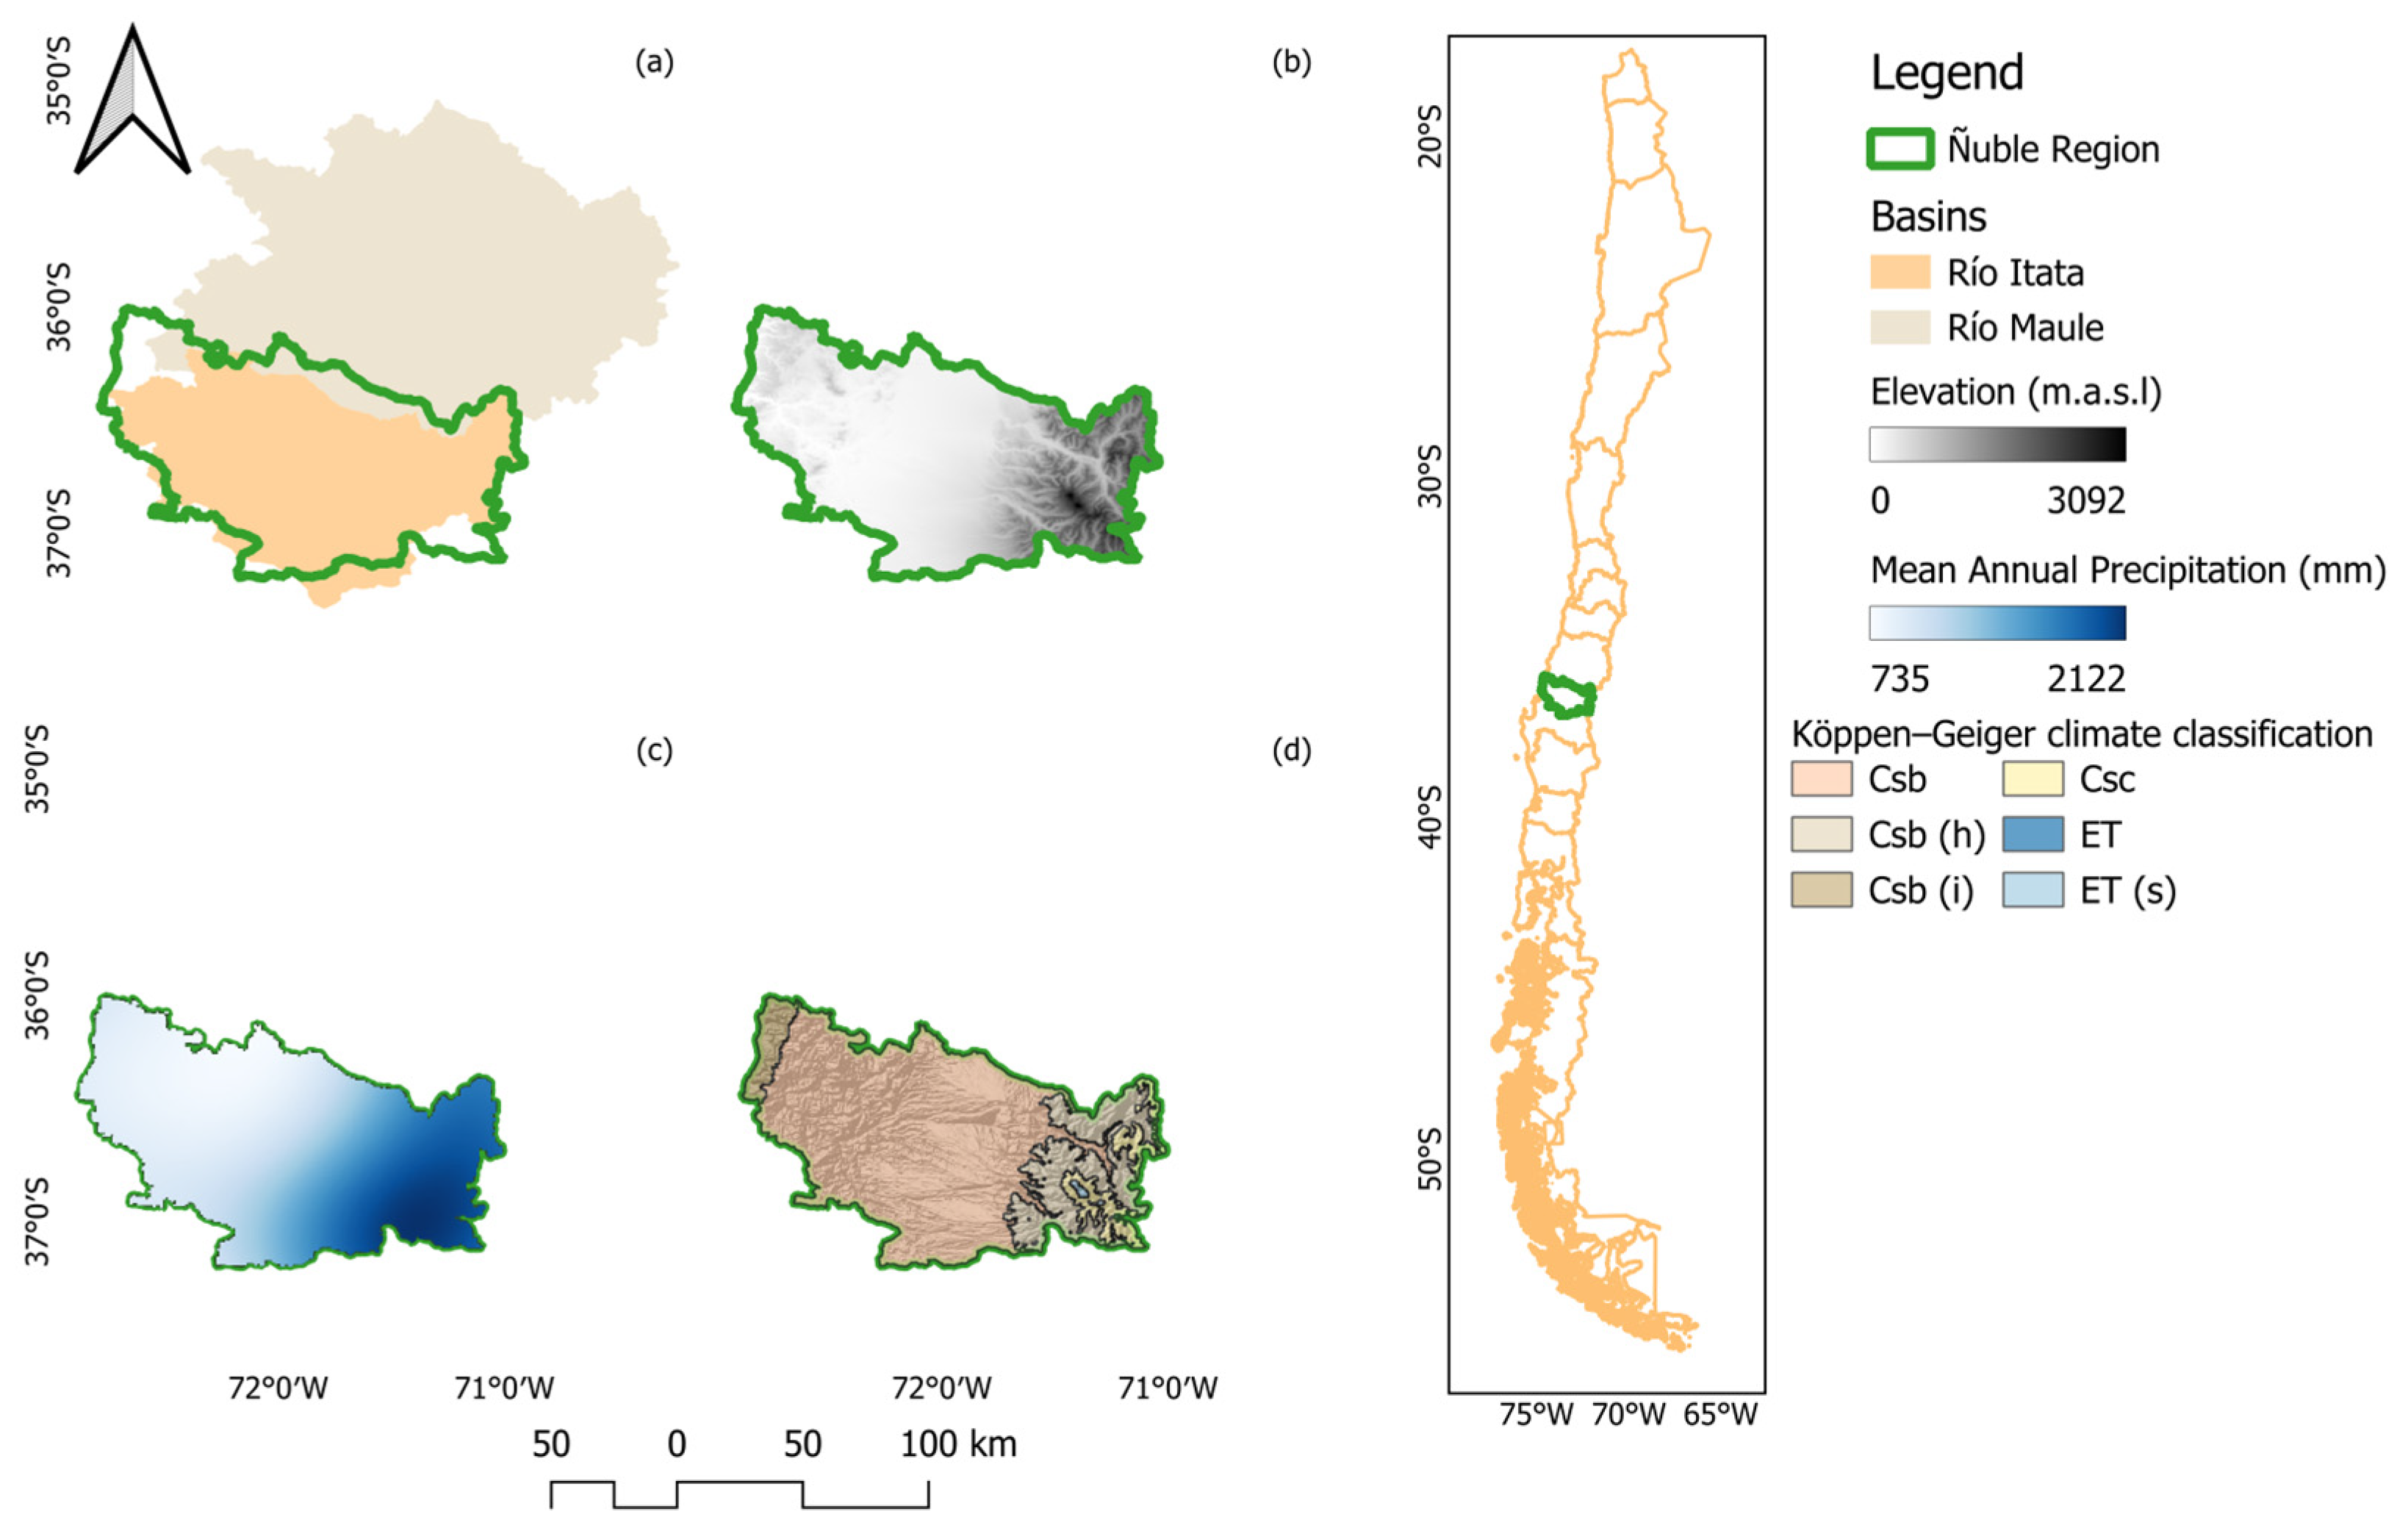
The study area is located in the Ñuble Region of central Chile, approximately 400 km south of Santiago, the country’s capital, between latitudes 36°00′ S and 37°12′ S (Figure 1). Ñuble covers approximately 13,200 km2 and is one of Chile’s most important agricultural regions, supporting extensive crop production, livestock farming, and forestry activities. The region encompasses two major river basins: the Maule River basin to the north and the Itata River basin in the central portion, the latter covering the largest regional extent. Because local economies depend heavily on water-intensive activities and have been affected by prolonged drought conditions, the region provides a representative case study for evaluating strategies aimed at improving rural water security in central Chile.
Figure 1.
Map of the study area. (a) Watersheds within the study area; (b) elevation map of the Ñuble Region (DEM); (c) mean annual precipitation in the Ñuble Region; and (d) climate classification of the Ñuble Region.
According to Sarricolea et al. [33], the predominant climate is Mediterranean with winter rainfall (Csb) in the central valley, with altitudinal variations in the Andes range (Csb [h]) and maritime influence along the coast (Csb [i]). Mean annual precipitation exhibits high variability both latitudinally and longitudinally, with the highest values concentrated in the Andes (Figure 1).
2.2. Well Selection
Beneficiary wells were selected based on criteria derived from a hydrogeological characterization that included analysis of aquifer depth, transmissivity, existing wells, pumping rates, natural recharge zones, and groundwater levels as of 2023. Two analysis zones were thus delineated according to high and low transmissivity; the latter being considered the area of interest as it would yield greater local recharge benefits by concentrating infiltration rates at the selected wells.
Subsequently, once the area of interest was defined and with the assistance of PRODESAL professionals from the respective municipalities, 12 wells were visited, georeferenced, and characterized. Candidate wells were first screened according to four selection criteria: location in a low-transmissivity area, agricultural use, owner availability, and with at least 500 m2 available for system installation were considered. The wells meeting these criteria were then evaluated using a weighted score based on well type (30%) and depth (70%). Finally, the wells were evaluated according to the beneficiary’s capacity to operate the rainwater harvesting and recharge system and the technical suitability of each well for installation of the system. Wells that met these requirements were selected for implementation.
2.3. Rainwater Harvesting System Design
The hydrological design of the works accounted for precipitation variability in the study areas (Figure 1c), the effects of the mega-drought [34,35,36,37] and the potential volume to be harvested [30,32,38].
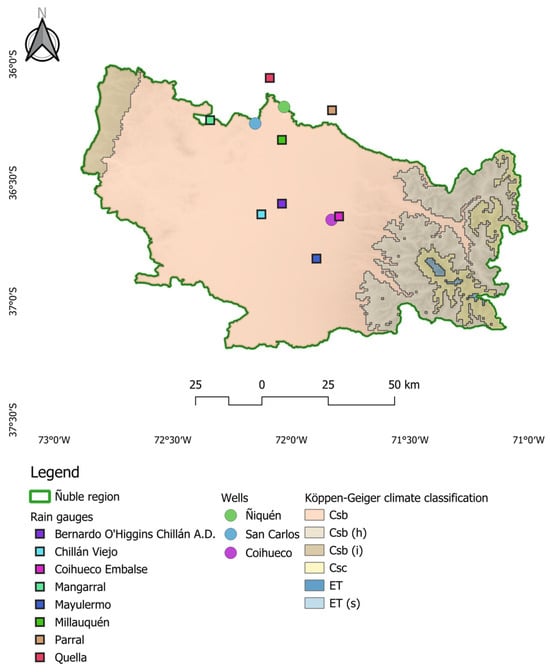
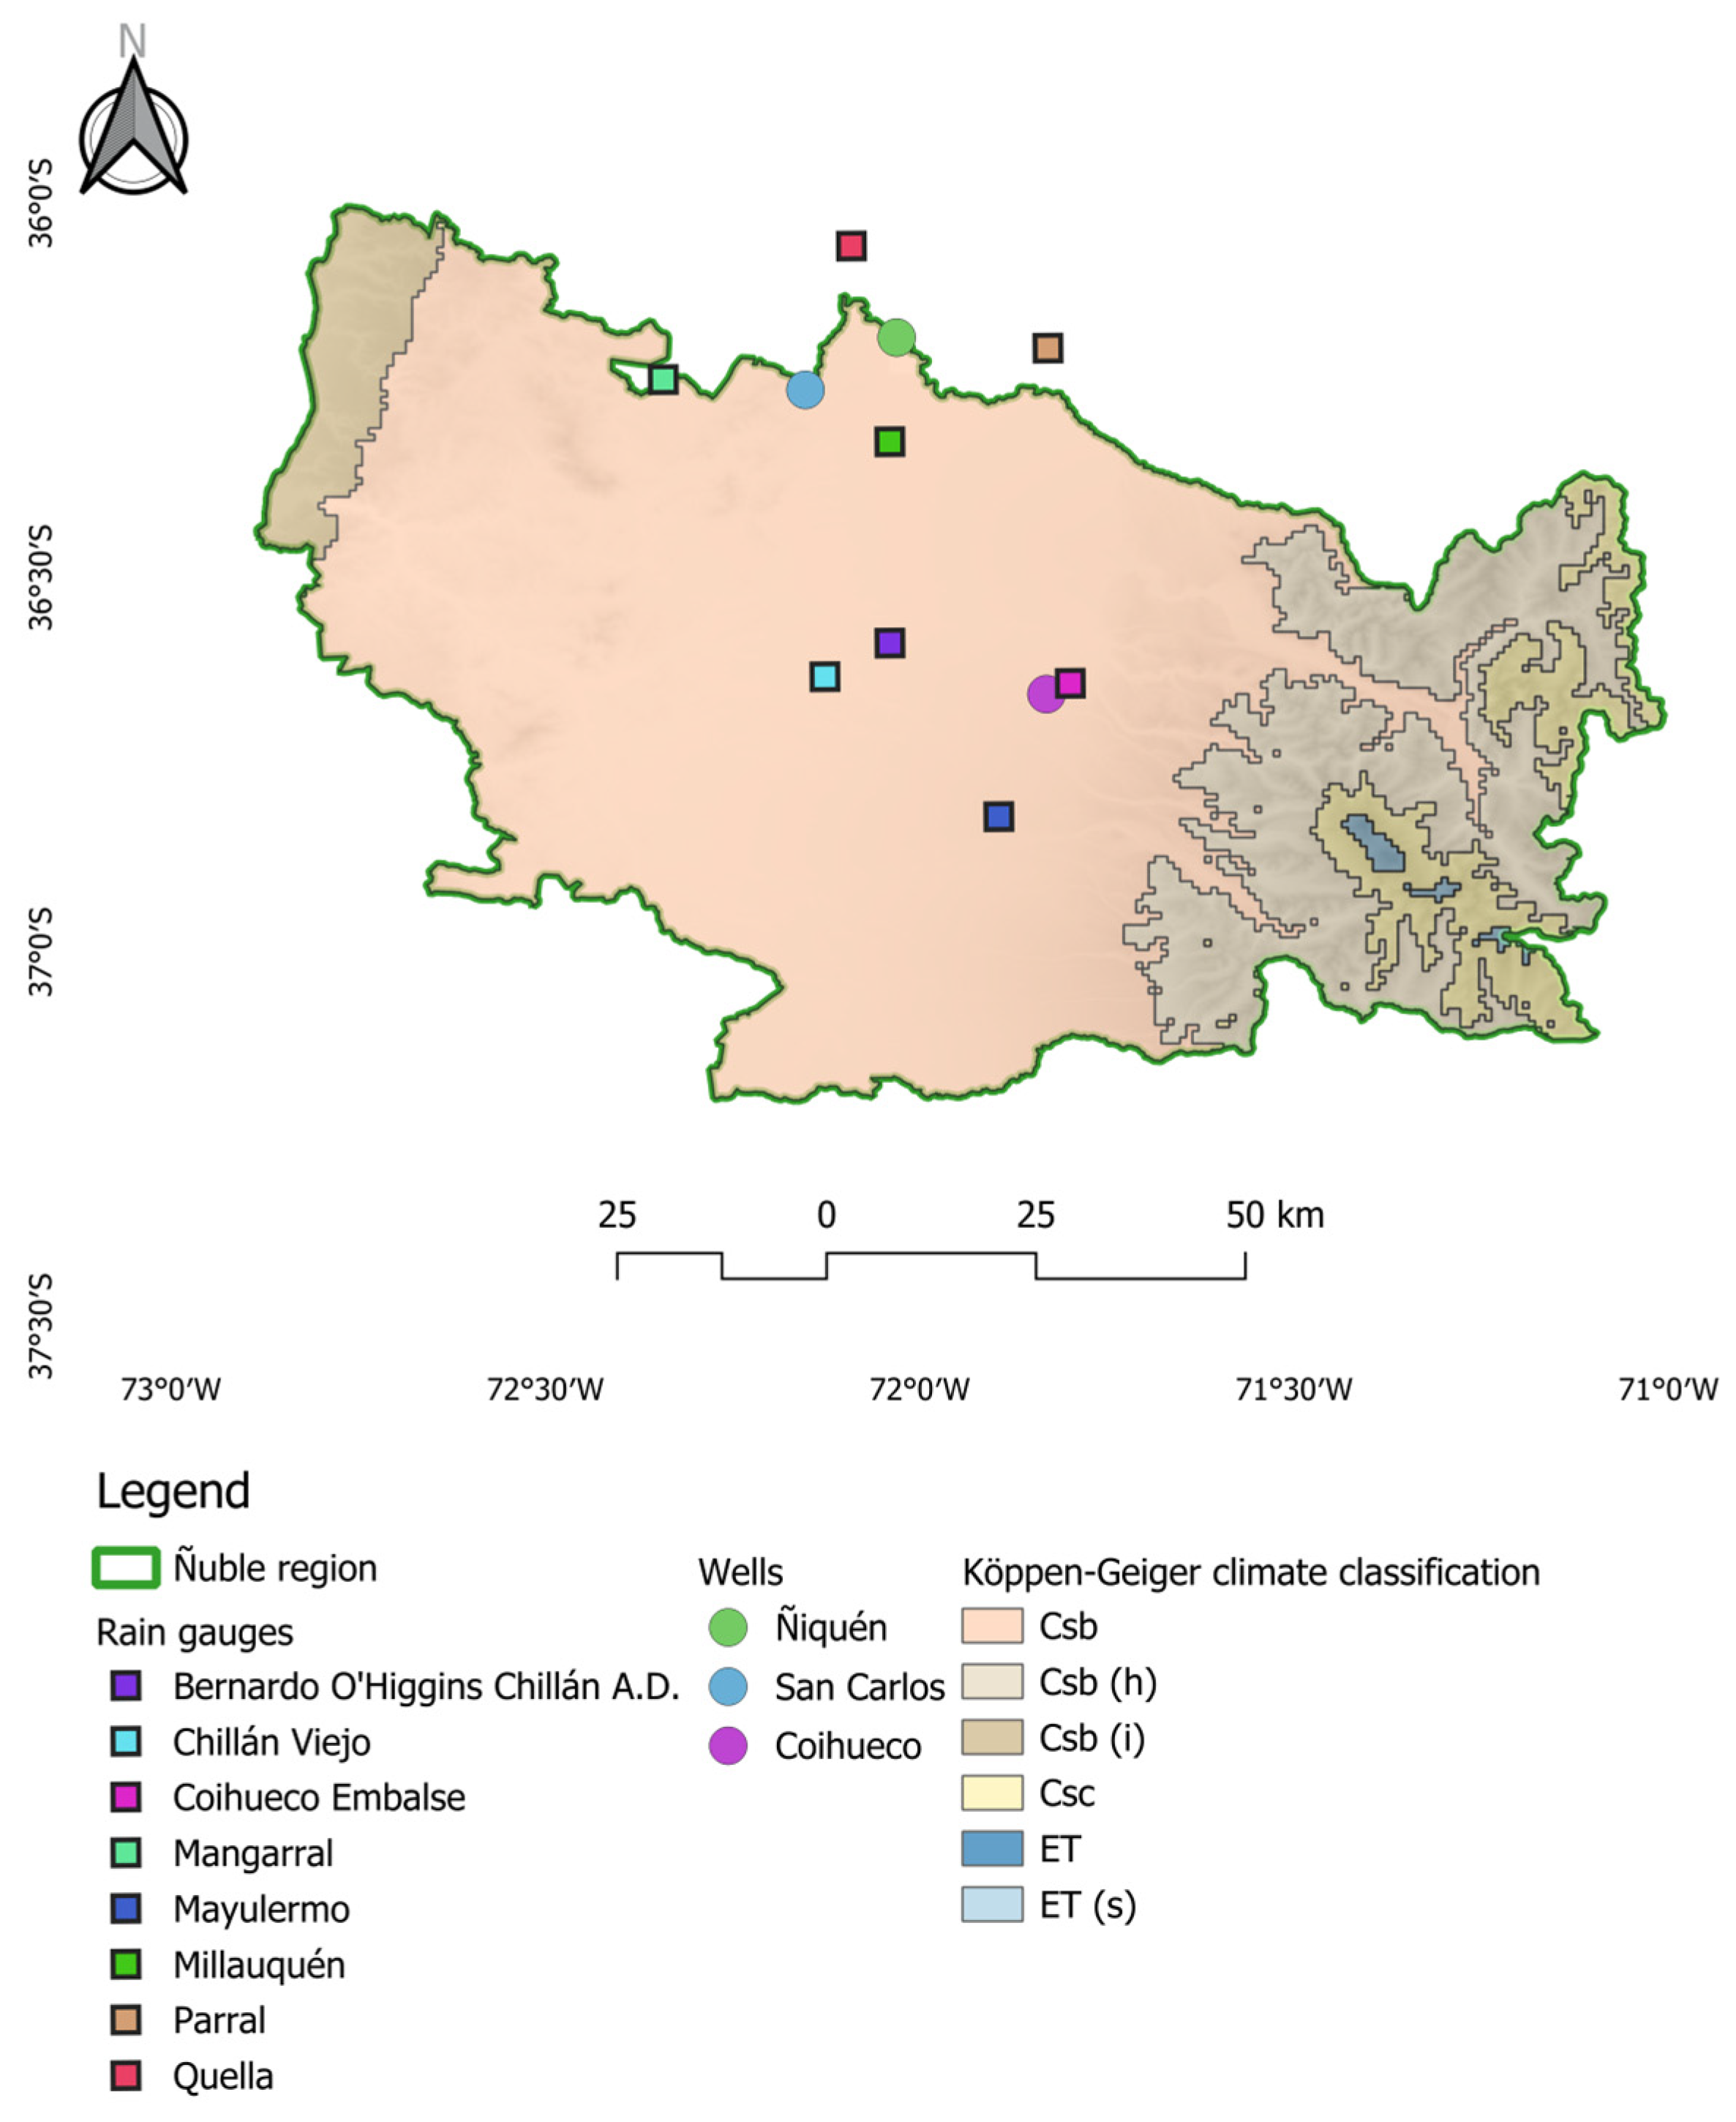
For this, the sampling points were georeferenced and cross-referenced with the DGA (General Water Directorate) rain gauge station layer, enabling identification of the stations with records closest to each point (Figure 2).
Figure 2.
Rain gauge stations within the study area.
Selection also considered the number of records available within the standard period (1991–2020), excluding stations with less than 80% completeness (i.e., fewer than 24 years of data). In order to better capture and understand the spatial distribution of precipitation, Inverse Distance Weighting (IDW) interpolation was used to predict between the selected stations and the planned systems, retaining only stations located within a 30 km radius (Figure 2).
These procedures described above facilitate the characterization of the temporal and spatial variability of the precipitation, while also ensuring that the estimated values adequately represent the study area.
2.3.1. Frequency Analysis
The estimated annual time series data were processed using a frequency analysis to estimate the Cumulative Distribution Function (CDF) that best represents the observed data [39]. The distributions tested in this work are listed in Table 1. Frequency analysis was carried out using R software version 4.5.3 [40].
Table 1.
Cumulative distributions tested.
2.3.2. Goodness-of-Fit
Traditional goodness-of-fit tests in statistics, for example, those suggested by Legates and McCabe [41], include the Nash–Sutcliffe efficiency (NSE), root mean square error (RMSE), mean absolute error (MAE), quantile–quantile (Q–Q) plots, and probability–probability (P–P) plots. These, among others, are used to quantify the performance of the different models proposed. Distribution selection was based on a combination of not just statistical but also graphical criteria. The Nash–Sutcliffe Efficiency (NSE) coefficient was used as the primary quantitative metric, while Probability–Probability (P–P) plots were used for visual assessment of the agreement between observed and estimated cumulative probabilities. The distribution with the highest NSE value and the best agreement to the 1:1 line in the P–P plots was selected for each site. Uncertainty for the estimated design rainfall values was determined using bootstrap resampling [42], from which confidence intervals were generated for the quantile associated with a non-exceedance probability of 0.1.
These tools allow identification of whether the variability explained by the model is adequate (NSE > 0.9) and whether the observed and estimated probabilities follow similar distributions [43]. The application of these goodness-of-fit tests is described below:
where y, ŷ, and ȳ represent the observed probabilities, those estimated by the CDF, and the observed mean, respectively. The P–P plot is interpreted visually. An adequate fit is indicated when the estimated values fall close to the line of perfect agreement, i.e., a 1:1 relationship, as previously mentioned.
2.3.3. Design Rainfall and Catchment Area
The steps described above enable selection of the best-fitting CDF—that is, the one that most accurately represents the observed data according to the goodness-of-fit tests. Once the CDF is selected, the value of the random variable can be estimated for different probabilities. For the RWHS design, Sangüesa Pool and Vallejos Carrera [38] indicate that a non-exceedance probability of 0.1 corresponds to a return period of approximately 1.1 years; that is, the projected design rainfall will be equaled or exceeded in 9 out of every 10 years. Additionally, the confidence interval associated with the probability of 0.1 was generated for each CDF selected using the bootstrap technique.
The catchment area of the rainwater harvesting systems is designed from the design rainfall estimated from the CDF. Equation (2) takes as inputs the required volume in m3, the design rainfall in meters, and the runoff coefficient. The latter depends on the geomembrane material used, with values ranging from 0.8 to 0.9 [30,31,38,44].
Once the catchment area size was determined, its shape was designed. This involved consideration of site conditions and available surface area, as well as the dimensions of the materials and equipment to be used.
For the present project, catchment areas were designed taking into account the fact that geomembrane is commercially available primarily in rolls of 7 m width by 100 m length.
2.4. Implementation of Works and Recharge System
The basic design of the works, calculated in the preceding steps, was assessed in the field to adapt it to site conditions, modifying the shape of the catchment area while maintaining the estimated total area.
Once the design was finalized, hydraulic connections were made between the catchment areas, storage tanks, recharge wells, and irrigation systems using pipes. Operational tests were subsequently conducted at each system, with no leaks or pressure losses detected. Furthermore, to prevent water contamination by solid material, a filter was installed between the catchment area and the water storage tank. Additionally, the drain was left at a height of 2 cm to allow solids to settle before entering the storage tank.
Additionally, pumps were installed for water mobilization according to the energy availability at each site. Photovoltaic solar pumps were installed at Coihueco and San Carlos due to their distance from the electricity grid. At Ñiquén, a conventional electric pump was installed to transfer water from the storage tank to the recharge well, utilizing the available grid connection. For the irrigation systems, Ñiquén and Coihueco used pre-existing pumps, while a new electric pump was installed at San Carlos.
2.5. Hydrogeological Characterization of the Territory
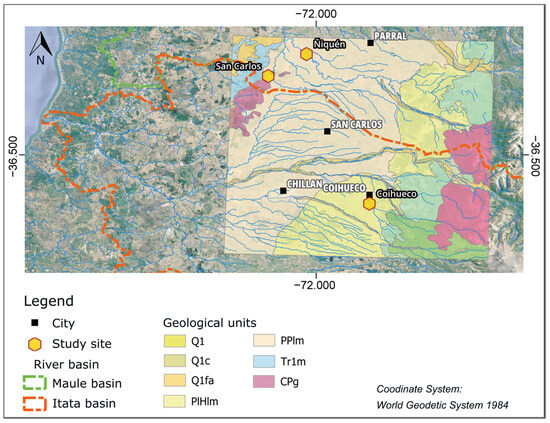
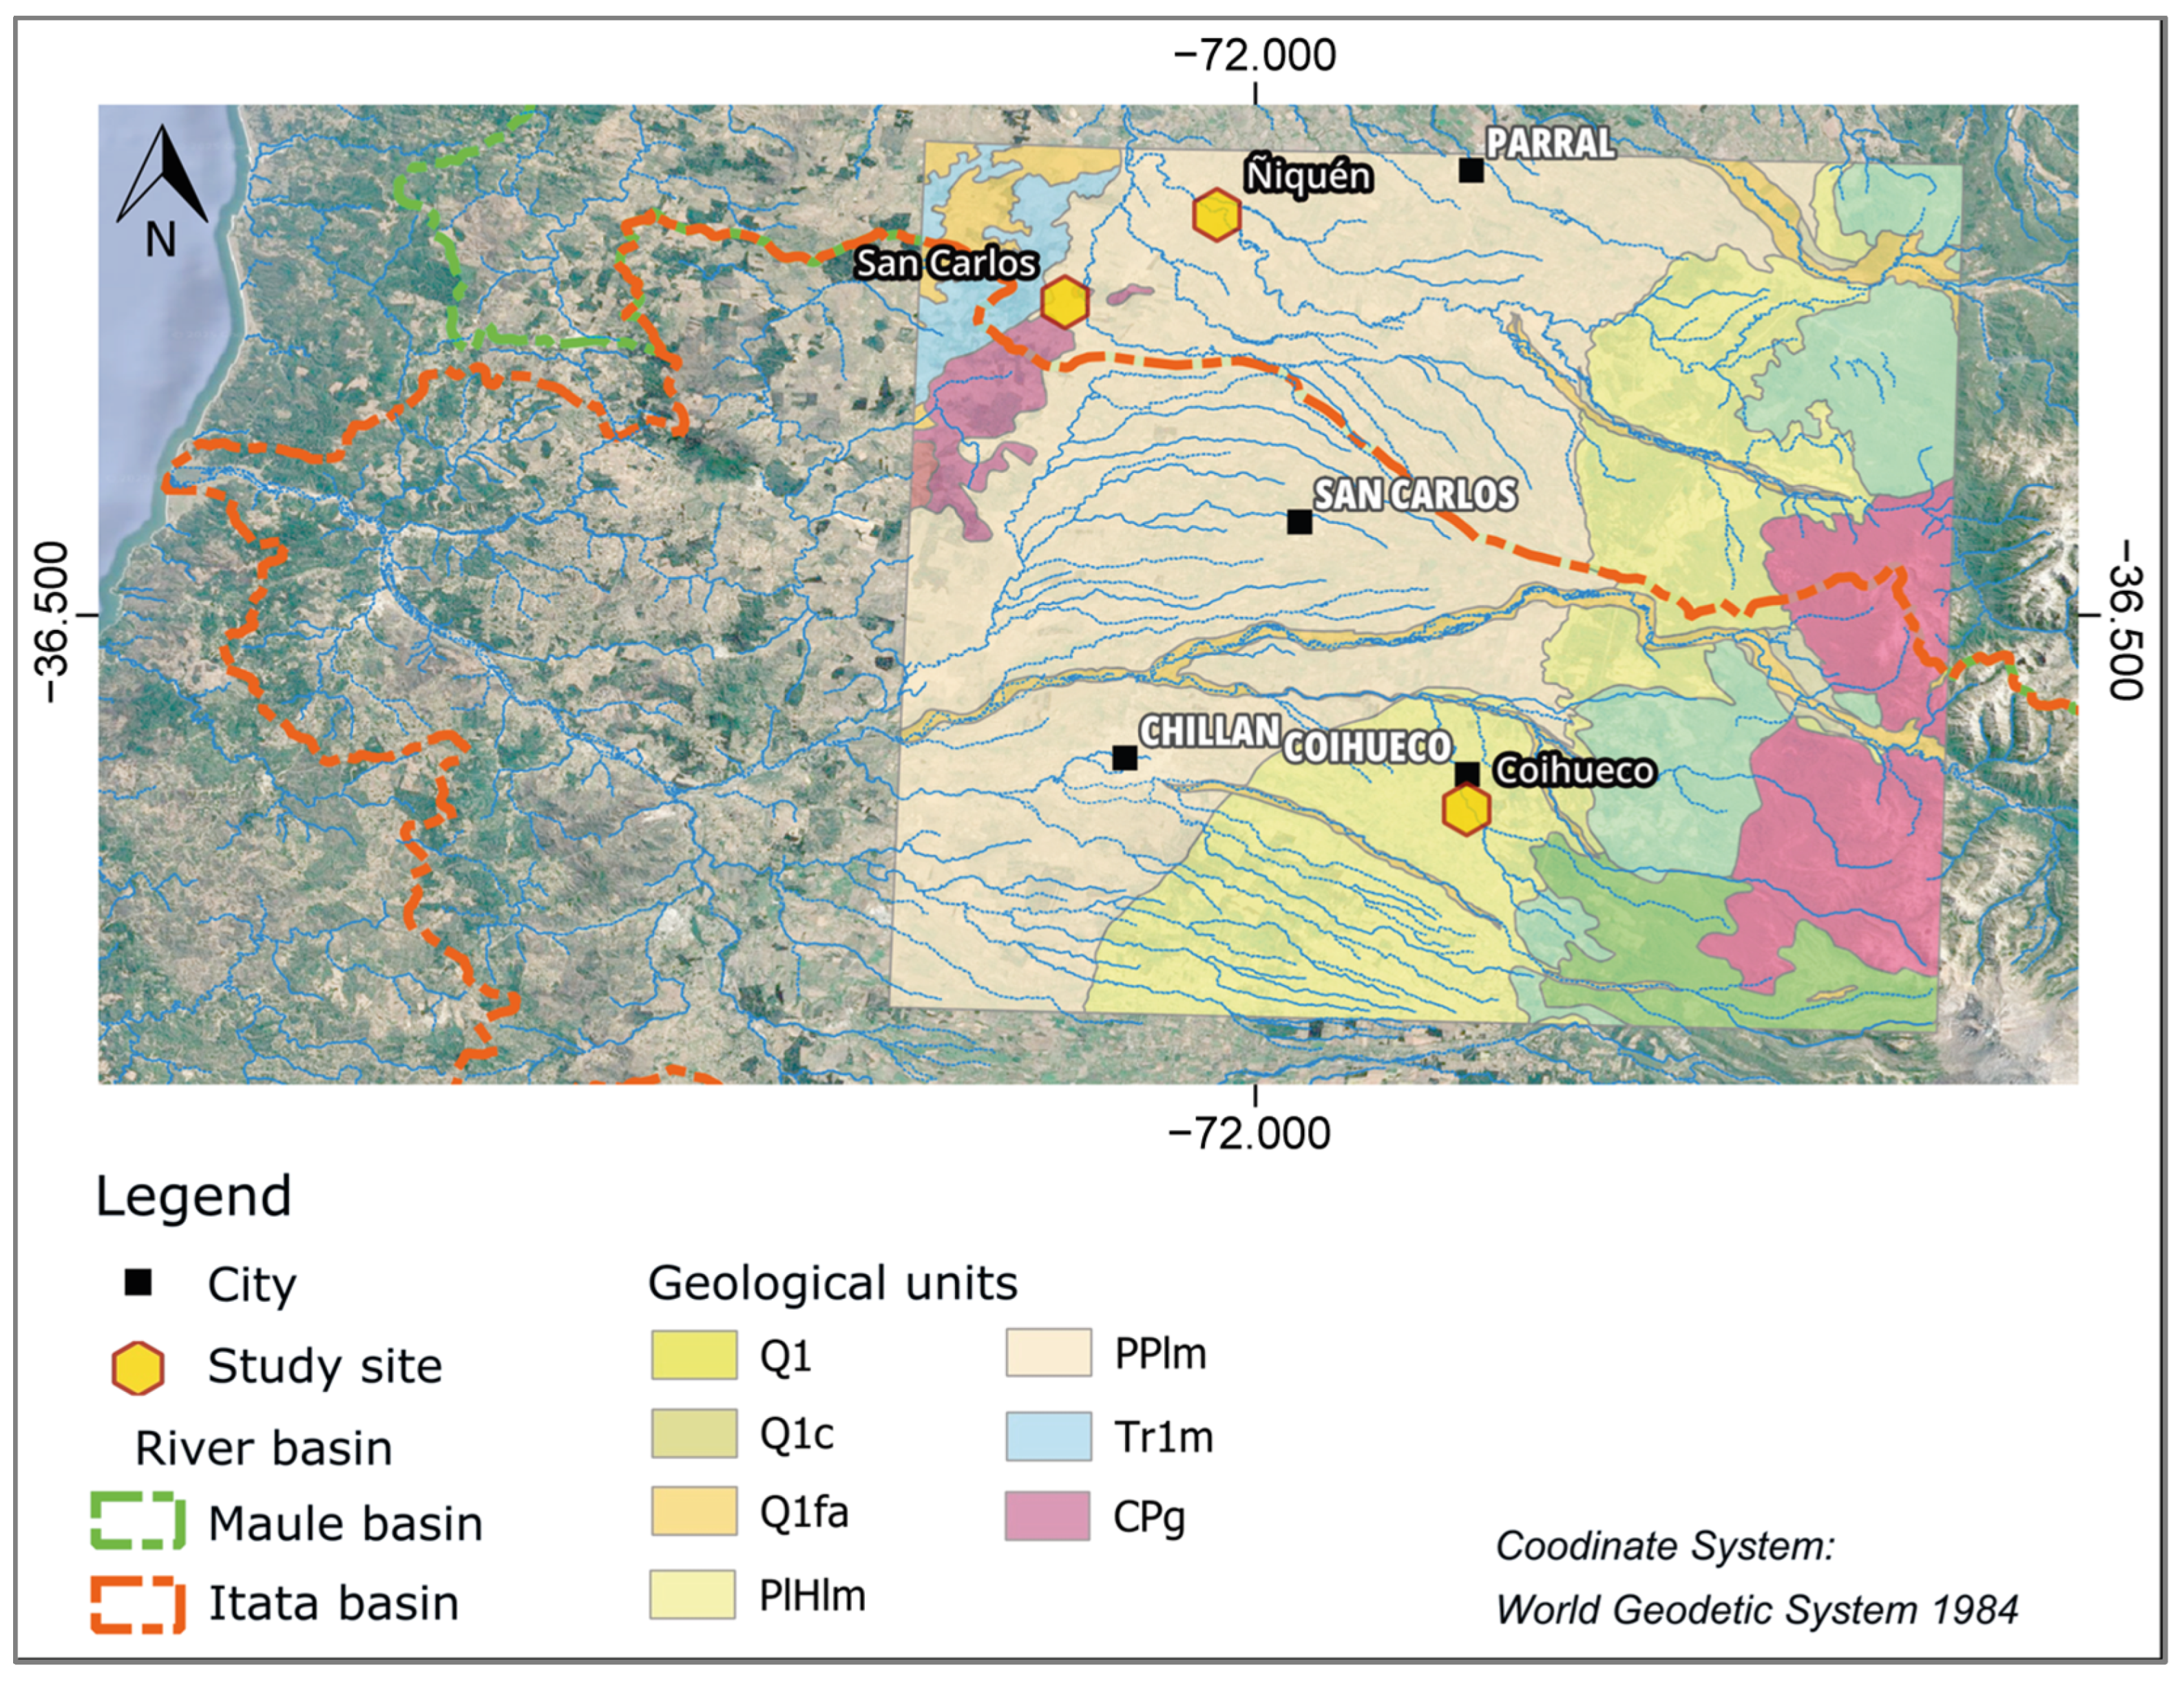
During the project, a literature-based conceptualization of the hydrogeological and geological characteristics of the study area (comprising the municipalities of San Fabián, Ñiquén, Coihueco, and San Carlos) was conducted. DGA studies [45,46,47] were consulted, enabling identification of the main hydrogeological unit: an unconfined, free-water sedimentary aquifer formed by alluvial, colluvial, and fluvial processes, occupying the floodplains of the main rivers and their surroundings in a fan-shaped pattern oriented east–west. This formation was found to extend beyond the study area boundaries to the west, north, and south, sharing groundwater resources with other municipalities such as Chillán, Pinto, Ninhue, Parral, and Cauquenes. To characterize the specific geological context of the Intermediate Depression in the Ñuble region, works by Gajardo [48], Muñoz and Niemeyer [49], and Sernageomin [50] were reviewed, enabling identification of the main sedimentary deposit and low-consolidation rock units: the Mininco Formation (PPlm), composed of tuffaceous sandstones, siltstones, and conglomerates with interbedded claystones and tuffs of Pliocene age; and the La Montaña Formation (PlHlm), described as glacial moraine and fluvioglacial deposits of Pleistocene to Holocene age, composed of clays, sands, and gravels of volcanic and granitic composition. On the western margin of the Intermediate Depression, forming its orographic boundary, consolidated rocks belonging to the Coastal Batholith (CPg) are recognized, composed of Palaeozoic granitic rocks overlain by a developed weathering mantle [51], together with rocks of the Pocillas–Coronel de Maule Strata unit (Tr1m) of Upper Triassic age, including slaty mudstones, sandstones, quartziferous conglomerates, lavas, and andesitic breccias (Figure 3).
Figure 3.
Geology of the study area. Modified from Gajardo [48] and Sernageomin [50].
2.6. Water-Level Trends Based on Regional Data and Well Analysis
To characterize the behavior and status of the region’s aquifers, groundwater level records from the General Water Directorate (DGA) monitoring network were analyzed. Station selection involved a combined assessment of their characteristics, location, and data quality, including only those with a continuous record of 10 years or more, in order to determine water-level trends in the aquifers of the intermediate depression. At the local scale, monthly water-level monitoring was carried out around the research sites over a one-year period to construct local piezometric gradient maps and determine groundwater flow directions and gradients.
Additionally, electrical resistivity tomography (ERT) surveys were carried out at the selected wells to characterize subsurface structure and the distribution of hydrogeological units at each site. ERT profiles were acquired using a Wenner–Schlumberger array with 37 electrodes spaced at 5 m intervals, with signal quality control and stacking, and data processing and inversion using smooth-constraint least squares [52,53,54].
2.7. Water Quality
Water-quality analyses were conducted on samples collected from both the recharge wells and the harvested rainwater stored in the storage containers prior to injection. The objective was to verify that the quality of the recharge water was equal to or better than that of the receiving groundwater, consistent with groundwater-recharge requirements in Chile. To reduce the introduction of suspended solids, a sediment filter was installed between the catchment area and the storage system. Furthermore, the outlet pipe was positioned approximately 2 cm above the bottom of the hydroaccumulator to promote sedimentation of particulate matter before water entered the recharge well. Samples were collected from both the wells and the RWHS storage tanks.
Finally, injection tests were conducted at the selected wells to estimate the recharge rate and assess the feasibility of this technique as a water-management measure.
2.8. Use of AI
Artificial intelligence tools (ChatGPT 5.4) were used to ensure proper English and assist with expressing thoughts and ideas within the manuscript.
3. Results
3.1. Selected Wells
The 12 prospected wells were assessed using the selection rubric, with wells 1, 2, 3, 4, and 6 identified as the five candidates, from which wells 1, 2, and 3 (Ñiquén, San Carlos and Coihueco) were ultimately selected as the most suitable for implementing the recharge system, based on the hydrogeological characteristics of the area and enabling operational factors for construction and system management, presenting the greatest hydrogeological and operational potential to ensure the success of the project.
3.2. Precipitation Estimation
Based on the selection criteria defined in the methodology, six rain gauge stations were selected, distributed between latitudes 36° S and 37° S. These stations are located primarily in the Ñuble Region, with the inclusion of one additional station from the Maule Region (Table 2).
Table 2.
Distance between rain gauges and wells.
Based on spatial cross-referencing between the sampling points and the DGA rain gauge stations, the nearest stations to each point were identified. From the stations identified (Table 2), only those with at least 24 years of data within the standard period 1991–2020 (≥80% completeness) were retained. Subsequently, for each planned system, only the stations located within a 30 km radius were considered in the analysis. The Inverse Distance Weighting (IDW) method was then applied using the stations that met both criteria.
Based on this matrix, precipitation was spatially estimated for each selected well. The procedures described allow for characterizing the temporal and spatial variability of precipitation, ensuring that the estimated values adequately represent the study area. As a result, the spatial interpolation generated three 30-year data series for each selected point, which were used in the frequency analysis (Table 3).
Table 3.
Estimated precipitation for each study area.
3.3. Goodness of Fit Metrics
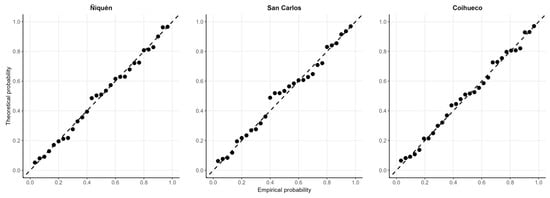
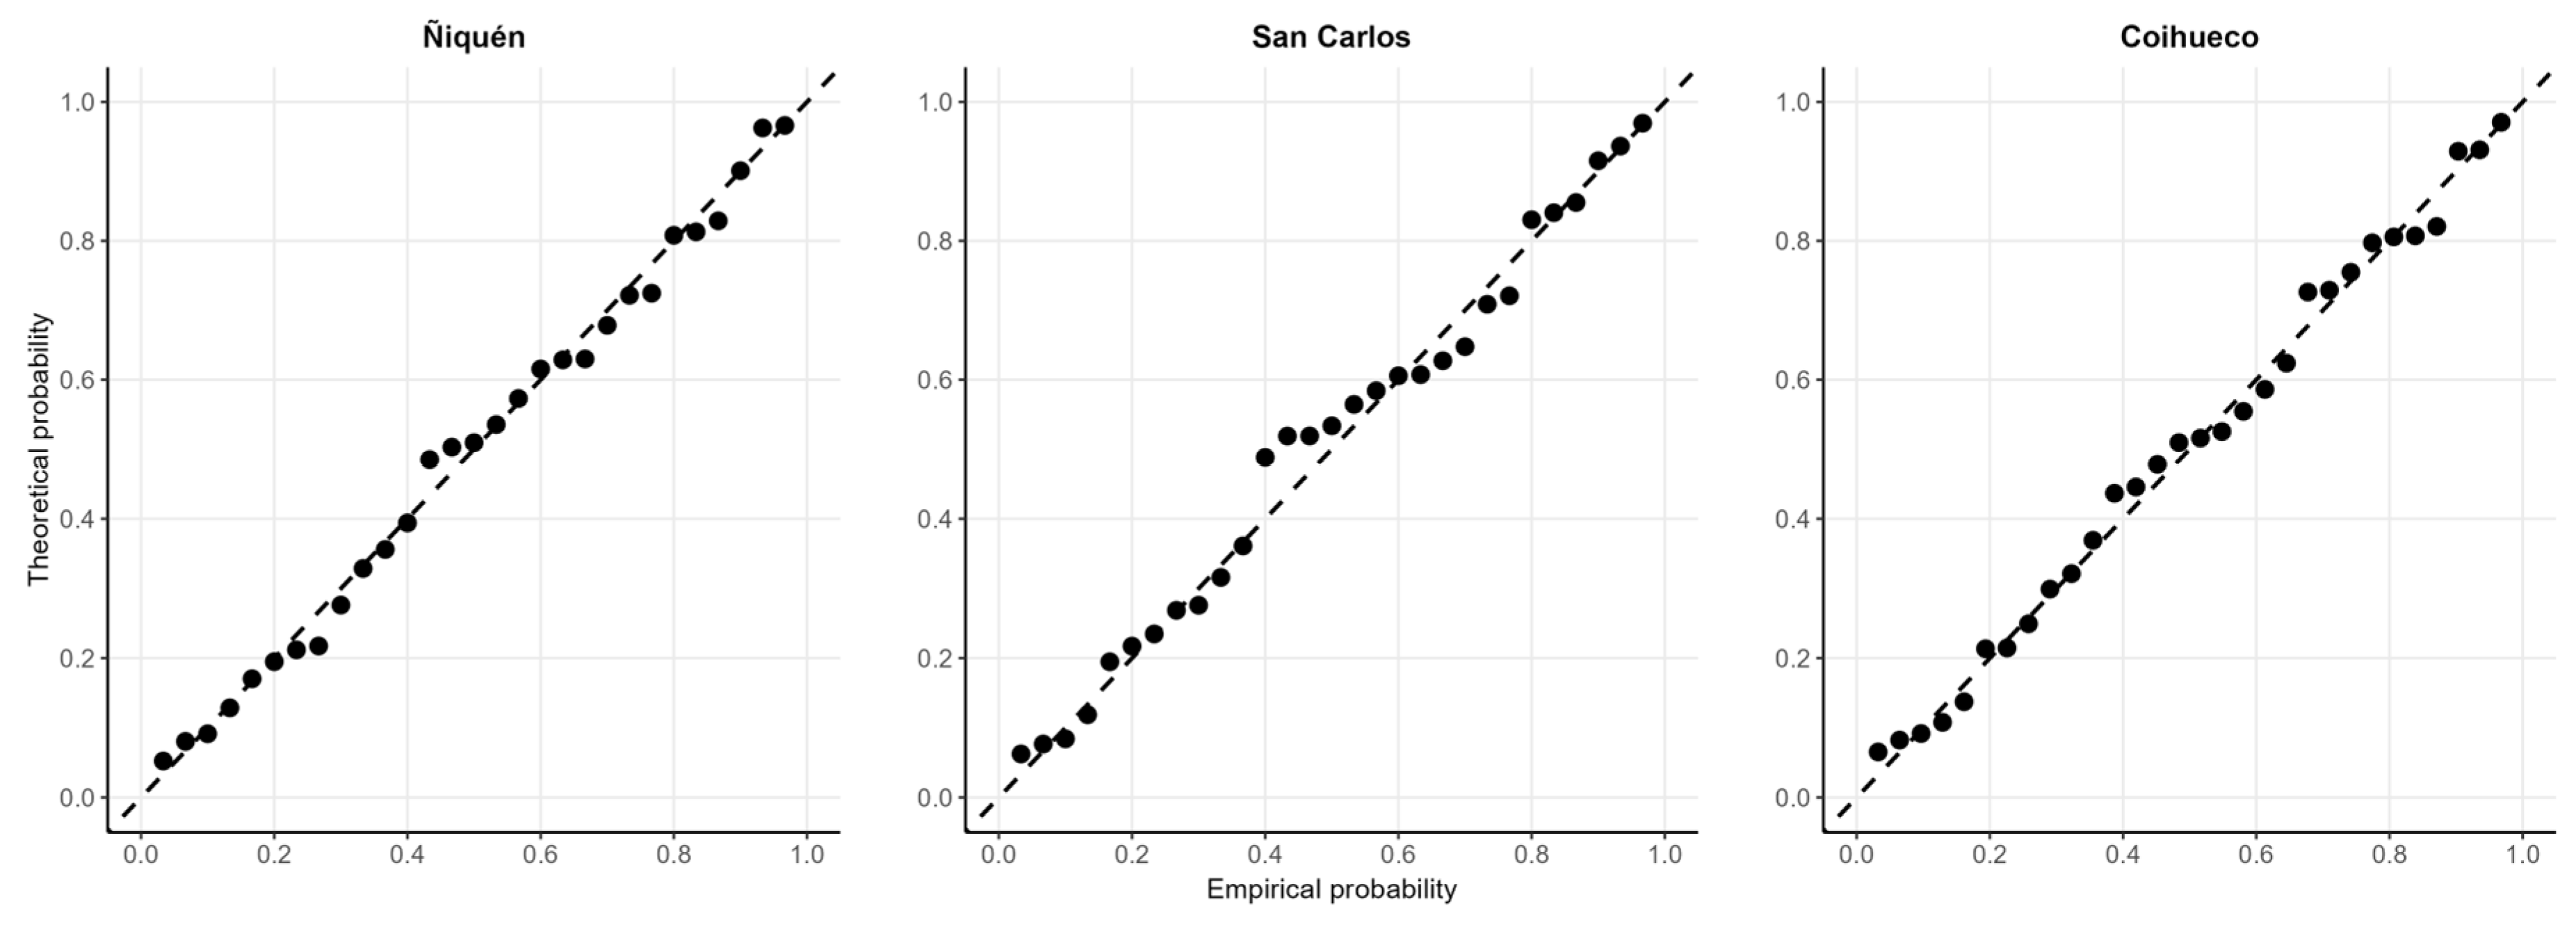
The goodness-of-fit test results show that the Fisher–Tippett type III distribution best describes the data, according to the Nash–Sutcliffe efficiency (NSE) values above 0.95 for all three study areas (Table 4). Consistently, the P–P plots show values tightly aligned with the 1:1 line (Figure 4), which further confirms the quality of the fit. As such, it was determined that this distribution is appropriate for modeling annual precipitation in the study areas.
Table 4.
Goodness-of-fit test results.
Figure 4.
P–P plots for the study area.
From this fit, design rainfall values associated with an exceedance probability of 0.1 (return period of approximately 1.1 years) were estimated as 442.1 mm for Ñiquén, 456.5 mm for San Carlos, and 694.4 mm for Coihueco (Table 4).
3.4. System Dimensions
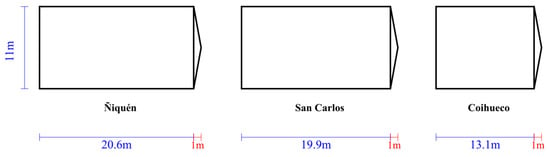
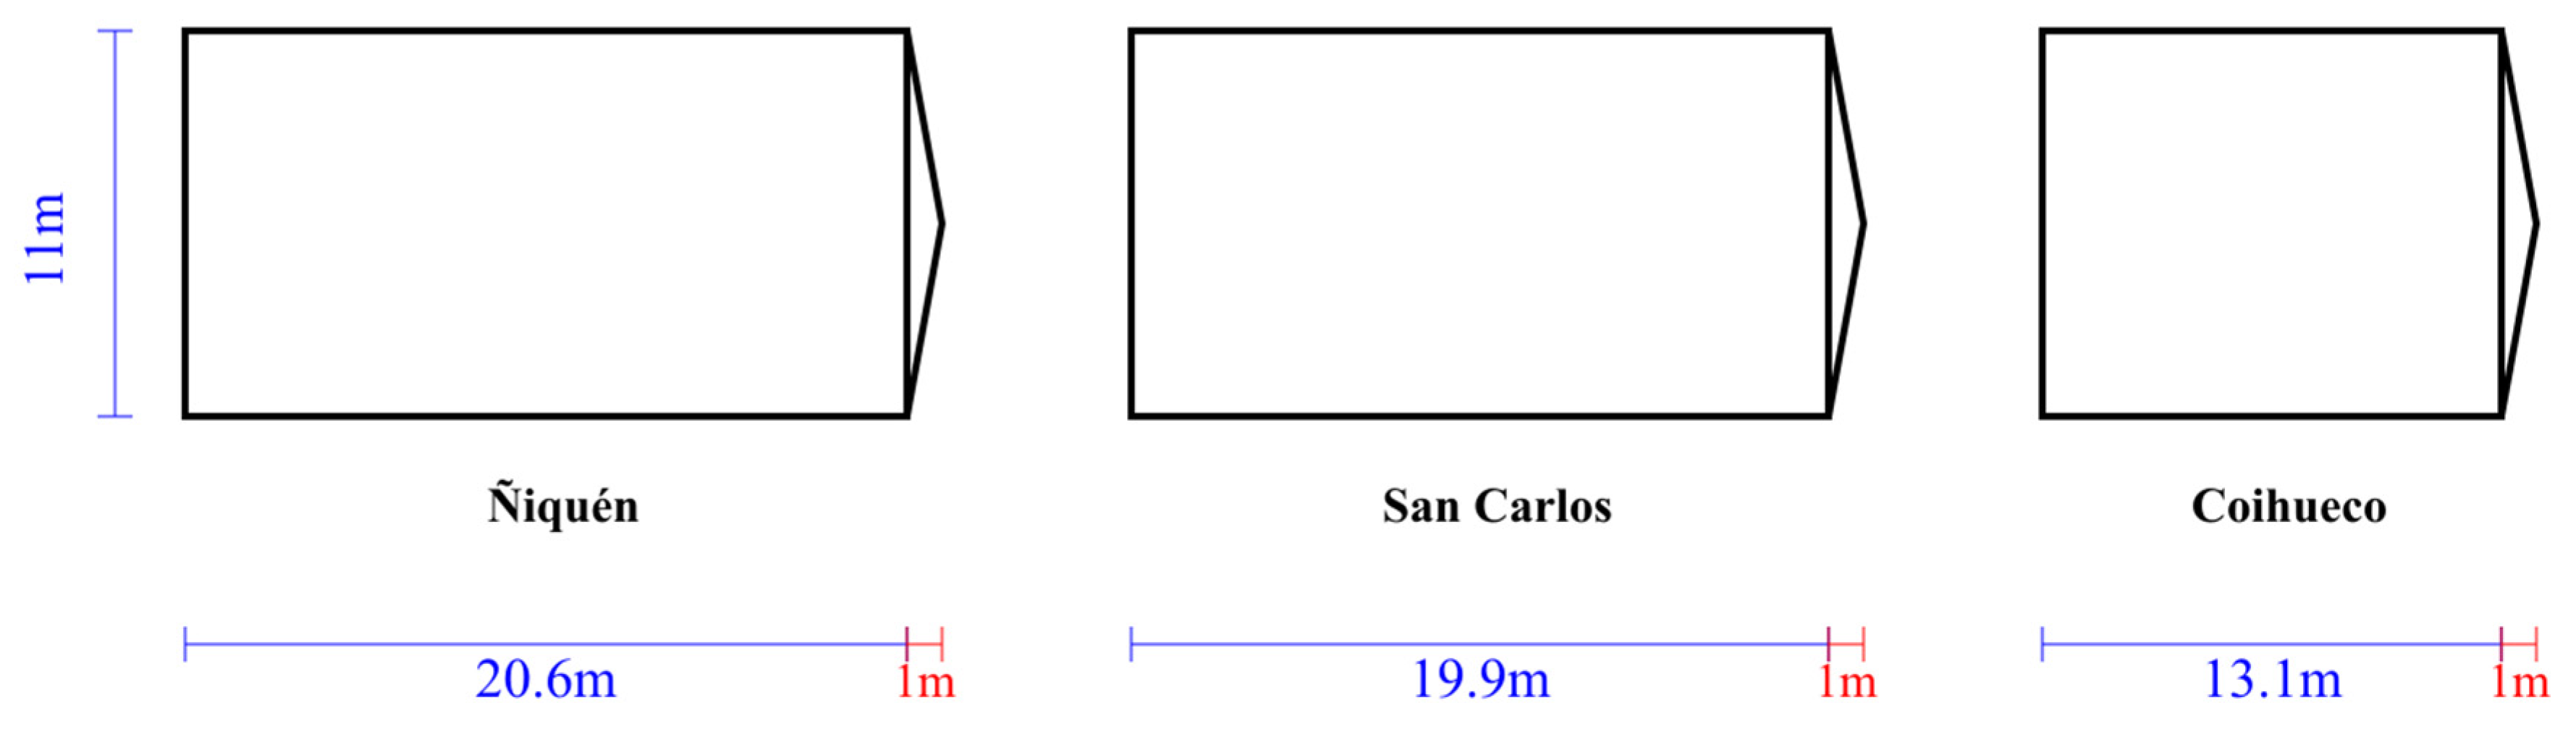
Using the design rainfall and Equation (2), the catchment area for each system was estimated. A practical constraint that was considered in determining the shape and size of these areas was the commercial format of geomembrane material, which is sold in rolls of 100 m length by 7 m width. For this reason, a structure width of 11 m was adopted, equivalent to 14 m of material minus losses associated with welding and anchoring of the rolls. The final dimensions are presented in Figure 5.
Figure 5.
Catchment area dimensions of the RWHS.
3.5. Well Recharge
The structures used for injection at the three project sites were existing hand-dug (noria-type) wells (Table 5), with depths between 5.8 and 11.0 m. At Ñiquén and Coihueco, the wells are used for domestic supply and maintain a permanent water column, though this water column fluctuates throughout the year. At San Carlos, the well is not in continuous active use and dries up in summer.
Table 5.
Description of wells used.
3.5.1. Site Hydrogeology
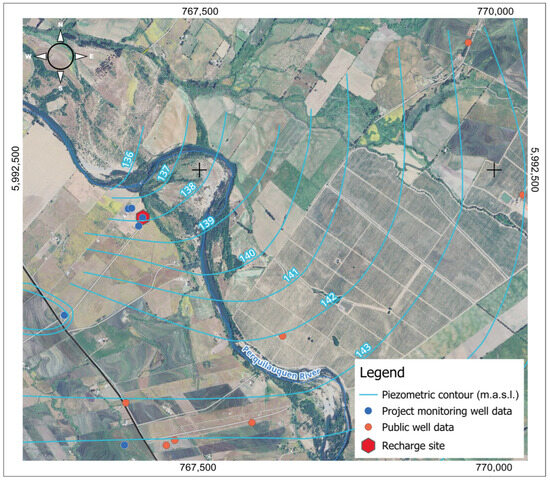
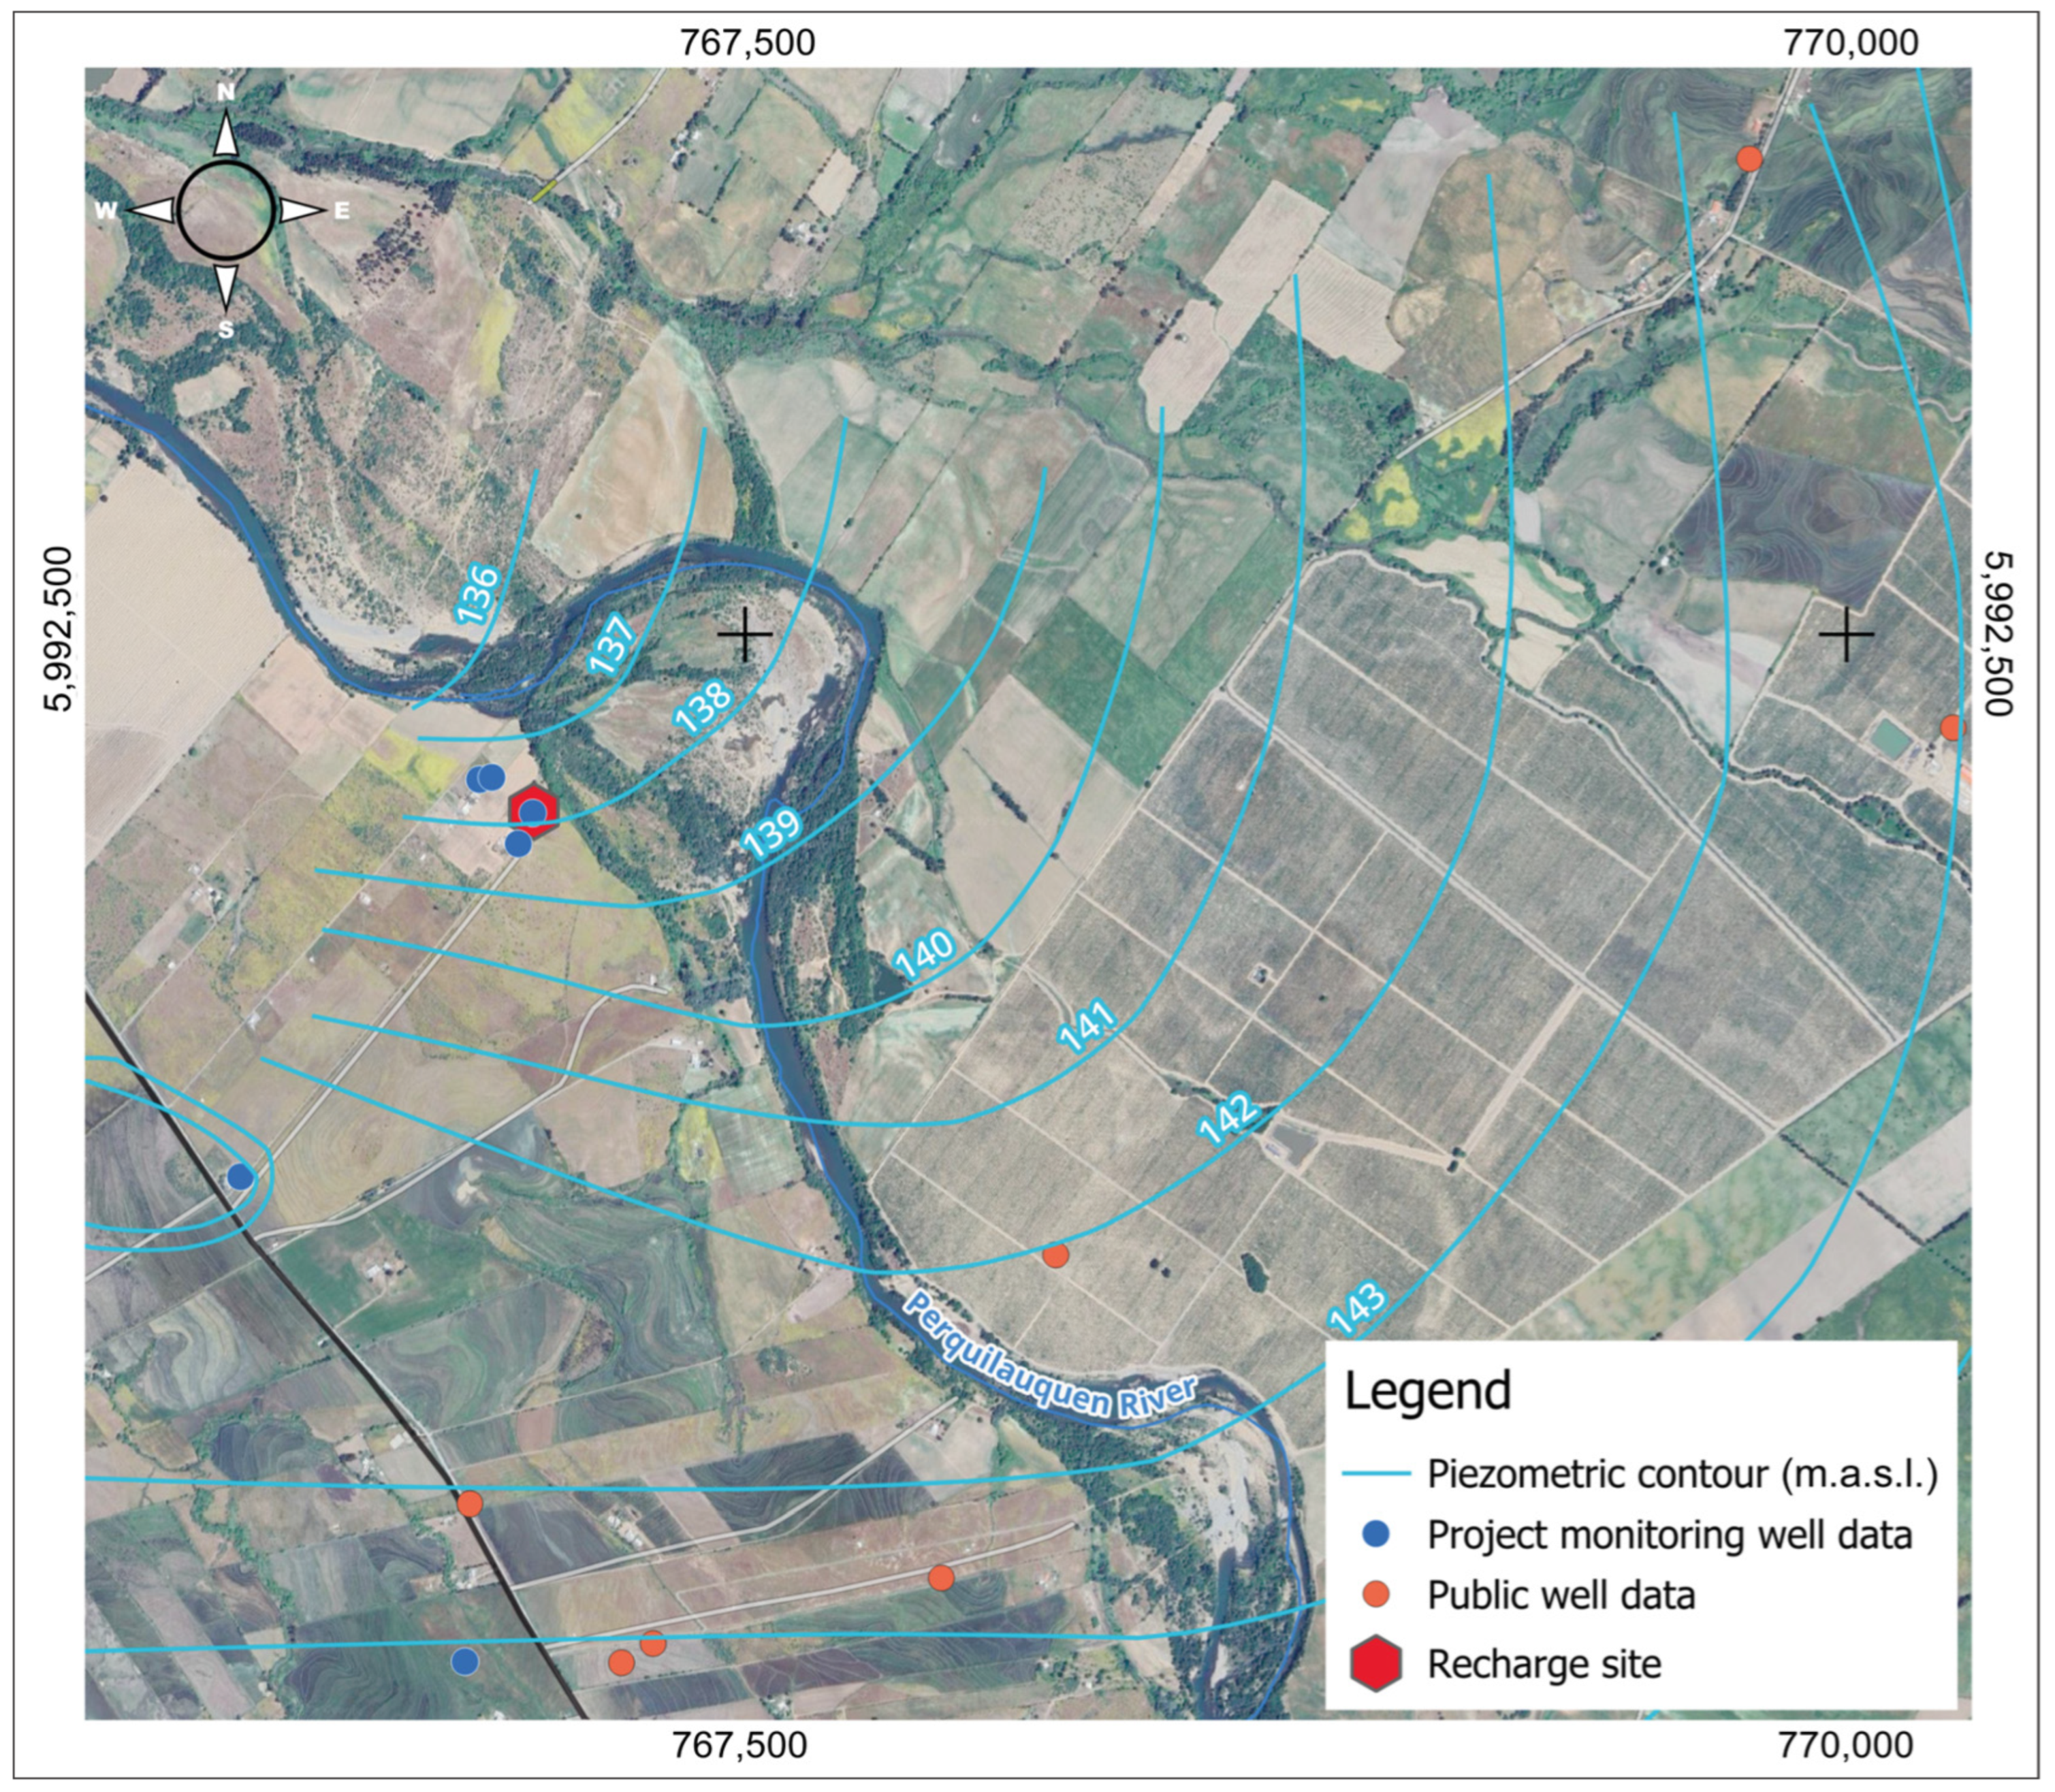
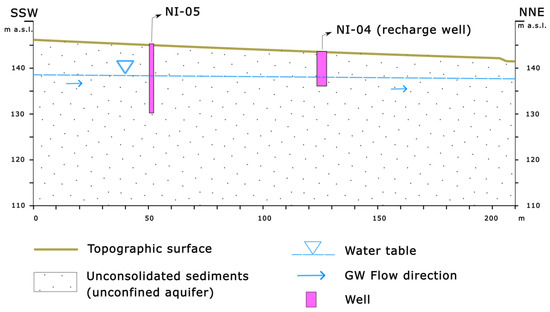
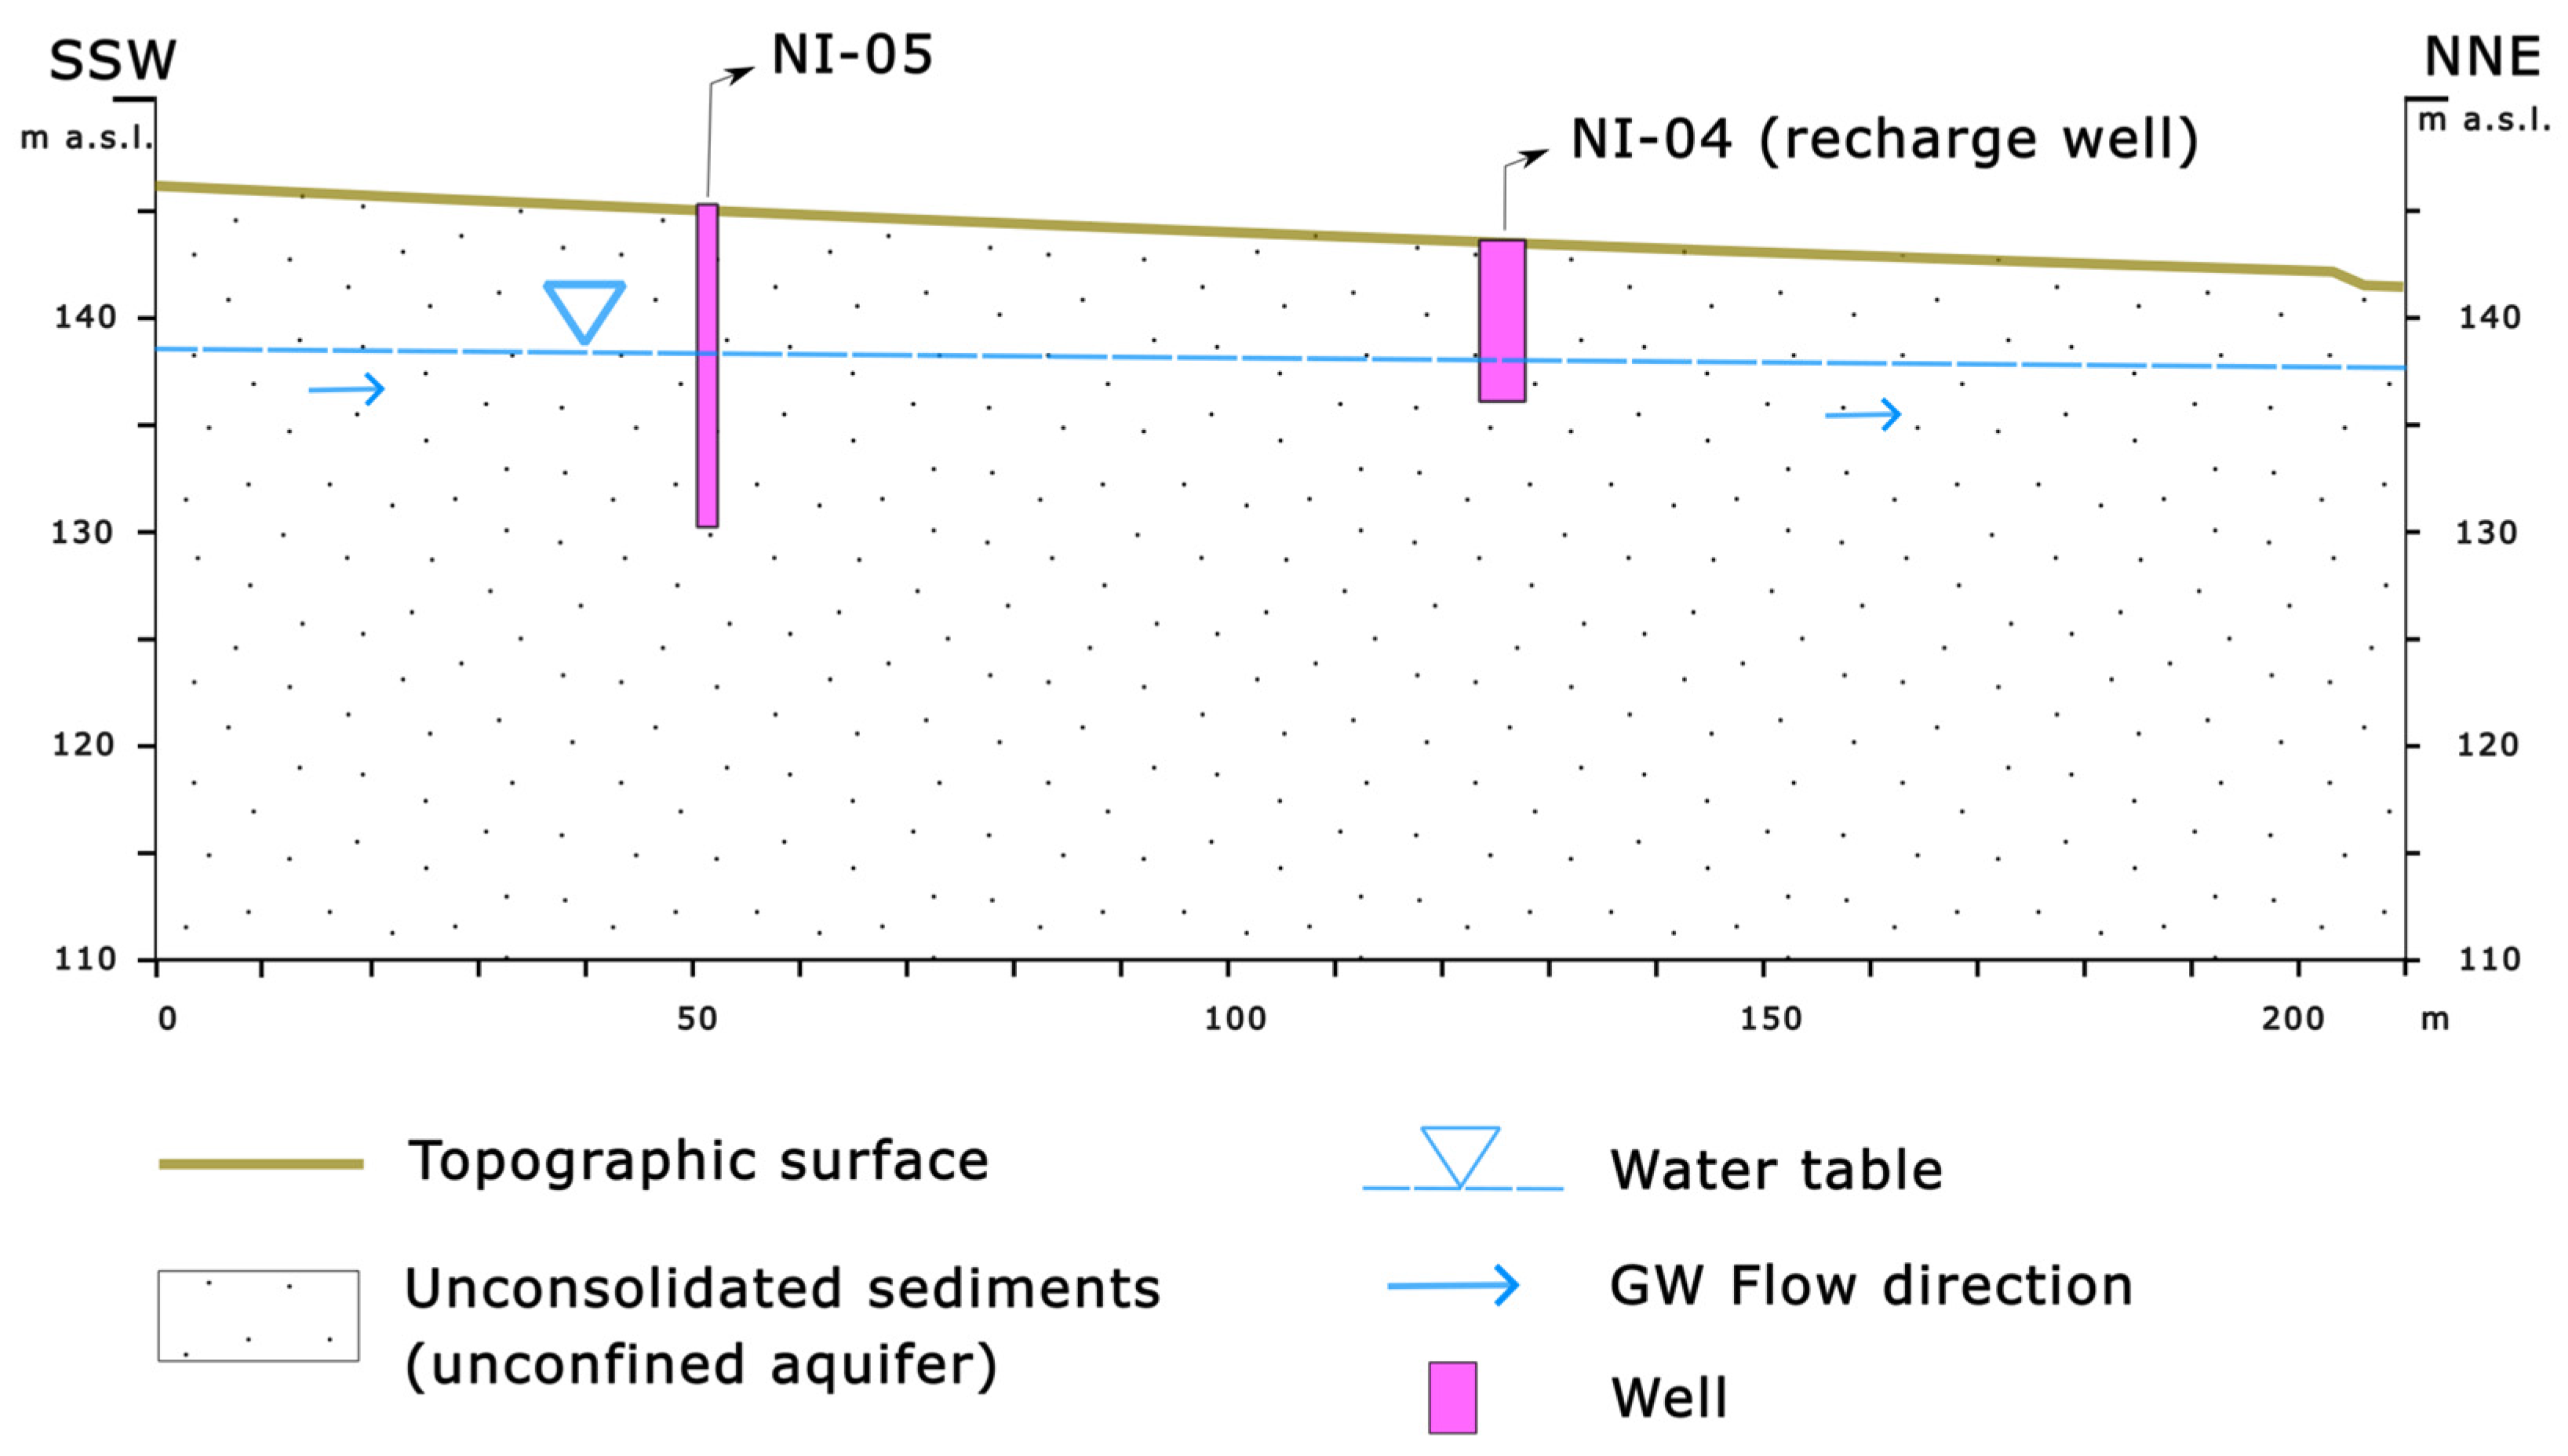
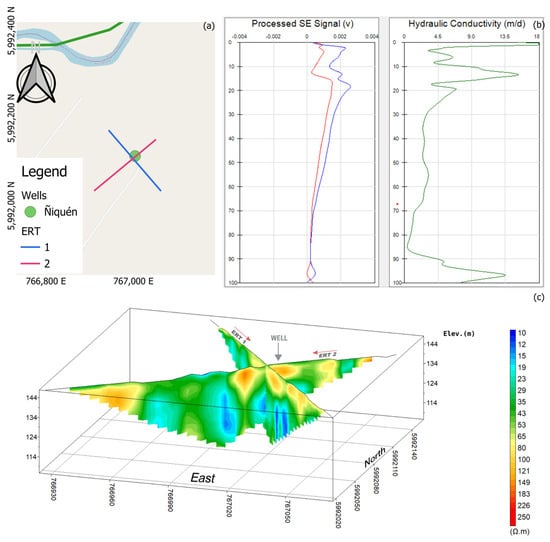
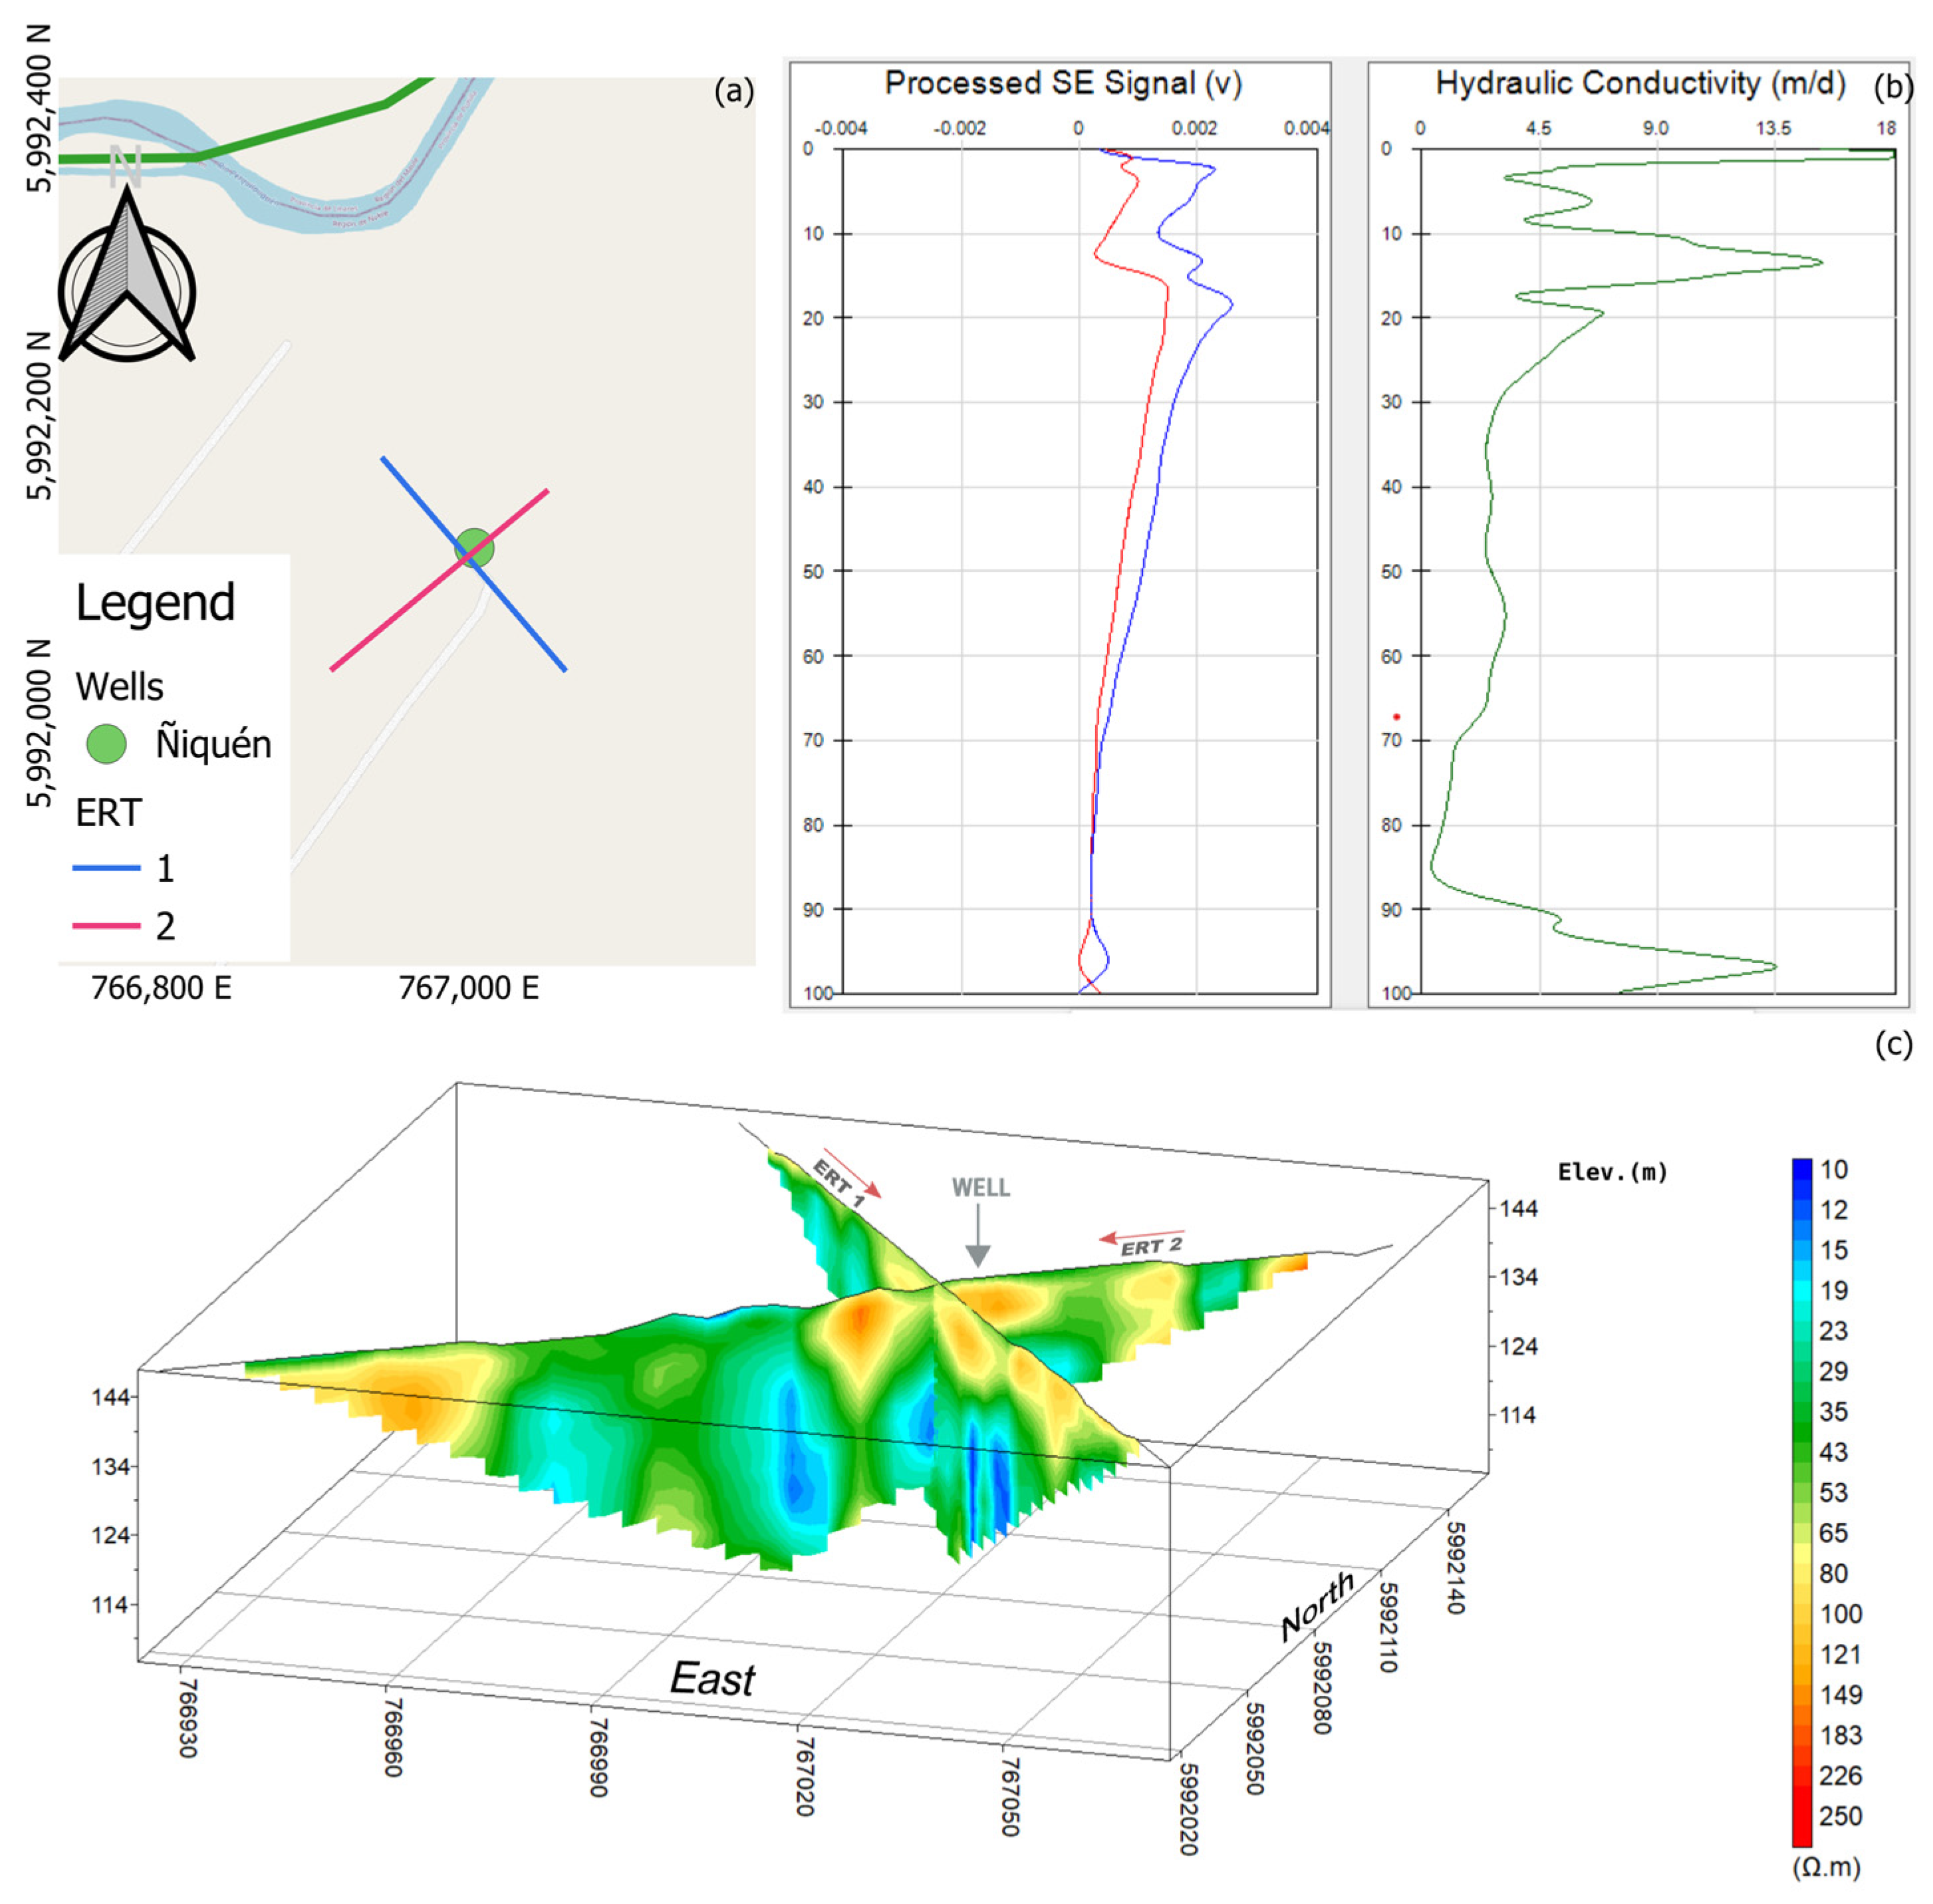
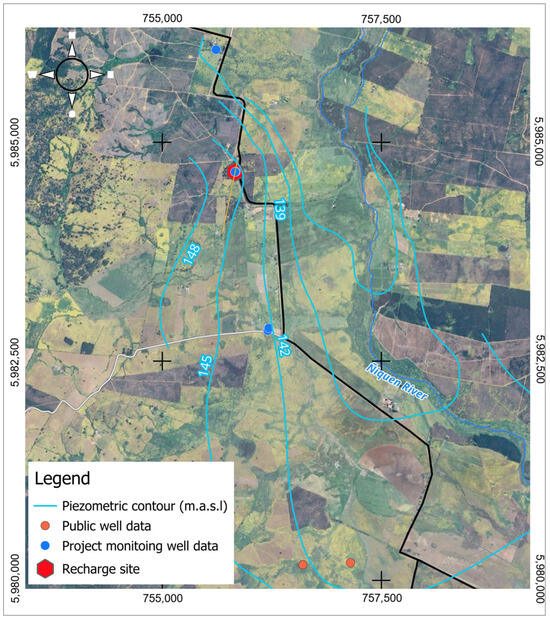
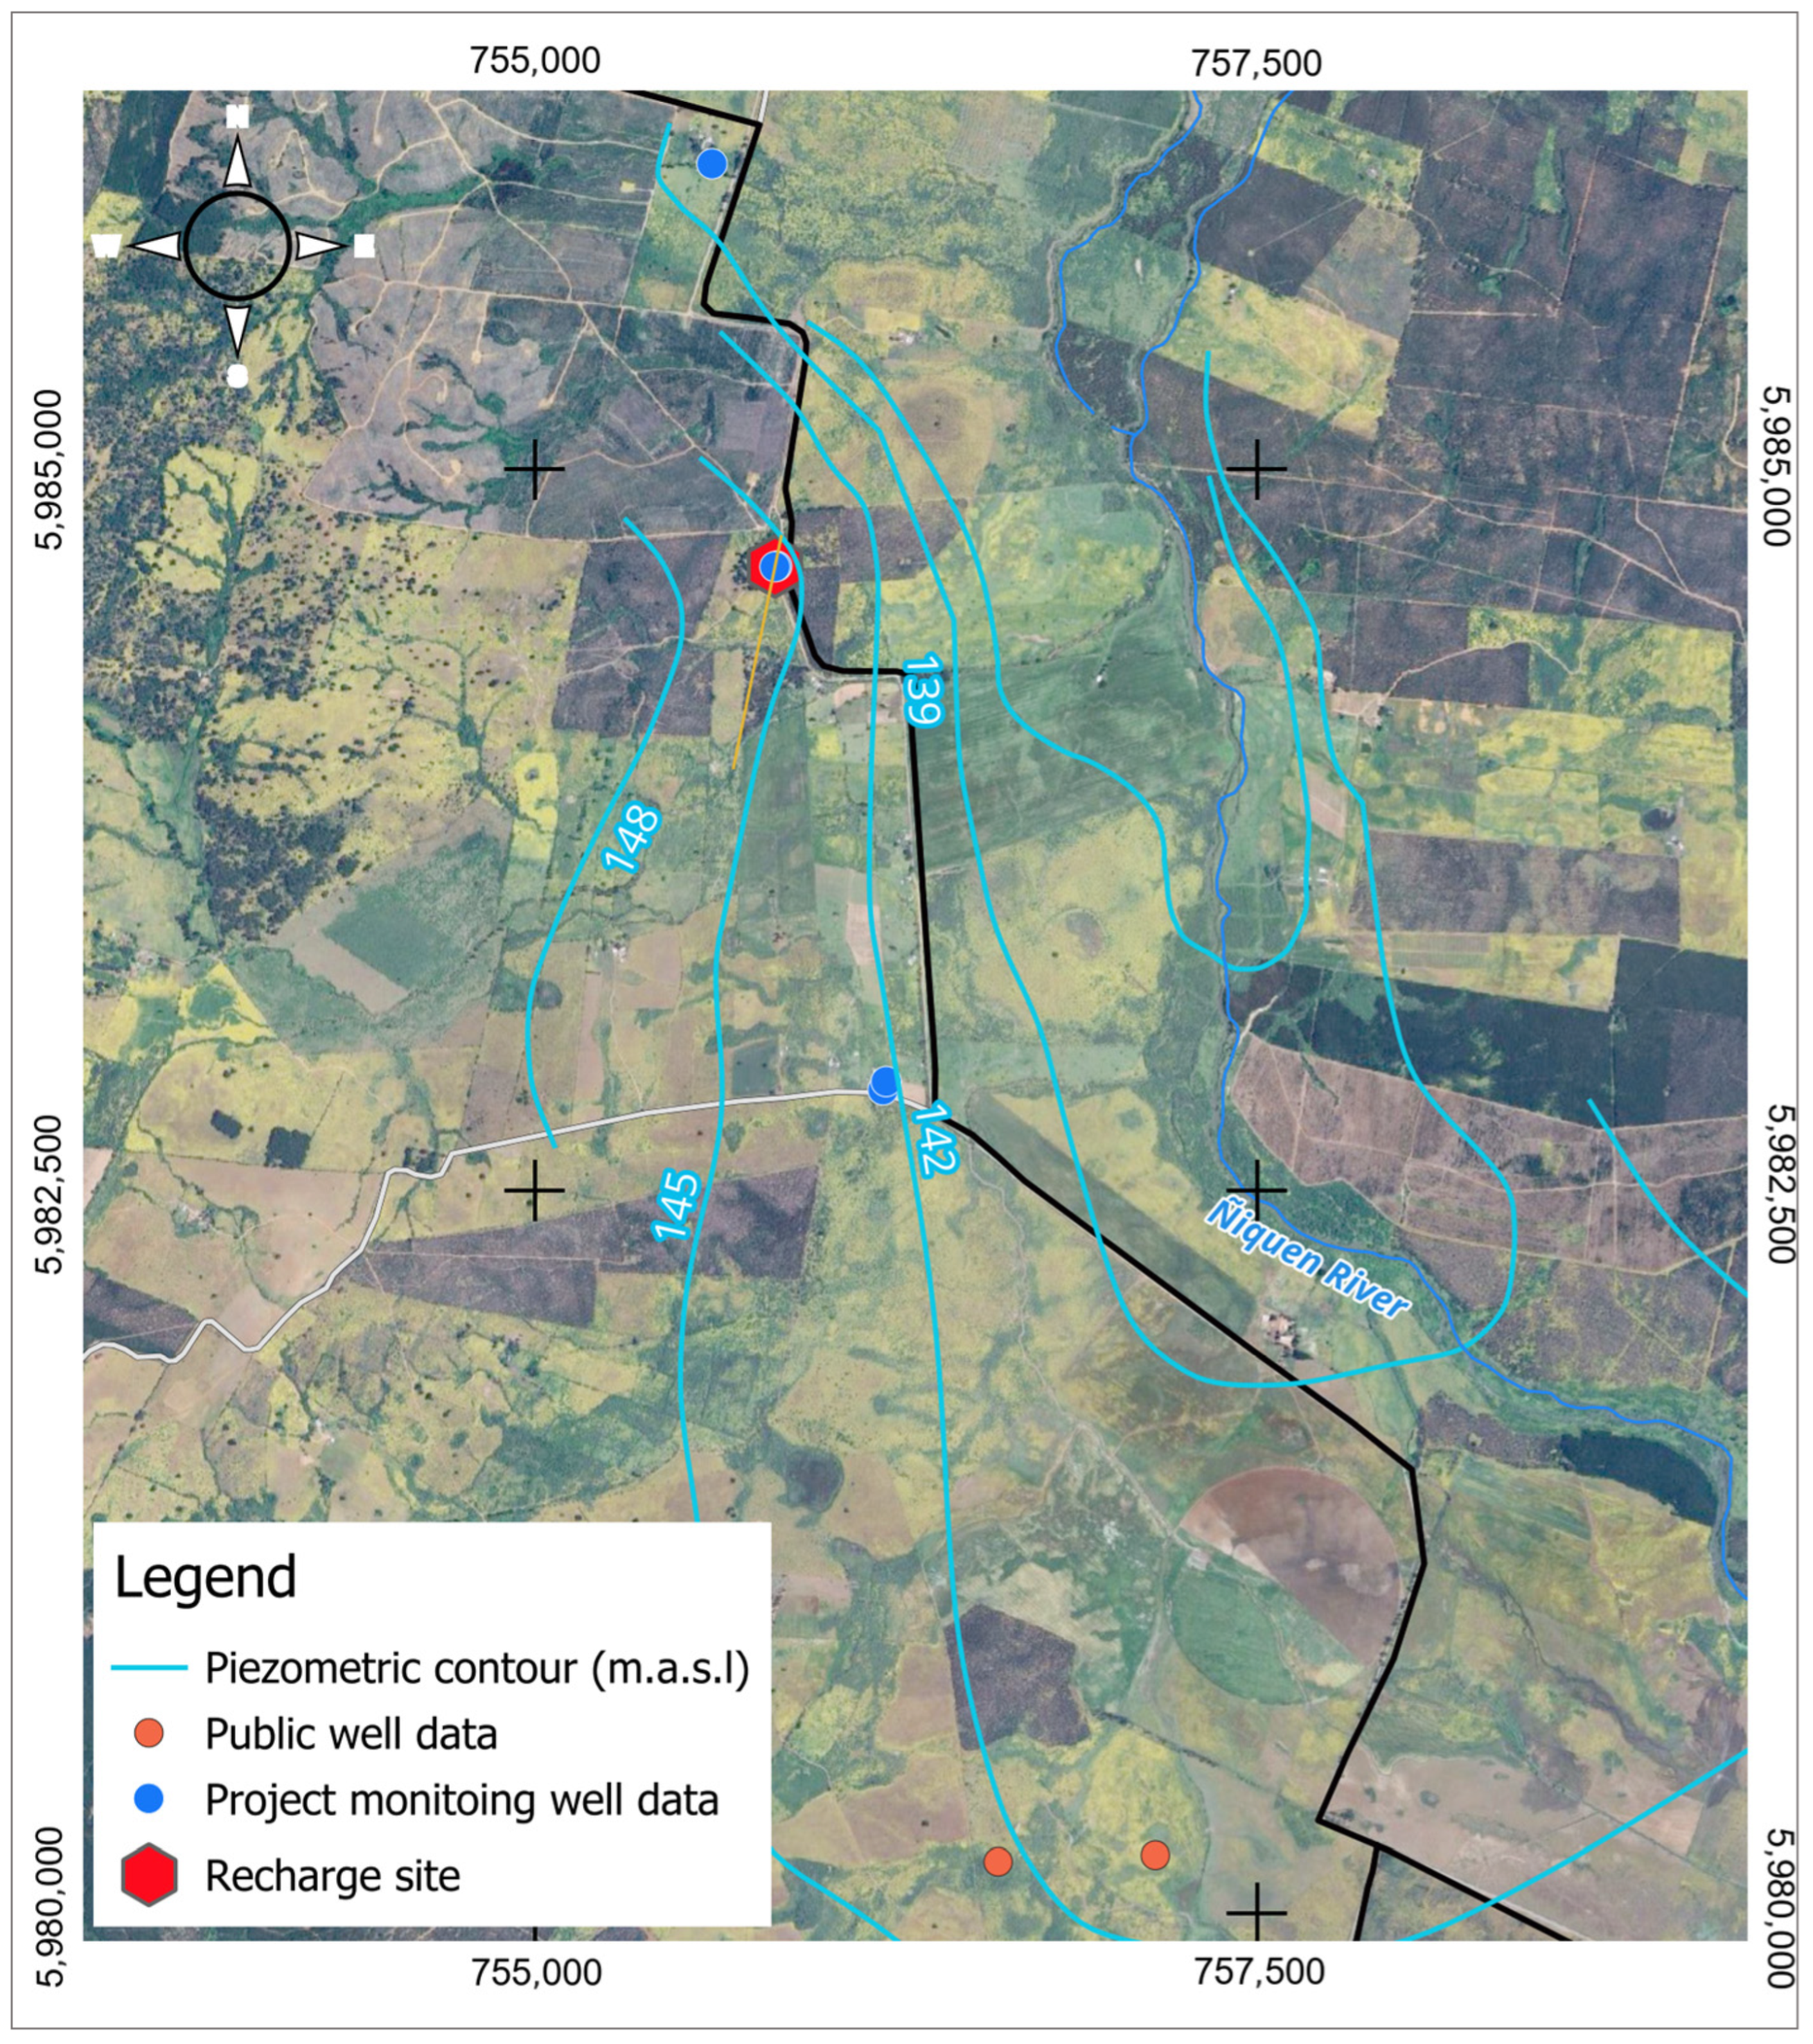
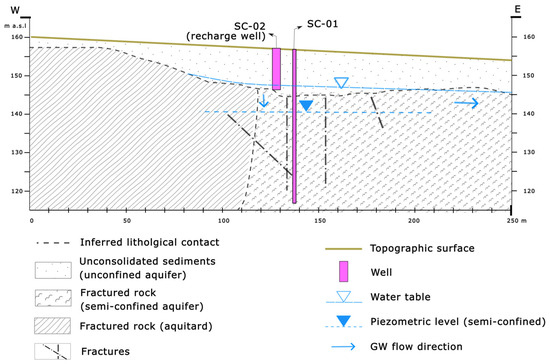
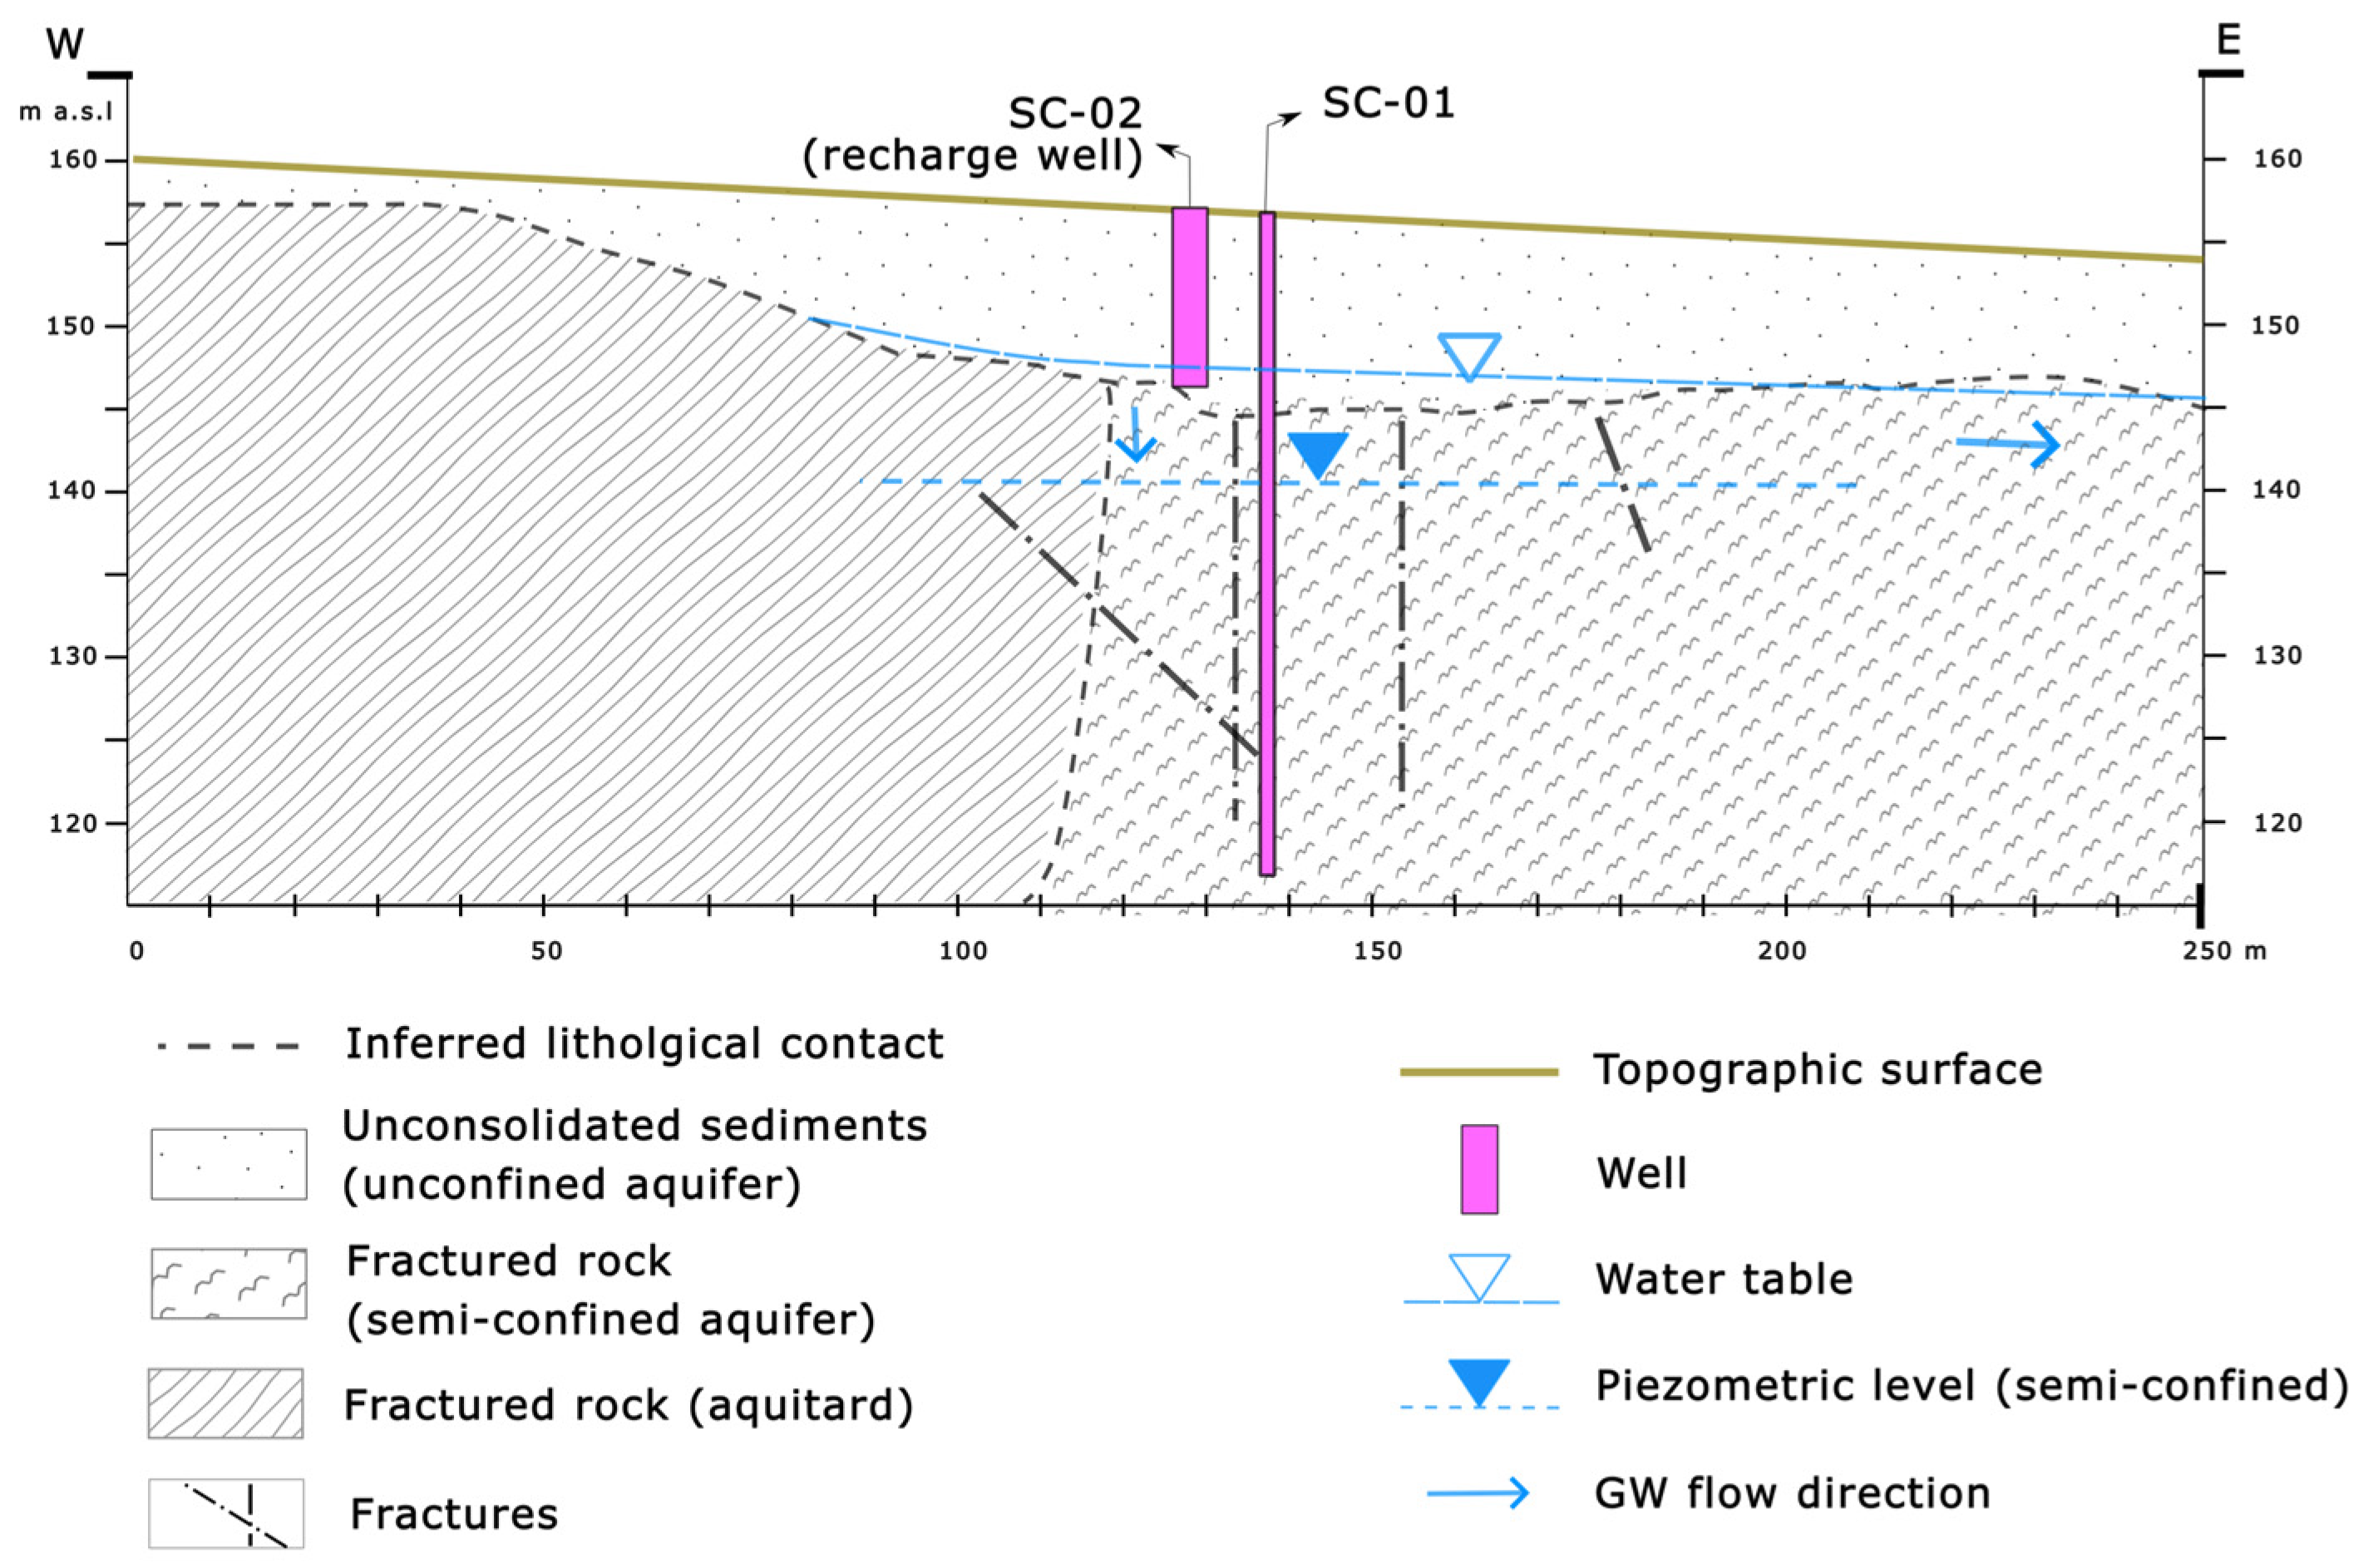
The Ñiquén well is located within the Mininco Formation (PPlm, Figure 3), where semi-consolidated sandy fine conglomerates were observed in the field, outcropping in nearby areas attributable to this same unit. The piezometric surface, constructed from data from 10 wells and the monitoring of three wells and two noria-type wells over one year, indicates convergent groundwater flow towards the northwest (N10° E, Figure 6), consistent with the flow direction and channel orientation of the Perquilauquén River, with a hydraulic gradient of 0.5%. A relatively uniform hydrogeological unit is identified, composed of fluvial and alluvial sediments hosting an unconfined aquifer with water levels between 2.6 and 7.6 m depth (Figure 7). Geophysical investigation using electrical resistivity tomography (Figure 8) enabled characterization of the vertical structure of the aquifer. In ERT1, a transition in resistivity values is observed in the first 12 m, with the upper zone associated with volcanic rocks exhibiting low saturation, transitioning to increasing saturation and lower resistivity at depth. At 22 m depth, low-resistivity anomalies appear as vertical structures associated with the presence of water, consistent with the hydraulic conductivity profile obtained from the seismoelectric test (SE, Figure 8c), which indicates a peak contribution zone between 12 and 18 m depth. The ERT2 line shows a similar distribution, with the first 10 m corresponding to a layer of volcanic rocks in a poorly saturated clay matrix, underlain by saturated strata appearing as semi-vertical structures exhibiting resistivity values between 10 and 63 ohm/m. The low-resistivity anomalies extend to the deepest layer of the section obtained.
Figure 6.
Groundwater flow direction at the Ñiquén site.
Figure 7.
Profile with a conceptual schematic at the project well site in Ñiquén.
Figure 8.
Well tomography at Ñiquén. (a) Location of ERT1 and ERT2 transects; (b) seimoelectric survey results; and (c) 2.5D representation of the tomography.
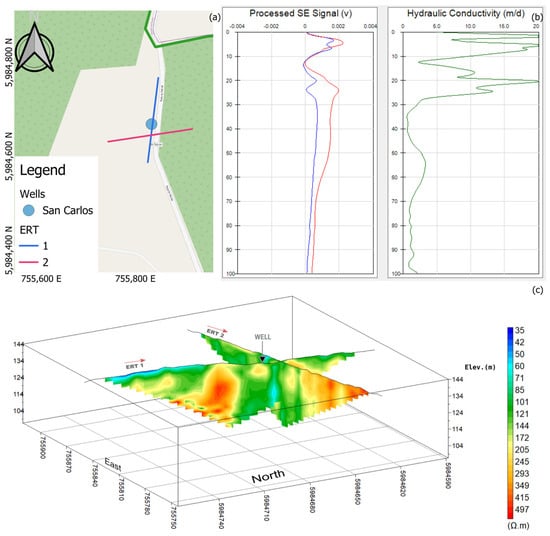
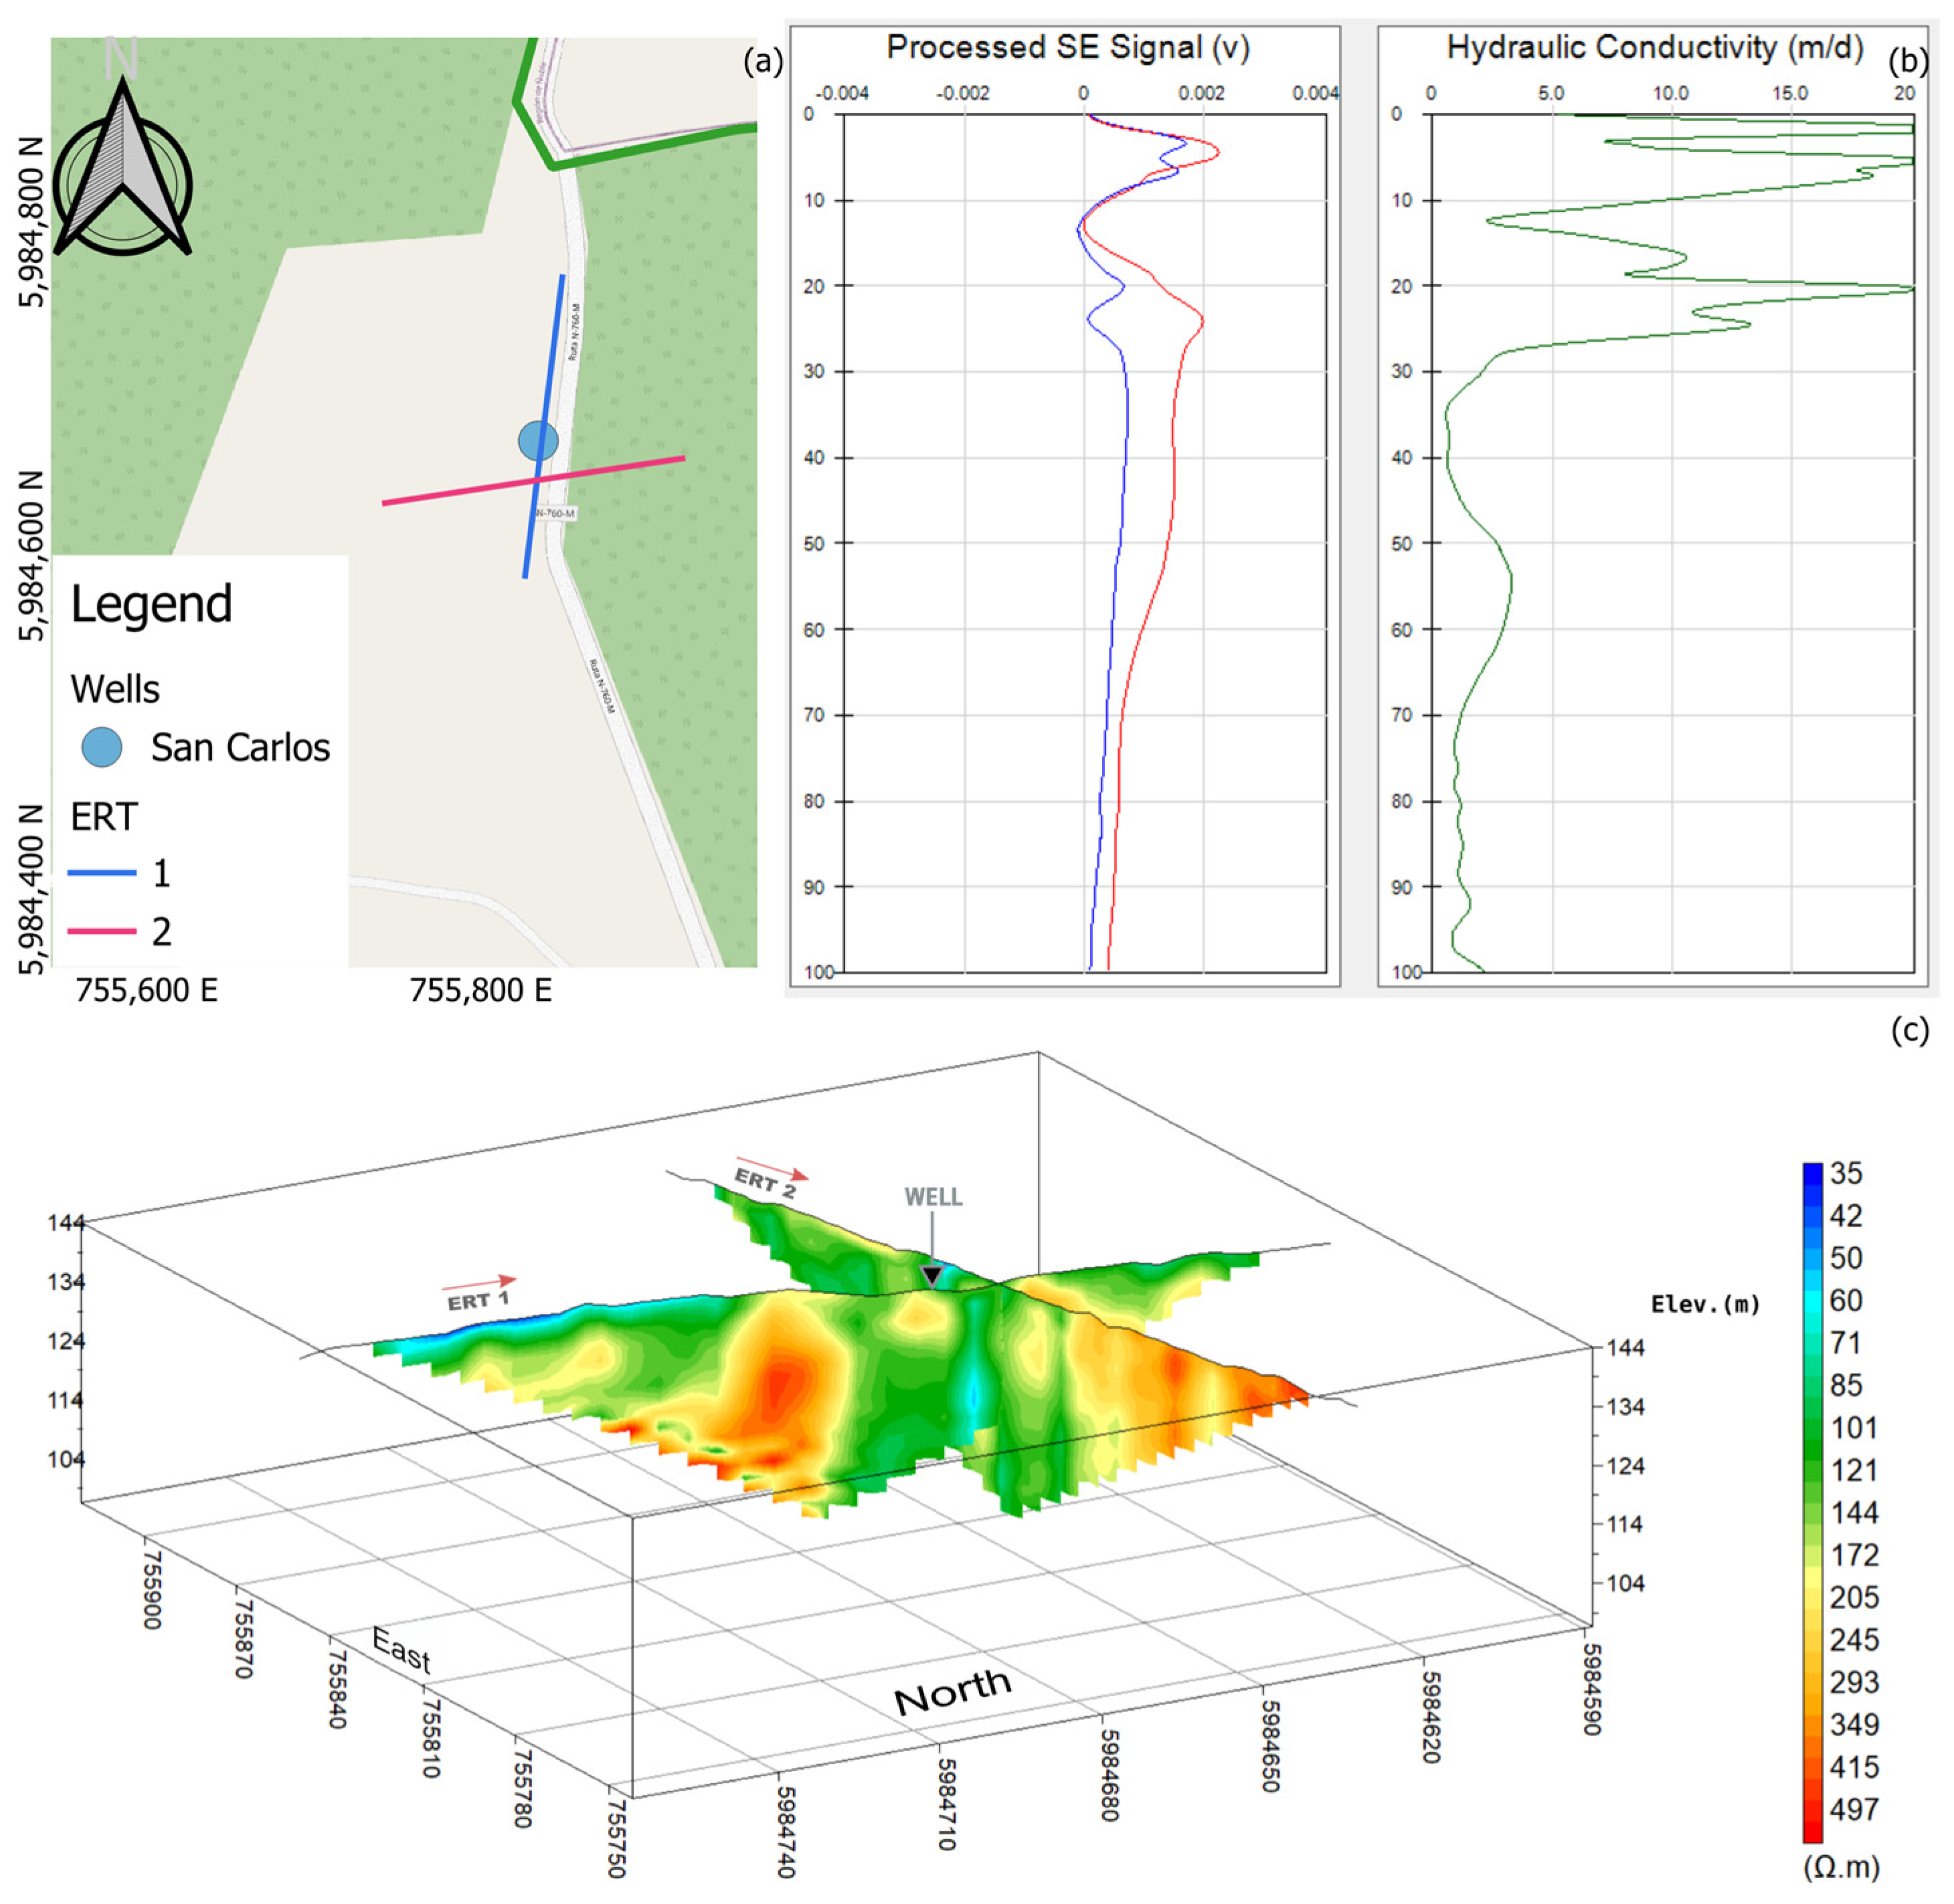
The San Carlos well is located in a contact zone between the Mininco Formation (PPlm), Palaeozoic granitic rocks (CPg, Figure 3), and the Pocillas–Coronel de Maule Strata (Tr1m), with sandstones of the latter unit observed in the field. Using eight water-level measurements and with the monitoring of five points over one year, the piezometric surface was constructed for the sector, indicating groundwater flow consistent with the topographic gradient, directed towards the Ñiquén River (N70° E, Figure 9), with a hydraulic gradient of 0.7%. Two hydrogeological units are identified: a shallow unit composed of colluvial or weathered sediments with partial saturation and seasonal behavior, and a deeper unit associated with sedimentary rocks, with piezometric levels between 9 and 23 m depth (Figure 10). Geophysical investigation using electrical resistivity tomography complemented this characterization. In ERT1, a low-resistivity lens is observed beginning near the surface and extending to approximately 7 m depth, with a longitudinal extent of up to 75 m. A well-defined structural contrast is evident between the first 90 m and the final 90 m of the profile. The latter section shows greater weathering, with semi-vertical structures exhibiting resistivity values between 60 and 100 ohm·m within a more resistive matrix (Figure 11c). ERT2 shows a similar contrast, with a less resistive structural composition in the first 90 m of the line and a more resistive composition towards the end. The images indicate that the most saturated zone is located to the southeast relative to the intersection of the two lines.
Figure 9.
Groundwater flow direction at the San Carlos site.
Figure 10.
Profile of conceptual schematic at San Carlos well site.
Figure 11.
Well tomography at San Carlos. (a) Location of ERT1 and ERT2 transects; (b) seismoelectric survey results; and (c) 2.5D representation of the tomography.
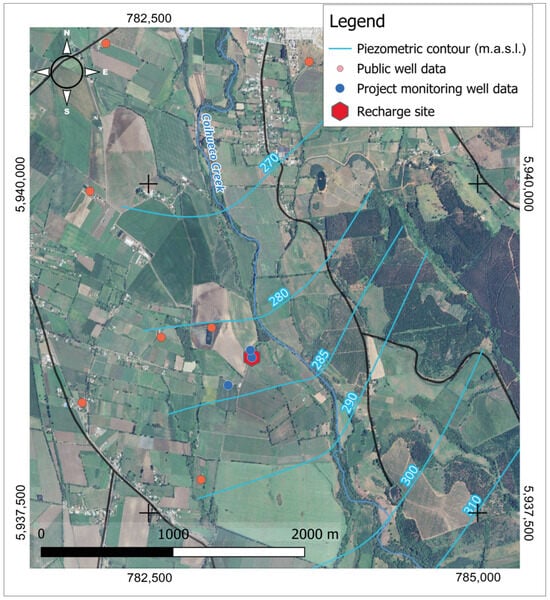
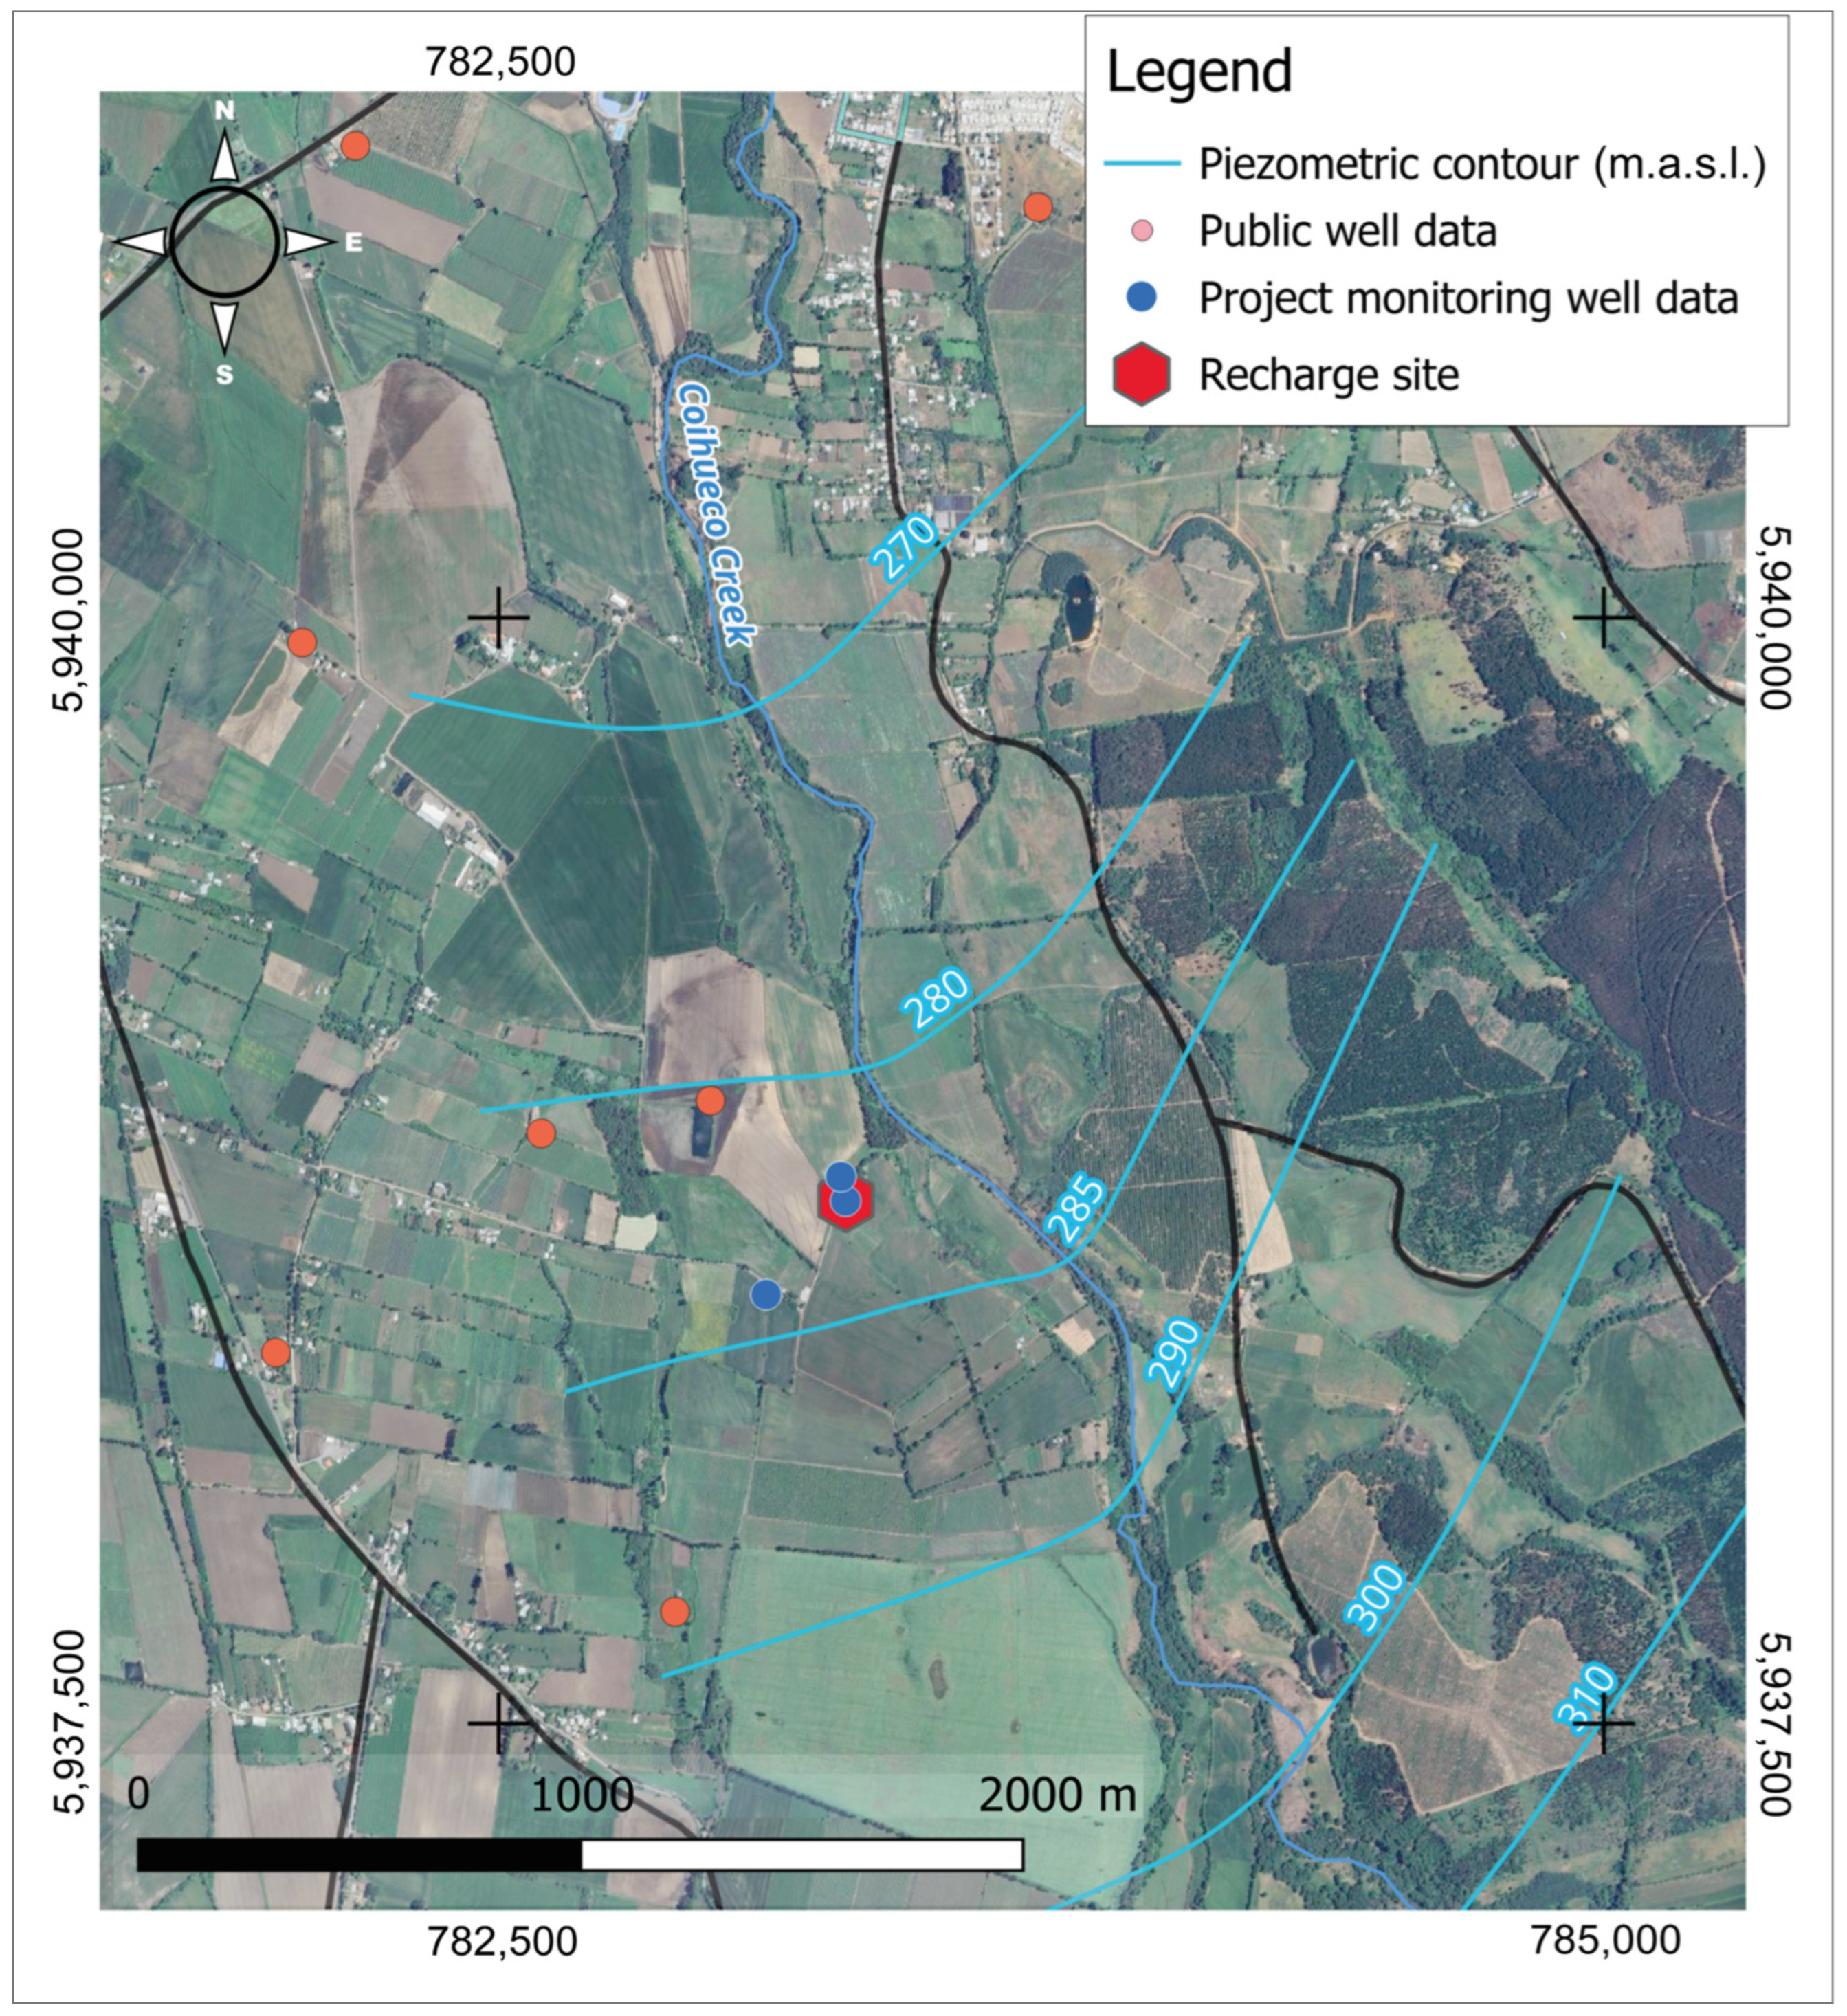
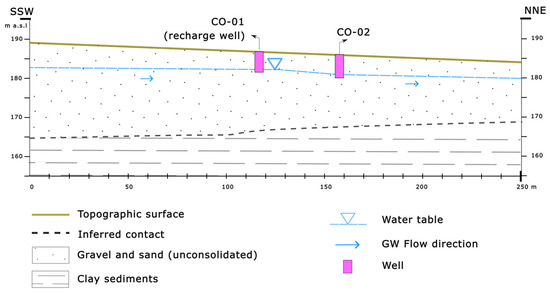
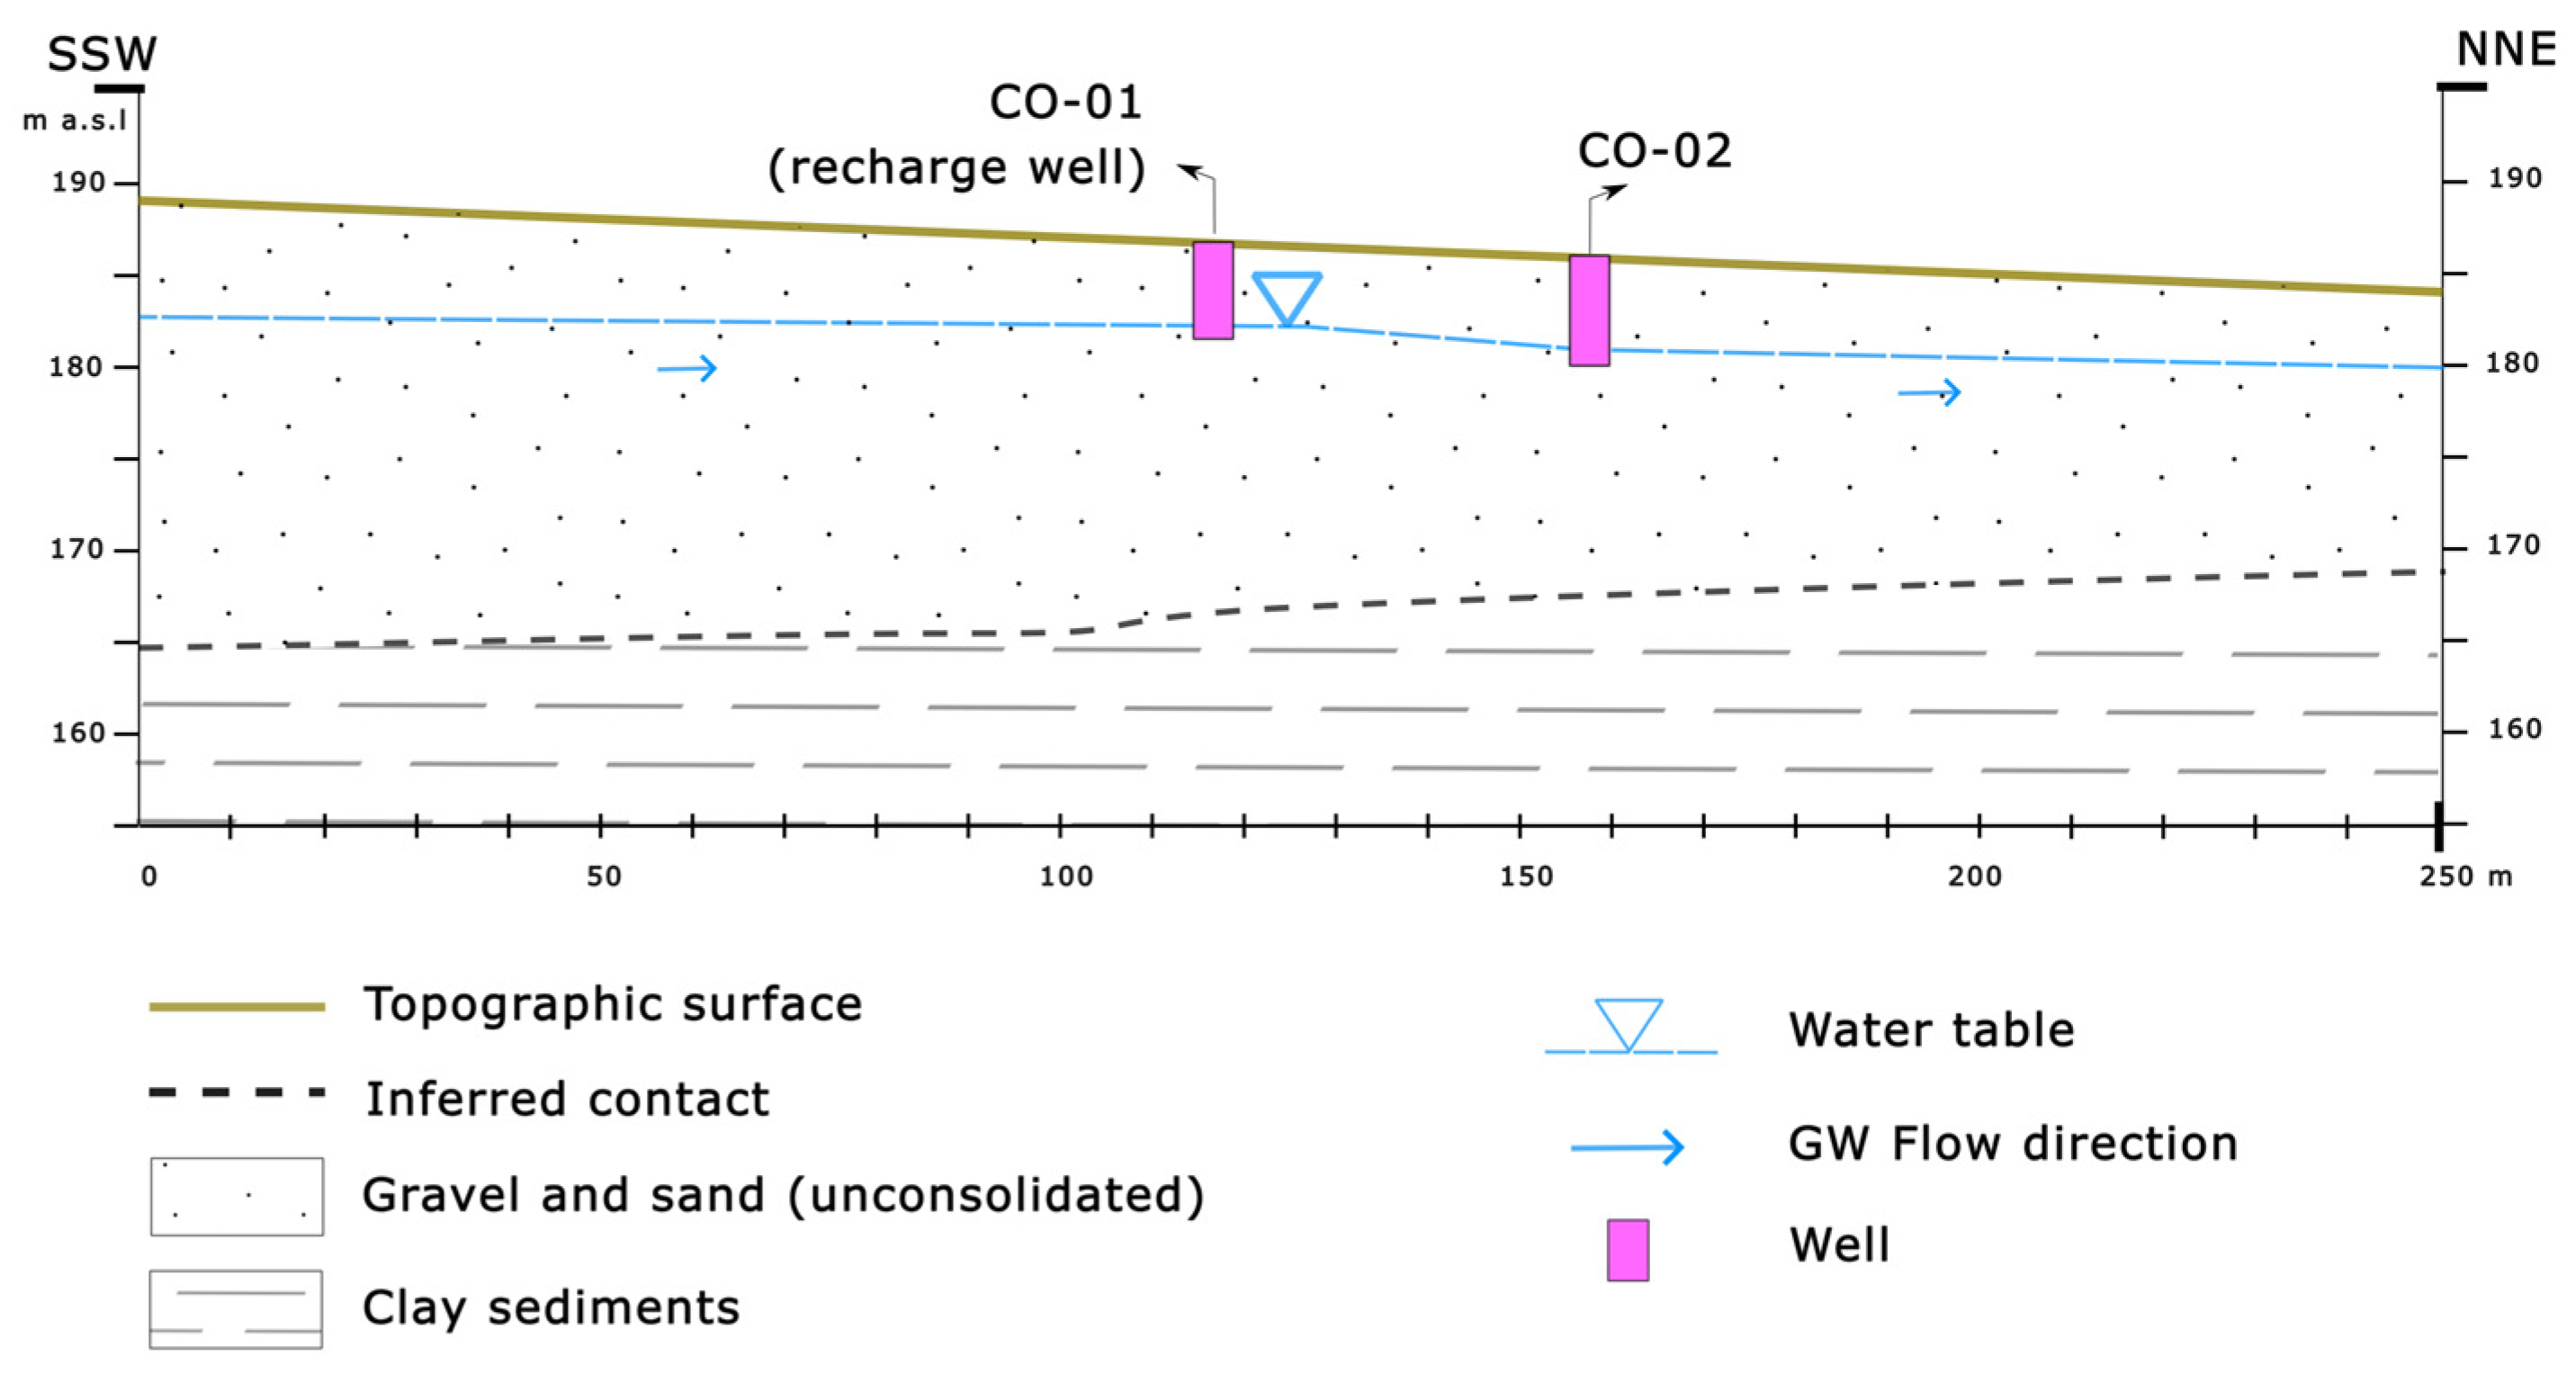
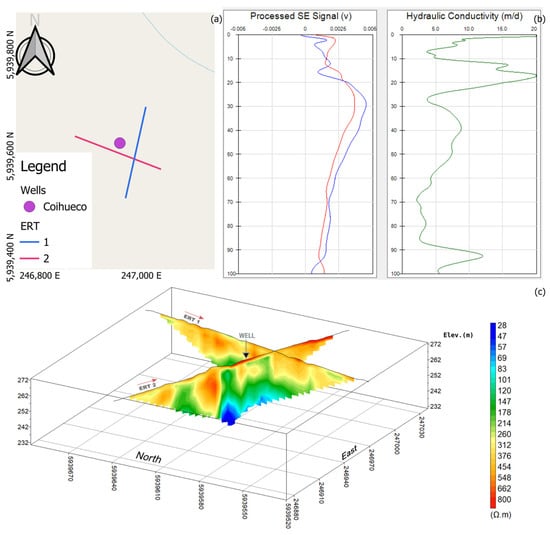
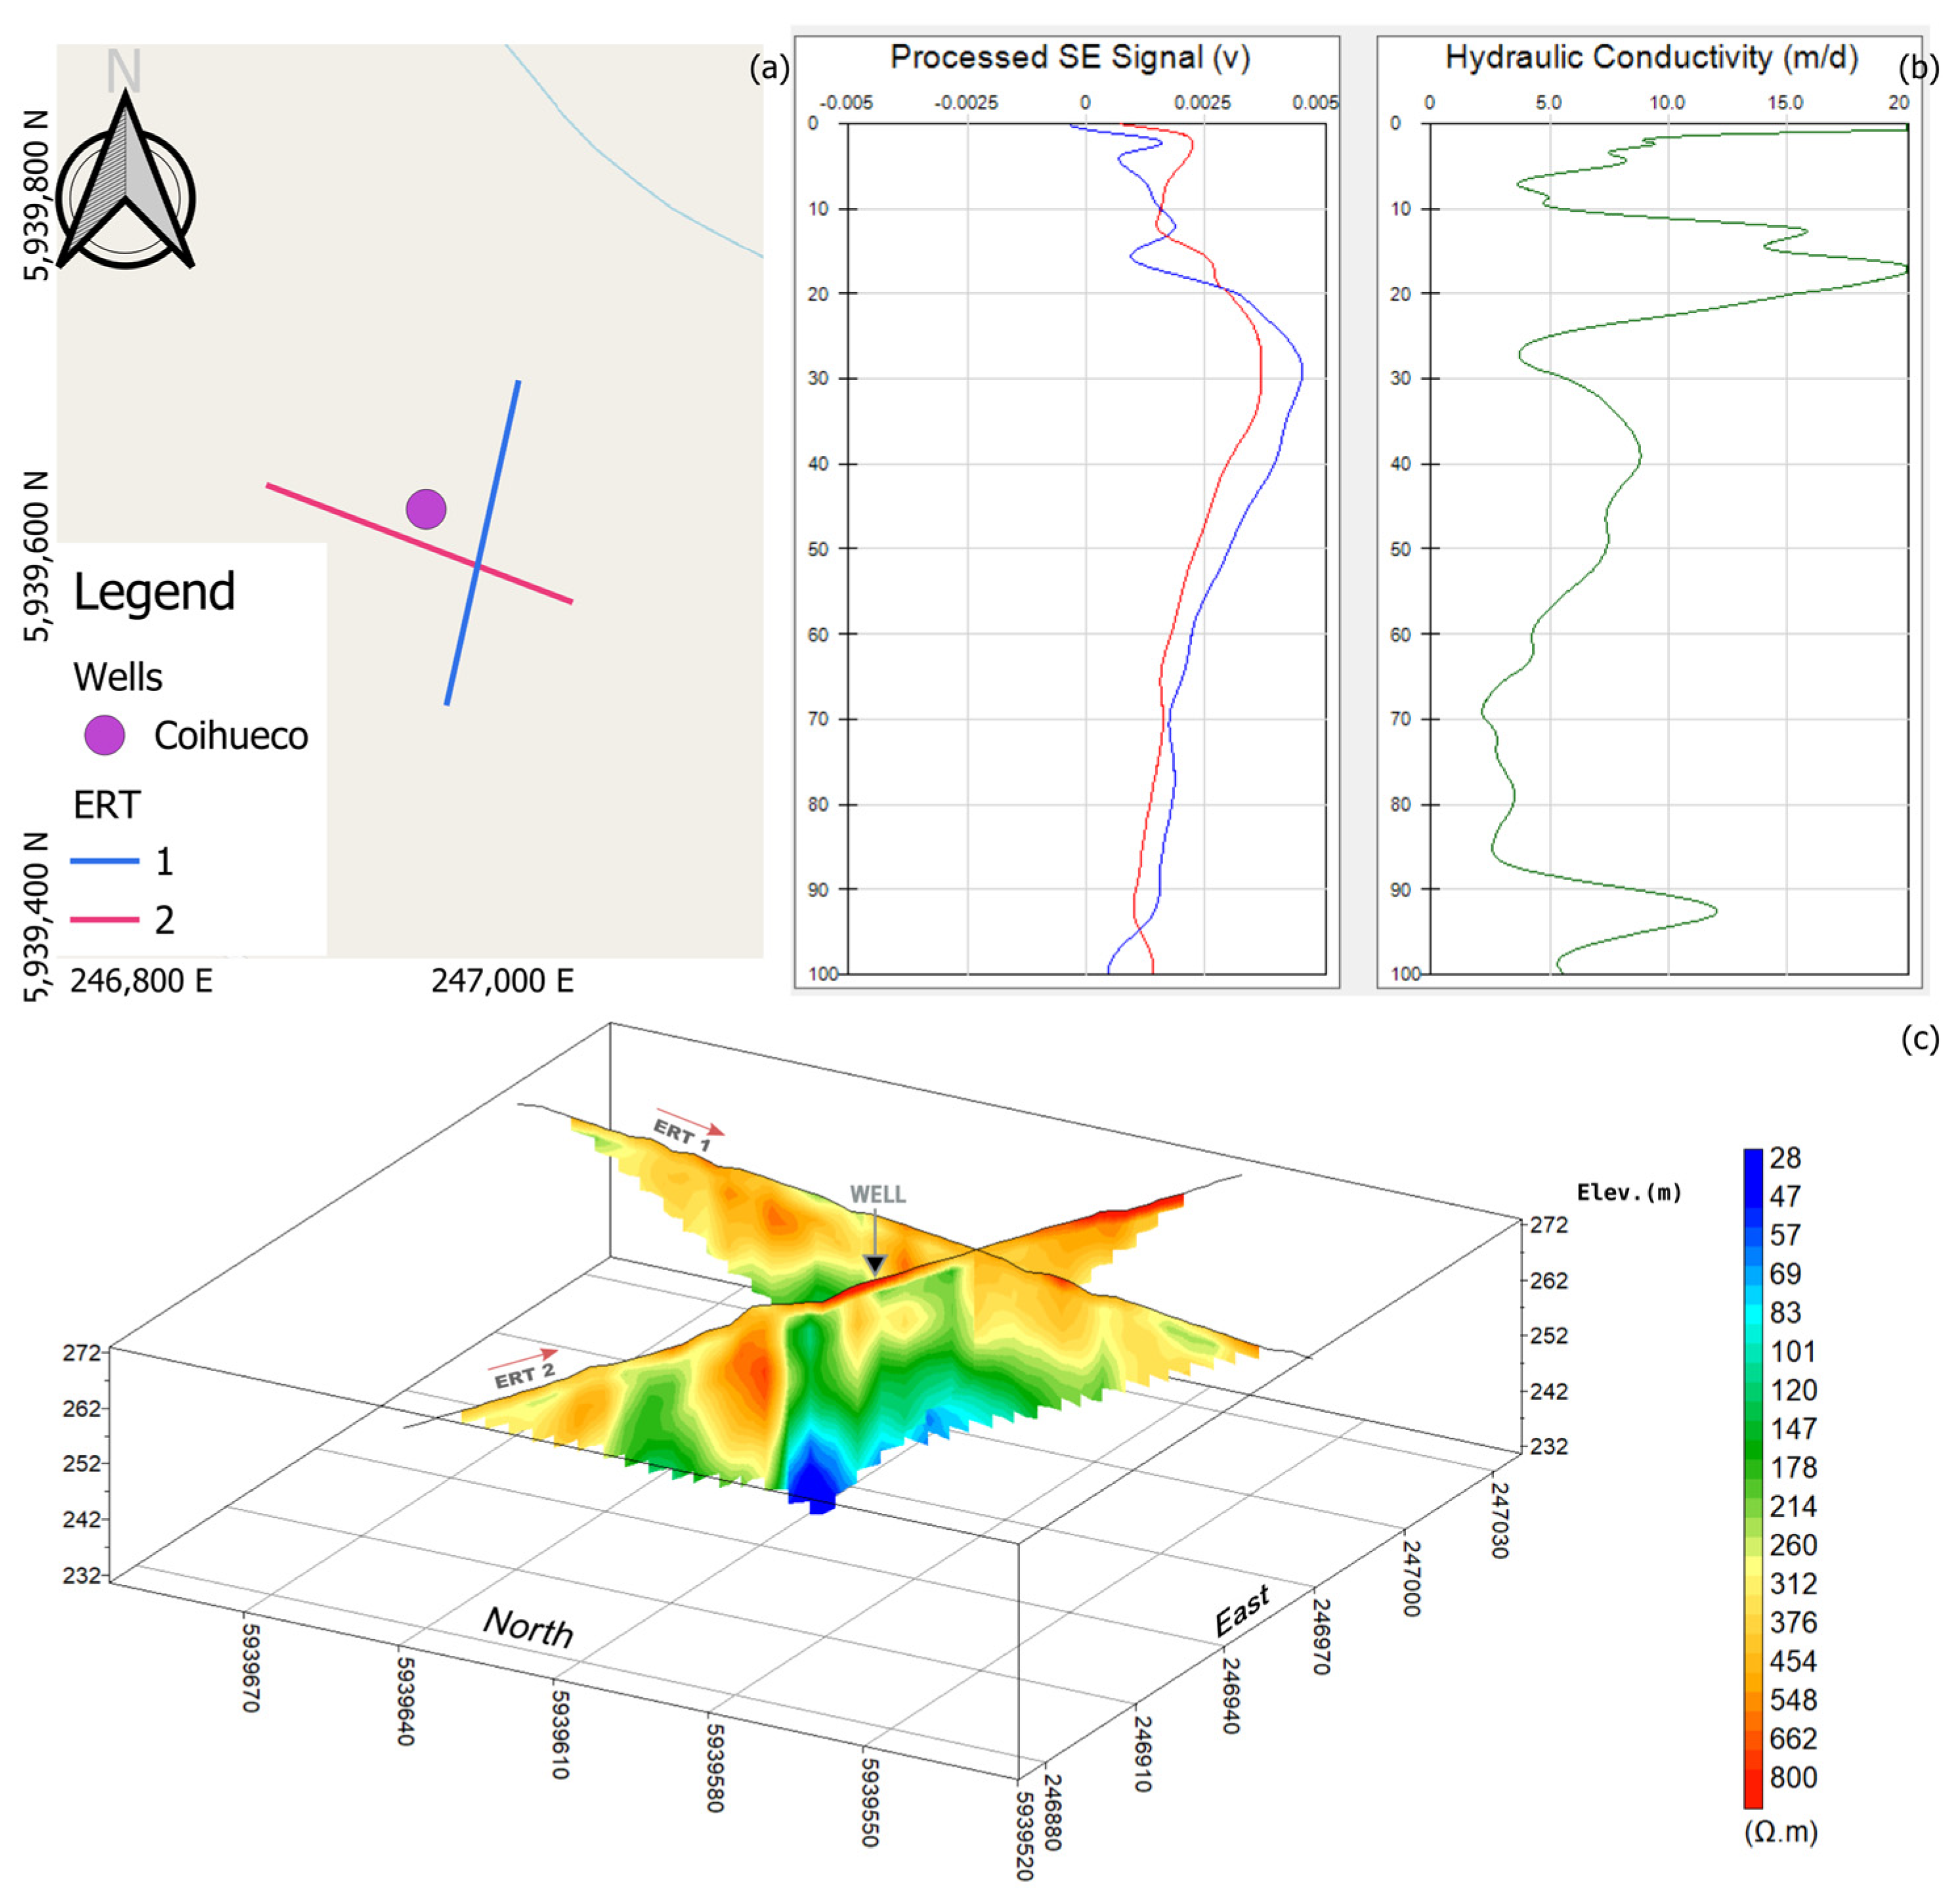
The Coihueco well is located within the La Montaña Formation (PlHlm, Figure 3), characterized by unconsolidated gravels, sands, and coarse material of fluvial and alluvial origin, together with layers of brown and orange clays interbedded with lahar deposits. Using water-level data from nine wells and with the monitoring of three noria-type wells over one year, the piezometric surface was constructed for the sector, indicating groundwater flow in an approximate N15W direction (Figure 12) with a hydraulic gradient of 0.9%. A continuous permeable hydrogeological unit is identified, associated with an unconfined aquifer with water levels between 4.5 and 8 m depth (Figure 13). Geophysical investigation using electrical resistivity tomography enabled characterization of the vertical structure of the aquifer. In this sector, both tomographies show a high-resistivity surface layer extending to 14 m depth. The values observed in this layer are associated with fresh, minimally weathered rock boulders embedded within a sand and gravel matrix. The upper boundary of the groundwater-saturated zone occurs within this layer; however, below 14 m resistivity begins to decrease, indicating weathering or a change in stratal composition. The lowest resistivity values are reached in the deepest layer, at approximately 30 m depth, ranging from 100 to 30 ohm/m, which is interpreted as an increase in clay content. The seismoelectric test exhibits an inflection point at approximately 20 m depth, consistent with the pronounced gradient observed in the tomographic sections. The hydraulic conductivity curve (Figure 14c) also shows a less pronounced signal at approximately 40 m depth interpreted as an additional permeable zone, within the low-resistivity layer identified in the electrical tomographies.
Figure 12.
Groundwater flow direction at the Coihueco site.
Figure 13.
Profile with a conceptual schematic at the project well site in Coihueco.
Figure 14.
Well tomography at Coihueco. (a): Location of ERT1 and ERT2 transects; (b): seismoelectric survey results; and (c): 2.5D representation of the tomography.
3.5.2. Recharge Tests
Water-quality test results confirm that the harvested rainwater exceeds the requirements of Chilean Standard NCh 1333 [55] and is of superior quality to the groundwater present in the target wells. Once this was established, the injection tests could then be subsequently conducted.
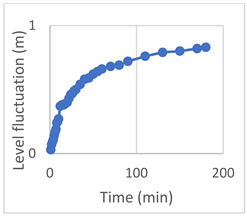
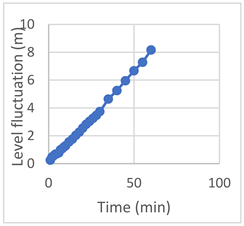
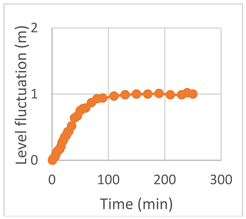
The system performance was evaluated using hydraulic injection tests using the harvested rainwater stored in collection tanks. At all three sites, injection rates ranged between 0.9 and 1.4 L·s−1 (Table 6), and test durations ranged from 1 to 4 h, with the shortest being at San Carlos and longest at Coihueco. In the days following the initial tests, additional injection cycles were conducted at Coihueco and San Carlos, with the same flow rates maintained.
Table 6.
Results of the injection test.
4. Discussion
The results of this study suggest that rainwater harvesting systems constitute a viable alternative for the collection and storage of good-quality water [31,32,38,44]. This is particularly significant given the effects of climate change and the mega-drought affecting central Chile. Moreover, the overexploitation of surface and groundwater resources has reduced water availability, particularly in rural areas. In this context, rainwater harvesting presents considerable potential both for increasing water supply and for contributing to the recovery of aquifer equilibrium.
In this regard, González et al. [29] demonstrate the feasibility of harvesting and storing rainwater for well recharge in the Biobío region. Their results indicate that, with appropriate planning, i.e., sizing harvesting systems based on local precipitation data, it is possible to collect the volumes required for storage. Furthermore, the use of design rainfall with an exceedance probability of 0.1 represents an adaptation measure in response to the sustained decline in precipitation in Chile [34,36,37,56], as it allows the structures to be oversized relative to mean annual precipitation. A key aspect of RWHS design is the selection of the probability distribution function (CDF), since an inappropriate fit to the precipitation data will yield incorrect design rainfall values that could result in undersized structures. Although the Gumbel distribution is commonly used in Chile [29,38,44], it does not account for the non-stationary effects generated by climate change [57]. Consequently, return period estimates will become inappropriate as non-stationarity becomes more pronounced in the time series [58].
In the field of aquifer recharge, Rivera-Vidal et al. [18] identified 15 recharge experiments in Chile, conducted primarily in arid and semi-arid zones, with the greatest concentration in the Atacama, Valparaíso, and Metropolitan regions. Reported recharge rates ranged from 0.01 to 9.5 hm3, with the highest values in the Atacama Region.
In the Ñuble region, a recharge experiment conducted through irrigation canals of the Diguillín River demonstrated high potential, reaching values of up to 1 hm3 per year [18,59]. Isotopic analyses confirmed that the water in nearby wells originated from these canals. The CNR [60] also assessed the recharge potential in the area, noting that during summer months recharge occurs primarily through canal losses and irrigation inefficiencies, whereas in winter it occurs almost entirely from precipitation. In other words, during summer the wells are fed predominantly by water from irrigation canals [60]. Furthermore, Alegría Olivera [59], using modeling approaches, indicates that while a high recharge potential exists in the Diguillín River basin, the contribution from the canals is essentially local in nature, with recharge concentrated in the aquifers in close proximity to them.
During the project, a hydrogeological conceptualization was developed for the study area, comprising the municipalities of San Fabián, Ñiquén, Coihueco, and San Carlos, where the principal hydrogeological unit is an unconfined sedimentary aquifer formed by alluvial, colluvial, and fluvial processes, occupying the floodplains of the main rivers and their surroundings in an east–west oriented fan pattern [45,46,47]. This formation extends beyond the study area boundaries to the west, north, and south and shares groundwater resources with other neighboring municipalities including Chillán, Pinto, Ninhue, Parral, and Cauquenes.
Existing wells are located in the alluvio–fluvio–colluvial aquifer. These are drilled to varying depths and use different construction types and include: deep wells exceeding 30 m, trench wells of 7 to 10 m with areas between 20 and 30 m2, and noria-type wells of 5 to 10 m, all exploiting the same hydrogeological unit, which implies dependence on local and regional water table levels and their interdependencies with pumping rates, recharge, river–aquifer interactions, and springs [61,62].
A characterization of the sedimentary aquifer determined that it consists of unconsolidated sand and gravel deposits, unconfined in nature, formed during the Quaternary period, differing depths varying between 5 and 120 m and an average of 55 m, with shallower depths to the west and towards San Fabián (5–30 m) and increasing depths towards the center (30–80 m), reaching up to 120 m in specific sectors [63].
Transmissivity ranges from 150 to 450 m2·day−1, with higher values in the central zone, while the average groundwater depth reaches 7 m. Of note, a cone of depression is present at San Carlos, with depths 20 m greater than average, which may be reversing the natural flow towards high-interference pumping centers near the Ñuble River [64]. Hydrographs from DGA monitoring wells showed declining trends of approximately 5 m since 2015 [65].
According to the Public Water Registry [66], the area contains 581 groundwater abstraction points with a total allocated flow of 18,886 L·s−1, distributed primarily between irrigation (11,893 L·s−1) and domestic consumption (1343 L·s−1), with a conservative estimated average pumping rate of 1889 L·s−1 annually. Natural recharge ranges between 54 and 871 L·s−1 on average for the period 2000–2020, being higher in the high-transmissivity zone (326–871 L·s−1) and relatively lower elsewhere (54–109 L·s−1), with an estimated average recharge rate of 1578 L·s−1 annually [67,68].
Based on the above, there is an aquifer imbalance of −311 L·s−1, indicating an unsustainable state of the groundwater resource that strongly justifies the well recharge project using harvested rainwater.
As a study criterion, an area of interest with low transmissivity was defined to promote local recharge, with 5 to 10 m of available storage space and a shallow aquifer depth, based on the water table levels analyzed from existing monitoring wells [65].
While the present study demonstrates the technical feasibility of combining rainwater harvesting with direct well recharge, successful implementation of this approach requires careful consideration of groundwater-quality protection. Managed aquifer recharge projects should not be evaluated solely on the basis of recharge rates or increases in groundwater storage. The quality of the recharge water, along with the vulnerability of the receiving aquifer, and also the potential for transport of contaminants must also be considered in any deployment. Although harvested rainwater generally presents a lower contamination risk than many alternative recharge sources, contaminants derived from atmospheric deposition, roof materials, storage systems, or accumulated sediments may affect groundwater-quality if adequate pretreatment measures are not implemented in the process. Therefore, it is crucial that recharge projects include water quality characterization, compliance with applicable drinking water and environmental standards, and long-term monitoring programs. In some scenarios, it may be necessary to add additional treatment processes before recharge, which would increase both operational complexity and project costs. As a result, the feasibility of direct recharge systems should be assessed through a thorough integrated evaluation of both hydraulic performance and water quality protection.
As with any hydrogeological research project, the results have an associated level of uncertainty which originate from several sources. One quantitative source of uncertainty is associated with the estimation of design rainfall through frequency analysis and spatial interpolation of precipitation records. That said, in this project the process used datasets with a long temporal time series of annual rainfall records and goodness-of-fit evaluations. Further uncertainty arises from the limited monitoring period, which may not fully capture interannual climatic variability or long-term aquifer responses. Qualitatively, groundwater systems are inherently heterogeneous, and local variations in lithology, hydraulic conductivity, preferential flow paths, and aquifer connectivity are likely to influence recharge efficiency and storage outcomes. Future climatic scenarios would also introduce further uncertainty, and would include changes to projected rainfall magnitude, seasonality, and intensity in central Chile. Therefore, the recharge rates and operational performance reported in this study should be interpreted as site-specific pilot-scale results rather than universally applicable in any context or timeframe. The findings specifically demonstrate the technical feasibility of rainwater harvesting and direct well recharge, long-term monitoring and implementation at additional sites and how they would help reduce uncertainty and improve confidence in regional-scale applications.
While the results of this pilot study are positive and provide an actionable workflow for implementation, it should be noted that the system requires extended injection periods and future ongoing monitoring so as to be more robustly able to quantify the effects of managed aquifer recharge on groundwater recovery. These prolonged observation periods would enable evaluation of the system response under diverse varying climatic conditions and provide validation of the long-term viability of the proposed recharge strategy.
Finally, an important consideration when interpreting the results is the scale of implementation. The systems evaluated in this study were designed as pilot-scale installations intended to support individual rural homes or small agricultural users through local rainwater harvesting and direct recharge of existing hand-dug wells. The positive recharge rates and operational performance observed under these conditions demonstrate the technical feasibility of the approach implemented at a small scale. However, these results should not be directly extrapolated to larger-scale applications. As system size increases, additional factors affect the performance, such as cumulative recharge volumes, aquifer response, operational complexity, maintenance requirements, infrastructure costs, and water-quality management, which may significantly influence project performance and feasibility. Therefore, larger-scale implementations would require additional hydrogeological, economic, and operational assessments before their viability can be determined.
4.1. Uncertainty and Climate Change Considerations
Despite the promising results obtained, several sources of uncertainty should be considered when interpreting the findings and extrapolating them to other locations. Quantitatively, uncertainty is associated with the estimation of design rainfall through frequency analysis and spatial interpolation of precipitation records, despite the use of long-term datasets and goodness-of-fit evaluations. Additional uncertainty arises from the limited monitoring period, which may not fully capture interannual climatic variability or long-term aquifer responses. Qualitatively, groundwater systems are inherently heterogeneous, and local variations in lithology, hydraulic conductivity, preferential flow paths, and aquifer connectivity may influence recharge efficiency and storage outcomes.
An additional source of uncertainty is associated with future climate conditions. Although most climate projections for central Chile suggest continued warming, increased water stress, and changes in precipitation regimes, the magnitude, timing, and local expression of these changes remain uncertain. Consequently, future recharge opportunities and system performance may differ from those observed during the study period. For this reason, rainwater harvesting and managed aquifer recharge systems should be viewed as adaptive strategies capable of increasing water security under a range of possible climate scenarios rather than as solutions based on a single projected future condition.
These uncertainties do not alter the overall conclusion that rainwater harvesting combined with direct recharge is technically feasible in the study area. However, they highlight the importance of long-term monitoring, site-specific assessments, and adaptive management approaches when implementing similar systems at larger scales.
Beyond its technical implications, the proposed approach is consistent with several objectives of the United Nations 2030 Agenda for Sustainable Development. Indeed, the combination of rainwater harvesting and managed aquifer recharge contributes to SDG 6 (Clean Water and Sanitation) by promoting sustainable management of water resources and improving water availability for rural communities. The approach is also aligned with SDG 13 (Climate Action), as it represents an adaptation measure that can increase resilience to droughts and changing precipitation patterns associated with climate change. These linkages highlight the broader societal relevance of nature-based and decentralized water-management solutions in regions experiencing increasing water stress.
4.2. Limitations and Recommendations for Future Research
An important limitation of the present study is that the long-term hydraulic performance of the recharge systems was not evaluated. Step-rate injection tests and detailed head-versus-flow analyses were beyond the scope of this pilot-scale investigation and, therefore, changes in injectivity over time could not be quantified. Although no operational problems were observed during the recharge tests conducted in this study, managed aquifer recharge systems may experience reductions in infiltration capacity due to physical, chemical, or biological clogging processes. Future studies should include long-term monitoring programs incorporating repeated injection tests, continuous water-level measurements, and assessments of clogging development to better understand the sustainability of recharge performance under prolonged operation. Such information would be valuable for optimizing system design, maintenance requirements, and operational protocols for larger-scale implementations.
The results obtained in this pilot study should also be interpreted in the context of seasonal hydrological variability. Studies conducted in the southern Caspian Sea have shown that water-column structure, stratification, thermocline development, and mixed-layer depth can vary substantially between seasons in response to changes in atmospheric forcing and thermal conditions [69,70]. Although these studies were carried out in marine environments, they illustrate the broader principle that hydrological systems are highly dynamic through time and that observations collected during a limited monitoring period may not capture the full range of seasonal variability. Consequently, long-term monitoring of recharge performance, groundwater levels, and water quality under different climatic conditions would help further evaluate the robustness and scalability of rainwater harvesting and direct well recharge systems in central Chile.
Importantly, while the results demonstrate the technical feasibility of collecting rainwater and injecting it into existing rural wells, they should not be interpreted as evidence of measurable aquifer recovery at the regional scale. The primary objective of this study was to evaluate the operational viability of a pilot-scale recharge system under real field conditions. The recharge volumes tested, the relatively short operational period, and the absence of long-term post-injection monitoring limit the ability to quantify groundwater storage gains or sustained changes in piezometric levels. Furthermore, the scale of the pilot systems is substantially smaller than the regional groundwater deficit affecting central Chile. Consequently, the findings should be viewed as proof of concept rather than direct evidence of aquifer restoration. Future studies should evaluate larger-scale implementations, conduct medium- and long-term monitoring of groundwater-level responses, and assess cumulative recharge effects across multiple systems to determine the extent to which this approach can contribute to aquifer recovery and regional water security.
Although the present study focused on technical feasibility rather than economic evaluation, the cost of materials for each pilot system was approximately CLP 5 million (around USD 5000), with the total cost varying based on site characteristics and contract type. A detailed breakdown of capital and operational expenditures was not available because the systems were constructed through a single procurement contract. Previous studies of rainwater harvesting systems in Chile have reported expected service lives of approximately 20 years for geomembrane-based catchment structures when routine maintenance is performed [30]. Maintenance requirements are expected to be relatively low and consist primarily of periodic cleaning of the catchment surface, removal of accumulated sediments, inspection of hydraulic components, and maintenance or replacement of filtration elements when necessary. Future research should evaluate the long-term operational costs, maintenance requirements, and economic performance of these systems to support larger-scale implementation and decision-making processes.
Chile currently lacks a specific regulatory framework governing Managed Aquifer Recharge (MAR) projects [71]. Nevertheless, the General Water Directorate (DGA) generally requires that injected water exhibit a quality equal to or better than that of the receiving groundwater. This principle was adopted in the design and evaluation of the present pilot systems. Water-quality analyses were conducted on both harvested rainwater and groundwater samples prior to injection to verify compatibility. Furthermore, sedimentation and filtration components were incorporated into the recharge systems to minimize the introduction of suspended solids into the wells. Although no dedicated disinfection system was included because the harvested rainwater met the established water-quality criteria for the pilot tests, future large-scale implementations intended for potable-water applications should incorporate comprehensive microbiological monitoring and, where necessary, additional treatment measures to address pathogen risks and comply with future regulatory requirements.
The hydrological design of the harvesting systems was based on conventional frequency analysis of historical precipitation records and therefore assumes stationarity in rainfall behavior. Although this approach is consistent with the methodology proposed by Unesco [44], future climatic conditions may differ from those represented in the historical record, particularly in central Chile where prolonged drought conditions and changes in precipitation patterns have been documented. To partially account for water-scarce conditions, the systems were designed using a precipitation value associated with a non-exceedance probability of 0.1, representing a relatively conservative design criterion. Likewise, runoff coefficients were selected from values reported in the literature for geomembrane-based catchment systems and were not subjected to formal sensitivity analysis. Future studies should evaluate the effects of non-stationary precipitation trends, alternative climate scenarios, and uncertainty in runoff coefficients on system performance and design requirements.
An additional limitation of the present study is that geophysical surveys were conducted only for site characterization and were not repeated during recharge operations. Time-lapse Electrical Resistivity Tomography (ERT) has the potential to provide valuable information on recharge pathways, the spatial distribution of infiltrated water, and temporal variations in aquifer saturation during and after injection events. Such information would improve understanding of recharge processes and help validate conceptual hydrogeological models. Although budgetary constraints prevented implementation of time-lapse monitoring within the present pilot study, this approach is being considered for future phases of the project and could provide important insights into the effectiveness and behavior of managed aquifer recharge systems under field conditions.
Although the implemented systems demonstrated satisfactory operational performance, the present study did not include continuous monitoring of rainfall capture, storage dynamics, conveyance losses, or recharge volumes at the event scale. Consequently, a complete seasonal water balance could not be established. Based on the precipitation recorded during 2025 and the design capacity of the systems, the storage reservoirs were estimated to have reached full capacity approximately twice during the year, providing an additional water source during the dry season and supporting small-scale agricultural activities. Nevertheless, quantification of capture efficiency, storage turnover, and recharge effectiveness requires dedicated monitoring programs capable of tracking water volumes throughout individual rainfall events and across multiple years. Such information would improve assessments of system reliability and support future optimization of rainwater harvesting and managed aquifer recharge designs.
A limitation of the present study is the absence of groundwater-level monitoring during and immediately after recharge operations. Consequently, although the injection systems demonstrated satisfactory operational performance, it was not possible to quantify groundwater mounding, determine the spatial extent of recharge, or evaluate short-term changes in aquifer storage associated with individual injection events. Future studies should incorporate dedicated observation wells and continuous groundwater-level monitoring before, during, and after recharge events to quantify aquifer responses and improve understanding of recharge dynamics under field conditions.
5. Conclusions
This study evaluated the feasibility of combining rainwater harvesting systems with direct recharge into existing rural wells as a strategy to improve water availability in the Ñuble region of central Chile. The hydrogeological characterization identified suitable aquifer conditions at the selected sites, while the hydrological design enabled the construction of rainwater harvesting systems adapted to local precipitation regimes and operational constraints. The implemented systems successfully collected, stored, and injected harvested rainwater into existing wells, achieving injection rates ranging from 0.9 to 1.4 L·s−1 and demonstrating that the physicochemical quality of the harvested water was compatible with groundwater recharge.
The results confirm the technical and operational feasibility of this approach at pilot scale and demonstrate its potential as a locally applicable water-management alternative for rural communities affected by water scarcity. However, the recharge volumes evaluated, the duration of the operational trials, and the absence of long-term post-injection monitoring do not allow a quantitative assessment of groundwater storage recovery or sustained changes in aquifer conditions. Consequently, the findings should be interpreted as proof of concept rather than as evidence of measurable aquifer recovery at the regional scale.
Future research should focus on larger-scale implementations, longer monitoring periods, and the evaluation of groundwater-level responses under repeated recharge cycles. Such studies would allow assessment of the cumulative effects of recharge, the long-term performance of the systems, and their potential contribution to groundwater management and rural water security under increasingly variable climatic conditions.
Finally, the proposed approach is also consistent with the objectives of the United Nations 2030 Agenda, specifically SDG 6 (Clean Water and Sanitation) and SDG 13 (Climate Action), by promoting sustainable water management and strengthening climate-change adaptation in rural communities.
Author Contributions
Conceptualization, R.P. and C.S.; methodology, R.P., C.S., D.P. and A.I.; software, B.I.; validation, P.A.G.-C., C.F. and D.P.; formal analysis, A.I. and C.U.; investigation, R.P.; resources, R.P.; data curation, B.I. and A.I.; writing—original draft preparation, R.P. and A.I.; writing—review and editing, B.I. and P.A.G.-C.; visualization, A.I. and C.U.; supervision, R.P.; project administration, C.S.; funding acquisition, R.P. All authors have read and agreed to the published version of the manuscript.
Funding
This research was funded by FIC-R Ñuble, BIP: 40050637-0 and the APC by the Center ANID BASAL FB210015 (CENAMAD).
Institutional Review Board Statement
Not applicable.
Informed Consent Statement
Not applicable.
Data Availability Statement
The raw data supporting the conclusions of this article will be made available by the authors upon request.
Acknowledgments
The authors gratefully acknowledge the support provided by the Center ANID BASAL FB210015 (CENAMAD). The authors acknowledge the use of ChatGPT 5.4 for assistance with language editing and stylistic improvements to the manuscript. The authors reviewed and edited the final text to ensure accuracy.
Conflicts of Interest
The authors declare no conflicts of interest.
References
- Jain, S.; Srivastava, A.; Khadke, L.; Chatterjee, U.; Elbeltagi, A. Global-Scale Water Security and Desertification Management amidst Climate Change. Environ. Sci. Pollut. Res. 2024, 31, 58720–58744. [Google Scholar] [CrossRef] [Scilit] [PubMed]
- Alam, S.; Roy, L.C.; Gala, T.; Ray, D. Global Water Resource Challenges. In Computational Intelligence and Optimization Methods for Sustainable Water Management; Ezaier, Y., Gaamouche, R., Lahby, M., Eds.; IGI Global Scientific Publishing: Hershey, PA, USA, 2025; pp. 39–80. ISBN 979-8-3373-2700-6. [Google Scholar]
- Amparo-Salcedo, M.; Pérez-Gimeno, A.; Navarro-Pedreño, J. Water Security Under Climate Change: Challenges and Solutions Across 43 Countries. Water 2025, 17, 633. [Google Scholar] [CrossRef] [Scilit]
- Liu, J.; Yang, H.; Gosling, S.N.; Kummu, M.; Flörke, M.; Pfister, S.; Hanasaki, N.; Wada, Y.; Zhang, X.; Zheng, C.; et al. Water Scarcity Assessments in the Past, Present, and Future. Earths Future 2017, 5, 545–559. [Google Scholar] [CrossRef] [Scilit] [PubMed]
- Pizarro, R.; Garcia-Chevesich, P.A.; McCray, J.E.; Sharp, J.O.; Valdés-Pineda, R.; Sangüesa, C.; Jaque-Becerra, D.; Álvarez, P.; Norambuena, S.; Ibáñez, A.; et al. Climate Change and Overuse: Water Resource Challenges during Economic Growth in Coquimbo, Chile. Sustainability 2022, 14, 3440. [Google Scholar] [CrossRef] [Scilit]
- Biswas, A.; Sarkar, S.; Das, S.; Dutta, S.; Roy Choudhury, M.; Giri, A.; Bera, B.; Bag, K.; Mukherjee, B.; Banerjee, K.; et al. Water Scarcity: A Global Hindrance to Sustainable Development and Agricultural Production—A Critical Review of the Impacts and Adaptation Strategies. Camb. Prism. Water 2025, 3, e4. [Google Scholar] [CrossRef] [Scilit]
- Muñoz, A.A.; Klock-Barría, K.; Alvarez-Garreton, C.; Aguilera-Betti, I.; González-Reyes, Á.; Lastra, J.A.; Chávez, R.O.; Barría, P.; Christie, D.; Rojas-Badilla, M.; et al. Water Crisis in Petorca Basin, Chile: The Combined Effects of a Mega-Drought and Water Management. Water 2020, 12, 648. [Google Scholar] [CrossRef] [Scilit]
- Fuentes, I.; Fuster, R.; Avilés, D.; Vervoort, W. Water Scarcity in Central Chile: The Effect of Climate and Land Cover Changes on Hydrologic Resources. Hydrol. Sci. J. 2021, 66, 1028–1044. [Google Scholar] [CrossRef] [Scilit]
- Boisier, J.P.; Alvarez-Garreton, C.; Marinao, R.; Galleguillos, M. Increasing Water Stress in Chile Revealed by Novel Datasets of Water Availability, Land Use and Water Use. Hydrol. Earth Syst. Sci. 2025, 29, 5185–5212. [Google Scholar] [CrossRef] [Scilit]
- Valdés-Pineda, R.; Pizarro, R.; García-Chevesich, P.; Valdés, J.B.; Olivares, C.; Vera, M.; Balocchi, F.; Pérez, F.; Vallejos, C.; Fuentes, R.; et al. Water Governance in Chile: Availability, Management and Climate Change. J. Hydrol. 2014, 519, 2538–2567. [Google Scholar] [CrossRef] [Scilit]
- Rosa, L.; Sangiorgio, M. Global Water Gaps under Future Warming Levels. Nat. Commun. 2025, 16, 1192. [Google Scholar] [CrossRef] [Scilit] [PubMed]
- Vellaiyan, A.; Chinthapalli, U.R.; Bandu, S. Addressing Water Scarcity and Climate Risks: Sustainable Solutions for Al Kharj, Saudi Arabia. Sustainability 2025, 17, 9273. [Google Scholar] [CrossRef] [Scilit]
- Matta, G.; Pant, G.; Kumar, P.; Pal, R. Navigating Water Scarcity for Global Climate Change and Ramifications. World Water Policy 2026, 12, e70055. [Google Scholar] [CrossRef] [Scilit]
- Verre, F.; Kumar, K.; Berndtsson, R.; Hashemi, H. Redefining Water Scarcity through the Integrated Water Strategic Resilience Index amid Climate and Conflict Pressures. Sci. Rep. 2026, 16, 9088. [Google Scholar] [CrossRef] [Scilit] [PubMed]
- Bonilla Valverde, J.P.; Stefan, C.; Palma Nava, A.; Bernardo Da Silva, E.; Pivaral Vivar, H.L. Inventory of Managed Aquifer Recharge Schemes in Latin America and the Caribbean. Sustain. Water Resour. Manag. 2018, 4, 163–178. [Google Scholar] [CrossRef] [Scilit]
- Page, D.; Gonzalez, D.; Bennison, G.; Burrull, C.; Claro, E.; Jara, M.; Valenzuela, G. Progress in the Development of Risk-Based Guidelines to Support Managed Aquifer Recharge for Agriculture in Chile. Water Cycle 2020, 1, 136–145. [Google Scholar] [CrossRef] [Scilit]
- Shubo, T.; Fernandes, L.; Montenegro, S.G. An Overview of Managed Aquifer Recharge in Brazil. Water 2020, 12, 1072. [Google Scholar] [CrossRef] [Scilit]
- Rivera-Vidal, R.; Arumí, J.L.; Melo, O.; Delgado, V.; Parra, V.; Stehr, A.; Daniele, L. Managed Aquifer Recharge Implementation Challenges: Lessons from Chile’s Water-Scarce Regions. Groundw. Sustain. Dev. 2025, 31, 101502. [Google Scholar] [CrossRef] [Scilit]
- Pizarro, R.; Flores, J.P.; Sangüesa, C.; Martínez, E.; León, L. Diseño Hidrológico de Zanjas de Infiltración En El Secano Costero e Interior de Las Regiones Semiáridas de Chile. Bosque Valdivia 2008, 29, 136–145. [Google Scholar] [CrossRef] [Scilit]
- Palma Nava, A.; Parker, T.K.; Carmona Paredes, R.B. Challenges and Experiences of Managed Aquifer Recharge in the Mexico City Metropolitan Area. Groundwater 2022, 60, 675–684. [Google Scholar] [CrossRef] [Scilit] [PubMed]
- Parker, T.K.; Jansen, J.; Behroozmand, A.; Halkjaer, M.; Thorn, P. Applied Geophysics for Managed Aquifer Recharge. Groundwater 2022, 60, 606–618. [Google Scholar] [CrossRef] [Scilit] [PubMed]
- Vanderzalm, J.; Page, D.; Dillon, P.; Gonzalez, D.; Petheram, C. Assessing the Costs of Managed Aquifer Recharge Options to Support Agricultural Development. Agric. Water Manag. 2022, 263, 107437. [Google Scholar] [CrossRef] [Scilit]
- Owen, D.; Dahlke, H.E.; Fisher, A.T.; Bruno, E.; Kiparsky, M. Navigating the Growing Prospects and Growing Pains of Managed Aquifer Recharge. Groundwater 2025, 63, 819–827. [Google Scholar] [CrossRef] [Scilit] [PubMed]
- Stefan, C.; Ansems, N. Web-Based Global Inventory of Managed Aquifer Recharge Applications. Sustain. Water Resour. Manag. 2018, 4, 153–162. [Google Scholar] [CrossRef] [Scilit]
- Dillon, P.; Stuyfzand, P.; Grischek, T.; Lluria, M.; Pyne, R.D.G.; Jain, R.C.; Bear, J.; Schwarz, J.; Wang, W.; Fernandez, E.; et al. Sixty Years of Global Progress in Managed Aquifer Recharge. Hydrogeol. J. 2019, 27, 1–30. [Google Scholar] [CrossRef] [Scilit]
- Blanc, J.; Arthur, S.; Wright, G. Natural Flood Management (NFM) Knowledge System: Part 1—Sustainable Urban Drainage Systems (SUDS) and Flood Management in Urban Areas; CREW—Centre of Expertise for Waters: Aberdeen, Scotland, 2012. [Google Scholar]
- Woodward, S.J.R.; Wöhling, T.; Stenger, R. Uncertainty in the Modelling of Spatial and Temporal Patterns of Shallow Groundwater Flow Paths: The Role of Geological and Hydrological Site Information. J. Hydrol. 2016, 534, 680–694. [Google Scholar] [CrossRef] [Scilit]
- Mattas, C.; Voudouris, S.; Foti, S.; Voudouris, K. Assessment of Future Groundwater Level Using Modflow Code under Different Managerial Scenarios in the Serres River Basin, Greece. Earth Sci. Inform. 2025, 18, 465. [Google Scholar] [CrossRef] [Scilit]
- González, P.S.; Sáez Lazo, R.; Vallejos Carrera, C.; Fernández Torres, Ó.; Bustos-Espinoza, L.; Ibáñez Córdova, A.; Ingram, B. Rainwater Harvesting for Well Recharge and Agricultural Irrigation: An Adaptation Strategy to Climate Change in Central Chile. Sustainability 2025, 17, 3549. [Google Scholar] [CrossRef] [Scilit]
- Pizarro, R.; Urbina, F.; Vallejos, C.; Mendoza, R.; Guzmán, J.; Tapia, J.; Sangüesa, C.; Campos, D.; Pino, J.; Saenz, R.; et al. Diseño y Construcción de Sistemas de Captación de Aguas Lluvias (SCALL): Una Experiencia de 3 Años; Pizarro, M., Ed.; Universidad de Talca: Talca, Chile, 2016; ISBN 978-956-329-070-7. [Google Scholar]
- Pizarro, R.; Estévez, C.; Vallejos, C.; Ibáñez, A.; Sangüesa, C.; Fernández, M.P.; Doll, U.; Mendoza, R.; Campos, D. Plantaciones de Aristotelia chilensis (maqui) en Base a Sistemas de Capatación de Aguas Lluvias (SCALL): Una Respuesta a los Escenarios de Escasez Hídrica de la Gobernanza del Agua en Chile; Pizarro, M., Ed.; Universidad de Talca: Talca, Chile, 2019; ISBN 978-956-329-110-0. [Google Scholar]
- Fernández, M.P.; Bonomelli, C.; Guevara, C.; Menéndez-Miguélez, M.; Celis, V.; Barrera, C.; Preller, C.; Pizarro, R.; Sangüesa, C.; Doll, U.; et al. Sistema de Captación de Aguas Lluvias (SCALL) y Su Aplicación En El Establecimiento de Maqui; Pontificia Universidad Católica de Chile: Santiago, Chile, 2017; ISBN 978-956-329-075-2. [Google Scholar]
- Sarricolea, P.; Herrera-Ossandon, M.; Meseguer-Ruiz, Ó. Climatic Regionalisation of Continental Chile. J. Maps 2017, 13, 66–73. [Google Scholar] [CrossRef] [Scilit]
- Garreaud, R.D.; Alvarez-Garreton, C.; Barichivich, J.; Boisier, J.P.; Christie, D.; Galleguillos, M.; LeQuesne, C.; McPhee, J.; Zambrano-Bigiarini, M. The 2010–2015 Megadrought in Central Chile: Impacts on Regional Hydroclimate and Vegetation. Hydrol. Earth Syst. Sci. 2017, 21, 6307–6327. [Google Scholar] [CrossRef] [Scilit]
- González, M.E.; Gómez-González, S.; Lara, A.; Garreaud, R.; Díaz-Hormazábal, I. The 2010–2015 Megadrought and Its Influence on the Fire Regime in Central and South-central Chile. Ecosphere 2018, 9, e02300. [Google Scholar] [CrossRef] [Scilit]
- Garreaud, R.D.; Boisier, J.P.; Rondanelli, R.; Montecinos, A.; Sepúlveda, H.H.; Veloso-Aguila, D. The Central Chile Mega Drought (2010–2018): A Climate Dynamics Perspective. Int. J. Climatol. 2020, 40, 421–439. [Google Scholar] [CrossRef] [Scilit]
- Álamos, N.; Alvarez-Garreton, C.; Muñoz, A.; González-Reyes, Á. The Influence of Human Activities on Streamflow Reductions during the Megadrought in Central Chile. Hydrol. Earth Syst. Sci. 2024, 28, 2483–2503. [Google Scholar] [CrossRef] [Scilit]
- Sangüesa Pool, C.; Vallejos Carrera, C. Diseño eficiente de Sistemas de captación de aguas lluvias en zonas rurales para su aplicación en zonas con demandas crecientes. Aqua-LAC 2021, 13, 53–64. [Google Scholar] [CrossRef] [Scilit]
- Riggs, H. Frequency Curves; Techniques of Water-Resources Investigations; US Government Printing Office: Washington, DC, USA, 1968. [Google Scholar]
- R Core Team. R: A Language and Environment for Statistical Computing; R Core Team: Vienna, Austira, 2025. [Google Scholar]
- Legates, D.R.; McCabe, G.J. Evaluating the Use of “Goodness-of-fit” Measures in Hydrologic and Hydroclimatic Model Validation. Water Resour. Res. 1999, 35, 233–241. [Google Scholar] [CrossRef] [Scilit]
- Flowers-Cano, R.; Ortiz-Gómez, R.; León-Jiménez, J.; López Rivera, R.; Perera Cruz, L. Comparison of Bootstrap Confidence Intervals Using Monte Carlo Simulations. Water 2018, 10, 166. [Google Scholar] [CrossRef] [Scilit]
- Nash, J.E.; Sutcliffe, J.V. River Flow Forecasting through Conceptual Models Part I—A Discussion of Principles. J. Hydrol. 1970, 10, 282–290. [Google Scholar] [CrossRef] [Scilit]
- UNESCO. Manual de Diseño y Construcción de Sistemas de Capacitación de Aguas Lluvias En Zonas Rurales de Chile; Documentos Técnicos del PHI-LAC; UNESCO: Montevideo, Uruguay, 2015; ISBN 978-92-9089-198-7. [Google Scholar]
- DGA; Cade-Idepe. Diagnóstico y Clasificación de Los Cursos y Cuerpos de Agua Según Objetivos de Calidad; S.I.T.; Dirección General de Aguas: Santiago, Chile, 2004. [Google Scholar]
- DGA. Delimitación Del Acuífero Del Río Ñuble Bajo y Determinación de La Recarga; S.D.T.; Dirección General de Aguas: Santiago, Chile, 2015; p. 27. [Google Scholar]
- DGA; Subterránea SpA. Análisis y Aplicación Metodología Para La Delimitación y Sectorización de Acuíferos En La Provincia de Ñuble, VIII Región; S.I.T.; Dirección General de Aguas: Santiago, Chile, 2015; p. 30. [Google Scholar]
- Gajardo, A. Avance Geológico Hoja Concepción-Chillán, Región Del Bío-Bío; Instituto de Investigaciones Geológicas: Santiago, Chile, 1981. [Google Scholar]
- Muñoz, J.; Niemeyer, H. Carta Geológica de Chile, Hoja Laguna Del Maule, Escala 1:250.000, Regiones Del Maule y Bío-Bío; Servicio Nacional de Geología y Minería: Santiago, Chile, 1984. [Google Scholar]
- Sernageomin. Mapa Geológico de Chile; Sernageomin: Santiago, Chile, 2003. [Google Scholar]
- Páez, D. Reconocimiento Hidrogeológico Mediante Prospecciones Eléctricas, Sondeos y Ensayos de Bombeo en la Comuna de Ninhue, Región Del Bío-Bío, Chile. Bachelor’s Thesis, Universidad de Concepción, Concepción, Chile, 2008. [Google Scholar]
- De Groot-Hedlin, C.D.; Constable, S.C. Occam’s Inversion to Generate Smooth, Two-Dimensional Models from Magnetotelluric Data. Geophysics 1990, 55, 1613–1624. [Google Scholar] [CrossRef] [Scilit]
- Sasaki, Y. Resolution of Resistivity Tomography Inferred from Numerical Simulation. Geophys. Prospect. 1992, 40, 453–463. [Google Scholar] [CrossRef] [Scilit]
- Loke, M.H.; Acworth, I.; Dahlin, T. A Comparison of Smooth and Blocky Inversion Methods in 2D Electrical Imaging Surveys. Explor. Geophys. 2003, 34, 182–187. [Google Scholar] [CrossRef] [Scilit]
- NCh 1333:1987; Water Quality Requirements for Different Uses. Instituto Nacional de Normalización (INN): Santiago, Chile, 1987.
- Boisier, J.P.; Rondanelli, R.; Garreaud, R.D.; Muñoz, F. Anthropogenic and Natural Contributions to the Southeast Pacific Precipitation Decline and Recent Megadrought in Central Chile. Geophys. Res. Lett. 2016, 43, 413–421. [Google Scholar] [CrossRef] [Scilit]
- Lee, O.; Sim, I.; Kim, S. Effect of Warming Climate on Extreme Daily Rainfall Depth Using Non-Stationary Gumbel Model with Temperature Co-Variate. Water Supply 2021, 21, 4153–4162. [Google Scholar] [CrossRef] [Scilit]
- Read, L.K.; Vogel, R.M. Reliability, Return Periods, and Risk under Nonstationarity. Water Resour. Res. 2015, 51, 6381–6398. [Google Scholar] [CrossRef] [Scilit]
- Alegría Olivera, L. Evaluation of the Feasibility of a Managed Aquifer Recharge through Irrigation Canals in the Lower Diguillín River Basin, Chile. Master’s Thesis, Flinders University, Adelaide, Australia, 2022. [Google Scholar]
- CNR. Diagnóstico Recarga de Acuíferos a Través de Canales, Río Diguillín; Comisión Nacional de Riego: Santiago, Chile, 2022; p. 157. [Google Scholar]
- DGA; Aquaterra. Estudio Hidrogeológico de Cuencas Del Bío Bío e Itata; S.I.T.; Dirección General de Aguas: Santiago, Chile, 2011; p. 115. [Google Scholar]
- DGA. Actualización de Los Recursos Hídricos Subterráneos En Los Sectores Acuíferos Ñuble y Changaral. Región Del Biobío; DARH; Dirección General de Aguas: Santiago, Chile, 2016; p. 34. [Google Scholar]
- Aguirre, I.; Maringue, J.; Santibáñez, I.; Yáñez, G. El Rol de La Exploración Geofísica En Acuíferos Profundos En Ambientes Semiurbanos y Rurales En Cuencas de Ante Arco Andino, Caso de Estudio En Acuífero Del Río Ñuble, Valle Central de Chile. Andean Geol. 2022, 49, 18–54. [Google Scholar] [CrossRef] [Scilit]
- Leiva, S. Estudio Hidrogeológico de La Disponibilidad de Agua de La Nueva XVI Región de Ñuble, Chile. Bachelor’s Thesis, Universidad de Concepción, Concepción, Chile, 2020. [Google Scholar]
- DGA. Reportes de Pozos, Región de Ñuble; Dirección General de Aguas: Santiago, Chile, 2023. [Google Scholar]
- DGA. Reporte de Inscripciones de Derechos de Aprovechamiento de Agua; Dirección General de Aguas: Santiago, Chile, 2023. [Google Scholar]
- DGA. Estimación Preliminar de Las Recargas de Agua Subterránea y Determinación de Los Sectores Hidrogeológicos de Aprovechamiento Común En Las Cuencas de Las Regiones Del Maule, Biobío, La Araucanía, Los Ríos y Los Lagos; S.D.T.; Dirección General de Aguas: Santiago, Chile, 2014. [Google Scholar]
- Quidel, C. Recarga Artificial de Acuíferos En La Cuenca Del Río Itata, Región Del BioBío, Chile. Bachelor’s Thesis, Andrés Bello, Santiago, Chile, 2017. [Google Scholar]
- Fereidouni, F.J.; Nahavandian Esfahani, S.; Mahmoudi, N. Seasonal variations of the water column structure and estimation of the mixed layer depth based on the temperature using threshold method in Babolsar and Ramsar regions. J. Earth Space Phys. 2020, 46, 159–174. [Google Scholar] [CrossRef] [Scilit]
- Nahavandian, S.; Jannar Fereidouni, F.; Mahmoudi, N. On the Seasonal Variability of the Vertical Physical Structure of the Water Column in the Continental Shelf, South-Eastern Caspian Sea. J. Sea Res. 2022, 187, 102246. [Google Scholar] [CrossRef] [Scilit]
- Bennison, G.; Claro, E. Managed Aquifer Recharge in Chile: A Promising Alternative to Enhance Water Security. In Managed Groundwater Recharge and Rainwater Harvesting; Water Resources Development and Management; Saha, D., Villholth, K.G., Shamrukh, M., Eds.; Springer Nature Singapore: Singapore, 2024; pp. 151–178. ISBN 978-981-99-8756-6. [Google Scholar]

Disclaimer/Publisher’s Note: The statements, opinions and data contained in all publications are solely those of the individual author(s) and contributor(s) and not of MDPI and/or the editor(s). MDPI and/or the editor(s) disclaim responsibility for any injury to people or property resulting from any ideas, methods, instructions or products referred to in the content. |
© 2026 by the authors. Licensee MDPI, Basel, Switzerland. This article is an open access article distributed under the terms and conditions of the Creative Commons Attribution (CC BY) license.