


Featured Application
The integrated FTIR–HPLC strategy developed in this study presents a practical and scalable solution for the pharmaceutical, nutraceutical, and cosmeceutical industries in ensuring the quality and consistency of Garcinia mangostana peel extracts. This approach facilitates rapid preliminary screening of raw materials through FTIR fingerprinting, followed by precise quantification of α-mangostin via HPLC as a confirmatory method. It can be directly implemented for routine quality control, authentication of geographical origin, and selection of high-potency raw materials in industrial supply chains. Furthermore, this method supports the standardization of mangosteen-based products with pharmacological relevance (e.g., antioxidant, anticancer, and antimicrobial formulations), thereby enhancing product efficacy, safety, and regulatory compliance.
Abstract
Mangosteen peel (Garcinia mangostana L.) is widely recognized as a rich source of xanthone derivatives, particularly α-mangostin, which exhibits diverse pharmacological activities and is increasingly utilized in herbal medicines and nutraceutical formulations. This study aimed to develop an integrated chemical fingerprinting approach combining chromatographic quantification and spectroscopic profiling to discriminate and evaluate the quality of GMP (Garcinia mangostana peel) extract collected from different Indonesian provinces. Ethanolic extracts of GMP, originating from ten distinct geographical regions, were subjected to high-performance liquid chromatography (HPLC) for the quantitative determination of α-mangostin. Fourier transform infrared (FTIR) spectroscopy was employed to generate characteristic fingerprint profiles and assess the functional group patterns present in the extracts. The correlation between chromatographic data and spectroscopic signatures was evaluated to elucidate regional variability. The geographical origin of the GMP extract significantly influences its phytochemical composition and α-mangostin content. The combined FTIR–HPLC approach offers a robust and practical framework for extract differentiation, preliminary estimation of α-mangostin content, and quality assurance of mangosteen-derived raw materials intended for 6a-standardized herbal and nutraceutical products.
1. Introduction
Mangosteen (Garcinia mangostana L.) is a tropical fruit-bearing plant widely recognized for its nutritional and medicinal values. It is predominantly cultivated in Southeast Asia, particularly in Indonesia, Thailand, and Malaysia [1,2]. The Garcinia mangostana L. pericarp has garnered substantial scientific interest due to its abundant concentration of bioactive secondary metabolites. Among these metabolites, xanthone derivatives represent the most extensively studied compounds [3,4]. Major xanthones identified in GMP include α-mangostin, γ-mangostin, gartanin, and several related analogs. These compounds are known for their diverse pharmacological activities. Numerous in vitro and in vivo studies have reported antioxidant properties associated with these xanthones. Additional investigations have demonstrated antibacterial and anti-inflammatory effects [5,6]. Among these bioactive constituents, α-mangostin is considered the principal marker compound due to its relatively high abundance [7]. The concentration of α-mangostin often serves as an indicator of extract potency [8]. As a result, GMP extract has gained increasing interest in traditional medicine systems. It is also widely incorporated into dietary supplements and herbal formulations [9]. The growing commercial demand further emphasizes the need for standardized raw materials. Therefore, comprehensive evaluation of its phytochemical composition is essential for ensuring product quality and efficacy.
Despite extensive research on GMP extracts, transforming them into standardized herbal products remains challenging. One of the primary obstacles lies in the inherent variability of phytochemical composition in plant materials [10,11]. Secondary metabolite production in plants is highly influenced by environmental conditions. Geographical origin plays a crucial role in determining the chemical profile of medicinal plants [12,13]. Climatic factors such as temperature, rainfall, and humidity can significantly affect metabolite biosynthesis. Soil composition and nutrient availability also contribute to variations in phytochemical accumulation [14]. Elevation and sunlight exposure may further modulate the concentration of specific compounds. Agricultural practices, including fertilization and harvesting time, introduce additional variability [15]. Post-harvest handling and storage conditions can also impact compound stability. These factors collectively lead to batch-to-batch differences in extract composition [16]. In the context of GMP, such variability may influence α-mangostin levels. Inconsistent concentrations may compromise therapeutic efficacy. Variability may also affect safety profiles and reproducibility of pharmacological effects [17,18]. Therefore, establishing reliable quality control strategies is imperative. Standardization approaches must account for both qualitative and quantitative differences among samples.
Standardization of herbal medicines requires analytical methods capable of providing comprehensive chemical information. Both identification and quantification of active constituents are necessary for robust quality control [19]. High-performance liquid chromatography is widely employed for the quantitative determination of marker compounds. HPLC offers high sensitivity, selectivity, and reproducibility for compound analysis [20]. In GMP extract, α-mangostin is commonly quantified using this technique. Chromatographic separation allows accurate measurement of retention time and peak area [21,22]. Calibration curves enable the precise determination of compound concentration. However, chromatographic analysis primarily focuses on individual target compounds. It does not fully represent the overall complexity of the herbal matrices. Herbal extracts contain numerous minor constituents that may also contribute to biological activity. Sole reliance on a single chromatographic marker may therefore be insufficient [23]. Variations in other components may remain undetected using targeted quantification alone. Hence, complementary analytical approaches are often required. An integrated strategy can provide broader insight into extract composition. Such a comprehensive evaluation strengthens quality assurance procedures.
Fourier transform infrared spectroscopy (FTIR) has emerged as a rapid and non-destructive analytical technique for herbal analysis. FTIR spectra provides information about functional groups present in complex mixtures [24]. The technique generates characteristic absorption bands corresponding to specific molecular vibrations. In plant extracts, typical signals include hydroxyl, carbonyl, and aromatic functional groups [25]. These functional groups are often associated with phenolic and xanthone structures. FTIR fingerprinting enables comparison of overall spectral patterns among samples [26]. Differences in spectral intensity may reflect variations in chemical composition. The method requires minimal sample preparation and offers rapid analysis. It is also considered environmentally friendly due to limited solvent use [27]. FTIR has been widely applied for authenticity testing of herbal materials. It can support discrimination of samples based on geographical origin [28]. Nevertheless, FTIR alone does not provide precise quantitative data for individual compounds. Its predictive capability improves when combined with chromatographic techniques. Integration with HPLC enhances both specificity and reliability. Therefore, a combined analytical approach is increasingly recommended for herbal standardization.
Although previous studies have quantified α-mangostin or applied FTIR spectroscopy separately, integrated investigations remain limited. Few reports have systematically correlated FTIR spectral patterns with quantitative α-mangostin data [29]. The ability of FTIR to reflect variations in α-mangostin concentration across geographical regions has not been fully elucidated. Moreover, discrimination of GMP extract from different Indonesian provinces remains underexplored. Indonesia possesses diverse agroecological conditions that may influence phytochemical profiles. The comprehensive evaluation of regional variability is therefore scientifically relevant. Establishing a correlation between spectroscopic fingerprints and chromatographic quantification could enhance quality assessment. Such correlation may enable rapid preliminary screening of raw materials. It may also support authentication of extract origin. In this study, we investigated GMP extracts collected from multiple provinces in Indonesia. HPLC was employed to quantify the α-mangostin content in each sample. FTIR spectroscopy was used to generate chemical fingerprint profiles. Correlation analysis was conducted to examine relationships between spectral intensity and compound concentration. The integrated FTIR–HPLC approach was evaluated as a framework for extract differentiation. This strategy is expected to contribute to improved raw material selection and standardization of mangosteen-based health products.
2. Materials and Methods
GMP samples (with specimen code of 36/HB/05/2022) were collected from ten different geographical locations in Indonesia, including West Java (Puspahiang: 7°25′1.29295″ S, 108°2′49.98844″ E, Sukaraja: 7°26′7″ S, 108°10′2″ E, Cibalong: 7°30′49.62200″ S, 108°10′59.60788″ E, Pangandaran: 7°41′5.031″ S 108°39′12.884″ E, Bogor: 6°35′40″ S 106°47.35′ E, and Subang: 6°34′16″ S, 107°45′42″ E), Central Java (Cilacap: 7°44′ S, 109°0′ E), Special Region of Yogyakarta (Yogyakarta: 7°48′5″ S, 110°21′52″ E), and Sumatra (Padang: 0°57′0″ S, 100°21′11″ E and Palembang: 2°59′10″ S, 104°45′20″ E). The samples were collected as representative samples from orchards in each geographical location. The number of trees and fruits per tree were not recorded quantitatively; instead, fruits were selected to reflect typical maturity and appearance at the time of harvest. All plant materials were authenticated based on morphological characteristics prior to processing. The samples were cleaned to remove adhering soil and impurities. The pericarp was separated manually from seeds and edible pulp. The collected materials were transported in breathable containers to prevent moisture accumulation. Drying was performed under controlled conditions to minimize degradation of thermolabile compounds. After drying, the samples were stored in airtight containers protected from light and humidity. Ethanol of analytical grade (Merck KGaA, Darmstadt, Germany) was used as the extraction solvent. α-Mangostin reference standard (purity ≥98%) was obtained from BioPurify (Chengdu, China). Acetonitrile (HPLC grade, Merck KGaA, Darmstadt, Germany) and phosphoric acid (HPLC grade, Merck KGaA, Darmstadt, Germany) were used for chromatographic analysis. Distilled water was purified using a Milli-Q system prior to use. All chemicals and reagents were used without further purification. Glassware and analytical instruments were calibrated prior to analysis. Each location sample was processed separately to avoid cross-contamination. The overall workflow included extraction, chromatographic analysis, spectroscopic profiling, and chemometric evaluation.
2.1. Collection, Authentication, and Preparation of Mangosteen GMP Samples
The preparation of GMP was carried out using a maceration technique to ensure efficient recovery of bioactive compounds. Fresh pericarp was separated carefully from seeds and residual pulp to obtain the outer rind. The material was sun-dried until a constant weight was achieved to ensure moisture removal. Drying was continued by an oven drying method at 50 °C until a constant weight was achieved [30]. The dried pericarp was cut into smaller fragments to facilitate grinding. Pulverization was carried out using a mechanical grinder to obtain a homogeneous powder. The powder was sieved to ensure uniform particle-size distribution. Approximately 500 g of powdered material was used for each extraction batch. The powder was immersed in 70% ethanol at a ratio of 1:10 (w/v). Maceration was conducted for 72 h at room temperature. Intermittent agitation was performed three times daily to enhance solvent penetration. After 72 h, the mixture was filtered using Whatman No. 1 filter paper. The residue was subjected to remaceration three times under identical conditions to maximize yield. All filtrates were pooled and concentrated using a rotary evaporator at 40 °C under reduced pressure. The viscous extract was stored in amber bottles at 4 °C until further analysis [24].
2.2. Chromatographic Quantification and Fingerprint Profiling Using HPLC–PDA
Chromatographic analysis was performed using a Shimadzu LC-20AD HPLC system equipped with a SIL-20A autosampler and SPD-20A photodiode array detector (Shimadzu Corporation, Kyoto, Japan). Separation was achieved using a Waters Spherisorb C18 column (250 mm × 4.6 mm, 5 μm). The mobile phase consisted of acetonitrile and water containing 0.1% phosphoric acid in a ratio of 95:5 (v/v). An isocratic elution system was applied throughout the analysis. The flow rate was maintained at 1.0 mL/min. The injection volume was set at 20 μL for all samples and standards. The column temperature was controlled at 30 °C. Detection was performed at a wavelength of 316 nm using the PDA detector (Shimadzu Corporation, Kyoto, Japan). This method was validated by our previous study where the coefficient correlation of the analytical method was 0.9999, the variation was less than 2%, the LOD was 0.671 ppm and the LOQ was 2.174 ppm [3]. Standard solutions of α-mangostin were prepared at various concentrations to construct a calibration curve. Linearity was evaluated based on correlation coefficient values. GMP extracts from each location were weighed at 10 mg and were prepared at 1000 µg/mL with ethanol of analytical grade (Merck KGaA, Darmstadt, Germany). Sample solutions were filtered through a 0.45 μm membrane filter prior to injection. Each sample was analyzed in duplicate to ensure reproducibility. Retention times and peak areas were recorded and processed using Shimadzu LC Solution software (Shimadzu Corporation, Kyoto, Japan). The quantification of α-mangostin was carried out using the external standard method. The chromatographic profile was also used to establish a fingerprint pattern for comparative analysis [29].
2.3. Spectroscopic Fingerprint Characterization Using FTIR–ATR
Infrared spectra were recorded using an ABB 3000 FTIR spectrophotometer (Agilent Cary 630, Agilent Technologies, Santa Clara, CA, USA) equipped with a DTGS detector. Spectral acquisition was performed using the attenuated total reflectance technique. A small amount of extract was directly applied onto the ATR crystal surface. Measurements were conducted at a controlled temperature of 20 °C to ensure stability. Each spectrum was obtained using 32 co-added scans. The spectral resolution was set at 4 cm−1. Background correction was performed prior to each measurement. The ATR crystal was cleaned with ethanol and methanol after each run. Cleaning was followed by drying with lint-free tissue. The instrument chamber was maintained under stable humidity conditions. Spectra were recorded in the range of 650–4000 cm−1. All measurements were performed in duplicate for reliability assessment. Spectral data were collected in absorbance mode. Characteristic absorption bands corresponding to hydroxyl, carbonyl, and aromatic groups were identified. The spectral patterns were used for fingerprinting and comparative evaluation among samples [31].
2.4. Multivariate Chemometric Evaluation and Statistical Data Processing
Principal component analysis (PCA) was performed using FTIR spectral data obtained from the samples. The absorbance values across the selected spectral region were used as input variables for the PCA. FTIR spectral data were exported in numerical format for chemometric processing. Principal component analysis was employed to explore clustering patterns among samples. The input variables included quantified α-mangostin levels and selected FTIR absorbance regions. Prior to analysis, data were standardized to reduce scale bias. PCA was conducted using Minitab® 22 software. Score plots were generated to visualize sample grouping. Loading plots were examined to identify influential variables. Variability explained by principal components was calculated. Clustering trends were interpreted in relation to geographical origin. Correlation between spectral intensity and compound concentration was assessed qualitatively. The integrated chromatographic–spectroscopic dataset was used to evaluate discrimination performance among GMP samples [32].
3. Results
3.1. HPLC Identification and Calibration Curve of α-Mangostin Reference Standard
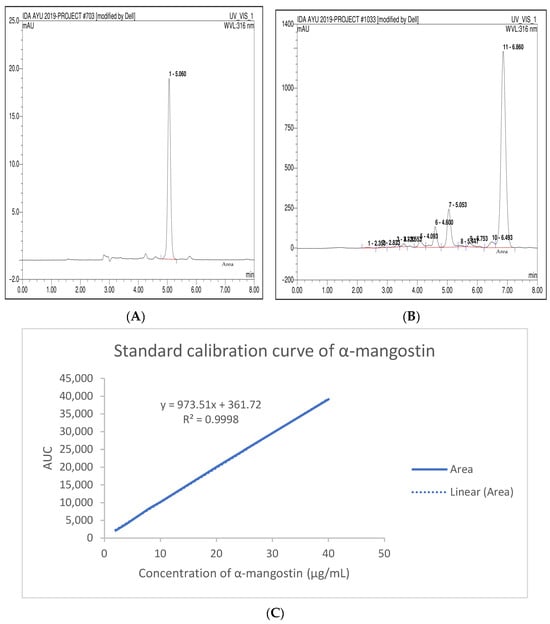
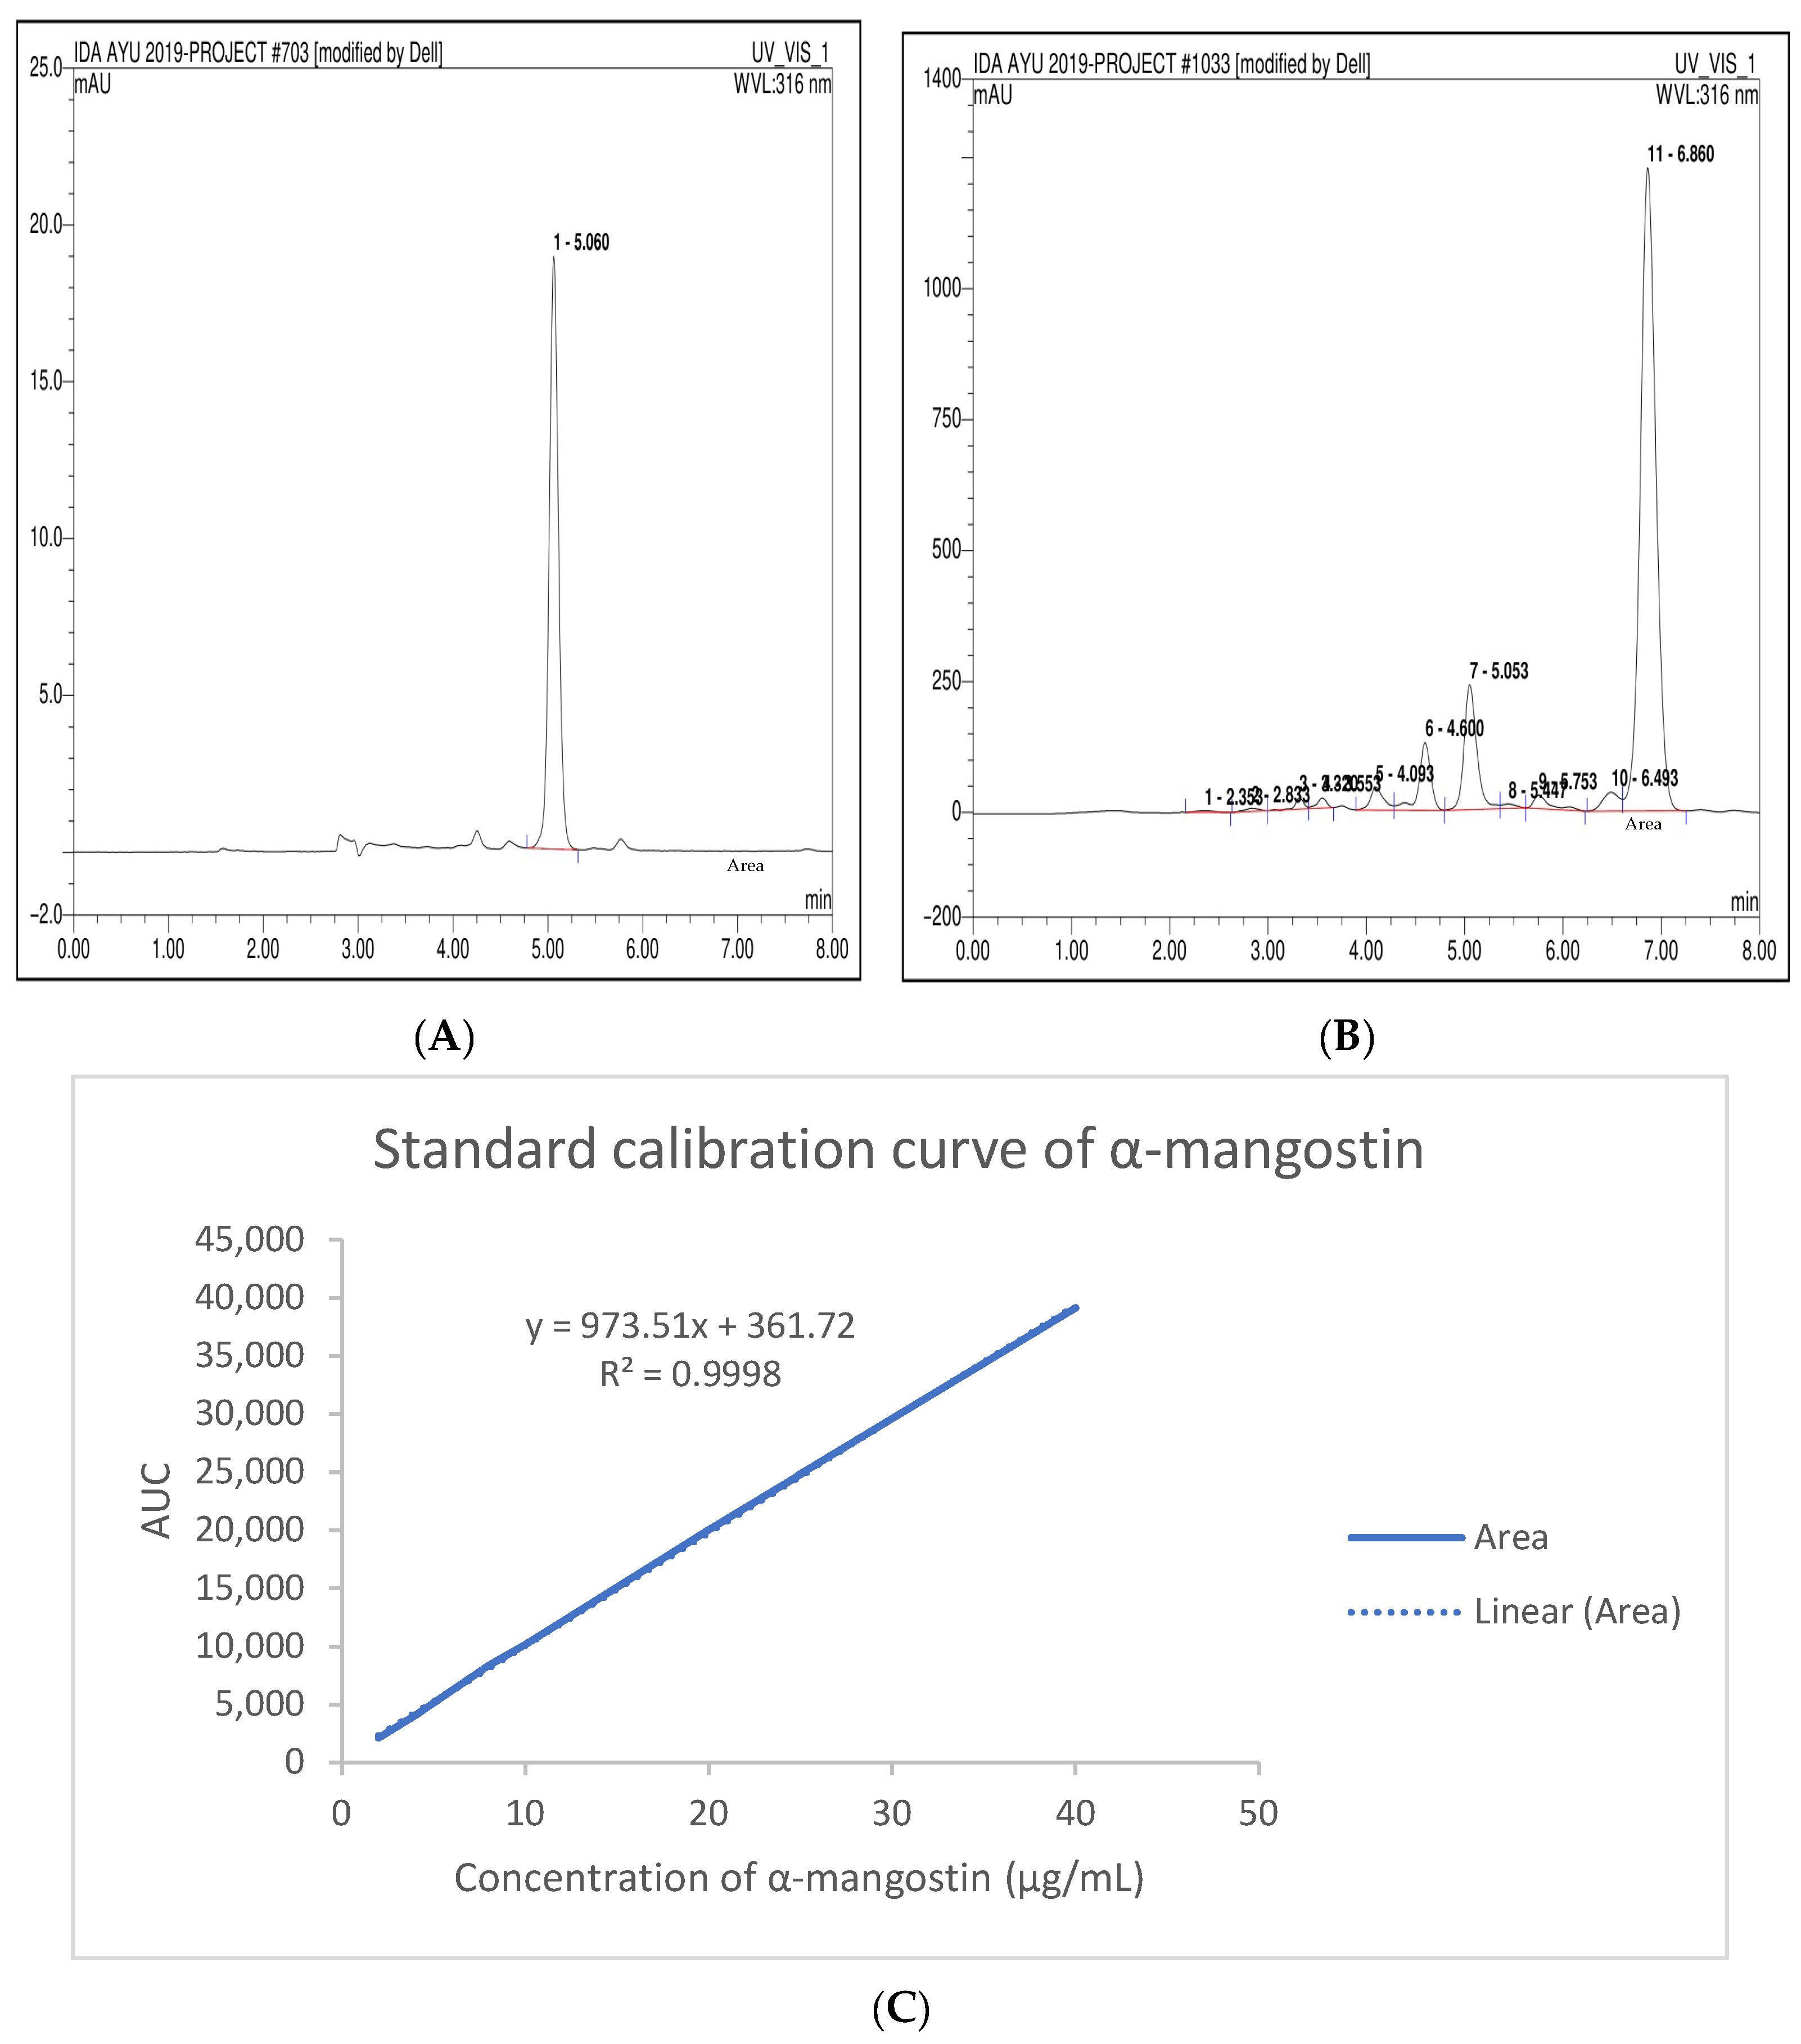
HPLC (high-performance liquid chromatography) was employed to quantify α-mangostin as the principal chemical marker in GMP extracts collected from different geographical origins. In designing this study, we deliberately selected ten locations that reflect the breadth of Indonesia’s agroecological diversity. The selection of location was not random but rooted in both scientific and practical considerations. West Java was emphasized because it is one of the country’s most important agricultural regions, where volcanic uplands, fertile alluvial plains, and monsoonal lowlands coexist within a relatively small area. This allowed us to capture a wide range of farming systems while maintaining logistical feasibility and research consistency. At the same time, we included sites in Central Java, Yogyakarta, Padang, and Palembang to ensure that contrasting contexts—such as coastal plains, high-rainfall volcanic zones, and lowland peat ecosystems—were represented. Taken together, these ten sites provide a balanced cross-section of Indonesia’s climate and soil variability, aligning with both national and international agroecological zoning frameworks and making the findings broadly relevant to the country’s agricultural landscape [33]. The chromatographic profile of the α-mangostin reference standard is presented in Figure 1. Under the applied chromatographic conditions, the standard compound exhibited a sharp and symmetrical peak. The retention time of the α-mangostin standard was approximately 5.06 min. This retention behavior indicates efficient separation under the selected mobile phase composition. The chromatogram also demonstrates minimal baseline disturbance, indicating stable detector performance during analysis. Such peak characteristics are important for ensuring accurate integration and reliable quantification. The calibration curve was constructed using several concentrations of the α-mangostin reference standard. The relationship between peak area and concentration displayed a strong linear trend. The regression equation obtained from the calibration data was y = 973.51x + 361.72. The coefficient of determination was calculated as R2 = 0.9998. This high correlation coefficient indicates excellent linearity across the evaluated concentration range. The strong linear relationship confirms that the chromatographic method is suitable for the quantitative determination of α-mangostin. Reliable linear calibration is essential for ensuring accurate concentration estimation in plant extract samples. The calibration model established in this study therefore provided a robust basis for subsequent quantitative analysis of GMP extracts.
Figure 1.
HPLC chromatogram of α-mangostin reference standard (A), sample (B) and the corresponding calibration curve for quantitative determination of α-mangostin (C).
All analyzed GMP extracts produced chromatographic peaks with retention times closely matching that of the α-mangostin reference standard. The deviation in retention time among samples did not exceed ±0.05 min [34]. This consistency indicates that α-mangostin was present in all examined extracts. The matching retention times also confirm the reliability of the chromatographic method for compound identification. Such reproducibility is essential when comparing extracts originating from different geographical locations. The presence of α-mangostin as a dominant xanthone compound in mangosteen pericarp has been widely reported in previous phytochemical studies. Similar chromatographic analyses have identified α-mangostin as a major bioactive constituent responsible for many biological activities of GMP. Studies using comparable chromatographic systems have reported retention times for α-mangostin within the range of approximately 5–6 min. Slight variations in retention time may occur depending on differences in chromatographic conditions. Some factors including column type, solvent composition, and detector wavelength may influence retention behavior. In some reports using different mobile phase polarity, α-mangostin has been detected at longer retention times [3]. For example, chromatographic systems containing higher proportions of aqueous phases have produced retention times approaching 20 min. These variations arise from differences in interaction between the analyte and the stationary phase. The reversed-phase C18 column used in this study provided efficient interaction between the hydrophobic xanthone structure and the stationary phase. Such chromatographic conditions enabled rapid separation and reliable identification of α-mangostin in GMP extracts from multiple regions.
3.2. Quantification of α-Mangostin in GMP Extracts from Different Geographical Locations
Despite the consistent retention time observed during chromatographic analysis, substantial variation in α-mangostin concentration was detected among the analyzed samples. Quantitative results summarized in Table 1 demonstrate that the content of α-mangostin differed considerably depending on the geographical origin of the GMP. The lowest concentration was detected in the Padang sample, which contained 16.72 mg/g of α-mangostin. In contrast, the Cilacap sample exhibited the highest concentration, reaching 58.64 mg/g. Samples collected from Bogor and Puspahiang also presented relatively high concentrations of α-mangostin. The Bogor extract contained 46.60 mg/g, while the Puspahiang sample showed 41.95 mg/g. Intermediate concentrations were recorded in samples obtained from Cibalong, Subang, Yogyakarta, and Palembang. The Cibalong extract contained 33.47 mg/g of α-mangostin, indicating moderate accumulation of the compound. The Subang sample exhibited a similar concentration of 32.12 mg/g. The Yogyakarta and Palembang samples contained 35.61 mg/g and 36.07 mg/g, respectively. Lower concentrations were observed in Sukaraja and Pangandaran, with values of 19.11 mg/g and 22.31 mg/g. These quantitative differences indicate that α-mangostin accumulation varies significantly among different regions. Such variation reflects the influence of environmental conditions on the biosynthesis of secondary metabolites in GMP. Differences in metabolite concentration are commonly reported in medicinal plants collected from diverse geographical locations. The quantitative data obtained in this study therefore demonstrate that regional origin plays an important role in determining the phytochemical composition of GMP extract.
Table 1.
HPLC determination of α-mangostin content in ethanolic GMP extracts obtained from various geographical regions.
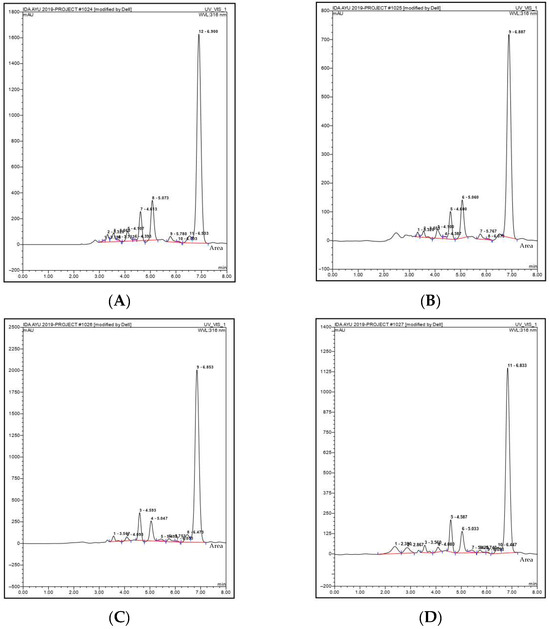
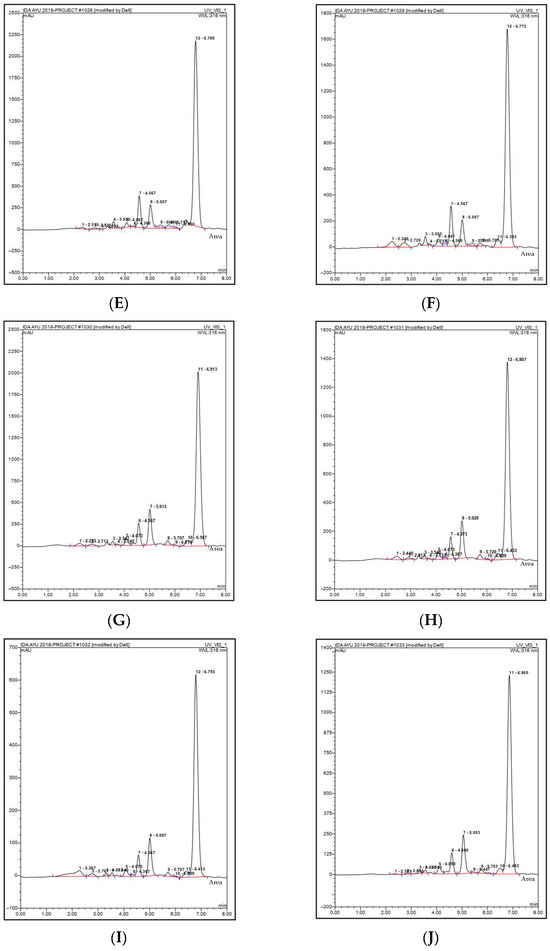
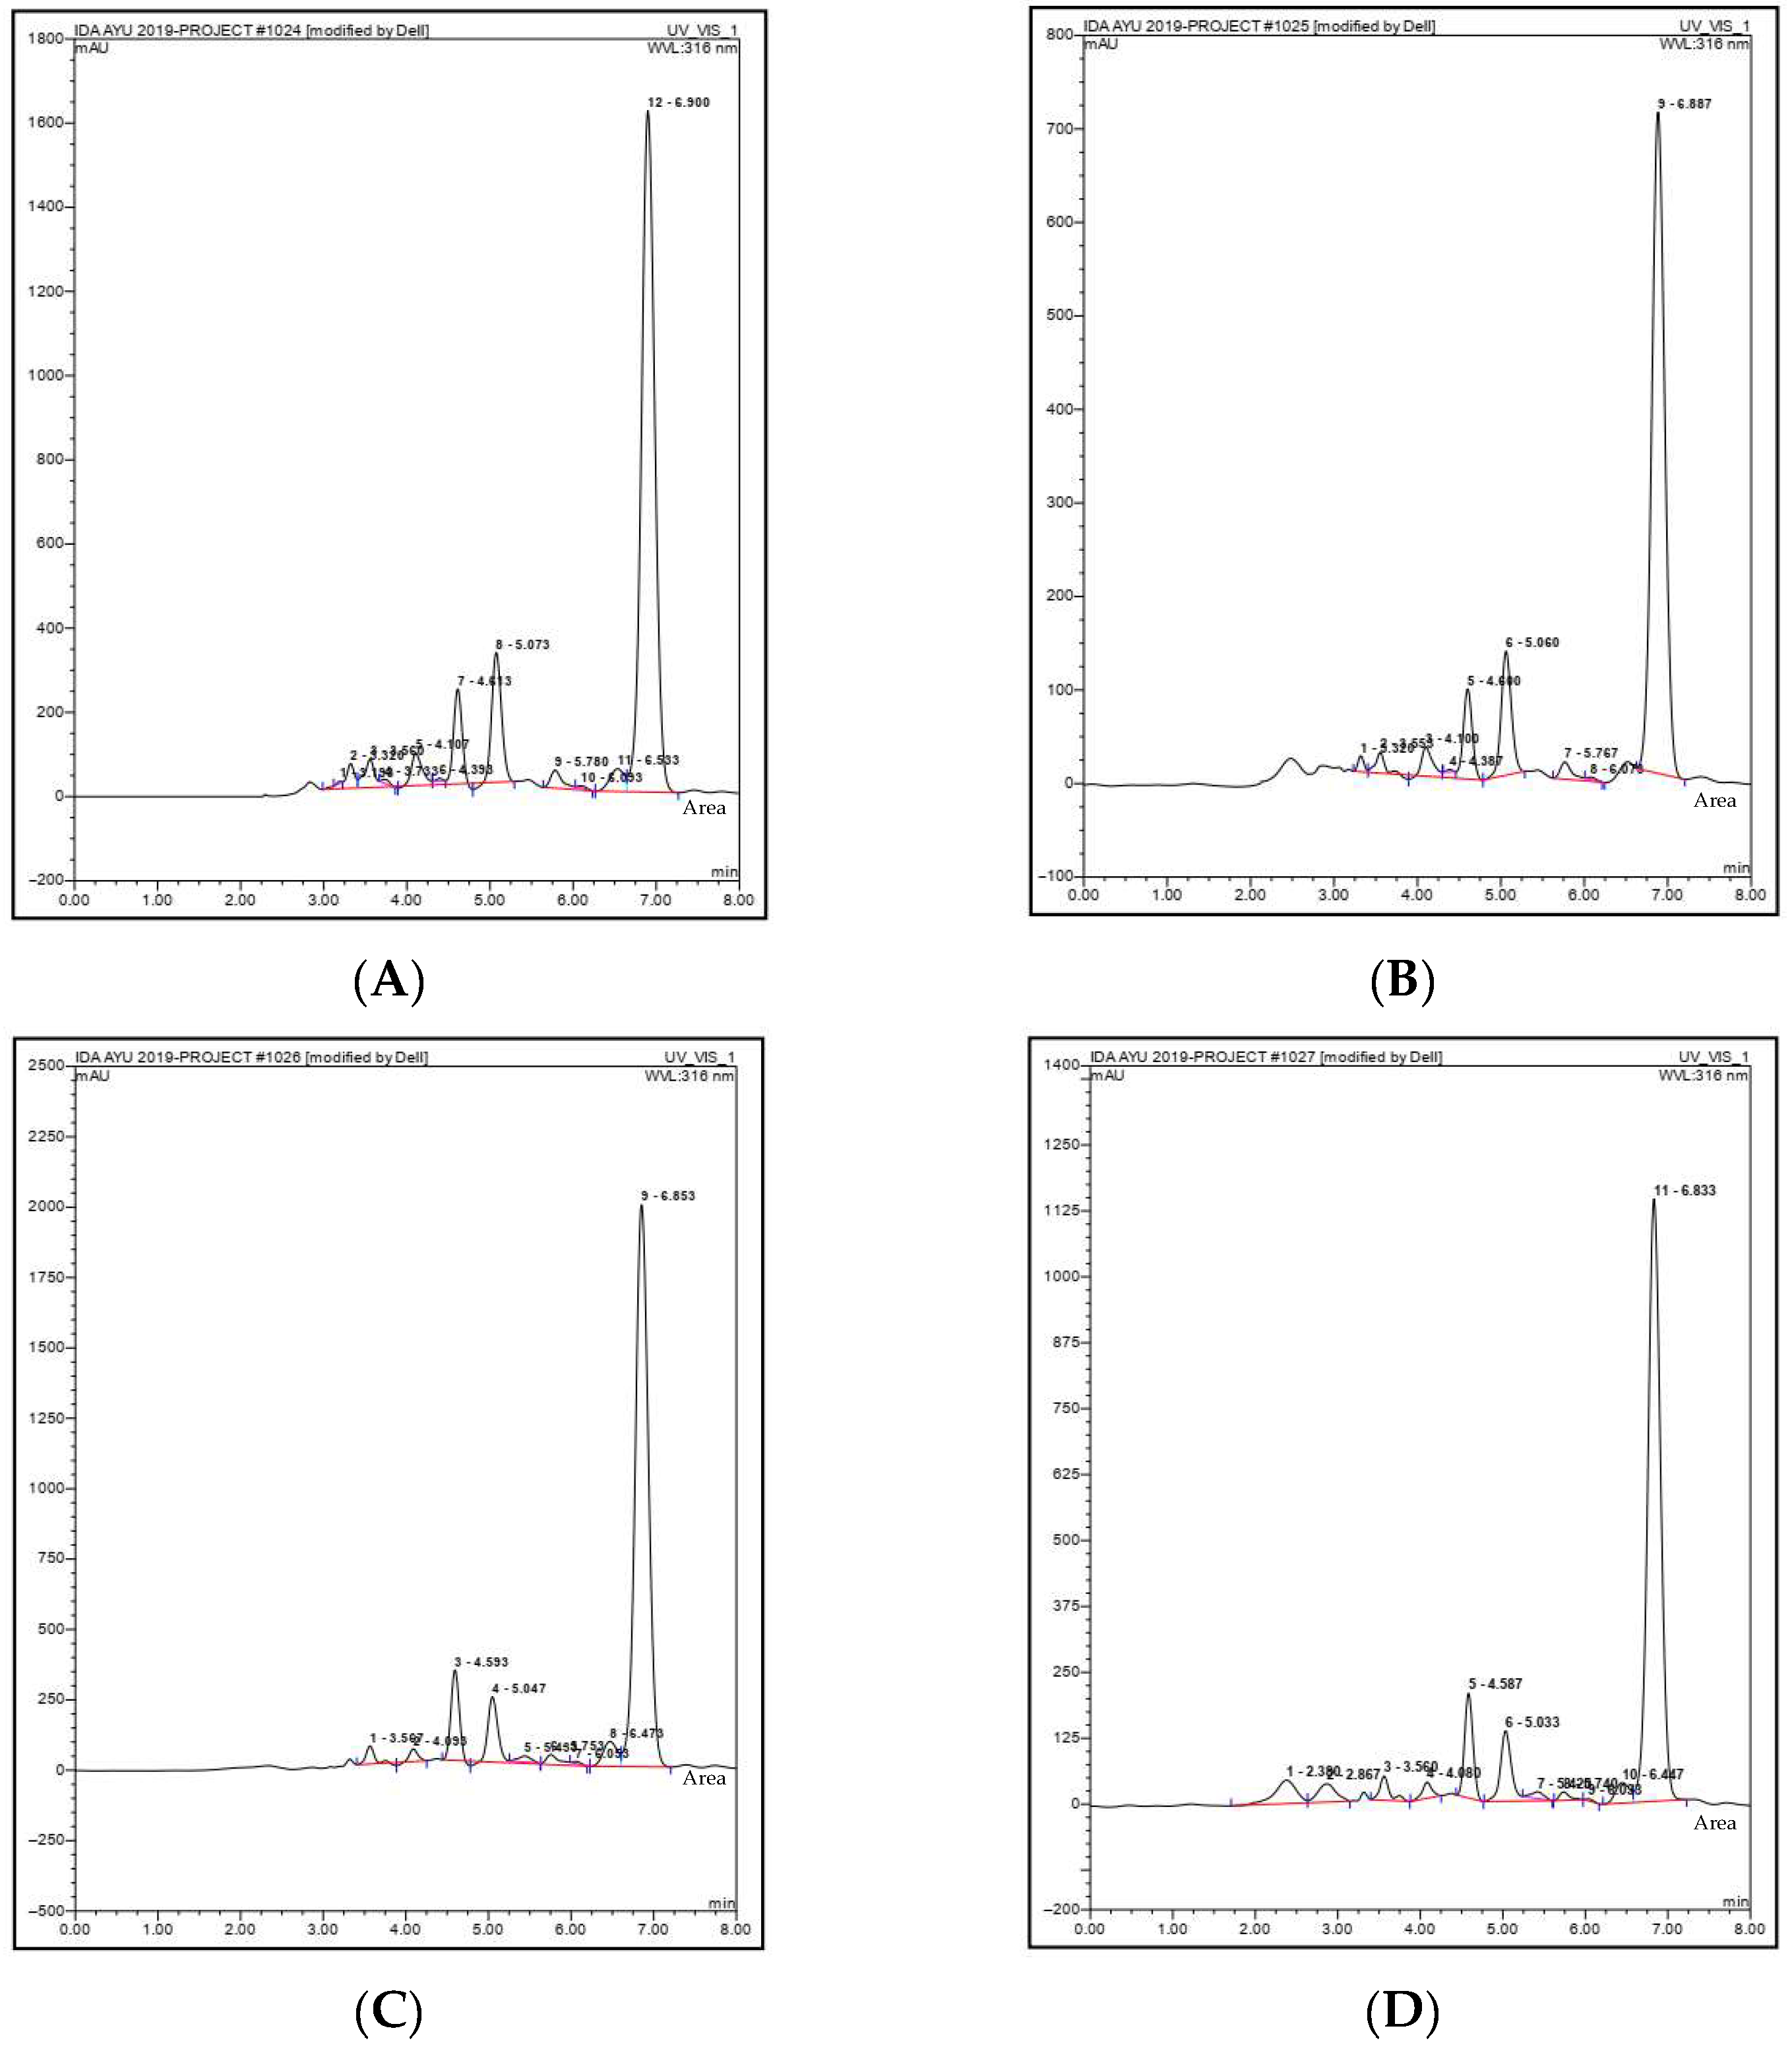
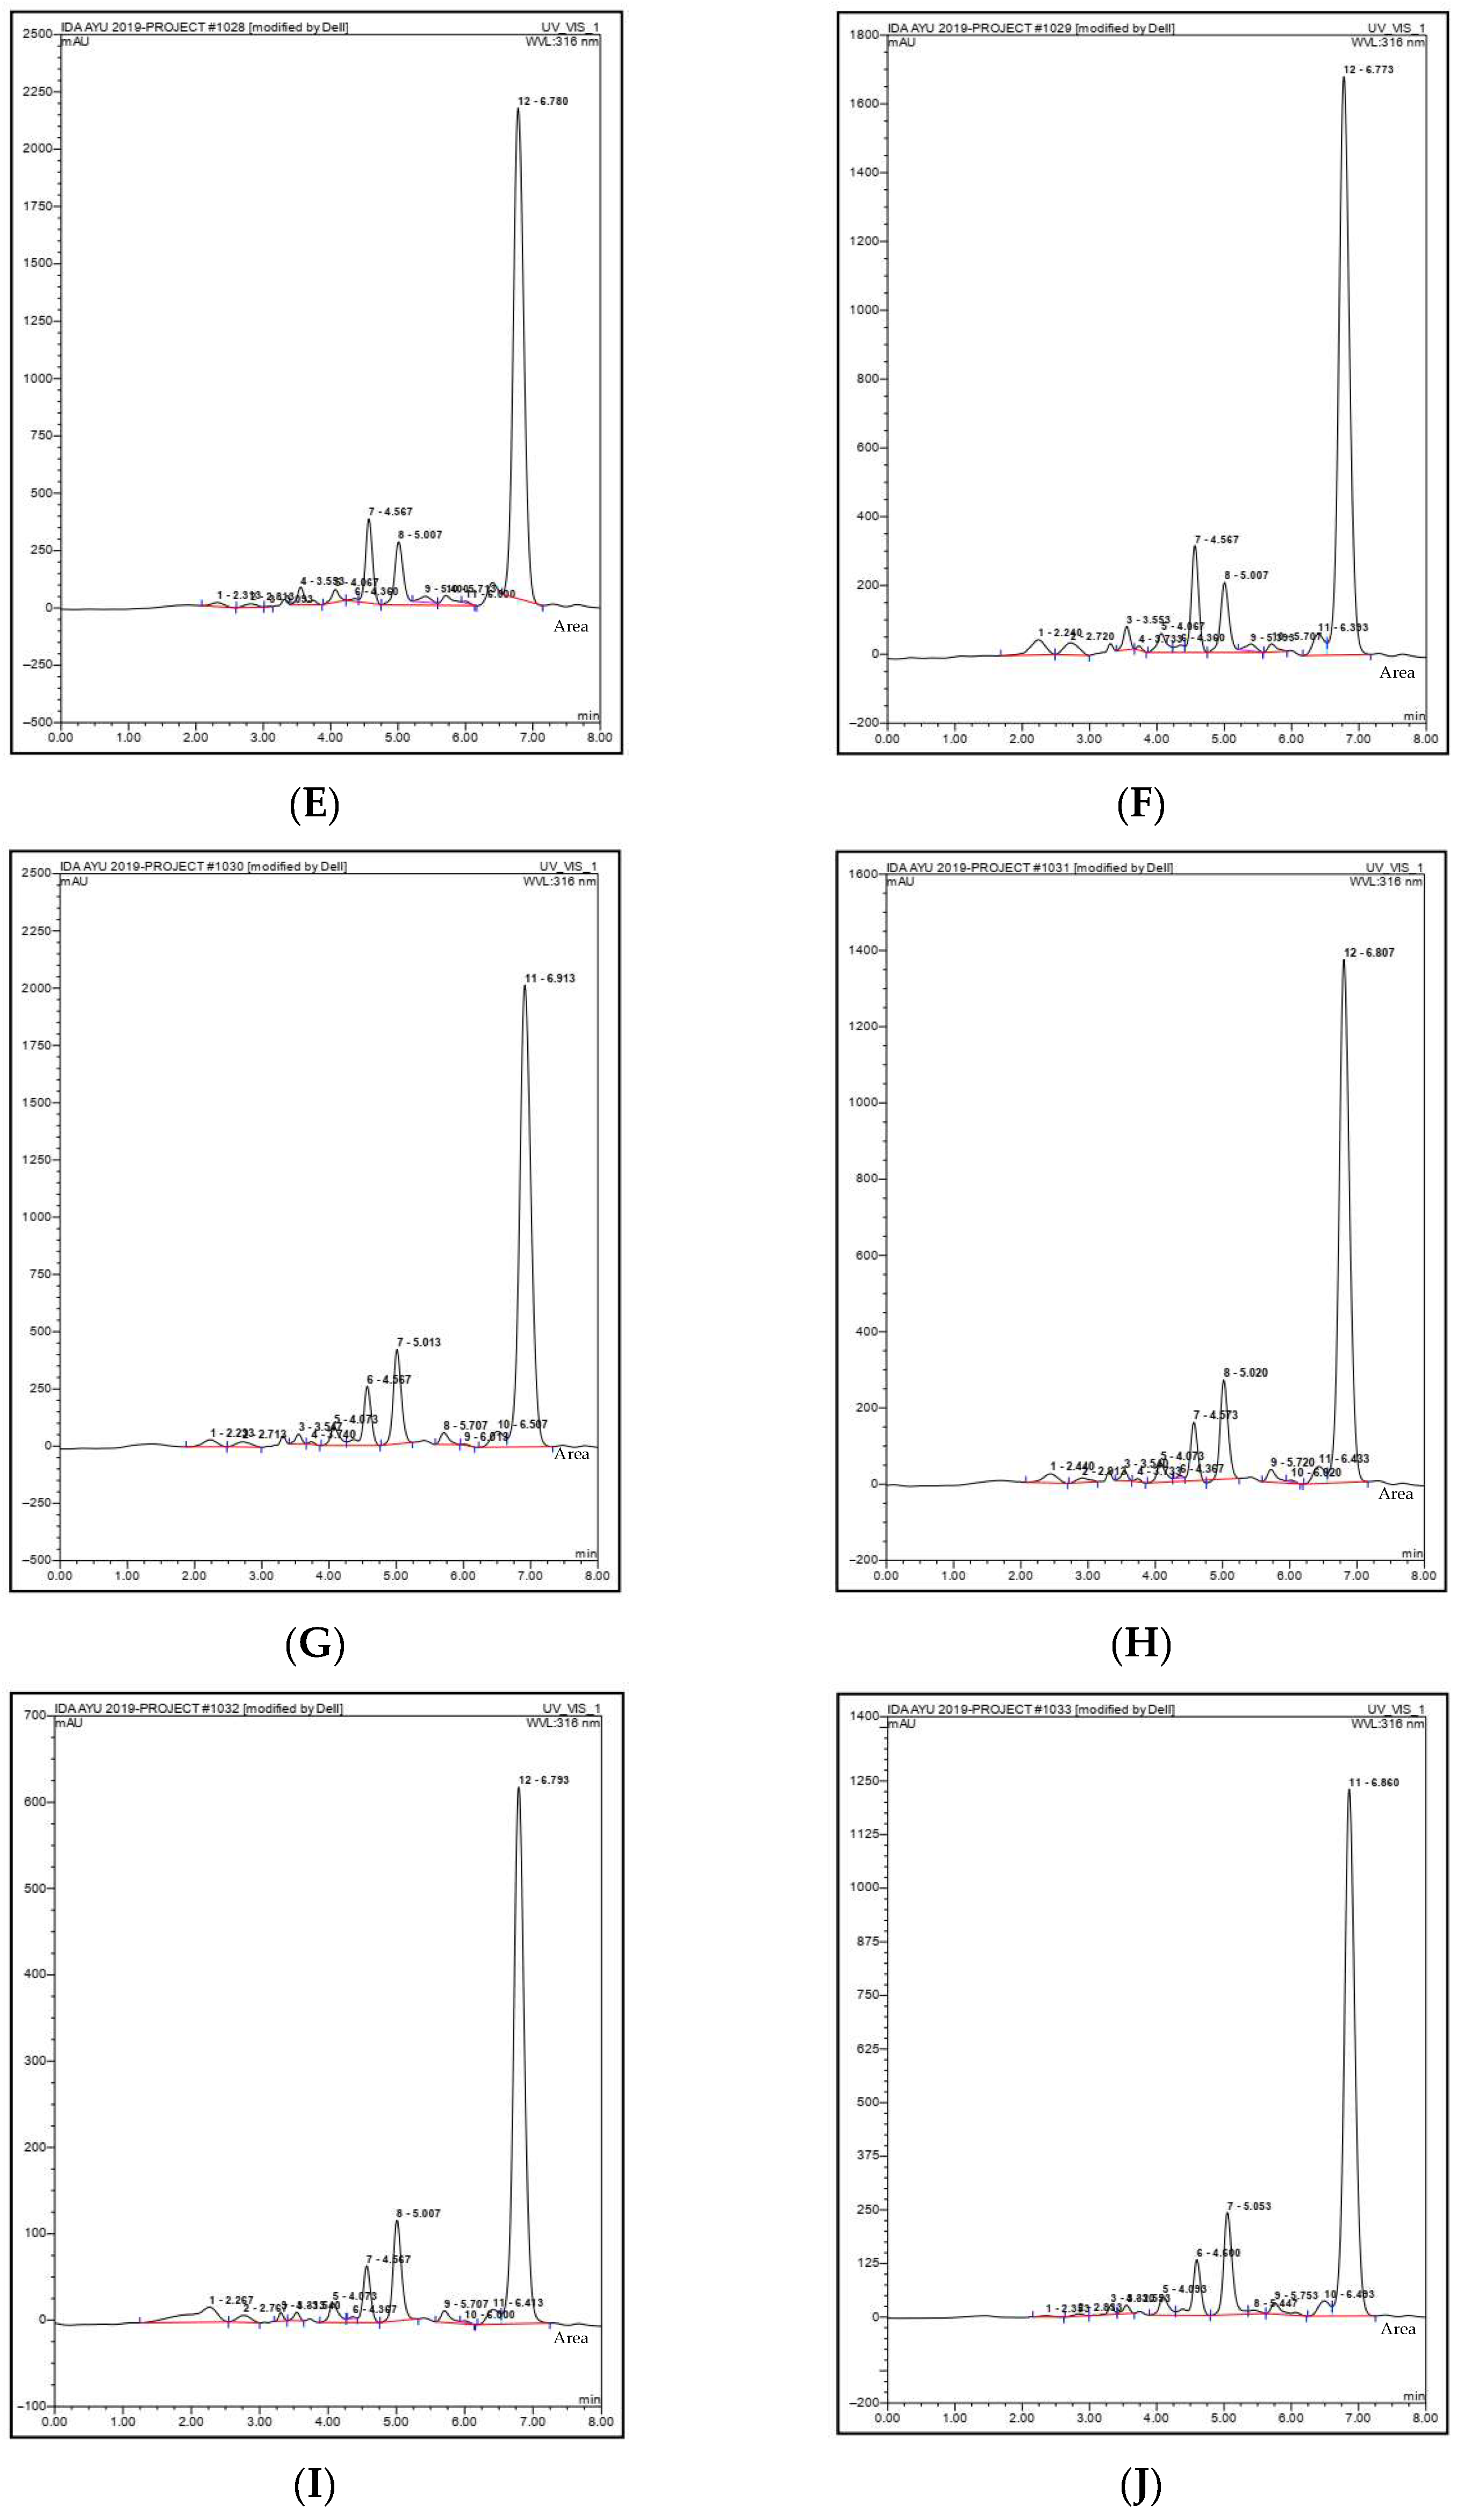
The chromatographic patterns of the ethanolic extracts obtained from different sampling locations are presented in Figure 2. The chromatograms show characteristic peaks corresponding to the xanthone compounds present in the GMP extracts. Among these peaks, the signal corresponding to α-mangostin appears as one of the dominant peaks in the chromatographic profile as shown in previous study [3,7,35]. The peak intensity differs among the chromatograms obtained from different locations. Samples with higher α-mangostin concentrations display more intense chromatographic peaks at the corresponding retention time. Conversely, extracts with lower α-mangostin content show relatively smaller peak intensities. Such variations in peak intensity are consistent with the quantitative results obtained from chromatographic integration. The chromatographic fingerprints also demonstrate that GMP extract contains multiple phytochemical constituents. These additional peaks likely correspond to other xanthone derivatives such as γ-mangostin, gartanin, and related compounds. The presence of multiple peaks reflects the chemical complexity of GMP extract. Chromatographic fingerprinting therefore provides useful information regarding the compositional profile of herbal extracts. Differences in chromatographic patterns may serve as indicators of variation in chemical composition among samples. Such fingerprint profiles are valuable for distinguishing extracts originating from different regions. Chromatographic fingerprinting also supports the authentication of herbal raw materials. The differences observed among chromatograms therefore reinforce the importance of analytical evaluation in herbal standardization.
Figure 2.
HPLC chromatograms of ethanolic GMP collected from ten sampling locations: Puspahiang (A); Sukaraja (B); Cibalong (C); Pangandaran (D); Bogor (E); Subang (F); Cilacap (G); Yogyakarta (H); Padang (I); Palembang (J).
Based on the ANOVA results, the effect of altitude on α-mangostin content was not significant. This is indicated by a p-value of 0.97 which is greater than 0.05. Moreover, factors influencing α-mangostin content can vary and are not limited to altitude alone. The variability observed in α-mangostin concentration is strongly associated with environmental and geographical factors influencing plant metabolism. Secondary metabolite biosynthesis in plants is highly responsive to environmental conditions. Temperature, rainfall patterns, and sunlight exposure may significantly influence metabolic pathways responsible for α-mangostin production. Soil composition and nutrient availability also affect plant growth and secondary metabolite accumulation. Differences in soil mineral content may alter enzymatic activity involved in biosynthetic processes. Elevation and local microclimatic conditions may further contribute to variations in phytochemical composition. Agricultural practices such as cultivation methods, fertilization, and irrigation regimes can also influence metabolite production. The maturity stage of the fruit at harvest may additionally affect the concentration of bioactive compounds in the peel [36]. Post-harvest handling and drying conditions may contribute to compound degradation or preservation. Similar geographical variations in α-mangostin concentration have been reported in previous phytochemical studies of G. mangostana. These studies demonstrated that environmental conditions can significantly influence the accumulation of α-mangostin in plant tissues. Variability in bioactive compound concentration is particularly relevant when GMP is used as a pharmaceutical raw material. Consistency in active compound levels is essential for ensuring reproducible therapeutic efficacy. Analytical verification of α-mangostin concentration therefore becomes an important step in quality control. Implementation of standardized analytical methods such as HPLC enables the reliable evaluation of phytochemical variability in GMP extract.
3.3. FTIR Spectral Fingerprint Analysis of GMP Extract
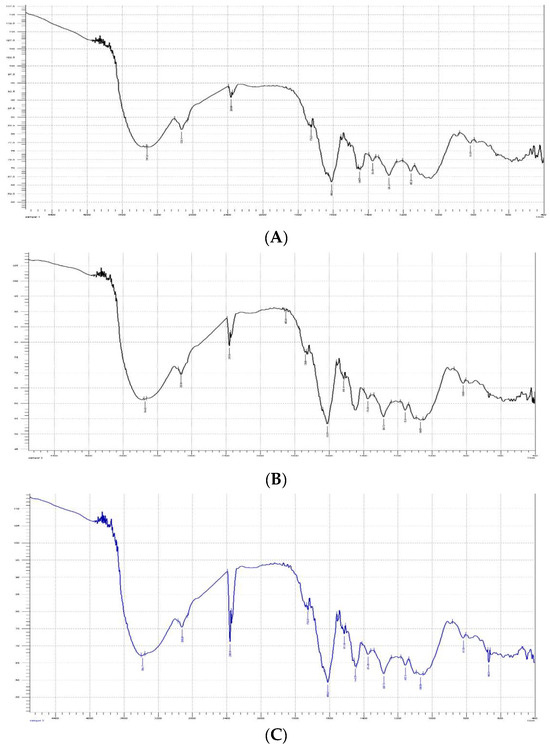
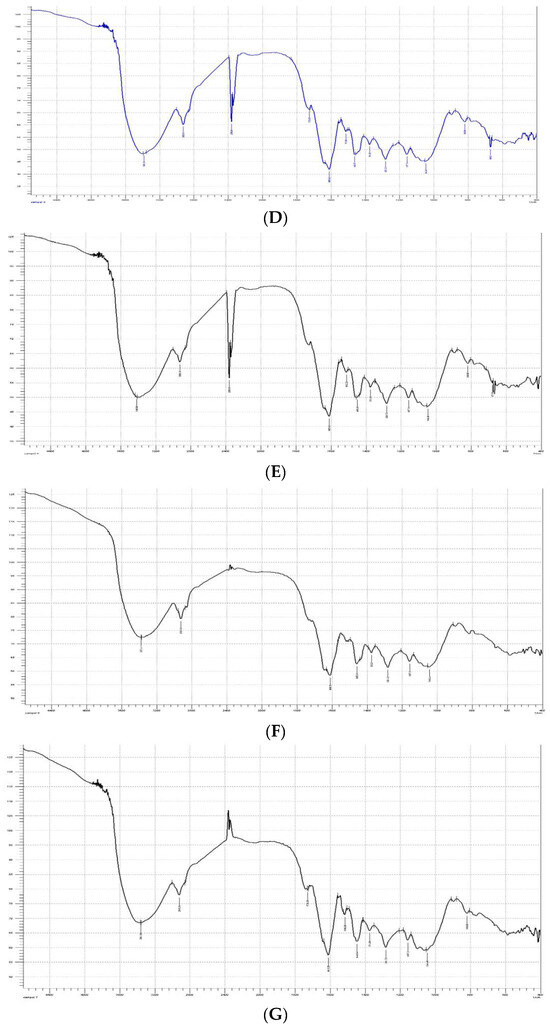
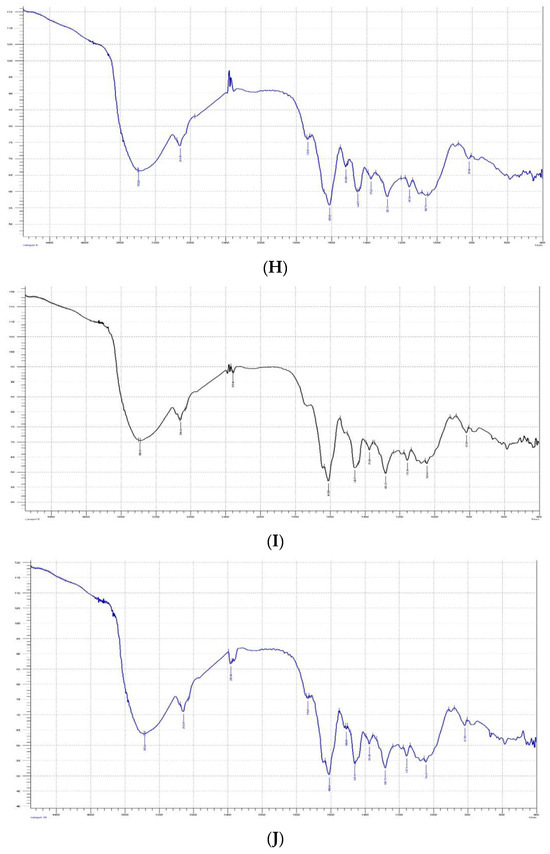
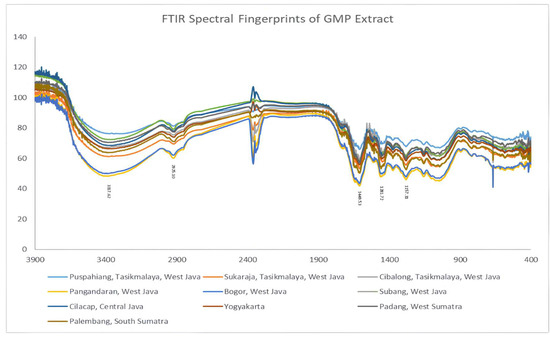
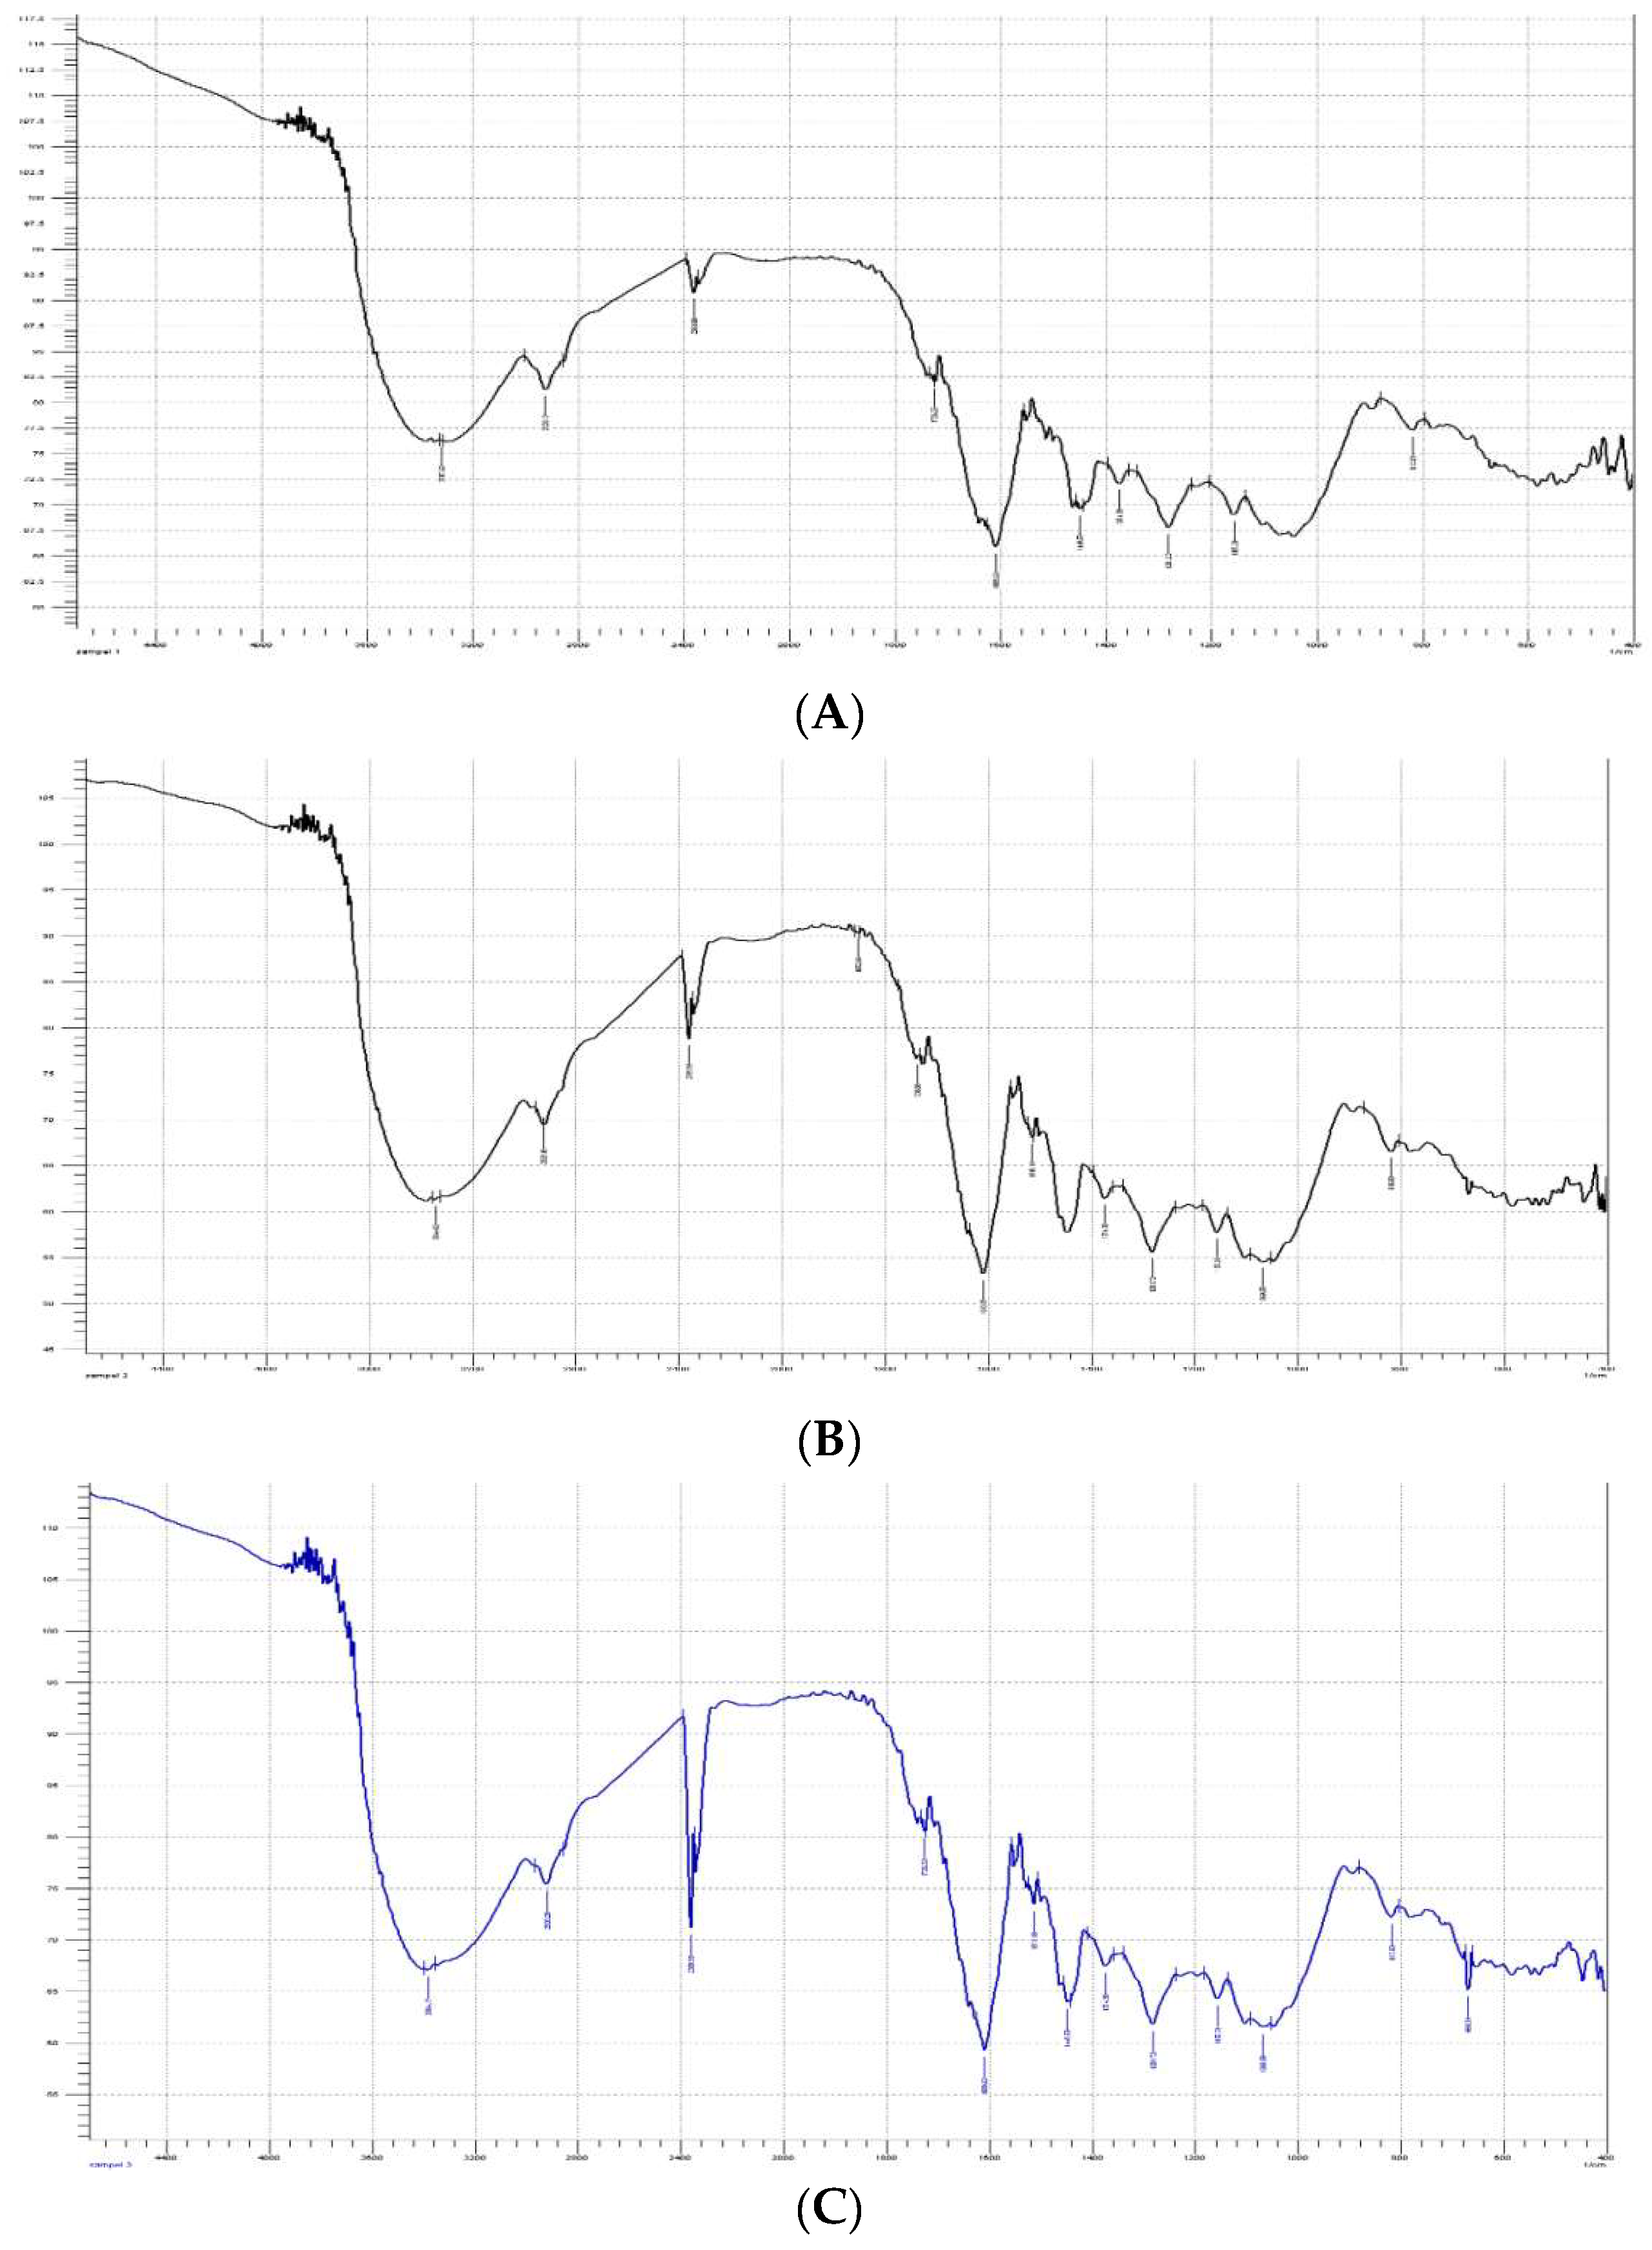
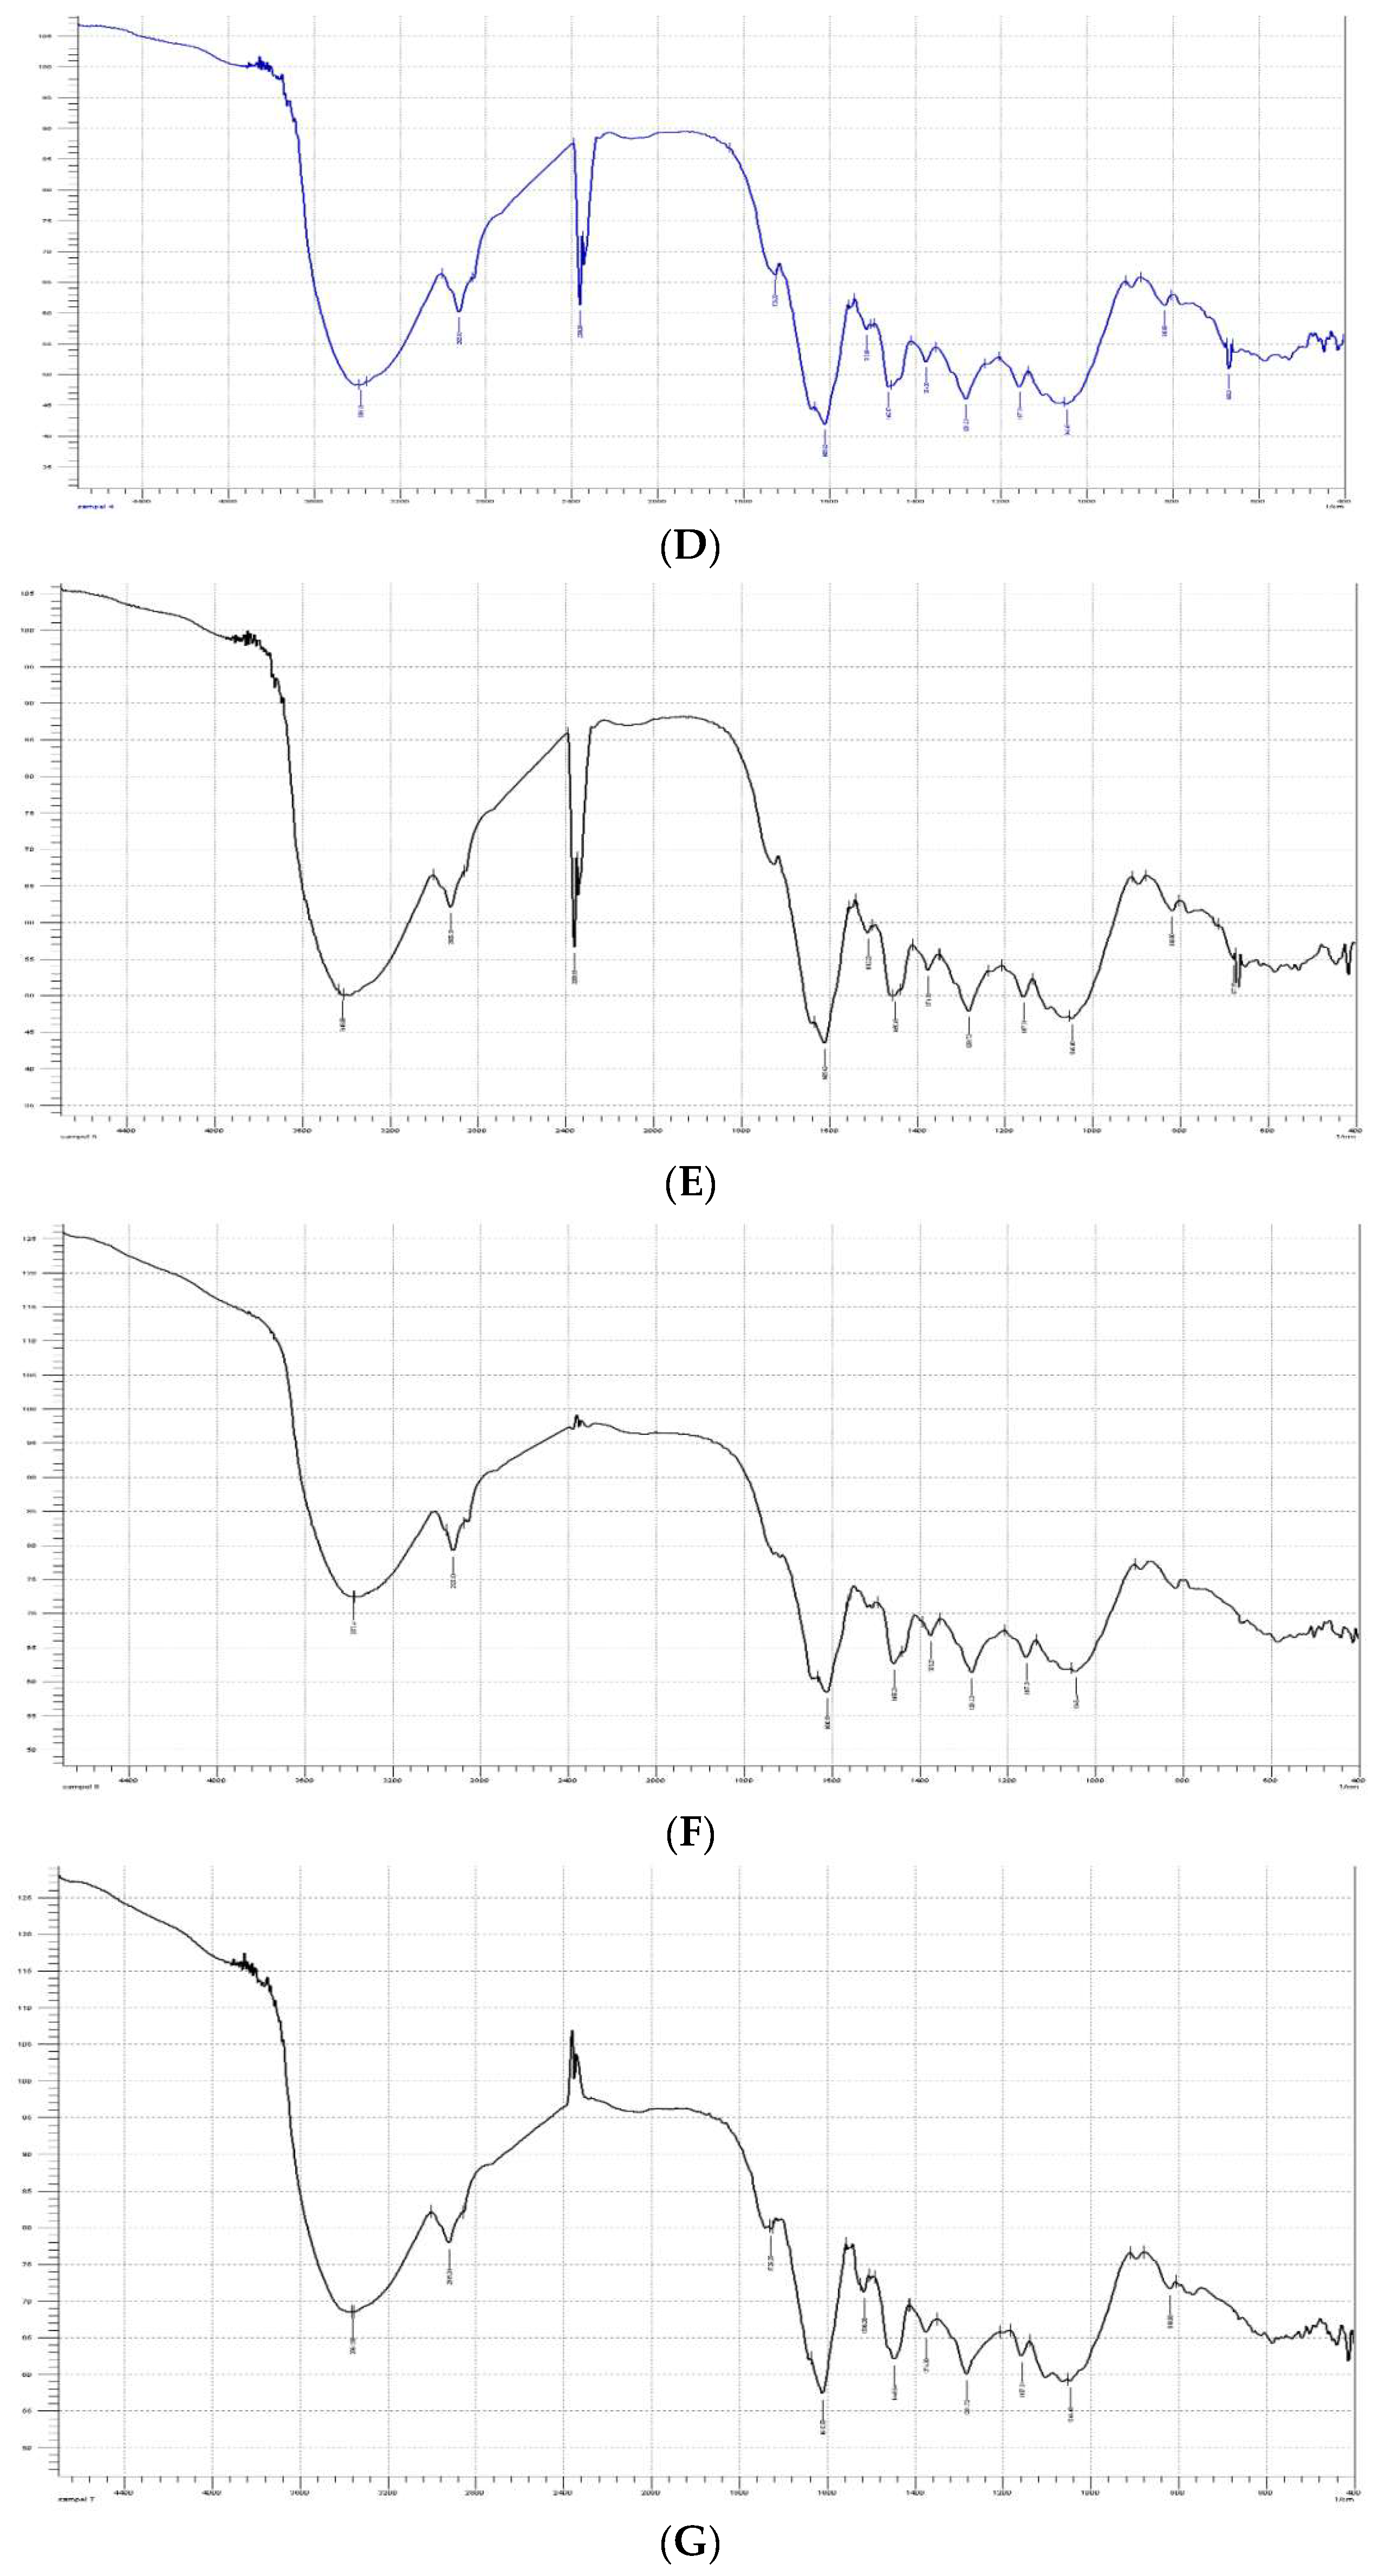
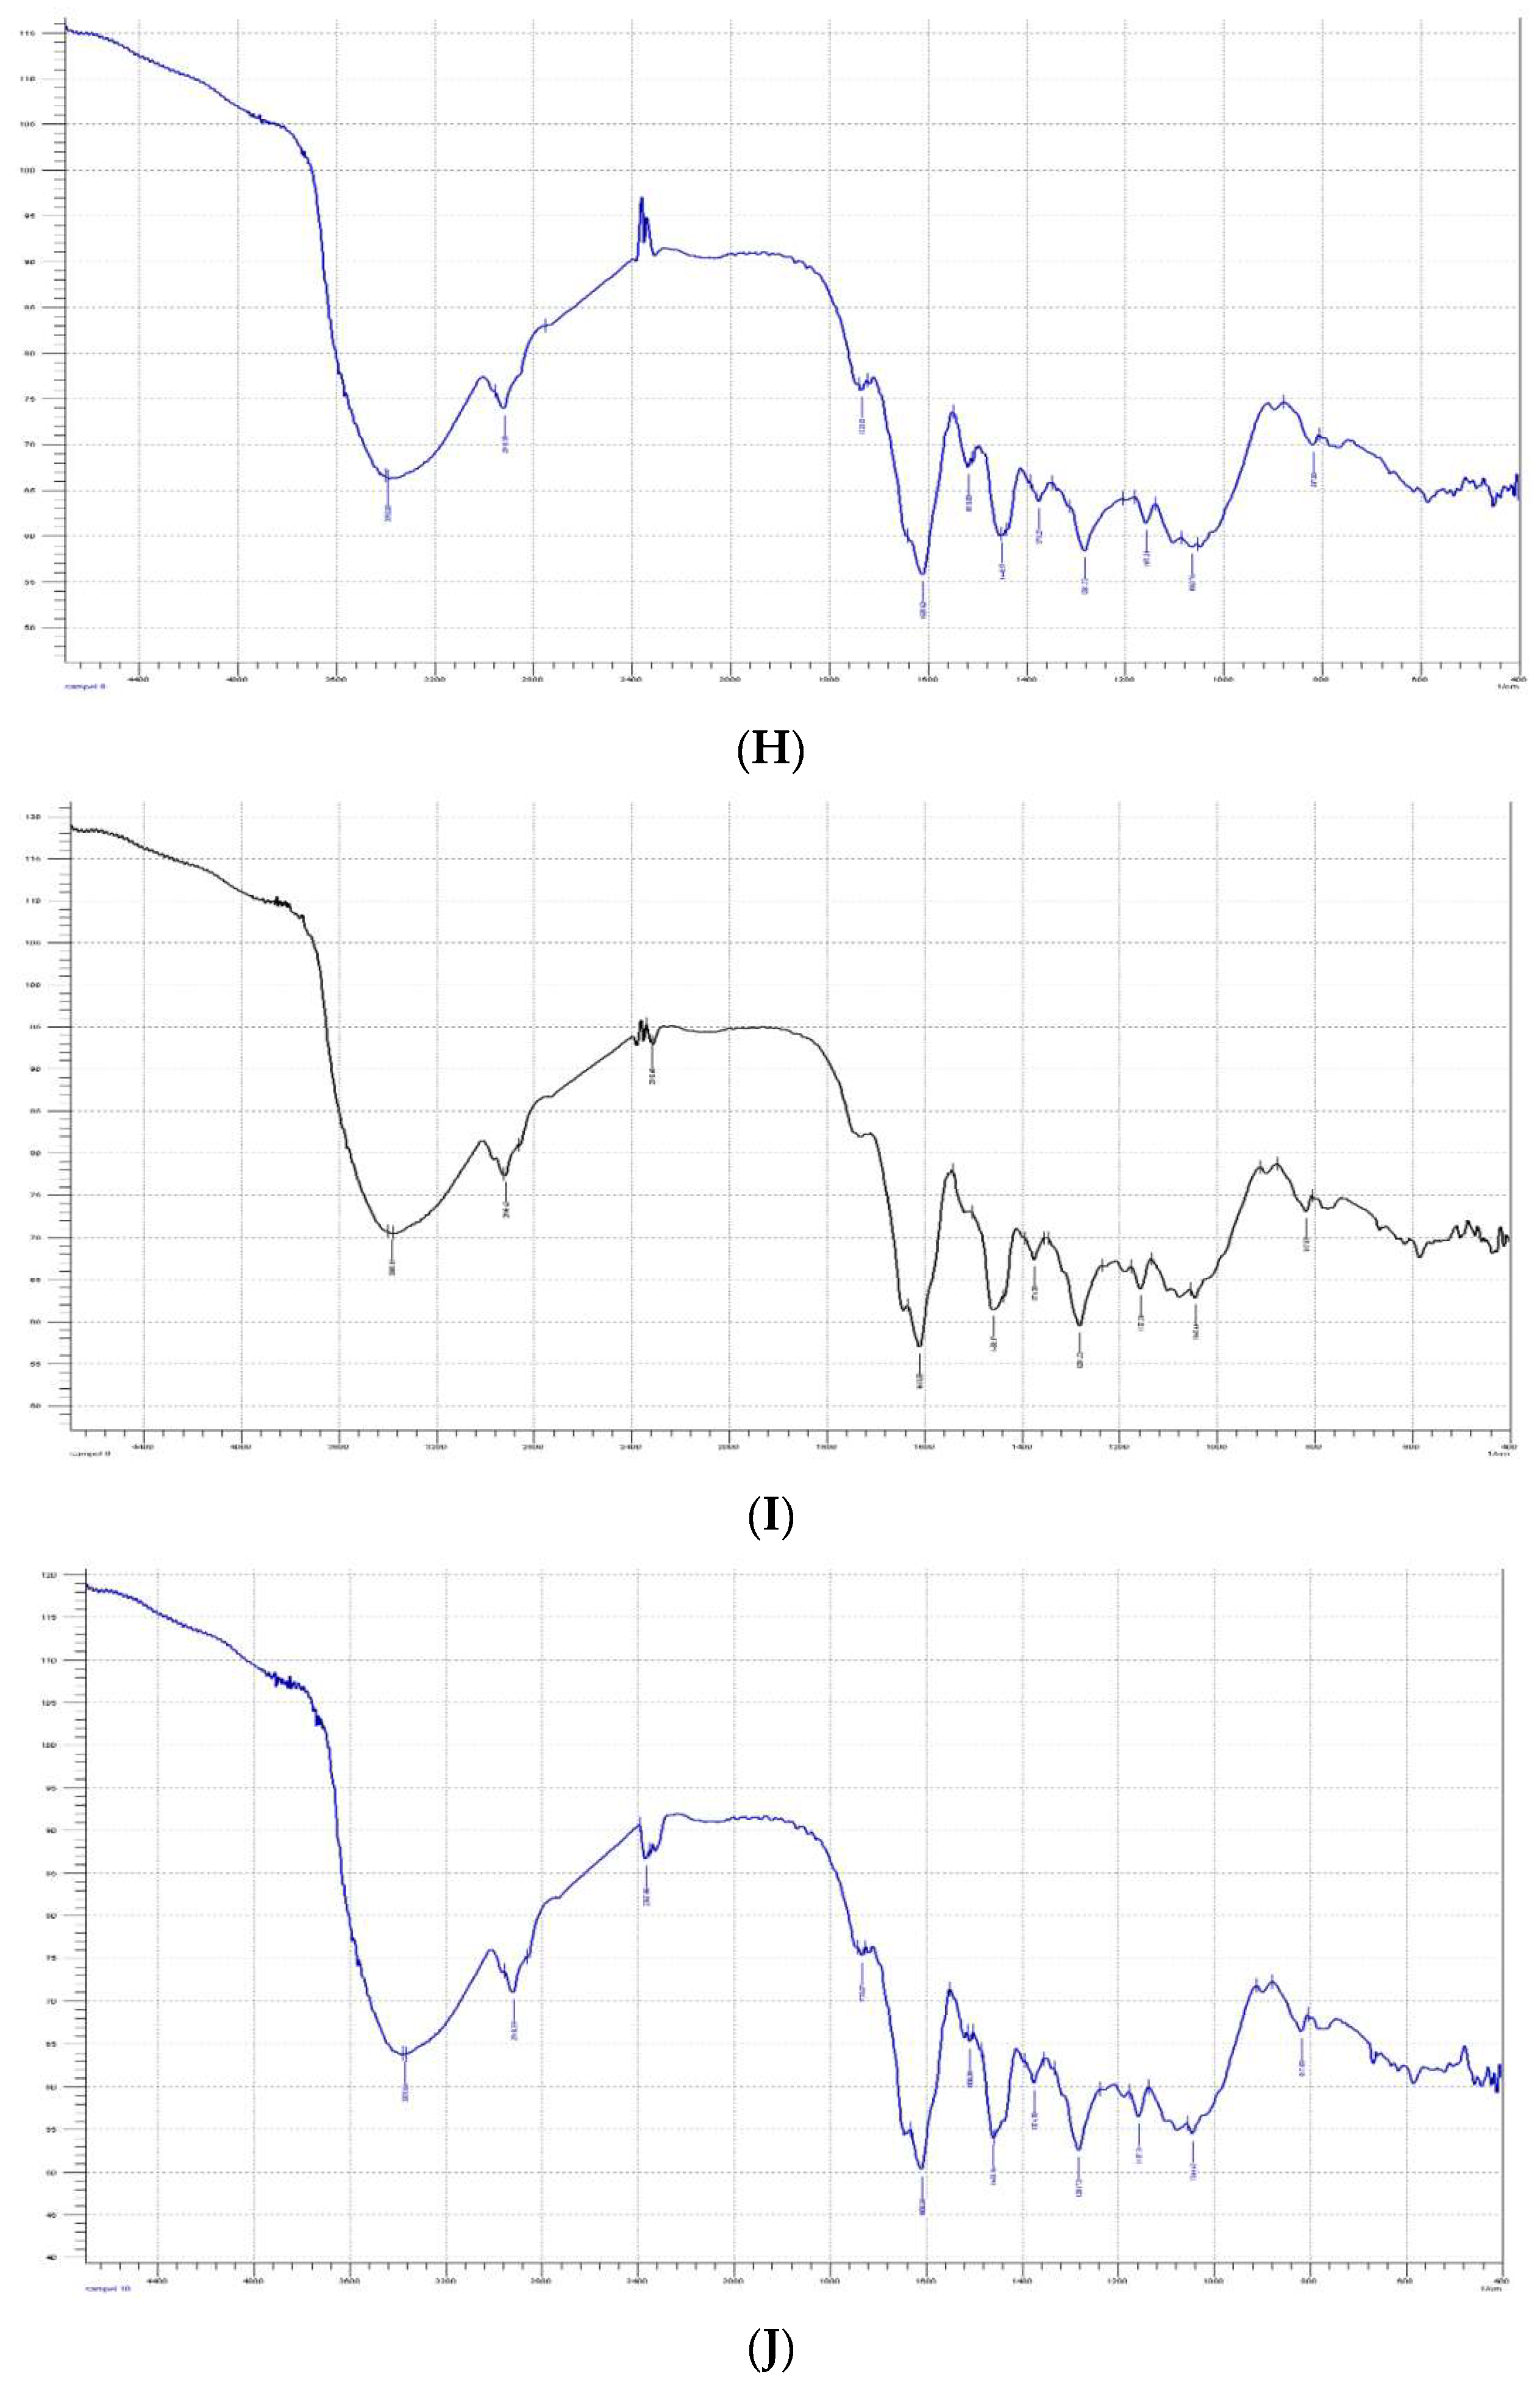
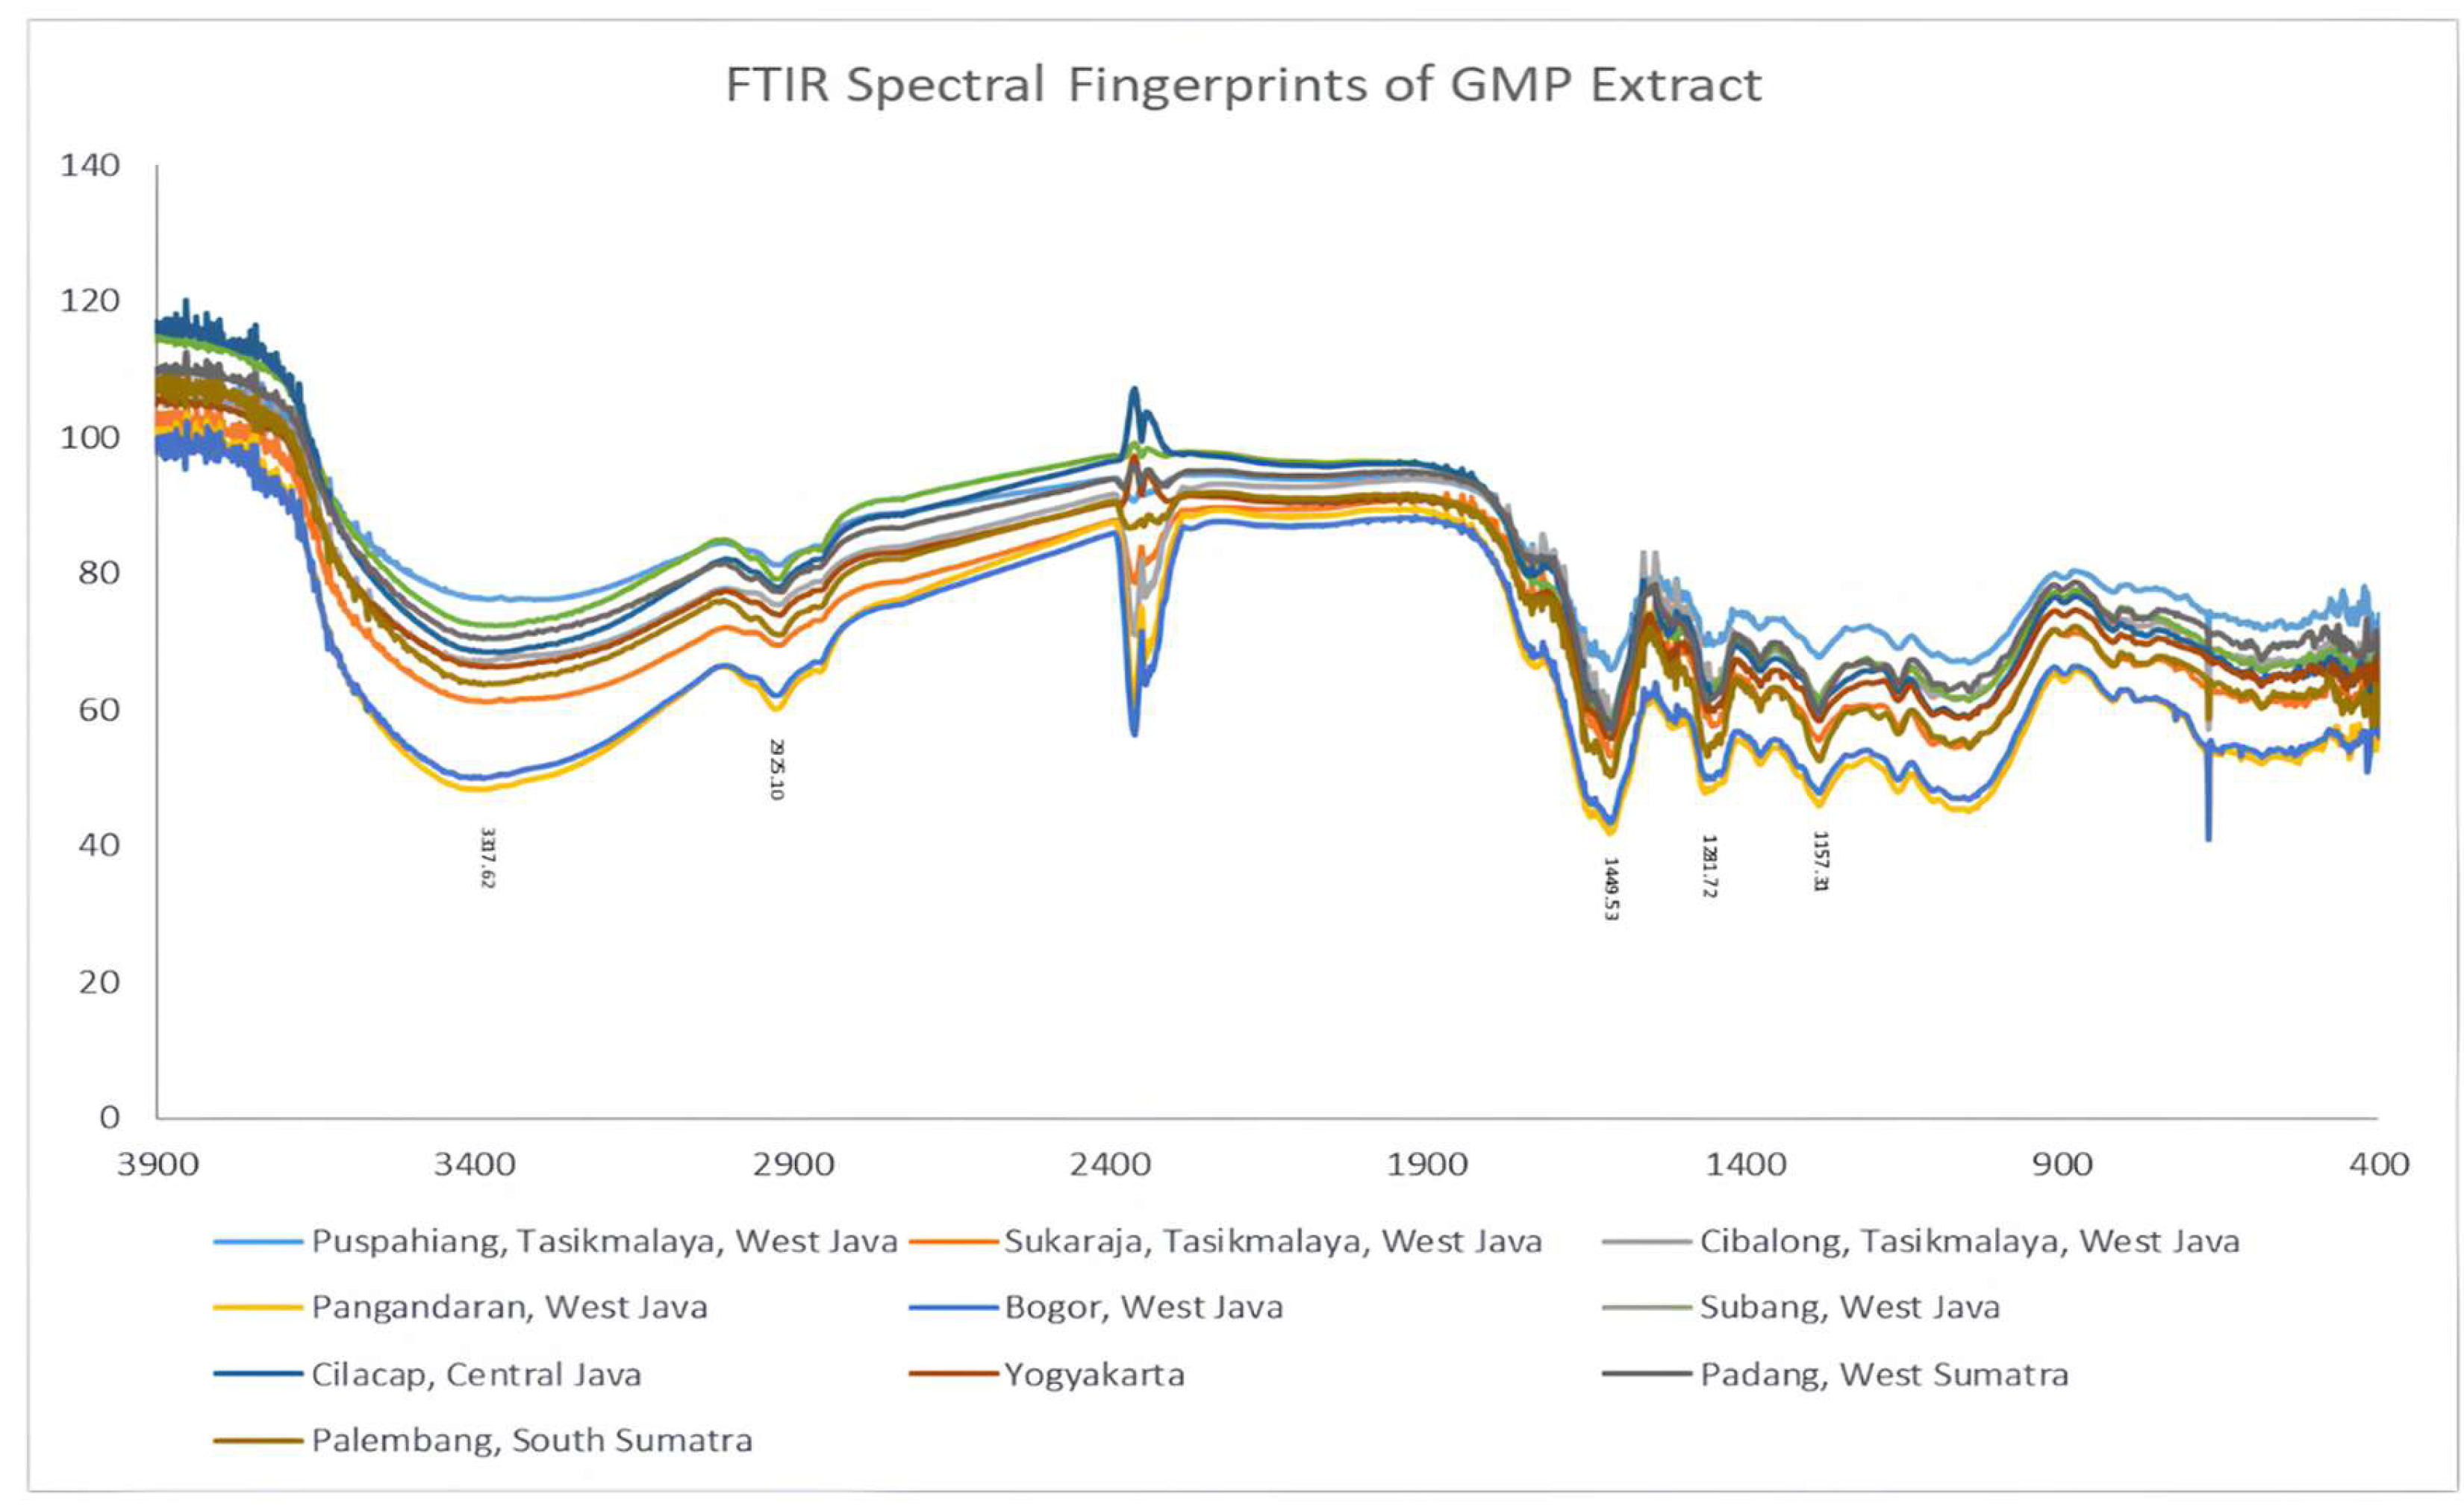
FTIR (Fourier transform infrared) spectroscopy was applied as a complementary analytical technique to obtain comprehensive chemical fingerprints of the GMP extracts. The FTIR spectral profiles recorded for all samples are presented in Figure 3. The spectra revealed complex transmittance patterns across the wavenumber range of 650–4000 cm−1. Such spectral complexity reflects the chemically diverse composition of GMP extract. Several characteristic absorption bands corresponding to functional groups associated with xanthone derivatives were consistently observed among samples. A broad transmittance band around 3400 cm−1 was assigned to the stretching vibration of hydroxyl groups. These hydroxyl groups are commonly present in phenolic compounds and xanthone derivatives. Transmittance bands located near 1600–1650 cm−1 correspond to carbonyl stretching and aromatic C=C vibrations. These signals are typical for aromatic compounds present in GMP. Additional peaks detected within the fingerprint region between 1400 and 1000 cm−1 were attributed to C–O stretching vibrations. These vibrations originate from phenolic, ether, and ester functional groups frequently found in polyphenolic structures. The presence of these bands confirms the abundance of oxygenated aromatic compounds in the extracts. Xanthone derivatives such as α-mangostin contain several hydroxyl and carbonyl functional groups that contribute to these spectral features. The consistency of these functional group signals indicates that the main chemical framework of the GMP extract remains similar among samples. These spectral observations confirm that FTIR spectroscopy can effectively characterize the functional group composition of GMP extract.
Figure 3.
FTIR spectral fingerprints of GMP extract from ten geographical locations in Indonesia: Puspahiang (A); Sukaraja (B); Cibalong (C); Pangandaran (D); Bogor (E); Subang (F); Cilacap (G); Yogyakarta (H); Padang (I); Palembang (J).
Although the general spectral patterns were similar among the analyzed extracts, differences in transmittance intensity were clearly observed. The FTIR spectral characteristics and their relationship with α-mangostin content are summarized in Table 2. Extracts obtained from Cilacap exhibited strong transmittance bands in the regions of 1600–1650 cm−1 and 1200–1300 cm−1. These bands correspond to aromatic and C–O functional groups associated with xanthone structures. The strong absorption observed in this sample is consistent with its highest α-mangostin concentration. The Bogor extract also showed pronounced transmittance around 3400 cm−1 and 700 cm−1. These bands indicate the presence of hydroxyl and aromatic functional groups in relatively high abundance. The Puspahiang sample demonstrated strong transmittance at both 1600 cm−1 and 3400 cm−1. Such spectral features indicate a high presence of phenolic and aromatic compounds. Samples from Yogyakarta and Palembang exhibited moderate transmittance intensity in the aromatic and fingerprint regions. These spectral features correspond to intermediate levels of α-mangostin detected in the chromatographic analysis. The Cibalong and Subang extracts displayed moderate to weak transmittance in several spectral regions. These weaker signals indicate a lower abundance of xanthone-related functional groups compared with samples from Cilacap and Bogor. The spectral intensity differences therefore provide qualitative evidence of variation in phytochemical composition among the samples [25,37].
Table 2.
FTIR spectral characteristics and corresponding α-mangostin content in ethanolic GMP extracts from different geographical locations.
In contrast, samples collected from Pangandaran, Sukaraja, and Padang exhibited relatively weak absorption patterns across several important spectral regions. The Pangandaran extract showed flattened absorption within the fingerprint region. Such spectral characteristics suggest a lower concentration of polar functional groups associated with phenolic compounds. The Sukaraja sample displayed weak absorption throughout most spectral regions. This spectral profile indicates a relatively low abundance of aromatic and hydroxyl functional groups. The Padang sample exhibited minimal absorption at 1600 cm−1 and 700 cm−1. These bands correspond to aromatic ring vibrations and therefore indicate reduced aromatic compound content. The weaker spectral signals observed in these samples correspond well with their lower α-mangostin concentrations. The relationship between FTIR spectral intensity and α-mangostin levels demonstrates that functional group abundance influences spectral patterns. Such correlations highlight the usefulness of FTIR spectroscopy as a rapid qualitative tool for assessing phytochemical variability. The method allows rapid screening of chemical composition without requiring extensive sample preparation. FTIR fingerprinting can therefore support preliminary evaluation of herbal raw materials. Differences in spectral intensity may serve as indicators of variations in bioactive compound content. These results demonstrate that FTIR spectroscopy provides valuable information regarding chemical differences among GMP extracts from various geographical origins. The technique complements chromatographic analysis by providing a holistic representation of functional group distribution in plant extracts.
3.4. Chemometric Discrimination of GMP Extract Using PCA Analysis
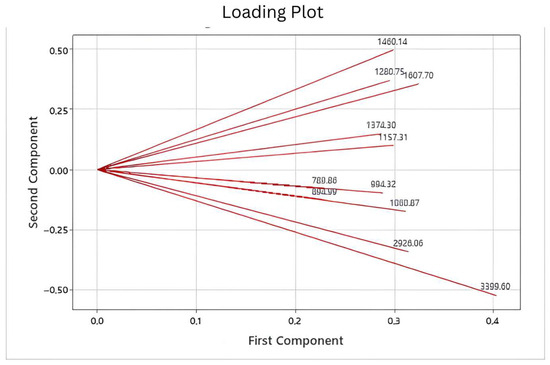
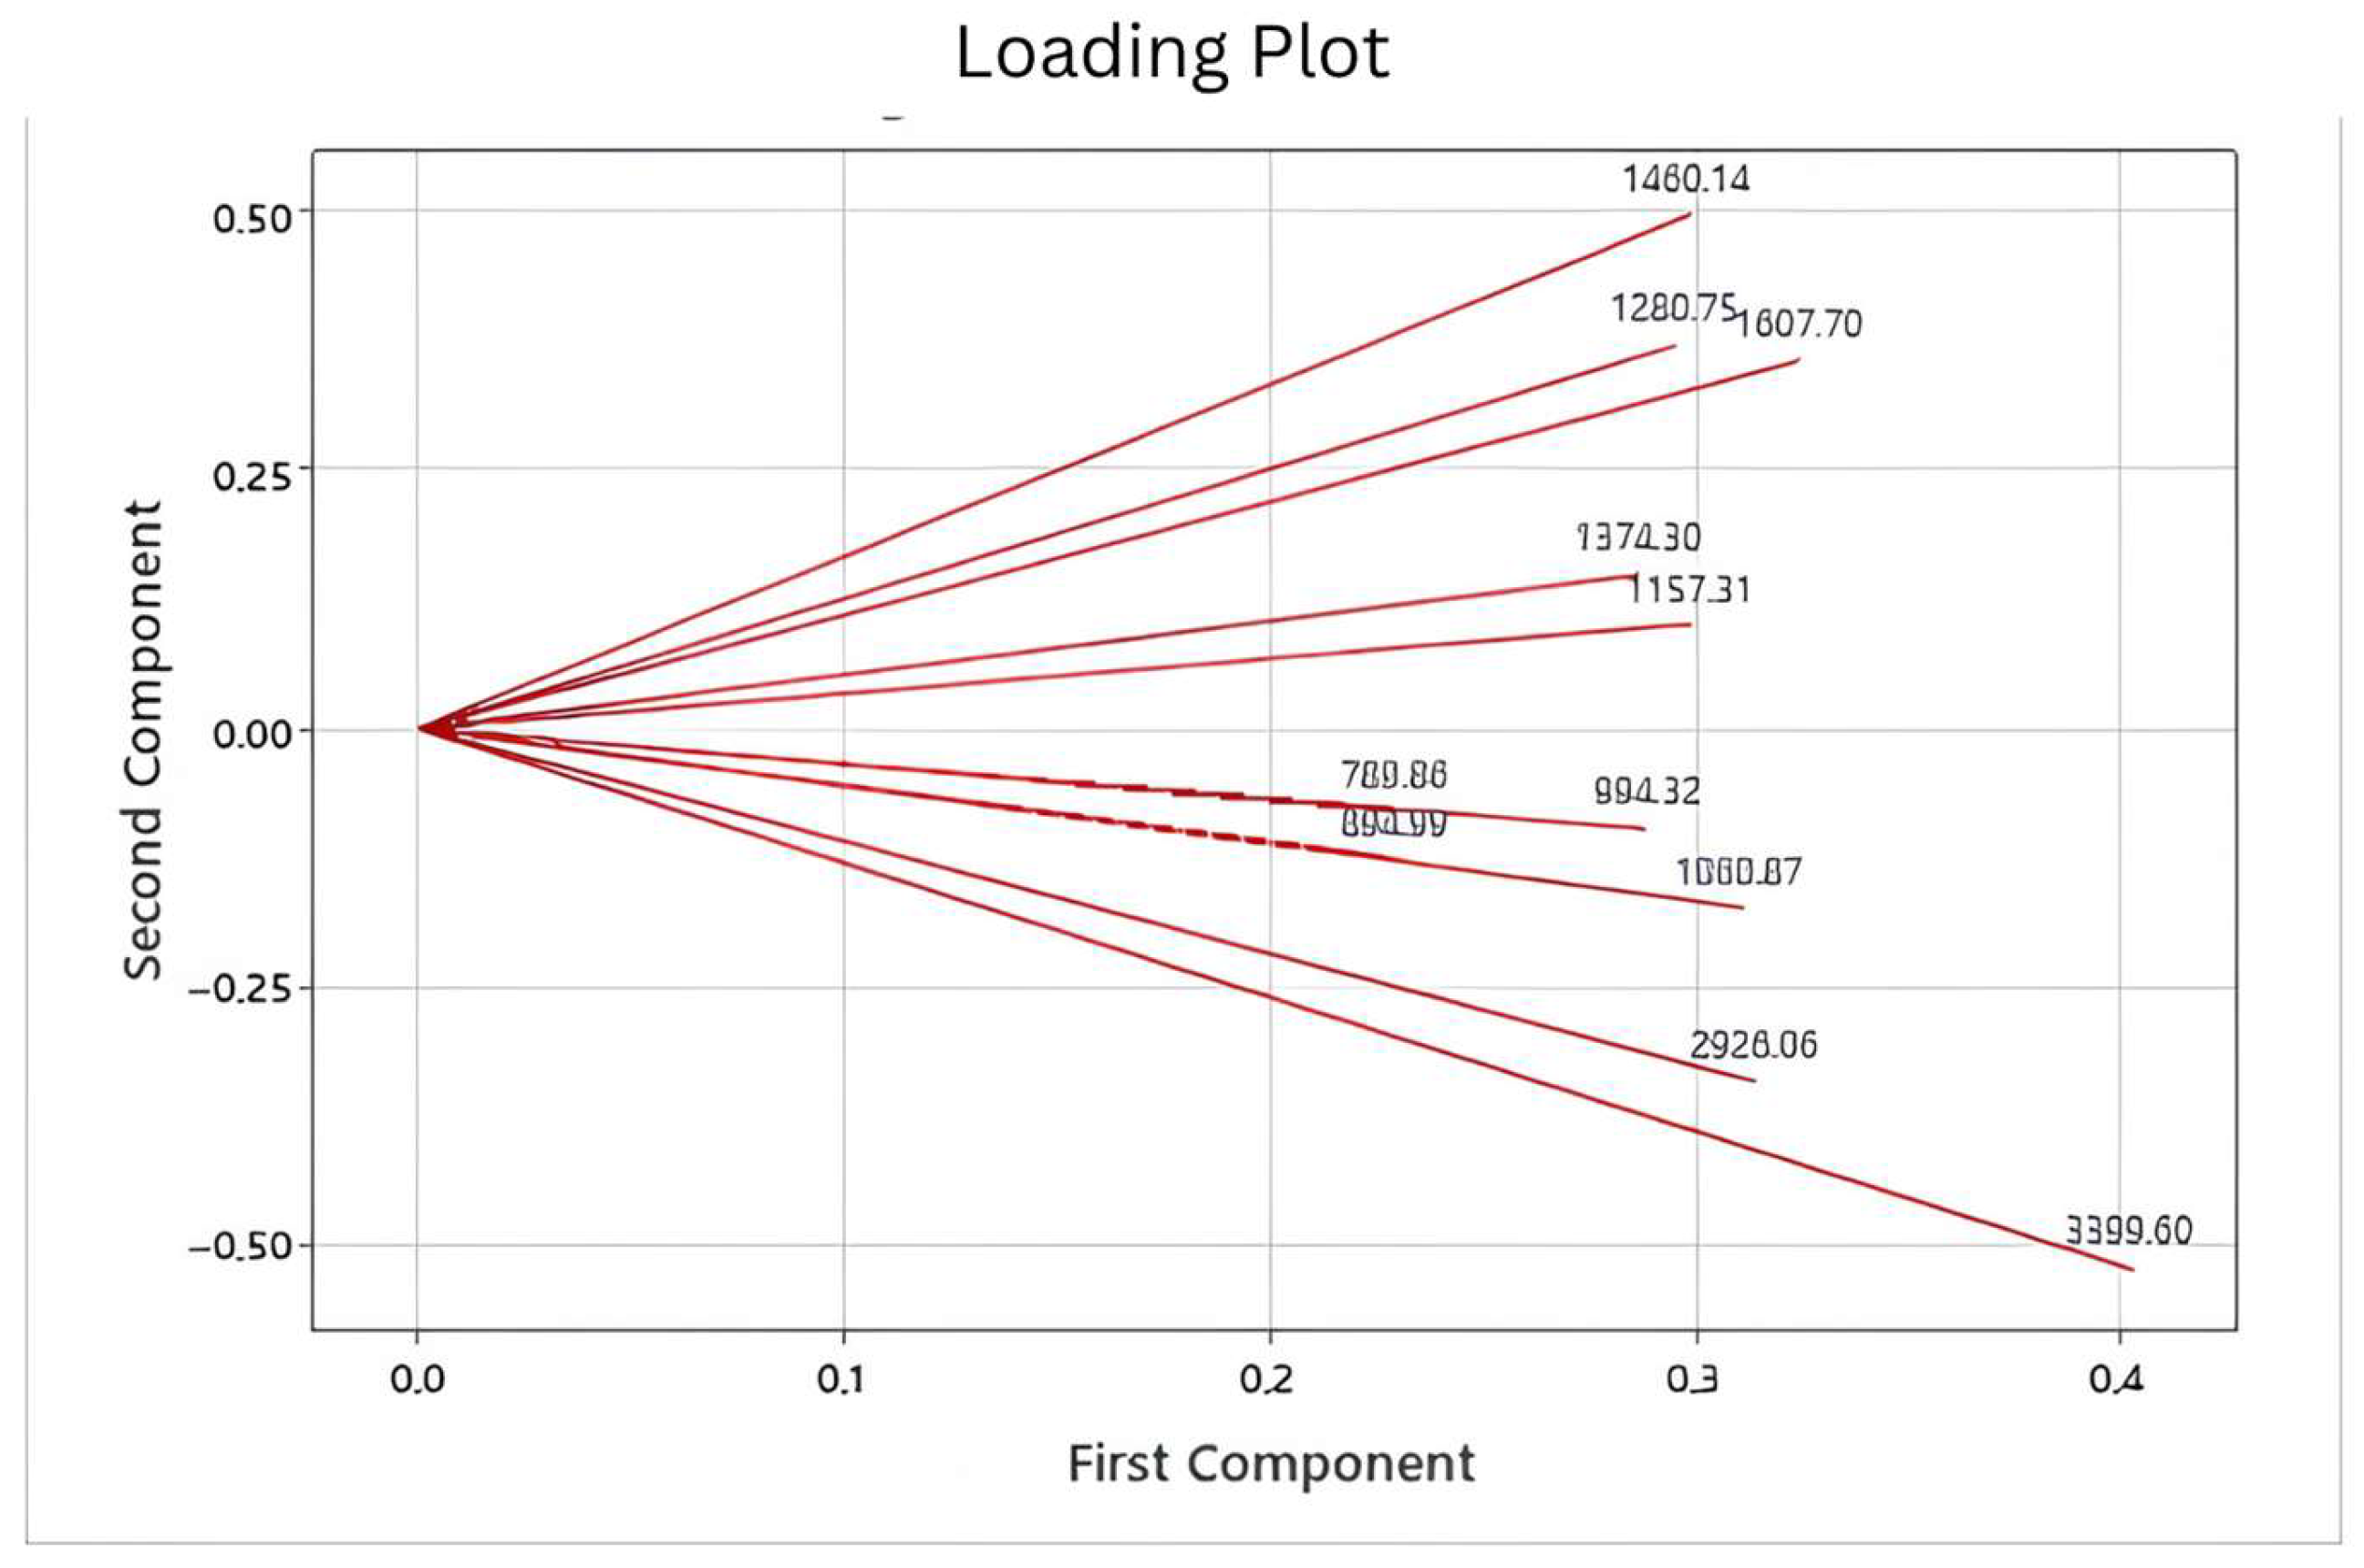
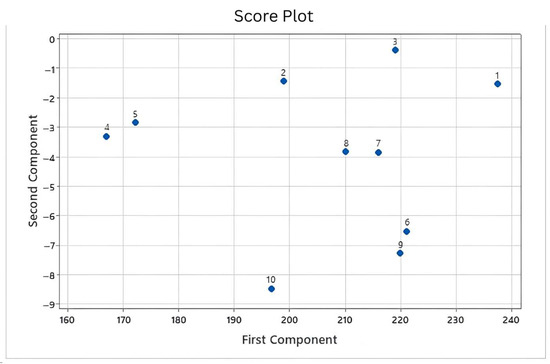
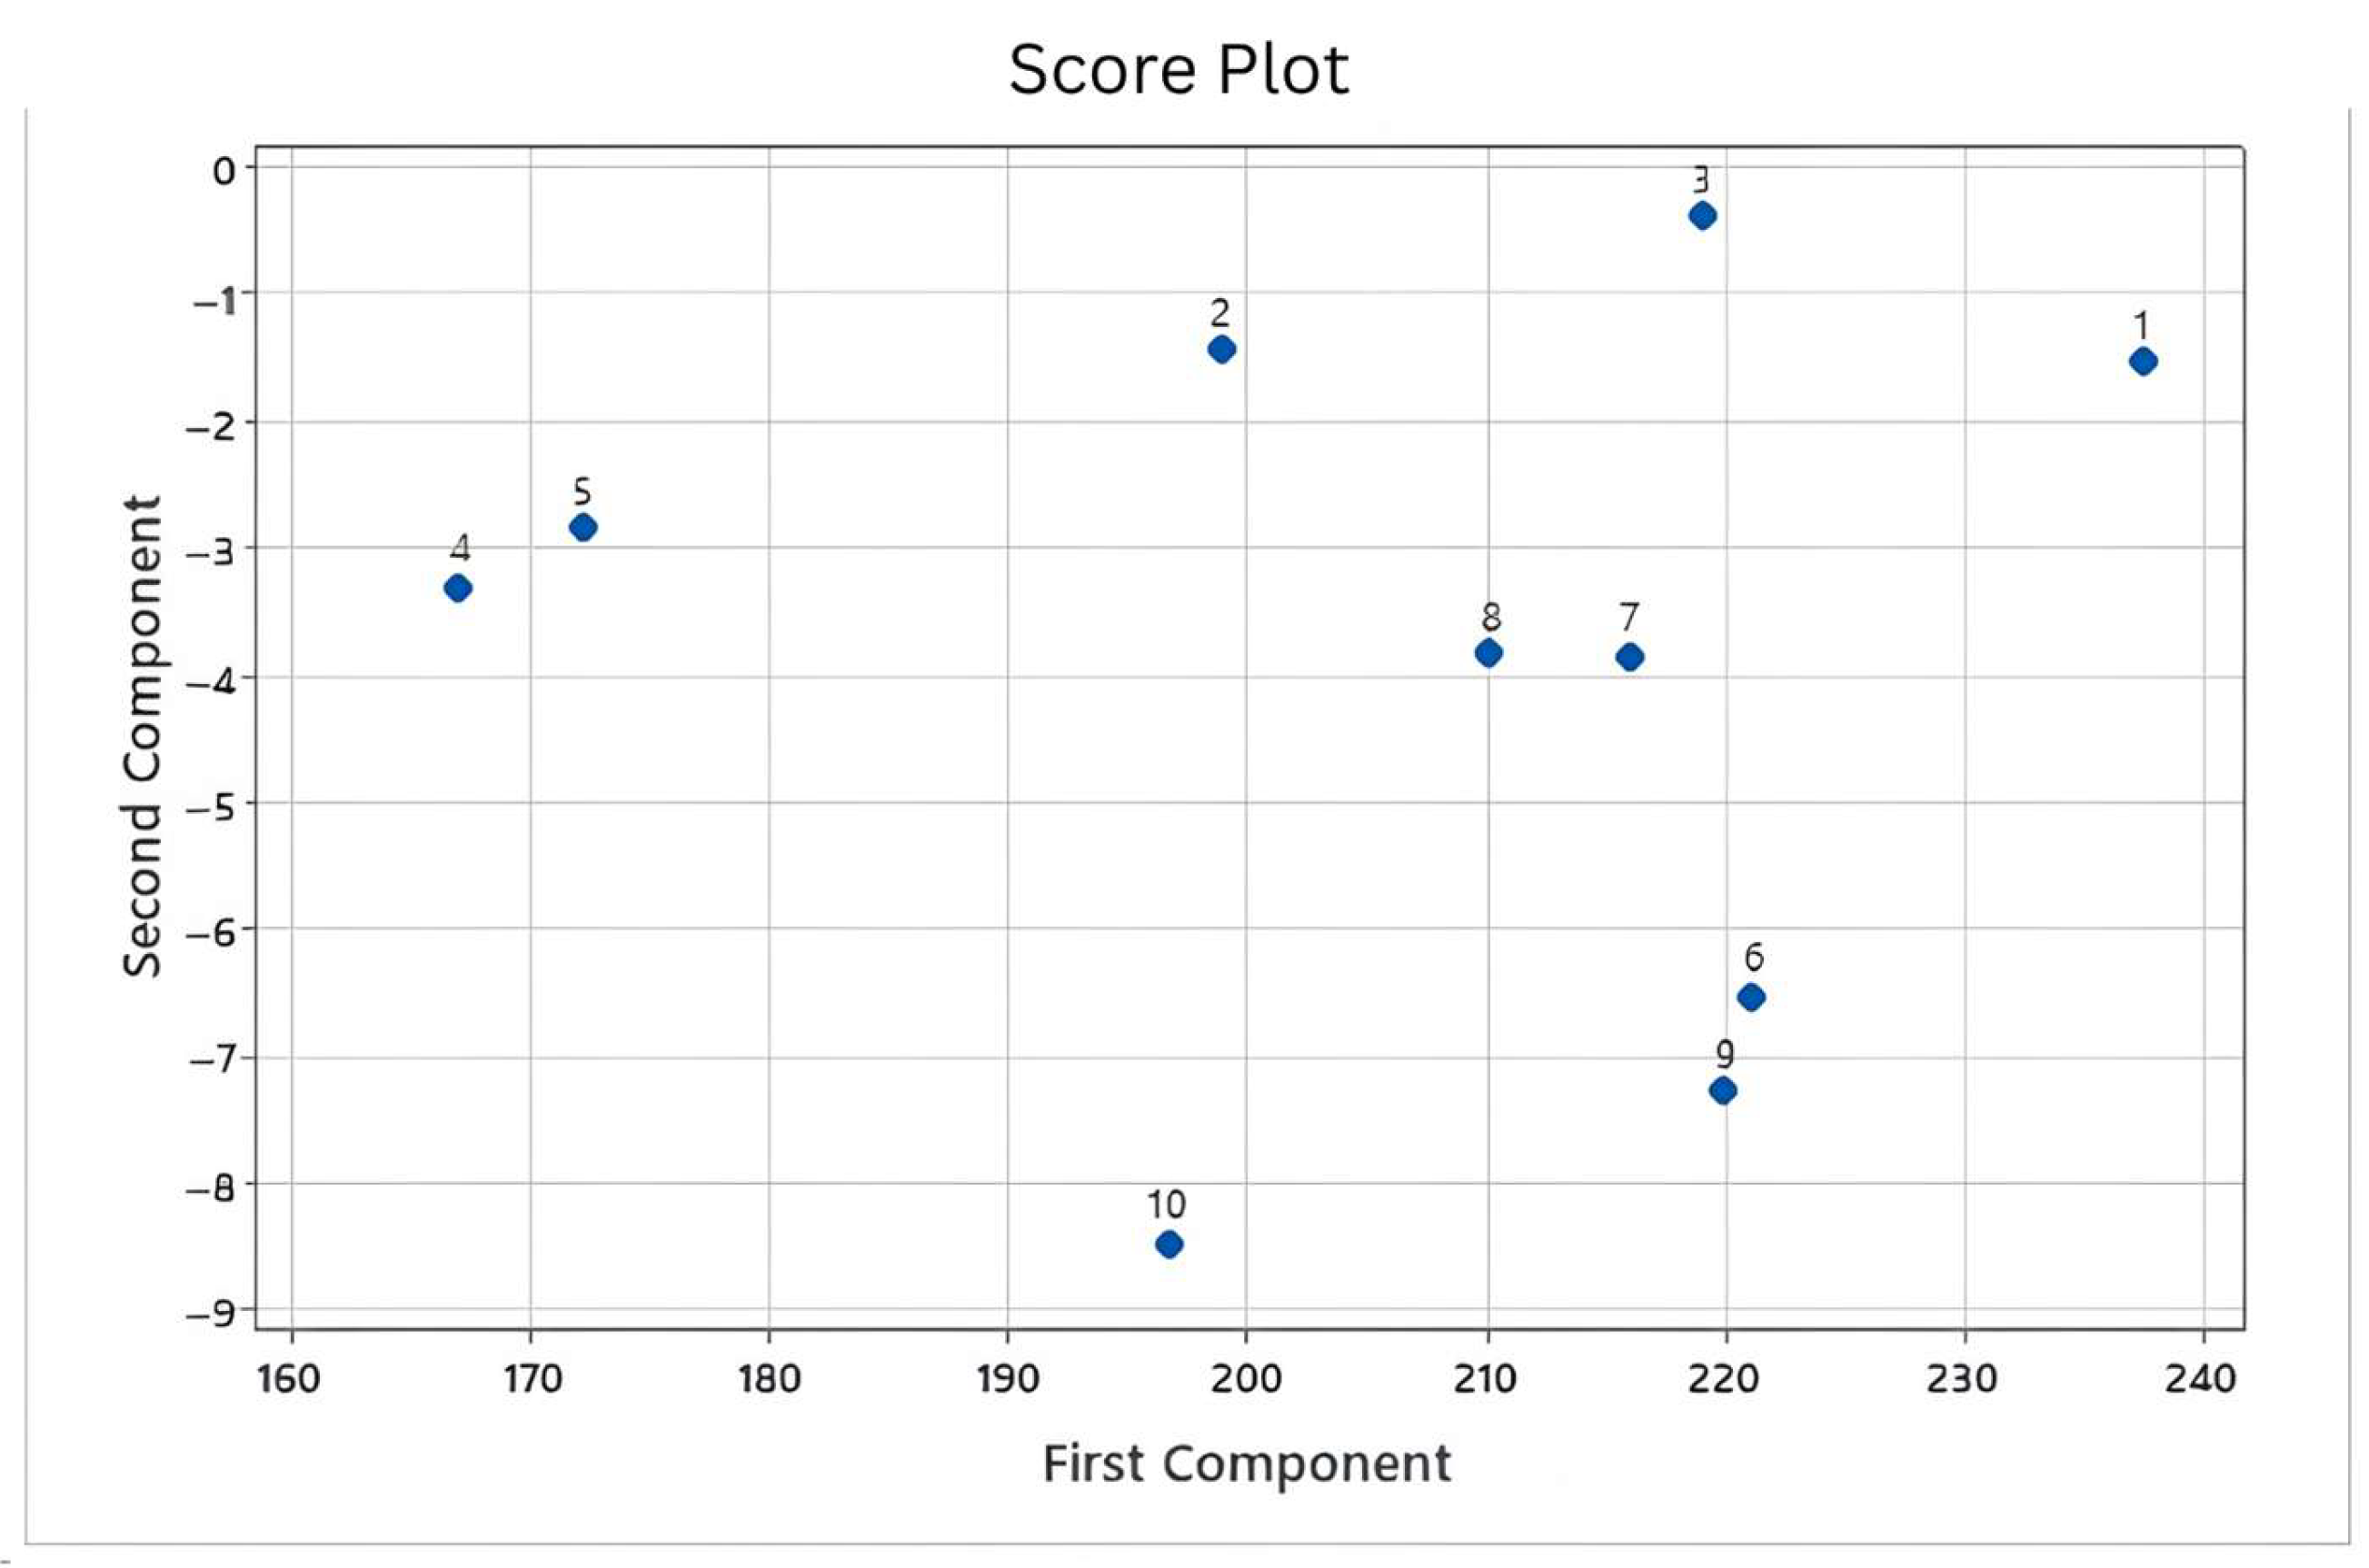
Principal component analysis (PCA) was applied as a chemometric approach to evaluate the multivariate relationships among GMP extracts based on their FTIR spectral data. PCA is widely used for unsupervised pattern recognition and sample classification in complex chemical datasets. The technique reduces the dimensionality of spectral variables while retaining the most significant information that explains data variability. In this study, PCA was performed using transmittance values obtained from multiple FTIR wavenumbers across the fingerprint region. The loading plot derived from the PCA model is presented in Figure 4. This plot illustrates the contribution of individual FTIR wavenumbers to the formation of the principal components. The principal component analysis (PCA) revealed that the first principal component (PC1) accounted for 97.9% of the total variance, while the second principal component (PC2) explained an additional 1.4%. Together, these two components captured 99.3% of the variance, indicating that the majority of the variability in the dataset can be effectively represented in a reduced two-dimensional space. This strong dominance of PC1 suggests that the underlying structure of the data is largely driven by a single latent factor, with PC2 contributing only marginally. Such results highlight the robustness of the dimensional reduction, as nearly all meaningful information is retained within the first two components. The distribution of loading vectors therefore highlights the functional groups that contribute most significantly to the chemical differentiation of GMP extract.
Figure 4.
PCA loading plot showing the contribution of FTIR wavenumbers to the discrimination of Garcinia mangosteen peel extracts.
The PCA score plot derived from the FTIR dataset is presented in Figure 5. This visualization illustrates the distribution of GMP extract samples within the multivariate PCA space. Each point in the plot represents an individual sample characterized by its FTIR spectral profile. The spatial arrangement of the points reflects similarities and differences in chemical composition among samples. Samples positioned close to one another exhibit similar spectral characteristics. Conversely, samples located farther apart indicate differences in their chemical fingerprints. Several samples formed small clusters within the PCA space. These clusters suggest that certain GMP extracts share comparable functional group compositions. Other samples were positioned at greater distances from the main clusters. Such separation indicates distinct spectral characteristics that may reflect differences in phytochemical composition. The PCA score distribution therefore reflects variations in chemical composition across sampling locations. This multivariate visualization provides a clear overview of the relationships among GMP extracts. The observed clustering pattern supports the interpretation that FTIR spectral data can effectively differentiate samples derived from different geographical origins.
Figure 5.
PCA score plot based on FTIR spectral data showing the clustering of Garcinia mangosteen peel extracts from different geographical locations: Puspahiang (1), Sukaraja (2), Cibalong (3), Pangandaran (4), Bogor (5), Subang (6), Cilacap (7), Yogyakarta (8), Padang (9) and Palembang (10).
The combined interpretation of score and loading plots provides deeper insight into the spectral variables responsible for sample discrimination. The loading vectors indicate which functional group regions influence the positioning of samples within the PCA space. Wavenumbers associated with hydroxyl, aromatic, and carbonyl functional groups appear to contribute strongly to the separation pattern. These functional groups are characteristic components of xanthone derivatives such as α-mangostin. Samples located in the direction of these loading vectors likely contain higher levels of phenolic and aromatic compounds. Conversely, samples positioned in opposite directions may contain lower concentrations of these functional groups. Such relationships demonstrate how multivariate analysis can connect spectral variables with chemical composition. The PCA model therefore provides an effective approach for identifying key spectral regions responsible for variation among samples. Chemometric analysis enhances the interpretability of FTIR spectral data by transforming complex datasets into visual patterns. This approach allows rapid identification of similarities and differences among herbal raw materials. Multivariate classification techniques such as PCA are widely used in phytochemical fingerprinting studies. They are particularly valuable for assessing the authenticity and quality of plant extracts. In the present analysis, PCA successfully revealed patterns of chemical variation among the GMP extracts. These results demonstrate that FTIR combined with chemometric analysis provides a powerful strategy for evaluating phytochemical variability. The integration of spectral fingerprinting and multivariate analysis therefore supports the discrimination and quality assessment of GMP extracts from different geographical locations.
4. Discussion
The comparison between FTIR spectral fingerprints and quantitative HPLC data revealed a clear relationship between characteristic absorption bands and the concentration of α-mangostin in the GMP extracts. Samples originating from regions with higher α-mangostin content, particularly Cilacap and Bogor, consistently displayed stronger absorption intensities in spectral regions associated with hydroxyl and carbonyl functional groups. These functional groups are intrinsic to the xanthone skeleton of α-mangostin and are responsible for the distinct vibrational transitions observed in infrared spectra. Previous FTIR studies of mangosteen extracts reported prominent peaks around 3414 cm−1 corresponding to O–H stretching. Such spectral features are consistent with the chemical structure of α-mangostin, which contains multiple hydroxyl groups and conjugated carbonyl moieties within its tricyclic aromatic framework. Xanthone derivatives such as α-, β-, and γ-mangostin are well documented as the dominant secondary metabolites present in mangosteen pericarp. These compounds contribute significantly to the pharmacological activity of the plant, including antioxidant, antimicrobial, and anticancer properties [32]. Hence, α-mangostin has been widely used as a chemical marker compound during the standardization of mangosteen extracts. In contrast, extracts from Padang and Sukaraja exhibited weaker absorption intensities within these diagnostic FTIR regions. The reduced spectral intensity corresponds with the lower α-mangostin concentrations measured by chromatographic analysis. This observation supports the hypothesis that FTIR spectral intensity reflects the relative abundance of xanthone derivatives in the extract matrix. Previous research has also demonstrated strong correlations between FTIR absorbance values and α-mangostin concentrations determined using chromatographic techniques [3]. Therefore, FTIR spectroscopy can provide valuable preliminary insights into the phytochemical composition of GMP extract. Although FTIR does not directly quantify compounds with the same precision as chromatographic methods, it can effectively capture chemical fingerprints associated with bioactive metabolites [29]. The integration of FTIR fingerprinting with targeted chromatographic analysis thus offers a comprehensive analytical strategy for evaluating the chemical composition of GMP extract.
PCA indicated that FTIR spectral datasets contained variability that allowed descriptive differentiation of GMP extracts obtained from different regions. The dominance of the first principal component suggests that a common spectral pattern is shared among samples, reflecting the overall phytochemical composition of mangosteen pericarp. Meanwhile, the second principal component (PC2) and the third principal component (PC3) provide additional discriminatory information that helps distinguish subtle chemical variations among extracts. Chemometric approaches are particularly useful when dealing with FTIR spectra because these datasets contain hundreds of correlated variables. Multivariate statistical methods such as PCA enable dimensional reduction while preserving most of the chemical information embedded in the spectral data [38]. Previous studies have confirmed that FTIR combined with chemometric techniques such as PCA and cluster analysis can effectively classify mangosteen extracts according to their geographical origin. The clustering observed in the PCA score plot indicates that samples with similar chemical compositions tend to group together. This clustering behavior may reflect variations in metabolite distribution potentially influenced by environmental factors such as soil composition and climate. The absence of extreme outliers in the dataset suggests that the analytical measurements were stable and reproducible. Reliable clustering patterns also indicate that the FTIR spectral data capture meaningful chemical differences among samples. These results reinforce the importance of combining spectroscopy with chemometric analysis when evaluating complex herbal matrices. However, the discriminatory capability of FTIR models can be further improved through spectral preprocessing methods [39]. Techniques such as baseline correction, normalization, and derivative transformation can enhance signal resolution and reduce noise. In addition, supervised chemometric models such as partial least squares discriminant analysis may provide more precise classification of mangosteen extracts. These advanced multivariate techniques allow the identification of key spectral variables that contribute most strongly to sample differentiation. Therefore, chemometric analysis significantly enhances the interpretative power of FTIR spectroscopy in natural product research.
The integration of FTIR spectroscopy with HPLC analysis provides complementary analytical insights for evaluating the chemical quality of GMP extract. HPLC enables accurate quantification of α-mangostin, which is widely recognized as the primary bioactive marker compound in mangosteen pericarp. FTIR spectroscopy, on the other hand, provides a rapid and non-destructive method for assessing the overall chemical fingerprint of plant extracts. The combination of these techniques therefore addresses a critical challenge in herbal medicine standardization [40]. Accurate quantification ensures compliance with quality standards, while fingerprint analysis enables rapid screening of raw materials. Analytical validation studies have shown that HPLC methods using photodiode array detectors provide highly sensitive quantification of α-mangostin with excellent linearity and low detection limits. At the same time, spectroscopic fingerprinting provides a holistic view of the chemical composition of plant extracts. This dual analytical approach enhances reliability in phytochemical characterization. The geographical variation in α-mangostin content observed in this study also highlights the influence of environmental and agricultural factors on metabolite accumulation. Mangosteen rind is known to contain abundant xanthones and other phenolic compounds whose levels can vary depending on extraction methods and cultivation conditions [41]. Regions such as Cilacap, Bogor, and Puspahiang appear to represent promising sources of high-quality GMP raw materials as reported previously [7]. Selecting raw materials from these regions may therefore improve the consistency and efficacy of mangosteen-based herbal products. The application of geographic phytochemical mapping can also strengthen traceability within herbal supply chains. Furthermore, integrating FTIR fingerprinting into routine quality control workflows could significantly reduce analysis time during raw material screening. HPLC analysis can subsequently be applied as a confirmatory method for precise quantification. Thus, this integrated analytical strategy provides a robust framework for the standardization of GMP extract and may serve as a model for quality control of other medicinal plant materials.
5. Conclusions
This study demonstrates that the combined application of Fourier transform infrared (FTIR) spectroscopy and high-performance liquid chromatography (HPLC) provides a robust analytical approach for evaluating the chemical characteristics of GMP extracts from different geographical regions. FTIR analysis revealed prominent absorption bands corresponding to hydroxyl and carbonyl functional groups that are structurally associated with xanthone compounds, particularly α-mangostin. The spectral regions around approximately 3317 cm−1 and 1157 cm−1 showed notable differences in absorption intensity among samples, reflecting variations in the concentration of phenolic and xanthone-related compounds. Quantitative HPLC analysis showed variation in α-mangostin levels among the evaluated extracts. These differences suggest possible geographical patterns in phytochemical composition, though the descriptive design limits firm conclusion. Extracts from Cilacap and Bogor showed higher α-mangostin concentrations compared with samples from Padang and Sukaraja, which exhibited relatively lower values. These differences were consistent with the FTIR spectral intensity patterns observed in the functional group regions associated with α-mangostin. The correlation between spectral fingerprint characteristics and chromatographic quantification indicates that FTIR absorbance intensity can reflect relative variations in xanthone abundance. Principal component analysis demonstrated that the FTIR dataset contained sufficient variance to classify the extracts based on their chemical profiles. The first principal component explained the largest proportion of spectral variability, while additional components provided further discrimination among the samples. The clustering patterns observed in the PCA score plot indicate that samples with similar phytochemical compositions tended to group together according to their spectral characteristics. The absence of outliers in the chemometric model indicates that the FTIR spectral dataset was stable and suitable for multivariate interpretation. The integration of FTIR fingerprinting with chemometric analysis therefore enables rapid classification of GMP extracts derived from different regions. HPLC analysis simultaneously provides precise quantification of α-mangostin, which functions as an important bioactive marker compound for mangosteen extract standardization. The complementary use of these analytical techniques enables efficient screening of raw materials while maintaining reliable chemical characterization. The findings suggest that GMP obtained from regions such as Cilacap and Bogor may provide raw materials with a relatively higher α-mangostin content. However, this observation is based on descriptive comparison and should be confirmed with boarder replicated studies.
Supplementary Materials
The following supporting information can be downloaded at https://drive.google.com/drive/folders/1veFRAD-ZoYFYpQ4BZNGl2x6g0oZdw18z (accessed on 7 April 2026).
Author Contributions
All authors contributed to the study conception and research. Material preparation, data collection [S.R.N.E. and M.M.], HPLC and FTIR analysis were performed by [M.M., S.R.N.E. and A.N.H.] and chemometric analysis was performed by [S.R.N.E., A.R. and T.M.F.]. The draft of the manuscript was written by [M.M., S.R.N.E. and T.M.F.] and all authors commented on previous versions of the manuscript. All authors have read and agreed to the published version of the manuscript.
Funding
This publication charge is funded by Unpad through the Indonesian Endowment Fund for Education (LPDP) on behalf of the Indonesian Ministry of Higher Education, Science and Technology and managed under the EQUITY Program (Contract No. 4303/B3/DT.03.08/2025 and 3927/UN6. RKT/HK.07.00/2025).
Institutional Review Board Statement
Not applicable.
Informed Consent Statement
Not applicable.
Data Availability Statement
The data of this study has been uploaded as a Supplementary File.
Acknowledgments
The authors gratefully acknowledge the support provided by the Department of Pharmaceutical Analysis and Medicinal Chemistry, Faculty of Pharmacy, Universitas Padjadjaran, and the Department of Pharmacy, Faculty of Health Sciences, Universitas Perjuangan Tasikmalaya. The authors also appreciate the institutional facilities and technical assistance that supported the completion of this research.
Conflicts of Interest
The authors declare no conflicts of interest.
References
- Bi, C.; Xu, H.; Yu, J.; Ding, Z.; Liu, Z. Botanical characteristics, chemical components, biological activity, and potential applications of mangosteen. PeerJ 2023, 11, e15329. [Google Scholar] [CrossRef] [Scilit] [PubMed]
- Yao, T.L.; Nazre, M.; McKey, D.; Jalonen, R.; Duminil, J. The origin of cultivated mangosteen (Garcinia mangostana L. var. mangostana): Critical assessments and an evolutionary-ecological perspective. Ecol. Evol. 2023, 13, e9792. [Google Scholar] [PubMed]
- Muchtaridi, M.; Prasetio, M.; Saptarini, N.M.; Saputri, F.A. High Performance Liquid Chromatography for α-mangostin analysis in mangosteen pericarp extract for routine analysis with Photodiode Array detector. Rasayan J. Chem. 2018, 11, 973–978. [Google Scholar] [CrossRef] [Scilit]
- Yuvanatemiya, V.; Srean, P.; Klangbud, W.K.; Venkatachalam, K.; Wongsa, J.; Parametthanuwat, T.; Charoenphun, N. A Review of the Influence of Various Extraction Techniques and the Biological Effects of the Xanthones from Mangosteen (Garcinia mangostana L.) Pericarps. Molecules 2022, 27, 8775. [Google Scholar] [CrossRef] [Scilit] [PubMed]
- Kalick, L.S.; Khan, H.A.; Maung, E.; Baez, Y.; Atkinson, A.N.; Wallace, C.E.; Day, F.; Delgadillo, B.E.; Mondal, A.; Watanapokasin, R.; et al. Mangosteen for malignancy prevention and intervention: Current evidence, molecular mechanisms, and future perspectives. Pharmacol. Res. 2023, 188, 106630. [Google Scholar] [CrossRef] [Scilit] [PubMed]
- Qian, W.; Liu, W.; Zhu, D.; Cao, Y.; Tang, A.; Gong, G.; Su, H. Natural skin-whitening compounds for the treatment of melanogenesis (Review). Exp. Ther. Med. 2020, 20, 173–185. [Google Scholar] [PubMed]
- Muchtaridi, M.; Puteri, N.A.; Milanda, T.; Musfiroh, I. Validation analysis methods of α-mangostin, γ-mangostin and gartanin mixture in Mangosteen (Garcinia mangostana L.) fruit rind extract from west java with HPLC. J. Appl. Pharm. Sci. 2017, 7, 125–130. [Google Scholar] [CrossRef] [Scilit]
- Suhandi, C.; Wilar, G.; Narsa, A.C.; Mohammed, A.F.A.; El-Rayyes, A.; Muchtaridi, M.; Shamsuddin, S.; Safuan, S.; Wathoni, N. Updating the Pharmacological Effects of α-Mangostin Compound and Unraveling Its Mechanism of Action: A Computational Study Review. Drug Des. Dev. Ther. 2024, 18, 4723–4748. [Google Scholar] [CrossRef] [Scilit]
- Tan, P.L.; Rajagopal, M.; Chinnappan, S.; Selvaraja, M.; Leong, M.Y.; Tan, L.F.; Yap, V.L. Formulation and Physicochemical Evaluation of Green Cosmeceutical Herbal Face Cream Containing Standardized Mangosteen Peel Extract. Cosmetics 2022, 9, 46. [Google Scholar] [CrossRef] [Scilit]
- Srisittiratkul, P.; Limsuvan, S.; Pattanapholkornsakul, S.; Akarasereenont, P. Optimizing herbal drug use through multivariable standardization and precision approaches. Phytomed. Plus 2025, 5, 100907. [Google Scholar] [CrossRef] [Scilit]
- Alum, E.U.; Manjula, V.S.; Uti, D.E.; Echegu, D.A.; Ugwu, O.P.-C.; Egba, S.I.; Agu, P.C. Metabolomics-Driven Standardization of Herbal Medicine: Advances, Applications, and Sustainability Considerations. Nat. Prod. Commun. 2025, 20, 1934578X251367650. [Google Scholar] [CrossRef] [Scilit]
- Yang, Y.; Wu, Y.; Li, W.; Liu, X.; Zheng, J.; Zhang, W.; Chen, Y. Determination of geographical origin and icariin content of Herba Epimedii using near infrared spectroscopy and chemometrics. Spectrochim. Acta Part A Mol. Biomol. Spectrosc. 2017, 191, 233–240. [Google Scholar]
- Hussain, M.S.; Fareed, S.; Ansari, S.; Rahman, M.A.; Ahmad, I.Z.; Saeed, M. Current approaches toward production of secondary plant metabolites. J. Pharm. Bioallied Sci. 2012, 4, 10–20. [Google Scholar] [CrossRef] [Scilit] [PubMed]
- Omwango, E.; Onguso, J.; Ochora, J.; Kirira, P.; Kinyua, Z.; Mandela, E. Phytochemical variability of selected medicinal plants from different agro-climatic zones in Kenya. Biochem. Syst. Ecol. 2024, 117, 104915. [Google Scholar] [CrossRef] [Scilit]
- Hou, P.-F.; Chang, Y.-T. Exploring the Impact of Different Fertilization Practices and Regional Climate Variables on Cabbage (Brassica oleracea L. Var. Capitata) Yield. Sustainability 2025, 17, 6086. [Google Scholar] [CrossRef] [Scilit]
- Ragno, A.; Imbesi, M.; Gervasi, T.; Smeriglio, A.; Mandalari, G.; Impellizzeri, D.; Trombetta, D. Impact of post-harvest storage conditions on polyphenol composition and antioxidant activity in natural almonds. Front. Nutr. 2025, 12, 1582434. [Google Scholar] [CrossRef] [Scilit] [PubMed]
- Setyawati, L.U.; Nurhidayah, W.; Khairul Ikram, N.K.; Mohd Fuad, W.E.; Muchtaridi, M. General toxicity studies of alpha mangostin from Garcinia mangostana: A systematic review. Heliyon 2023, 9, e16045. [Google Scholar] [CrossRef] [Scilit] [PubMed]
- Chen, G.; Li, Y.; Wang, W.; Deng, L. Bioactivity and pharmacological properties of α-mangostin from the mangosteen fruit: A review. Expert Opin. Ther. Pat. 2018, 28, 415–427. [Google Scholar] [CrossRef] [Scilit] [PubMed]
- Sachan, A.; Vishnoi, G.; Kumar, R. Need of standardization of herbal medicines in Modern era. Int. J. Phytomed. 2016, 8, 300–307. [Google Scholar] [CrossRef] [Scilit]
- Fauziah, A.N.; Kim, M.J.; So, B.R.; Son, J.E.; Jung, S.K. Validation of the High-Performance Liquid Chromatography Method for Determining Quercitrin in Capsicum annuum L. Cultivar Dangjo. Prev. Nutr. Food Sci. 2024, 29, 504–511. [Google Scholar] [CrossRef] [Scilit] [PubMed]
- Han, M.M.; Tangpromphan, P.; Kaewchada, A.; Jaree, A. Recovery and partial isolation of ⍺-mangostin from mangosteen pericarpsvia sequential extraction and precipitation. PLoS ONE 2024, 19, e0310453. [Google Scholar] [CrossRef] [Scilit] [PubMed]
- Yang, X.; Zeng, P.; Wen, J.; Wang, C.; Yao, L.; He, M. Gain deeper insights into traditional Chinese medicines using multidimensional chromatography combined with chemometric approaches. Chin. Herb. Med. 2024, 16, 27–41. [Google Scholar] [PubMed]
- Heinrich, M.; Jalil, B.; Abdel-Tawab, M.; Echeverria, J.; Kulić, Ž.; McGaw, L.J.; Pezzuto, J.M.; Potterat, O.; Wang, J.B. Best Practice in the chemical characterisation of extracts used in pharmacological and toxicological research-The ConPhyMP-Guidelines. Front. Pharmacol. 2022, 13, 953205. [Google Scholar] [PubMed]
- Al-Amin, K.; Kawsar, M.; Mamun, M.; Sahadat Hossain, M. Fourier transform infrared spectroscopic technique for analysis of inorganic materials: A review. Nanoscale Adv. 2025, 7, 6677–6702. [Google Scholar] [CrossRef] [Scilit] [PubMed]
- Pasieczna-Patkowska, S.; Cichy, M.; Flieger, J. Application of Fourier Transform Infrared (FTIR) Spectroscopy in Characterization of Green Synthesized Nanoparticles. Molecules 2025, 30, 684. [Google Scholar] [CrossRef] [Scilit] [PubMed]
- Pissard, A.; Baeten, V.; Arnould, Q.; Rogez, H.; Stevens, F. Characterization and Discrimination of Pure Standards of Phenolic Compounds Using FTIR Spectroscopy in the Terahertz Range. Foods 2025, 14, 3737. [Google Scholar] [CrossRef] [Scilit] [PubMed]
- Munteanu, I.G.; Apetrei, C. Analytical Methods Used in Determining Antioxidant Activity: A Review. Int. J. Mol. Sci. 2021, 22, 3380. [Google Scholar] [CrossRef] [Scilit] [PubMed]
- Duan, X.; Zhang, D.; Nie, L.; Zang, H. Rapid discrimination of geographical origin and evaluation of antioxidant activity of Salvia miltiorrhiza var. alba by Fourier transform near infrared spectroscopy. Spectrochim. Acta A Mol. Biomol. Spectrosc. 2014, 122, 751–757. [Google Scholar] [CrossRef] [Scilit] [PubMed]
- Rohman, A.; Arifah, F.H.; Alam, G.; Muchtaridi, M. The application of FTIR spectroscopy and chemometrics for classification of Mangosteen extract and its correlation with alpha-mangostin. J. Appl. Pharm. Sci. 2020, 10, 149–154. [Google Scholar] [CrossRef] [Scilit]
- de Vilela Silva, E.T.; de Queiroz, A.J.M.; de Figueiredo, R.M.F.; Moura, H.V.; de França Silva, A.P.; dos Santos, F.S.; Paiva, Y.F.; Palma, C.F.C.; Saraiva, M.M.T.; Junior, N.d.M.A. Enhancing mangosteen peel drying: Impact of ethanol pre-treatment, vacuum pulsing, and blaching on process efficiency and bioactive compound levels. LWT 2024, 198, 115981. [Google Scholar] [CrossRef] [Scilit]
- Samsir, S.A.; Bunawan, H.; Yen, C.C.; Noor, N.M. Dataset of Fourier transform-infrared coupled with chemometric analysis used to distinguish accessions of Garcinia mangostana L. in Peninsular Malaysia. Data Brief. 2016, 8, 1–5. [Google Scholar] [CrossRef] [Scilit] [PubMed]
- Yasir, B.; Djawad, K.; Alam, G.; Irnawati, I.; Rohman, A. Chemometrics-assisted fingerprinting profiling of Mangosteen extracts from Sulawesi island using Fourier Transform Infrared (FTIR) Spectroscopy. J. Res. Pharm. 2025, 29, 151–158. [Google Scholar] [CrossRef] [Scilit]
- Fischer, G.; Nachtergaele, F.O.; van Velthuizen, H.; Chiozza, F.; Francheschini, G.; Henry, M.; Muchoney, D.; Tramberend, S. Global Agro-Ecological Zones (Gaez v4)-Model Documentation; FAO: Rome, Italy; IIASA: Laxenburg, Austria, 2021. [Google Scholar]
- Chavan, T.; Muth, A. The diverse bioactivity of α-mangostin and its therapeutic implications. Future Med. Chem. 2021, 13, 1679–1694. [Google Scholar] [CrossRef] [Scilit] [PubMed]
- Muchtaridi, M.; Suryani, D.; Qosim, W.A.; Saptarini, N.M. Quantitative analysis of A-mangostin in mangosteen (Garcinia mangostana L.) pericarp extract from four district of West Java by HPLC method. Int. J. Pharm. Pharm. Sci. 2016, 8, 232–236. [Google Scholar]
- Yan, M.; Hou, W.; Wang, H.; Beyatli, A.; Arshad, M.S.; Suleria, H.A. Phytochemicals and Bioactive Properties of Mangosteen (Garcinia mangostana L.): A Comprehensive Review. Food Biosci. 2026, 79, 108569. [Google Scholar] [CrossRef] [Scilit]
- Cubas Pereira, D.; Pupin, B.; de Simone Borma, L. Influence of sample preparation methods on FTIR spectra for taxonomic identification of tropical trees in the Atlantic forest. Heliyon 2024, 10, e27232. [Google Scholar] [CrossRef] [Scilit] [PubMed]
- Verbeeck, N.; Caprioli, R.M.; Van de Plas, R. Unsupervised machine learning for exploratory data analysis in imaging mass spectrometry. Mass Spectrom. Rev. 2020, 39, 245–291. [Google Scholar] [PubMed]
- Vera, W.; Salvador-Reyes, R.; Quispe-Santivañez, G.; Kemper, G. Detection of Adulterants in Powdered Foods Using Near-Infrared Spectroscopy and Chemometrics: Recent Advances, Challenges, and Future Perspectives. Foods 2025, 14, 3195. [Google Scholar] [CrossRef] [Scilit] [PubMed]
- Muyumba, N.W.; Mutombo, S.C.; Sheridan, H.; Nachtergael, A.; Duez, P. Quality control of herbal drugs and preparations: The methods of analysis, their relevance and applications. Talanta Open 2021, 4, 100070. [Google Scholar] [CrossRef] [Scilit]
- Hew, P.S.; Ng, W.J.; Loh, P.J.; Ching, J.; Ee, K.Y. Microwave-assisted extraction of Garcinia × mangostana L. and its ‘Mesta’ cultivar rinds: Physicochemical and antioxidant properties analyzed using multiple chemometric algorithms. Food Chem. Adv. 2025, 9, 101118. [Google Scholar] [CrossRef] [Scilit]

Disclaimer/Publisher’s Note: The statements, opinions and data contained in all publications are solely those of the individual author(s) and contributor(s) and not of MDPI and/or the editor(s). MDPI and/or the editor(s) disclaim responsibility for any injury to people or property resulting from any ideas, methods, instructions or products referred to in the content. |
© 2026 by the authors. Licensee MDPI, Basel, Switzerland. This article is an open access article distributed under the terms and conditions of the Creative Commons Attribution (CC BY) license.