1. Introduction
The global population is growing rapidly and the growth is even stronger in densely populated areas [
1]. At the same time, the average household income has been rising since the mid-19th century, and with that, the number of cars per 1000 inhabitants has also increased [
2]. However, on the one hand, creating new parking spaces for these cars is costly, if not impossible in many cases, especially in highly populated areas, where there has been hardly any free land for decades. Even if the parking lots were expanded, it has been shown that such an increase in parking space will only encourage more customers to arrive with their cars, rather than choosing other means of transportation [
3].
On the other hand, regular parking lot layouts that allow visitors to enter and exit their vehicles cannot be improved considerably, as long as cars require manual driving and thus, cannot drop off passengers in entry and exit zones and then find a parking space themselves. Since optimizing the physical layout is therefore not a viable option, the only remaining alternative is to use existing spaces more efficiently.
Typically, unregulated parking lots operate on a “first come, first serve” basis, allowing drivers to occupy any available space regardless of their planned parking time. This can lead to situations where long-term visitors occupy the spaces closest to the entrance for extended periods, blocking them from short-stay visitors who arrive later. Those subsequent visitors are forced to park further away, increasing average walking distances and overall time spent in the parking lot across all drivers.
This paper proposes structured parking space assignment, where vehicles can optionally be assigned based on their estimated parking duration, placing short-stay visitors closer to the entrance to increase turnover in the most desirable areas. This reduces average walking distances and eliminates the need for drivers to search for a free spot, a factor that the simulation results identify as the dominant source of efficiency gain. The question that then arises is what vehicle and contextual features can predict parking duration at the time of arrival, and how much the quality of those predictions determines the achievable efficiency gain. Crucially, the vehicle and contextual data used for this prediction—license plate, vehicle type, arrival time, and origin district—are already captured by the image recognition and access-control infrastructure that any managed parking facility requires for operational purposes. Predicting parking duration from this data therefore requires no additional hardware or data collection, and even a modest improvement in assignment quality over a naive baseline translates directly into reduced overhead for every visitor, making the approach practically viable regardless of whether the prediction task is fully solved. While the primary driver of parking duration is the visitor’s purpose and intent, which is not directly observable at lot entry, the vehicle and its associated context serve as indirect proxies for the demographic and behavioral profile of its driver. Vehicle type, origin district, and arrival time reflect sociodemographic characteristics that correlate systematically with visit purpose—a large van arriving from a distant district on a weekday is more likely to represent a combined-errand trip than a compact car from the local area on a weekend morning—and the license plate identifier, accumulated over repeated visits, provides a direct behavioral history that partially compensates for the latent nature of intent. The prediction task is therefore not based on directly observing intent, but on exploiting the statistical regularities that link observable vehicle and contextual attributes to parking behavior at the population level.
1.1. Structure of the Paper
Section 2 presents an exploratory analysis of real-world parking data from an Austrian shopping mall, with the aim of identifying which vehicle and contextual features carry a meaningful signal for parking duration before committing to a predictive model. Building on these findings,
Section 3 evaluates a range of regression and classification models for predicting parking duration and selects the most suitable approach for operational deployment.
Section 4 then describes a discrete-event parking lot simulation that quantifies the efficiency gains that are achievable under different parking space assignment strategies, comparing machine learning-based duration prediction against a perfect-knowledge upper bound and an unguided baseline.
Section 5 summarizes the results and discusses limitations and directions for future work.
1.2. Related Work
Since this work focuses on a shopping mall parking area, we restrict our review to studies addressing isolated off-street parking facilities of commercial or public entities and exclude approaches targeting on-street or city-scale parking scenarios, whose objectives and constraints differ fundamentally.
Established strategies of optimizing parking areas are primarily focused on reducing the overall demand of parking spaces instead of reducing the time of stay. Such strategies include programs for commute trip reductions [
3], encouraging arrival by bike [
3,
4], priced parking [
4], and improving public transport [
3,
5]. It has also been shown that exclusively increasing the number of parking spaces can actually be detrimental in the long term, as it encourages the use of cars [
6]. This, in turn, leads to a more private transport-centered traffic infrastructure and therefore increases the demand for parking spaces even more [
3]. While these approaches aim to reduce overall parking demand, they do not address operational parking processes at the level of individual vehicles.
Over the past decade, multiple technological innovations have emerged to improve the parking experience for customers using technology. Early approaches focused on mechanical solutions, such as optimizing parking lot layouts by stacking cars in paternoster-type elevators [
7], and basic driver assistance systems guiding users to available parking spaces [
8]. More recent developments show increasing reliance on data-driven approaches, particularly machine learning models (ranging from deep architectures to ensemble methods), to forecast parking occupancy or availability based on historical usage patterns and contextual information [
9,
10,
11,
12,
13]. However, these approaches do not consider the prediction of individual parking durations at the time of arrival and therefore cannot directly support operational parking space assignment.
Similarly, Ribas et al. [
14] address parking dwell time by reconstructing vehicle stay durations from image streams using deep learning. While their results demonstrate that dwell times can be estimated with high accuracy, the approach is retrospective in nature and does not aim to predict parking duration at the time of arrival or to use such information for operational parking space assignment or layout optimization.
Related work also includes studies on parking duration modeling [
15], behavioral parking analysis [
16], simulation-based parking analytics [
17], and parking allocation strategies that aim to improve space utilization through structured assignment policies [
18,
19]. These approaches address important aspects of the problem, including retrospective analysis, aggregate behavior modeling, and operational parking allocation strategies. However, they typically do not provide predictive estimates of individual parking duration at the time of arrival. This limits their applicability for real-time, prediction-informed parking space assignment.
Taken together, these research directions highlight that key aspects of parking duration modeling, behavioral analysis, and parking optimization have been studied individually or in specific combinations. To the best of our knowledge, only limited work combines supervised machine learning-based prediction of individual parking duration at the time of arrival with its use as a direct operational input for parking space assignment and parking efficiency optimization in isolated commercial off-street parking facilities based on real-world parking process data.
2. Materials and Methods
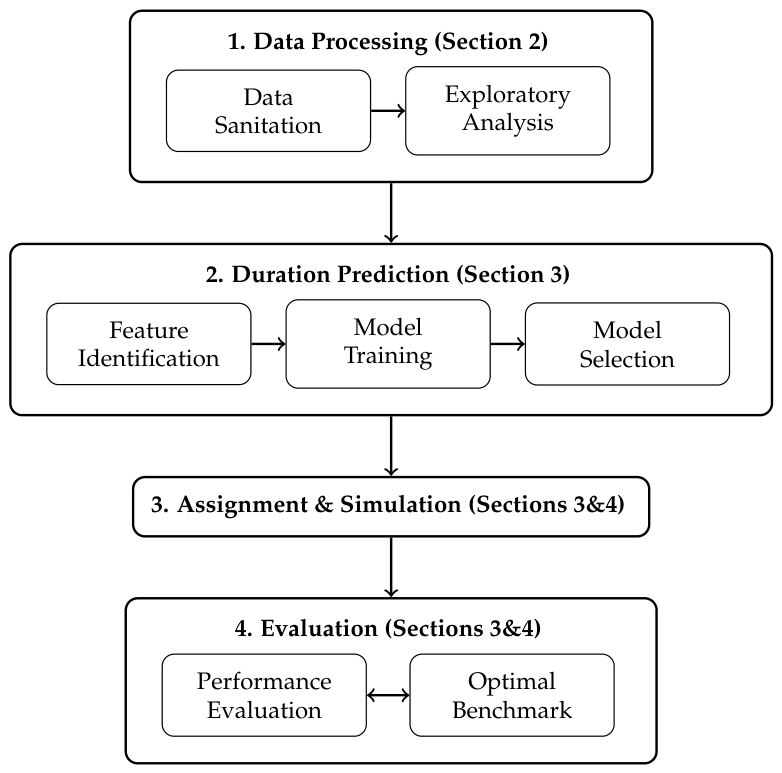
Figure 1 provides an overview of the proposed methodology. The workflow consists of four main stages. First, the collected parking data is processed and analyzed to identify relevant characteristics of parking behavior. Based on this analysis, key features influencing parking duration are derived.
Second, machine learning models are trained to predict the parking duration of individual vehicles based on these features, and the most suitable model is selected based on its predictive performance. Third, the predicted parking durations are used within a simulation framework, where vehicles are assigned parking spaces according to their estimated duration of stay. Finally, the performance of the proposed approach is evaluated and compared to an optimal benchmark model assuming perfect knowledge of parking durations.
To enable the proposed optimization approach, it is first necessary to understand the parking behavior of customers, or, more precisely, to determine a vehicle’s duration of stay. Simply asking customers when they enter the parking lot is unfeasible, as it would not only require visitors to know their duration of stay beforehand, but is also vulnerable to exploitation by lying (i.e., visitors may claim to have a shorter parking time to get a better parking space) [
20].
2.1. Data Collection
For our data analysis, we used first-hand, real-world parking data from a shopping mall in Upper Austria, which has a few thousand visitors per business day. The data, which was gathered using video cameras located at all entrances and exits of the parking lot, ranges over a period of 2.5 months.
Vehicle data was obtained through an image recognition system, which provided information such as license plate numbers, estimated vehicle model, type, and year of manufacture. In addition, each record includes a timestamp indicating the time of entry or exit, as well as an identifier for the respective access point.
The dataset initially consisted of more than half a million records of vehicles entering or leaving the parking garage.
As the data covered a limited time period of two months, only 0.321% of the overall recorded visitors were found to have more than 20 visits. Hence, instead of analyzing the parking history of individual customers, we focused on an analysis per criteria. The subsections of the dataset used for the respective analyses are mentioned in the respective sections.
2.2. Data Sanitation
Before the actual analysis, several preprocessing steps were performed to sanitize the data. To minimize inaccuracies, values predicted by the image recognition algorithms were only considered if they were consistent in more than 50% of the detections.
After matching the original data to parking processes and eliminating all visits that were too short to be considered parking processes, there were still over 200,000 records left. To identify parking processes for all vehicle-specific evaluations, we only used instances in which the camera-based detection systems detected the same license plate twice (i.e., the vehicle was registered when entering and exiting the parking space).
The timestamp included in the dataset is the arrival time of the vehicle. All times have been rounded to the nearest quarter-hour. In the parking data, only entries with a timestamp between 8 a.m. and 10 p.m. were considered, as this corresponds with the business hours of the shopping mall.
For all captured vehicle-specific information, we report the effect size of the association with parking duration rather than relying on significance testing alone: given the sample sizes involved (up to several hundred thousand records per feature), even practically negligible differences in mean duration become statistically significant, so p-values are reported only as a secondary check and are not treated as evidence of practical relevance on their own. The effect size is summarized as the approximate relative difference in mean parking duration between the two most divergent categories of each feature, which is the quantity of practical interest for feature selection ahead of the supervised learning step that follows. It was ensured that for all analyzed properties there were at least 1000 entries per category (500 for vehicle model, owing to its lower recognition consistency); categories with fewer entries were excluded due to the risk of a high error rate. A log transformation was applied to the duration data prior to analysis, and confidence intervals are reported at the 95% level throughout.
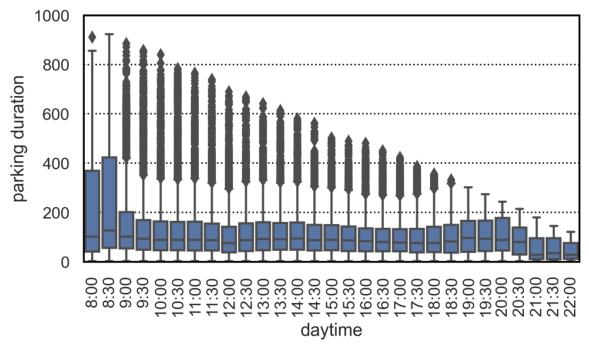
As a first overview,
Figure 2 shows the variation of parking duration across the day: visitors arriving early in the morning tend to stay longer, while parking duration decreases as the day progresses.
Six candidate features were evaluated: the day of the week, vehicle brand (17 brands with at least 1000 entries), vehicle model (8 models, threshold lowered to 500 entries due to low recognition consistency), vehicle type (7 categories), vehicle age in 5-year manufacture periods (4 periods), and the travel distance inferred from the license plate’s home district (19 districts).
Table 1 summarizes, for each feature, whether the aggregate ANOVA reaches statistical significance and how this result should be interpreted in light of the observed effect magnitude, discussed in detail below.
District-based travel distance shows both the largest effect size and the strongest statistical association: visitors from districts far from the mall stay, at times, nearly twice as long as those from the home district, consistent with the hypothesis that longer journeys are more often combined into a single, comprehensive shopping trip. This combination of a large effect size and overwhelming sample size makes district distance the most practically relevant of the six features, and it is later confirmed as the dominant predictor once the license plate history itself is unavailable (
Section 3.4). Weekday and vehicle type show smaller but still practically relevant effects, with deviations of up to roughly 30–40% between their most divergent categories; the largest weekday deviation occurs between working days and the closed Sunday/weekend, and the largest type deviation occurs between large vehicles (vans, wagons) and compact cars. Manufacture age reaches nominal statistical significance (
) purely as a consequence of the large sample size, but the underlying duration curves overlap almost completely and show no consistent trend; we therefore do not consider age a practically useful feature, despite its formal significance.
Vehicle brand does not reach significance at the aggregate level (), since many of the 17 individual brands are not well separated from one another once averaged together. A small number of individual brand pairs, most notably Mercedes-Benz against Seat, do show a sizeable difference in mean duration (up to roughly 30% at certain times of day). We flag this finding as suggestive rather than conclusive: it emerges from an unadjusted comparison of two specific brands out of 136 possible pairs, and without correction for multiple comparisons, this is the kind of result that can arise when the most divergent pair is selected after the fact. We therefore do not treat aggregate brand identity as a reliable feature, though we retain it in the encoded feature set for the prediction models, where its actual contribution can be assessed directly via feature importance rather than via significance testing. The vehicle model could not be evaluated conclusively, as consistent model recognition was available for only about 10% of records, leaving too few entries per model for a robust analysis.
In summary, of the six candidate features, district-based travel distance, weekday, and vehicle type show both statistically significant and practically meaningful effects on parking duration and are retained as primary features. Vehicle brand shows a suggestive but statistically unconfirmed effect at the aggregate level. Vehicle model and manufacture age provide no practically useful signal at the available sample sizes, despite age reaching nominal significance. These findings directly motivate the feature set used for the predictive models in
Section 3, where the actual predictive contribution of each feature is assessed empirically rather than inferred from significance tests alone. It should be noted that, due to the limited consistency of the image recognition system, vehicle model, brand, and type are missing or unreliable for a large share of all parking records, which limits how much predictive signal these otherwise significant features can ultimately contribute to the models in
Section 3.
3. Machine Learning Model
Based on the insights gained from the data analysis, a comprehensive set of supervised machine learning models was evaluated to predict the parking duration of new visits from the statistical patterns observed in completed ones.
3.1. Methods
To identify the most suitable model, a systematic comparison of twelve regression model families was conducted under a unified experimental protocol. For each model family, hyperparameters were optimized independently via Randomized Search Cross-Validation with three folds (cv = 3), using negative mean absolute error (MAE) as the selection criterion. The best configuration per family was then re-fitted on the complete training set before final evaluation on the held-out test set. The candidate models span a broad range of learning paradigms:
Ridge and Lasso Regression (linear baselines)
Decision Tree Regressor
Random Forest Regressor and Extra Trees Regressor
Histogram-based Gradient Boosting, Gradient Boosting Regressor, and XGBoost
Linear Support Vector Regression (LinearSVR)
Multi-layer Perceptron Regressor (MLP)
k-Nearest Neighbours Regressor (KNN)
LightGBM
In addition to regression, we also evaluated the problem as a classification task, using the classes described in
Table 2. Predicting a coarse duration category is inherently less demanding than predicting an exact value in minutes and may therefore yield a more robust and operationally useful output. For parking space assignment, knowing whether a visitor will stay for a short, medium, long, or very long time is sufficient without requiring a precise estimate. The continuous parking duration was discretised into four ordered bins whose thresholds were set at the approximate quartiles of the training distribution, resulting in four roughly equally sized classes of approximately 49,000 samples each:
Eleven classifier families were evaluated under the same 3-fold cross-validation protocol using weighted F1-score as the selection criterion:
Logistic Regression and Linear SVC (linear baselines)
Decision Tree
Random Forest and Extra Trees
Histogram-based Gradient Boosting, Gradient Boosting, XGBoost, and LightGBM
Multi-layer Perceptron (MLP)
k-Nearest Neighbours (KNN)
3.2. Necessary Statistical Target Encoding
A key finding of this extended evaluation was that satisfactory model performance critically depends on an adequate representation of the high-cardinality categorical features—most notably the hashed license plate identifier and the origin district of each vehicle. Standard one-hot encoding is infeasible for these columns: the license plate feature alone contains tens of thousands of unique values, and a plate unseen at training time would produce an out-of-vocabulary vector. Ordinal encoding, on the other hand, discards the distributional information these features carry. We therefore applied a statistical target encoding: each unique category value is replaced by four per-category summary statistics of the parking duration, computed exclusively from the training fold to prevent data leakage—specifically the observation count, mean, median, and standard deviation.
Experiments conducted without this encoding showed that models were unable to extract useful signal from these features and performed no better than baselines that ignored them entirely. Only after introducing the statistical encoding did model performance improve substantially, confirming that the learned per-category duration statistics are the primary source of predictive information for these high-cardinality features.
We analyzed the suitability of these models for the regression task of predicting continuous parking duration and determined the most suitable approach using the 3-fold cross-validated MAE as the selection criterion.
3.3. Results
Across both tasks, model performance is largely determined by the quality of the feature representation rather than the choice of algorithm: once statistical target encoding is in place, test-set metrics cluster narrowly across all evaluated model families.
3.3.1. Regression Results
Table 3 summarizes the three-fold cross-validated MAE (used for hyperparameter selection) together with the final test-set metrics evaluated on the held-out 20% test portion for all eleven model families.
KNN achieved the best cross-validation MAE (63.9 min) as well as the best test-set MAE (59.7 min), while Extra Trees yielded the highest on the test set (0.426). The test-set MAE is clustered narrowly between 59.7 min and 62.5 min across all models, suggesting that once the statistical target encoding is in place, the choice of model family has only a modest effect on absolute prediction error. Linear models (Ridge, Lasso, LinearSVR) consistently ranked at the bottom, confirming that the relationship between the engineered features and parking duration is non-linear. In absolute terms, a mean absolute error of approximately 60 min on parking durations that range up to over 1000 min and have a mean of around 120 min reflects the inherent difficulty of the prediction task, as parking duration is driven substantially by individual intent, which is not directly observable from vehicle attributes and arrival context alone. From the perspective of parking space assignment, a MAE of this magnitude implies that the model will frequently misclassify the duration category of a given vehicle—for instance, predicting a long stay for a vehicle that departs within 30 min, or vice versa. Similarly, a classification accuracy of approximately 39% means that roughly six out of ten individual assignment decisions are based on an incorrect duration estimate. This accuracy shortfall is the primary constraint on the efficiency gains achievable in the downstream simulation, and we return to its practical implications in the Discussion.
The strong performance of KNN deserves a closer look. Its competitiveness is largely explained by the statistical target encoding: the per-category statistics (count, mean, median, standard deviation of parking duration) effectively embed each vehicle and each origin district into a feature space that summarises historical parking behaviour. In this space, Euclidean distance between two points is partly a direct measure of similarity in past parking patterns, which is precisely the kind of structure KNN is designed to exploit. The result is that KNN’s prediction for a new visit is essentially a weighted average of the observed durations of the most behaviourally-similar recent visits in the dataset, an intuitive and well-suited strategy for this problem.
3.3.2. Classification Results
Table 4 summarises the three-fold cross-validated weighted F1 score together with the final test-set metrics for all nine classification models.
The best test-set weighted F1 of 0.391 and accuracy of 39.0% were achieved by KNN. Since randomly assigning one of four equally probable labels yields an expected accuracy of 25%, the best classifier performs approximately 1.56 times better than chance. Overall, classification performance is modest across all models, with test accuracies clustered tightly between 36.7% and 39.0%, reflecting the inherent difficulty of discretising a continuous and highly variable target from the available features. This level of performance means that the majority of individual duration predictions will be incorrect, and the practical utility of any duration-aware assignment system built on these models should be evaluated with this limitation explicitly in mind.
Table 5 shows the per-class precision, recall, and F1-score for the best-performing classifier (KNN). Short stays (0–44 min) and very long stays (155+ min) are predicted with higher precision (0.51 and 0.56), whereas the two middle classes are harder to distinguish, with precision values of 0.34 and 0.31.
Although KNN achieves the highest test accuracy and F1-score among all classifiers, it is not recommended for operational deployment. As a lazy learner, KNN stores the entire training set and performs a nearest-neighbour search over all instances at inference time, making prediction latency grow with the size of the training data. This renders it impractical for a real-time parking assignment system where predictions must be delivered within milliseconds of vehicle arrival. XGBoost, which achieves a test F1 of 0.383 compared to KNN’s 0.391 while offering fast, constant-time inference through a fixed ensemble of gradient-boosted trees, is therefore the recommended classifier for operational use.
3.3.3. Feature Importance and Reoccurring Visitors
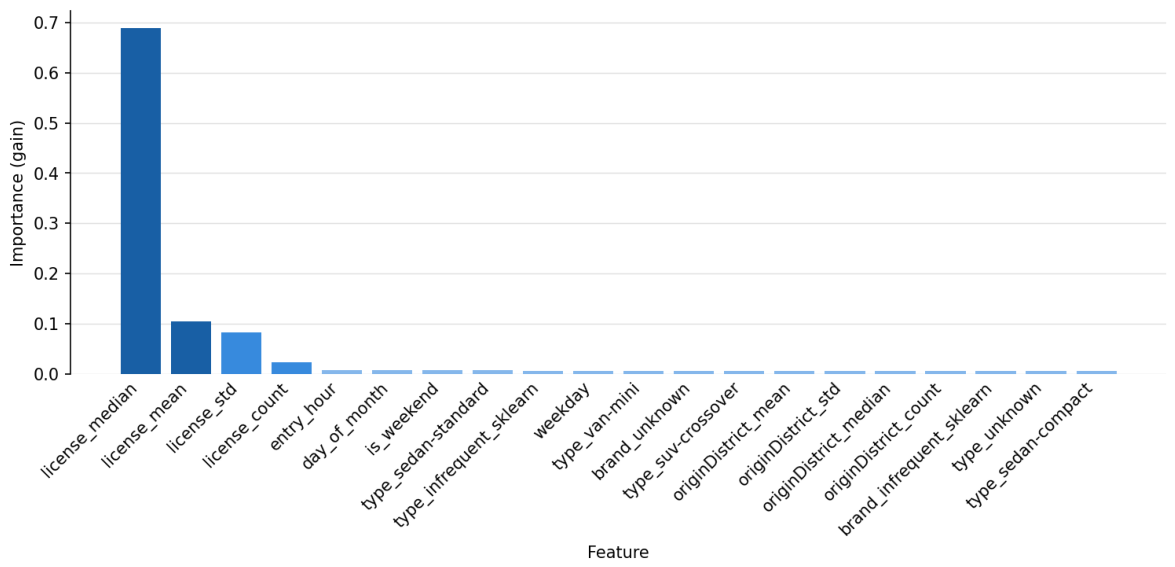
Figure 3 shows the feature importances of the recommended XGBoost classifier, measured by the mean gain across all tree splits in which each feature is used.
The analysis reveals a pronounced dominance of the statistical target encoding applied to the license plate identifier. The median parking duration per license plate accounts for approximately 69% of the total feature importance, followed by the mean (10%), standard deviation (8%), and observation count (2%) per plate. Together, these four features derived from the license plate alone explain over 90% of the model’s predictive signal.
All remaining features, including time of arrival, day of week, vehicle type, and district-based statistics, contribute only marginally. This confirms that individual behavioral history, captured through past parking durations associated with a given license plate, is by far the most informative signal in the dataset. Features representing vehicle demographics and arrival context play only a minor supporting role.
This result has a direct practical implication: for first-time visitors or vehicles with few prior records, the license plate statistics revert toward the population mean, effectively reducing the model to a weaker baseline. In the dataset used for this study, only approximately 5% of parking processes were performed by repeat visitors with at least 20 recorded visits, a consequence of the 2.5-month data collection window. To quantify the potential accuracy gain from longer observation periods, the classifier was retrained on subsets of the data with artificially increased shares of repeat visitors, as shown in
Table 6.
The classification accuracy is directly proportional to the share of repeat visitors: with 100% repeat visitors it reaches 69%, dropping to 39.7% at the 5% level observed in the actual dataset. This confirms that longer observation periods, which naturally increase the proportion of customers with rich historical records, would substantially improve predictive performance.
3.4. Generalization of the Model
How well the model generalizes depends on what kind of generalization is required. The feature importance analysis (
Figure 3) shows that the license plate statistical encoding accounts for the large majority of the predictive signal. This has direct consequences for two practically relevant scenarios.
3.4.1. Generalization to a New Parking Facility
If the model is deployed at a different parking facility that also serves a population of repeat visitors, the license plate statistics accumulated during an initial observation period can be transferred directly. Once a vehicle is seen a sufficient number of times, its per-plate statistics converge toward its individual parking behavior, regardless of which facility is being considered. The remaining features—origin district, vehicle type, brand, day of week, and time of arrival—are facility-independent by nature. Under these conditions the model is expected to generalize well to a new site, provided a sufficient warm-up period is available to build up the license plate encoding from scratch.
3.4.2. Generalization to Previously Unseen Vehicles
A more challenging scenario arises when the model is asked to predict the duration of a vehicle that has never been observed before—either a first-time visitor or a vehicle absent from the training set. For such vehicles, the license plate statistics are undefined and must be replaced by a population-level fallback (e.g., the global mean and median), effectively discarding the most informative feature group.
To quantify this effect, we conducted an ablation experiment in which the license plate feature was entirely removed from the input, simulating the worst-case scenario of a system with no prior visit history. The results are reported in
Table 7 for both regression and classification.
Removing the license plate encoding increases the best regression MAE from 59.7 min to 69.9 min (an increase of approximately 17%) and reduces the best classification F1 from 0.389 to 0.363. The model therefore still yields a meaningful improvement over naive baselines even without license plate history, but the performance degrades noticeably.
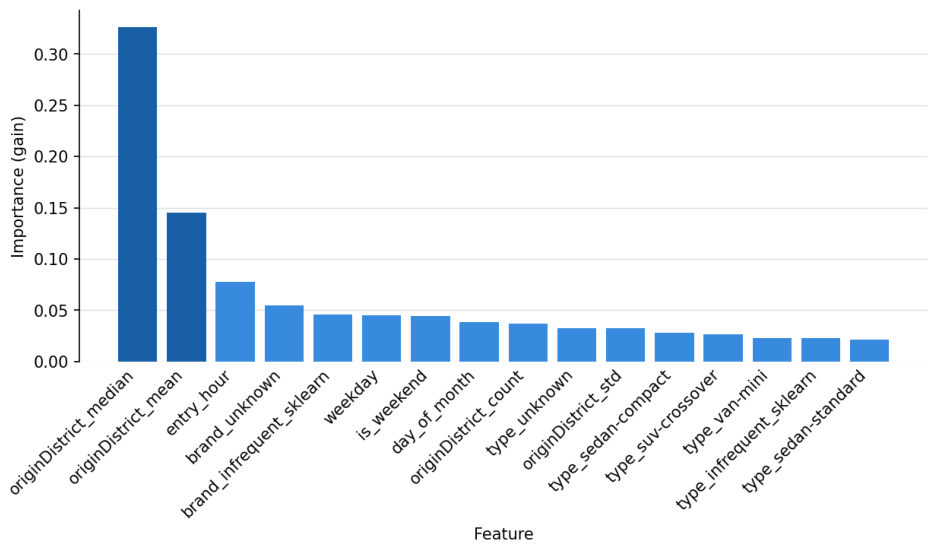
Figure 4 shows the feature importances of the best classifier when the license plate feature is excluded. In this setting, the origin district statistics take over as the dominant predictors: the per-district median parking duration alone accounts for approximately 33% of the total importance, with the district mean contributing a further 15%. Together, the district-level statistical encodings carry nearly half the predictive weight, confirming that geographic origin remains an informative proxy for parking behavior even in the absence of individual vehicle history. Time of arrival (entry hour, weekday, and weekend indicator) and vehicle type then contribute the remaining signal.
In summary, the model generalizes well to new parking facilities that accumulate repeated visitor data over time. For entirely new vehicles, performance degrades but remains above baseline, with origin district and arrival context providing the residual predictive signal.
4. Simulating the Increase in Parking Efficiency
To quantify potential reductions in customer walking time and time spent searching for a parking space, a discrete-event parking lot simulation was implemented. Arrival rates and parking durations are grounded in real-world observations rather than assumed distributions.
Arrival rates were obtained by partitioning the dataset by time of arrival into 15 min intervals and computing, for each slot, the mean number of arriving vehicles and the corresponding standard deviation. At each simulation step, the number of newly generated vehicles is sampled from a normal distribution parameterized by these per-slot statistics.
Parking durations are assigned analogously: for each 15 min arrival slot, the empirical mean and standard deviation of observed parking durations are computed, and each simulated vehicle is assigned a stay duration drawn from the corresponding per-slot distribution.
The primary structural difference between the simulation and the real-world facility is that the simulated parking lot is modeled as a single-level area comprising 1304 spaces, denoted N, whereas the reference dataset was collected in a six-level parking garage. The potential effect of a multi-level layout on parking behavior is acknowledged as a limitation and is left for future investigation.
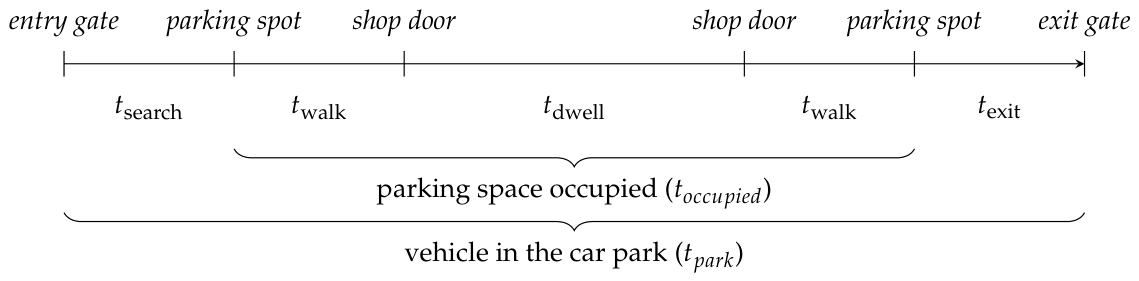
Figure 5 illustrates the individual time spans that constitute a complete parking process in the context of our simulation: upon entering the facility, a driver first searches for a free spot (
), then walks to the shop (
), spends time there (
), walks back to the vehicle (
), and finally drives to the exit gate (
).
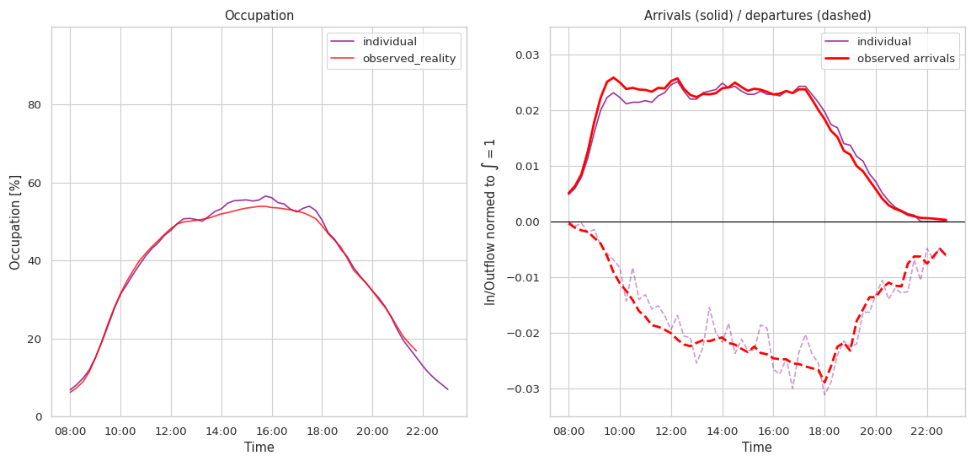
The fidelity of the simulation is assessed in
Figure 6, which compares the simulated results against real-world observations with respect to both parking lot occupancy and the normalized arrival and departure flow distributions over the course of the day.
4.1. Parking Spot Rating
A central concept in both the individual search and the assignment strategies is the
rating of a parking spot, which quantifies its desirability in terms of walking distance to the shop entrance. For each spot
s, the rating
is computed as the minimum walking distance to any shop entrance, normalized linearly across all spots to the range
:
where
is the minimum walking distance from spot
s to any shop entrance, and
,
are the minimum and maximum such distances across all spots. Consequently,
denotes the spot with the shortest walk and
the most remote one.
Ratings are also aggregated at the road-segment level. Each edge in the road graph is assigned an initial rating
equal to the minimum of the average spot ratings on each of its two sides:
where
and
denote the mean spot ratings on the left and right side of edge
e, respectively.
4.2. Simulation of Individual Parking Search
In the absence of an assignment strategy, each simulated driver searches for a parking spot autonomously by navigating the road graph of the parking lot. This scenario serves as the baseline and is directly compared against real-world observations, since it reflects the unguided behavior seen in practice, as shown in
Figure 6.
The search is governed by a
desperation threshold
, representing the driver’s willingness to accept spots further from the shop entrance. Since spot ratings are normalized to
(Equation (
1)), setting
means the driver accepts any spot in the lot, while
encodes the observation that even in a nearly empty lot, drivers do not insist on the single closest spot. Upon entry, a driver-specific initial desperation
is derived from the perceived lot occupancy
:
where
ℓ is the true occupancy,
is the standard deviation of occupancy perception noise (drivers can estimate lot fullness only to within roughly ±5%), and
captures the spread in individual patience levels across drivers. Equation (4) linearly interpolates between
and
: in an empty lot, a driver targets only the closest spots, while in a full lot they are immediately willing to accept any available space.
As the driver traverses the lot, desperation rises as patience
(initialized to
) depletes:
Patience is updated at each step according to
, where
depends on the spots observed along the current edge. Two triggers contribute, where
N denotes the total number of spots and
the rating of spot
s:
The first case is calibrated so that a driver who traverses all
spots on one side without finding improvement loses patience completely (
).
At each intersection, the driver selects the outgoing edge
with the lowest noisy rating score, restricted to edges with sufficiently promising spots:
Here,
is each driver’s private estimate of the best free spot rating on edge
e, initialized from
(Equation (
2)) and updated after each traversal as described below. The term
denotes a uniform random draw on
that introduces stochastic variability in route choice, and
is the set of forward edges from node
v, excluding the previously traversed edge to prevent immediate back-tracking. After each traversal, the local estimate is updated as:
where
F is the set of currently unoccupied parking spots. Setting
when
exceeds the maximum spot rating of 100, discouraging repeated visits to fully occupied edges.
The driver parks on the first free spot s with and since the chain of discovered parking spaces is known, the time can be calculated. If no such spot is found within a maximum number of traversal steps, the search terminates.
4.3. Assignment Strategies
Upon arrival, each vehicle under an assignment strategy is directed to the best currently free parking spot whose rating meets a minimum threshold
:
where
is the current lot occupancy and
is the predicted duration class (short, medium, long, very long) as defined in
Table 2. The vehicle is then assigned the free spot with the lowest rating that is still at least
, i.e., the closest available spot beyond the threshold.
The effect of Equation (
9) is to spread vehicles across the lot proportionally to their predicted stay: short-stay visitors (
,
) always receive the closest available spot, while longer-stay visitors are directed progressively further from the entrance, keeping the most desirable spots free for future short-stay arrivals. The small occupancy buffer of 0.1 prevents all strategies from collapsing to the entrance at near-zero load.
Four strategies are evaluated, differing only in how c is determined:
Naive: always sets , assigning every vehicle the closest free spot regardless of predicted duration.
Cls: determines c from the XGBoost classifier, whose errors are modelled via the empirical confusion matrix obtained from the held-out test set.
Cls_opt: uses a perfect classifier (identity confusion matrix), serving as an upper bound on achievable efficiency.
Individual: no assignment is made and the driver searches autonomously as described in
Section 4.2, serving as the unguided baseline.
4.4. Determining the Increase in Parking Efficiency
Four assignment strategies are compared in the simulation as described above.
As visible in
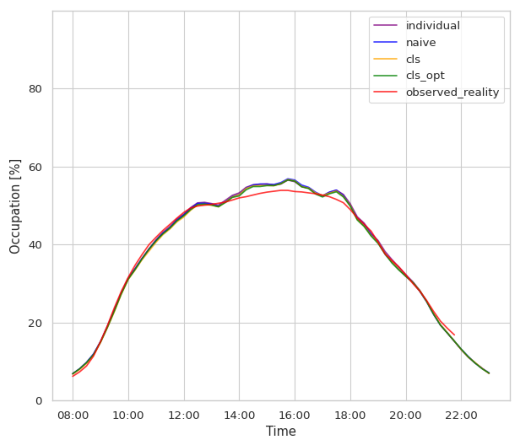
Figure 7, the choice of assignment strategy has no significant effect on overall parking lot occupation or the arrival and departure flow distributions. This is expected, as the strategies differ only in where within the lot vehicles are placed, not in how many vehicles use the lot or when they arrive and depart.
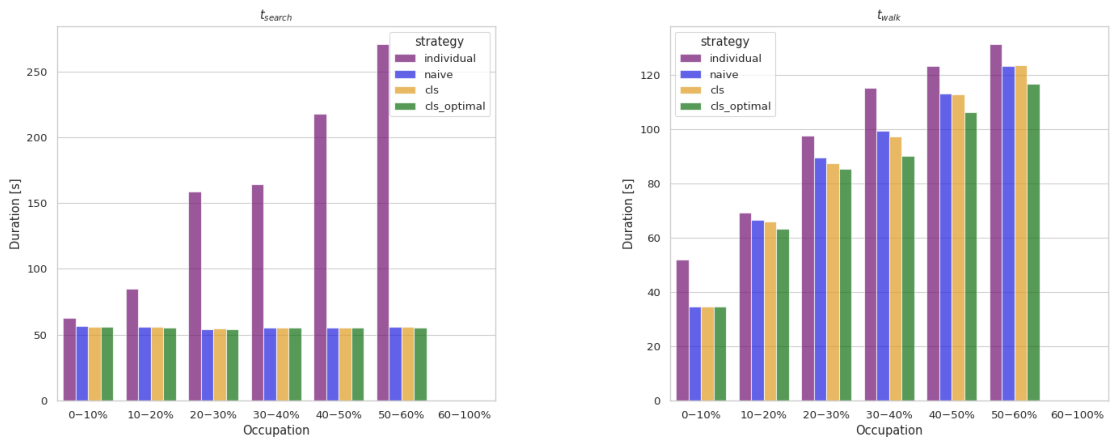
The most substantial gain from any assignment strategy is the elimination of search time. As shown in
Figure 8 (left), unguided drivers (
individual) require significantly more time to find a spot, with search time growing steeply with lot occupation. All three assignment strategies reduce
to a consistently low level across all occupation ranges, since the driver is directed to a pre-selected spot and no search is necessary. This difference in benefit based on the specific strategy used is negligible.
Walking time
(
Figure 8, right) tells a more nuanced story. At low occupation, the
naive strategy performs best, as most spots near the entrance are free and assigning the closest one is optimal. At higher occupation levels, duration-aware strategies (
cls and
cls_opt) begin to show an advantage over both
individual and
naive: by reserving spots close to the entrance for short-stay visitors, they increase turnover in the most desirable area, reducing the average walking distance across all drivers.
Both effects are captured jointly by the
overhead ratio, defined as the fraction of the total parking duration spent on non-dwelling activities:
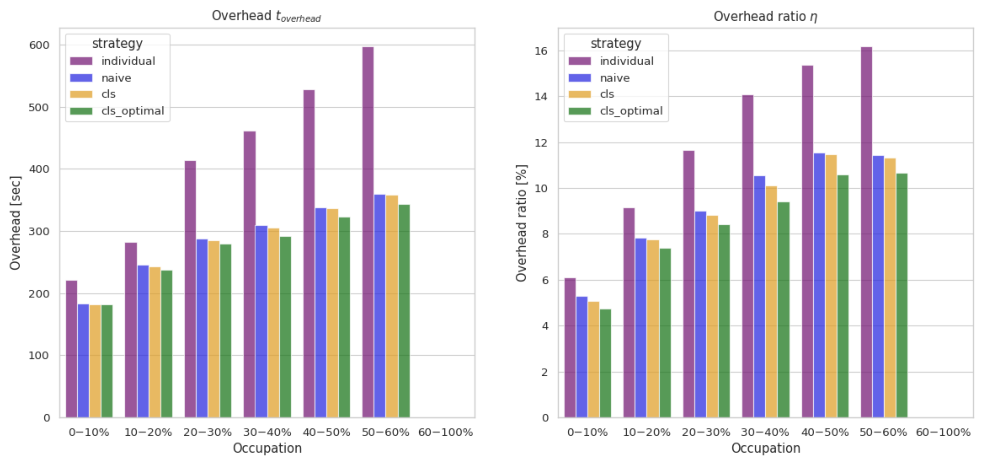
Figure 9 shows that unguided drivers (
individual) incur a substantially higher overhead, growing from approximately 6% at low occupation to over 16% at 50–60% occupation, driven primarily by the increasing search effort. All assignment strategies keep
considerably lower and more stable across occupation levels, with
cls_opt consistently achieving the lowest overhead. Notably,
naive and
cls perform very similarly, confirming that the dominant efficiency gain arises from eliminating the search phase, while the precision of the duration prediction provides only a secondary contribution. Beyond operational efficiency,
is hypothesized to correlate with customer satisfaction. A long shopping trip can absorb a moderate overhead without significantly affecting the perceived experience, whereas for a short visit even a small absolute overhead represents a large relative cost, making low
particularly valuable for brief stays. This is the precise scenario in which duration-aware assignment strategies provide the greatest benefit.
In absolute terms,
Table 8 presents the average overhead saved per vehicle compared to unguided individual search, broken down by occupation bin. At moderate occupation levels the gains are already substantial, and at the highest observed occupation level (50–60%) the classifier-based strategy reduces overhead by approximately 4.1 min per trip, and a theoretically optimal classifier could save visitors up to 4.3 min per trip. This is a meaningful reduction in time spent on non-dwelling parking activities that is directly attributable to the duration-aware assignment.
Aggregated over all vehicles in a simulated day,
Table 9 shows that assignment strategies collectively reduce the total time spent in the parking lot by tens of hours per day. Even the parameter-free
naive strategy recovers roughly 33 h of vehicle time daily, purely by eliminating the search phase. The classifier-based strategy adds a further gain, and an optimal classifier could recover over 46 h per day in aggregate, a saving that compounds across the entire visitor population with every day of operation.
5. Conclusions
The exploratory analysis confirmed statistically significant correlations between parking duration and several vehicle and contextual features, most notably the day of the week and the origin district of the vehicle. The strongest predictor, district-based travel distance, reflects the intuitive pattern that visitors arriving from further away tend to combine multiple errands into a single, longer stay. Vehicle brand also showed a measurable effect, while features such as vehicle model and age of manufacture remained inconclusive due to insufficient data density.
Machine learning models trained on these features achieved a mean absolute error of approximately 60 min for the regression task and a classification accuracy of around 38.7%, reflecting the inherent difficulty of predicting a quantity driven substantially by individual intent, which is not directly observable from vehicle attributes and arrival context alone. The purpose of a visit, whether a brief errand, an extended shopping trip, or a restaurant visit, is the primary driver of stay duration, yet it cannot be directly observed at lot entry. The vehicle type and origin district used as features serve only as indirect sociodemographic proxies for this latent intent. These figures are lower than those reported in aggregate occupancy prediction, where [
13] achieve an R
2 of 0.974 and [
10] report up to 48% accuracy improvement over a standard LSTM, but the comparison is not direct: forecasting how many spaces will be free exploits strong temporal autocorrelation in aggregate counts, whereas predicting how long a specific individual vehicle will stay depends on unobservable intent and carries irreducible uncertainty regardless of model sophistication. A notable result is that accuracy improves substantially when historical data from repeated visitors is available, suggesting that behavioral history is a more informative signal than vehicle characteristics. This represents a fundamental limitation of the dataset, which covers only a 2.5-month window with few repeat visits per customer.
The simulation results reveal two distinct and separable sources of efficiency gain. The dominant effect is the elimination of the search phase: any assignment strategy—including the simple naive approach of always directing drivers to the closest free spot—reduces the search time dramatically and consistently across all occupation levels, regardless of prediction quality. This benefit alone accounts for the majority of the overhead reduction observed in the overhead ratio
, and it is consistent with the broader smart parking literature. A 42% reduction in average parking search time is reported by [
17] in a multiagent IoT-based simulation of urban street parking, and [
8] demonstrate that even a basic intelligent parking assist system that guides drivers to available spaces substantially reduces search overhead. The present results corroborate these findings in the context of an isolated off-street commercial facility, where the closed topology allows for more deterministic routing. A secondary, incremental gain arises from duration-aware assignment at higher occupation levels, where directing long-stay vehicles away from the entrance increases turnover in the most desirable spots and reduces the average walking time. This layer of optimization goes beyond what guidance-only systems such as that provided by [
8], and beyond the aggregate-availability forecasts of [
9,
11], who address routing between facilities rather than assignment within one. The gap between the classifier-based strategy (cls) and the oracle (cls_opt) remains moderate, indicating that even the imperfect predictions delivered by the machine learning model yield a meaningful share of the theoretically achievable improvement.
The distinction between the dominant effect of structured parking space assignment and the secondary contribution of parking duration prediction has implications for the interpretation of the contribution of this work. Rather than positioning parking duration prediction as the primary driver of efficiency, the results indicate that its role is to complement the underlying assignment mechanism, which constitutes the main source of improvement.
A relevant limitation of this study is that the evaluated facility—a large shopping mall—may not represent the most favorable deployment context for this method. With a 25th-percentile dwell time of 44 min, the majority of visits are already of considerable length, which compresses the relative overhead and reduces the incentive to optimize spot placement. Duration-aware assignment is expected to yield substantially greater gains in facilities with a more heterogeneous mix of stay durations, such as a parking lot serving both restaurants and grocery stores, where a meaningful share of vehicles stay only a few minutes while others occupy spaces for several hours. In such environments, the separation between short-stay and long-stay visitors is both larger and operationally more valuable, in contrast to fully automated parking systems such as those studied by [
7] where walking distance plays no role and the assignment problem is purely combinatorial.
In summary, structured parking space assignment provides measurable efficiency gains primarily by eliminating driver search effort, a benefit that requires no predictive model at all and that is well established across the smart parking literature. In absolute terms, the classifier-based strategy reduces overhead by approximately 4.1 min per vehicle at the highest observed occupation level. Aggregated across all vehicles in a simulated day, the total time spent in the parking lot is reduced by over 36 h compared to unguided search, and an optimal classifier could recover more than 46 h per day. These numbers demonstrate that even under conservative conditions, at a shopping mall where most visits are already long and the relative overhead is small, the approach delivers a practically relevant reduction in wasted visitor time. Duration-aware machine learning adds a further improvement beyond the baseline assignment gain, particularly at higher occupancy, and the magnitude of this gain is expected to increase with better prediction accuracy, longer observation periods enabling richer behavioral histories, and deployment in facilities with a more heterogeneous visitor population.
Author Contributions
Conceptualization, G.O., A.M., R.E. and S.G.; methodology, A.M., G.O., M.S., R.E. and S.G.; software, M.S., R.E. and S.G.; validation, A.M., G.O., M.S., R.E. and S.G.; formal analysis, A.M., G.O., M.S., R.E. and S.G.; investigation, R.E. and S.G.; resources, G.O.; data curation, R.E. and S.G.; writing—original draft preparation, A.M., R.E. and S.G.; writing—review and editing, A.M., M.S. and G.O.; visualization, M.S., R.E. and S.G.; supervision, G.O. and A.M.; project administration, G.O.; funding acquisition, G.O. and A.M. All authors have read and agreed to the published version of the manuscript.
Funding
This research received no external funding.
Institutional Review Board Statement
Not applicable.
Informed Consent Statement
Not applicable.
Data Availability Statement
The dataset presented in this article is not readily available because it was provided by and belongs to an Austrian shopping mall. The data presented in this study are available on request from the corresponding author.
Conflicts of Interest
The authors declare no conflicts of interest.
References
- Duranton, G.; Puga, D. Chapter 5—The Growth of Cities. In Handbook of Economic Growth; Aghion, P., Durlauf, S.N., Eds.; Elsevier: Amsterdam, The Netherlands, 2014; Volume 2, pp. 781–853. [Google Scholar] [CrossRef]
- Dargay, J.; Gately, D.; Sommer, M. Vehicle Ownership and Income Growth, Worldwide: 1960–2030. Energy J. 2007, 28, 143–170. [Google Scholar]
- Litman, T. Parking Management Best Practices; Victoria Transport Policy Institute: Victoria, BC, Canada, 2006; Volume 72, pp. 40–41. [Google Scholar] [CrossRef]
- Groote, J.d.; Ommeren, J.v.; Koster, H.R.A. The effect of paid parking and bicycle subsidies on employees parking demand. Transp. Res. Part A Policy Pract. 2019, 128, 46–58. [Google Scholar] [CrossRef]
- Gruyter, C.D.; Truong, L.T.; Taylor, E.J. Can high quality public transport support reduced car parking requirements for new residential apartments? J. Transp. Geogr. 2020, 82, 102627. [Google Scholar] [CrossRef]
- McCahill, C.; Garrick, N. Parking Supply and Urban Impacts. In Parking Issues and Policies; Emerald Group Publishing Limited: Leeds, UK, 2014; Volume 5, pp. 33–55. [Google Scholar] [CrossRef]
- Zou, M.; Wang, Q.; Liu, S.A. Optimization of Parking Space Allocation for Automated Parking System of Paternoster Type by Genetic Algorithm. In Proceedings of the 2019 Chinese Control and Decision Conference (CCDC), Nanchang, China, 3–5 June 2019; pp. 3834–3838. [Google Scholar] [CrossRef]
- Rajabioun, T.; Foster, B.; Ioannou, P. Intelligent parking assist. In Proceedings of the 21st Mediterranean Conference on Control and Automation, Platanias, Greece, 25–28 June 2013; pp. 1156–1161. [Google Scholar] [CrossRef]
- Zhang, L.; Wang, B.; Zhang, Q.; Zhu, S.; Ma, Y. Parking Lot Traffic Prediction Based on Fusion of Multifaceted Spatio-Temporal Features. Sensors 2024, 24, 4971. [Google Scholar] [CrossRef] [PubMed]
- Zhang, F.; Shang, K.; Yan, L.; Nan, H.; Miao, Z. Prediction of Parking Space Availability Using Improved MAT-LSTM Network. ISPRS Int. J. Geo-Inf. 2024, 13, 151. [Google Scholar] [CrossRef]
- Huang, Y.; Dong, Y.; Tang, Y.; Li, L. Leverage Multi-source Traffic Demand Data Fusion with Transformer Model for Urban Parking Prediction. arXiv 2024. [Google Scholar] [CrossRef]
- Enriquez, F.J.; Mejía-Muñoz, J.M.; Bravo, G.; Cruz-Mejía, O. Smart Parking: Enhancing Urban Mobility with Fog Computing and Machine Learning-Based Parking Occupancy Prediction. Appl. Syst. Innov. 2024, 7, 52. [Google Scholar] [CrossRef]
- Knights, V.; Petrovska, O.; Bunevska-Talevska, J.; Prchkovska, M. Machine Learning Models and Mathematical Approaches for Predictive IoT Smart Parking. Sensors 2025, 25, 2065. [Google Scholar] [CrossRef] [PubMed]
- Ribas, M.M.; Mendes, H.B.; de Oliveira, L.E.; Zanlorensi, L.A.; de Almeida, P.L. Using Deep Neural Networks to Quantify Parking Dwell Time. In Proceedings of the 2024 International Conference on Machine Learning and Applications (ICMLA), Miami, FL, USA, 18–20 December 2024; pp. 1504–1509. [Google Scholar] [CrossRef]
- Sun, Z.; Wu, J.; Wang, F.; Tian, Z.; He, Q. Survival analysis of parking duration in urban commercial areas: A case study in Zhengzhou, China. PLoS ONE 2025, 20, e0323207. [Google Scholar] [CrossRef] [PubMed]
- Rodríguez, A.; dell’Olio, L.; Moura, J.L.; Alonso, B.; Cordera, R. Modelling Parking Choice Behaviour Considering Alternative Availability and Systematic and Random Variations in User Tastes. Sustainability 2023, 15, 8618. [Google Scholar] [CrossRef]
- Mutambik, I. Sustainable IoT-Enabled Parking Management: A Multiagent Simulation Framework for Smart Urban Mobility. Sustainability 2025, 17, 6382. [Google Scholar] [CrossRef]
- Icarte-Ahumada, G.; He, Z.; Godoy, V.; García, F.; Oyarzún, M. A Multi-Agent System for Parking Allocation: An Approach to Allocate Parking Spaces. Electronics 2025, 14, 840. [Google Scholar] [CrossRef]
- Jiang, Y.; Gao, Z.; Zheng, T.; Zhang, Y. Enhanced Benders decomposition approach for shared vacant private parking spaces allocation method considering uncertain parking duration of demanders. Transp. Res. Part E Logist. Transp. Rev. 2025, 199, 104150. [Google Scholar] [CrossRef]
- Crawford, V.P. Lying for strategic advantage: Rational and boundedly rational misrepresentation of intentions. Am. Econ. Rev. 2003, 93, 133–149. [Google Scholar] [CrossRef]
Figure 1.
Compact methodological workflow with grouped processing steps.
Figure 1.
Compact methodological workflow with grouped processing steps.
Figure 2.
Parking duration at a shopping mall over time, in 30 min intervals across the day.
Figure 2.
Parking duration at a shopping mall over time, in 30 min intervals across the day.
Figure 3.
Feature importances (gain) of the recommended XGBoost classifier. The license plate target encoding features dominate, accounting for over 90% of the total importance.
Figure 3.
Feature importances (gain) of the recommended XGBoost classifier. The license plate target encoding features dominate, accounting for over 90% of the total importance.
Figure 4.
Feature importances of the best classifier without the license plate feature. Origin district statistics dominate, with the per-district median accounting for approximately 33% of total importance.
Figure 4.
Feature importances of the best classifier without the license plate feature. Origin district statistics dominate, with the per-district median accounting for approximately 33% of total importance.
Figure 5.
Temporal decomposition of a single parking process.
Figure 5.
Temporal decomposition of a single parking process.
Figure 6.
Validation of the parking lot simulation against real-world observations. (Left): parking lot occupancy [%] throughout the day. (Right): normalized arrival (solid lines) and departure (dashed lines) distributions, both scaled such that . In both panels, the simulated behavior is compared against the corresponding observed real-world values.
Figure 6.
Validation of the parking lot simulation against real-world observations. (Left): parking lot occupancy [%] throughout the day. (Right): normalized arrival (solid lines) and departure (dashed lines) distributions, both scaled such that . In both panels, the simulated behavior is compared against the corresponding observed real-world values.
Figure 7.
Parking lot occupation over the course of the day.
Figure 7.
Parking lot occupation over the course of the day.
Figure 8.
Average search time (left) and walking time (right) per vehicle by parking lot occupation level and assignment strategy.
Figure 8.
Average search time (left) and walking time (right) per vehicle by parking lot occupation level and assignment strategy.
Figure 9.
Overhead and overhead ratio per vehicle by parking lot occupation level and assignment strategy.
Figure 9.
Overhead and overhead ratio per vehicle by parking lot occupation level and assignment strategy.
Table 1.
Aggregate ANOVA significance for all six analyzed features against parking duration. Effect magnitude is discussed in the text, as significance alone is not indicative of practical relevance given the large sample sizes involved.
Table 1.
Aggregate ANOVA significance for all six analyzed features against parking duration. Effect magnitude is discussed in the text, as significance alone is not indicative of practical relevance given the large sample sizes involved.
| Feature | Significant? |
|---|
| District distance | Yes () |
| Weekday | Yes () |
| Vehicle type | Yes () |
| Vehicle brand | No at aggregate level (); selected pairs differ |
| Manufacture age | Marginal (), effect not practically meaningful |
| Vehicle model | No (); data too sparse to evaluate |
Table 2.
Duration thresholds for the four classification labels, set at the approximate quartiles of the parking duration distribution.
Table 2.
Duration thresholds for the four classification labels, set at the approximate quartiles of the parking duration distribution.
| Label | Threshold |
|---|
| short | duration < 44 min |
| medium | 44 min <= duration < 87 min |
| long | 87 min <= duration < 155 min |
| very long | 155 min <= duration |
Table 3.
Three-fold cross-validated and test-set performance for all twelve regression models. Bold values indicate the best result per column.
Table 3.
Three-fold cross-validated and test-set performance for all twelve regression models. Bold values indicate the best result per column.
| Model | CV MAE (Min) | Test MAE (Min) | Test RMSE (Min) | Test |
|---|
| KNN | 63.9 | 59.7 | 88.4 | 0.399 |
| Random Forest | 66.0 | 60.1 | 89.3 | 0.387 |
| Extra Trees | 64.6 | 60.2 | 86.3 | 0.426 |
| Gradient Boosting | 66.2 | 60.6 | 89.4 | 0.385 |
| XGBoost | 65.7 | 60.9 | 87.6 | 0.409 |
| LightGBM | 66.0 | 60.9 | 89.7 | 0.381 |
| Decision Tree | 66.4 | 61.0 | 89.7 | 0.380 |
| Hist. Gradient Boost. | 66.1 | 61.0 | 88.8 | 0.393 |
| MLP | 66.4 | 61.2 | 89.9 | 0.377 |
| Ridge | 66.7 | 62.2 | 92.3 | 0.344 |
| Linear SVR | 67.1 | 62.5 | 92.5 | 0.341 |
| Lasso | 66.9 | 62.5 | 91.7 | 0.352 |
Table 4.
Three-fold cross-validated and test-set classification performance for all eleven models (sorted by test F1-weighted). Bold values indicate the best result per column.
Table 4.
Three-fold cross-validated and test-set classification performance for all eleven models (sorted by test F1-weighted). Bold values indicate the best result per column.
| Model | CV F1 | Test Acc | Test F1 |
|---|
| KNN | 0.321 | 0.390 | 0.391 |
| XGBoost | 0.307 | 0.380 | 0.383 |
| Hist. Gradient Boost. | 0.284 | 0.387 | 0.381 |
| Logistic Regression | 0.320 | 0.380 | 0.380 |
| MLP | 0.314 | 0.375 | 0.379 |
| Linear SVC | 0.312 | 0.374 | 0.376 |
| Gradient Boosting | 0.299 | 0.369 | 0.369 |
| LightGBM | 0.275 | 0.370 | 0.365 |
| Extra Trees | 0.314 | 0.368 | 0.365 |
| Random Forest | 0.285 | 0.368 | 0.364 |
| Decision Tree | 0.299 | 0.367 | 0.361 |
Table 5.
Per-class metrics for the best classification model (KNN) on the 20% held-out test set. Overall accuracy: 39.0%.
Table 5.
Per-class metrics for the best classification model (KNN) on the 20% held-out test set. Overall accuracy: 39.0%.
| Duration Class | Precision | Recall | F1-Score | Support |
|---|
| 0–44 min | 0.51 | 0.38 | 0.43 | 9948 |
| 44–87 min | 0.34 | 0.37 | 0.36 | 10,217 |
| 87–155 min | 0.31 | 0.53 | 0.39 | 9613 |
| 155+ min | 0.56 | 0.29 | 0.38 | 9699 |
Table 6.
Classification accuracy by percentage of parking processes carried out by customers with at least 20 visits.
Table 6.
Classification accuracy by percentage of parking processes carried out by customers with at least 20 visits.
| Percentage | Accuracy |
|---|
| 100 | 69% |
| 50 | 52.2% |
| 20 | 42.5% |
| 10 | 39.7% |
| 5 | 39.7% |
Table 7.
Impact of removing the license plate feature on test-set performance. Removing license plate history increases regression MAE by approximately 10 min (+17%) and reduces classification F1 by 0.026 (−7%).
Table 7.
Impact of removing the license plate feature on test-set performance. Removing license plate history increases regression MAE by approximately 10 min (+17%) and reduces classification F1 by 0.026 (−7%).
| | Regression (Test MAE) | Classification (Test F1) |
|---|
| With License | Without License | With License | Without License |
|---|
| Best model | 59.7 min (KNN) | 69.9 min (LinearSVR) | 0.389 (KNN) | 0.363 (XGBoost) |
Table 8.
Average overhead saved per vehicle compared to the individual (unguided) strategy, in seconds, by occupation bin.
Table 8.
Average overhead saved per vehicle compared to the individual (unguided) strategy, in seconds, by occupation bin.
| Occupation Bin | cls Savings (s) | cls_opt Savings (s) | Naive Savings (s) |
|---|
| 0–10% | 40.0 | 42.3 | 42.6 |
| 10–20% | 41.7 | 47.7 | 41.0 |
| 20–30% | 134.7 | 142.4 | 133.7 |
| 30–40% | 150.9 | 166.5 | 147.5 |
| 40–50% | 205.2 | 218.9 | 200.7 |
| 50–60% | 246.1 | 255.3 | 242.7 |
Table 9.
Total time spent in the parking lot and total overhead saved per simulated day, aggregated across all vehicles, by assignment strategy.
Table 9.
Total time spent in the parking lot and total overhead saved per simulated day, aggregated across all vehicles, by assignment strategy.
| Strategy | Total Time in Lot (h) | Saved vs. Individual (h) |
|---|
| individual | 6963.4 | 0.0 |
| naive | 6930.3 | 33.1 |
| cls | 6927.2 | 36.2 |
| cls_opt | 6916.5 | 46.9 |
| Disclaimer/Publisher’s Note: The statements, opinions and data contained in all publications are solely those of the individual author(s) and contributor(s) and not of MDPI and/or the editor(s). MDPI and/or the editor(s) disclaim responsibility for any injury to people or property resulting from any ideas, methods, instructions or products referred to in the content. |




 ,
,