


Abstract
Mobile phone use can distract drivers; however, mobile applications may also improve safety by delivering timely traffic and cooperative intelligent transport system warnings. This pilot study evaluated the user experience of the DARS Traffic Plus (DT+) mobile application and examined simulator sickness and affective burden during its use in a professional driving simulator. Thirty-nine participants were recruited and thirty-three completed all scenarios in a within-subject, counterbalanced design. Following a familiarization scenario, participants completed two comparable driving scenarios: one without DT+ support (S1) and one with DT+ support (S2). User experience was assessed using the User Experience Questionnaire (UEQ), the meCUE 2.0 questionnaire based on the component model of user experience, and a post-interview, while simulator sickness and participant state were measured using the Simulator Sickness Questionnaire (SSQ), Fast Motion Sickness Scale (FMS), and Positive and Negative Affect Schedule (PANAS), complemented by exploratory eye-tracking observations. Both UEQ and meCUE 2.0 indicated positive user experience, with generally higher ratings in scenario S2 using the DT+ mobile application. UEQ showed a significant difference for Perspicuity, and meCUE 2.0 showed significantly higher scores for usefulness, visual aesthetics, commitment, intention to use, product loyalty, and overall evaluation. SSQ and FMS showed that simulator sickness effects occurred in a subset of participants. PANAS revealed no significant change in positive affect, while negative affect decreased significantly by the end of the evaluation. The findings suggest that DT+ was positively experienced in the simulator setting and that combining user experience measures with sickness monitoring is useful in simulator-based evaluation of driving-related mobile applications.
1. Introduction
Mobile devices are deeply embedded in everyday mobility. While these devices offer considerable benefits, they also introduce certain drawbacks. A significant negative impact is their potential to distract users, particularly during vehicular operation. According to national safety organizations such as the Insurance Institute for Highway Safety (IIHS) [1] and the U.S. Department of Transportation’s National Highway Traffic Safety Administration [2], distractions from mobile phones are implicated in approximately 6% of automotive collisions. To mitigate this risk, transportation safety authorities advocate for the activation of “Do not disturb” modes or the restrained use of mobile phones via Bluetooth-enabled hands-free systems while driving [3].
Although in-vehicle information systems and driving-related mobile applications can support drivers by providing navigation, traffic, and warning information, their evaluation remains methodologically challenging. Existing evaluations of automotive HMI and driving-related interfaces often rely primarily on subjective usability or User Experience Questionnaires, while recent reviews emphasize the need for more comprehensive and multimodal evaluation protocols [4]. This is particularly important because mobile and in-vehicle systems may introduce visual, cognitive, or affective demands, even when the interaction is limited to passive notification reception rather than active phone operation. For example, passive mobile-phone notifications have been shown to affect situation awareness and driving behaviour, indicating that even non-interactive alerts can influence the driving task [5].
Therefore, the evaluation of traffic-support mobile applications should not be limited to a single UX questionnaire. Simulator-based studies show that perceived usability and user experience can be influenced by additional factors such as simulator sickness, presence, stress, motion cues, and task-related discomfort [6]. In the present study, multiple complementary assessment tools were applied to provide a broader interpretation of the DT+ application evaluation. UEQ and meCUE 2.0 were used to assess user experience from different conceptual perspectives, SSQ and FMS were used to monitor simulator sickness, PANAS was used to assess affective state, and post-interview data together with exploratory eye-tracking observations provided additional insight into subjective experience and visual behaviour. This multi-method approach was selected to address the limitations of relying on a single UX measure and to better capture both the perceived quality of the application and the methodological burden of simulator-based evaluation.
However, adapted applications on mobile phones can provide drivers with critical information on road traffic and infrastructure. The safety can be further enhanced using the combination of traffic mobile solutions and the cooperative intelligent transport systems (C-ITS) [7]. The C-ITS system is typically designed for various communication modes, such as vehicle-to-vehicle (V2V), vehicle-to-infrastructure communications (V2I) and vehicle-to-person (V2P) communication. C-ITS system analyses the data and warns drivers of possible dangerous situations on the road. One of the viable possibilities for presenting the C-ITS information to the drivers in an accessible and user-friendly manner is through a tailored mobile application on the mobile phone.
The Slovenian National Motorways operator, Družba za avtoceste v Republiki Sloveniji (DARS d.d.) [8], recently introduced a redesigned mobile application, DARS Traffic Plus, with C-ITS functionalities. DARS Traffic Plus provides drivers with focus on real-time information on Hazardous Location Notification services. We present the results of the pilot study evaluation of the DARS Traffic Plus mobile application user experience and simulator sickness effects in a professional driving simulator. We are comparing different methods for evaluating user experience for mobile applications with special focus on an analysis of simulator sickness symptoms and eye-tracking data evaluation in the driving simulator environment. The results show that the DARS Traffic Plus mobile application achieves good user experience and has high usability for the participants in the pilot study evaluation. We also observed that the way participants scanned the road with their eyes impacted the reported level of sickness. A more focused users’ view of the road ahead generated lower levels of simulator sickness, and a more scattered users’ view provided a higher level of reported sickness effects.
The main contributions of this paper are as follows:
- Empirical evaluation of the DT+ mobile application in a professional driving simulator.The study provides pilot evidence that the DT+ condition was generally evaluated more favourably than the no-app condition across multiple user-experience measures, with particularly positive results for perceived clarity, usefulness, visual aesthetics, intention to use, and overall evaluation.
- Integrated assessment of user experience and simulator sickness within a single evaluation protocol.The study shows how UEQ, meCUE 2.0, SSQ, FMS, PANAS, and post-interview data can be combined to evaluate not only perceived quality of a driving-related mobile application but also the methodological burden imposed by the simulator setting.
- Practical insight into simulator-based evaluation design for driving related mobile applications.The results indicate that simulator sickness occurred in a subset of participants but that the adopted protocol, including familiarization and between-scenario recovery periods, supported evaluation under manageable conditions rather than symptom-free conditions.
- Exploratory basis motivating future gaze-based sickness analysis.Eye-tracking heatmap observations suggested that stronger sickness reports may be associated with a more scattered gaze pattern and greater attention toward the road periphery, although this relationship was exploratory and not formally tested.
The remainder of this paper is organised as follows. Section 2 reviews the related work relevant to mobile traffic-support applications, user-experience evaluation, and simulator sickness. Section 3 describes the materials and methods used in the study. Section 4 presents the results, while Section 5 discusses the main findings. Section 6 outlines the study limitations and mitigation measures. Finally, Section 7 summarizes the key conclusions.
2. Related Work
We conducted a literature review to address the works related to the research on evaluating the user experience of mobile applications in driving contexts. Additionally, we reviewed the relevant research on the effects of simulator sickness in driving simulator environments.
2.1. User Experience in a Driving Simulator Environment
Driving simulators demonstrate a correlation between actual and simulated driving, offering a secure, effective, and controlled setting for conducting driving assessments [9]. The accuracy of evaluations carried out in driving simulators depends on the simulator’s capability to recreate real-world driving experiences [10,11].
While in-vehicle information systems (IVIS) are designed to be safe, they can still distract drivers from driving tasks. The level of distraction increases with prolonged task completion time in tasks like reading and text entry. This study suggests that the time needed to complete the task should be shortened as much as possible to reduce the possible distraction of the driver [11]. Positioning of the vehicle display location is vital for drivers’ performance. Advanced driver assistance systems (ADAS) and driver information systems (DIS) can influence drivers’ awareness and demand that the drivers’ attention be off the road. The NHTSA guidelines [2] recommend that the total time to find the relevant information within a display should be two seconds or less while not looking at the road. The study did not find significant differences between mobile device displays and dashboard displays and the mean speed on the road.
Recent research also shows that traffic-support and C-ITS applications should be considered within the broader context of intelligent transport safety, risk assessment, and connected-vehicle-system robustness. Luo et al. [12] proposed a multi-factor lane-changing risk-resilience assessment, highlighting the importance of integrating multiple risk factors when assessing complex driving situations. Such work demonstrates that road-safety support increasingly depends on systematic and data-driven assessment of dynamic traffic risks rather than on isolated warning events alone. Similarly, Zhai et al. [13] addressed the robustness of intelligent connected vehicles under cyber-attack conditions by introducing a throttle-based self-stabilizing control scheme into a traffic-flow model. Their study emphasizes that cyber-attacks in intelligent connected vehicle environments can disturb information exchange and destabilize traffic flows. These recent studies indicate that C-ITS and traffic-support systems are becoming increasingly complex, safety-critical, and dependent on reliable human–system interaction.
Distracted driving has received increasing research attention, particularly regarding the metrics used to assess its impact on driving performance and safety. Researchers have identified several key parameters in driving simulator studies, including lateral and longitudinal control, reaction times, gap acceptance, eye movement, and workload measurements [14]. Among the various distractions during driving, mobile phones [15] emerge as one of the most frequent examples, prompting further investigation into how such distractions, particularly texting, conversing, and other phone related tasks, affect driving performance. Eating and drinking activities also contribute to driving distractions as well as significant other roadside distractions like billboards and work zones [16].
A major concern for driving safety is the usage of smartphones while driving. Mobile applications have great potential to mitigate safety concerns. Collision warning and voice control applications are among the most accepted application solutions for increasing road safety [17]. Applications designed to prevent texting/typing and reading are not as widely accepted. In [17] the authors highlight the lack of research on how mobile phones affect driver performance. They focus on mobile phone distractions such as conversing, texting, reading, and driving tasks.
2.2. Simulator Sickness
Simulator sickness has been identified as one of the limiting parameters for using driving simulators in user experience evaluations [18]. The authors present a method with 90% accuracy for predicting participants who cannot complete the evaluation in a driving simulator. The report showed that younger participants had a lesser likelihood of exhibiting simulator sickness effects than older participants. Visually induced motion sickness in driving simulators can be assessed by repeated symptom assessments over time, according to the authors in [19]. The development of motion sickness progression can be evaluated with established methods, such as fast numerical scores, e.g., Fast Motion Sickness Scale (FMS) [20]. An increase in sickness symptoms was associated with specific road elements. A slower increase in symptoms between and within consecutive drives was also detected. The Simulator Sickness Questionnaire [21] is another well-established tool to evaluate motion sickness originating from visual display elements and visual vestibular interaction. The design of the driving scenarios, including elements like sharp turns, dramatically impacts reported levels of sickness symptoms [22].
Research indicates that study outcomes depend on the initial accommodation or adaptation period in a driving simulator [23]. The literature suggests two primary methods for adapting to a driving simulator. The first method recommends driving for a set period of time, and the second relies on the subjective feelings of adaptation [24]. The researchers analysed the varying complexities and demands of road types, the time required for adaptation, and the participants’ subjective feelings of acclimatization. The findings indicated that more challenging, curved roads necessitated longer adaptation periods. The subjective feelings of acclimatization corresponded well with most performance metrics across all types of roads.
2.3. Eye-Tracking
Eye-tracking systems can be utilized as valuable tools for obtaining objective and quantitative indicators in driving-simulator studies [25]. In driving-performance evaluation, eye-tracking data are used to assess driver attention and visual behaviour, including road centred gaze, off-road glances, fixation duration, gaze transitions between the road and the interface, and visual scanning patterns. In the context of driving-performance evaluation, eye tracking has been used to analyse how simulator conditions influence braking behaviour and visual attention. For example, a driving-simulator study on physical motion cues [26] showed that stronger motion cues improved braking performance and increased gaze focus on the road/track area, while reducing attention to the dashboard and warning signs. This demonstrates how eye-tracking indicators, such as fixation time and gaze distribution across areas of interest, can be used to assess driver attention and performance in simulator-based studies.
In user-experience and usability evaluation, eye tracking is used to analyse how users perceive and interpret interface elements, including visual salience, information hierarchy, noticeability of warnings, and attention distribution across relevant areas of interest [27,28]. This distinction is particularly important for driving-related mobile applications, because active mobile phone operation, such as typing, reading, or manual navigation, can impose visual, manual, and cognitive distraction, whereas passive reception of traffic alerts, such as hazardous-location warnings, mainly requires brief attention shifts and cognitive processing of safety-related information. Therefore, eye-tracking-based evaluation can support the assessment of user acceptance, safety, and vehicle touchscreen or mobile interfaces when the specific interaction context is clearly defined [29,30].
The reviewed literature shows that simulator-based evaluation of driving related mobile applications lies at the intersection of several research areas: driving-simulator validity, in-vehicle information systems, distracted driving, C-ITS and traffic-support systems, simulator sickness, affective responses, and eye-tracking-based assessment. Existing studies provide important evidence on simulator realism, driver distraction, motion sickness, and visual-attention indicators; however, these areas are often examined separately. In particular, limited attention has been given to integrated evaluation approaches that simultaneously consider user experience, simulator-induced burden, affective state, and gaze behaviour when traffic-support information is delivered through a mobile application. This distinction is important because the passive reception of traffic alerts differs from active mobile phone operation, and because eye-tracking indicators may serve different purposes in driving-performance evaluation and user-experience evaluation. The present study addresses this gap by evaluating the DT+ mobile application in a professional driving simulator using a multi-method protocol that combines UEQ, meCUE 2.0, SSQ, FMS, PANAS, post-interview data, and exploratory eye-tracking observations.
3. Materials and Methods
3.1. Participants
In the study (DT+ mobile application) evaluation participated 39 individuals. The final analysis was based on 33 participants who completed all scenarios. As this was a pilot simulator-based evaluation, no formal a priori sample-size calculation was conducted. We recruited a diverse group of participants, divided by gender, age and profession. Participants were recruited to represent a heterogeneous sample of regular drivers rather than a narrowly defined professional driver group. Their occupational background was predominantly related to engineering and social sciences. While one participant was a professional freight vehicle operator, this occupational distribution indicates that the sample mainly reflected ordinary licensed drivers with different professional backgrounds, rather than experts. This is relevant because the DT+ mobile application is intended for general road users and not only for professional drivers.
Participants also differed in their driving experience and daily driving habits. All participants held valid driving licences and regularly drove personal vehicles on different road types. Differences in annual mileage, preferred road type, driving style, and use of mobile or navigation applications while driving may have influenced how participants perceived traffic alerts, simulator events, and the usefulness of DT+.
Nine participants had prior experience with the DT+ mobile application, while the remaining participants did not. Prior DT+ experience may have influenced familiarity with the application interface and could have contributed to easier interpretation of warnings in Scenario S2. However, because the study used a within-subject design in which each participant completed both the no-application and DT+ conditions, prior experience was not expected to invalidate the comparison between scenarios. Nevertheless, this factor should be considered when interpreting the results.
All participants were in good health, had suitable vision for driving, and held valid licences for operating personal vehicles. One participant was a professional freight vehicle operator.
Before participating in the simulator study, all individuals provided written informed consent. Upon completing the study, participants received a small promotional gift, courtesy of the DARS company.
3.2. Apparatus and Driving Simulator Scenarios
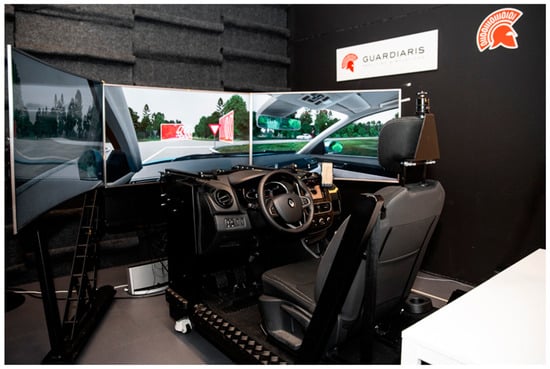
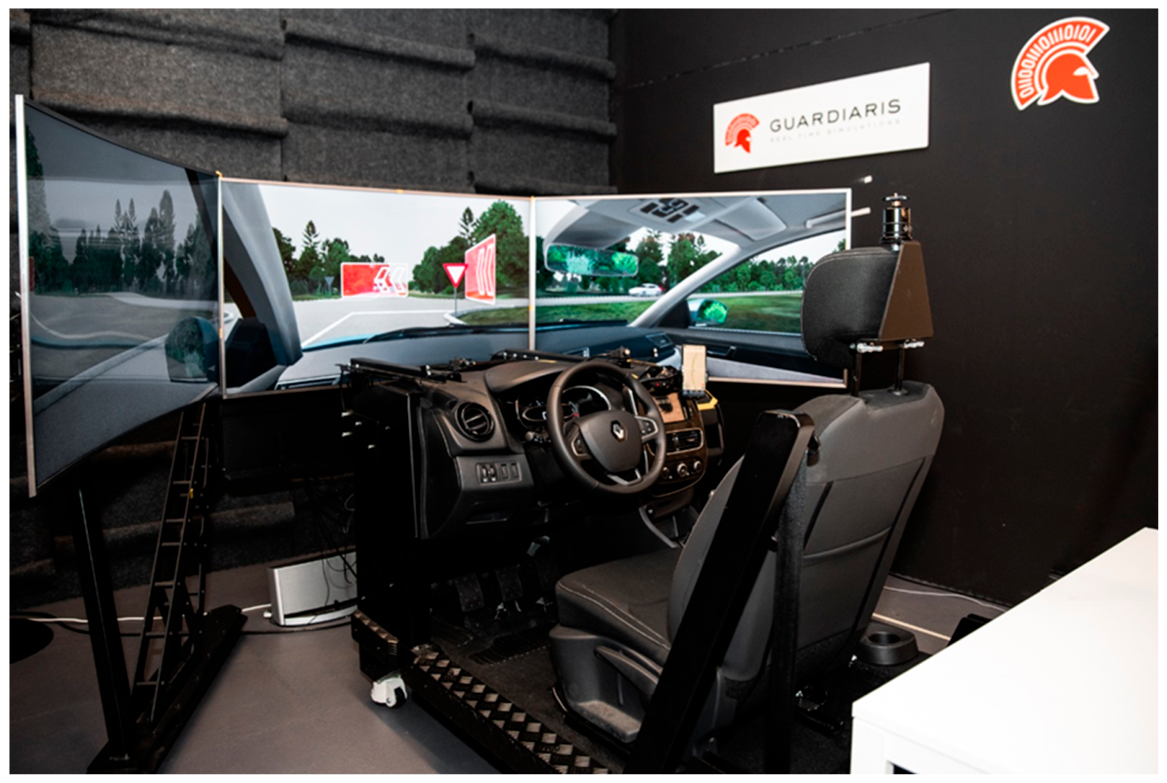
The pilot study evaluation took place in an official professional driving simulator (Figure 1) utilized by the DARS company(Ljubljana Slovenia). This simulator closely resembled the Renault Clio’s interior and featured all the road-legal vehicle functionalities.
Figure 1.
The DT+ mobile application study evaluation in a professional driving simulator.
The Smarteye PRO system [31,32] was used for non-invasive remote eye tracking and head tracking during simulator driving. In the present setup, two cameras were installed to record the participant’s face and eyes, and the system sampled gaze data at 60 Hz. Before each participant’s driving session, the eye-tracking system was calibrated to the individual participant. According to the manufacturer’s technical specifications, Smarteye PRO supports multi-camera configurations, has a field of view of 90–360° depending on the number of cameras, and provides gaze accuracy of approximately 0.5° under ideal conditions [31]. The optimal camera–eye distance is 30–300 cm, depending on camera placement and lens configuration.
We used a Samsung Galaxy S8 mobile phone (Samsung, Suwon, South Korea)during the study to run the DT+ mobile application. Three 50-inch Samsung 4K television (Samsung, Suwon, South Korea) sets were used to show the simulator’s graphical environment. We collected quantitative driving simulator parameters, eye-tracking data, and participant driving recordings on an external computer. A speaker simulated the vehicle engine and environmental sounds to enhance realism. After each participant’s session, the driving simulator, mobile phone, pen, table, and chair were cleaned using sanitary wipes.
Participants were instructed to drive in accordance with traffic regulations across all driving scenarios. Three scenarios were marked Scenario S0, S1, and S2. Scenarios S1 and S2 are comparable to each other, as the main difference lies in the usage of the DT+ mobile application—it was used in S2, but not in S1.
Specifics are provided in Table 1. The scenarios included Hazardous Locations Notification events (Accident Zone Warning, Traffic Jam Ahead Warning, Obstacle on the Road Warning and Weather Condition Warning). Figure 1 depicts the actual driving simulator environment.
Table 1.
Description of scenarios used to evaluate the DT+ mobile application.
3.3. Metrics
We used validated questionnaires to validate the user experience in the pilot study, specifically the User Experience Questionnaire (UEQ) [33] and the meCUE 2.0 questionnaire [34] for user experience, and the Simulator Sickness Questionnaire (SSQ) [21] and Fast Motion Sickness Score (FMS) [20] for assessing participants’ sickness levels. Positive And Negative Affect Schedule (PANAS) [35] was used to measure the participants’ moods during the pilot study evaluation. In the end, we conducted a post semi-structured interview to gather participants’ opinions on the overall user experience of the DT+ mobile application.
3.3.1. User Experience Questionnaire
The User Experience Questionnaire [33] was designed to evaluate the user experience of interactive products. The questionnaire consists of six UEQ subscales derived from 26 semantic differential items. Each item is assessed on an interval ranging from −3 (most negative evaluation) to +3 (most positive evaluation), with 0 representing a neutral response. The Attractiveness subscale provides an overall users’ impression of the product. The Perspicuity, Efficiency, and Dependability subscales provide pragmatic quality, meaning goal-directed (usability) aspects. The Stimulation and Novelty subscales provide hedonic quality, assessing user satisfaction aspects. Calculated UEQ subscale results above the value of 1 are normally considered as positive.
3.3.2. meCUE 2.0 Questionnaire
The meCUE 2.0 questionnaire [34] consists of five modules, assessing the perception of instrumental and non-instrumental qualities, user emotions, consequences of use and finally overall evaluation. The questionnaire is based on the analytical Component model of User Experience and grants modular evaluation of the user experience’s central aspects.
The meCUE 2.0 questionnaire items are scored on a seven-point Likert scale, ranging from 1 to 7. A value of 7 translates to “strongly agree”, and a value of 1 translates to “strongly disagree”. Specific module scores are calculated as arithmetic values.
3.3.3. Simulator Sickness Questionnaire
The Simulator Sickness Questionnaire [21] is one of the most commonly used validated questionnaires to evaluate the simulator sickness effects. Participants rate the severity of their symptoms, and the scores are then calculated to reflect the overall severity of simulator sickness and the severity within each of the specific subscales. The subscales evaluated are Nausea, Oculomotor, Disorientation, and the Total score.
3.3.4. Fast Motion Sickness Scale
The Fast Motion Sickness scale [20] is a verbal rating scale to evaluate the level of sickness felt in the simulator. Participants report a single-word response on a scale of 0 to 20 during the time spent in the simulator; a score of 0 represents no sickness, while a score of 20 means frank sickness.
3.3.5. Positive and Negative Affect Schedule
The Positive and Negative Affect Schedule (PANAS) [35] measures levels of positive and negative affects with specific words describing users’ feelings and emotions. There are two sub-scales; one measures positive and the other negative affect. The PANAS scale is widely used for self-reported measures of affect.
3.3.6. Post-Interview
The interview conducted at the end of the driving simulator study was designed to evaluate the DT+ mobile application overall user experience. Participants were asked to evaluate interface visual components, interactions using and the overall user experience on a five-point Likert scale (1—strongly disagree; 5—strongly agree). An additional objective of the study was to evaluate the occurrence rate and effects of simulator sickness among the participants.
3.4. Experiment Study Environment and Evaluation Procedure
The environmental conditions for the driving simulator study evaluation were constant, and environment parameters were controlled. Experimenters controlled the temperature, noise level, lighting conditions and humidity.
Upon arrival at the driving simulator facility, participants were briefed on the study objectives and evaluation procedure. Written informed consent was obtained from all participants prior to the start of the pilot study. The study lasted, on average, 90 min per participant.
A repeated-measures within-subject design principle was used to evaluate the DT+ mobile application. The order of Scenarios S1 and S2 was counterbalanced using a Latin square design to reduce potential order effects in the within-subject comparison.
At the beginning of the pilot study evaluation, participants completed a demographic questionnaire. The Positive and Negative Affect Schedule (PANAS scale) questionnaire followed the demographic questionnaire. Next, we performed a baseline evaluation of the initial sickness level of the participants. Participants completed the Simulator Sickness Questionnaire and the Fast Motion Sickness Scale questionnaire. The questionnaires were followed by the driving simulator’s presentation and the eye-tracking system’s calibration for each participant.
Participants performed all three driving Scenarios S0–S2. They were instructed to drive according to traffic regulations and suggestions from the DT+ mobile application (applied in S2).
After completing each driving scenario, participants left the driving simulator and sat behind the table near the driving simulator. There, they performed Fast Motion Sickness Scale assessment of simulator sickness, followed by the meCUE 2.0 questionnaire and User Experience Questionnaire. Afterward, participants again completed the Simulator Sickness Questionnaire and the Fast Motion Sickness Scale to assess whether simulator sickness symptoms had subsided.
The measurement sequence was identical across all scenarios (S0, S1, and S2). Following completion of the driving scenarios, participants participated in a post-interview and completed the Positive and Negative Affect Schedule (PANAS) again.
3.5. Research Questions
RQ1. How do participants perceive the user experience of the DARS Traffic Plus mobile application in a driving simulator setting?
RQ2. Do the UEQ and meCUE 2.0 lead to similar overall conclusions about the user experience of the DARS Traffic Plus mobile application?
RQ3. To what extent does simulator sickness occur during the driving simulator evaluation, and how might it influence interpretation of the user experience results?
RQ4. Does participation in the driving simulator evaluation affect participants’ affective state?
4. Results
For data curation and statistical analysis, we used IBM SPSS packet version 25 (IBM, USA, packet version 25), M.S. Office Excel 2019 (Microsoft, USA, version 2019), and Tableau software version 2020.4 (Tableau Software, USA, version 2020.4). We checked for normal distribution of the data. We used the Wilcoxon signed-rank test as the data was not normally distributed.
4.1. Participant Characteristics
Thirty-three (33) participants of thirty-nine (39) participants completed all three driving scenarios. Of thirty-three participants, with a mean age value of 35.6 years (SD = 10.7 years), sixteen were female, and seventeen were male. The youngest participant was 22 years old, and the oldest participant was 62 years old. Due to the effects of simulator sickness, six participants did not complete all of the driving scenarios in full. Their professional domain background was predominantly in engineering and social sciences. All participants had a valid driving licence and regularly drove personal vehicles on all types of roads. The results indicated that approximately one third of participants (39.4%) drove between 10,000 and 20,000 km annually, mainly on motorways (57.6%) and local roads (24.2%), and self-reported a dynamic driving style (72.7%).
Android (version 10) was the predominant mobile operating system among participants (57.6%), whereas 42.4% used iOS. Participants also reported using mobile phones while driving, with 57.6% indicating daily use of a hands-free system. Google Maps (version 10.50.1) was the most commonly used driving-related mobile application, reported by 97.0% of participants. The DT+ mobile application was used by 27.3% of participants. The most frequently used DT+ features were congestion alerts (24.3%), traffic notifications (24.3%), and checking road conditions (21.2%).
4.2. User Experience Results
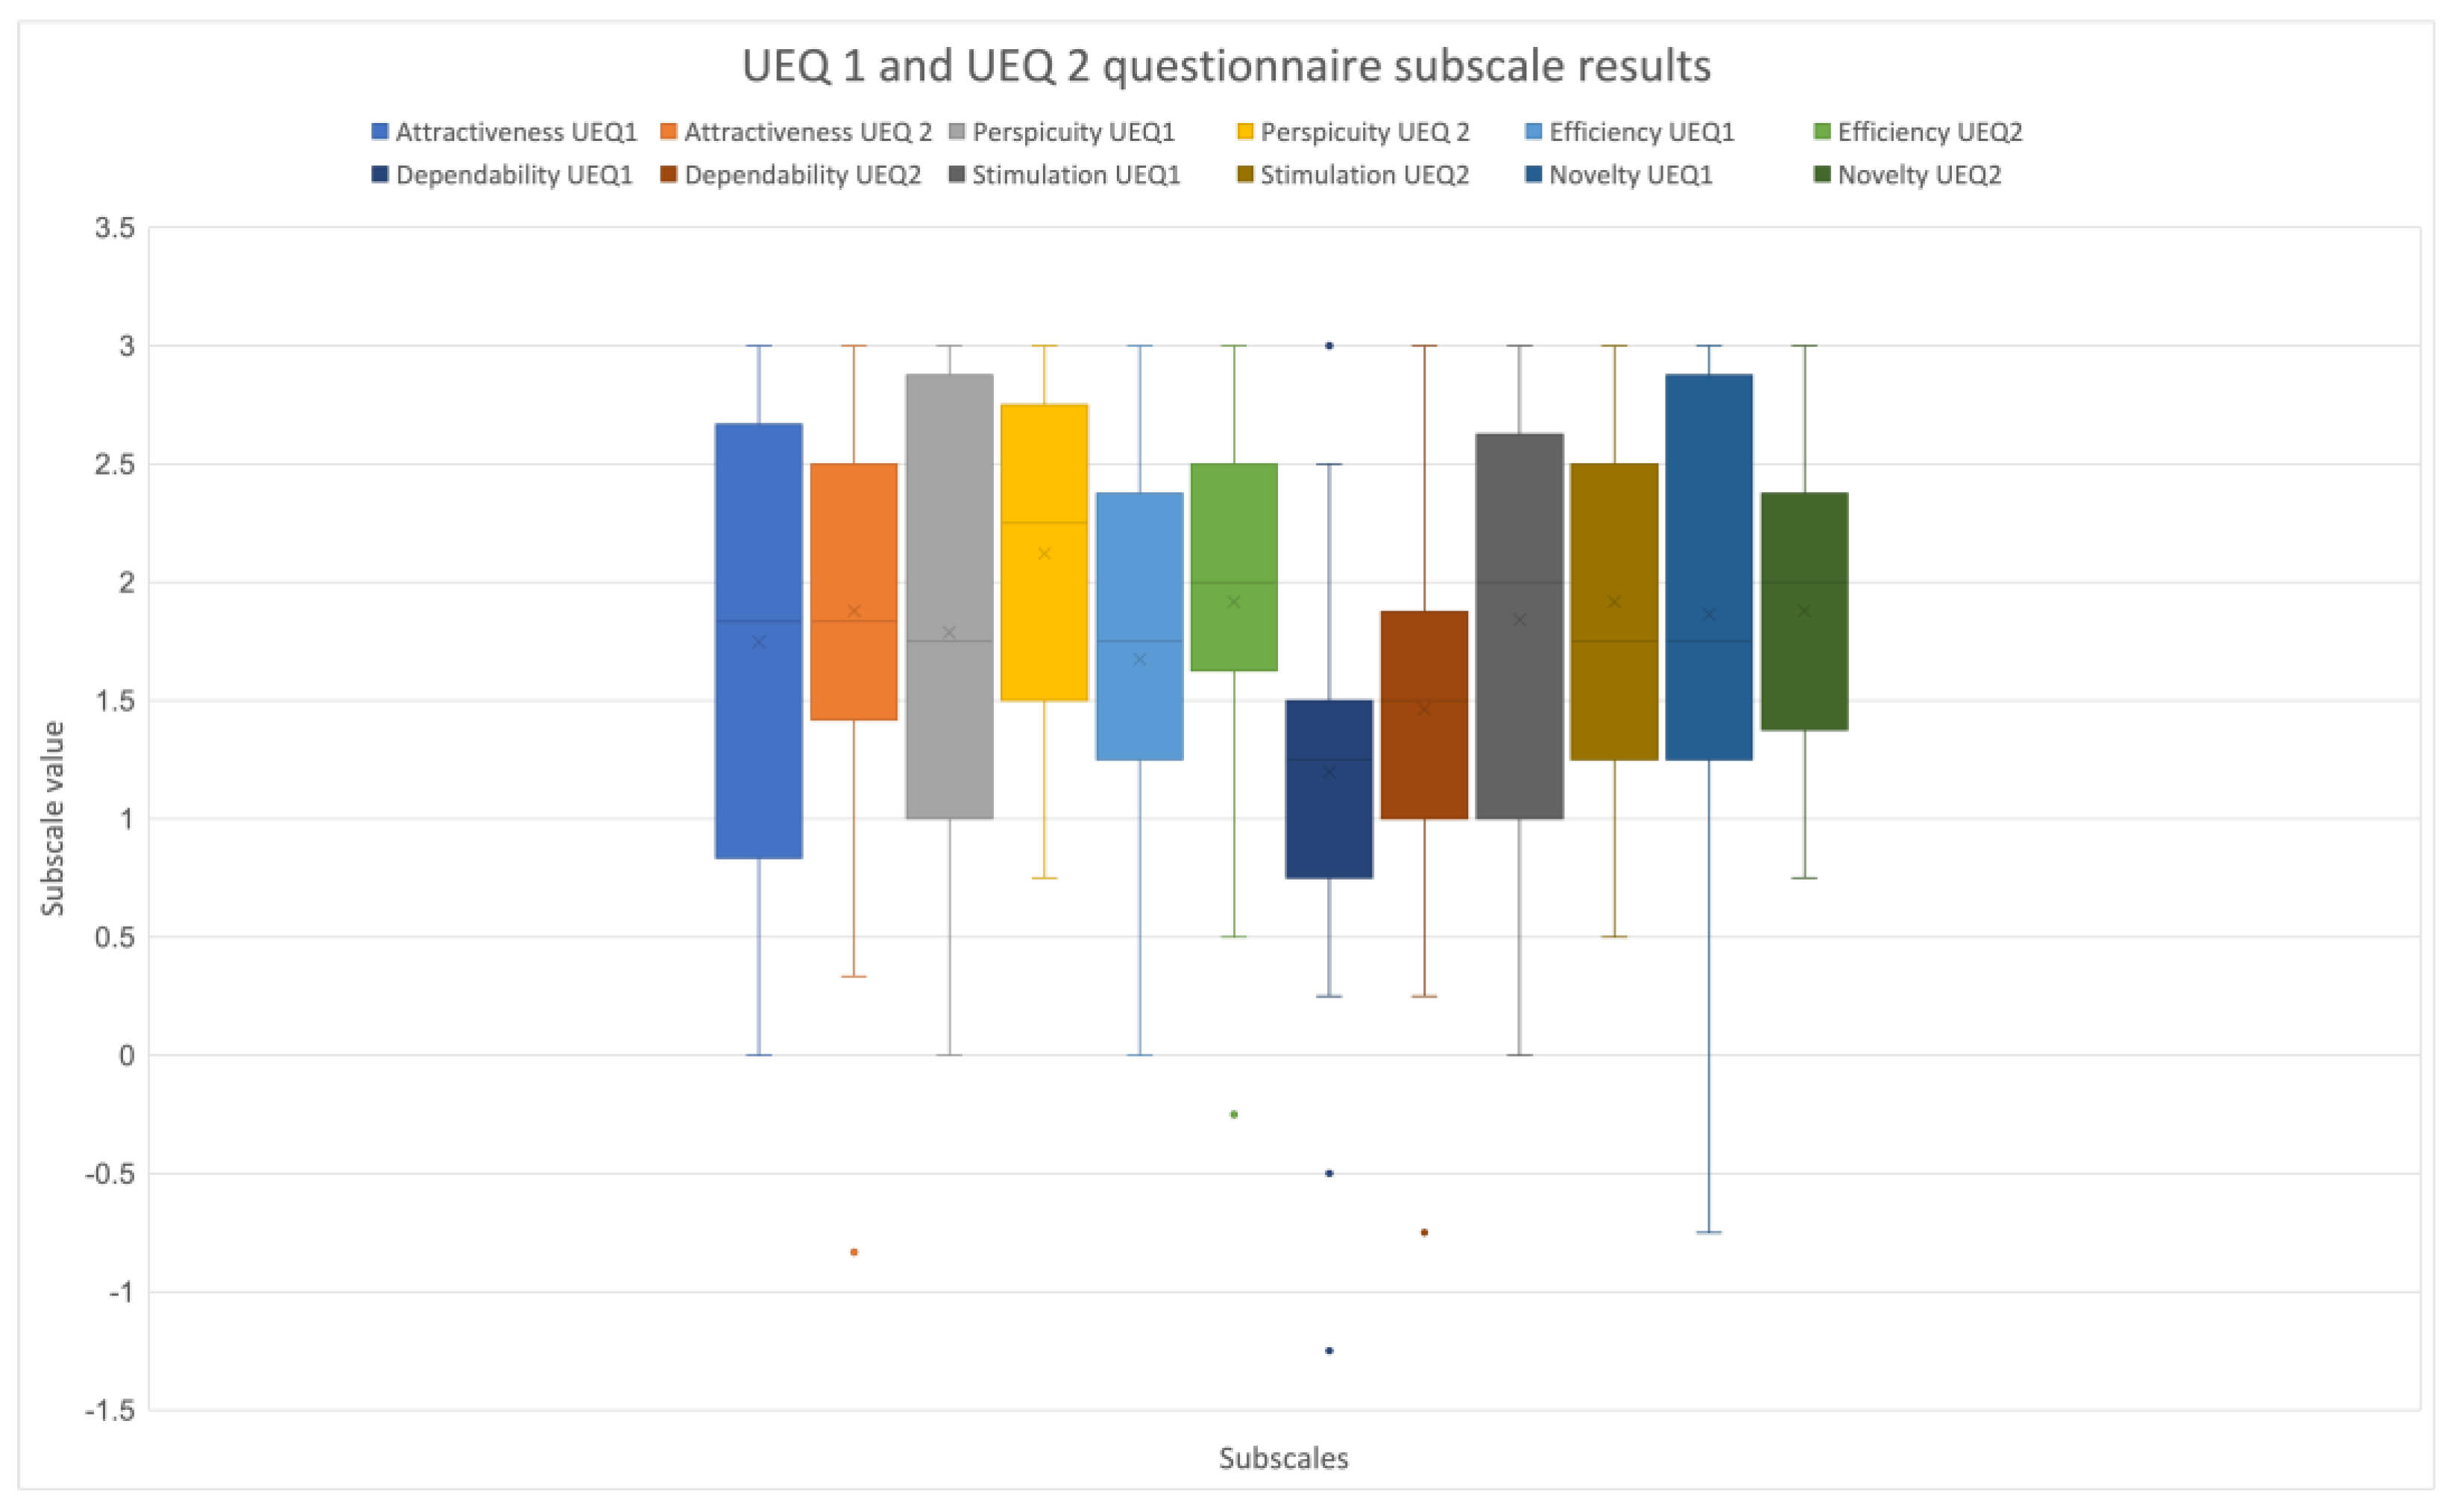
The comparison of UEQ subscale scores in scenarios S1 and S2 was overall favourable. Detailed summary results are presented in Table 2. We noticed that all subscale scores were higher in Scenario S2 than in Scenario S1. In Scenario S2, the highest scored subscales were perspicuity with a mean value of 2.12 (SD = 0.55), Efficiency with a mean value of 1.91 (SD = 0.58), and Stimulation with a mean value of 1.92 (SD = 0.57). Scenario S2 represented the driving condition in which participants used the DT+ mobile application, indicating that driving with the aid of the DT+ application provided a better user experience than driving without it. A comparison is shown in Figure 2.
Table 2.
Mean value scores for UEQ subscales for scenarios S1 (without DT+ mobile application) and S2 (with DT+ mobile application). Bold values indicate mean scores and standard deviations that are particularly relevant for the interpretation of the research findings.
Figure 2.
Comparison of UEQ subscales for scenario S1 (driving without DT+ mobile application) and scenario S2 (driving with DT+ mobile application).
We detect a significant difference (p < 0.05) in comparison of subscale Perspicuity scores in scenarios S1 and S2, Z = −2.08, p = 0.04, as shown in Table 3. Although the difference in Perspicuity between S1 and S2 was statistically significant, the absolute mean difference was modest (1.79 vs. 2.12). Since both values were already in the positive range of the UEQ scale, this result should be interpreted as a modest but consistent improvement in perceived clarity and ease of understanding when DT+ was available, rather than as a large practical difference.
Table 3.
Wilcoxon signed-rank test results for significant differences between UEQ subscales scores of scenarios S1 and S2. Statistically significant results (p < 0.05) are shown in bold.
User experience was additionally assessed using the validated meCUE 2.0 questionnaire. Descriptive results indicated slightly more favourable ratings for Scenario S2 (with the DT+ mobile application) than for Scenario S1 (without the DT+ mobile application) across most meCUE dimensions. In Module I, Usefulness increased from 5.30 (SD = 1.02) in S1 to 5.75 (SD = 0.63) in S2, while Usability increased from 5.80 (SD = 0.85) to 5.97 (SD = 0.75). These subscales reflect instrumental product qualities and capture aspects of user experience related to perceived usefulness and ease of use.
In Module II, Visual aesthetics was rated at 5.43 (SD = 0.95) in S1 and 5.72 (SD = 0.62) in S2, while Status increased from 4.28 (SD = 1.09) to 4.50 (SD = 0.96). Commitment also showed a small increase, from 2.72 (SD = 1.12) in S1 to 2.97 (SD = 1.06) in S2. In Module III, Positive emotions were similar across scenarios, with mean scores of 3.69 (SD = 1.16) in S1 and 3.76 (SD = 1.20) in S2. Negative emotions were lower in S2, decreasing from 2.60 (SD = 1.06) in S1 to 2.38 (SD = 0.94).
In Module IV, Intention to use increased from 4.27 (SD = 1.40) in S1 to 4.68 (SD = 1.16) in S2, and Product loyalty increased from 4.05 (SD = 1.15) to 4.38 (SD = 0.75).
Overall evaluation (Module V) was also higher in S2, with a mean score of 3.5 (SD = 1.2), compared with 3.1 (SD = 1.6) in S1.
Overall, the descriptive meCUE 2.0 results suggest a more positive user experience for the scenario involving the DT+ mobile application. Detailed results are presented in Table 4.
Table 4.
Comparison of meCUE 2.0 module subscale scores for Scenario S1 (without the DT+ mobile application) and Scenario S2 (with the DT+ mobile application). Statistically significant results (p < 0.05) are shown in bold.
Wilcoxon signed-rank tests showed (Table 5) significant differences between Scenario S2 and Scenario S1 on several meCUE 2.0 subscales. Significant differences were observed for Usefulness (Z = −4.26, p = 0.001), Visual Aesthetics (Z = −3.15, p = 0.002), Commitment (Z = −5.02, p = 0.001), Negative Emotions (Z = −4.52, p = 0.001), Intention to Use (Z = −3.27, p = 0.001), Product Loyalty (Z = −2.21, p = 0.027), and Overall Evaluation (Z = −4.05, p = 0.001). In combination with the descriptive results, these findings indicate that Scenario S2 was perceived more favourably than Scenario S1 in terms of usefulness, visual aesthetics, commitment, intention to use, product loyalty, and overall evaluation, while also eliciting lower negative emotional responses. These results suggest a more positive user experience for the scenario involving the DT+ mobile application.
Table 5.
Wilcoxon signed-rank test results for differences in meCUE 2.0 subscale scores between Scenario S1 and Scenario S2. Statistically significant results (p < 0.05) are shown in bold.
4.3. User Experience Questionnaire and meCue Questionnaire Results Correlation
Correlations between the UEQ and meCUE 2.0 subscales were calculated using Spearman’s rho in order to examine the degree of association between related user experience dimensions measured by the two instruments. The analysis was conducted separately for both experimental scenarios: S1, without the use of the DT+ mobile application, and S2, with the use of the DT+ mobile application. The purpose of this analysis was to explore whether both questionnaires produced comparable patterns of user experience assessment across the two scenarios.
In scenario S1, several statistically significant correlations were found between UEQ and meCUE 2.0 subscales. A moderate positive correlation was observed between UEQ Attractiveness and meCUE Overall Evaluation (ρ = 0.519, p = 0.002), indicating that participants who rated the experience as more attractive (indicating overall user experience) on the UEQ also tended to provide a higher overall evaluation in the meCUE 2.0 questionnaire. A similarly moderate positive correlation was found between UEQ Efficiency and meCUE Commitment (ρ = 0.519, p = 0.002), suggesting that participants who perceived the interaction as more efficient also reported stronger commitment or engagement with the evaluated system. In addition, weaker but statistically significant positive correlations were found between UEQ Efficiency and meCUE Usability (ρ = 0.363, p = 0.038), UEQ Dependability and meCUE Positive Emotions (ρ = 0.352, p = 0.044), and UEQ Novelty and meCUE Usability (ρ = 0.386, p = 0.027). These results suggest partial convergence between the two questionnaires, particularly in relation to pragmatic user experience qualities such as efficiency and usability, as well as broader evaluative dimensions such as attractiveness and overall evaluation.
In scenario S2, fewer statistically significant correlations were identified. A positive correlation was found between UEQ Efficiency and meCUE Negative Emotions (ρ = 0.359, p = 0.040), while a negative correlation was found between UEQ Stimulation and meCUE Positive Emotions (ρ = −0.387, p = 0.026). Compared with S1, the correlation pattern in S2 was less consistent and more difficult to interpret. The negative correlation between UEQ Stimulation and meCUE Positive Emotions is particularly unexpected, as higher stimulation would generally be expected to correspond to more positive emotional responses. This result may indicate scenario-specific effects, differences in how the two questionnaires operationalize user experience, or possible effects of scale interpretation and response variability.
Overall, the findings indicate that the UEQ and meCUE 2.0 questionnaire showed partial compatibility in assessing user experience, especially in scenario S1, where several theoretically meaningful correlations were observed. However, the weaker and less consistent pattern of correlations in S2 suggests that the two instruments should not be treated as interchangeable. Rather, they provide complementary perspectives on user experience: the UEQ focuses more strongly on pragmatic and hedonic quality dimensions, whereas meCUE 2.0 additionally captures emotional responses, commitment, and overall evaluation.
4.4. Simulator Sickness Results
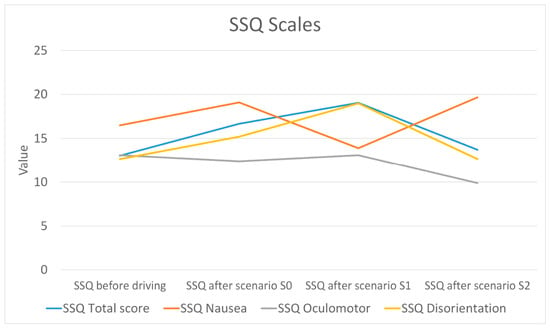
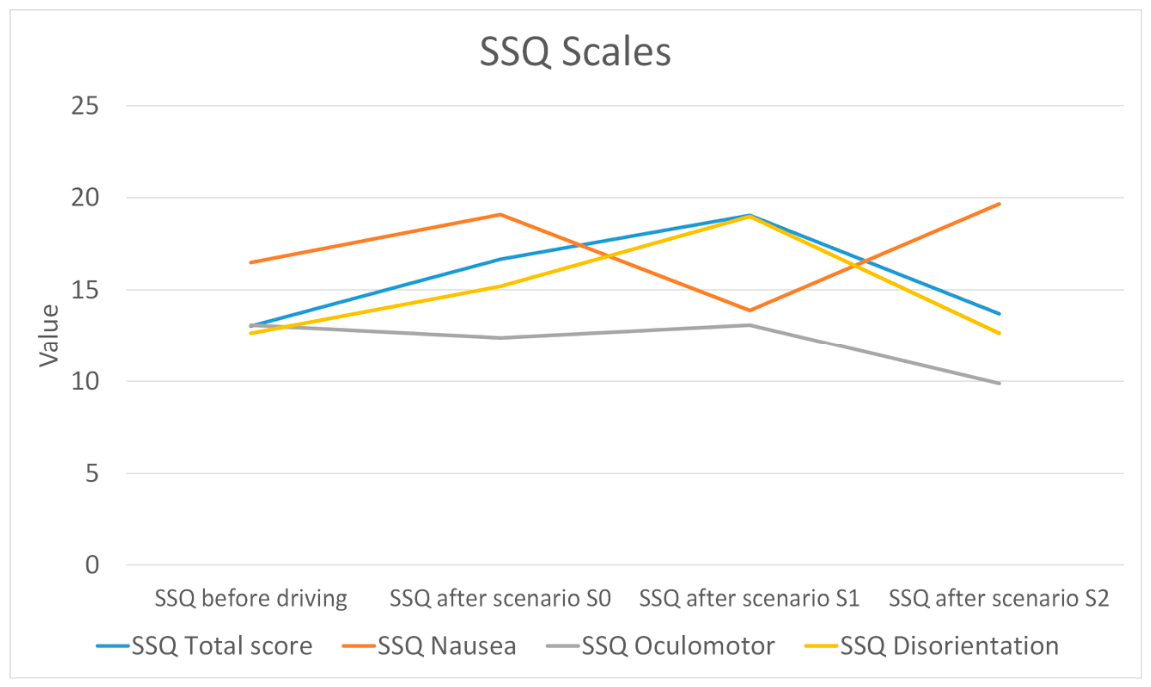
Simulator sickness was assessed using the Simulator Sickness Questionnaire (SSQ) before simulator driving and after each driving scenario. Descriptive results (Table 6) showed that the SSQ total score increased from a baseline mean of 13.03 (SD = 14.15) before driving to 16.66 (SD = 18.13) after Scenario S0 and 19.04 (SD = 20.96) after Scenario S1, before decreasing to 13.71 (SD = 15.91) after Scenario S2. This pattern suggests that simulator sickness symptoms were most pronounced after Scenario S1 and returned close to baseline levels after Scenario S2.
Table 6.
SSQ subscale mean scores before simulator driving and after each driving scenario.
A similar pattern was observed for the SSQ nausea subscale. The mean nausea score increased from 8.09 (SD = 11.22) before driving to 16.48 (SD = 17.57) after Scenario S0 and 19.08 (SD = 22.88) after Scenario S1, before declining to 13.88 (SD = 18.02) after Scenario S2. Oculomotor symptoms were relatively stable across the first two scenarios, with mean scores of 13.09 (SD = 13.44) before driving, 12.40 (SD = 13.38) after Scenario S0, and 13.09 (SD = 13.30) after Scenario S1, and then decreased to 9.88 (SD = 10.11) after Scenario S2. Disorientation scores increased from 12.65 (SD = 19.18) at baseline to 15.19 (SD = 22.38) after Scenario S0 and 18.98 (SD = 28.23) after Scenario S1, before returning to 12.65 (SD = 21.27) after Scenario S2.
Overall, the descriptive SSQ results (Figure 3) indicate that simulator sickness symptoms increased during the early stages of the simulator session, particularly after Scenario S1, but were reduced by the end of the experiment. Across all SSQ dimensions, substantial standard deviations and wide score ranges were observed, indicating considerable inter-participant variability in susceptibility to simulator sickness effects.
Figure 3.
Comparison of SSQ score trends before simulator driving and after each driving scenario.
Wilcoxon signed-rank tests were conducted to compare SSQ scores between Scenario S1 and Scenario S2. The results showed (Table 7) a significant reduction in oculomotor symptoms in S2 compared with S1 (Z = −1.99, p = 0.046), as well as a significant reduction in the overall SSQ total score (Z = −2.09, p = 0.037). Differences in nausea (Z = −1.79, p = 0.074) and disorientation (Z = −1.66, p = 0.096) were not statistically significant.
Table 7.
Wilcoxon signed-rank test results for significant differences between SSQ subscales for Scenario S1 (driving without DT+ mobile application) and Scenario S2 (driving with DT+ mobile application). Statistically significant results (p < 0.05) are shown in bold.
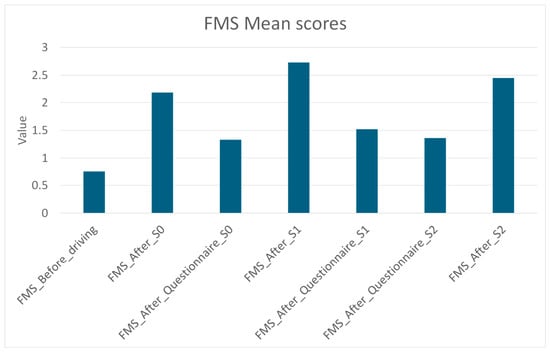
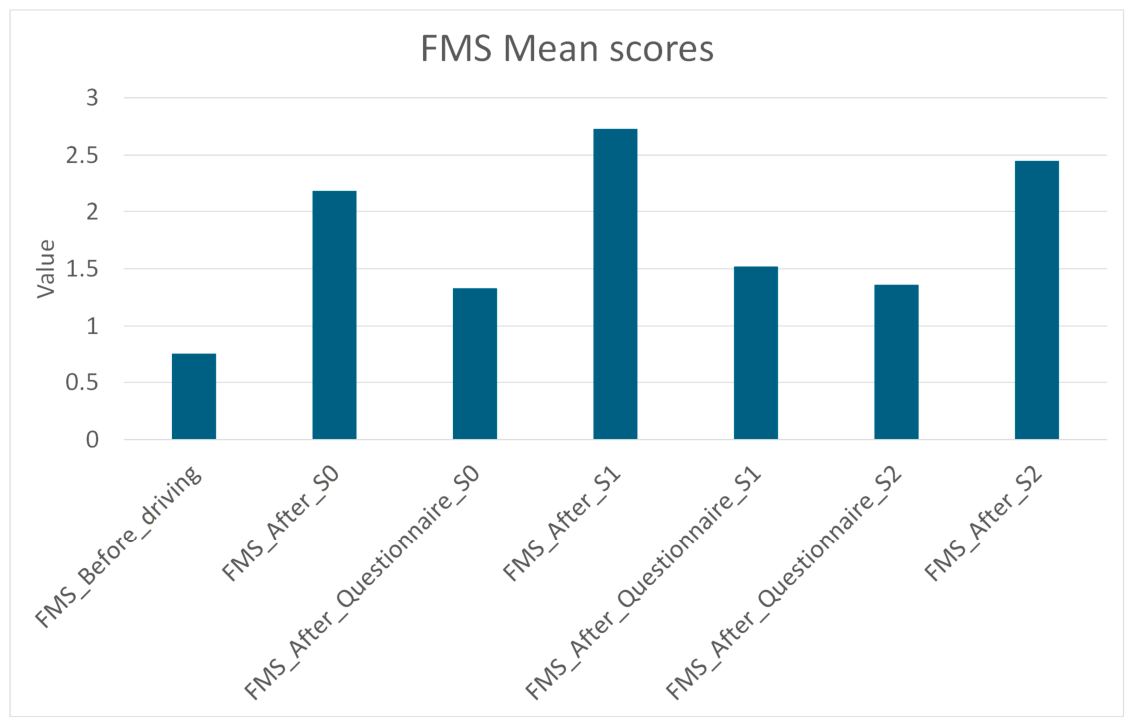
In addition to the SSQ, the Fast Motion Sickness Scale (FMS) was used to assess simulator sickness (Table 8). Fast Motion Sickness Scale scores were low before simulator driving (M = 0.76, SD = 1.25) but increased after each driving scenario. The mean FMS score rose to 2.18 (SD = 3.28) after Scenario S0, 2.73 (SD = 3.78) after Scenario S1, and 2.45 (SD = 3.68) after Scenario S2. The highest immediate post-drive FMS score was observed after Scenario S1, indicating that this scenario elicited the strongest motion sickness response. After each post-scenario questionnaire period, FMS scores decreased to 1.33 (SD = 2.10) after S0, 1.52 (SD = 2.76) after S1, and 1.36 (SD = 2.63) after S2, suggesting partial recovery following each driving session. Observed FMS scores do not imply strong simulator sickness effects, as they are mostly below 4 considering the mean values, which implies mild motion sickness effects [20].
Table 8.
FMS scores before simulator driving and after each driving scenario and post-scenario questionnaire period.
Figure 4 shows that mean FMS scores increased after each driving scenario compared with the pre-driving baseline. The baseline score before simulator driving was lowest, while the highest mean FMS score was observed after Scenario S1. After each post-scenario questionnaire period, the mean FMS score decreased relative to the immediately preceding driving scenario, indicating recovery. Overall, the graph suggests a repeated pattern of short-term increases in motion sickness after simulator driving followed by a reduction in symptoms during the subsequent non-driving interval.
Figure 4.
Mean FMS scores before simulator driving and after each driving scenario and post-scenario questionnaire period.
Wilcoxon signed-rank tests showed (Table 9) significant changes in FMS scores across consecutive measurement points. FMS scores increased significantly from before driving to after Scenario S0 (Z = −2.584, p = 0.010). They then decreased significantly from immediately after Scenario S0 to after the subsequent questionnaire period (Z = −2.030, p = 0.042). A further significant increase was observed after Scenario S1 compared with the post-questionnaire S0 measurement (Z = −2.590, p = 0.010), followed by a significant decrease after the questionnaire period following S1 (Z = −2.456, p = 0.014). Finally, FMS scores increased significantly again after Scenario S2 relative to the post-questionnaire S1 measurement (Z = −1.993, p = 0.046). After scenario S2 questionnaire FMS score decreased (Z = −2.502, p = 0.120). Overall, these findings indicate that each driving scenario induced a significant short-term increase in motion sickness symptoms, followed by partial symptom reduction during the subsequent non-driving interval.
Table 9.
Wilcoxon signed-rank test results for differences in FMS scores before simulator driving and between consecutive post-scenario measurement points. Statistically significant results (p < 0.05) are shown in bold.
4.5. Positive and Negative Affect Schedule Results
Positive and negative affect were assessed using the PANAS questionnaire at the beginning and the end of the pilot evaluation. A Wilcoxon signed-rank test was conducted to examine changes in affective state over the course of the study. No statistically significant difference was found for positive affect between the pre- and post-study measurements (Z = −0.40, p = 0.68). In contrast, negative affect decreased significantly by the end of the evaluation (Z = −2.48, p = 0.01). Descriptively, the mean positive affect score changed only slightly, from 34.09 (SD = 6.26) before the simulator session to 33.52 (SD = 7.18) after the evaluation, whereas the mean negative affect score decreased from 15.79 (SD = 3.25) to 14.64 (SD = 3.13). These findings suggest that participation in the study did not significantly alter positive affect, while negative affect was significantly reduced by the end of the evaluation. A possible explanation is that participants experienced less uncertainty or tension after becoming familiar with the simulator procedure. Results are presented in Table 10 and Table 11.
Table 10.
Positive and Negative Affect Schedule results from before driving in the driving simulator (PA_1, NA_1) and at the end of the driving evaluation (PA_2, NA_2).
Table 11.
Wilcoxon signed-rank test results for significant differences between positive and negative PANAS affect results before driving in the driving simulator (PA_1, NA_1) and at the end of the driving evaluation (PA_2, NA_2). Statistically significant results (p < 0.05) are shown in bold.
4.6. Post-Interview Results
A post-interview was conducted at the end of the DT+ mobile application evaluation to obtain participants’ overall subjective assessments of key usability and user experience attributes using a five-point Likert scale. The results (Table 12) showed consistently favourable ratings across all items. Perceived usability received a mean score of 4.79 (SD = 0.48), and perceived user experience received a mean score of 4.58 (SD = 0.71). Visual aspects of the application were also positively evaluated, including the colour palette (M = 4.61, SD = 0.56) and visual hierarchy of icons (M = 4.82, SD = 0.46). The size of the interaction fields was rated positively as well (M = 4.55, SD = 0.83). Overall, these descriptive results suggest high participant satisfaction with the application’s usability and interface design.
Table 12.
Post-interview ratings from the pilot evaluation of the DT+ mobile application using a five-point Likert scale.
The post-interview scores were generally high across the evaluated usability and user-experience items, indicating a favourable overall subjective assessment of the DT+ mobile application. However, possible differences between participant groups were not analysed separately in this pilot study. Participants differed in occupational background, driving experience, daily driving habits, use of traffic-support applications, and previous experience with DT+. These characteristics may have influenced individual ratings, but the limited sample size and the small number of participants in some subgroups did not allow for reliable subgroup-level interpretation. Therefore, the post-interview results should be interpreted as an overall descriptive assessment of the complete participant sample rather than as evidence of uniform evaluation across all driver profiles.
4.7. Visual Observations
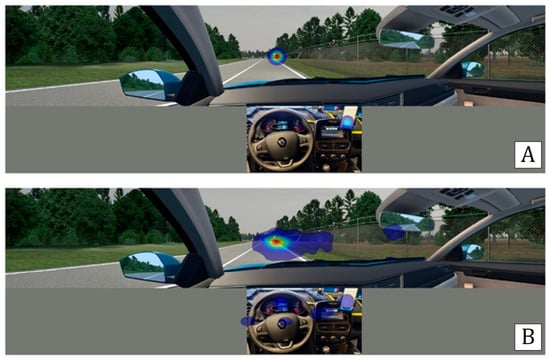
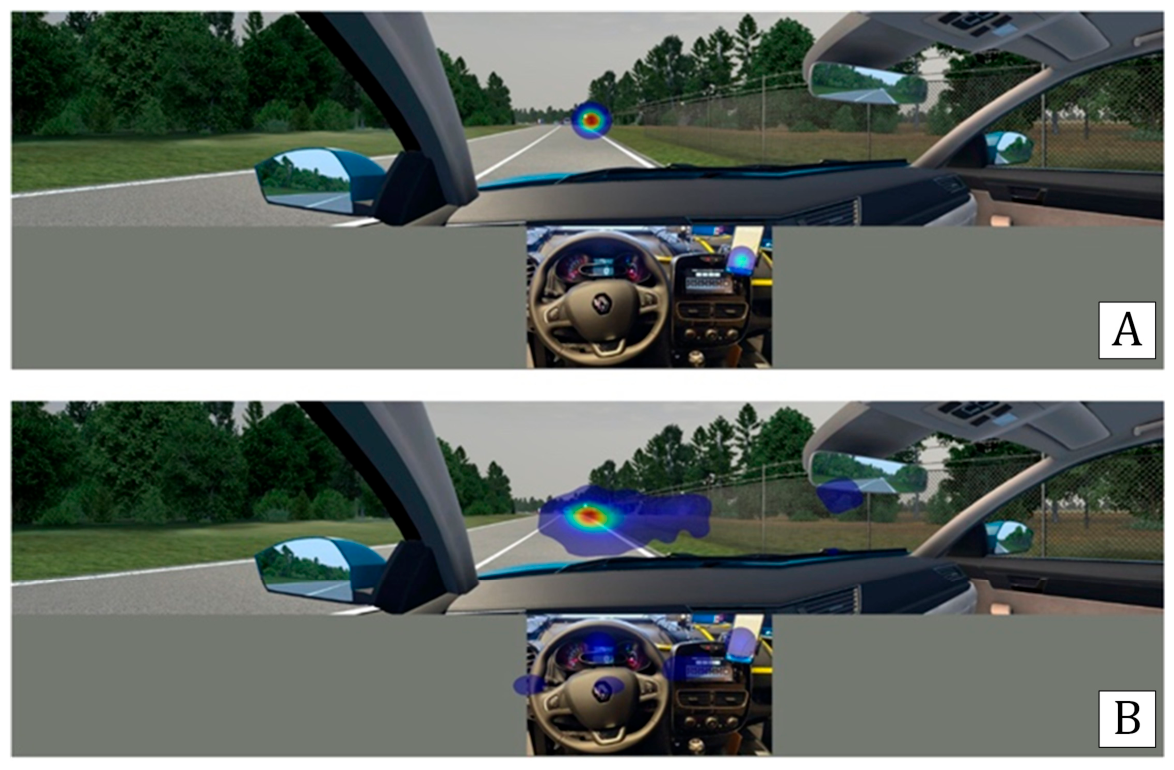
During the evaluation of the DT+ mobile application, differences in gaze distribution on the road were observed in the eye-tracking data. Participants who reported elevated levels of simulator sickness showed a more scattered visual pattern across the simulator screens, whereas participants who did not report simulator sickness symptoms exhibited a more focused gaze distribution. In particular, participants with stronger simulator sickness symptoms appeared to allocate more visual attention toward the edge of the road, with their gaze shifting from the centre of the road scene toward its periphery. Figure 5 illustrates this pattern: the top image (A) presents an example heatmap for a specific participant who did not report simulator sickness symptoms, showing a concentrated focus on the road ahead. However, the bottom image (B) presents an example heatmap for a participant who reported more expressed simulator sickness symptoms, showing a more dispersed gaze pattern. The images show a brief moment before reaching a hazardous section of the road.
Figure 5.
Eye-tracking heatmaps in the driving simulator. The top image (A) shows an example of a concentrated gaze pattern for a participant without simulator sickness symptoms, whereas the bottom image (B) shows an example of a more scattered gaze pattern for a participant with more expressed simulator sickness symptoms.
5. Discussion
This pilot study investigated participants’ experience of the DARS Traffic Plus (DT+) mobile application in a professional driving simulator and examined whether its use was associated with simulator sickness or affective burden. Overall, the results indicate that DT+ was positively experienced in the simulator setting and that the scenario with DT+ support (S2) was generally perceived more favourably than the comparable scenario without the application use (S1). At the same time, the study confirms that simulator sickness remains a relevant methodological issue in driving-simulator-based UX evaluation, although the adopted protocol appears to have reduced symptom accumulation between successive driving tasks.
RQ1. How do participants perceive the user experience of the DARS Traffic Plus mobile application in a driving simulator setting?
Regarding RQ1, the results suggest that participants perceived the DT+ mobile application as usable and positively experienced. Across the UEQ, all subscales were positive in both scenarios, with higher values in S2 than in S1 and a significant difference for Perspicuity, indicating that the application particularly improved the perceived clarity and comprehensibility of the driving experience. The meCUE 2.0 results converged with this general pattern: S2 showed higher scores on several instrumental and experiential dimensions, including usefulness, visual aesthetics, commitment, intention to use, product loyalty, and overall evaluation. The post-interview results further supported this interpretation, as participants rated the application highly in terms of overall user experience, visual hierarchy and interactions. Taken together, these findings suggest that DT+ was not only acceptable for use in the simulator but was experienced as a supportive and well-designed interface for delivering hazard-related traffic information.
An important implication is that traffic-support mobile applications in driving contexts should not be evaluated solely in terms of functional correctness. In this study, participants’ responses indicate that the perceived quality of information presentation, visual structure, and ease of comprehension were central to the overall experience. This is especially relevant for applications such as DT+, where the value of warnings depends not only on their availability, but also on whether they can be integrated into the driving task without causing excessive cognitive or perceptual burden. Under the present simulator conditions, the application appears to have achieved this balance reasonably well.
The high-scoring user-experience dimensions can also be interpreted in relation to the design characteristics of the DT+ interface. The significant improvement in UEQ Perspicuity suggests that the application supported clearer understanding of the driving situation when hazardous-location information was available. This is consistent with the design goal of presenting traffic warnings in a simple, recognizable, and quickly interpretable form. Similarly, the higher meCUE 2.0 scores for usefulness and intention to use indicate that participants perceived the warnings as practically relevant for the driving task, while the higher visual-aesthetics score and the favourable post-interview ratings for colour palette, icon hierarchy, and interaction-field size suggest that the visual structure of the interface contributed positively to the overall experience. In this sense, the main design strengths of DT+ appear to be the clear organization of warning information and visually distinct notification elements.
These findings are broadly consistent with similar studies on in-vehicle and driving-related mobile interfaces, which show that positive user experience depends not only on the availability of information, but also on the clarity, timing, transparency, and perceived usefulness of its presentation. Studies on mobile and in-vehicle interfaces in automated-driving contexts have similarly shown that transparent information presentation can improve perceived control, safety, and user experience [36].
RQ2. Do the UEQ and meCUE 2.0 lead to similar overall conclusions about the user experience of the DARS Traffic Plus mobile application?
Regarding RQ2, the findings suggest that the UEQ and meCUE 2.0 provided partly convergent, but not fully overlapping, perspectives on the user experience of the DT+ mobile application. At the overall interpretive level, both instruments pointed in the same direction: the scenario with DT+ support (S2) was evaluated more favourably than the comparable scenario without the application (S1). This convergence strengthens confidence in the general conclusion that DT+ was positively experienced in the driving simulator setting. At the same time, the two questionnaires emphasized different aspects of that experience. The UEQ primarily reflected improvements in perceived clarity, with a significant difference for Perspicuity, whereas the meCUE 2.0 questionnaire captured a broader range of differences, including usefulness, visual aesthetics, commitment, intention to use, product loyalty, lower negative emotions, and overall evaluation. These differences are consistent with the conceptual structure of the instruments: the UEQ focuses more strongly on pragmatic and hedonic quality dimensions, whereas meCUE 2.0 additionally addresses emotional and consequence related aspects of use.
The correlation analysis provides only limited support for direct construct level alignment between the two tools. In Scenario S1, several statistically significant associations were found between related dimensions, suggesting partial overlap in how the two questionnaires captured pragmatic and overall evaluative qualities. In Scenario S2, however, the correlation pattern was weaker and less consistent, with some relationships proving difficult to interpret. This indicates that the two instruments should not be treated as interchangeable measures of the same underlying constructs. Rather, in the present study they appear to function best as complementary tools: the UEQ offered a concise overview of pragmatic and hedonic quality, while meCUE 2.0 provided a more differentiated picture of emotional, experiential, and behavioural consequences of use. Taken together, the results suggest practical convergence in the overall appraisal of DT+, but only partial convergence at the level of specific subscales.
RQ3. To what extent does simulator sickness occur during the driving simulator evaluation, and how might it influence interpretation of the user experience results?
Regarding RQ3, simulator sickness was clearly present in a subset of participants and should be treated as a non-trivial factor in the evaluation design. The descriptive SSQ and FMS results showed that sickness symptoms increased during simulator exposure and then decreased during subsequent non-driving intervals. These findings suggest two important points. First, simulator sickness was not eliminated and likely contributed to some attrition, as six participants did not complete all scenarios. Second, the evaluation procedure appears to have moderated symptom accumulation by incorporating a familiarization drive, breaks, and questionnaire completion outside the simulator. The results therefore support a claim of partial mitigation rather than absence of sickness. Importantly, the presence of simulator sickness did not invalidate the UX findings, but it does qualify them: the reported user experience should be understood as emerging under simulator conditions in which some participants experienced some discomfort.
The eye-tracking observations provide a potentially useful, but still exploratory, perspective on this issue. Participants reporting stronger simulator sickness appeared to show a more scattered gaze distribution and greater attention toward the edge of the road, whereas participants without sickness symptoms appeared to focus more consistently on the road ahead. Because this pattern was not formally tested, it should not yet be interpreted as a causal mechanism. Nevertheless, it raises a meaningful hypothesis for future work: gaze allocation strategy may be associated with the onset or management of simulator sickness in complex driving-simulator tasks.
RQ4. Does participation in the driving simulator evaluation affect participants’ affective state?
Regarding RQ4, participation in the evaluation did not produce evidence of adverse affective consequences. Positive affect did not change significantly from pre- to post-evaluation, whereas negative affect decreased significantly by the end of the session. A plausible interpretation is that participants became more comfortable as they adapted to the simulator environment and study procedure. This interpretation is consistent with the temporal pattern observed in FMS scores, which repeatedly declined after non-driving intervals. Accordingly, the study does not suggest that the protocol imposed a substantial negative affective burden on participants overall, although this conclusion should be interpreted in light of the participants who withdrew due to simulator sickness.
Overall, the present findings suggest that the DT+ mobile application can deliver a positive user experience in a driving simulator while supporting hazardous-location awareness without clear evidence of increased affective burden. At the same time, the study reinforces that simulator sickness must be treated as an integral methodological consideration in simulator-based UX evaluation. The practical value of this work lies not only in the favourable evaluation of DT+, but also in showing how user experience assessment and sickness monitoring can be combined in a structured simulator-based evaluation protocol.
6. Study Limitations and Mitigation Measures
Several limitations should be considered when interpreting the results of this pilot study. Simulator sickness is a factor that cannot be fully controlled in driving simulator experiments and may influence participant performance and data collection. In the present study, six out of thirty-nine participants did not complete all driving scenarios due to simulator sickness symptoms, resulting in a final sample of thirty-three participants. Although this reduction in sample size is not uncommon in simulator-based studies, it may limit the statistical power and generalizability of the findings. A further limitation concerns the final sample size. Although 39 participants were recruited, six participants did not complete all scenarios due to simulator sickness, resulting in 33 complete datasets for the within-subject comparisons. Because this was a pilot simulator-based evaluation, no formal a priori sample-size calculation was performed. The final sample size may be sufficient to detect medium or larger within-subject effects, but it provides limited statistical sensitivity for smaller effects, particularly in the presence of substantial inter-participant variability in user experience, simulator sickness, and affective responses. Therefore, non-significant findings should not be interpreted as evidence of no effect, and the results should be considered exploratory and interpreted with caution.
Participant heterogeneity represents a potential limitation of the study. Participants differed in occupational background, driving experience, daily driving habits, preferred road types, use of traffic-support applications, and previous experience with the DT+ mobile application. Although this heterogeneity is appropriate for a pilot evaluation of an application intended for general drivers, it may have introduced inter-participant variability in subjective ratings, including the post-interview evaluations. For example, participants who drive more frequently, mainly use motorways, or already use traffic-support applications may perceive hazardous-location notifications differently from participants with less frequent exposure to such systems. In addition, nine participants had prior experience with DT+, which may have increased their familiarity with the interface and influenced perceived clarity or usefulness in the DT+ condition. Due to the limited sample size, especially the small number of participants in some subgroups, these factors were not analysed separately. Therefore, the post-interview results should be interpreted as an overall descriptive assessment of the complete participant sample rather than as evidence of uniform evaluation across all driver profiles.
The evaluation was conducted in a controlled driving simulator environment rather than in real-world traffic conditions. While professional driving simulators provide a safe and repeatable testing environment, they cannot fully replicate the complexity and variability of real-world driving situations. Therefore, the results should be interpreted within the context of simulated driving conditions.
During the experiment we observed a tendency for participants who reported higher levels of simulator sickness to focus their gaze closer to the vehicle and toward the edge of the road, whereas participants who directed their gaze further ahead on the road reported fewer symptoms. This observation was exploratory and was not formally tested within the scope of this study. Nevertheless, it suggests that visual focus strategies may play a role in the development or mitigation of simulator sickness.
To mitigate simulator sickness effects during the evaluation, several procedural measures were implemented. Participants were first familiarized with the driving simulator through an introductory scenario, and regular breaks were provided between scenarios to allow recovery from potential discomfort. Participants also exited the simulator to complete questionnaires, which further helped reduce accumulated symptoms.
It should also be noted that the simulator-sickness results reported for the repeated-measures analyses are based on the 33 participants who completed all scenarios. The six participants who withdrew from the experiment due to simulator-sickness symptoms could not be included in the complete within-subject comparisons. Their withdrawal nevertheless provides important evidence that simulator sickness represented a meaningful methodological burden in the study. Therefore, the reported SSQ and FMS results may underestimate the full severity of simulator sickness across the recruited sample, and the UX findings may partly reflect the responses of participants who were able to tolerate the simulator protocol.
7. Conclusions
This pilot study evaluated the DARS Traffic Plus (DT+) mobile application in a professional driving simulator with simultaneous assessment of user experience, simulator sickness, and participant affect. Overall, the results indicate that DT+ was positively perceived in the simulator setting. Across the applied UX measures, the scenario with DT+ support (S2) was generally evaluated more favourably than the comparable scenario without the application (S1), and the post-interview results further supported high participant satisfaction with the application’s usability and interface design. These findings suggest that DT+ can provide a supportive and positively experienced interface for hazardous-location information delivery in simulated driving conditions.
The study also confirmed that simulator sickness remains an important methodological consideration in simulator-based evaluations of driving-related mobile applications. SSQ and FMS results showed that sickness symptoms occurred in a subset of participants and increased during driving exposure but also decreased during subsequent non-driving intervals. In the direct comparison between S1 and S2, lower oculomotor and total SSQ scores in S2 suggest that the evaluation protocol supported testing under manageable, although not symptom-free, conditions. Positive affect did not change significantly, whereas negative affect decreased by the end of the evaluation, indicating little evidence of adverse overall affective consequences among participants who completed the study.
Taken together, the empirical results demonstrate the value of the proposed multi-method evaluation model. Its core advantage is that it does not assess the mobile application only through perceived usability or user experience, but simultaneously considers simulator sickness, affective state, and exploratory gaze behaviour, which are important for interpreting results in driving-simulator studies. The model showed that DT+ was generally evaluated more favourably than the no application condition, particularly in terms of clarity, usefulness, visual aesthetics, commitment, intention to use, and overall evaluation, while simulator-sickness effects remained manageable for participants who completed the study. Therefore, the practical contribution of this work lies in demonstrating that professional driving simulators can support a structured and comprehensive evaluation of traffic-support mobile applications, provided that both user experience and simulator-induced methodological burden are assessed together. Future work should extend this evaluation model with larger samples, real-world validation, and more detailed quantitative eye-tracking indicators.
Author Contributions
Conceptualisation, G.B., M.P., and J.G.; Methodology, G.B., M.P., and J.G.; Software, J.G.; Validation, G.B., M.P., and J.G.; Formal analysis, G.B.; Investigation, G.B., M.P., and J.G.; Data curation, G.B.; Writing—original draft, G.B. and J.G.; Writing—review & editing, G.B., M.P., and J.G.; Visualisation, G.B.; Supervision, M.P. and J.G.; Project administration, J.G. All authors have read and agreed to the published version of the manuscript.
Funding
The authors acknowledge the financial support from the Slovenian Research Agency (research core funding No. P2-0450 and research core funding No. P2-0425).
Institutional Review Board Statement
The study was conducted in accordance with the Declaration of Helsinki, and approved by the Ethics Committee of University of Ljubljana, Faculty of Electrical Engineering (protocol code 00071/2020, date of approval 1 September 2020).
Informed Consent Statement
Informed consent was obtained from all subjects involved in the study.
Data Availability Statement
The data presented in this study are available on request from the corresponding author.
Conflicts of Interest
The authors declare no conflicts of interest.
Abbreviations
The following abbreviations are used in this manuscript:
| ADAS | Advanced Driver Assistance Systems |
| C-ITS | Cooperative Intelligent Transport Systems |
| DARS | Družba za avtoceste v Republiki Sloveniji |
| DIS | Driver Information Systems |
| DT+ | DARS Traffic Plus |
| FMS | Fast Motion Sickness Scale |
| IIHS | Insurance Institute for Highway Safety |
| IVIS | In-Vehicle Information Systems |
| meCUE | Modular Evaluation of Key Components of User Experience |
| NHTSA | National Highway Traffic Safety Administration |
| PANAS | Positive and Negative Affect Schedule |
| SSQ | Simulator Sickness Questionnaire |
| UEQ | User Experience Questionnaire |
| UX | User Experience |
| V2I | Vehicle-to-Infrastructure |
| V2P | Vehicle-to-Person |
| V2V | Vehicle-to-Vehicle |
References
- Reagan, I. Smartphones Lead to Distraction. Could They Also Prevent It? Available online: https://www.iihs.org/news/detail/smartphones-lead-to-distraction-could-they-also-prevent-it (accessed on 29 June 2024).
- Blincoe, L.J.; Miller, T.R.; Zaloshnja, E.; Lawrence, B. The Economic and Societal Impact of Motor Vehicle Crashes, 2010 (Revised). Ann. Emerg. Med. 2015, 66, 194–196. [Google Scholar] [CrossRef] [Scilit]
- Owens, J.M.; Dingus, T.A.; Guo, F.; Fang, Y.; Perez, M.; McClafferty, J. Crash Risk of Cell Phone Use While Driving: A Case-Crossover Analysis of Naturalistic Driving Data (Technical Report); AAA Foundation for Traffic Safety: Washington, DC, USA, 2018. [Google Scholar]
- Cescon, M.; Peruzzini, M. Evaluating UX and Usability in Automotive Human–Machine Interfaces: A Systematic Review. Appl. Sci. 2026, 16, 3437. [Google Scholar] [CrossRef] [Scilit]
- Van Dam, J.; Kass, S.J.; VanWormer, L. The effects of passive mobile phone interaction on situation awareness and driving performance. J. Transp. Saf. Secur. 2020, 12, 1007–1024. [Google Scholar] [CrossRef] [Scilit]
- Jabbari, Y.; von Mohrenschildt, M. Evaluating the effects of motion cues in virtual truck driver training. Transp. Res. Rec. 2025, 2679, 778–787. [Google Scholar]
- About C-ITS|CAR 2 CAR Communication Consortium. Available online: https://www.car-2-car.org/about-c-its/ (accessed on 8 June 2026).
- DARS d.d. Available online: https://www.dars.si/ (accessed on 17 June 2024).
- Wynne, R.A.; Beanland, V.; Salmon, P.M. Systematic Review of Driving Simulator Validation Studies. Saf. Sci. 2019, 117, 138–151. [Google Scholar] [CrossRef] [Scilit]
- Morales-Alvarez, W.; Certad, N.; Tadjine, H.H.; Olaverri-Monreal, C. Automated Driving Systems: Impact of Haptic Guidance on Driving Performance after a Take Over Request. In Proceedings of the 2022 IEEE Intelligent Vehicles Symposium (IV), Aachen, Germany, 4–9 June 2022; IEEE: New York, NY, USA, 2022; pp. 1817–1823. [Google Scholar]
- Peng, Y.; Boyle, L.N.; Lee, J.D. Reading, Typing, and Driving: How Interactions with in-Vehicle Systems Degrade Driving Performance. Transp. Res. Part F Traffic Psychol. Behav. 2014, 27, 182–191. [Google Scholar] [CrossRef] [Scilit]
- Luo, Q.; Wang, H.; Yang, J.; Zang, X.; Chen, X.; Postolache, O. Study on a Multi-Factor Lane-Changing Risk Resilience Assessment Model Based on Genetic Algorithm and Fault Tree Analysis. Accid. Anal. Prev. 2026, 230, 108443. [Google Scholar] [CrossRef] [Scilit] [PubMed]
- Zhai, C.; Wu, W.; Xiao, Y.; Zhang, J.; Zhai, M.; Wu, Y. A Novel Throttle-Based Self-Stabilizing Control Scheme Integrated into an Anisotropic Continuum Model to Mitigate Cyber-Attacks in Connected Vehicle Scenarios. Chaos Solitons Fractals 2025, 201, 117319. [Google Scholar] [CrossRef] [Scilit]
- Bruck, L.; Haycock, B.; Emadi, A. A Review of Driving Simulation Technology and Applications. IEEE Open J. Veh. Technol. 2021, 2, 1–16. [Google Scholar] [CrossRef] [Scilit]
- Oviedo-Trespalacios, O.; Haque, M.M.; King, M.; Washington, S. Understanding the Impacts of Mobile Phone Distraction on Driving Performance: A Systematic Review. Transp. Res. Part C Emerg. Technol. 2016, 72, 360–380. [Google Scholar] [CrossRef] [Scilit]
- Irwin, C.; Monement, S.; Desbrow, B. The Influence of Drinking, Texting, and Eating on Simulated Driving Performance. Traffic Inj. Prev. 2015, 16, 116–123. [Google Scholar] [CrossRef] [Scilit] [PubMed]
- Albert, G.; Musicant, O.; Oppenheim, I.; Lotan, T. Which Smartphone’s Apps May Contribute to Road Safety? An AHP Model to Evaluate Experts’ Opinions. Transp. Policy 2016, 50, 54–62. [Google Scholar] [CrossRef] [Scilit]
- Brooks, J.O.; Goodenough, R.R.; Crisler, M.C.; Klein, N.D.; Alley, R.L.; Koon, B.L.; Logan, W.C.; Ogle, J.H.; Tyrrell, R.A.; Wills, R.F. Simulator Sickness during Driving Simulation Studies. Accid. Anal. Prev. 2010, 42, 788–796. [Google Scholar] [CrossRef] [Scilit] [PubMed]
- Reinhard, R.; Rutrecht, H.M.; Hengstenberg, P.; Tutulmaz, E.; Geissler, B.; Hecht, H.; Muttray, A. The Best Way to Assess Visually Induced Motion Sickness in a Fixed-Base Driving Simulator. Transp. Res. Part F Traffic Psychol. Behav. 2017, 48, 74–88. [Google Scholar] [CrossRef] [Scilit]
- Keshavarz, B.; Hecht, H. Validating an Efficient Method to Quantify Motion Sickness. Hum. Factors 2011, 53, 415–426. [Google Scholar] [CrossRef] [Scilit] [PubMed]
- Kennedy, R.S.; Lane, N.E.; Berbaum, K.S.; Lilienthal, M.G. Simulator Sickness Questionnaire: An Enhanced Method for Quantifying Simulator Sickness. Int. J. Aviat. Psychol. 1993, 3, 203–220. [Google Scholar] [CrossRef] [Scilit] [PubMed]
- Stoner, H.; Fisher, D.; Mollenhauer, M., Jr. Simulator and Scenario Factors Influencing Simulator Sickness; Lee, J., Ed.; CRC Press: Boca Raton, FL, USA, 2011. [Google Scholar]
- Ronen, A.; Yair, N. The Adaptation Period to a Driving Simulator. Transp. Res. Part F Traffic Psychol. Behav. 2013, 18, 94–106. [Google Scholar] [CrossRef] [Scilit]
- Olaverri-Monreal, C.; Hasan, A.E.; Bulut, J.; Körber, M.; Bengler, K. Impact of In-Vehicle Displays Location Preferences on Drivers’ Performance and Gaze. IEEE Trans. Intell. Transp. Syst. 2014, 15, 1770–1780. [Google Scholar] [CrossRef] [Scilit]
- Zhou, F.; Yang, X.J.; de Winter, J.C.F. Using Eye-Tracking Data to Predict Situation Awareness in Real Time During Takeover Transitions in Conditionally Automated Driving. IEEE Trans. Intell. Transp. Syst. 2022, 23, 2284–2295. [Google Scholar] [CrossRef] [Scilit]
- El Hamdani, S.; Bouchner, P.; Kunclova, T.; Lehet, D. The Impact of Physical Motion Cues on Driver Braking Performance: A Clinical Study Using Driving Simulator and Eye Tracker. Sensors 2023, 23, 42. [Google Scholar] [CrossRef] [Scilit] [PubMed]
- Tan, H.; Sun, J.; Wenjia, W.; Zhu, C. User Experience & Usability of Driving: A Bibliometric Analysis of 2000–2019. Int. J. Hum.–Comput. Interact. 2021, 37, 297–307. [Google Scholar] [CrossRef] [Scilit]
- Duczman, M.; Brangier, E.; Thévenin, A. Criteria Based Approach to Assess the User Experience of Driving Information Proactive System: Integration of Guidelines, Heuristic Mapping and Case Study. In Proceedings of the Advances in Ergonomics in Design; Rebelo, F., Soares, M., Eds.; Springer International Publishing: Cham, Switzerland, 2016; pp. 79–90. [Google Scholar]
- Breitschaft, S.J.; Pastukhov, A.; Carbon, C.-C. Where’s My Button? Evaluating the User Experience of Surface Haptics in Featureless Automotive User Interfaces. IEEE Trans. Haptics 2022, 15, 292–303. [Google Scholar] [CrossRef] [Scilit] [PubMed]
- Pitts, M.J.; Skrypchuk, L.; Attridge, A.; Williams, M.A. Comparing the User Experience of Touchscreen Technologies in an Automotive Application. In Proceedings of the 6th International Conference on Automotive User Interfaces and Interactive Vehicular Applications; Association for Computing Machinery: New York, NY, USA, 2014; pp. 1–8. [Google Scholar]
- The Global Leader in Human Insight AI. Available online: https://smarteye.se/ (accessed on 8 June 2026).
- Brousseau, B.; Rose, J.; Eizenman, M. SmartEye: An Accurate Infrared Eye Tracking System for Smartphones. In Proceedings of the 2018 9th IEEE Annual Ubiquitous Computing, Electronics & Mobile Communication Conference (UEMCON), New York, NY, USA, 8–10 November 2018; IEEE: New York, NY, USA, 2018; pp. 951–959. [Google Scholar]
- Laugwitz, B.; Held, T.; Schrepp, M. Construction and Evaluation of a User Experience Questionnaire. In Proceedings of the 4th Symposium of the Workgroup Human-Computer Interaction and Usability Engineering of the Austrian Computer Society on HCI and Usability for Education and Work; Springer: Berlin/Heidelberg, Germany, 2008; pp. 63–76. [Google Scholar]
- Minge, M.; Thüring, M. The MeCUE Questionnaire (2.0): Meeting Five Basic Requirements for Lean and Standardized UX Assessment. In Proceedings of the Design, User Experience, and Usability: Theory and Practice; Marcus, A., Wang, W., Eds.; Springer International Publishing: Cham, Switzerland, 2018; pp. 451–469. [Google Scholar]
- Watson, D.; Clark, L.A.; Tellegen, A. Development and Validation of Brief Measures of Positive and Negative Affect: The PANAS Scales. J. Personal. Soc. Psychol. 1988, 54, 1063–1070. [Google Scholar] [CrossRef] [PubMed]
- Schneider, T.; Hois, J.; Rosenstein, A.; Ghellal, S.; Theofanou-Fülbier, D.; Gerlicher, A.R.S. ExplAIn Yourself! Transparency for Positive UX in Autonomous Driving. In Proceedings of the 2021 CHI Conference on Human Factors in Computing Systems, Yokohama Japan, 8–13 May 2021; ACM: New York, NY, USA, 2021; pp. 1–12. [Google Scholar]

Disclaimer/Publisher’s Note: The statements, opinions and data contained in all publications are solely those of the individual author(s) and contributor(s) and not of MDPI and/or the editor(s). MDPI and/or the editor(s) disclaim responsibility for any injury to people or property resulting from any ideas, methods, instructions or products referred to in the content. |
© 2026 by the authors. Licensee MDPI, Basel, Switzerland. This article is an open access article distributed under the terms and conditions of the Creative Commons Attribution (CC BY) license.