


Abstract
The mesomechanical properties of dolostone are critical for reservoir stimulation. Focusing on the dolostone from the Shunbei Oil and Gas Field, this study employed nanoindentation combined with SEM, EDS, and XRD to investigate its micromechanical behavior. The samples are predominantly composed of dolomite, with minor amounts of calcite and silicates, exhibiting heterogeneity in both mineral phases and pore structures. Nanoindentation results indicate that the elastic moduli are concentrated in the range of 90–120 GPa, with hardness values of 3–5 GPa and maximum indentation depths of 1.0–1.4 μm, reflecting high brittleness. Dense regions with a modulus of 149.09 GPa exhibit few cracks, whereas low-modulus regions at 109.2 GPa develop radial cracks. The fracture toughness ranges from 3.6 to 10.3 MPa·m0.5, and microdefects significantly degrade this toughness. The elastic modulus shows a moderate positive correlation with hardness; meanwhile, fracture toughness correlates positively with the elastic modulus and weakly with hardness, reflecting the synergistic control exerted by dense crystalline domains and defects. Furthermore, the elastic modulus varies nonlinearly with indentation depth, and fracture toughness exhibits a negative power-law correlation with depth, confirming the coupling effect between depth dependence and heterogeneity. This study establishes quantitative correlations among micromechanical heterogeneity, mineral phases, and pores. It provides a mesomechanical basis for fracturing optimization and wellbore stability in ultra-deep carbonate reservoirs, thereby expanding the application of nanoindentation techniques.
1. Introduction
As carbonate rocks constitute significant reservoirs for global oil and gas resources, their mechanical properties directly dictate the effectiveness of reservoir fracturing stimulation, wellbore stability, and long-term development outcomes. The carbonate reservoirs of the Lower Qiulitage Formation in the Shunbei Oil and Gas Field, China, are characterized by deep burial, high temperatures, high in-situ stress, and strong heterogeneity [1,2,3]. The complexity of their micromechanical behavior significantly influences macroscopic engineering responses. Although traditional macroscopic mechanical experiments can provide overall strength parameters, they struggle to reveal the mesoscale controlling mechanisms of mineral composition, pore structure, and microcracks on mechanical performance. As unconventional oil and gas development extends into deep and complex formations, there is an urgent need to analyze rock mechanical behavior at the microscale and establish quantitative macro-meso mechanical parameter correlations to provide theoretical support for efficient reservoir development. Nanoindentation technology, with its high resolution, minimally invasive nature, and capability for the synchronous acquisition of multiple parameters, has become a core tool for the micromechanical characterization of rocks [4]. By analyzing the indenter load-displacement curves, this technique can determine the material’s elastic modulus, hardness, creep properties, and fracture toughness. When combined with microscopic imaging techniques, it enables the spatial mapping of mineral phases and mechanical responses. In recent years, researchers have successfully applied nanoindentation to the micromechanical study of complex rocks such as shale, granite, and coal, revealing the governing mechanisms of mineral composition, pore structure, and interfacial effects on mechanical behavior [5].
The core principle of nanoindentation technology stems from the Oliver-Pharr method, which calculates parameters such as the material’s elastic modulus, hardness, and fracture toughness by recording the load-displacement curve during the loading and unloading of an indenter. Its development can be traced back to the 1980s, initially applied to the surface mechanical analysis of homogeneous materials like metals and ceramics. The contact stiffness analytical model proposed by Oliver et al. [1] established the theoretical foundation for this technique in micro- and nanoscale mechanical testing. Since the early 21st century, driven by improvements in instrument precision and the maturity of multi-technique integration, nanoindentation has increasingly gained prominence in the field of rock mechanics. Early studies focused on the mechanical properties of mineral phases in typical rocks such as shale and granite. For instance, Zhang et al. [6] applied nanoindentation to the Bakken shale and found a negative correlation between illite content and elastic modulus, revealing the dominant role of clay minerals in the mechanical weakening of shale. Wenda et al. [7] systematically studied the loading rate effect on the Longmaxi shale in the Sichuan Basin. They found that as the loading rate increased from 5 mN/s to 30 mN/s, the elastic modulus increased by 6% and the yield stress increased significantly, confirming the sensitivity of shale mechanical behavior to dynamic loading. Regarding carbonate rocks, Dong et al. [8] combined SEM-EDS with nanoindentation and found that the difference in elastic modulus between calcite and dolomite is a key factor causing the macroscopic mechanical heterogeneity of carbonates. However, the values predicted by the homogenization model were 1.7 times higher than the experimental ones, highlighting the impact of microcracks and pore morphology on mechanical upscaling. The core advantages of this technique are manifested in three aspects. First, it offers extremely high spatial resolution. The Berkovich indenter has a contact area of only 10–100 μm2, allowing precise positioning for mechanical testing on single mineral phases such as quartz, feldspar, and clay. Ni [9] conducted grid nanoindentation on granitic gneiss, revealing the modulus gradients among quartz, feldspar, and mica. Second, it is suitable for tiny or fragmented samples. Guo et al. [10] successfully inverted the elastic modulus of Wolfcamp shale using millimeter-scale cuttings with an error of less than 8%, offering a solution for mechanical evaluation in the absence of cores. Third, it can characterize time-dependent behavior. Through step-loading experiments, Zhang et al. [11] found that the creep displacement of Tarim carbonate rocks is positively correlated with the applied load, and dislocation creep dominates when the stress exponent n > 3, providing a micromechanical basis for predicting long-term deformation in deep reservoirs. Furthermore, innovations in fracture toughness testing methods have expanded the technical boundaries. The traditional crack length method is limited by the absence of radial cracks in quasi-brittle materials. In contrast, the energy method indirectly calculates fracture toughness by decomposing elastoplastic work and fracture energy, addressing the challenge of toughness assessment in scenarios without visible cracks. Ji [12] established a shale brittleness index model based on the energy method and found that the brittleness coefficient of marine shale is significantly higher than that of continental shale, providing key parameters for fracturing design. However, the limitations of nanoindentation testing methods should not be overlooked. First, surface roughness and residual stress significantly affect data reliability, requiring a polished surface roughness of less than 1/5 of the indentation depth. For carbonate rocks, due to large hardness contrasts among minerals, polishing easily causes edge chipping, thereby increasing test dispersion. Gu et al. [13] found that the dispersion coefficient of nanohardness in mudstone soaked in oil-based drilling fluid reached 28%, necessitating SEM morphology analysis to exclude pore interference. Second, there is a theoretical bottleneck in the upscaling of micro- to macro-mechanical parameters. Although Mori-Tanaka homogenization models are widely used for elastic modulus prediction, their isotropic assumption struggles to reflect the anisotropy induced by bedding or microstructural fabrics in carbonate rocks. Cai [14] constructed a granite mineral grain model and found that ignoring pores and cracks overestimated the macroscopic modulus prediction by 5.2%, while introducing a 3D defect model reduced the error to 2.1%. Additionally, the lack of multi-physics coupling tests (temperature-stress-chemistry) restricts applications in complex environments. Jiang [15] conducted freeze-thaw-chemical combined experiments and found that the elastic modulus of granite decreased by 37% in an acidic environment at pH = 2, but current equipment struggles to achieve real-time observation under in-situ high-temperature and high-pressure conditions. Xie et al. [16] used X-ray diffraction (XRD) and scanning electron microscopy-energy dispersive spectroscopy to determine mineral composition and distribution, and adopted grid nanoindentation to obtain the elastic modulus and hardness of calcite, dolomite, and pore regions, combined with k-means clustering analysis for data classification.
Regarding carbonate reservoirs, existing research mostly focuses on the impact of diagenesis and pore structure. Wang et al. [17] found that the elastic modulus of dolomite decreases by 28% at temperatures above 150 °C, which was attributed to grain boundary weakening induced by the α-β phase transition of quartz. Based on a mineral strength classification model, Liu et al. [18] pointed out that nanopores resulting from calcite dissolution can locally reduce the elastic modulus by 40%, whereas siliceous cementation can increase hardness by 15%. These findings reveal the high sensitivity of the mechanical properties of carbonate rocks to their microstructure. However, research remains insufficient regarding the coupling effects of extreme temperature-pressure conditions and multi-stage fracturing in ultra-deep reservoirs. The carbonate rocks of the Lower Qiulitage Formation in the Shunbei area have undergone multi-stage tectonic movements, resulting in the development of high-angle fractures and dissolution pores [19,20,21,22]. Traditional core recovery rates are low, and the retrieved cores are highly prone to fragmentation. Given its applicability to cuttings and outcrop samples, nanoindentation technology has emerged as an ideal approach for analyzing their micromechanical mechanisms. This study focuses on outcrop carbonate rocks from the Lower Qiulitage Formation in the Shunbei Oil and Gas Field [23,24,25]. Energy-dispersive X-ray spectroscopy (EDS) and X-ray diffraction (XRD) were employed to determine the mineral composition of the samples. Subsequently, systematic nanoindentation experiments were conducted to investigate the micromechanical response mechanisms of the carbonate rocks, with fracture toughness calculated using the energy method. Finally, the correlations among the nanoscale mechanical parameters were analyzed. By leveraging nanoindentation technology, this study elucidates the micromechanical behavior of the Shunbei carbonate rocks. These findings not only bridge the gap in mesomechanical data for deep reservoirs but also provide key parameters for fracturing design and wellbore stability assessments.
2. Test Specimens and Principles
2.1. Test Specimens
The dolostone samples were collected from the Shunbei Oil & Gas Field in the Tarim Basin, China, targeting the Ordovician Lower Qiulitage Formation. This stratum represents a typical ultra-deep marine carbonate fracture-cavity reservoir with complex depositional environments and strong heterogeneity. The core samples were specifically extracted from Well Shunbei-4 at a depth range of 7500 to 7508 m. Carbonate rock samples that were free from contamination during transportation and showed no obvious disturbance were selected and processed into thin-section specimens of 1 cm × 1 cm × 0.2 cm. Before polishing the test surface, energy dispersive spectroscopy (EDS) analysis was conducted to determine the element types and content of the test specimens. Eight points were selected on the test specimens for EDS analysis, and the test results are shown in Table 1.
Table 1.
Element type and content of carbonate rock.
The EDS analysis results show that the sample is mainly composed of carbon (C), oxygen (O), magnesium (Mg), and calcium (Ca), with some areas containing elements such as aluminum (Al), silicon (Si), potassium (K), sodium (Na), and iron (Fe). It should be noted that, due to the interaction volume of the electron beam in SEM-EDS analysis, the elemental signals detected at specific analysis points may include contributions from the surrounding mineral matrix or micro-inclusions, rather than originating solely from the target mineral. The high content of carbon and oxygen suggests the possible presence of carbonate or organic components, such as calcium carbonate (CaCO3) or dolomite (CaMg(CO3)2). However, the atomic percentage of oxygen is generally more than three times that of carbon, implying the possible existence of other oxygen-containing compounds (such as silicates or oxides). The contents of magnesium and calcium fluctuate significantly in different areas; for example, the weight percentage of calcium ranges from 19.48% to 38.02%, and magnesium from 8.02% to 19.89%, reflecting local enrichment of mineral phases or compositional inhomogeneity in the sample, such as a mixture of dolomite and calcite. The detection of aluminum and silicon at locations 6 and 7, coupled with a high oxygen content, suggests the presence of silicate minerals (such as feldspar or clay minerals). Trace amounts of sodium, potassium, and iron likely originate from impurities or minor mineral phases. All quantitative data were processed using the ZAF matrix correction method, yielding elemental totals approaching 100% and confirming the reliability of the measurements. Comprehensive analysis indicates that the sample is predominantly composed of carbonates (specifically Ca-Mg carbonates), accompanied by silicates and trace impurities.
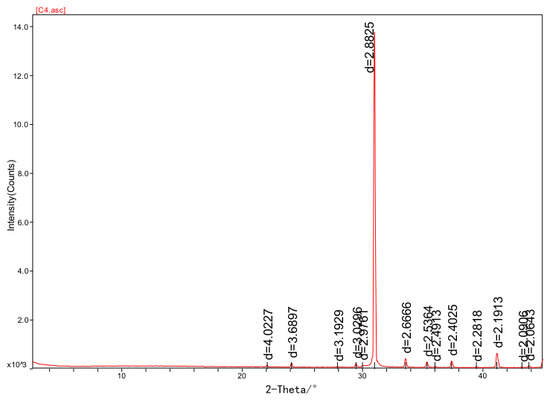
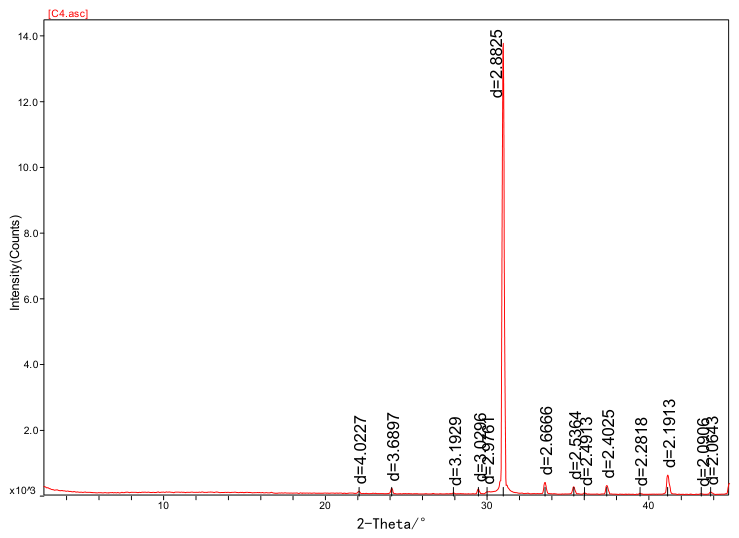
A portion of the sample from the same rock block was crushed, and mineral samples with a particle size of less than 10 microns were extracted using the water suspension separation method or centrifugal separation method to determine the total relative content of different minerals in the original rock. The content of a mineral was obtained by measuring the intensity of its characteristic peaks in the X-ray diffraction pattern (as shown in Figure 1) of the unknown sample. The test results are shown in Table 2.
Figure 1.
X-ray diffraction pattern of non-clay mineral components.
Table 2.
X-ray diffraction analysis results of non-clay minerals.
The XRD data show that dolomite content absolutely dominates (92.7–99.4%) in the six samples, while calcite is only a trace component (0.6–7.3%). This highly matches the high calcium and magnesium contents and the carbon-oxygen ratio detected by EDS, confirming that the main body of the sample is dolomite-type carbonate mineral (CaMg(CO3)2). It is noteworthy that the dolomite content in sample 3 drops to 92.7% (corresponding to 7.3% calcite), suggesting that localized calcitization may have occurred in this area, possibly related to later fluid activity. The fluctuation of dolomite content between samples (±6.7%) reveals weak differentiation in mineral composition, and the phenomenon of relatively higher calcite content in samples 3 and 5 (7.3%, 1.5%) may be related to differences in the micro-diagenetic environment. It is speculated that the minor components not detected by XRD might be silicate impurities (such as feldspar or clay minerals), whose amorphous or low-crystallinity characteristics may lead to weak XRD signals. The detection of iron (0.75 At%) may be related to isomorphic substitution in the dolomite lattice (Fe2+ replacing Mg2+) or the inclusion of trace pyrite. The trace distribution of sodium and potassium may originate from pore water evaporation residues or detrital mineral input. Combined with EDS and XRD results, the sample is a typical dolomite series that has undergone stable dolomitization, with local secondary calcite produced by later diagenetic fluid alteration.
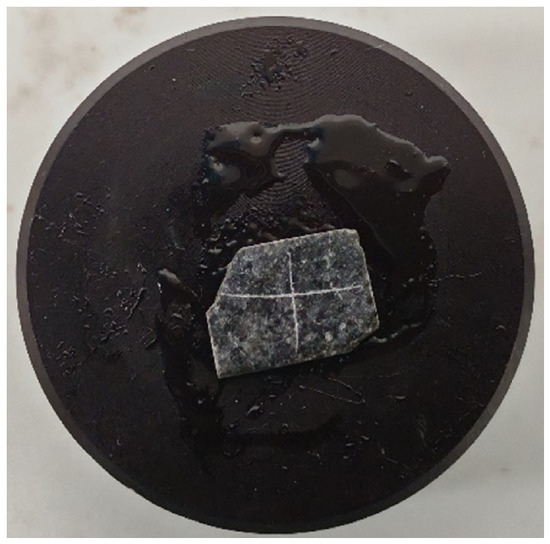
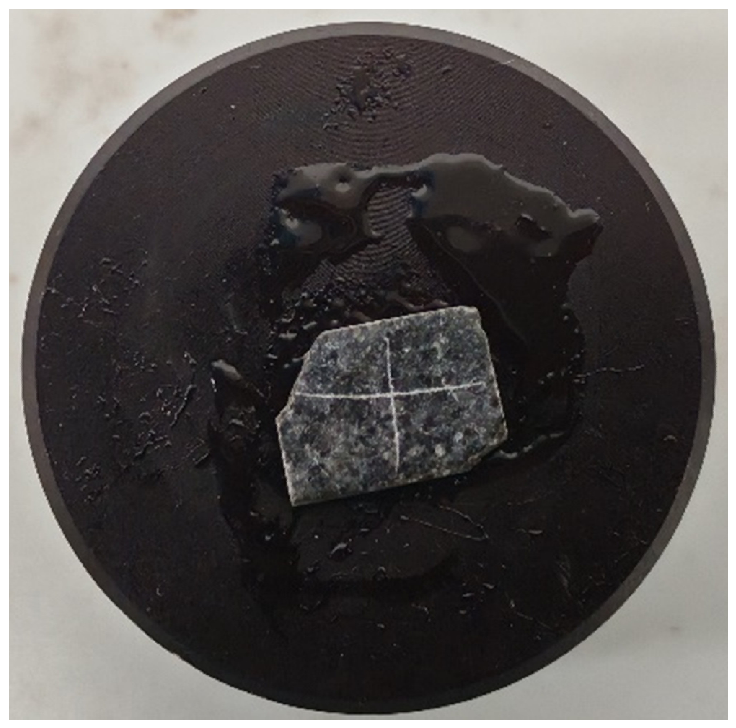
After understanding the mineral types of the studied sample, the specimen surface was polished. The process was as follows: initial grinding of the specimen using an angle grinder, then fine grinding sequentially using sandpaper of different grits up to 7000 grit. The grinding time for each sandpaper grade was successively increased, with the shortest grinding time being no less than 20 min. Finally, a 0.1 μm polishing solution was used for further fine grinding, polishing the surface sufficiently to achieve a mirror effect. After polishing, the specimen was placed in an ultrasonic cleaner and cleaned with anhydrous ethanol solution for 5 min to ensure the surface was free of any debris. The specimen was then placed in an oven at 101 °C and dried for 24 h until completely dry, after which it was removed and stored in a sealed bag for later use. During testing, the specimen was taken out and adhered tightly to the base of the nanoindentation instrument using epoxy resin, as shown in Figure 2, ensuring the upper surface of the specimen was level for accurate determination of test data.
Figure 2.
Polished carbonate rock specimen.
2.2. Principles of Nanoindentation
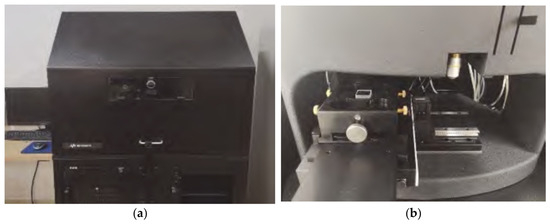
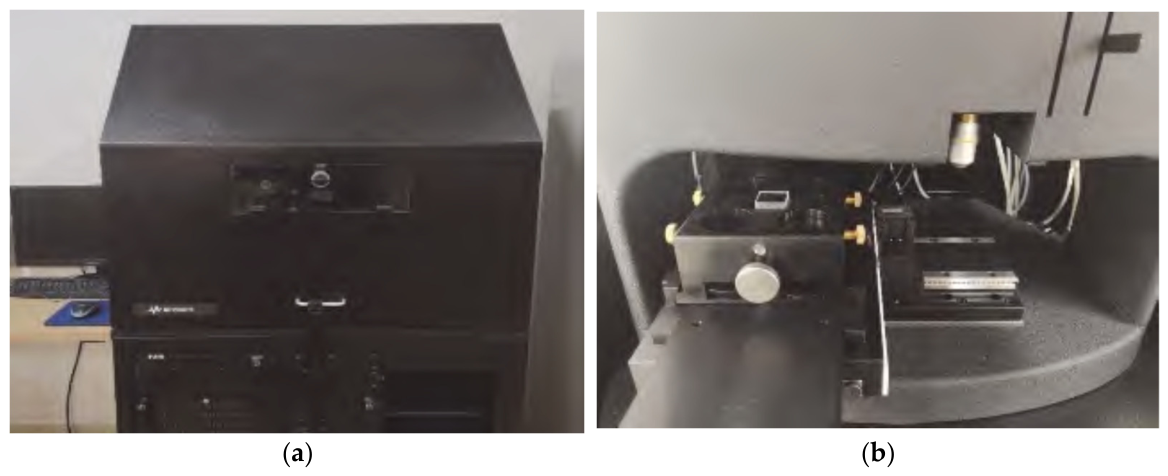
The nanoindentation test equipment used was the Agilent Nano Indenter G200 nanoindentation tester (Agilent Technologies, Santa Clara, CA, USA) (see Figure 3). The load control mode employed a standard load of 500 mN, with a load resolution of 50 nN. The maximum displacement of the small-strain extension system of this test setup is 1 mm, with a displacement resolution of 0.01 nm. The indenter selected was a Berkovich triangular pyramid diamond indenter, with a maximum displacement range of 1.5 mm, a maximum indentation depth of 500 μm, and a displacement resolution of 0.01 nm.
Figure 3.
Agilent Nano Indenter G200 nanometer indentation tester. (a) Nanoindentation test system; (b) Indentation test platform.
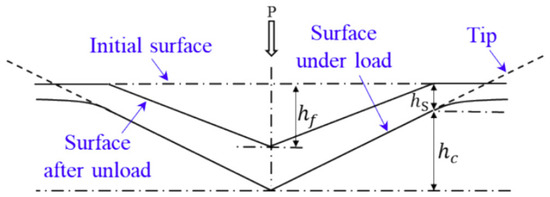
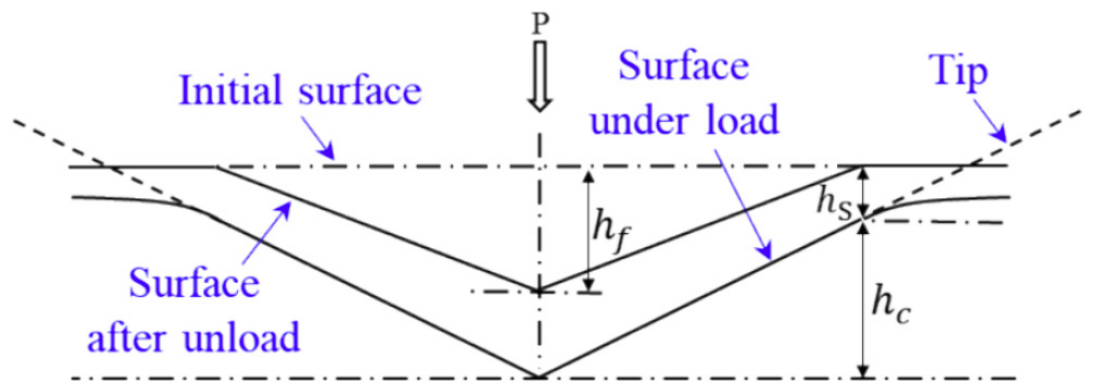
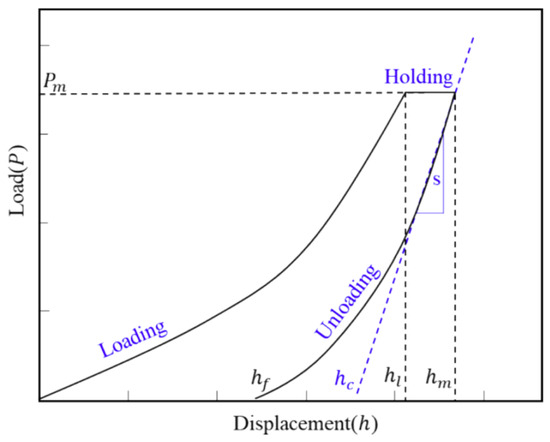
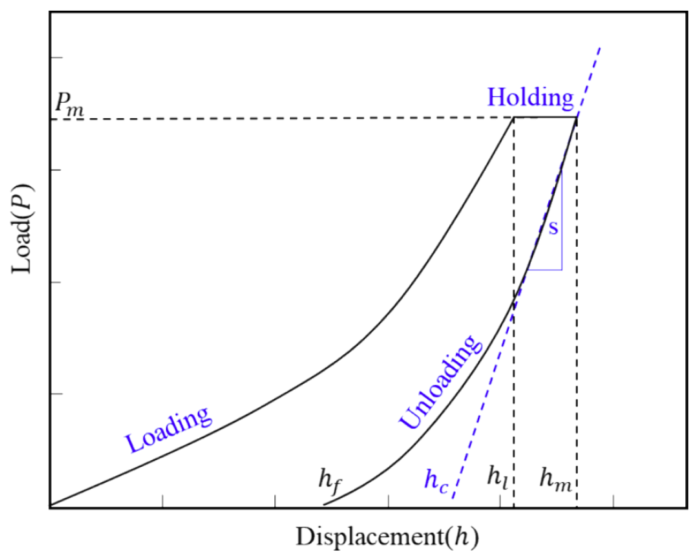
During the nanoindentation test, continuous load is applied to the specimen, and by analyzing the load and displacement data combined with relevant mechanical models, the contact area between the indenter and material is calculated. When the indenter presses into the specimen, elastic deformation occurs first. As the load increases, an indentation matching the indenter appears on the specimen, and plastic deformation begins to occur. A schematic of the indentation profile during loading is shown in Figure 4 [26]. During unloading, elastic deformation recovers, while plastic deformation remains as the indentation fracture. Based on the experimental data, the load-displacement curve of the nanoindentation loading-unloading process is drawn, and the elastic modulus and hardness of the rock are calculated using this curve, as illustrated in Figure 5 [27].
Figure 4.
Schematic diagram of Berkovich indenter tip parameters.
Figure 5.
Schematic diagram of the load-displacement (indentation depth) curve.
The Oliver-Pharr method is used to calculate the elastic modulus and hardness, requiring the determination of stiffness and contact area [28]. First, the load-displacement curve of the unloading stage is fitted to an exponential equation, as shown in Equation (1):
where P is the load, mN; h is the indentation depth, nm; hf represents the residual indentation depth, nm; B and m are fitting parameters.
The contact stiffness is the derivative of stress with respect to displacement during the experimental unloading stage, as given by Equation (2):
where hmax is the maximum indentation depth of the indenter, nm. In practical applications, the contact stiffness is usually calculated by fitting the slope of the upper portion of the unloading curve. The contact stiffness reflects the ability of the specimen to resist the indenter’s action at the maximum indentation depth.
To determine the contact area, it is first necessary to ascertain the contact depth between the indenter and the specimen [29,30,31]. The maximum indentation depth comprises the contact depth and the non-contact depth. The contact depth is given by Equation (3):
where hs characterizes the depth not in contact between the indenter and the tested material, as expressed in Equation (4):
where is a constant determined by the type of indenter used in the experiment. When the indenter is a Berkovich indenter, it is taken as 0.75; for a conical indenter, it is taken as 0.72.
For the commonly used standard Berkovich regular triangular pyramid indenter, the projected contact area Ac can be calculated using Equation (5):
The hardness calculation model is as shown in Equation (6):
The elastic modulus calculation model is as shown in Equation (7):
where E and v are the elastic modulus and Poisson’s ratio of the test specimen, and Ei and vi are the elastic modulus and Poisson’s ratio of the diamond indenter. Generally, Ei is 1140 GPa and vi is 0.07. Er is the reduced modulus [32], representing the combined modulus of the indenter and the test specimen, as expressed in Equation (8):
where A is the contact area between the indenter and the test specimen at different indentation depths, nm2; β is determined by the indenter type, taken as 1.034 for Berkovich indenters, 1.012 for Vickers indenters, and 1.000 for spherical indenters. Based on the above theory, the elastic modulus and hardness of the test material can be calculated from the load-depth curve during the loading process.
3. Study of Micro-Mechanical Response Mechanism
3.1. Micro-Mechanical Response Mechanism
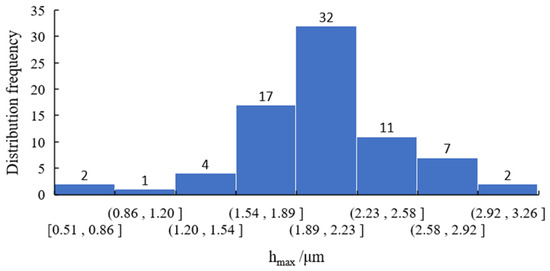
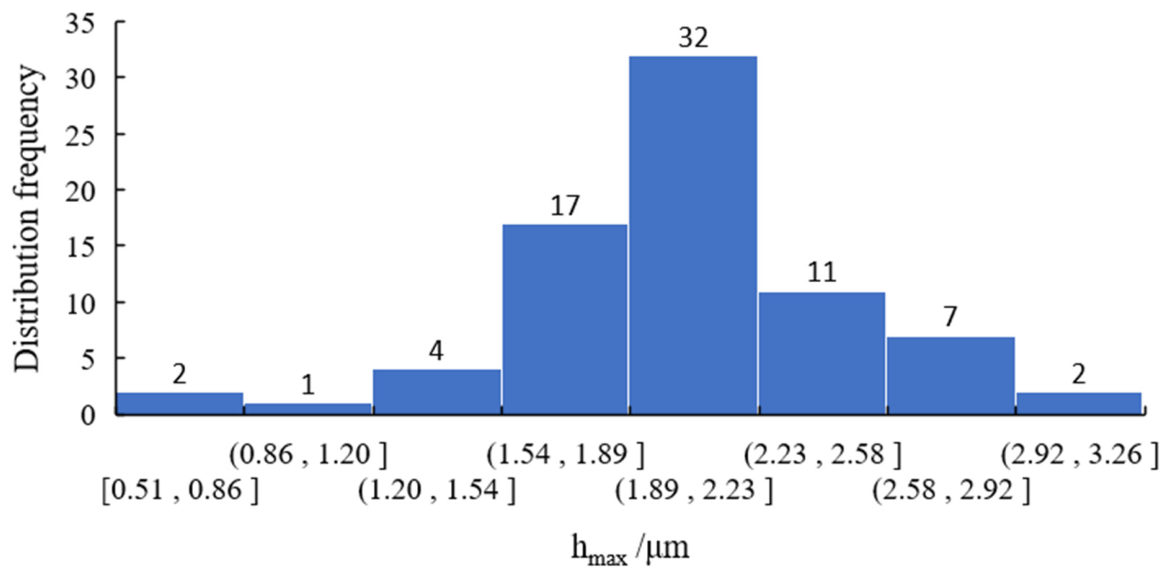
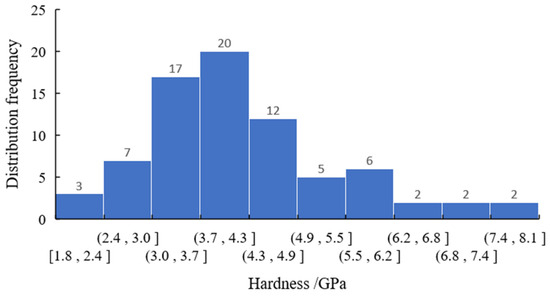
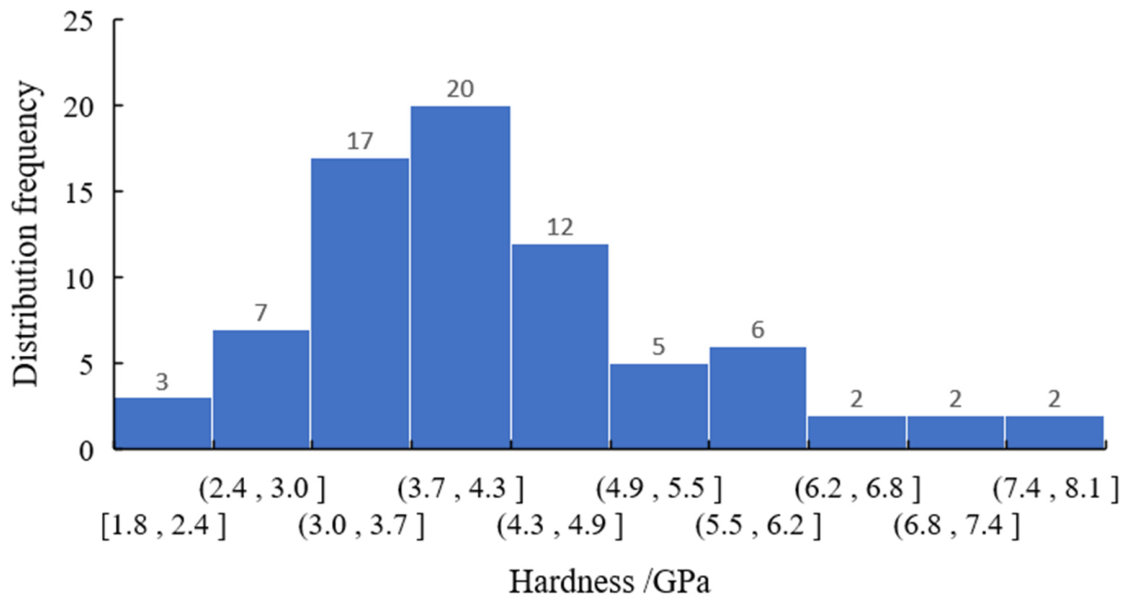
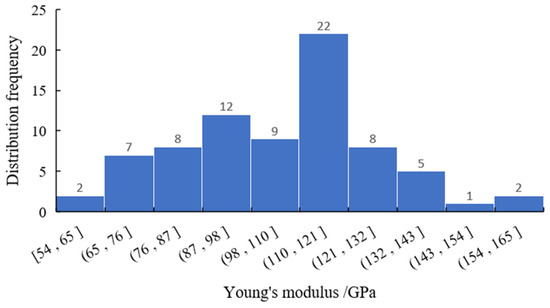
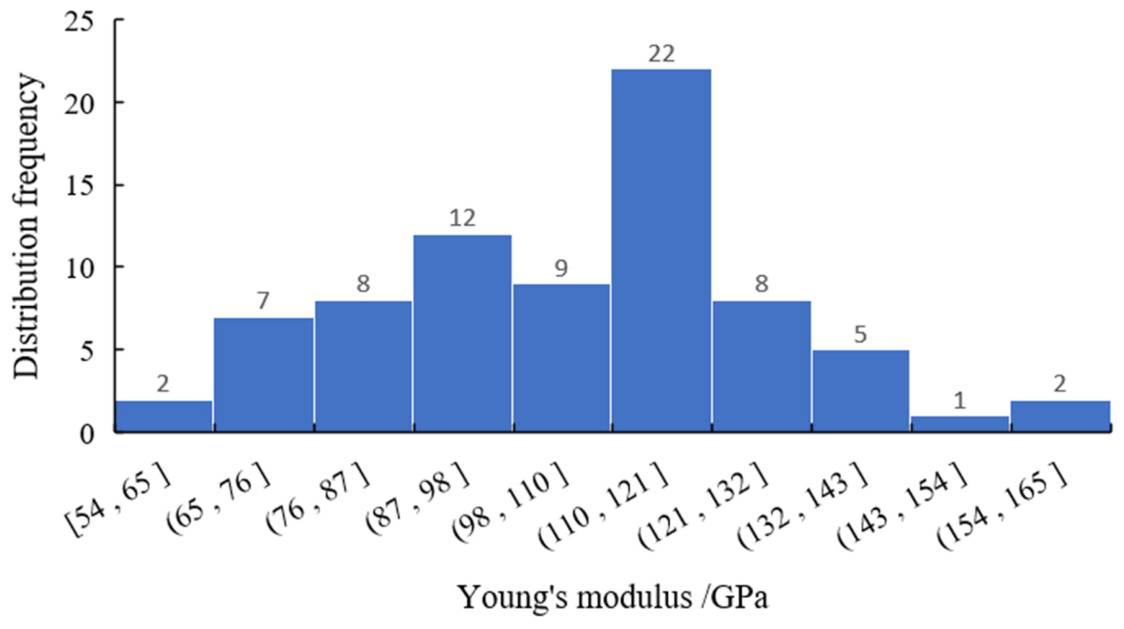
Using the static testing method, a 9 × 9 grid array was set up to perform positioned indentation tests on the specimen. The target load was set to 300 mN, with both loading and unloading times set to 10 s. To eliminate the effects of creep and stress relaxation, the holding time was set to 10 s. After removing anomalous results, 76 valid sets of test data remained. Based on the collected load-depth loading-unloading curves and the fundamental principles in Section 2, the mechanical parameters such as elastic modulus and hardness of the specimen were calculated. Histogram analysis was conducted on the nanoindentation experimental results. The study showed that the distribution frequency of the maximum indentation depth (Figure 6) concentrated in a shallower interval, reflecting the overall high hardness and weak plastic deformation ability of dolomite, consistent with its brittle mineral characteristics. If the distribution frequency of hardness (Figure 7) presented a unimodal narrow distribution (typical value 3–5 GPa), it indicated that the sample composition was homogeneous, consistent with the macroscopic mechanical properties of dolomite. A wide distribution or anomalous peaks might originate from micro-area compositional differences (such as calcite impurities or pores). The elastic modulus distribution (Figure 8) was concentrated in the 90–120 GPa range with low dispersion, confirming the microstructural uniformity of dolomite. Test results in the lower elastic modulus range (<90 GPa) might be influenced by local grain boundaries or defects on the sample surface.
Figure 6.
Distribution frequency of maximum indentation depth.
Figure 7.
Distribution frequency of hardness.
Figure 8.
Distribution frequency of elastic modulus.
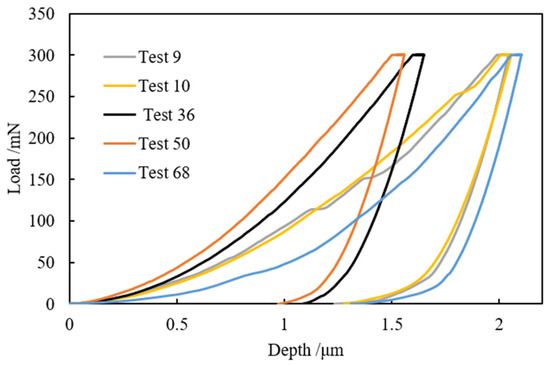
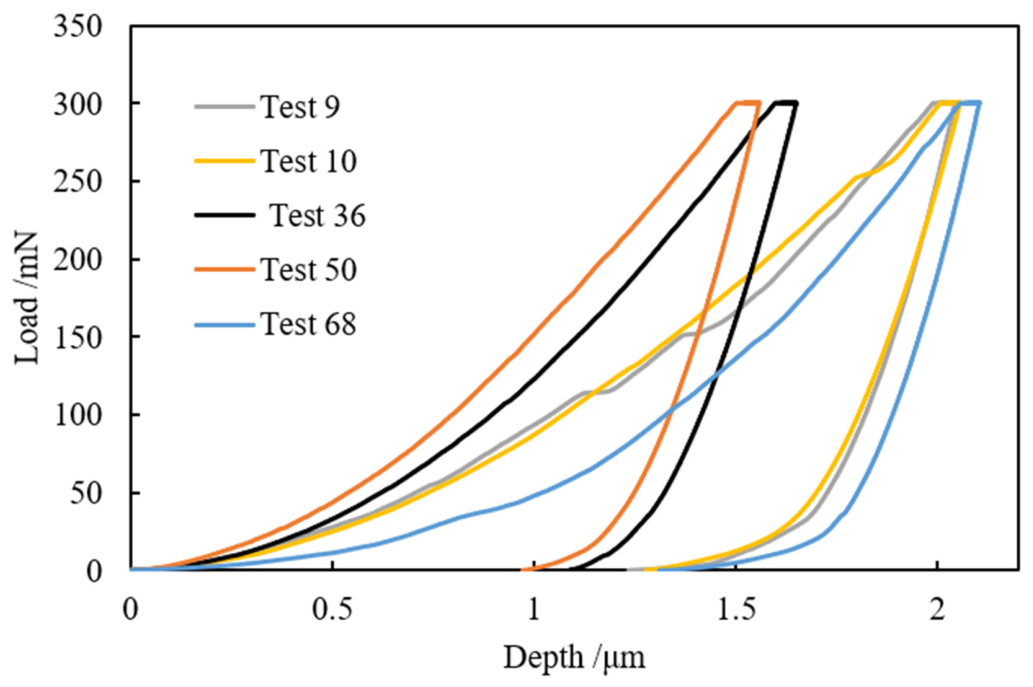
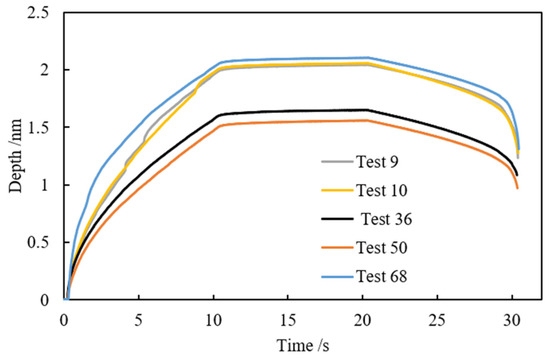
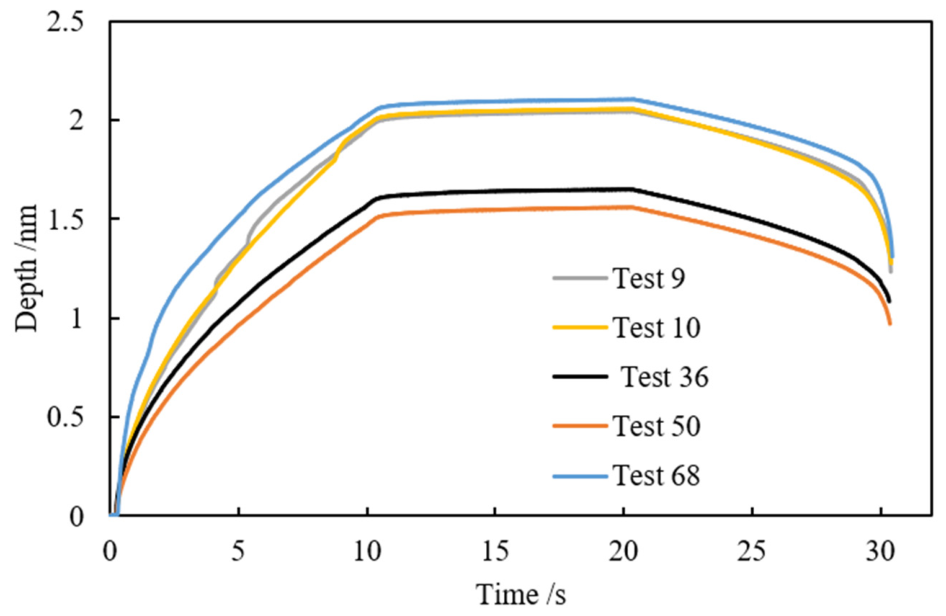
Several typical load-depth loading-unloading curves were selected to analyze the micro-mechanical response mechanism of the tested specimen, as shown in Figure 9. Simultaneously, the change of indenter depth with loading time was plotted, as shown in Figure 10.
Figure 9.
Typical load-depth loading-unloading curves.
Figure 10.
Typical loading-unloading depth-time curves.
An analysis of the curve characteristics across multiple test points in the figures reveals significant local heterogeneity in the mechanical properties of the tested sample. Test 50 exhibited the smallest maximum indentation depth (1 μm) alongside the highest hardness and elastic modulus (6.62 GPa and 149.09 GPa, respectively). This indicates a dense, brittleness-dominated region, which is consistent with the high crystallinity characteristic of dolomite. In contrast, Test 68 reached a greater maximum depth (1.4 μm) with lower hardness and elastic modulus (3.33 GPa and 109.2 GPa, respectively), suggesting the presence of pores or structural weak planes within the micro-region that enhance plastic deformability. In the load-depth curves (Figure 9), high-modulus test points (e.g., Test 50) displayed limited elastic recovery during unloading and significant energy dissipation, further confirming a brittleness-dominated deformation mechanism. Slope variations in the curve for Test 68, along with the “pop-in” events observed in the curves for Tests 9 and 10, indicate the presence of micro-defects at the indentation sites or the initiation of microcrack propagation during the loading process. Furthermore, the depth-time curves (Figure 10) demonstrate that the loading responses of Tests 36 and 50 are relatively stable, exhibiting weak time dependence. Conversely, the indentation depth in Test 68 fluctuates more pronouncedly over time, revealing the high sensitivity of pores or defects to deformation under dynamic loading.
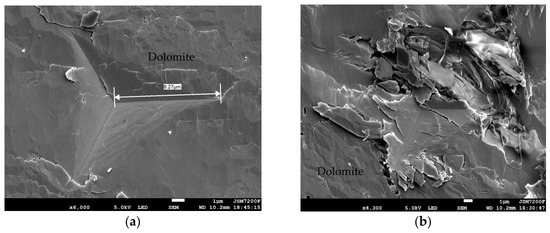
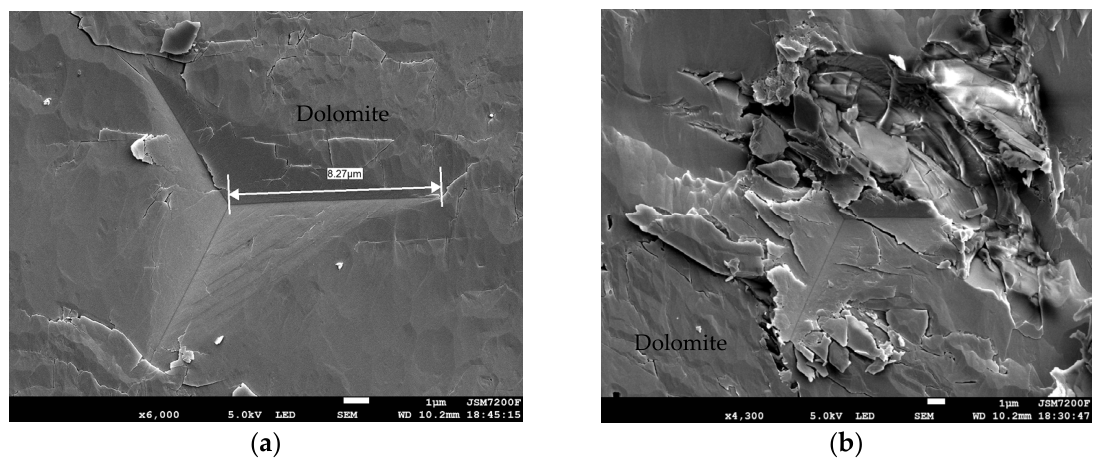
The micro-morphology of residual indentations was observed under an electron microscope, comparing two typical residual indentations at positions with high modulus/high hardness and low modulus/low hardness, as shown in Figure 11. Micromorphological analysis reveals that the indentation of Test 50 features sharp edges, limited crack propagation, and a dense surrounding surface. These characteristics corroborate its high hardness (6.62 GPa) and high elastic modulus (149.09 GPa), reflecting complete mineral crystallization, significant grain boundary strengthening, and excellent microstructural uniformity in this region. Conversely, radial cracks and local chipping are visible around the indentation of Test 68, accompanied by higher surface roughness. This is consistent with its lower hardness (3.33 GPa) and reduced elastic modulus (109.2 GPa), indicating the presence of pore aggregation or localized compositional segregation (such as calcite enrichment). Such microstructural features lead to stress concentration and an enhanced tendency for brittle fracture. A comparison of the two micrographs reveals the heterogeneous distribution of internal microscopic defects within the dolomite. This heterogeneity is directly linked to the local variability in mechanical properties, further supporting the governing role of mineral phase composition and structural integrity over mechanical behavior. Overall, the data indicate that the mechanical response of dolomite is highly dependent on its microstructural integrity. Therefore, it is essential to integrate microscopic characterization to elucidate the mechanisms by which pores, grain boundaries, and mineral phase distributions govern the macroscopic performance of the rock.
Figure 11.
Residual indentation micro-morphology. (a) Test 50; (b) Test 68.
3.2. Micro-Scale Fracture Toughness
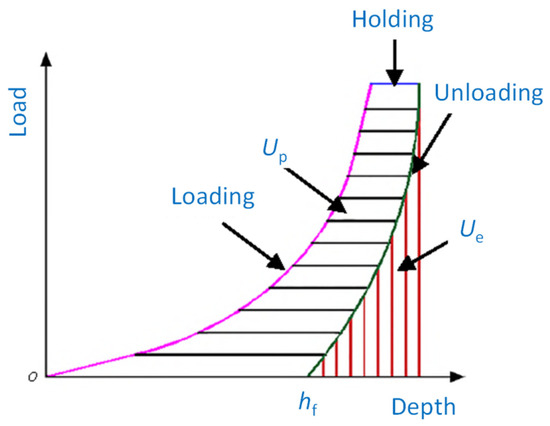
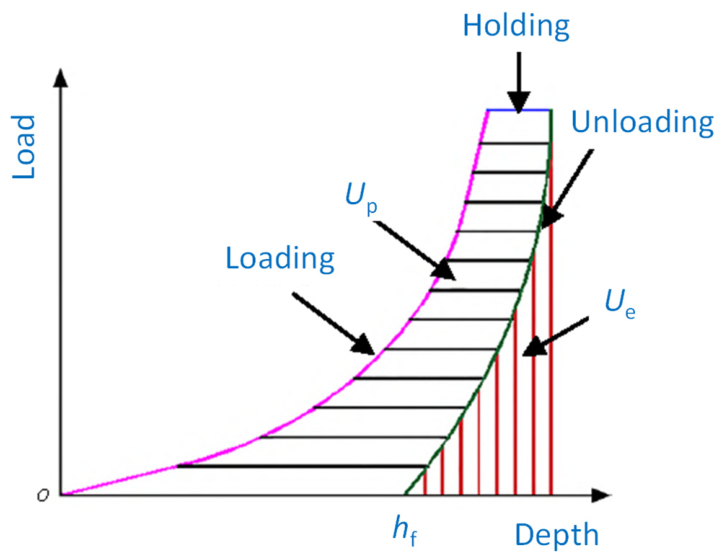
Nanoindentation has unique advantages in fracture toughness testing, especially the energy method, which does not require measuring crack length and other information, and can obtain fracture toughness based solely on the load-depth curve of the loading-unloading process. Based on the principle of energy conservation, this study investigated the meso-scale fracture performance of carbonate rocks by utilizing the relationships among total energy, elastic energy, plastic energy, and fracture energy during the indentation process. The energy distribution schematic of the loading-unloading process is shown in Figure 12. Based on classical linear elastic fracture mechanics theory, the fracture toughness of the material is:
Figure 12.
Schematic of energy distribution in the loading-unloading curve.
Gc is the energy consumed per unit area of crack extension,
where is the fracture energy, and is the crack area, approximated by the contact area Ac at the maximum indentation depth.
Without considering heat dissipation, the total energy Wt generated during the indentation process can be decomposed into elastic energy We and irreversible energy Wir. The irreversible energy consists of plastic energy Wp and fracture energy. The fracture energy is as shown in Equation (11):
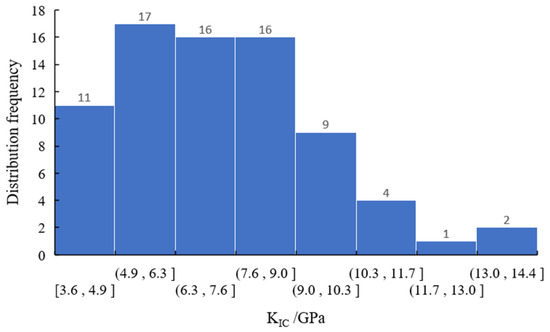
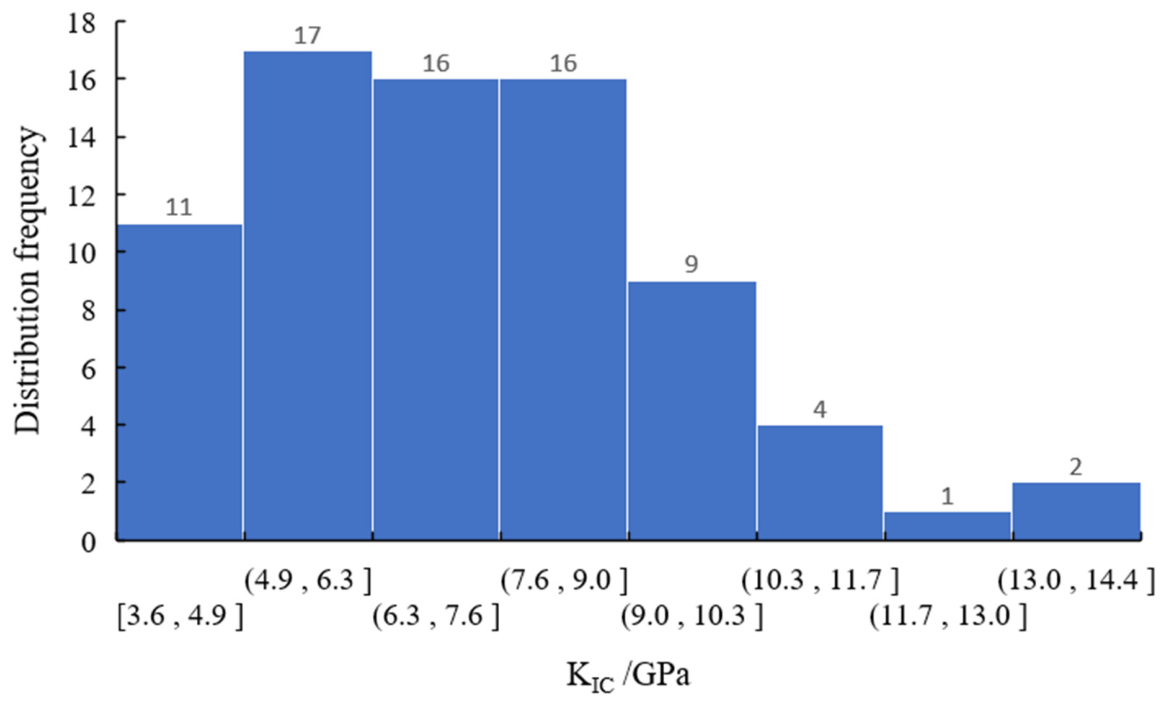
Based on the above theory, the fracture toughness of the test specimens was calculated, and the histogram of the test results is plotted in Figure 13.
Figure 13.
Distribution frequency of fracture toughness of the test specimens.
Analysis reveals that the fracture toughness is mainly concentrated between 3.6 and 10.3 MPa·m0.5, with a large dispersion and significant overall brittleness, consistent with the mineral characteristics of dolomite. A small number of samples in the 6.3–9.0 MPa·m0.5 range (frequencies 11 and 9) may result from enhanced toughness due to local grain boundary strengthening or impurity dispersion, but the proportion is limited. Cases above 9.0 MPa·m0.5 (frequency ≤ 2) are almost negligible and may be due to testing errors or abnormal performance in very few extremely dense areas. This distribution reveals the microstructural heterogeneity of dolomite—the dominance of low toughness reflects the widespread presence of pores, microcracks, or grain boundary weakening, while the small amount of high toughness areas suggests local structural optimization.
4. Study on the Correlation of Nano-Scale Mechanical Parameters
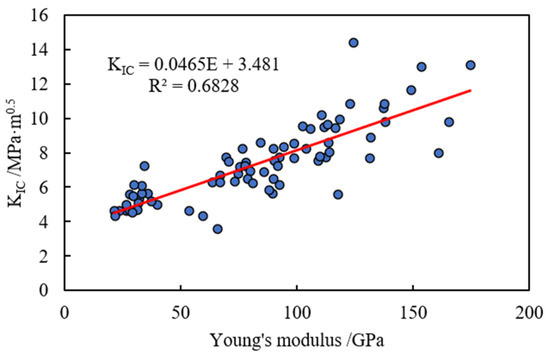
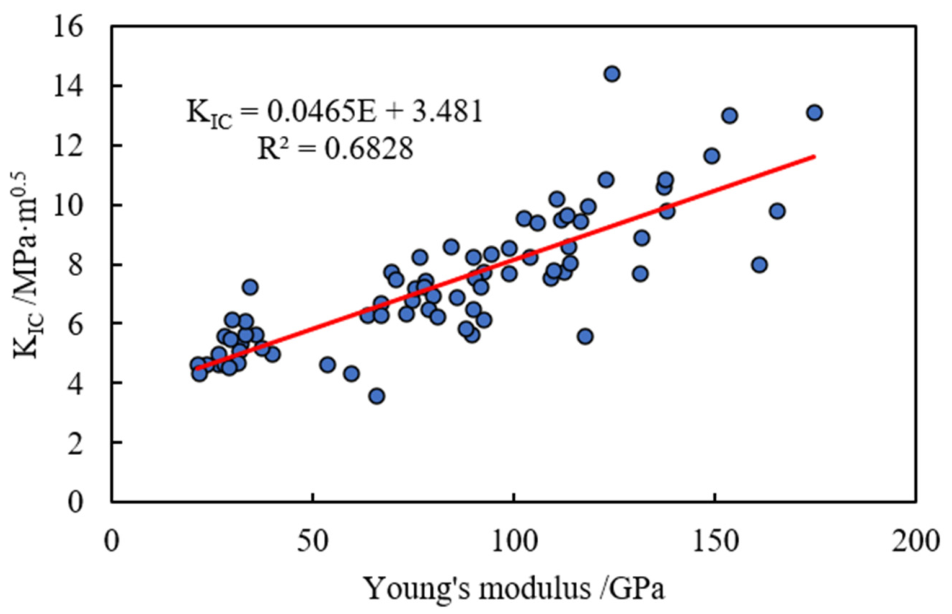
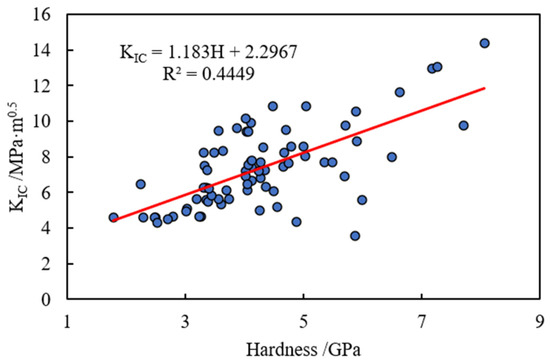
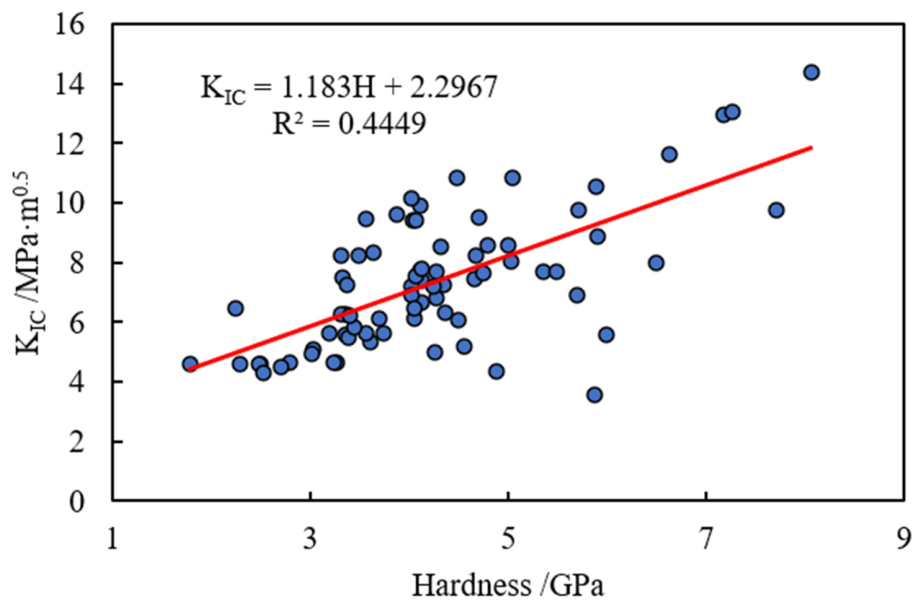
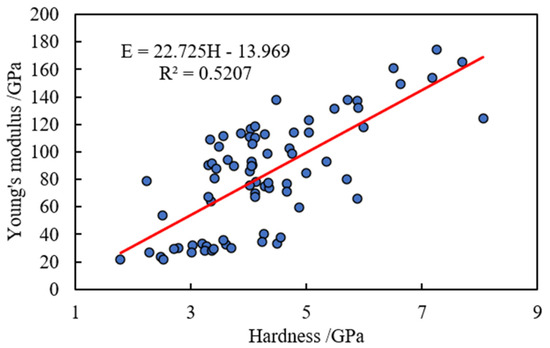
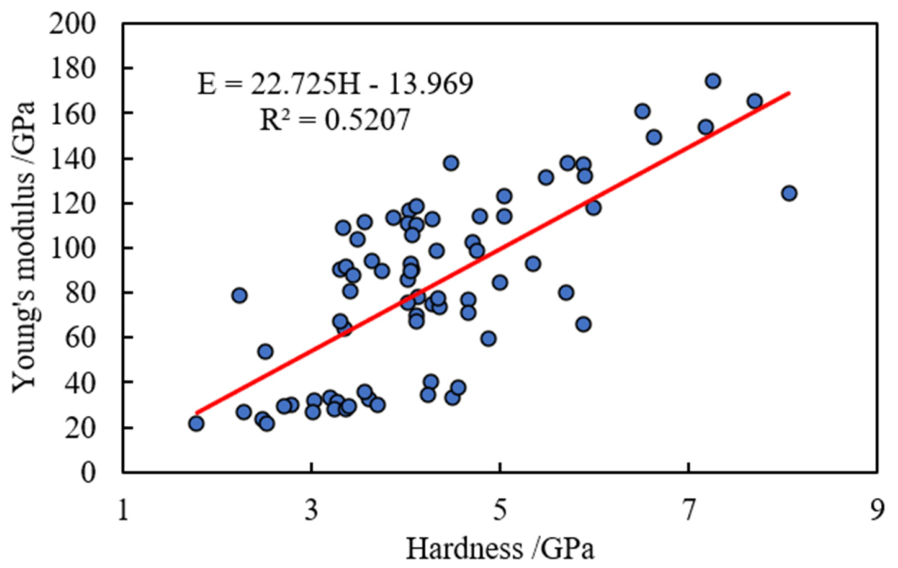
Following the understanding of the distribution characteristics of nano/micro-scopic mechanical parameters of carbonate rocks, a study on the correlation among their mechanical response parameters was conducted. The correlation relationships among micro-scale elastic modulus, hardness, and fracture toughness are shown in Figure 14, Figure 15, and Figure 16, respectively.
Figure 14.
Correlation between micro-scale fracture toughness and elastic modulus.
Figure 15.
Correlation between micro-scale fracture toughness and hardness.
Figure 16.
Correlation between micro-scale elastic modulus and hardness.
The correlation analysis results among micro-scale elastic modulus, hardness, and fracture toughness indicate that fracture toughness has a moderate positive correlation with elastic modulus (R2 = 0.68), suggesting that an increase in material stiffness may enhance toughness by limiting the size of the plastic zone, but the remaining 32% variation reflects the significant weakening effects of pores or microcracks. The weak correlation between fracture toughness and hardness (R2 = 0.44) highlights the contradiction between high hardness and brittle fracture, possibly because local dense areas temporarily increase toughness, while macroscopic low toughness is still dominated by the defect network. The positive correlation between elastic modulus and hardness (R2 = 0.52) indicates that densification contributes synergistically to both, but lattice orientation or non-uniform stress fields cause significant dispersion. In summary, the mechanical behavior of dolomite is jointly regulated by the duality of its microstructure (dense crystalline regions and defect-rich zones). It is necessary to combine microscopic characterization (such as SEM-EBSD or micro-area XRD) to clarify the quantitative impact of mineral phase distribution, grain boundary characteristics, and defect evolution on performance, further elucidating the dominant mechanisms.
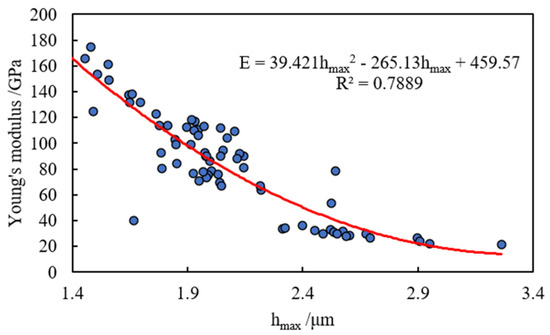
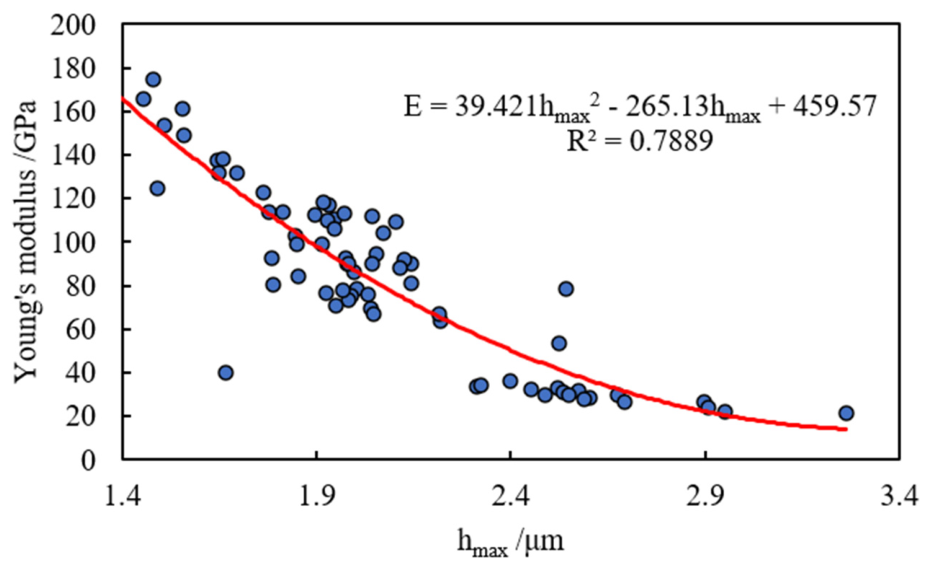
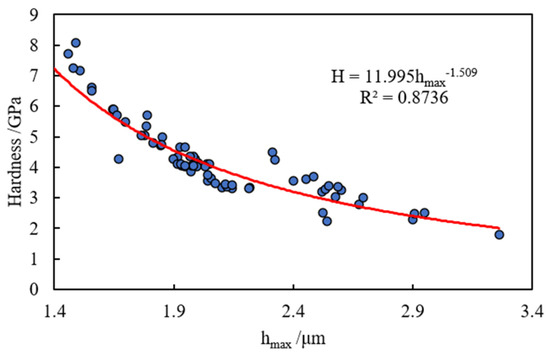
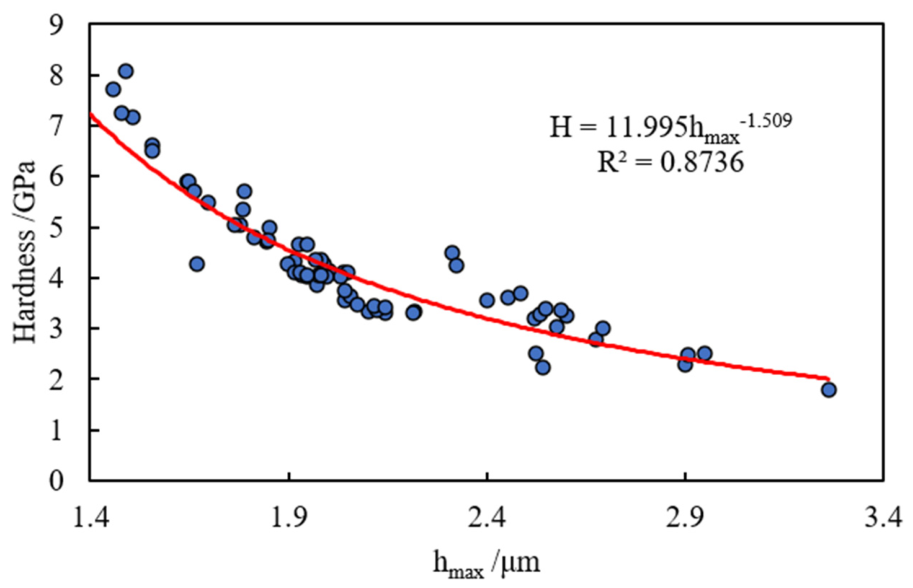
Simultaneously, the correlation between micro-scale elastic modulus, hardness, fracture toughness, and maximum indentation depth was analyzed separately, as shown in Figure 17, Figure 18 and Figure 19.
Figure 17.
Correlation between micro-scale elastic modulus and maximum indentation depth.
Figure 18.
Correlation between micro-scale hardness and maximum indentation depth.
Figure 19.
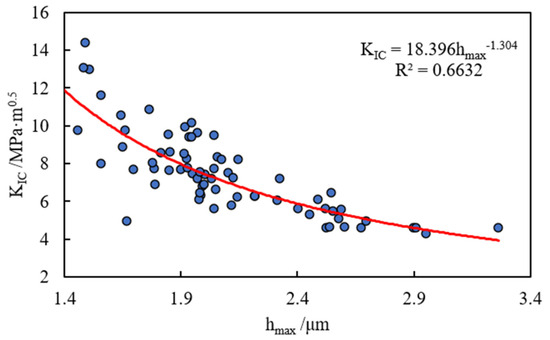
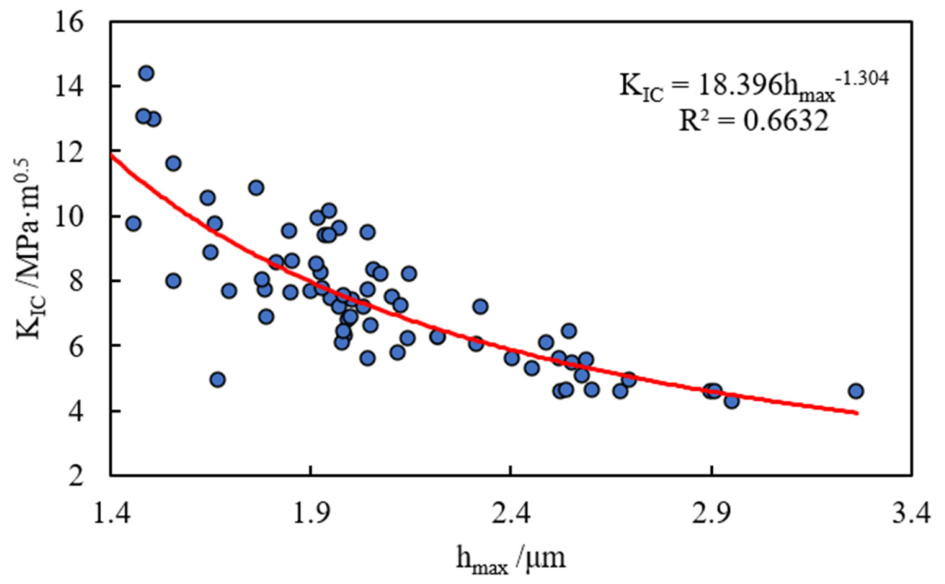
Correlation between micro-scale fracture toughness and maximum indentation depth.
As illustrated in the figures, the experimental results for the dolomite specimen indicate that the microscale elastic modulus exhibits a quadratic relationship with the maximum indentation depth (E = 39.421 hmax2 − 265.13 hmax + 459.57), demonstrating a relatively high goodness of fit (R2 = 0.7889). This reveals a nonlinear dependence of the elastic modulus on indentation depth, which may be attributed to localized plastic deformation or microstructural heterogeneity. Although an explicit empirical equation for the correlation between hardness and indentation depth was not derived, the data distribution range aligns with that of the elastic modulus, suggesting a similar underlying trend. Fracture toughness displays a negative power-law relationship with hmax (KIC = 18.396 hmax − 1.304) with a lower goodness of fit (R2 = 0.6632). This indicates that fracture toughness decreases significantly as indentation depth increases; however, the high data scatter is likely influenced by complex crack propagation mechanisms or experimental boundary conditions. Overall, the results demonstrate that the micromechanical behavior of dolomite exhibits significant depth dependence (i.e., the indentation size effect), and the coupled response of its elastic, plastic, and fracture properties is governed by multiscale structural features, such as grain boundaries and defect distributions. Further investigations integrating micromorphological analysis and cross-scale mechanical models are required to elucidate the underlying mechanisms.
5. Conclusions
By integrating nanoindentation coupled with scanning electron microscopy, energy-dispersive spectroscopy, X-ray diffraction, and an energy-based method, the meso-mechanical properties and fracture mechanisms of dolomite from the Lower Qiulitage Formation in the Shunbei oil and gas field were systematically investigated. The main conclusions are as follows,
The samples are predominantly composed of dolomite, which constitutes 92.7% to 99.4% of the mineralogy, along with minor amounts of calcite ranging from 0.6% to 7.3% and trace silicate impurities. Mineralogical heterogeneity, particularly localized calcite enrichment, combined with the presence of nanopores and microcracks, significantly influences the mechanical properties. The measured elastic modulus ranges from 90 to 120 GPa, hardness from 3 to 5 GPa, and maximum indentation depth from 1.0 to 1.4 μm, collectively indicating pronounced brittleness. In dense regions, the elastic modulus and hardness reach up to 149.09 GPa and 6.62 GPa, respectively, exhibiting weak plasticity. Conversely, in low-modulus regions characterized by pore or calcite enrichment, the elastic modulus and hardness decrease to 109.2 GPa and 3.33 GPa, respectively. In these weaker zones, the emergence of radial cracks and pop-in events confirms a high sensitivity to micro-defects. The fracture toughness, determined via an energy-based method, ranges from 3.6 to 10.3 MPa·m0.5. The data exhibit a scattered distribution skewed towards lower toughness values, reflecting the prevalence of pores and microcracks, whereas the sporadic high toughness values likely originate from grain boundary strengthening or impurity dispersion. A significant proportion of irreversible work confirms that brittle fracture predominates during indentation, with energy primarily dissipated through crack propagation and local spalling. Regarding parameter correlations, the elastic modulus shows a moderate positive correlation with hardness, yielding a coefficient of determination of 0.52. Fracture toughness correlates more strongly with elastic modulus, achieving an R2 of 0.68, than with hardness, which shows a weaker correlation of 0.44. Although increased stiffness can partially enhance toughness, the weakening effect induced by pores and microcracks plays a more critical role. Furthermore, the elastic modulus varies nonlinearly with indentation depth, and fracture toughness exhibits a negative power-law relationship with depth, reflecting the coupling between the indentation size effect and structural heterogeneity. The proposed methodology is highly suitable for extracting meso-mechanical parameters from rock cuttings and fragmented samples. The established correlation models linking elastic modulus, hardness, and fracture toughness deepen the understanding of the macro-to-meso cross-scale mechanical behavior of carbonate rocks, providing a robust experimental basis for improving homogenization models that incorporate three-dimensional defects. Notably, the energy-based method overcomes the limitations of the traditional crack-length approach, offering a novel and reliable pathway for toughness evaluation in scenarios where visible cracks are absent.
Author Contributions
Conceptualization, W.Z.; methodology, W.Z.; software, X.J.; validation, X.J.; formal analysis, L.Z.; investigation, W.Z.; resources, X.J.; data curation, X.J.; writing—original draft preparation, L.Z.; writing—review and editing, L.Z.; visualization, W.Z.; supervision, X.J.; project administration, X.J.; funding acquisition, L.Z. All authors have read and agreed to the published version of the manuscript.
Funding
This research received no external funding.
Data Availability Statement
The raw data supporting the conclusions of this article will be made available by the authors on request.
Conflicts of Interest
Author Wentao Zhou was employed by North Blasting Technology Co., Ltd. The remaining authors declare that the research was conducted in the absence of any commercial or financial relationships that could be construed as a potential conflict of interest.
References
- Ollivier, J.P.; Maso, J.C.; Bourdette, B. Interfacial transition zone in concrete. Adv. Cem.-Based Mater. 1995, 2, 30–38. [Google Scholar] [CrossRef] [Scilit]
- Griffith, A.A. The Phenomena of Rupture and Flow in Solids. Philos. Trans. A Math. Phys. 1921, 221, 163–198. [Google Scholar] [CrossRef] [Scilit]
- Zhang, M.M.; Liang, L.X.; Liu, X.J. Analysis of the Influence of Different Rock Shear Failure Criteria on Wellbore Collapse Pressure. Chin. J. Rock Mech. Eng. 2017, 36, 3485–3491. [Google Scholar]
- Zhang, M.; Fan, X.; Zhang, Q.; Yang, B.; Zhao, P.; Yao, B.; He, L. Influence of multi-planes of weakness on unstable zones near wellbore wall in a fractured formation. J. Nat. Gas. Sci. Eng. 2021, 93, 104026. [Google Scholar] [CrossRef] [Scilit]
- Zhang, M.; Fan, X.; Zhang, Q.; Yang, B.; Zhao, P.; Yao, B.; Ran, J. Parametric sensitivity study of wellbore stability in transversely isotropic medium based on poly-axial strength criteria. J. Pet. Sci. Eng. 2021, 197, 108078. [Google Scholar]
- Zhang, M.; Li, D.; Liu, J.; Zhang, D.; Zhang, Y.; Cui, K. The modification of Mohr-Coulomb criteria based on shape function and determination method of undetermined parameters. Mech. Mater. 2023, 185, 104772. [Google Scholar] [CrossRef] [Scilit]
- Wu, W.; Wang, T.; Bai, J.; Liu, J.; Wang, X.; Xu, H.; Feng, G. Failure Characteristics and Cooperative Control Strategies for Gob-Side Entry Driving near an Advancing Working Face: A Case Study. Processes 2024, 12, 1398. [Google Scholar] [CrossRef] [Scilit]
- Dong, Z.; Tian, S.; Xue, H.; Lu, S.; Liu, B.; Erastova, V.; Chen, G.; Zhang, Y. A novel method for automatic quantification of different pore types in shale based on SEM-EDS calibration. Mar. Pet. Geol. 2025, 173, 107278. [Google Scholar]
- Ni, H.; Guo, X.; Ding, L.; Bai, B.; Sun, X.; Yang, Q. Experimental study on the effect of supercritical CO2 soaking on shale mechanical properties. J. China Univ. Pet. 2019, 43, 77–84. [Google Scholar]
- Guo, H. Nanoindentation Experimental Study on Granite After High-Temperature Heat Treatment. Master’s Thesis, Hubei University of Technology, Wuhan, China, 2017. [Google Scholar]
- Zhang, Z. Nanoindentation Test of Granite and Numerical Simulation Study on Upscaling of Mechanical Parameters. Ph.D. Thesis, Xi’an University of Technology, Xi’an, China, 2023. [Google Scholar]
- Ji, J. Study on Physical and Mechanical Properties and Macro-Micro Mechanical Characteristics of Granite. Ph.D. Thesis, Anhui University of Science and Technology, Huainan, China, 2019. [Google Scholar]
- Gu, S.; Lu, Y.; Li, W. Experimental study on meso-mechanics and fracture performance of coal-measure mudstone based on nanoindentation. Coal Eng. 2023, 55, 128–133. [Google Scholar]
- Cai, Y.; Jia, D.; Qiu, F.; Liu, D.; Yan, X.; Zhou, Y.; An, K. Analysis of micro-mechanical properties of coal rock and their influencing factors based on nanoindentation. J. China Coal Soc. 2023, 48, 879–890. [Google Scholar]
- Jiang, J.; Shen, J.; Hou, D. Test and calculation method of fracture toughness of calcium silicate hydrate based on nanoindentation. J. Chin. Ceram. Soc. 2010, 46, 1067–1073. [Google Scholar]
- Xie, X.; Deng, H.; Hu, L.; He, J.; Li, R.; Mao, J.; Li, B. Exploring the influence of shale foliation structure on its micro-macro mechanical behavior based on nanoindentation and FE-SEM technology. Geol. Rev. 2024, 70, 319–322. [Google Scholar]
- Wang, J.; Che, M.; Song, X.; Su, J.; Zhang, J. Evaluation of rock mechanical parameters based on nanoindentation technology. J. Shenzhen Univ. (Sci. Eng.) 2023, 40, 608–614. [Google Scholar]
- Liu, Z.; Huang, M.; Cui, M.; Xu, K.; Guo, S.; Wang, D. Study on micro-mechanical properties of MICP cemented body of shale soil based on nanoindentation technology. J. Disaster Prev. Mitig. Eng. 2022, 42, 1036–1045. [Google Scholar]
- Zhang, Z.; Zhang, S.; Shi, S.; Zou, Y.; Li, J.; Ma, X.; Xiao, F. Evaluation of multi-scale mechanical properties of conglomerate based on nanoindentation experiments and homogenization method—A case study of tight conglomerate reservoir in the southern slope of Mahu Sag. Chin. J. Rock Mech. Eng. 2022, 41, 926–940. [Google Scholar]
- Lei, M. Study on Meso-Mechanical Properties and Mechanisms of Hydrochemistry and Granite Based on Nanoindentation Tests. Ph.D. Thesis, Xi’an University of Technology, Xi’an, China, 2022. [Google Scholar]
- Zhang, Y.; Gao, F.; Qiao, J.; Tang, X. Analysis of lunar rock mechanical properties based on nanoindentation tests. J. Huazhong Univ. Sci. Technol. (Nat. Sci. Ed.) 2024, 52, 84–90. [Google Scholar]
- Xuhai, T.; Xu, J.; Zhang, Y.; He, Q.; Wang, Z.; Zhang, G.; Liu, Q. Analysis of asteroid rock mechanical parameters based on microscopic rock mechanics tests and NWA13618 meteorite. Rock Soil Mech. 2022, 43, 1157–1163. [Google Scholar]
- Gao, R.; Kuang, T.; Meng, X.; Huo, B. Effects of ground fracturing with horizontal fracture plane on rock breakage charac-teristics and mine pressure control. Rock Mech. Rock Eng. 2021, 54, 3229–3243. [Google Scholar]
- Gao, R.; Dou, B.; Yu, B.; Yang, T.; Meng, X.; Zhang, W. Ground fracturing of multi-strata for strong ground pressure control in extra-thick coal seams with hard roofs: Numerical simulation and case study. Eng. Fract. Mech. 2024, 303, 110129. [Google Scholar]
- Zhang, X.; Li, J. Advancements and challenges of high-speed active flow control: Plasma actuators. Int. J. Heat Mass Transf. 2025, 252, 127481. [Google Scholar] [CrossRef] [Scilit]
- Li, J.; Zhang, X. Active flow control for supersonic aircraft: A novel hybrid synthetic jet actuator. Sens. Actuators A Phys. 2020, 302, 111770. [Google Scholar] [CrossRef] [Scilit]
- Jiang, S.; Zhang, J.; Diao, K.; Liu, X.; Ding, Z. Research Advances in Solvent Extraction of Lithium: The Potential of Ionic Liquids. Adv. Funct. Mater. 2025, 35, 2423566. [Google Scholar] [CrossRef] [Scilit]
- Rong, H.; He, L.; Li, N.; Wang, Z.; Kou, S. Technical research on surrounding rock control of roadways crossing collapse columns in strong mine pressure working faces. Sci. Rep. 2025, 15, 31905. [Google Scholar] [CrossRef] [Scilit] [PubMed]
- Xu, Z.; Cao, W.; Zhang, C.; Zhou, W.; Liu, T.; He, M. A deep and shallow Adaptive Feature Fusion Method for Image Stylization via Adversarial Learning. Signal Process. Image Commun. 2026, 146, 117560. [Google Scholar] [CrossRef] [Scilit]
- Zhang, S.; Lai, X.; Cao, J.; Xu, H.; Zhang, Y.; Yan, B.; Ji, S. Theoretical analyses of surrounding rock stress of a non-circular tunnel considering the horizontal inclination of initial principal stress field. Tunn. Undergr. Space Technol. 2026, 167, 106994. [Google Scholar] [CrossRef] [Scilit]
- Olayiwola, S.O.; Ng, K. Influence of fly-ash reaction on the performance of coal-derived char bricks. J. Mater. Civ. Eng. 2023, 35, 04023337. [Google Scholar] [CrossRef] [Scilit]
- Olayiwola, S.O.; Dejam, M. Experimental study on the viscosity behavior of silica nanofluids with different ions of electrolytes. Ind. Eng. Chem. Res. 2020, 59, 3575–3583. [Google Scholar] [CrossRef] [Scilit]

Disclaimer/Publisher’s Note: The statements, opinions and data contained in all publications are solely those of the individual author(s) and contributor(s) and not of MDPI and/or the editor(s). MDPI and/or the editor(s) disclaim responsibility for any injury to people or property resulting from any ideas, methods, instructions or products referred to in the content. |
© 2026 by the authors. Licensee MDPI, Basel, Switzerland. This article is an open access article distributed under the terms and conditions of the Creative Commons Attribution (CC BY) license.