Article

Experimental and Numerical Investigation of Additively Manufactured Continuous Fibre-Reinforced Composites for UAV Structures

1
Department of Aeronautical Engineering, Faculty of Mechanical Engineering and Naval Architecture, University of Zagreb, 10000 Zagreb, Croatia
2
Department of Materials, Faculty of Mechanical Engineering and Naval Architecture, University of Zagreb, 10000 Zagreb, Croatia
*
Author to whom correspondence should be addressed.
Appl. Sci. 2026, 16(13), 6510; https://doi.org/10.3390/app16136510
Submission received: 26 February 2026 / Revised: 29 April 2026 / Accepted: 18 June 2026 / Published: 30 June 2026
(This article belongs to the Special Issue Advances in Carbon Fiber Reinforced Polymers (CFRPs))

Abstract

Additive manufacturing of continuous fibre-reinforced composites enables lightweight and structurally efficient solutions for aerospace applications. In this work, specimens were fabricated with an Anisoprint Composer A3® printer using carbon fibres and a polyamide (PA) matrix. Unidirectional samples were mechanically tested to determine the Young’s modulus and establish the baseline stiffness of the printed system. Tensile test revealed a Young’s modulus of 37.84 GPa, and three-point bending testing indicated a bending modulus of 26.4 GPa. To improve quality, printing parameters were varied to reduce void formation, and computed tomography (CT) scans were used to quantify porosity. Lowest obtained specimen porosity volume content was 10.06%. To extend the experimental investigation, a numerical representative volume element (RVE) model with three constituents, matrix, fibres, and voids, was developed based on the CT images. This approach provides realistic microstructural representation and offers predictive capability for effective material properties, particularly in assessing the role of voids on stiffness. At the structural level, several wing rib geometries representative of small fixed-wing UAVs were printed and tested. Crushing forces were normalized by weight to evaluate load-bearing efficiency. Results indicate that analysed rib designs combined with reduced porosity improve strength-to-weight performance. The integration of mechanical testing, CT-based analysis, and RVE modelling demonstrates a comprehensive pathway to optimize fibre-reinforced composites in UAV design.

1. Introduction

Additive manufacturing (AM) of continuous fibre-reinforced polymer composites has emerged as a promising approach for producing lightweight structures with adjustable mechanical performance particularly interesting for application in the aerospace engineering. This capability allows localized reinforcement and tailored stiffness distribution, enhancing structural efficiency and enabling significant weight reduction.
However, the layered nature of processes such as fused deposition modelling (FDM) introduces manufacturing defects that distinguish additively manufactured composites from conventionally produced laminates. The sequential deposition of thermoplastic filaments, coupled with repeated thermal cycling and rapid solidification, promotes the formation of voids, inclusions, fibre waviness, and imperfect fibre–matrix and interlayer bonding. These process-induced imperfections result in heterogeneous microstructures and spatial variability in material properties, both within a single layer and across neighbouring layers. Consequently, additively manufactured continuous fibre composites exhibit reduced stiffness compared to their conventionally manufactured counterparts [1]. The presence of such defects not only decreases mechanical performance but also makes predictive modelling much more challenging, as classical homogenization assumptions and idealized material descriptions may not adequately represent the actual microstructure.
Experimental investigations have consistently documented substantial reductions in mechanical performance due to manufacturing-induced porosity and bonding deficiencies. Oztan et al. [1] reported stiffness and strength reductions of up to 40% relative to conventional composites, attributing the degradation primarily to void content and insufficient interfacial bonding. Similarly, Iragi et al. [2] identified porosity levels of approximately 7.5% and weak interlayer adhesion, caused by rapid cooling during printing, as key factors reducing transverse and interlaminar strength. From a computational standpoint, representative volume element (RVE)-based homogenization techniques have been successfully employed to capture the anisotropic behaviour of additively manufactured continuous fibre composites under quasi-static loading. Somireddy and Czekanski [3] utilized RVEs to incorporate microstructural features and predict effective elastic properties, while Polyzos et al. [4] demonstrated that fibre irregularities decrease transverse and shear moduli of continuous carbon fibre-reinforced polyamide composites by approximately 3–4% compared to idealized geometries. Moreover, constitutive models incorporating fibre volume fraction effects have achieved prediction errors below 10% when compared to experimental data [5,6,7].
Despite these developments, comprehensive multiscale modelling strategies, capable of reliably predicting the dynamic and impact behaviour of additively manufactured continuous fibre composites, remain relatively underdeveloped. Experimental studies have shown that impact resistance and damage progression are strongly influenced by the fibre orientation, stacking configuration, and internal architecture [8,9,10]. Nevertheless, robust numerical frameworks for simulating low-velocity impact and drop-tower loading conditions, particularly those incorporating process-induced microstructural variability, are still limited.
In this study, a homogenization-driven numerical framework is proposed to predict the mechanical properties of additively manufactured continuous carbon fibre-reinforced nylon composites manufactured using an Anisoprint Composer A3® printer. CT-based microstructural characterization is used to evaluate the void content for different printing parameters and to assemble representative volume elements (RVEs), from which effective material properties are extracted. These properties are subsequently implemented in explicit finite element (FE) simulations to evaluate structural response under impact loading. The methodology is applied at both coupon and component levels, demonstrating its scalability and its applicability to the analysis and design of lightweight aerospace composite structures.

2. Materials and Methods

2.1. Materials

All specimens were manufactured using an Anisoprint Composer A3® (Anisoprint, Singapore) continuous fibre additive manufacturing system. The printer has a build volume of 460 × 297 × 210 mm, which allowed fabrication of both standardized test coupons and UAV wing-rib specimens. The system uses a co-extrusion process in which continuous fibre reinforcement is impregnated with a molten thermoplastic matrix during deposition. Toolpaths, fibre trajectories, extrusion widths, extrusion temperatures, and layer sequences were defined using the manufacturer’s Aura® slicing software (v2.6.1).
The printer utilizes a dedicated nozzle for continuous fibre deposition, ensuring alignment between the fibre bundle and the extruded polymer flow. Toolpath generation and fibre deposition trajectory definition were performed using the manufacturer’s slicing software Aura®, which allows definition of, among other, fibre trajectories, extrusion widths, extrusion temperatures, and layer stacking sequences.
The reinforcement was a proprietary continuous carbon fibre bundle supplied by Anisoprint®, with an effective bundle diameter of approximately 0.1 mm. The matrix material was Anisoprint® polyamide (PA). Using fibre and matrix materials supplied by the same manufacturer ensured material compatibility and reduced uncertainty associated with constituent mismatch, allowing the study to focus on processing parameters, porosity, and microstructural effects. The use of fibre and matrix materials sourced from the same manufacturer ensured compatibility between constituents and reduced variability associated with interfacial bonding. This choice also minimized uncertainties related to melt viscosity, impregnation behaviour, and chemical compatibility, thereby allowing the study to focus on the influence of processing parameters and microstructural features rather than material mismatches.

2.2. Printing System and Parameters

All testing coupons were printed using a unidirectional fibre layout. Fibre paths were aligned with the primary loading direction for mechanical testing, enabling direct measurement of longitudinal elastic properties.
Specimen geometries for mechanical testing were generated using consistent slicing strategies, including identical orientations, fibre placement, and contour definitions. This approach ensured that geometric effects resulting from varying printing technology do not influence the mechanical properties.
Following fabrication, specimens were left at a controlled room temperature of 25 °C and relative humidity of 50% for 5 days to ensure the equal conditions for all specimens. No post-processing treatments or surface finishing were applied, ensuring that measured properties reflected the as-printed condition.
To establish a consistent manufacturing baseline and enable direct comparison across different specimen geometries, a fixed set of printing parameters was used for all coupons for testing. These parameters were selected based on preliminary trial prints aimed at achieving stable extrusion, reliable fibre impregnation, acceptable surface quality and the void content evaluation described later in this paper. The baseline printing parameters were as follows: extrusion temperature: 265 °C, extrusion width: 0.65 mm, printing speed: 8 mm/s. The printing chambre temperature is not actively regulated on the used printer, but the measurement indicated the temperature during the printing process was constant at 45 °C. The cooling of the specimen was done by gradual decreasing of the print bed temperature from 60 °C to room temperature.
The selected extrusion temperature was chosen to ensure sufficient melt viscosity for effective impregnation of the continuous carbon fibre bundle while avoiding thermal degradation of the polyamide matrix. The extrusion width was maintained at 0.65 mm to balance deposition resolution with process stability and to accommodate the nominal diameter of the impregnated fibre tow. The printing speed was kept relatively low to ensure adequate heat transfer, fibre wetting, and interlayer bonding.
All baseline specimens were printed using identical toolpaths and environmental conditions to minimize external sources of variability. This consistent parameter set served as the reference condition for subsequent mechanical testing and microstructural analysis.

2.3. Parameter Optimization for Void Reduction

Void formation poses a critical issue in additively manufactured continuous fibre-reinforced thermoplastic composites, as voids act as stress concentrators, reduce effective load-bearing cross-section, and degrade fibre–matrix load transfer efficiency, particularly under longitudinal loading. The presence of voids has been shown to significantly reduce elastic stiffness and strength. Selected printing parameters were varied, shown in Table 1, to investigate their influence on void content and internal material quality. Specifically, extrusion temperature, printing speed, and layer height were adjusted due to their direct impact on polymer melt viscosity, fibre impregnation quality, interlayer bonding, and consolidation between layers during deposition. Each specimen consisted of 14 layers, with an average layer height of 0.35 mm.
Specimen quality was evaluated using CT-based porosity measurements. The parameter set with the lowest average void content was selected for manufacturing of the mechanical-test and structural-test specimens.

3. Mechanical Testing of Unidirectional Specimens

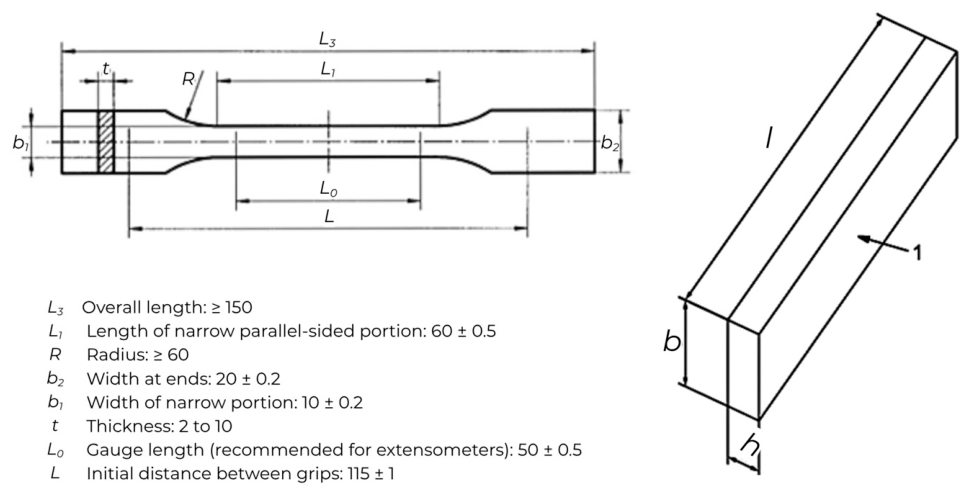
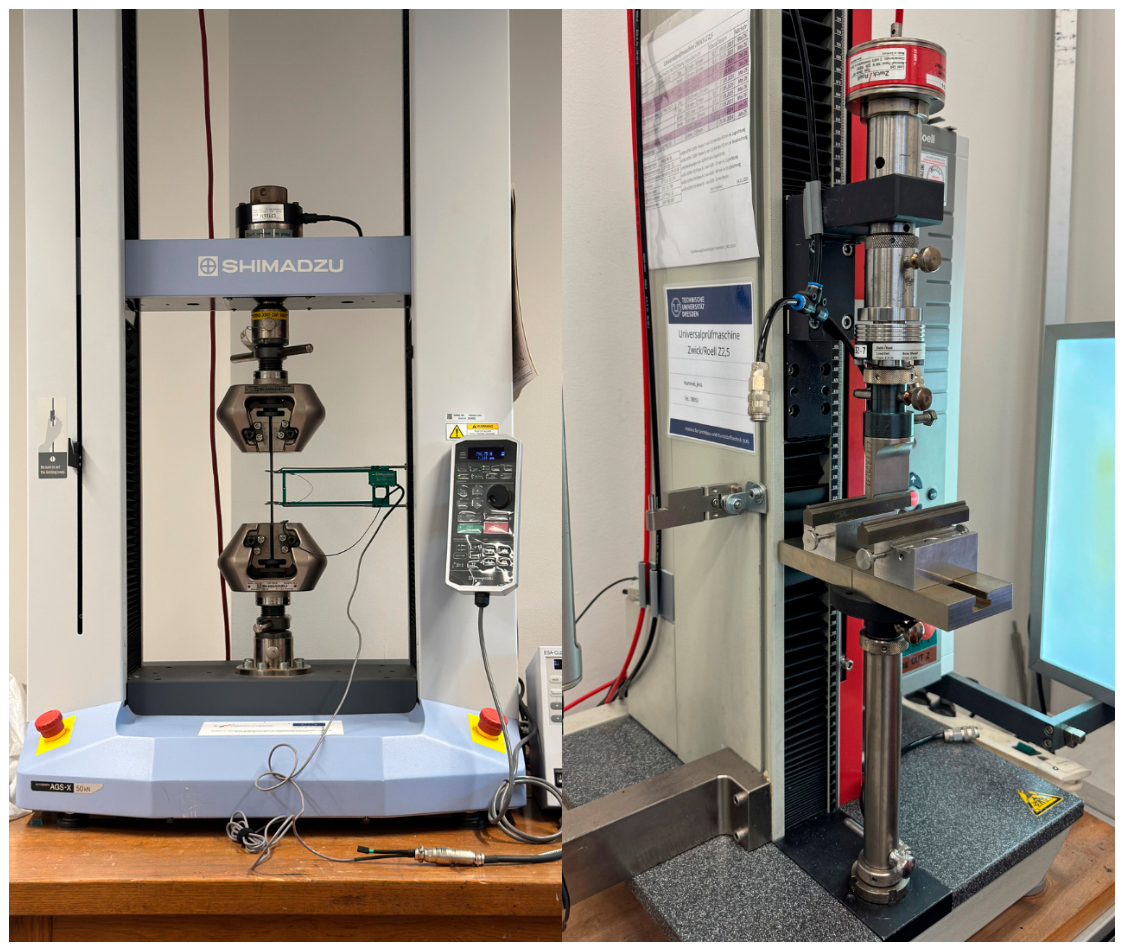
Mechanical characterization was performed using quasi-static tensile and three-point bending tests on unidirectional continuous carbon fibre-reinforced coupons. Tensile specimens were designed according to ISO 527 [11], while flexural specimens followed DIN EN ISO 14125 [12] for unnotched specimens, as shown in Figure 1. The tests were conducted under displacement control using a Shimadzu® AGS-X2 50 kN (Shimadzu Corporation, Kyoto, Japan) universal testing machine for tensile loading and a ZwickRoell® Z2.5 (ZwickRoell GmbH & Co. KG, Ulm, Germany) universal testing machine for bending tests (Figure 2). The recorded force–displacement and strain data were used to determine the effective elastic moduli and corresponding strength values.
During testing, loading was applied perpendicular to the build layers, inducing tensile and compressive stresses on opposing specimen surface. In addition to the force and displacement measurements recorded by the testing machine, a non-contact optical deformation measurement system Aramis 3D 5M (Carl Zeiss GOM Metrology GmbH, Braunschweig, Germany) was employed to capture the full-field deformation of the specimens during bending. The ARAMIS® system enabled accurate measurement of surface strain and mid-span deflection, allowing verification of displacement data and providing insight into strain localization and bending kinematics beyond what is accessible through machine-based measurements alone. Force–displacement curves were obtained for all specimens and subsequently used to calculate the effective flexural modulus and flexural strength. The flexural modulus was extracted from the initial linear portion of the response, while the flexural strength was determined from the maximum recorded force prior to failure.

3.1. Specimen Design and Fabrication

Mechanical test specimens were designed and fabricated to enable characterization of the effective elastic and strength properties of the additively manufactured continuous fibre-reinforced composite material. All specimens were produced using the same additive manufacturing system, materials, and baseline printing parameters described in Section 2, ensuring consistency between manufacturing conditions, microstructural features, and the mechanical properties used for subsequent numerical modelling.
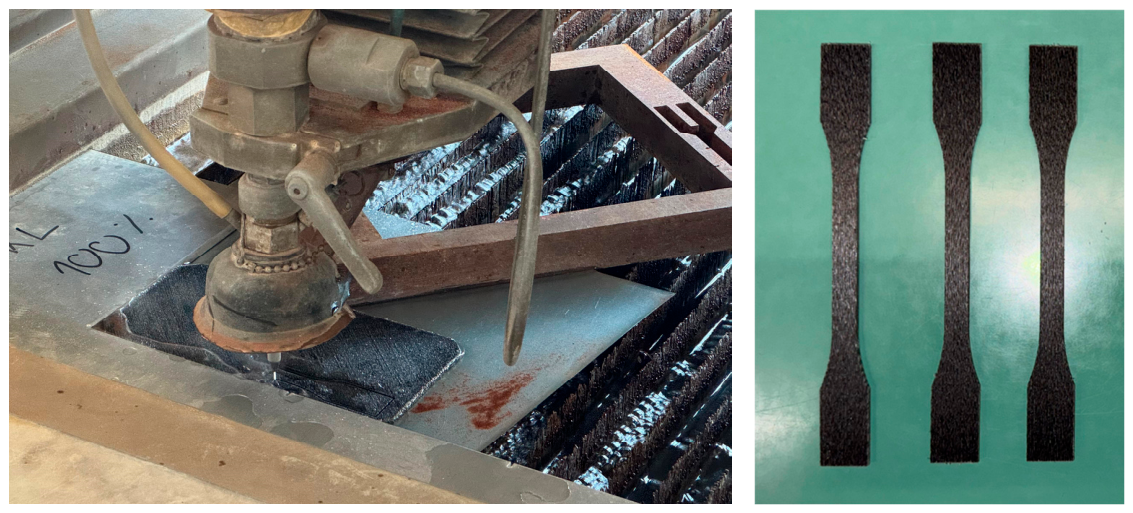
Tensile specimens were prepared in accordance with ISO 527. Flat composite plates were printed and then cut to the final coupon geometry using waterjet cutting, as shown in Figure 3. This procedure provided repeatable specimen dimensions while avoiding thermal damage during cutting. Following the cutting process, all specimens were inspected using callipers to verify that the width along the parallel portion remained within the 0.2 mm tolerance. One tensile specimen was also printed directly in the final coupon shape to compare the two fabrication approaches. The mechanical response of the directly printed specimen and the waterjet-cut specimens showed negligible differences.
All specimens were manufactured with a unidirectional fibre architecture ([0°] orientation). This configuration was selected to assess fibre-dominated mechanical behaviour and to directly characterize the longitudinal stiffness and strength of the printed composite system.
For flexural testing, specimens were designed in accordance with DIN EN ISO 14125 requirements for unnotched coupons. These specimens had nominal dimensions of 80 mm in length, 10 mm in width, and 3 mm in thickness and were also manufactured using a unidirectional [0°] fibre stacking sequence. The continuous fibres were aligned along the longitudinal axis of the specimens.
For each mechanical test type, multiple specimens were fabricated to ensure repeatability and statistical relevance of the experimental results. The resulting specimen set provided an experimental foundation for subsequent analysis, including porosity characterization, micromechanical modelling, and structural-level validation.

3.2. Test Setup and Methodology

Quasi-static tensile tests were performed in accordance with ISO 527 using a Shimadzu® AGS-X2 50 kN universal testing machine. The tests were conducted under displacement control at a crosshead speed of 2 mm/min. Axial strain was measured over the gauge section of each specimen, and the Young’s modulus was calculated from the initial linear region of the stress–strain response. The ultimate tensile strength was determined from the maximum recorded load before failure.
Quasi-static three-point bending tests were performed in accordance with DIN EN ISO 14125 using a ZwickRoell® Z2.5 universal testing machine. The specimens were simply supported over a span of 62 mm using cylindrical supports and loaded at mid-span under displacement control at 2 mm/min. The load was applied perpendicular to the build layers using a Charpy-type striker. Force–displacement data were recorded throughout the tests and used to calculate the flexural modulus and flexural strength. During bending tests, a non-contact ARAMIS® optical measurement system was used to measure surface strain and mid-span deflection. These measurements were used to verify the displacement data and observe strain localization during flexural loading.
The recorded experimental data were processed to determine the effective Young’s modulus and flexural modulus from the initial linear portion of the stress–strain responses for each of the tests and ultimate tensile and flexural strengths from the maximum recorded loads prior to failure. These properties provided a basis for assessing the influence of additive manufacturing parameters on mechanical performance and served as input parameters for the homogenized material models and numerical simulations presented in subsequent sections.

4. Computed Tomography (CT) Analysis and Porosity Quantification

CT Scanning Procedure

Computed tomography (CT) investigations were performed at the Institute of Lightweight Engineering and Polymer Technology (ILK), TU Dresden, using a Phoenix V|tome|x L450® (Waygate Technologies, Hürth, Germany) industrial X-ray CT system. The scanner is equipped with a 450 kV/1500 W minifocus X-ray source and an optional 300 kV/500 W microfocus source, enabling high-resolution imaging of composite materials. For the present study, the microfocus configuration was employed to ensure sufficient resolution for detecting microstructural features such as voids within the carbon fibre-reinforced polyamide matrix. The system allows geometric magnifications up to 400 times for 2D scans and 242 times for 3D scans, with focal spot sizes at the micrometre scale, permitting reliable identification of small-scale porosity.
The scanning parameters were selected to provide sufficient contrast between fibres, matrix, and voids. A tube voltage of 60 kV and current of 100 µA were used. The focus–object distance was 42.50 mm and the focus–detector distance was 849.998 mm, resulting in a geometric magnification of approximately 20× and an isotropic voxel size of 10 µm. Each radiographic projection was exposed for 500 ms. Reconstruction of the volumetric datasets was carried out using filtered back-projection algorithms implemented in the reconstruction software myVGL® 2.2. The resulting three-dimensional voxel datasets provided detailed representations of the internal microstructure and were subsequently processed for segmentation and quantitative porosity analysis.
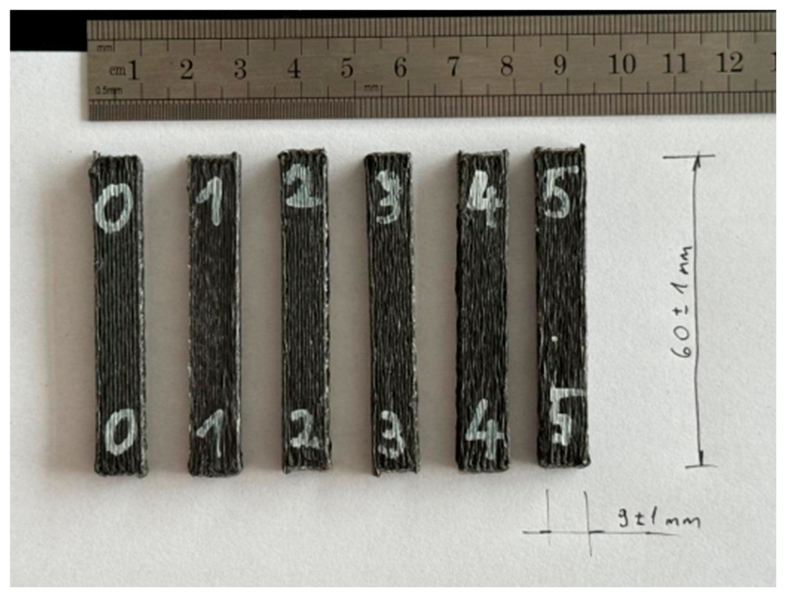
The CT analysis of specimens depicted in Figure 4 was used to quantify the amount and spatial distribution of porosity and to provide defect information for the RVE-based prediction of effective material properties. No in situ thermal measurements were performed during printing; therefore, pro-cess-related sources of the observed porosity distribution are interpreted as likely mechanisms rather than directly verified thermal effects.

5. Finite Element Micromechanical Modelling

5.1. RVE Construction Based on CT Data

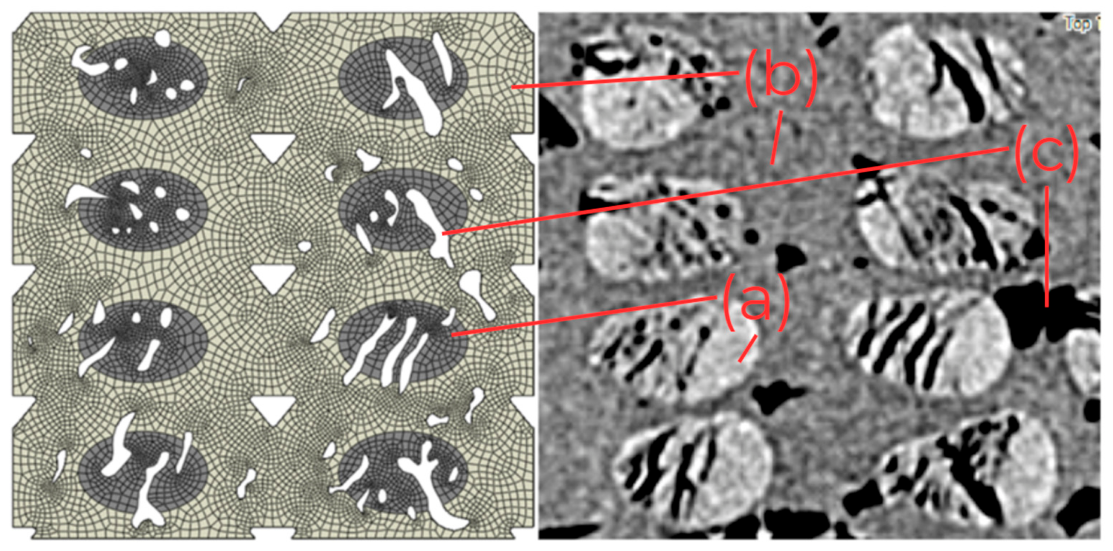
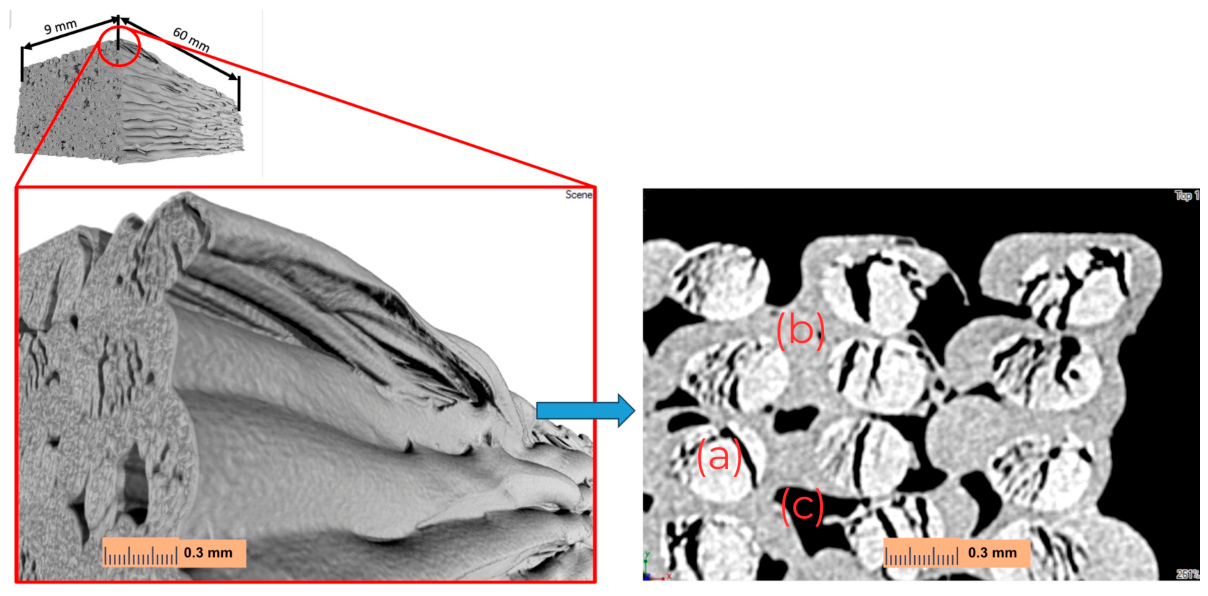
Representative volume elements (RVEs) were generated directly from high-resolution X-ray computed tomography (CT) datasets, depicted in Figure 5, to ensure that the numerical model reflects the actual microstructural characteristics of the additively manufactured continuous carbon fibre-reinforced composite. The reconstructed volumetric images were segmented into three distinct constituents: continuous carbon fibre bundles, polyamide matrix, and voids. Grayscale-based thresholding enabled clear differentiation between solid phases and air-filled regions, allowing fibre distribution, matrix-rich areas, and process-induced porosity to be explicitly identified. The resulting segmented geometry was imported into the numerical environment.
The RVE, depicted in Figure 6, therefore consists of aligned fibre regions representing the continuous reinforcement, the surrounding thermoplastic matrix phase, and discrete void inclusions embedded within the material. Voids were incorporated as explicit geometric entities enabling local stiffness reduction and stress concentration effects to be inherently captured in the homogenized response. Although the porosity represents a limitation of the current manufacturing process, its explicit incorporation provides a more realistic basis for the material-property prediction than an idealized void-free model. The RVE dimensions were selected to be sufficiently large to ensure statistical representativeness of fibre spacing and void distribution while remaining computationally efficient for finite element analysis. A unidirectional architecture consistent with the printing process was assumed, and fibres were idealized as continuous.
The RVE geometry has been discretised using total of 504,392 eight-node, linear, three-dimensional, solid continuum brick element (C3D8R) elements, and the width of the RVE is set to 140 µm.

5.2. Constitutive Models and Boundary Conditions

The RVE-based numerical framework employs linear elastic constitutive descriptions for each constituent phase, consistent with the objective of extracting effective elastic properties. The continuous carbon fibre bundles and the polyamide matrix were modelled as isotropic, linear elastic materials, with elastic constants assigned according to manufacturer-provided data shown in Table 2. The matrix Poisson’s ratio used in Table 2 was selected according to the material supplier’s recommendation for the polyamide employed in this study. While this value is lower than typical literature values for polyamide, its influence on the predicted effective longitudinal elastic response was found to be negligible in a sensitivity analysis. Although carbon fibres are intrinsically transversely isotropic, an isotropic representation at the bundle scale was adopted to maintain consistency with the homogenization objective and to limit additional modelling uncertainty. This approach has been used in the previous RVE-based studies of continuous and chopped carbon fibre composites [13,14,15]. Voids were treated as physical voids inside the model, without any assigned properties, thereby introducing local stress concentrations and stiffness degradation directly through geometric representation rather than through modified material parameters.
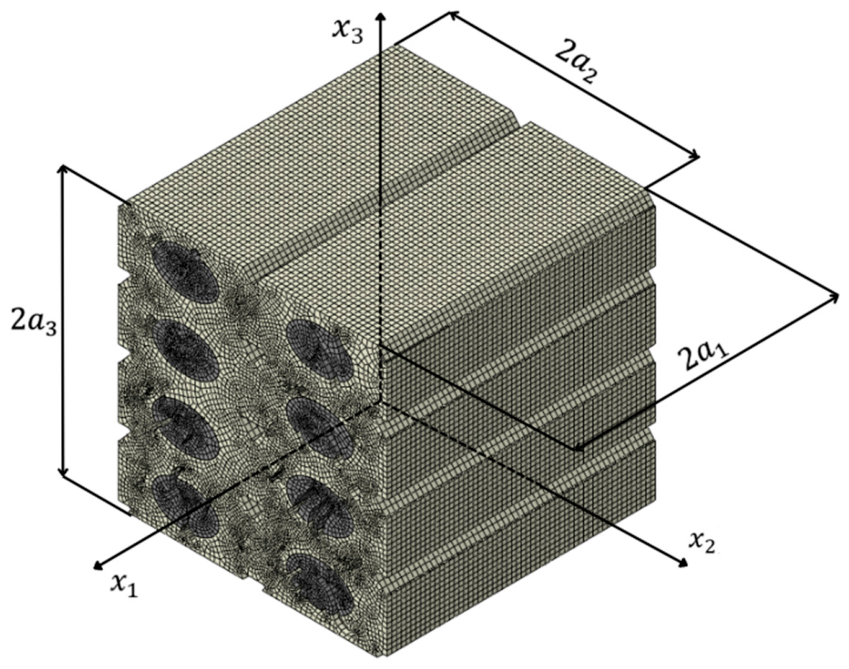
Effective composite properties were determined using a numerical homogenization approach based on volume averaging of the stress response under prescribed strain states. The RVE, shown in Figure 7, was subjected to a sequence of independent unit strain load cases to extract the components of the effective stiffness tensor. Uniform displacement boundary conditions were applied on opposing RVE faces to impose macroscopic normal and shear strain components sequentially, following standard homogenization procedures. For each load case, the resulting heterogeneous stress field was volume-averaged to compute the corresponding macroscopic stress response, enabling determination of the orthotropic stiffness matrix. The detailed numerical homogenization approach is described in [16].
The boundary conditions applied to the RVE used to determine the mechanical properties can be described with the Equations (1)–(3).
u i a 1 ,   x 2 ,   x 3 u i a 1 ,   x 2 ,   x 3 = 2 a 1 ε i 1 0 ,   a 2 x 2 a 2 ,   a 3 x 3 a 3 ,
u i x 1 , a 2 ,   x 3 u i x 1 , a 2 ,   x 3 = 2 a 2 ε i 2 0 ,   a 1 x 1 a 1 ,   a 3 x 3 a 3 ,
u i x 1 ,   x 2 ,   a 3 u i x 1 ,   x 2 , a 3 = 2 a 3 ε i 3 0 ,   a 1 x 1 a 1 ,   a 2 x 2 a 2 .
The resulting stress fields were averaged by the volume to calculate the corresponding macroscopic stress. The strain is applied to stretch the RVE in the fibre direction (direction x 1 ) in order to determine the components C i 1 , with i = 1 ,   2 ,   3 , according to the expression
ϵ 1 0 = 1 ,                                                                           ϵ 2 0 = ϵ 3 0 = γ 4 0 = γ 5 0 = γ 6 0 = 0 .
Similarly, the components C i 2 and C i 3 , with i = 1 ,   2 ,   3 , are calculated by applying strain to stretch the RVE in the direction x 2 and x 3 , respectively, according to the expressions
ϵ 2 0 = 1 ,                                                                           ϵ 1 0 = ϵ 3 0 = γ 4 0 = γ 5 0 = γ 6 0 = 0 ,
ϵ 3 0 = 1 ,                                                                           ϵ 1 0 = ϵ 2 0 = γ 4 0 = γ 5 0 = γ 6 0 = 0 .
Finally, the term C 66 is determined by setting
γ 6 0 = ϵ 12 0 + ϵ 21 0 = 1 ,                                   ϵ 1 0 = ϵ 2 0 = ϵ 3 0 = γ 4 0 = γ 5 0 = 0 .
This approach is used to determine the values of the stiffness tensor C averaged by volume as shown in Equation (8) [16], where only one component of the strain ϵ β 0 is different from zero for each of the six components of stiffness tensor C.
C α β = 1 V V σ α x 1 ,   x 2 ,   x 3 d V ,                                     with   ϵ β 0 = 1 .
Using Equation (9) [16], longitudinal and transversal Young’s moduli, Poisson’s ratios and shear modulus are calculated.
E 1 = C 11 2 C 12 2 C 22 + C 23 , ν 12 = C 12 C 22 + C 23 , E 2 = C 11 C 22 + C 23 2 C 12 2 C 22 C 23 C 11 C 22 C 12 2 , ν 23 = C 11 C 23 C 12 2 C 11 C 22 C 12 2 , G 12 = C 66 .
The applied boundary conditions ensured consistency with the assumed periodic microstructure while maintaining computational stability. Specifically, displacement differences were prescribed between opposite faces of the RVE to enforce uniform macroscopic strain states in the fibre direction, transverse directions, and shear modes. This procedure allowed extraction of longitudinal and transverse Young’s moduli, Poisson’s ratios, and shear modulus from the homogenized stiffness tensor.

5.3. Predicted Effective Properties

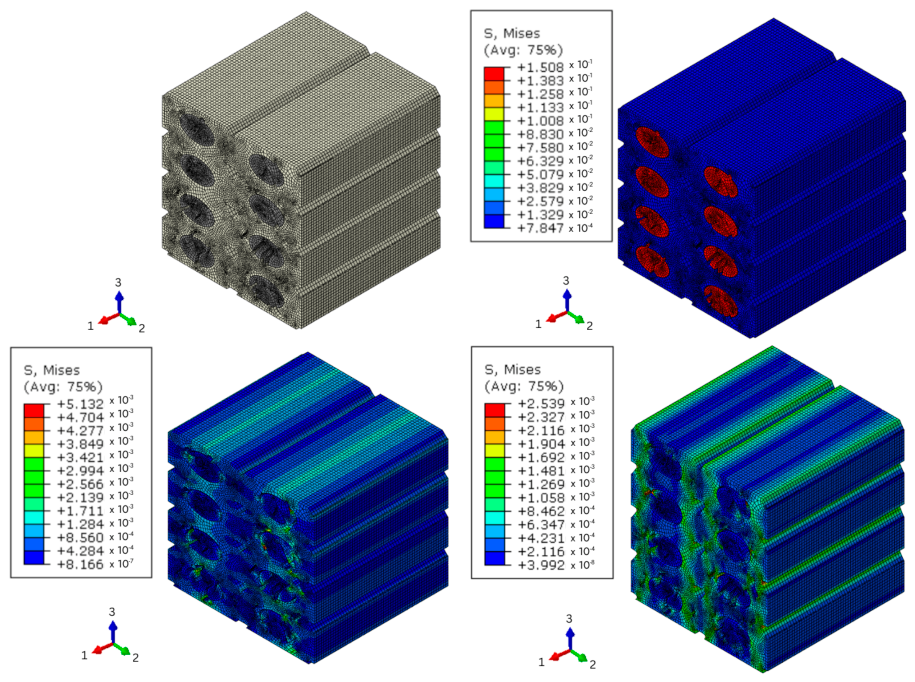
The numerical homogenization of the CT-derived representative volume element yielded orthotropic effective elastic properties that explicitly account for fibre architecture and process-induced porosity. Stress results for each direction are depicted in Figure 8. These displacements were used to calculate the averaged stiffness tensor C and subsequently to calculate the effective elastic constants using a post processing subroutine implemented in Python® 3.14. In the fibre direction, the finite element-based homogenization predicted a longitudinal Young’s modulus of 34.42 GPa. The transverse modulus was significantly lower, with the FEM-based model predicting 0.46 GPa, reflecting the combined influence of matrix-dominated behaviour and the explicit inclusion of voids within the microstructure. These results confirm the pronounced anisotropy characteristic of additively manufactured continuous fibre composites.
When compared to experimental tensile testing of unidirectional [0°] specimens, which yielded an average longitudinal Young’s modulus of 37.84 GPa, the numerically predicted longitudinal Young’s modulus shows good agreement, with a difference of approximately 9%. The remaining discrepancy can be attributed to modelling assumptions such as idealized elastic behaviour, geometric simplifications of fibre bundles, and the absence of interfacial damage mechanisms.

6. Structural-Level Application: UAV Wing Ribs

6.1. Wing Rib Design and Manufacturing

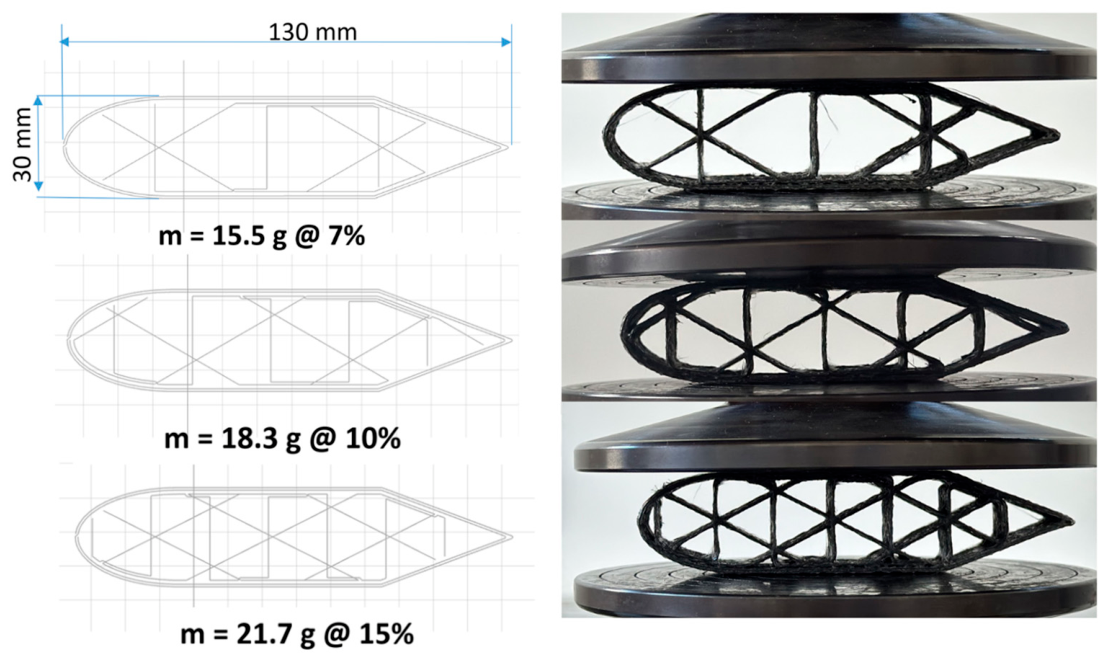
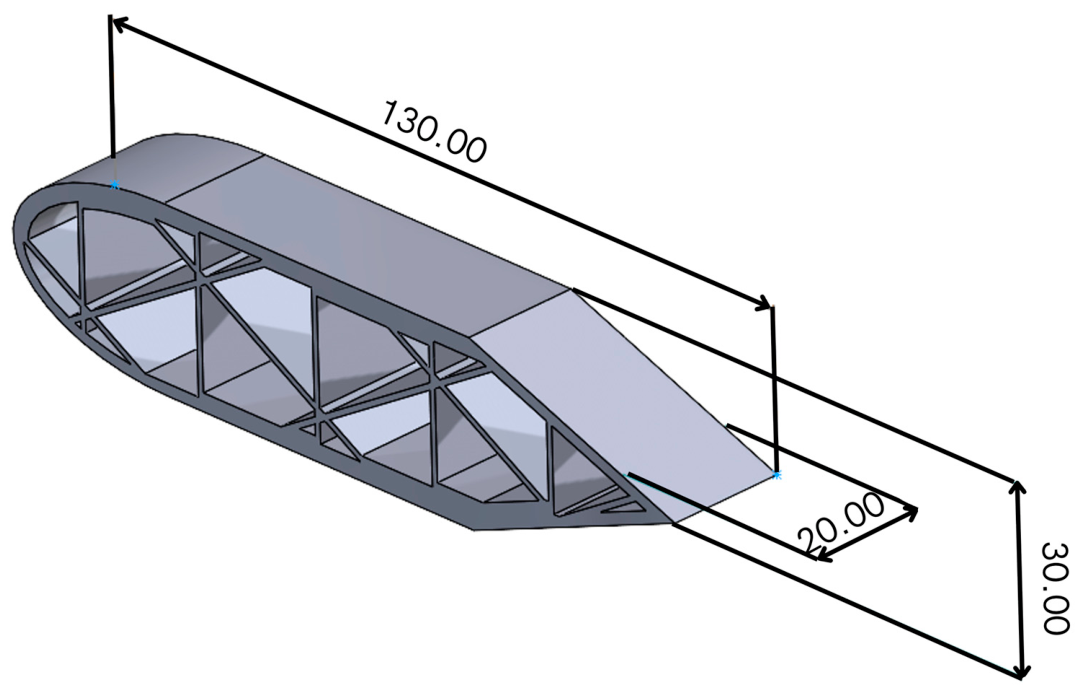
To evaluate the macroscopic structural response of additively manufactured aerospace components, a composite aerofoil section, depicted in Figure 9, was designed and manufactured using continuous fibre-reinforced polymer additive manufacturing. The aerofoil geometry was intentionally simplified to accommodate the constraints of the experimental setup, resulting in parallel upper and lower surfaces while preserving the characteristic load-bearing features of an aerodynamic profile. This simplification enabled controlled and repeatable loading conditions during crushing tests while maintaining structural relevance. The internal composite reinforcement architecture was varied by modifying the density of equilateral infill pattern in order to investigate its influence on the maximum crushing force relative to specimen mass. Infill densities of 7%, 10%, and 15% have been used for manufacturing of the specimens. The outer shell thickness was set at 2 mm, and the resulting interior volume was filled in the slicing software Aura® with supporting elements so that the total volume of the internal support equals 7%, 10% and 15%. Diagonal supports are at an angle of 60° to the vertical supporting elements, forming equilateral triangles. This approach allowed assessment of the structural efficiency of different reinforcement strategies under compressive loading. A total of three aerofoil specimens with distinct internal reinforcement configurations were manufactured and tested.

6.2. Structural Testing Methodology

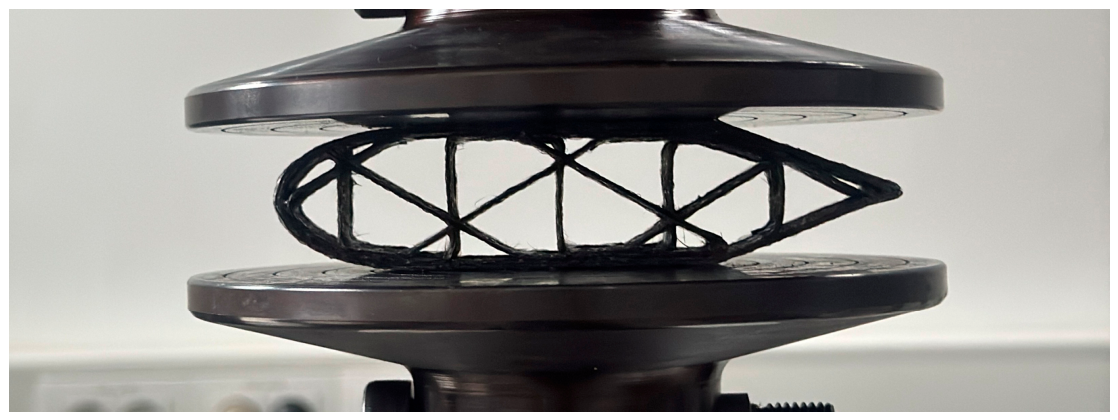
Quasi-static crushing experiments were conducted using a Messphysik BETA 50-5® (ZwickRoell Testing Systems GmbH, Fürstenfeld, Austria) universal testing machine, at the Faculty of Mechanical Engineering and Naval Architecture, University of Zagreb, under displacement-controlled conditions. The aerofoil specimens were positioned vertically between two rigid flat compression plates, shown in Figure 10, ensuring uniform load application across the cross-sectional area. One specimen per configuration has been tested. Boundary conditions were selected to approximate ideal vertical crushing, with lateral constraints minimized to allow natural deformation and progressive damage development. A constant crosshead displacement rate of 1 mm/min was applied throughout the tests to ensure quasi-static loading and to avoid dynamic effects. During testing, the applied force and axial displacement were continuously recorded to generate force–displacement curves for each aerofoil configuration. These curves were used to identify key crushing characteristics, including the initial peak force, post peak load evolution, and progressive deformation behaviour. Visual observation of the specimens during and after loading enabled identification of dominant deformation and failure modes, such as local buckling, delamination, fibre fracture, and progressive crushing of the printed layers. Force–displacement curves and post-test observations were used to compare peak load, post-peak response, and deformation modes.

6.3. Numerical Simulation of Aerofoil Crushing Test

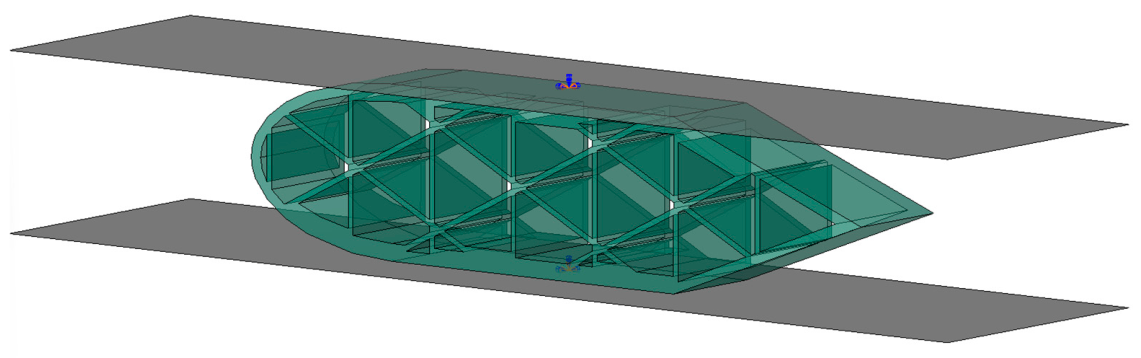
Numerical simulations of the aerofoil compression tests were performed using the Abaqus/Standard implicit finite element solver. The experimental setup was represented by two analytical rigid plates, with the aerofoil specimen positioned vertically between them, as shown in Figure 11. The simulations were intended to reproduce the initial elastic response of the specimens and did not include progressive damage mechanisms such as fibre fracture, matrix cracking, interlayer debonding, or delamination due to current lack of reliable data.
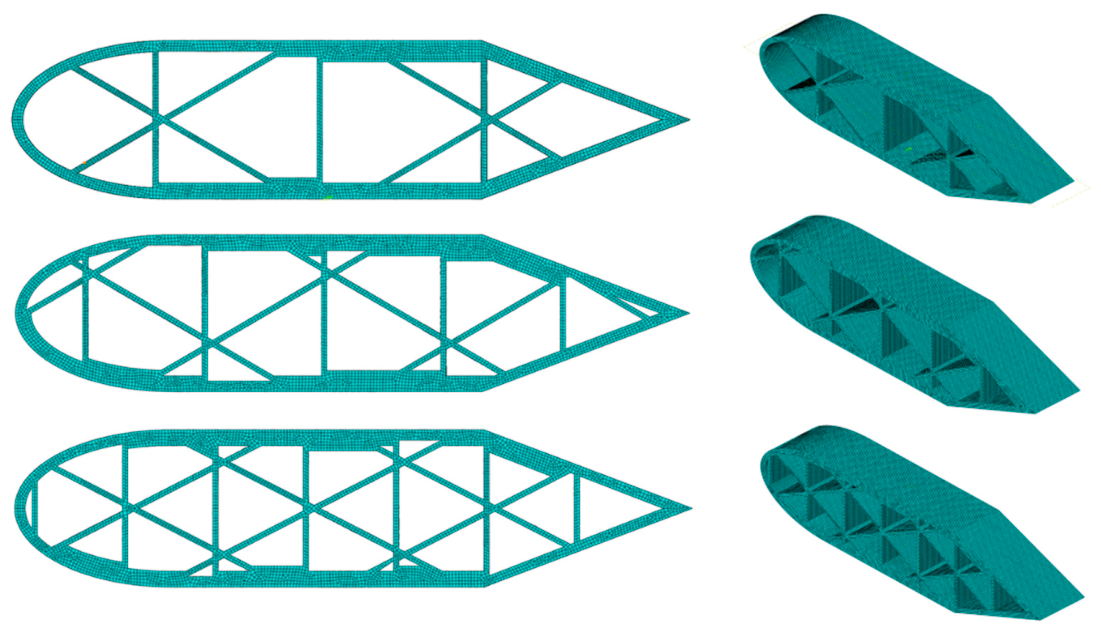
The three aerofoil geometries were discretized using reduced-integration linear hexahedral C3D8R elements, as shown in the Figure 12. The corresponding number of elements were 106,689, 115,830, and 125,598, respectively. The composite material was modelled using the RVE-derived orthotropic elastic properties listed in Table 3. A mesh convergence assessment was conducted to verify that further mesh refinement did not produce significant changes in the predicted force–displacement response. The adopted mesh density and corresponding element sizes were therefore considered sufficient with respect to the employed C3D8R element formulation, ensuring reliable numerical predictions without excessive computational demand.
Contact between the aerofoil specimens and the rigid plates was defined using the Abaqus/Standard general contact algorithm. Normal contact was modelled using hard contact, while no additional tangential friction behaviour was prescribed. The lower rigid plate was fully constrained, and the upper plate was assigned a prescribed vertical displacement. Horizontal translations and rotations of the upper plate were constrained to maintain axial compression and parallel alignment between the plates.
Boundary conditions, shown in Figure 11, were prescribed to replicate the experimental displacement-controlled loading procedure. The lower rigid plate was fully constrained in all translational and rotational degrees of freedom. The upper rigid plate, representing the moving crosshead of the testing machine, was subjected to a prescribed vertical displacement applied incrementally throughout the analysis. Translational degrees of freedom in the horizontal directions were restricted to ensure purely axial compression and to prevent rigid body motion, while rotation was suppressed to maintain parallel alignment between the compression plates. This displacement-controlled approach enables direct extraction of force–displacement curves for comparison with experimental results and provides stable convergence behaviour in the post-peak regime.

7. Results

7.1. Experimental Results

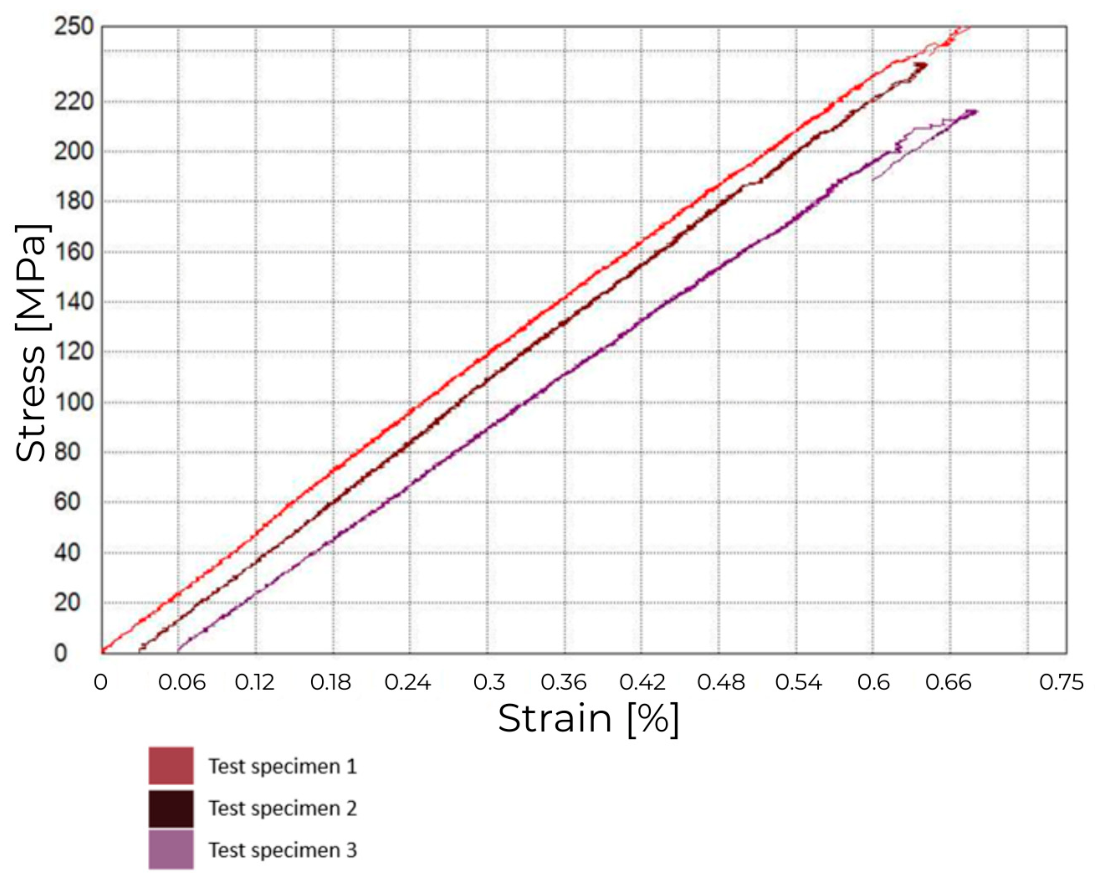
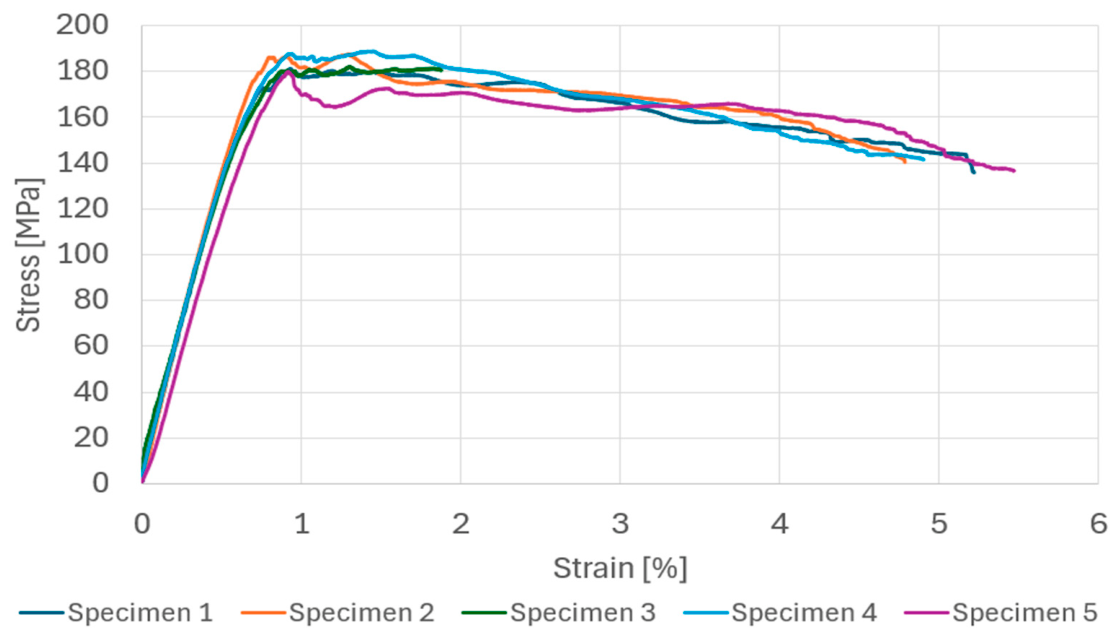
Under quasi-static tensile loading, the unidirectional [0°] specimens exhibited a predominantly linear elastic response up to failure, indicating fibre-dominated behaviour with limited plastic deformation prior to fracture. In line with the selection of the Type 1B geometry, all valid test specimens exhibited fracture exclusively within the designated gauge area. No premature failures due to crushing or slippage in the grips were observed, confirming that the “dog-bone” geometry successfully mitigated the stress concentrations encountered in preliminary trials with straight-sided specimens, adhering to the requirement that specimens that break or slip inside the grips must be discarded. The average Young’s modulus measured for this configuration was 37.84 GPa with standard deviation of 1.45 GPa. The specimens sustained an average maximum force of 9593.30 N with standard deviation of 694.67 N, corresponding to an average ultimate tensile stress of 236.40 MPa with standard deviation of 20.42 MPa. Tensile testing of the [90°] configuration was not performed, as loading transverse to the fibre direction would primarily activate matrix-dominated deformation mechanisms and interlayer bonding rather than the reinforcing fibres, resulting in limited insight into the fibre-driven mechanical performance that is the focus of this study. The interlaminar (between layers) and intralaminar (inside one layer) properties have significant impact on behaviour of structures in real life loading cases, but the scope of this study included fibre-dependant performance, and the testing specimens have been developed to focus on the properties in the fibre direction. Stress–strain curves are depicted in Figure 13.
The flexural behaviour of the unidirectional composite material was evaluated through quasi-static three-point bending tests, which revealed stable and repeatable responses across multiple specimens, shown in Figure 14. The force–displacement and corresponding flexural stress–strain curves exhibited consistent trends, characterized by an initial linear elastic region followed by a gradual reduction in load-carrying capacity prior to failure. This progressive post-peak behaviour suggests the activation of damage mechanisms such as fibre cracking and interlayer debonding rather than abrupt brittle fracture.
The average flexural modulus E f determined from the linear elastic portion of the response was 26.4 GPa with standard deviation of 1.48 GPa, with good repeatability and uniform stiffness among the tested specimens. The mean maximum bending force F M reached 262 ± 5.4 N, corresponding to an average flexural stress σ f M of 184 ± 3.96 MPa. Results for all specimens and average values are shown in Table 4 and depicted in Figure 14.
In contrast to stiffness and strength, the flexural strain ϵ f M at maximum stress exhibited greater variability, with an average value of 1.18% and a coefficient of variation of 20.59%. This increased scatter is attributed to the sensitivity of deformation and damage evolution to local microstructural features inherent to the additive manufacturing process, such as void distribution and fibre alignment imperfections. Flexural stress at break σ f B , strain at break ϵ f B , and force at break F B are listed in Table 4. These results collectively provide an experimental basis for subsequent micromechanical modelling and structural-level analyses presented in this work.

7.2. Porosity Results

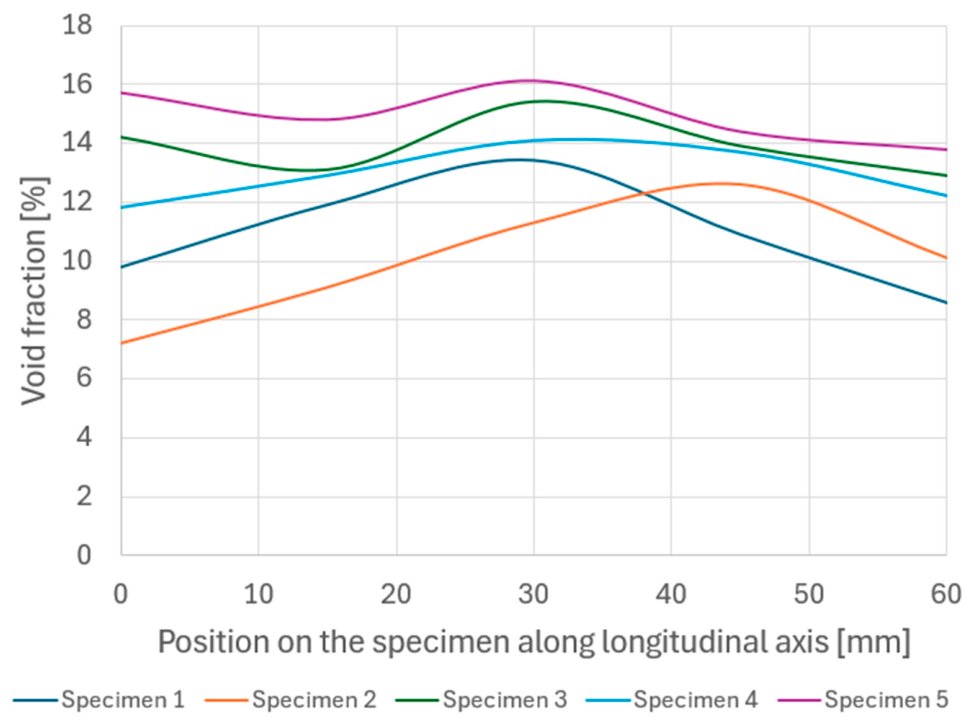
The analysis was aimed at determining both the global void fraction for different printing parameters as well as its spatial distribution along the specimen length. For each specimen, five cross-sectional areas were extracted along the longitudinal axis. Within each section, the void content was calculated by segmenting air-filled regions and computing the ratio between the total void area and the corresponding cross-sectional area of the specimen. This two-dimensional sectional approach, consistently applied across all specimens, ensured comparability between different scans while capturing longitudinal variations in porosity.
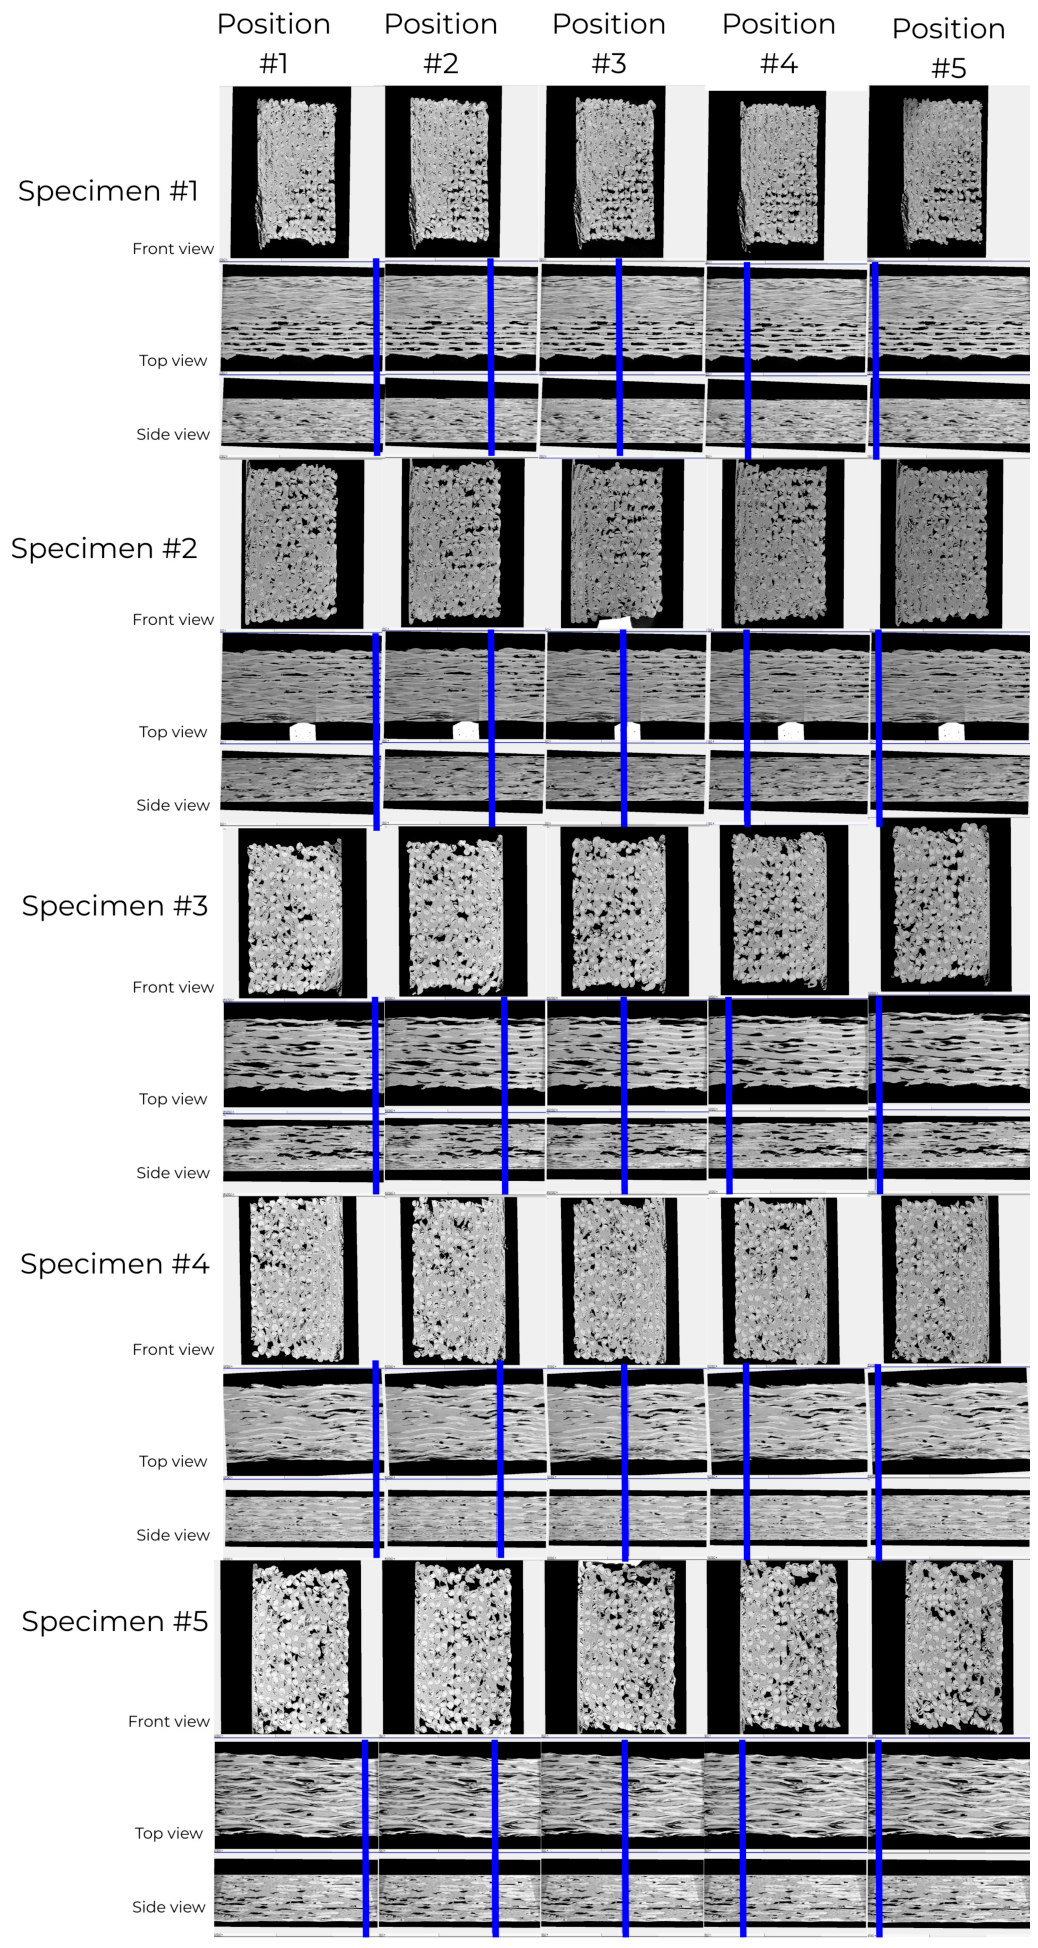
The results revealed measurable void content, not considering voids smaller than the minimum voxel size in all investigated specimens, confirming that process-induced porosity is an inherent feature of the employed additive manufacturing strategy. Void fraction for all tested specimens along the length of specimen is shown in Figure 15. CT scans for all specimens are shown in Figure 16. Among the five specimens, shown in Table 5, specimen 2 exhibited the lowest average void fraction across the evaluated sections, indicating comparatively improved consolidation quality and fibre–matrix interaction for the used printing parameters. This finding suggests that variations in processing conditions or local deposition stability can slightly influence internal material quality. In contrast, the remaining specimens displayed moderately higher porosity levels, with some variability between sections.
A consistent trend was observed across all specimens, with the void fraction increasing toward the central region of the specimen length and decreasing near the end regions, as shown in Figure 7. This longitudinal variation indicates that the void distribution was not fully uniform along the printing path. A possible explanation is that local deposition conditions, including changes in nozzle motion near the start and end regions, affected consolidation and void entrapment. However, since no in situ thermal or process-temperature measurements were performed, this explanation should be regarded as an interpretation rather than a directly verified mechanism.
In addition to the global cross-sectional analysis, a detailed close-up evaluation of the fibre-bundle regions was conducted to investigate porosity inside fibres. Segmentation of these high-resolution regions revealed an average void fraction of 14.4% within the fibre-bundle domain. This value indicates incomplete impregnation of the carbon fibre filaments by the polyamide matrix and suggests the presence of micro-scale air pockets trapped between individual filaments within the fibre bundle during co-extrusion. Such porosity is mechanically significant, as it reduces effective load transfer efficiency and lowers longitudinal stiffness.
The reported void fractions are affected by the 10 µm CT voxel size and segmentation threshold selection, so pores close to the resolution limit may not be fully captured. Nevertheless, the CT analysis identified specimen 2 as the lowest-porosity configuration, supporting its use for subsequent specimen manufacturing and justifying the explicit inclusion of voids in the RVE model. The measured porosity levels are relatively high for certified aerospace structural applications. Therefore, the present work should not be interpreted as a qualification of the investigated material system for commercial aerospace use. Instead, the CT analysis was used to quantify process-induced porosity under the selected manufacturing conditions and to provide realistic information on defects for subsequent micromechanical modelling.

7.3. Results of Aerofoil Crushing Tests

Quasi-static crushing tests were conducted to evaluate the load-bearing behaviour and structural efficiency of additively manufactured continuous carbon fibre wing ribs produced with three different infill configurations, 7%, 10%, and 15%, depicted in Figure 17, with masses presented in Table 6.
Since all wing-rib configurations were manufactured using the same material system and selected printing parameters, the crushing tests are interpreted as a relative comparison of internal reinforcement configurations rather than as statistically derived aerospace design solutions. The porosity present in the specimens is therefore considered as a common manufacturing-related feature across the tested configurations, while the comparison focuses on the effect of infill architecture on load-bearing efficiency.
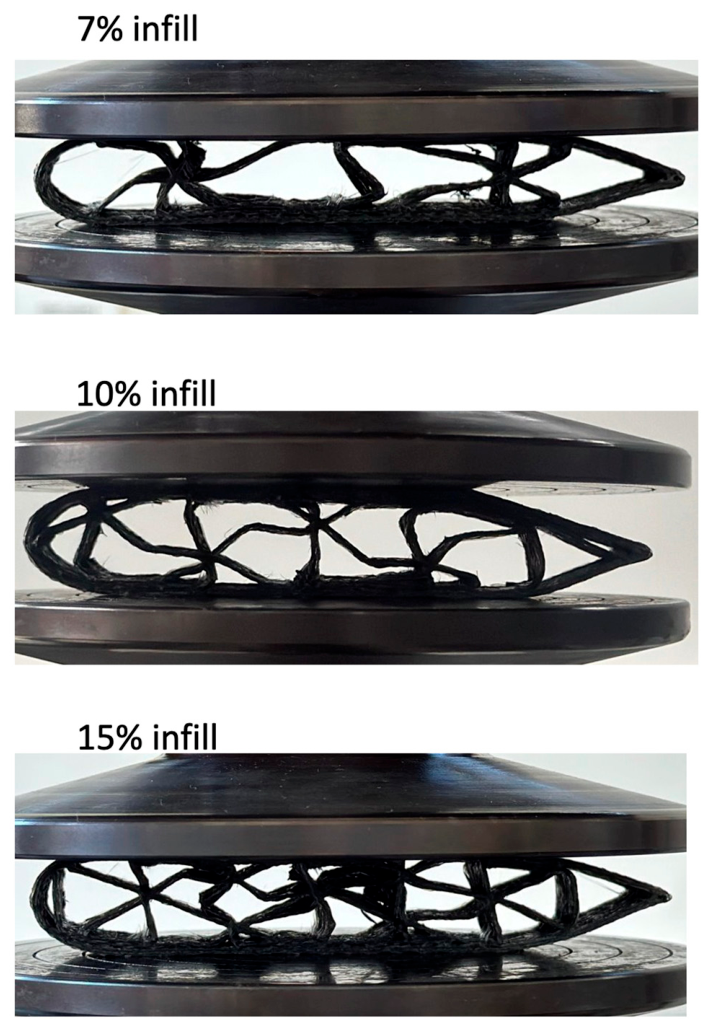
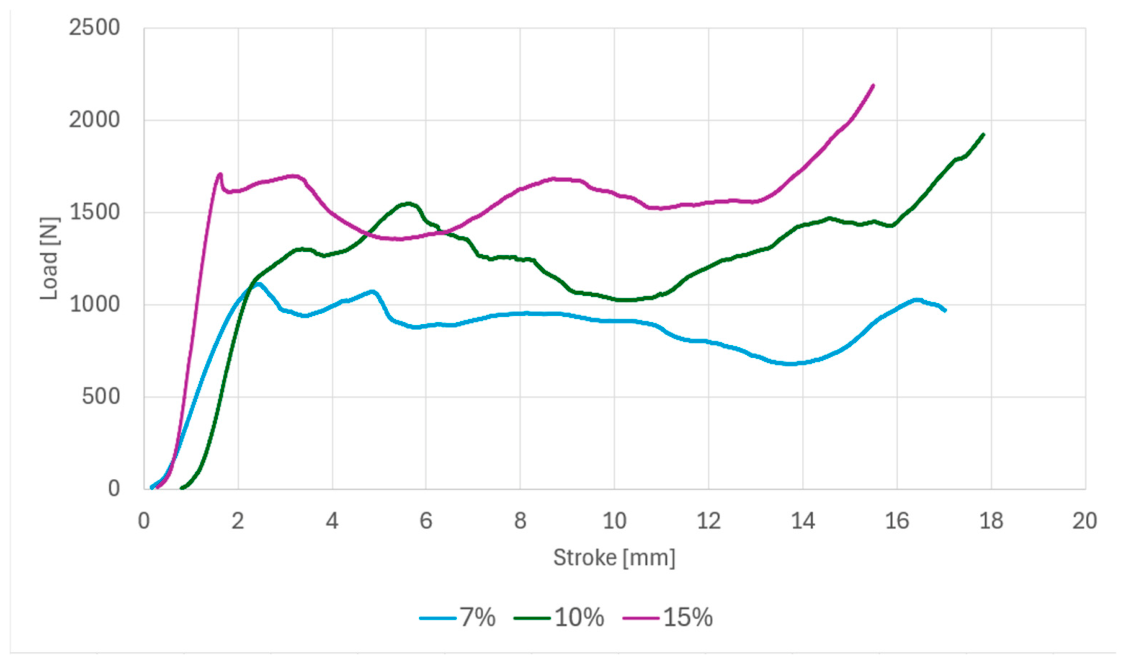
The force–displacement curves obtained from the tests, depicted in Figure 18, reveal a response of an initial elastic region, followed by a distinct first peak associated with the onset of structural failure, and a subsequent progressive crushing phase marked by load oscillations. In Figure 19 specimens after the crushing test are depicted.
The first pronounced peak F i was used as the initial failure load, corresponding to the onset of local buckling, fibre fracture, or interlayer damage in the rib structure. Increasing the infill density increased the absolute initial failure load; the 7% infill rib showed the lowest peak load, while the 15% infill rib showed the highest resistance to initial collapse.
To compare structural efficiency, the peak force was normalized by specimen mass. The resulting force-to-weight ratios were 71.038 N/g for the 7% infill rib, 71.613 N/g for the 10% infill rib, and 79.256 N/g for the 15% infill rib, as shown in Table 7. Although the 10% infill configuration increased the absolute load-carrying capacity compared with the 7% configuration, its force-to-weight ratio remained nearly unchanged. This indicates that the added material increased mass without producing a proportional improvement in structural efficiency. In contrast, the 15% infill configuration showed a clear improvement in force-to-weight performance.
After the initial failure peak, all specimens exhibited progressive crushing rather than immediate catastrophic collapse. This behaviour suggests a gradual damage evolution involving local buckling of internal webs, fibre fracture, and interlayer delaminations. The 15% infill rib maintained higher post-peak load levels than the other configurations, while the 7% infill rib showed earlier load degradation. The 10% infill rib exhibited intermediate behaviour. Overall, the results indicate that increasing infill density improves load capacity, but a clear improvement in mass-normalized structural efficiency was observed only for the 15% infill configuration. These findings confirm that appropriate infill selection can improve strength-to-weight efficiency, a critical parameter for lightweight aerospace structures such as unmanned aerial vehicle (UAV) wing ribs.

7.4. Numerical Simulation Results of Aerofoil Crushing Test

It should be emphasized that the numerical simulations were limited to the initial elastic portion of the crushing response. Progressive damage mechanisms such as fibre fracture, matrix cracking, interlayer debonding, and delamination were not yet incorporated into the constitutive model. Consequently, the simulations were not intended to reproduce the post-peak behaviour or progressive crushing phenomena observed experimentally, but rather to evaluate the initial stiffness and load transfer characteristics of the aerofoil structures. The composite material was therefore modelled using homogenized linear elastic properties derived from the RVE-based micromechanical analysis described in the preceding sections. These effective orthotropic elastic constants were implemented at the structural scale, ensuring consistency between the microstructural characterization and the structural-level simulations.
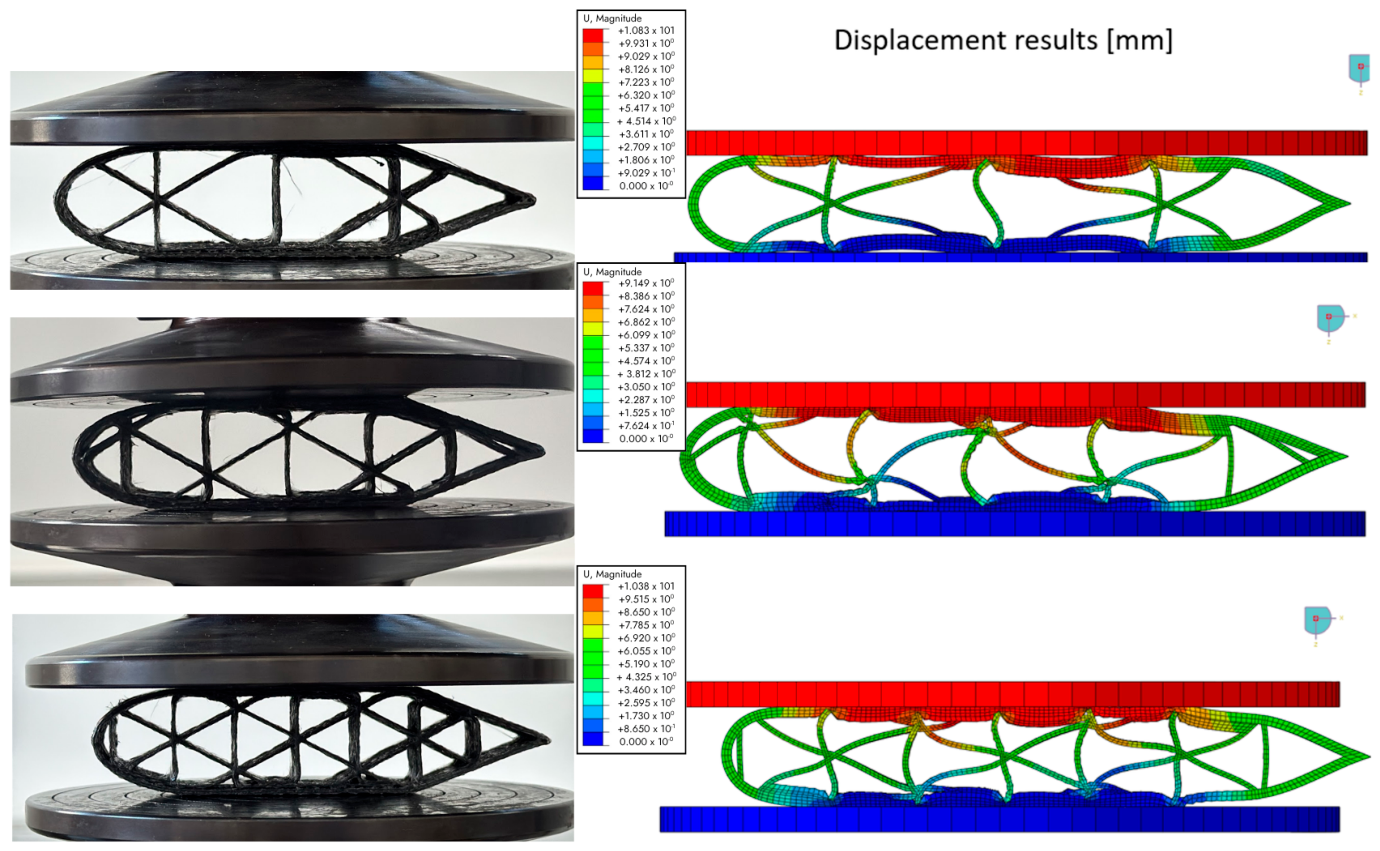
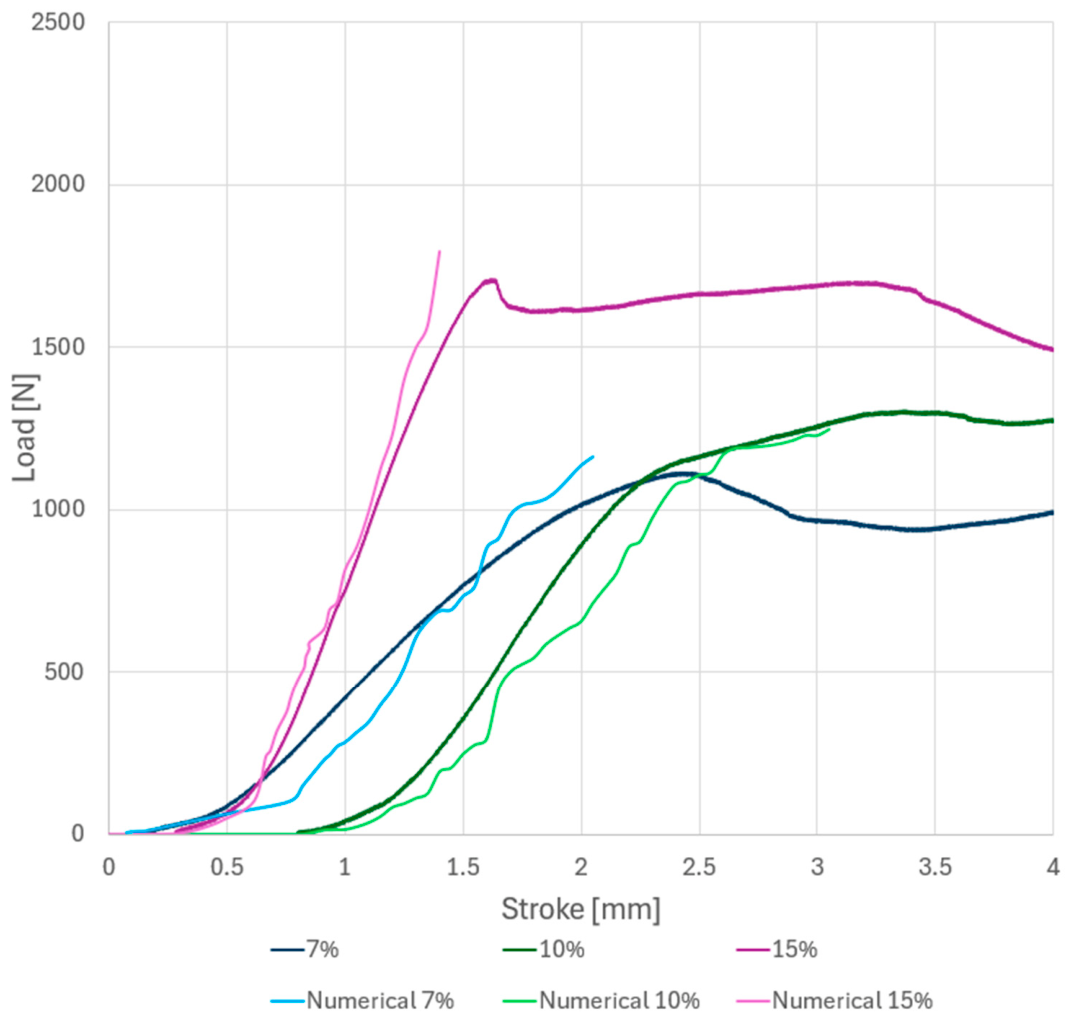
The numerical simulations demonstrate good agreement, as shown in Figure 20 and Figure 21, with the experimental force–displacement responses in the initial loading regime for all three infill configurations. In this region, the structural behaviour is predominantly elastic, and the response is governed by the stiffness of the composite material and the global geometry of the aerofoil. The predicted initial slopes of the force–displacement curves closely match the experimentally measured stiffness, indicating that the RVE-derived elastic properties provide a consistent and representative description of the material behaviour at the structural scale. Minor deviations between numerical and experimental results can be attributed to manufacturing-induced imperfections and local damage mechanisms that are not captured within the purely elastic modelling framework. Overall, the correlation confirms the validity of the adopted homogenization approach and boundary condition implementation for predicting the initial structural response of additively manufactured composite aerofoils under quasi-static compression.

8. Conclusions

This study presented an integrated experimental and numerical investigation of additively manufactured continuous carbon fibre-reinforced polyamide composites for potential lightweight UAV structural applications. The framework combined controlled manufacturing, mechanical characterization, CT-based porosity analysis, RVE homogenization, and structural-level crushing tests to relate processing conditions, internal defects, effective material properties, and component performance.
Mechanical testing of unidirectional [0°] specimens showed fibre-dominated behaviour, with an average longitudinal Young’s modulus of 37.84 GPa and tensile strength of 236.40 MPa. Flexural testing showed stable and repeatable responses, although variability in flexural strain indicated sensitivity to local microstructural heterogeneity and manufacturing-induced imperfections.
CT analysis confirmed measurable porosity in all investigated specimens. Specimen 2 showed the lowest average void fraction of 10.06%, while specimen 5 showed the highest value of 14.96%. Void content varied along the specimen length, increasing toward the mid-length region and decreasing near the ends, suggesting an influence of local deposition conditions. Additional fibre-bundle analysis revealed an average void fraction of 14.4%, indicating incomplete impregnation of the carbon fibre filaments. The CT-derived RVE model predicted a longitudinal Young’s modulus of 34.42 GPa, which agreed reasonably well with the experimentally measured value of 37.84 GPa. This result indicates that explicitly included porosity in the micromechanical model improves the prediction of effective stiffness. At the structural level, the 15% infill wing-rib configuration achieved the highest force-to-weight ratio and improved post-peak crushing stability. Numerical simulations reproduced the initial crushing response with good agreement, but progressive damage and failure criteria are required to capture the full crushing process. Although the measured porosity levels are high for certified aerospace structural applications, the study demonstrates how such process-induced defects can be quantified by CT and incorporated into RVE-based material-property prediction.
Overall, the results show that reducing porosity and optimizing internal reinforcement architecture are both essential for improving the structural efficiency of additively manufactured continuous fibre composite UAV components. Future work should focus on progressive damage modelling, improved fibre impregnation strategies, and extension of the framework to dynamic and impact loading conditions.

Author Contributions

Conceptualization, I.S. and D.I.; Methodology, D.I. and F.U.; Software, D.I.; Validation, F.U. and L.B.; Investigation, F.U. and L.B.; Resources, I.S.; Data curation, F.U. and L.B.; Writing—original draft, F.U.; Writing—review & editing, I.S. and D.I.; Supervision, I.S.; Project administration, I.S.; Funding acquisition, I.S. All authors have read and agreed to the published version of the manuscript.

Funding

The research is fully funded by the Croatian Science Foundation (HRZZ) within the project “Development of Numerical Methods in Modelling New Generation of Advanced Composite Structures” (DENNGA), grant number IP-2022-10-8845. Partial financial support for the experimental testing was provided by the COST Action CA21155 Advanced Composites under HIgh STRAin raTEs loading: a route to certification-by-analysis (HISTRATE).

Data Availability Statement

The data presented in this study are available on request from the corresponding author.

Acknowledgments

The authors would like to thank Marek Danczak from TU Dresden for the help in obtaining the CT scans for the specimens and postprocessing the results. The authors also gratefully acknowledge Zvonimir Tomičević from the Faculty of Mechanical Engineering and Naval Architecture, University of Zagreb, for his contributions to the planning, execution, and analysis of the aerofoil testing results.

Conflicts of Interest

The authors declare no conflicts of interest. The funders had no role in the design of the study; in the collection, analyses, or interpretation of data; in the writing of the manuscript; or in the decision to publish the results.

Abbreviations

The following abbreviations are used in this manuscript:
b [mm]specimen width
E 1 [GPa]Young’s modulus in direction 1
E 2 [GPa]Young’s modulus in direction 2
E f [MPa]Flexural modulus
F B [N]Force at break
F M [N]Maximum force
h [mm]Specimen thickness
S l [MPa]Longitudinal shear strength
S t [MPa]Transverse shear strength
ϵ f B [%]Strain at break
ϵ f M [%]Strain at maximum flexural stress
ν 12 [-]Poisson’s ration
ν 23 [-]Poisson’s radio
σ f B [MPa]Flexural stress at break
σ f M   [MPa]Maximum flexural stress

References

  1. Tian, X.; Liu, T.; Yang, C.; Wang, Q.; Li, D. Interface and performance of 3D printed continuous carbon fiber reinforced PLA composites. Compos. Part A Appl. Sci. Manuf. 2016, 88, 198–205. [Google Scholar] [CrossRef]
  2. Yang, C.; Tian, X.; Liu, T.; Cao, Y.; Li, D. 3D printing for continuous fiber reinforced thermoplastic composites: Mechanism and performance. Rapid Prototyp. J. 2017, 23, 209–215. [Google Scholar] [CrossRef]
  3. Oztan, C.; Karkkainen, R.; Fittipaldi, M.; Nygren, G.; Roberson, L.; Lane, M.; Celik, E. Microstructure and mechanical properties of three dimensional-printed continuous fiber composites. J. Compos. Mater. 2019, 53, 271–280. [Google Scholar]
  4. Iragi, M.; Pascual-González, C.; Esnaola, A.; Lopes, C.S.; Aretxabaleta, L. Ply and interlaminar behaviours of 3D printed continuous carbon fibre-reinforced thermoplastic laminates; effects of processing conditions and microstructure. Addit. Manuf. 2019, 30, 100884. [Google Scholar] [CrossRef]
  5. Wong, J.; Altassan, A.; Rosen, D. Additive manufacturing of fiber-reinforced polymer composites: A technical review and status of design methodologies. Compos. Part B Eng. 2023, 257, 110676. [Google Scholar]
  6. Kuncius, T.; Rimašauskas, M.; Rimašauskienė, R. Interlayer adhesion analysis of 3D-printed continuous carbon fibre-reinforced composites. Polymers 2021, 13, 1653. [Google Scholar] [CrossRef] [PubMed]
  7. Pascual-González, C.; Iragi, M.; Fernández, A.; Aretxabaleta, L.; Lopes, C.S. An approach to analyse the factors behind the micromechanical response of 3D-printed composites. Compos. Part B Eng. 2020, 186, 107820. [Google Scholar] [CrossRef]
  8. Polyzos, E.; Van Hemelrijck, D.; Pyl, L. A multi-scale analytical methodology for the prediction of mechanical properties of 3D-printed materials with continuous fibres. Addit. Manuf. 2020, 36, 101394. [Google Scholar] [CrossRef]
  9. Polyzos, E.; Van Hemelrijck, D.; Pyl, L. Modeling elastic properties of 3D printed composites using real fibers. Int. J. Mech. Sci. 2022, 232, 107581. [Google Scholar] [CrossRef]
  10. Somireddy, M.; Czekanski, A. Computational modeling of constitutive behaviour of 3D printed composite structures. J. Mater. Res. Technol. 2021, 11, 1710–1718. [Google Scholar] [CrossRef]
  11. ISO 527-2:2025; Plastics—Determination of Tensile Properties Part 2: Test Conditions for Moulding and Extrusion Plastics. International Organization for Standardization: Geneva, Switzerland, 2025.
  12. ISO 14125:1998; Fibre-Reinforced Plastic Composites—Determination of Flexural Properties. International Organization for Standardization: Geneva, Switzerland, 1998.
  13. Hanhan, I.; Sangid, M.D. Design of low cost carbon fiber composites via examining the micromechanical stress distributions in A42 bean-shaped versus T650 circular fibers. J. Compos. Sci. 2021, 5, 294. [Google Scholar] [CrossRef]
  14. Wang, H.; Zhong, X.-Y.; Jia, H.; Zhang, L.-W.; Liu, H.-S.; Sun, M.-C.; Liu, T.-W.; Bao, J.-W.; Bai, J.-B.; Ge, S.-C. Study on the transverse properties of T800-grade unidirectional carbon fiber-reinforced polymers. Materials 2025, 18, 816. [Google Scholar] [CrossRef] [PubMed]
  15. Pathan, M.V.; Tagarielli, V.L.; Patsias, S. Numerical predictions of the anisotropic viscoelastic response of uni-directional fibre composites. Compos. Part A Appl. Sci. Manuf. 2017, 93, 18–32. [Google Scholar] [CrossRef]
  16. Barbero, E.J. Finite Element Analysis of Composite Materials Using Abaqus; CRC Press: Boca Raton, FL, USA, 2013. [Google Scholar]
Figure 1. Dimensions of the tensile coupons in accordance with ISO 527 (tensile test) standard (left), and nominal dimensions (right) of the specimen for length (l), width (b) and thickness (h) in mm in accordance with DIN EN ISO 14125 standard are 80, 10 and 3 mm respectively, with “1” marking the direction of the impact.
Applsci 16 06510 g001
Figure 2. Shimadzu® AGS-X2 50 kN universal testing machine and tensile test setup (left), and ZwickRoell® Z2.5 universal testing machine and three-point bending test setup (right).
Applsci 16 06510 g002
Figure 3. Waterjet cutting of additively manufactured continuous carbon fibre specimen for unidirectional testing in accordance with ISO 527 standard.
Applsci 16 06510 g003
Figure 4. Specimens for CT testing.
Applsci 16 06510 g004
Figure 5. Close-up of the specimen (left) and close-up cross section (right) of the continuous fibre AM composite microstructure. (a) Fibre bundle, (b) matrix material, (c) voids.
Applsci 16 06510 g005
Figure 6. RVE geometry (left) used for FEM homogenization, with fibres depicted as dark grey elements and matrix depicted with light grey. Reference microstructure used for RVE modelling (right) adapted to contain the 10% void content. (a) Fibre bundle, (b) matrix material, (c) voids.
Applsci 16 06510 g006
Figure 7. Dimensions of the RVE used for the defining boundary condition based on [16].
Applsci 16 06510 g007
Figure 8. Stress results (in GPA) of the imposed deformation on the RVE for FEM homogenisation approach; initial RVE (upper left), and deformations in direction 1 (upper right), direction 2 (lower left), and direction 3 (lower right).
Applsci 16 06510 g008
Figure 9. Dimensions (in mm) of the manufactured composite wing ribs.
Applsci 16 06510 g009
Figure 10. Test setup for the crushing test of AM composite wing ribs.
Applsci 16 06510 g010
Figure 11. Model of the test setup and boundary conditions imposed on the analytical plates.
Applsci 16 06510 g011
Figure 12. Mesh geometries representing 7% (up), 10% (middle), and 15% (down) infill aerofoil geometries.
Applsci 16 06510 g012
Figure 13. Stress–strain curve for unidirectional specimen tensile testing results.
Applsci 16 06510 g013
Figure 14. Stress–strain curves for the quasi-static three-point bending test for unidirectional specimens.
Applsci 16 06510 g014
Figure 15. Void fraction for specimens manufactured using different printing parameters at different positions.
Applsci 16 06510 g015
Figure 16. CT scans of specimens manufactured using different printing parameters. Blue line marks the position of the scan along the specimen.
Applsci 16 06510 g016
Figure 17. Different wing-rib infill configurations of 7% (upper), 10% (middle), and 15% (lower). Infill configurations depicted in slicer program, with each line representing one composite fibre printing path (left) and manufactured (right).
Applsci 16 06510 g017
Figure 18. Load–stroke diagram for different infill parameter aerofoils.
Applsci 16 06510 g018
Figure 19. Aerofoil shapes deformed by 10 mm after in the crushing test.
Applsci 16 06510 g019
Figure 20. Comparison of the numerical and experimental results for the initial part of the crushing test for three different aerofoil models.
Applsci 16 06510 g020
Figure 21. Comparison of numerical and experimental specimen morphology after the crushing test.
Applsci 16 06510 g021
Table 1. Printing parameters used for evaluating void volume fraction.
Specimen IDNozzle Temperature [°C]Printing Speed [mm/s]Extrusion Width [mm]
126080.6
226580.65
326560.65
426540.6
527030.6
Table 2. Mechanical properties provided by manufacturer Anisoprint® of constituents used for RVE modelling.
Young’s Modulus [GPa]Poisson’s Ratio [-]
Carbon fibre bundle1500.27
Polyamide matrix1.440.18
Table 3. Material properties for numerical modelling.
RVE
E 1 [GPa]33.62
E 2 [GPa]1.89
ν 12 [-]0.32
ν 23 [-]0.43
G 12 [GPa]0.72
Table 4. Results of the quasi-static three-point bending testing of unidirectional specimen.
E f [MPa] F M [N] σ f M [MPa] ϵ f M [%] σ f B [MPa] F B [N] ϵ f B [%]h [mm]b [mm]
Spec. 124,6002641821.30---10.40737.989
Spec. 228,4002651871.301401994.7810.36537.459
Spec. 325,4002641800.921351985.5310.27037.977
Spec. 426,6002521891.451411894.909.67535.184
Spec. 526,8002641810.931361985.2210.37838.062
Avg.26,4002621841.181381965.113.65310.219
Table 5. Void volume fractions for specimens manufactured using different printing parameters.
Specimen IDPorosity at Position 1Porosity at Position 2Porosity at Position 3Porosity at Position 4Porosity at Position 5Average
Porosity
19.8%11.9%13.4%10.9%8.6%10.92%
27.2%9.1%11.3%12.6%10.1%10.06%
314.2%13.1%15.4%13.9%12.9%13.9%
411.8%12.9%14.1%13.7%12.2%12.94%
515.7%14.8%16.1%14.4%13.8%14.96%
Table 6. Aerofoil configuration masses.
Infill Configuration7% Infill10% Infill15% Infill
Mass [g]15.518.321.7
Table 7. Force-to-weight ratio for each aerofoil configuration.
Infill Configuration7% Infill10% Infill15% Infill
Force-to-weight ratio [N/g]71.03871.61379.256
Disclaimer/Publisher’s Note: The statements, opinions and data contained in all publications are solely those of the individual author(s) and contributor(s) and not of MDPI and/or the editor(s). MDPI and/or the editor(s) disclaim responsibility for any injury to people or property resulting from any ideas, methods, instructions or products referred to in the content.