


Featured Application
Surface electromyography assessment during posterior chain exercises such as the single knee straight bridge may provide medical staff and strength, fitness and rehabilitation coaches with additional information regarding hamstring neuromuscular function throughout rehabilitation and return to sport progression in professional football players, even when conventional jump performance variables appear unchanged.
Abstract
Limited evidence exists regarding longitudinal changes in neuromuscular function throughout a competitive season and following time-loss injuries in professional football. The aim of this study was to explore the longitudinal alterations related to time-loss injuries on surface electromyography (SEMG) and vertical jump performance in professional football players. Fourteen U-23 male professional football players were assessed at two time points during the 2019–2020 competitive season. SEMG activity of the rectus femoris, vastus medialis, vastus lateralis, biceps femoris, and semitendinosus was evaluated during the bulgarian squat (BS) and single knee straight bridge (SKSB) exercises. Vertical jump performance was assessed using squat jump (SJ) and countermovement jump (CMJ) tests performed on force platforms. Participants were classified as players experiencing time-loss injuries (IPs; n = 6) or players who remained continuously available (NIPs; n = 8) according to the occurrence of a time-loss injury (>8 days). Repeated-measures ANOVA was used to examine the effects of time point, group, limb, and exercise phase. Significant time point × group interactions were observed for CMJ inter-limb asymmetry variables, with IPs demonstrating reduced asymmetry values over time. During the SKSB exercise, biceps femoris activation was significantly lower in IPs (η2p = 0.38) compared with NIPs. No consistent alterations related to time-loss injuries were identified during the BS exercise. No consistent differences related to time-loss injuries were observed in conventional vertical jump performance measures. These observations suggest that SEMG assessment during posterior-chain exercises may provide complementary information regarding neuromuscular function in professional football players experiencing time-loss injuries beyond that obtained from conventional vertical jump assessments. Nevertheless, these observations should be interpreted with caution given the small sample size, the heterogeneous injury profile, and the exploratory nature of the present investigation.
1. Introduction
Male football players are exposed to a substantial risk of injury, with the lower limbs being the most frequently affected anatomical region, particularly involving muscles and tendons [1]. The thigh, especially the hamstring muscle groups, represents the most commonly affected area [2,3]. Injury severity is classified according to the time required for return to full team participation [4]. In addition to hamstring injuries, groin adductor pain (8.8%), lateral ankle ligament injuries (6.3%), and structural quadriceps injuries (4.6%) represent some of the most prevalent injury types. When stratified by severity, moderate injuries (8–28 days) account for the greatest proportion of time loss in professional football [5]. A greater injury burden during the season has been associated with poorer team performance [6].
Several injury risk factors in football have been identified in the literature. These include a history of previous injury [7,8,9], inter-limb strength imbalances [10,11], and altered neuromuscular recruitment patterns within the posterior chain musculature [12]. Additionally, higher squat jump (SJ) performance, typically associated with greater levels of neuromuscular power, has also been linked to an increased risk of injury [13].
Researchers have described some effects of injuries once players have returned to full participation as a decreased activation of the biceps femoris (BF) during an eccentric contraction in an isokinetic test following hamstring strain injury [14,15]. The same results were found by Sole et al. (2011), who also demonstrated a decrease in medial hamstring activation [16]. Muscle strength is also reduced after a hamstring injury, affecting the hamstrings and quadriceps of the injured limb. Evidence suggests that isokinetic strength deficits persist after return to sport (RTS), although their clinical relevance remains unclear [17].
Several studies have attempted to identify injury risk factors in football through pre-season strength assessments, although their effectiveness remains inconclusive [18,19]. This weak association could be produced for many reasons, such as the difficulty of distinguishing between a low, moderate or high injury risk when a single test is used [20], which may limit the ability to individualize appropriate training programs for each player. Secondly, it should be noted that performance capacities change considerably throughout the season [21,22,23,24].
Despite extensive research and the efforts of medical and coaching staff, lower-limb muscle injuries continue to represent a significant challenge in professional football [25]. Considering that impairments in neural function may contribute to reduced neuromuscular performance, increasing attention has been directed towards the need to address injuries such as hamstring strains without overlooking the potential contribution of the nervous system [26]. Building on this biomechanical perspective, subsequent research has indicated that a reductionist approach focused primarily on assessing muscle groups without considering the specific function and contribution of individual muscles may be insufficient to fully explain injury mechanisms [27,28].
Distinct muscle activation patterns have been described for exercises commonly used during the RTS process [27,28,29], as well as for football-specific tasks such as kicking [30] and sprinting [31]. However, a lack of information has been found about the longitudinal changes of the muscular activation in relevant muscles, such as hamstring or quadriceps muscles during a competitive season. Given the persistent incidence of injuries in professional football, further research is needed to better understand how time-loss injuries may influence performance-related variables, particularly during the final stages of the RTS process, when the progressive restoration of running exposure, high-speed running, and sprinting is considered a key component of rehabilitation [32].
A limited number of training sessions between RTS and the first competitive match has been identified as a significant risk factor for injury [33]. This may indicate that injury risk factors associated with muscle activation patterns could be altered after the player has returned to competition. Despite this, a lack of studies analyzing the influence of neuromuscular activation patterns throughout an entire competitive season has been reported.
In recent years, jump assessment using force platforms to evaluate neuromuscular performance parameters, notably through the use of countermovement jump (CMJ) and SJ, has gained increasing prominence due to its efficiency, practicality, and the minimal physical demands imposed on players across different testing protocols. Metrics such as jump height (JH), peak power (PP), and inter-limb asymmetries have been described and shown to be useful for both the analysis of athletic performance and the assessment of injury risk factors, including during reconditioning programs [34]. However, the influence of jump performance on injury risk over the competitive season remains limited.
Therefore, the aim of this study was to explore longitudinal alterations related to time-loss injuries on surface electromyography (SEMG) activity and vertical jump performance across a competitive season in professional football players. It was hypothesized that players experiencing time-loss injuries (IPs) during the competitive season might exhibit different longitudinal neuromuscular responses compared with players who remained continuously available (NIPs), although the exploratory nature of the study warrants cautious interpretation of these observations.
The present grouping strategy was not intended to define a physiologically homogeneous injury-specific population, characterize detraining responses, or investigate adaptations associated with a particular injury entity or duration of restricted participation. In the present study, the term time-loss injury was exclusively adopted according to its epidemiological definition to identify players who experienced medically documented interruptions from unrestricted football participation during the competitive season. Consequently, comparisons between groups should be interpreted as exploratory descriptions of longitudinal neuromuscular trajectories rather than as evidence of injury-specific, duration-specific, or detraining-related adaptations.
2. Materials and Methods
A longitudinal study was conducted to determine whether muscle activation during the bulgarian squat (BS) and single knee straight bridge (SKSB) exercises, as well as vertical jump performance during SJ and CMJ, differed between professional football players with and without a recent occurrence of time-loss injury during the 2019–2020 season.
2.1. Participants
Fourteen professional football players (age: 20.4 ± 1.6 years; height, 178.7 ± 5.5 cm; body mass 72.3 ± 6.2 kg) belonging to a Spanish third division team (U-23 squad of a “LaLiga” club) were recruited to participate in this study. All participants followed a standard training schedule consisting of five training sessions per week and one official match, in accordance with the regulations of the “Real Federación Española de Fútbol”. Written informed consent was obtained from all participants prior to testing, in accordance with the Declaration of Helsinki. The study protocol was approved on 06 April 2016 by the Ethics Committee of the Universidad Politécnica de Madrid (UPM). Inclusion criteria required participants to be registered members of the team during the study period. Exclusion criteria included a history of lower limb surgery within the previous six months or lack of medical clearance at the time of testing.
2.2. Measuring Devices
Muscle electrical activity was registered using a TrignoTM electromyography system (Delsys Inc., Boston, MA, USA) with wireless sensors sampled at 1024 Hz. The sensors included an integrated accelerometer, which was used to identify the different phases of each exercise. Ground reaction forces were recorded using two force platforms (Kistler®, model 9281E, Kistler Group, Winterthur, Switzerland) at a sampling frequency of 1000 Hz.
2.3. Procedures
The research was conducted over a 17-week period. Participants completed all tests at two time points during the competitive season, separated by a minimum of 13 weeks. The first testing session took place during the fourth week of October and the second during the last week of January. If a player was injured at the time of testing, the assessment was postponed until completion of the rehabilitation process and performed on the day before receiving full RTS clearance from the medical staff. Rehabilitation programs were individually prescribed and supervised by the club medical staff according to the nature and severity of each injury. Consequently, all measurements obtained from injured players reflected the final stage of rehabilitation immediately prior to unrestricted participation in team training and competition.
Injury incidence was recorded prospectively by the club physiotherapist in accordance with the FIFA consensus statement on injury definitions and data collection procedures [4]. Only injuries resulting in more than 8 days of time loss were included in the analysis.
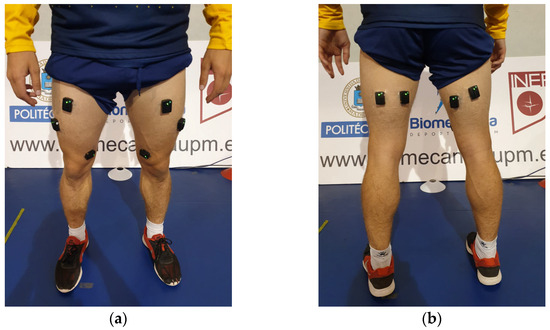
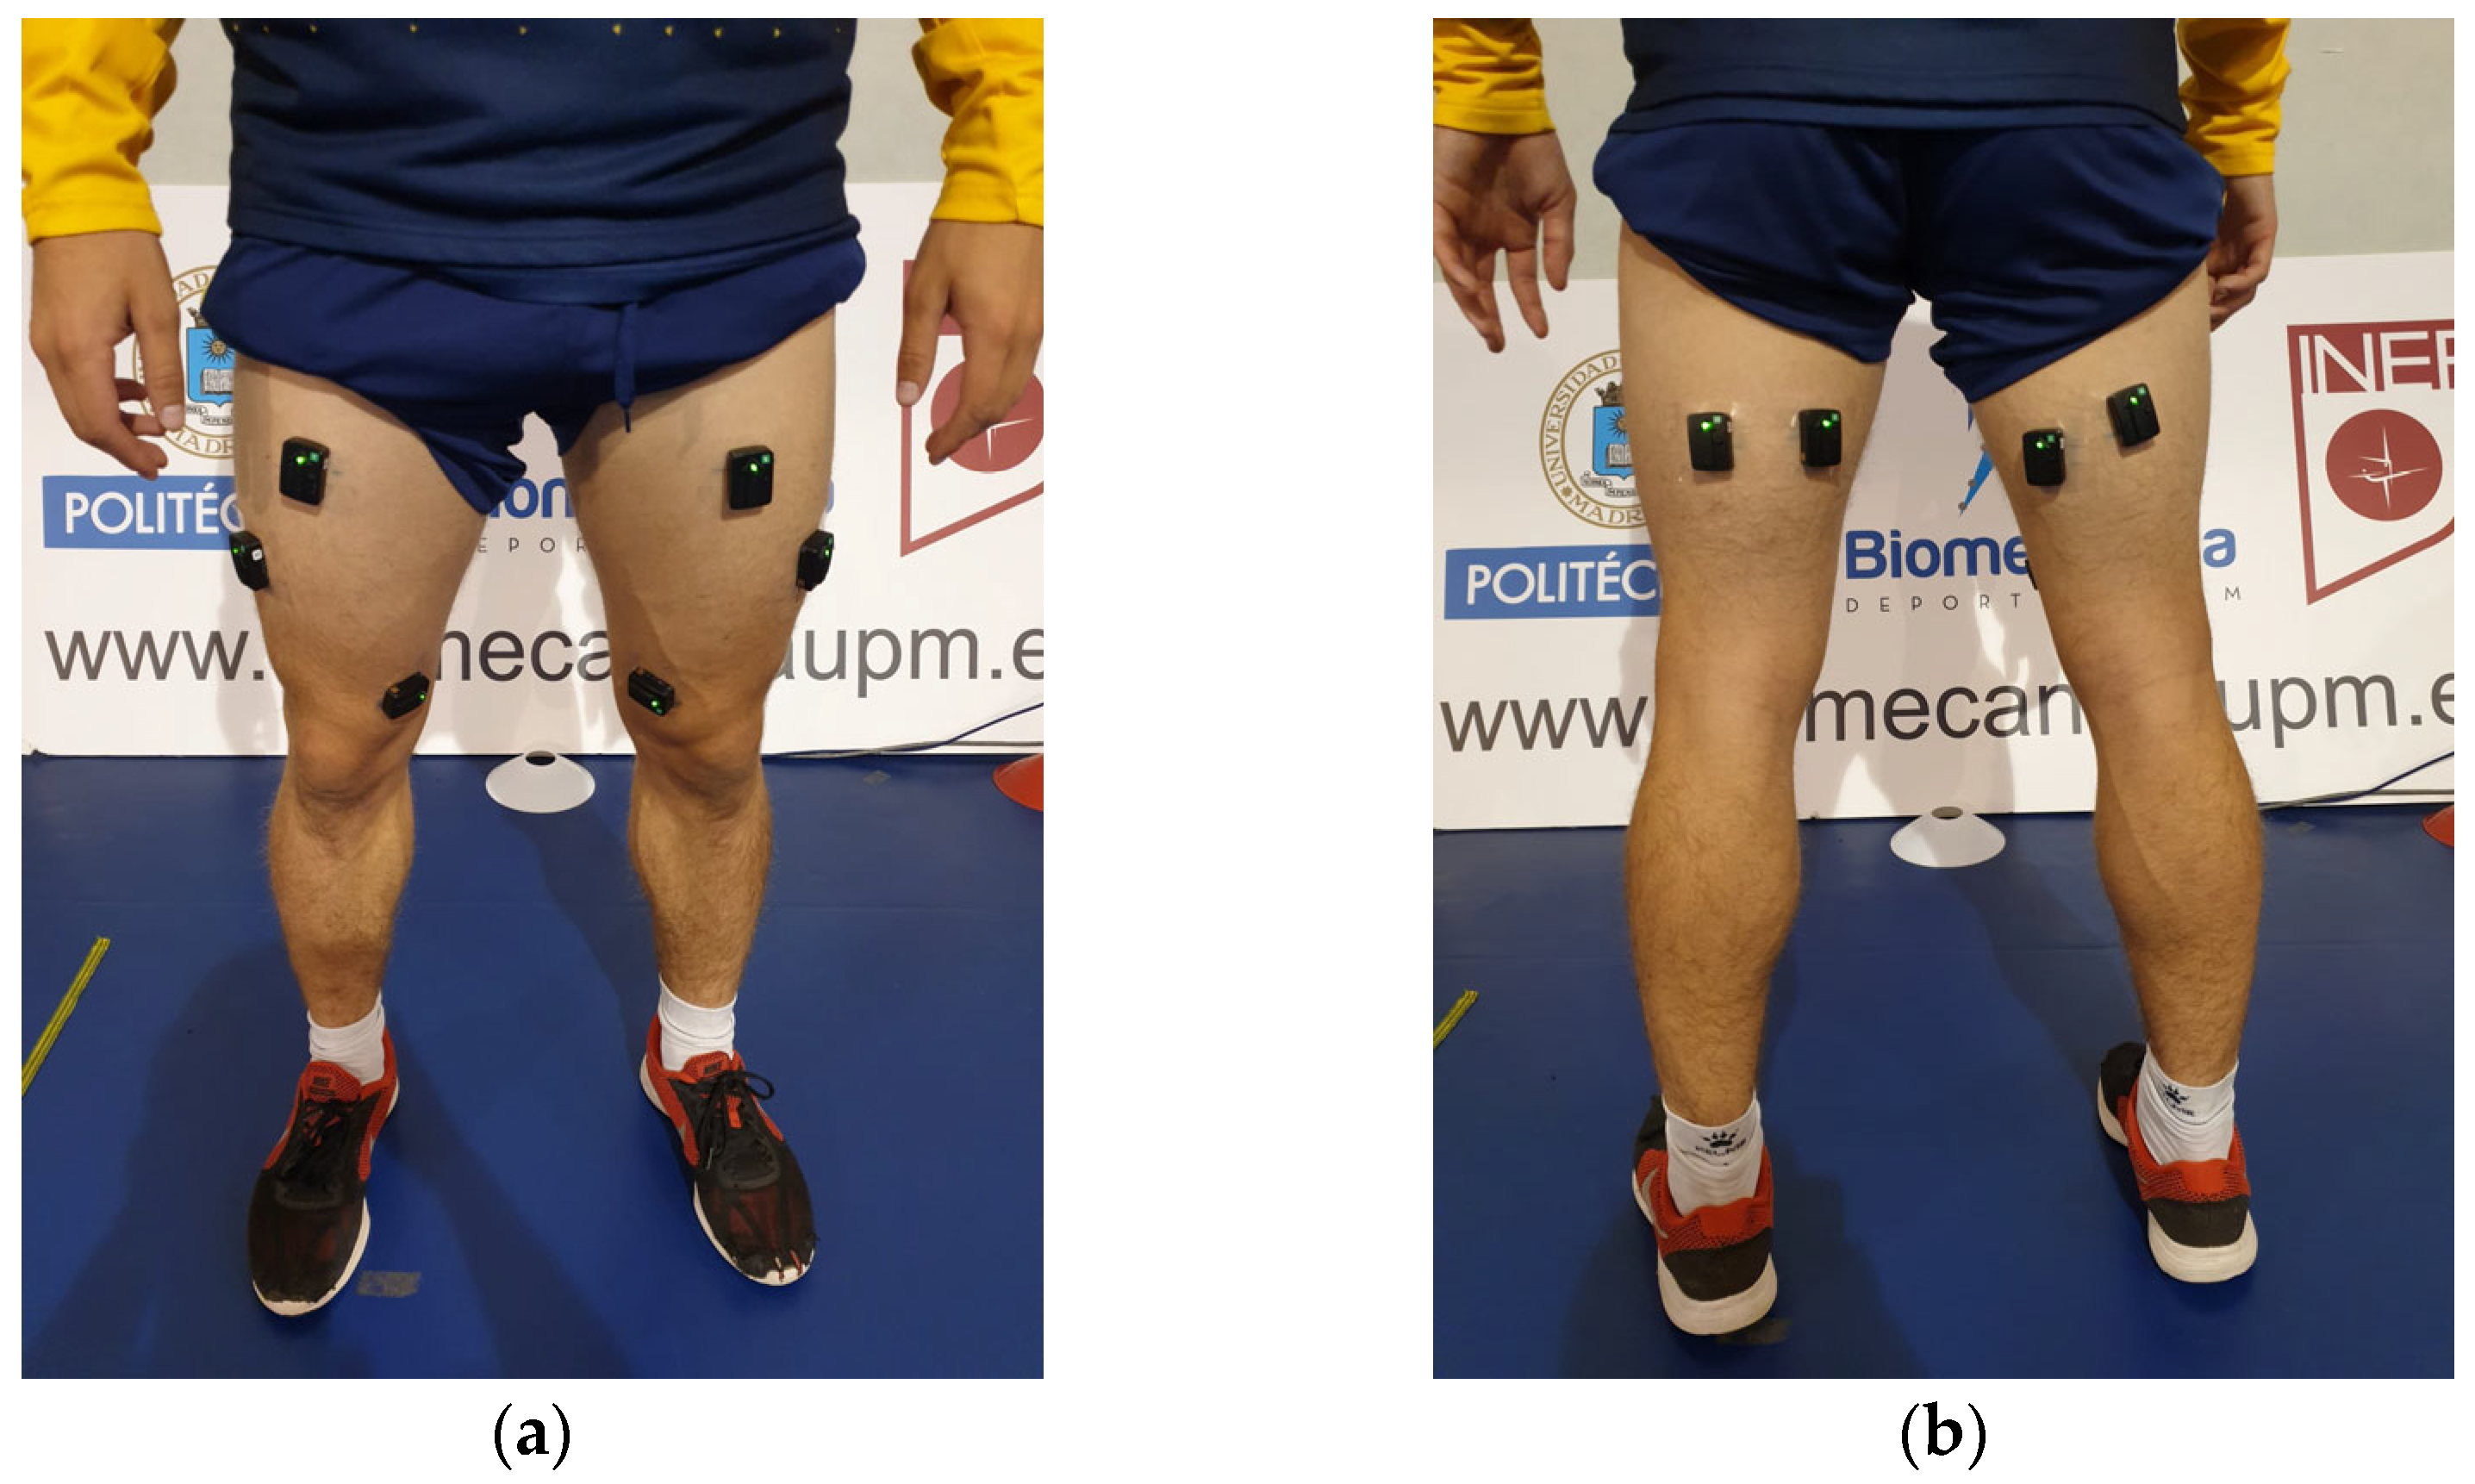
All testing sessions were conducted in the Sports Biomechanics Laboratory at the Faculty of Sports Sciences, Universidad Politécnica de Madrid. To minimize fatigue and circadian variability, tests were performed 72–96 h after the last match, between 16:00 and 20:00 h. Participants were instructed to refrain from caffeine intake prior to testing. Participants completed two familiarization sessions during the week preceding data collection under the supervision of a strength and conditioning coach. Before testing, body weight was recorded using force plates, and electrode placement sites were marked by the same experienced physiotherapist according to SENIAM guidelines for the following muscles: rectus femoris (RF), vastus medialis (VM), vastus lateralis (VL), BF, and semitendinosus (ST) of both lower limbs [35]. A standardized 10 min warm-up was subsequently performed, including bodyweight strength exercises, mobility drills, and dynamic movements, concluding with five SJ and CMJ trials. After warm-up, the skin was shaved and cleaned with alcohol before electrode placement (Figure 1).
Figure 1.
Surface electromyography electrode placement according to SENIAM guidelines: (a) rectus femoris, vastus medialis and vastus lateralis; (b) biceps femoris and semitendinosus.
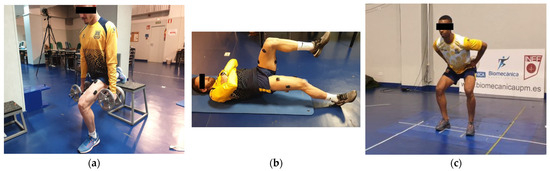
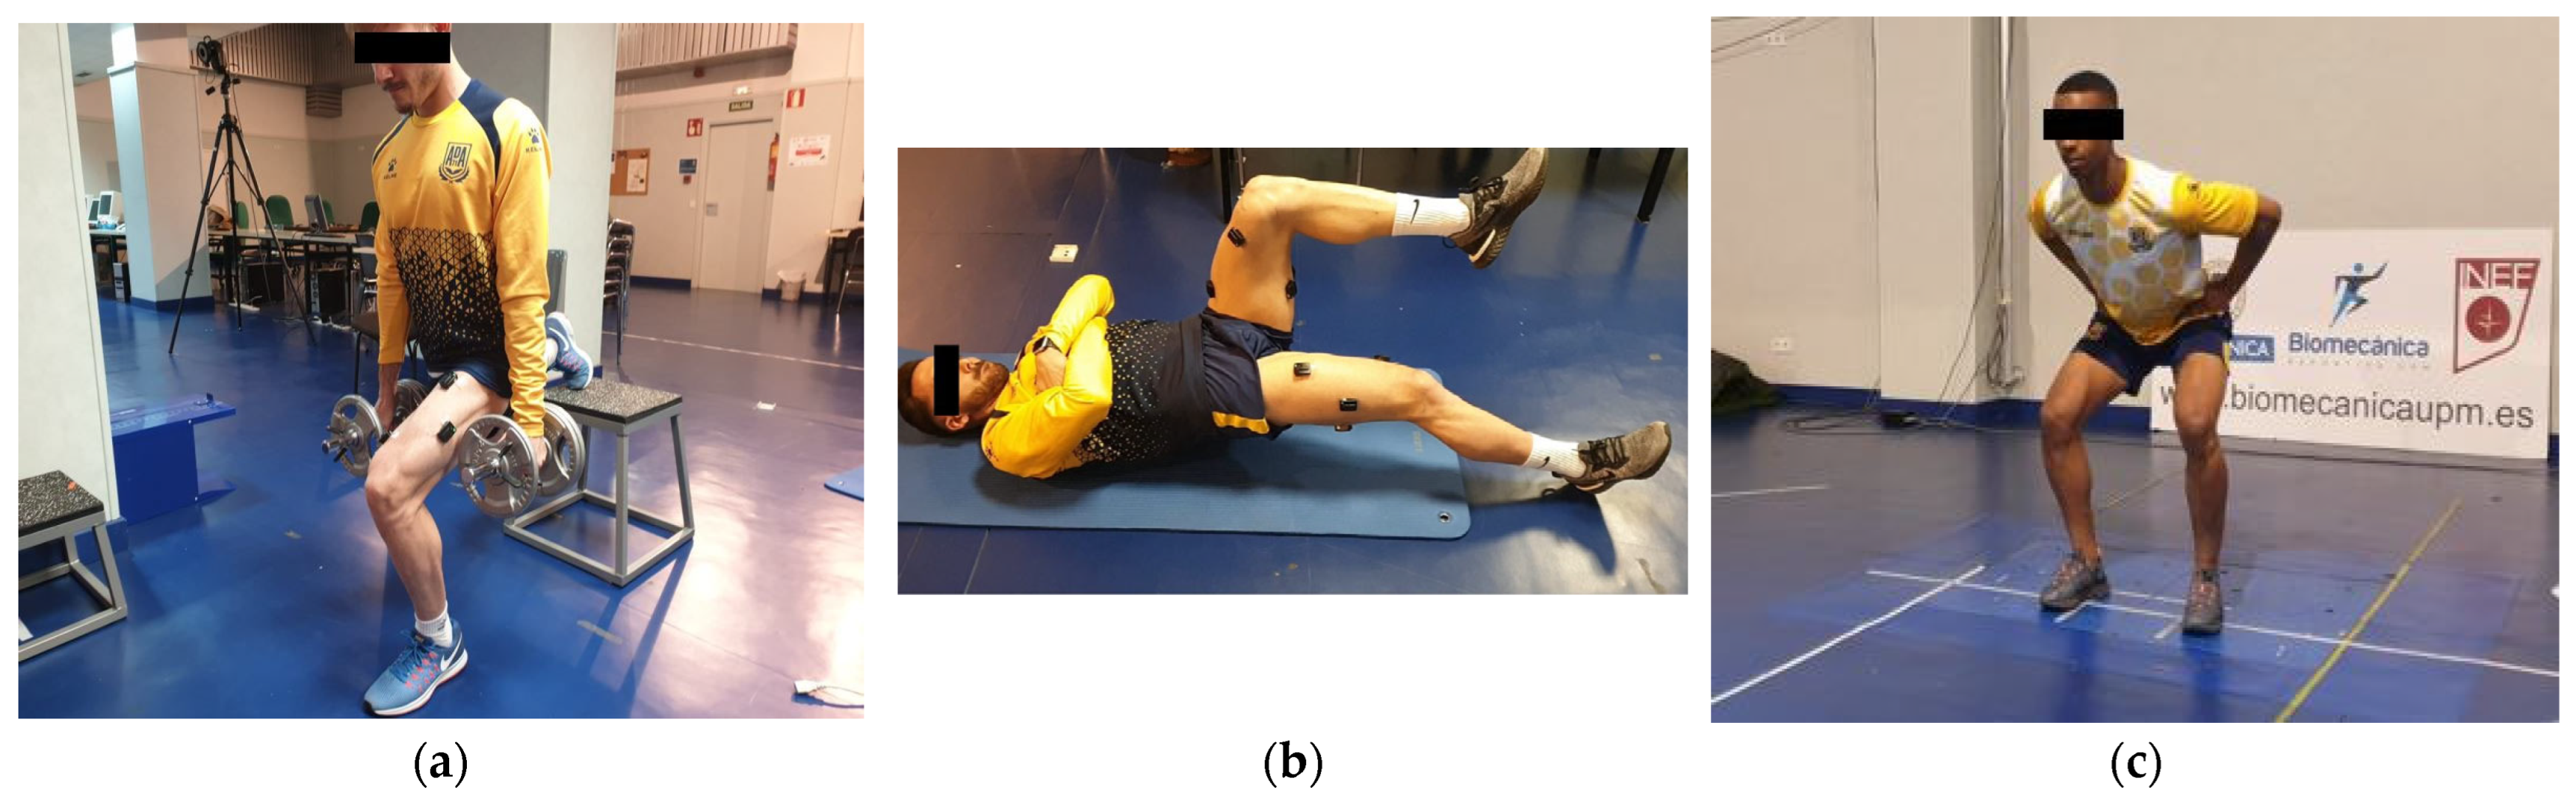
Data collection was then initiated, starting with SEMG data followed by ground reaction force recording. Testing was conducted in the following order with a two-minute rest interval between tasks: BS, SKSB, SJ, and CMJ (Figure 2).
Figure 2.
Technical procedures related to the testing process: (a) Bulgarian squat; (b) Final single Knee straight bridge position; (c) Initial squat jump position.
2.3.1. Bulgarian Squat
Participants performed one set of three repetitions per lower limb with an external load equivalent to 30% of their body mass, using two dumbbells (one in each hand). The exercise was executed by performing hip and knee flexion until the thigh of the front leg was parallel to the ground, while the rear foot was placed on a 50 cm elevated platform.
Participants were instructed to maintain an upright trunk throughout the movement to avoid alterations in muscle activation. Each repetition consisted of a 3 s eccentric phase followed by a 3 s isometric phase and a concentric phase performed at maximal intended velocity, ensuring continuous contact of the front foot with the ground. A 3 s rest interval was allowed between repetitions. During the concentric phase, participants received standardized verbal encouragement (“up fast”) from the researchers.
2.3.2. Single Knee Straight Bridge
Participants performed three repetitions per lower limb. The starting position was supine, with arms crossed over the chest. The working limb was positioned with the heel in contact with the ground and a 20° knee flexion, while the contralateral limb was maintained with a 90° hip and knee flexion. Each repetition consisted of a concentric phase performed at maximal velocity without losing heel contact, followed by a 3 s isometric phase and a controlled eccentric return to the starting position. A 3 s rest interval was provided between repetitions and 1 min between limbs. Standardized verbal encouragement (“up fast”) was given during the concentric phase.
2.3.3. Squat Jump
Participants performed three valid repetitions with their hands placed on their hips throughout the movement. From an initial standing position, participants descended to a self-selected semi-squat position and held this posture for at least 3 s to eliminate any countermovement. Upon the verbal cue (“whenever you want”), participants performed a maximal vertical jump without any preparatory movement. Jump validity was assessed using Kistler MARS software (Kistler Instrumente AG, Winterthur, Switzerland available online: https://www.kistler.com/ES/es/cp/programa-informatico-de-analisis-del-rendimiento-mars-2875a/P0000210; accessed on 20 June 2026). The exact software version used during data processing could not be retrospectively retrieved. Jump validity was determined by ensuring the absence of any countermovement prior to take-off. If a trial was deemed invalid, participants repeated the attempt up to a maximum of five trials. No participant required more than five attempts. A 1 min rest interval was provided between repetitions.
2.3.4. Countermovement Jump
Participants performed three repetitions with their hands on their hips, starting from an upright standing position. They were instructed to perform a rapid downward movement followed by an immediate maximal vertical jump. Participants initiated the movement following the verbal cue (“whenever you want”). If a participant perceived that a better performance was possible, additional attempts were allowed up to a maximum of five trials. A 1 min rest interval was provided between repetitions.
2.4. Surface Electromyography Data Processing
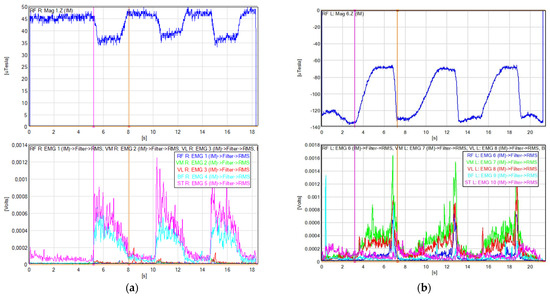
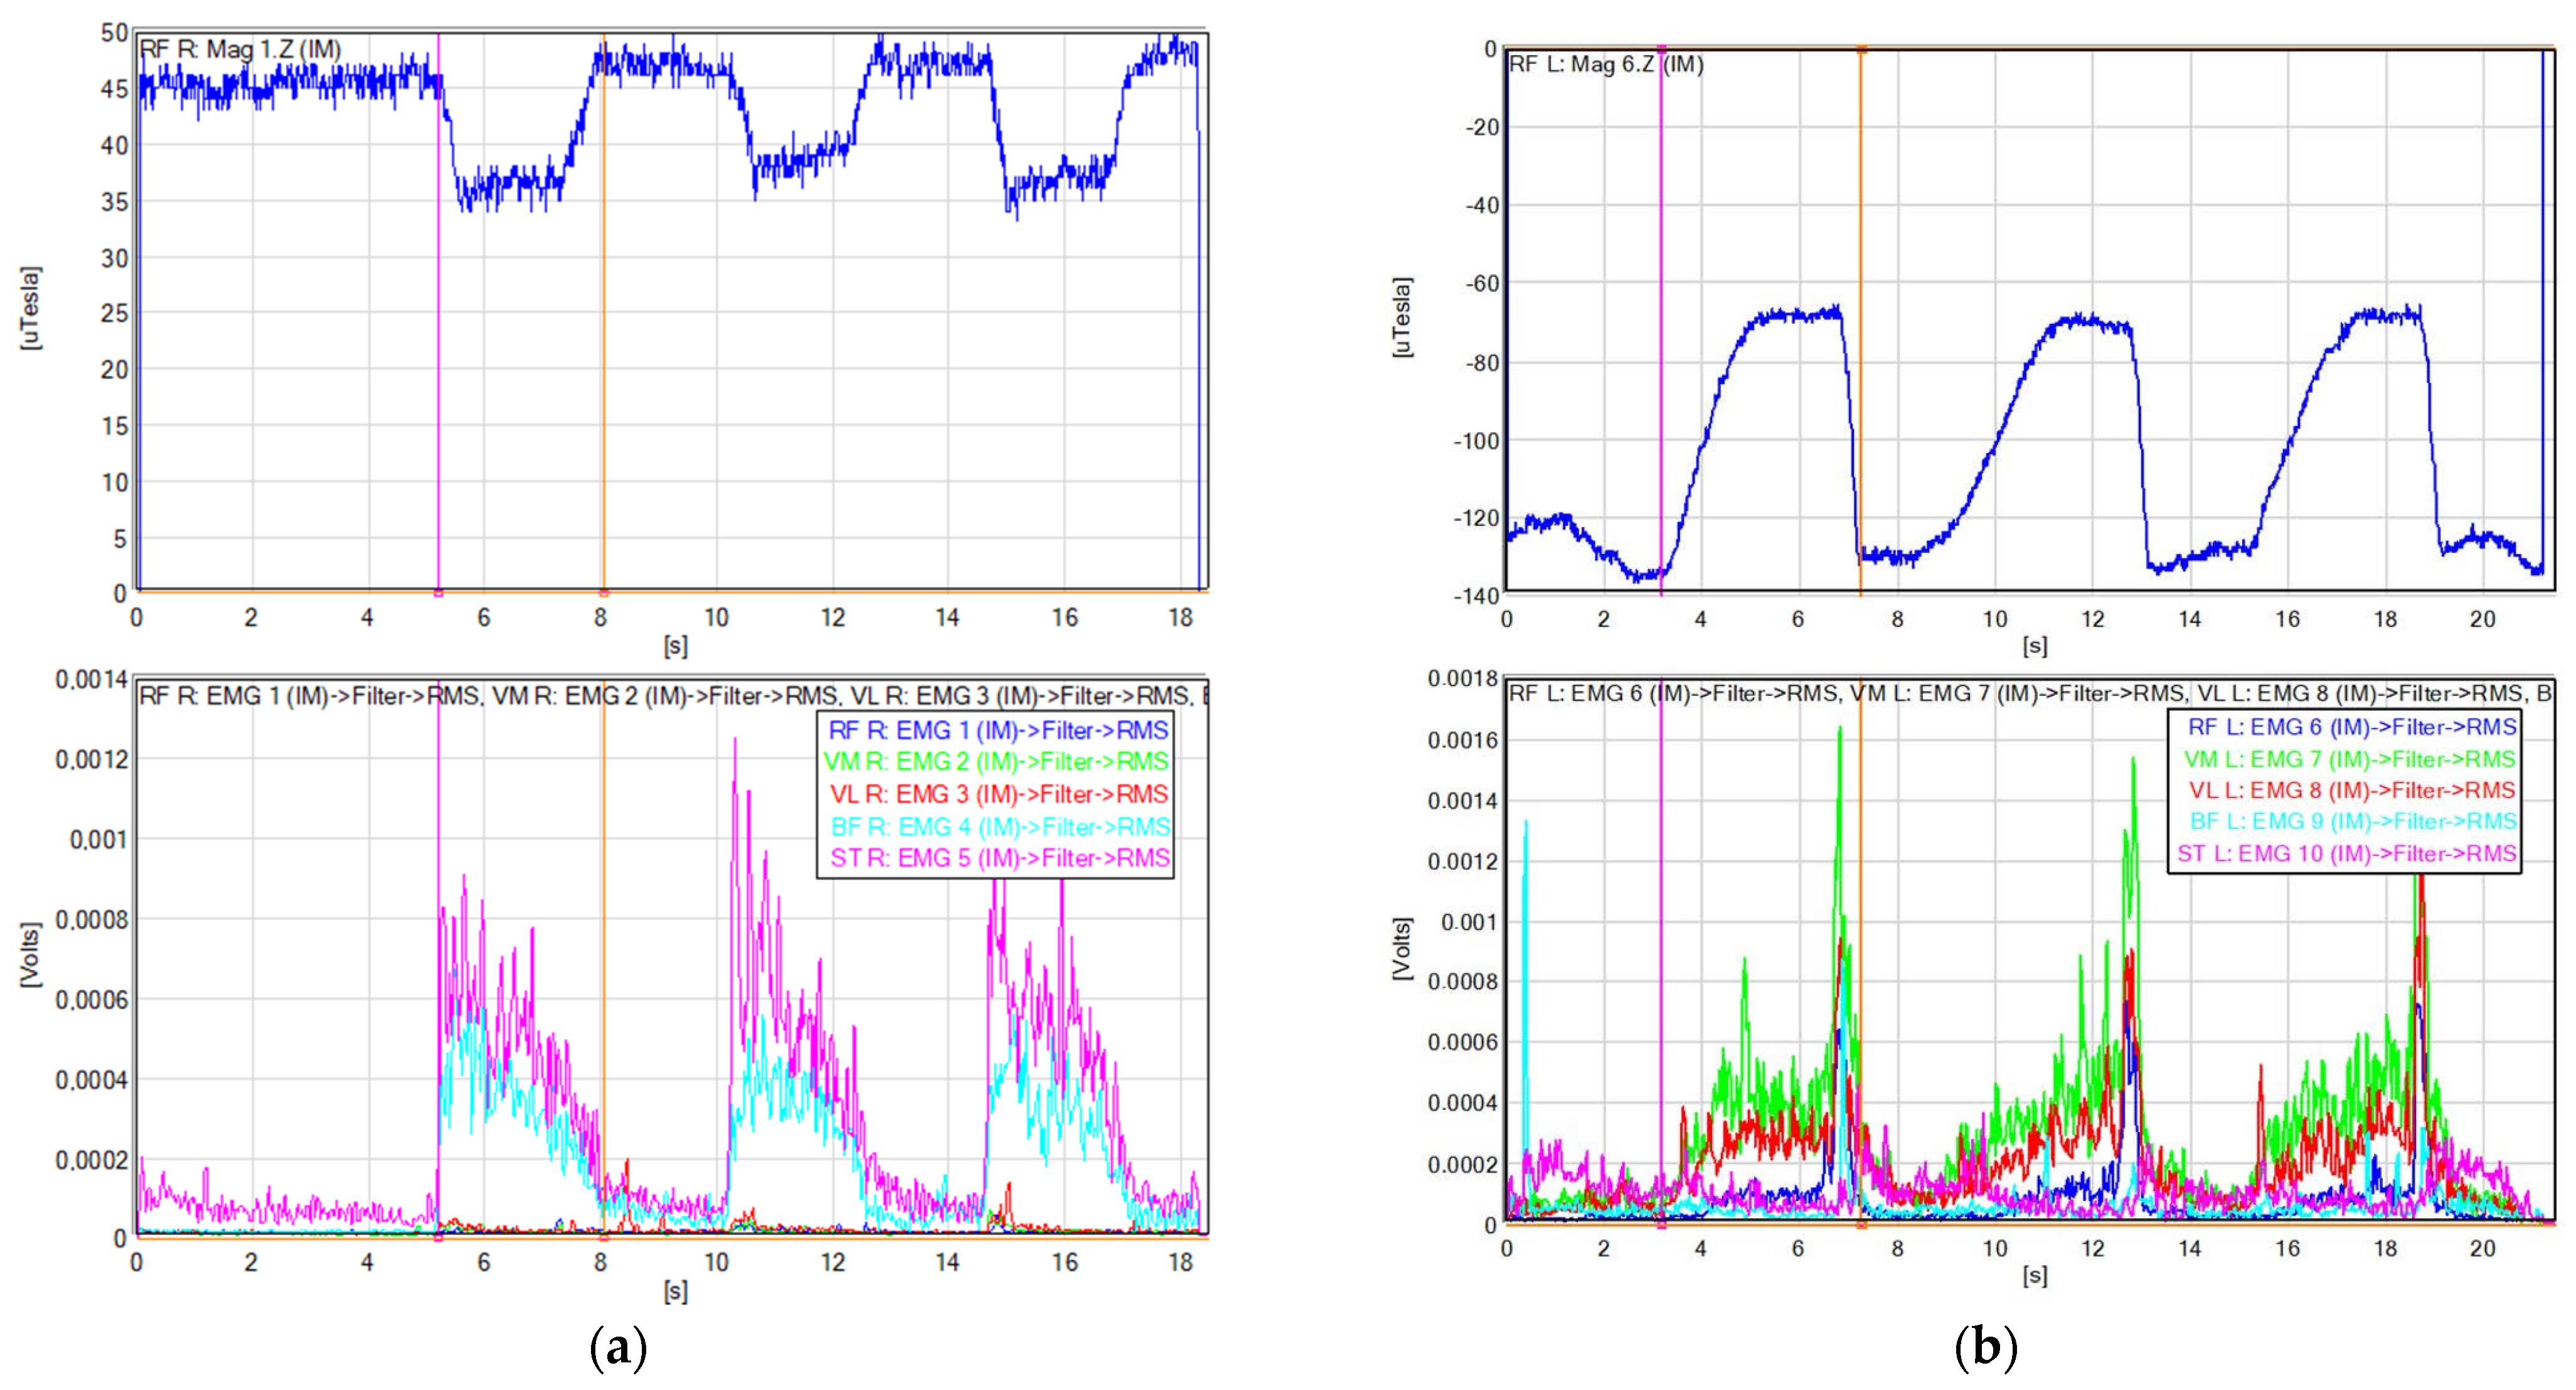
SEMG data were processed using EMGWORKS ANALYSIS® software (version 4.5.1 (Delsys, Inc., Natick, MA, USA). The signal was filtered using a bandpass Butterworth filter with a normalized cut-off frequency of 20 to 300 Hz. Subsequently, the root mean square (RMS) of the filtered signal was calculated using a window length of 0.05 s with an overlap of 0.025 s to reduce signal variability and offset. Median RMS values were obtained from the three phases (concentric, isometric and eccentric) of both exercises (BS and SKSB). These phases were identified based on accelerometer signal changes (Figure 3). The percentage change in RMS between time points was calculated as
((RMSfinal − RMSinitial)/RMSinitial) × 100
Figure 3.
Synchronized electromyographic and accelerometer signals: (a) Single knee straight bridge; (b) Bulgarian squat.
2.5. Ground Reaction Force Data
Ground reaction force variables during vertical jumps were obtained using Kistler MARS software (Kistler Instrumente AG, Winterthur, Switzerland). Variables included JH (m), peak force (PF; N/BW), PP (W/Kg), peak rate of force development (PRFD; N/s), the modified reactive strength index (MRSI), calculated as (jump height/time to take-off) and inter-limb asymmetry in peak force (PFa), and power (PPa) relative to body weight. Inter-limb asymmetry was calculated as (dominant limb/non-dominant limb) × 100. For the SJ, the best valid trial based on JH was selected to represent maximal concentric explosive performance. For the CMJ, the mean of the three highest jumps was used to provide a more stable estimate of neuromuscular performance.
2.6. Statistical Analysis
Data analysis was performed using IBM SPSS 29.0 (IBM Corp., Armonk, NY, USA). Differences between groups over the season were examined. A repeated-measures ANOVA was conducted for CMJ and SJ performance, with season time point as the within-subject factor and group (injured vs. control) as the between-subject factor. The interaction between season time point and group was examined.
SEMG data were analyzed using repeated-measures ANOVA for two exercises: BS and SKSB. The dependent variables were the percentage change in SEMG activity between two seasonal time points.
In both models, limb (dominant vs. non-dominant) and exercise phase (concentric, isometric, and eccentric) were included as within-subject factors, while group (injured vs. control) was included as a between-subject factor. The two-way and three-way interaction (limb × phase × group) was examined.
Homogeneity of variances was assessed using Levene’s test, and normality was evaluated using the Shapiro–Wilk test. Normality assumptions were generally satisfied across the datasets analyzed, supporting the use of parametric procedures. Sphericity was assessed using Mauchly’s test for within-subject factors with more than two levels, and Greenhouse–Geisser corrections were applied when the assumption was violated. When appropriate, post hoc comparisons were performed with Bonferroni adjustment. Effect sizes were reported using partial eta squared (ηp2), interpreted according to conventional thresholds [36]. Statistical significance was set at p < 0.05.
3. Results
3.1. Injuries
Six players sustained medically documented time-loss injuries during the study period. The location, severity, and duration of restricted participation associated with these injuries are presented in Table 1.
Table 1.
Characteristics of injured players.
3.2. Jump Performance
3.2.1. Countermovement Jump
The analyses indicated a significant main effect of time point for PPa (F = 16.72, p = 0.002, ƞ2p = 0.58), corresponding to a 2.23% increase from in-season 1 to in-season 2. A significant time point x group interaction was found for PFa (F = 30.06, p < 0.001, ƞ2p = 0.72) and PPa (F = 19.19, p = 0.002, ƞ2p = 0.57). Post hoc tests revealed for PFa in NIPs a 3.2% worsening (p < 0.001), while IPs improved by 2.86% (p = 0.005); for the PPa, IPs showed a 4.42% improvement (p < 0.001). No other variables showed significant effects (Table 2).
Table 2.
Results of CMJ performance at the two points in the season. NIPs (n = 8) and IPs (n = 6).
3.2.2. Squat Jump
The analysis revealed a significant main effect of time point for PF (F = 6.67, p = 0.024, ƞ2p = 0.36), indicating a 13.8 (N/BW) reduction from in-season 1 to in-season 2. Although the interaction was not significant, exploratory analysis showed a 3.64% worsening of the dominant/non-dominant PPa in NIPs (p = 0.042) (Table 3).
Table 3.
Results of SJ performance at the two points in the season. NIPs (n = 8) and IPs (n = 6).
3.3. Surface Electromyography
3.3.1. Bulgarian Squat
A near-significant main effect of limb was observed for BF (F = 4.61, p = 0.053, ηp2 = 0.28), reflecting a 36% inter-limb divergence (decreased activity in dominant limb and increased in non-dominant). A significant main effect of exercise phase was found for VM (F = 3.50, p = 0.046, ηp2 = 0.23), although post hoc comparisons were not significant.
The limb × group interaction for BF was significant (p = 0.038) showing a 59.4% difference, with decreased activation in the dominant limb (−18.5%) and increased activation in the non-dominant limb (41%). This asymmetry was most pronounced during the eccentric phase, where the inter-limb difference reached 77% (p = 0.025; Table 4).
Table 4.
BS changes in muscle activation throughout the season.
3.3.2. Single Knee Straight Bridge
Due to incomplete signal acquisition in one control participant, analyses for SKSB were conducted with NIPs (n = 7) and IPs (n = 6).
Analyses showed a near-significant main effect of limb for VM (F = 4.77, p = 0.051, ηp2 = 0.30), with a 28.8% inter-limb divergence (dominant decreased, non-dominant increased) and a significant main group effect for BF (F = 6.59, p = 0.026, ηp2 = 0.38), with NIPs showing a 40% change (increased activity) vs. IPs (decreased). This difference was observed in the concentric (p = 0.023), isometric (p = 0.035) and eccentric (p = 0.035) phases. The limb x phase interaction was significant for VL (F = 4.61, p = 0.021, ηp2 = 0.30) and BF (F = 7.71, p = 0.003, ηp2 = 0.41).
Post hoc analyses of the limb and phase interaction revealed a 21.6% difference between eccentric and isometric phases in the dominant limb for VL (p = 0.038) and a 12.4% higher concentric vs. isometric activation in the non-dominant limb for BF (p = 0.034).
The group × limb × phase interaction showed an 85.35% difference between NIPs (+52%) and IPs (−33%) in the non-dominant concentric phase for RF (p = 0.025). Inter-limb differences in IPs during the concentric phase were observed with a 66.8% for VM (p = 0.034; dominant −33% vs. non-dominant +34%). Also in NIPs non-dominant limbs, BF showed phase differences between isometric and both concentric (18.4%; p = 0.021) and eccentric (36.3%; p = 0.043) phases. No other variables showed significant effects (Table 5).
Table 5.
SKSB changes in muscle activation throughout the season.
Additional results regarding phase-specific changes in SEMG activity during the BS and SKSB are provided in Appendix A.
4. Discussion
The objective of this study was to explore longitudinal alterations related to time-loss injuries on SEMG activity and vertical jump performance across a competitive season in professional football players. The main observations were that IPs did not appear to substantially affect overall jump performance; however, it was associated with alterations in neuromuscular recruitment patterns, notably within the hamstring musculature during the SKSB. For this reason, the initial hypothesis was only partially supported.
4.1. Jump Performance
Contrary to our initial hypothesis, most of the jump performance variables were not significantly influenced by time-loss injuries across the competitive season. In the SJ assessment, no significant differences were observed between IPs and NIPs at the second in-season testing point. Nevertheless, a significant reduction in PF was found over time in both groups, suggesting that seasonal variations may influence neuromuscular performance independently of injury status.
Previous longitudinal investigations in professional football have reported contradictory results about the jump test performance throughout the season. For instance, a progressive increase in CMJ JH has been reported from the beginning (0.374 ± 0.04 m) to the end of the competitive season (0.386 ± 0.39 m) in elite football players, potentially reflecting positive adaptations to training exposure and competitive demands [21]. However, sprint-related mechanical capacities may not remain stable throughout the competitive season, as force production capabilities have been shown to decline during the final stages of the season following peak values reached at mid-season, decreasing from 7.40 ± 0.70 N/kg to 7.13 ± 0.58 N/kg [24]. In any case, these findings suggest that seasonal changes in physical performance should be considered when interpreting post injury assessments. Monitoring players exclusively against their own pre-injury baseline may overlook the natural fluctuations that occur throughout the season, potentially leading to an overestimation or underestimation of the specific effects of injury. As a result, periodic evaluation of the entire squad across different stages of the season may provide a more appropriate contextual framework for interpreting neuromuscular and performance-related changes from the reconditioning process to the RTS clearance criteria.
With regard to the CMJ analysis, a relevant finding was detected for PFa, as IPs demonstrated a significant reduction in inter-limb asymmetry between the dominant and non-dominant limbs across the season, reaching absolute asymmetry values of 2.846 ± 2.719% at the second in-season assessment. In contrast, NIPs showed the opposite tendency, with a significant increase in asymmetry throughout the analyzed period (−0.267 ± 2.038% vs. −3.505 ± 2.355%).
Similarly, PPa also showed a reduction in inter-limb asymmetry in IPs, reaching absolute asymmetry values below 1%. Conversely, JH and the remaining CMJ variables did not show significant differences between groups or throughout the season.
It should be noted that group mean symmetry values approaching 100% do not necessarily indicate perfect individual symmetry. Rather, they may reflect the mathematical offsetting of dominant- and non-dominant-sided asymmetries when averaged across participants. Although IPs appeared to demonstrate lower inter-limb asymmetry values compared with NIPs, these findings should be interpreted cautiously, as the role of asymmetries during vertical jumping tasks, particularly in the SJ and CMJ, as predictors of injury risk in football has not been consistently established. Greater asymmetry in peak landing vertical ground reaction force relative to body weight, assessed using alternative jump modalities such as the single-leg CMJ, has been associated with an increased likelihood of injury occurrence in youth football players. However, no specific cut-off threshold for clinically relevant asymmetry values has been established [37]. Therefore, the reductions in asymmetry observed in IPs in our results should be interpreted cautiously and should not be directly extrapolated to other jumping modalities. Unilateral jumping tasks require greater motor control, lumbopelvic stabilization, and force generation capacity, especially during the eccentric and landing phases. These task-specific mechanical and neuromuscular demands may substantially influence asymmetry-related outcomes, potentially amplifying inter-limb differences as a consequence of technical execution requirements. Consequently, asymmetry measures derived from different jump tasks may reflect distinct neuromuscular strategies rather than a uniform marker of injury risk. Furthermore, practitioners should be cautious when relying exclusively on group-level outcomes. Previous research has highlighted that meaningful individual responses may be masked by group averages, particularly in elite sport settings where rehabilitation and adaptation processes are highly individualized [38]. Therefore, neuromuscular monitoring during the RTS process may benefit from combining group-based analyses with an individualized assessment approach. Taken together, these findings suggest that conventional jump assessments should be interpreted within a broader monitoring framework that considers both task-specific demands and the individual characteristics of each player throughout the rehabilitation and RTS process.
4.2. Surface Electromyography
The analysis of the BS did not reveal clear significant alterations in thigh neuromuscular behavior. The BS is considered a knee-dominant exercise, characterized by greater quadriceps activation compared with hamstring involvement, particularly within the VM and VL [27]. Furthermore, hamstring activation during this exercise is substantially lower than that demonstrated in exercises specifically targeting the posterior chain, such as the Nordic hamstring exercise or the SKSB [29]. Since none of the injuries recorded in the study directly affected the quadriceps, the findings derived from the BS assessment should be interpreted cautiously when considering players presenting with quadriceps-related injuries. Under such conditions, neuromuscular activation patterns during the BS could be substantially altered due to the direct involvement of the primary muscle groups responsible for force production during the exercise.
Regarding the SKSB analysis, exploratory differences in hamstring neuromuscular activation patterns were observed between IPs and NIPs. In particular, lower BF activation was identified among IPs, with a large effect size (ηp2 = 0.38). These observations were broadly consistent with our initial expectations, although these findings should be interpreted within the context of the exploratory nature of the study, the heterogeneous injury profile, and the limited sample size. The SKSB has been described as an exercise requiring high BF activation levels [29]. Therefore, our findings suggest that SEMG assessment during the SKSB may provide complementary information regarding hamstring neuromuscular behavior among players experiencing episodes of restricted football participation, especially in the BF. Moreover, these alterations may be detectable across the concentric, isometric, and eccentric phases of the exercise, as suggested by the present findings.
Previous investigations had already demonstrated reduced hamstring activation following hamstring strain injuries; despite this, those studies neither analyzed the influence of other injury types nor evaluated neuromuscular behavior specifically at the RTS stage [14,15,16]. One possible explanation for the reduced hamstring activation observed in the present study, particularly in the BF, may be the limited exposure to tasks requiring high levels of posterior chain activation during the rehabilitation process, as well as the potential persistence of horizontal force production deficits, which were not assessed in the current investigation. In football reconditioning programs, sprinting tasks, which have been shown to impose substantial activation demands on both the BF and ST musculature [31], are commonly reintroduced progressively for safety reasons and, in some cases, may not be fully performed until the final stage of the process due to functional limitations associated with the injury itself [32]. Consequently, insufficient exposure to high-demand hamstring activation tasks during the reconditioning phase may contribute to explaining the reduced BF activation observed in the present cohort, even in injuries not directly affecting the hamstring musculature. Future investigations should focus on determining whether reductions in hamstring neuromuscular activation may constitute a potential injury risk factor and on clarifying the possible implications of these neuromuscular alterations for athletic performance.
Importantly, the present study was not designed to define a physiological homogeneous injury-specific population, characterize detraining responses, or investigate adaptations associated with a particular injury entity or duration of restricted participation. Instead, the term time-loss injury was adopted according to its epidemiological definition to identify players who experienced medically documented interruptions from unrestricted football participation during the competitive season. Consequently, comparisons between groups should be interpreted as exploratory descriptions of longitudinal neuromuscular trajectories rather than as evidence of injury-specific, duration-specific, or detraining-related adaptations. The observed responses likely reflect the complex interaction between injury characteristics, RTS processes, temporary modifications in football exposure, and individual recovery trajectories.
Several limitations of this study should be acknowledged. First, the relatively small sample size and the inclusion of players from a single team limit the generalizability of the findings and reduce statistical power, although only the results showing a large effect size are discussed to account for the limited statistical power. Consequently, the results should be interpreted as exploratory and require confirmation in larger cohorts. Second, the injury profile included different anatomical locations and tissue types, including injuries that are not directly affecting the lower limbs or hamstring musculature. Although this approach allowed the exploration of the potential consequences associated with sustaining a time-loss injury during the season, different injury characteristics may produce distinct neuromuscular responses, which could partially explain the variability reported in SEMG outcomes. Third, SEMG activity was analyzed using RMS-derived values without normalization to maximal voluntary isometric contraction (MVIC). Although within-subject longitudinal comparisons were performed, the absence of MVIC normalization limits the ability to establish absolute comparisons of muscle activation magnitude between participants. Moreover, despite the use of identical acquisition settings, standardized skin preparation procedures, and electrode placement performed by the same experienced physiotherapist according to SENIAM recommendations, longitudinal changes in raw RMS values may also have been influenced by variations in skin impedance, sweating, electrode repositioning, and subcutaneous tissue characteristics across the competitive season. Consequently, SEMG findings should be interpreted cautiously and do not allow definitive conclusions regarding pure neuromuscular adaptations [35]. Furthermore, substantial inter-individual variability was observed in several SEMG variables, with standard errors frequently exceeding mean percentage changes. Although statistically significant findings were identified within the investigated cohort, the combination of a relatively small sample size, heterogeneous injury characteristics, non-normalized SEMG recordings, and considerable variability limits the strength of the inferences that can be drawn from these outcomes. Therefore, SEMG findings, particularly those related to BF activation during the SKSB exercise, should be considered preliminary and exploratory findings requiring confirmation in larger and more homogeneous populations of professional football players.
Another limitation is that only two testing sessions were conducted throughout the season. Given that neuromuscular performance may fluctuate throughout different competitive periods, additional longitudinal assessments could provide a more comprehensive understanding of temporal adaptations following injury and RTS.
Furthermore, sprint performance, horizontal force production capacities, and exposure to high-speed running during rehabilitation were not quantified, despite their potential relevance for hamstring neuromuscular function. Future investigations should integrate these variables to better explain the mechanisms underlying the reductions in BF activation observed in the present research. Despite these limitations, our research provides novel longitudinal information regarding neuromuscular behavior during the RTS process in professional football players, especially in relation to BF neuromuscular function activation during the SKSB exercise.
5. Conclusions
The present exploratory investigation suggests that conventional vertical jump assessments may provide limited information regarding some of the neuromuscular changes observed among players experiencing time-loss injuries during the season. In contrast, SEMG assessment during posterior-chain-dominant exercises such as the SKSB may provide additional information regarding hamstring neuromuscular function within the investigated cohort.
The reductions in inter-limb asymmetry observed in IPs during CMJ performance should be interpreted cautiously, as asymmetry-related outcomes may be task-specific and do not necessarily reflect a direct reduction in injury risk. Similarly, the differences observed in BF activation during the SKSB task should be interpreted within the context of the study limitations, including the small sample size, the heterogeneous injury profile, the absence of SEMG normalization procedures and the considerable inter-individual variability observed across several SEMG outcomes. Therefore, the neuromuscular and performance-related responses should be interpreted as preliminary and exploratory observations that may contribute to the development of future longitudinal studies in more homogeneous professional football cohorts.
Nevertheless, the present findings contribute additional longitudinal information regarding neuromuscular function and performance-related measures throughout a competitive season and the RTS process in professional football. Future studies including larger and more homogeneous cohorts, injury-specific analyses, additional seasonal assessments, and sprint-related variables are required to further clarify the relationship between injury history, hamstring neuromuscular function, and performance adaptations in football.
Author Contributions
Conceptualization, R.-A.F.M.; methodology, R.-A.F.M., J.R.O. and E.N.C.; software, R.-A.F.M. and J.R.O.; validation, J.R.O. and E.N.C.; formal analysis, J.R.O.; investigation, R.-A.F.M., J.R.O. and E.N.C.; resources, R.-A.F.M., J.R.O. and E.N.C.; data curation, J.R.O. and E.N.C.; writing—original draft preparation, R.-A.F.M.; writing—review and editing, J.R.O. and E.N.C.; visualization, R.-A.F.M. and J.R.O.; supervision, E.N.C.; project administration, E.N.C. All authors have read and agreed to the published version of the manuscript.
Funding
This research received no external funding.
Institutional Review Board Statement
This study was conducted in accordance with the Declaration of Helsinki and approved by the Ethics Committee of Universidad Politécnica de Madrid (6 April 2016).
Informed Consent Statement
Informed consent was obtained from all subjects involved in the study.
Data Availability Statement
The original contributions presented in the study are included in the article; further inquiries can be directed to the authors.
Conflicts of Interest
The authors declare no conflicts of interest.
Abbreviations
The following abbreviations are used in this manuscript:
| SJ | Squat Jump |
| BF | Biceps Femoris |
| RTS | Return to Sport |
| CMJ | Countermovement Jump |
| JH | Jump Height |
| PP | Peak Power |
| SEMG | Surface Electromyography |
| IP | Player Experiencing Time-Loss Injury |
| NIP | Player Who Remained Continuously Available |
| BS | Bulgarian Squat |
| SKSB | Single Knee Straight Bridge |
| RF | Rectus Femoris |
| VM | Vastus Medialis |
| VL | Vastus Lateralis |
| ST | Semitendinosus |
| RMS | Root Mean Square |
| PF | Peak Force |
| BW | Body Weight |
| PRFD | Peak Rate of Force Development |
| MRSI | Modified Reactive Strength Index |
| PFa | Peak Force Inter-Limb Asymmetry |
| PPa | Peak Power Inter-Limb Asymmetry |
| MVIC | Maximal Voluntary Isometric Contraction |
Appendix A
Table A1.
Phase-specific changes in SEMG activity during SKSB. NIPs (n = 7) and IPs (n = 6).
Table A2.
Phase-specific changes in SEMG activity during SB. NIPs (n = 8) and IPs (n = 6).
References
- López-Valenciano, A.; Ruiz-Pérez, I.; Garcia-Gómez, A.; Vera-Garcia, F.; De Ste Croix, M.; Myer, G.D.; Ayala, F. Epidemiology of injuries in professional football: A systematic review and meta-analysis. Br. J. Sports Med. 2020, 54, 711–718. [Google Scholar] [CrossRef] [Scilit] [PubMed]
- Ekstrand, J.; Hägglund, M.; Waldén, M. Epidemiology of muscle injuries in professional football (soccer). Am. J. Sports Med. 2011, 39, 1226–1232. [Google Scholar] [CrossRef] [Scilit] [PubMed]
- Noya Salces, J.; Gomez-Carmona, P.M.; Gracia-Marco, L.; Moliner-Urdiales, D.; Sillero-Quintana, M. Epidemiology of injuries in First Division Spanish football. J. Sports Sci. 2014, 32, 1263–1270. [Google Scholar] [CrossRef] [Scilit] [PubMed]
- Fuller, C.W.; Ekstrand, J.; Junge, A.; Andersen, T.E.; Bahr, R.; Dvorak, J.; Hägglund, M.; McCrory, P.; Meeuwisse, W.H. Consensus statement on injury definitions and data collection procedures in studies of football (soccer) injuries. Br. J. Sports Med. 2006, 40, 193–201. [Google Scholar] [CrossRef] [Scilit] [PubMed]
- Ekstrand, J.; Krutsch, W.; Spreco, A.; van Zoest, W.; Roberts, C.; Meyer, T.; Bengtsson, H. Time before return to play for the most common injuries in professional football: A 16-year follow-up of the UEFA Elite Club Injury Study. Br. J. Sports Med. 2020, 54, 421–426. [Google Scholar] [CrossRef] [Scilit] [PubMed]
- Hägglund, M.; Waldén, M.; Magnusson, H.; Kristenson, K.; Bengtsson, H.; Ekstrand, J. Injuries affect team performance negatively in professional football: An 11-year follow-up of the UEFA Champions League injury study. Br. J. Sports Med. 2013, 47, 738–742. [Google Scholar] [CrossRef] [Scilit] [PubMed]
- Langhout, R.; Tak, I.; van Beijsterveldt, A.M.; Ricken, M.; Weir, A.; Barendrecht, M.; Kerkhoffs, G.; Stubbe, J. Risk factors for groin injury and groin symptoms in elite-level soccer players: A cohort study in the Dutch professional leagues. J. Orthop. Sports Phys. Ther. 2018, 48, 704–712. [Google Scholar] [CrossRef] [Scilit] [PubMed]
- Mendiguchia, J.; Alentorn-Geli, E.; Idoate, F.; Myer, G.D. Rectus femoris muscle injuries in football: A clinically relevant review of mechanisms of injury, risk factors and preventive strategies. Br. J. Sports Med. 2013, 47, 359–366. [Google Scholar] [CrossRef] [Scilit] [PubMed]
- Navarro, E.; Chorro, D.; Torres, G.; García, C.; Navandar, A.; Veiga Fernández, S. A review of risk factors for hamstring injury in soccer: A biomechanical approach. Eur. J. Hum. Mov. 2015, 34, 52–74. [Google Scholar]
- Fousekis, K.; Tsepis, E.; Poulmedis, P.; Athanasopoulos, S.; Vagenas, G. Intrinsic risk factors of non-contact quadriceps and hamstring strains in soccer: A prospective study of 100 professional players. Br. J. Sports Med. 2011, 45, 709–714. [Google Scholar] [CrossRef] [Scilit] [PubMed]
- Wing, C.; Bishop, C. Hamstring strain injuries: Incidence, mechanisms, risk factors, and training recommendations. Strength Cond. J. 2020, 42, 40–57. [Google Scholar] [CrossRef] [Scilit]
- Schuermans, J.; van Tiggelen, D.; Witvrouw, E. Prone hip extension muscle recruitment is associated with hamstring injury risk in amateur soccer. Int. J. Sports Med. 2017, 38, 696–706. [Google Scholar] [CrossRef] [Scilit]
- Henderson, G.; Barnes, C.A.; Portas, M.D. Factors associated with increased propensity for hamstring injury in English Premier League soccer players. J. Sci. Med. Sport 2010, 13, 397–402. [Google Scholar] [CrossRef] [Scilit] [PubMed]
- Areia, C.; Barreira, P.; Montanha, T.; Oliveira, J.; Ribeiro, F. Neuromuscular changes in football players with previous hamstring injury. Clin. Biomech. 2019, 69, 115–119. [Google Scholar] [CrossRef] [Scilit] [PubMed]
- Opar, D.A.; Williams, M.D.; Timmins, R.G.; Dear, N.M.; Shield, A.J. Knee flexor strength and biceps femoris electromyographical activity is lower in previously strained hamstrings. J. Electromyogr. Kinesiol. 2013, 23, 696–703. [Google Scholar] [CrossRef] [Scilit] [PubMed]
- Sole, G.; Milosavljevic, S.; Nicholson, H.; Sullivan, S.J. Selective strength loss and decreased muscle activity in hamstring injury. J. Orthop. Sports Phys. Ther. 2011, 41, 354–363. [Google Scholar] [CrossRef] [Scilit] [PubMed]
- Van Dyk, N.; Wangensteen, A.; Vermeulen, R.; Whiteley, R.; Bahr, R.; Tol, J.L.; Witvrouw, E. Similar isokinetic strength preinjury and at return to sport after hamstring injury. Med. Sci. Sports Exerc. 2019, 51, 1091–1098. [Google Scholar] [CrossRef] [Scilit] [PubMed]
- Bakken, A.; Targett, S.; Bere, T.; Eirale, C.; Farooq, A.; Mosler, A.B.; Tol, J.L.; Whiteley, R.; Khan, K.M.; Bahr, R. Muscle strength is a poor screening test for predicting lower extremity injuries in professional male soccer players: A 2-year prospective cohort study. Am. J. Sports Med. 2018, 46, 1481–1491. [Google Scholar] [CrossRef] [Scilit] [PubMed]
- Grygorowicz, M.; Michalowska, M.; Walczak, T.; Owen, A.; Grabski, J.K.; Pyda, A.; Piontek, T.; Kotwicki, T. Discussion about different cut-off values of conventional hamstring-to-quadriceps ratio used in hamstring injury prediction among professional male football players. PLoS ONE 2017, 12, e0188974. [Google Scholar] [CrossRef] [Scilit] [PubMed]
- Bahr, R. Why screening tests to predict injury do not work—And probably never will…: A critical review. Br. J. Sports Med. 2016, 50, 776–780. [Google Scholar] [CrossRef] [Scilit] [PubMed]
- Haugen, T.A. Soccer seasonal variations in sprint mechanical properties and vertical jump performance. Kinesiology 2018, 50, 102–108. [Google Scholar]
- Lehnert, M.; Xaverova, Z.; De Ste Croix, M. Changes in muscle strength in U19 soccer players during an annual training cycle. J. Hum. Kinet. 2014, 42, 175–185. [Google Scholar] [CrossRef] [Scilit] [PubMed]
- Caldwell, P.B.; Peters, M.D. Seasonal variation in physiological fitness of a semiprofessional soccer team. J. Strength Cond. Res. 2009, 23, 1370–1377. [Google Scholar] [CrossRef] [Scilit] [PubMed]
- Jiménez-Reyes, P.; Garcia-Ramos, A.; Párraga-Montilla, J.A.; Morcillo-Losa, J.A.; Cuadrado-Peñafiel, V.; Castaño-Zambudio, A.; Samozino, P.; Morin, J.B. Seasonal changes in the sprint acceleration force-velocity profile of elite male soccer players. J. Strength Cond. Res. 2022, 36, 70–74. [Google Scholar] [CrossRef] [Scilit] [PubMed]
- Ekstrand, J.; Bengtsson, H.; Waldén, M.; Davison, M.; Khan, K.M.; Hägglund, M. Hamstring injury rates have increased during recent seasons and now constitute 24% of all injuries in men’s professional football: The UEFA Elite Club Injury Study from 2001/02 to 2021/22. Br. J. Sports Med. 2023, 57, 292–298. [Google Scholar] [CrossRef] [Scilit] [PubMed]
- Opar, D.A.; Williams, M.D.; Shield, A.J. Hamstring strain injuries: Factors that lead to injury and re-injury. Sports Med. 2012, 42, 209–226. [Google Scholar] [CrossRef] [Scilit] [PubMed]
- Navarro, E.; Chorro, D.; Torres, G.; Navandar, A.; Rueda, J.; Veiga, S. Electromyographic activity of quadriceps and hamstrings of a professional football team during Bulgarian squat and lunge exercises. J. Hum. Sport Exerc. 2021, 16, 581–594. [Google Scholar] [CrossRef] [Scilit]
- Torres, G.; Chorro, D.; Navandar, A.; Rueda, J.; Fernández, L.; Navarro, E. Assessment of hamstring: Quadriceps coactivation without the use of maximum voluntary isometric contraction. Appl. Sci. 2020, 10, 1615. [Google Scholar] [CrossRef] [Scilit]
- Bourne, M.N.; Williams, M.D.; Opar, D.A.; Al Najjar, A.; Kerr, G.K.; Shield, A.J. Impact of exercise selection on hamstring muscle activation. Br. J. Sports Med. 2017, 51, 985. [Google Scholar] [CrossRef] [Scilit] [PubMed]
- Scurr, J.C.; Abbott, V.; Ball, N. Quadriceps EMG muscle activation during accurate soccer instep kicking. J. Sports Sci. 2011, 29, 247–251. [Google Scholar] [CrossRef] [Scilit] [PubMed]
- Hegyi, A.; Gonçalves, B.A.M.; Finni, T.; Cronin, N.J. Individual region- and muscle-specific hamstring activity at different running speeds. Med. Sci. Sports Exerc. 2019, 51, 2274–2285. [Google Scholar] [CrossRef] [Scilit] [PubMed]
- Taberner, M.; Allen, T.; Cohen, D.D. Progressing rehabilitation after injury: Consider the ‘control-chaos continuum’. Br. J. Sports Med. 2019, 53, 1132–1136. [Google Scholar] [CrossRef] [Scilit] [PubMed]
- Bengtsson, H.; Ekstrand, J.; Waldén, M.; Hägglund, M. Few training sessions between return to play and first match appearance are associated with an increased propensity for injury: A prospective cohort study of male professional football players during 16 consecutive seasons. Br. J. Sports Med. 2020, 54, 427–432. [Google Scholar] [CrossRef] [Scilit] [PubMed]
- Bishop, C.; Jordan, M.; Torres-Ronda, L.; Loturco, I.; Harry, J.; Virgile, A.; Mundy, P.; Turner, A.; Comfort, P. Selecting metrics that matter: Comparing the use of the countermovement jump for performance profiling, neuromuscular fatigue monitoring, and injury rehabilitation testing. Strength Cond. J. 2023, 45, 545–553. [Google Scholar] [CrossRef] [Scilit]
- Hermens, H.J.; Freriks, B.; Disselhorst-Klug, C.; Rau, G. Development of recommendations for SEMG sensors and sensor placement procedures. J. Electromyogr. Kinesiol. 2000, 10, 361–374. [Google Scholar] [CrossRef] [Scilit] [PubMed]
- Cohen, J. Statistical Power Analysis for the Behavioral Sciences, 2nd ed.; Lawrence Erlbaum Associates: Hillsdale, NJ, USA, 1988. [Google Scholar]
- Read, P.J.; Oliver, J.L.; De Ste Croix, M.B.A.; Myer, G.D.; Lloyd, R.S. A prospective investigation to evaluate risk factors for lower-extremity injury risk in male youth soccer players. Scand. J. Med. Sci. Sports 2018, 28, 1244–1251. [Google Scholar] [CrossRef] [Scilit] [PubMed]
- Bishop, C.; Read, P.; Chavda, S.; Turner, A.; Lake, J. Interlimb asymmetries: Understanding how to calculate differences from bilateral and unilateral tests. Strength Cond. J. 2018, 40, 1–6. [Google Scholar] [CrossRef] [Scilit]

Disclaimer/Publisher’s Note: The statements, opinions and data contained in all publications are solely those of the individual author(s) and contributor(s) and not of MDPI and/or the editor(s). MDPI and/or the editor(s) disclaim responsibility for any injury to people or property resulting from any ideas, methods, instructions or products referred to in the content. |
© 2026 by the authors. Licensee MDPI, Basel, Switzerland. This article is an open access article distributed under the terms and conditions of the Creative Commons Attribution (CC BY) license.