


Abstract
Action quality assessment (AQA) is vital in sports science and clinical rehabilitation, but existing methods suffer from data noise sensitivity, weak physical interpretability, and limited generalization across body types. This study proposes a novel AQA paradigm for standing long jump to address these limitations. A methodological framework based on kinematic reconstruction and physical deviation analysis is developed. Ideal trajectories derived from forward kinematics establish a unified evaluation benchmark. Three deviation features (Peak Deviation, Cumulative Deviation Integral, Phase-Weighted Deviation) are computed between ideal and experimental samples, then input into a Random Forest Classifier for automatic grading. Experimental results demonstrate the proposed method significantly outperforms traditional dynamic-time-warping-based templates in accuracy and robustness. Ablation studies confirm kinematic trajectory benchmarks are superior to raw or averaged trajectories. Model decisions show strong consistency with physical characteristics, verifying interpretable assessment capability. This work shifts AQA from “data similarity comparison” to “physical rationality evaluation”, offering a new perspective for vision-based automated motion analysis.
1. Introduction
Human action quality assessment (AQA) is an interdisciplinary research field, which combines computer vision, sports science, and rehabilitation medicine. This field aims to automatically and objectively evaluate human movement execution through algorithms. The evaluation provides precise quantitative feedback for athlete training, rehabilitation outcome evaluation, and daily fitness activities [1,2,3,4,5]. In recent years, the increasing maturity of human pose estimation algorithms (e.g., OpenPose, AlphaPose) has enabled precise extraction of joint trace from ordinary videos. This technique created a robust data foundation for vision-based non-contact motion assessment [6,7,8,9,10]. The concern of how to utilize these pose data for building effective assessment models has become a key focus that attracted significant attention from both academic and industrial communities.
Existing AQA methods can be broadly categorized into two types: deep learning-based approaches and handcrafted feature-based approaches. Deep learning-based methods typically take raw pose sequences as input and learn evaluation score mappings directly [11,12,13,14,15,16,17,18,19,20]. Although these methods enable automated feature learning, their “black-box” nature obscures decision logic, and their performance heavily depends on large-scale annotated datasets. Handcrafted feature-based methods offer strong interpretability and lower data demands [21,22], but fundamentally rely on data-driven similarity comparison. However, this mainstream paradigm relied on a data-driven similarity comparison. Whether the features were derived from statistical measures of joint coordinate sequences or similarity metrics with pre-defined templates, their design heavily depended on extracting mathematical patterns directly from observed data, while failing to adequately incorporate the inherent physical constraints and biological principles of human motion. Furthermore, many of the constructed features were correlated with the specific build of an individual and their absolute spatial position in the capture environment, making the resulting assessment models difficult to generalize to subjects with different body types [5,6]. Additionally, coordinate jitter and detection errors inherent to the pose estimation algorithm were directly introduced during feature computation, thereby exerting a persistent negative influence on the robustness of the final assessment model [7,8]. A detailed review and comparison of these methods is provided in Section 2.
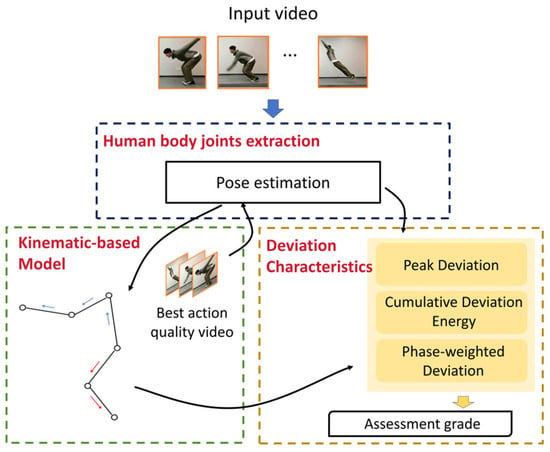
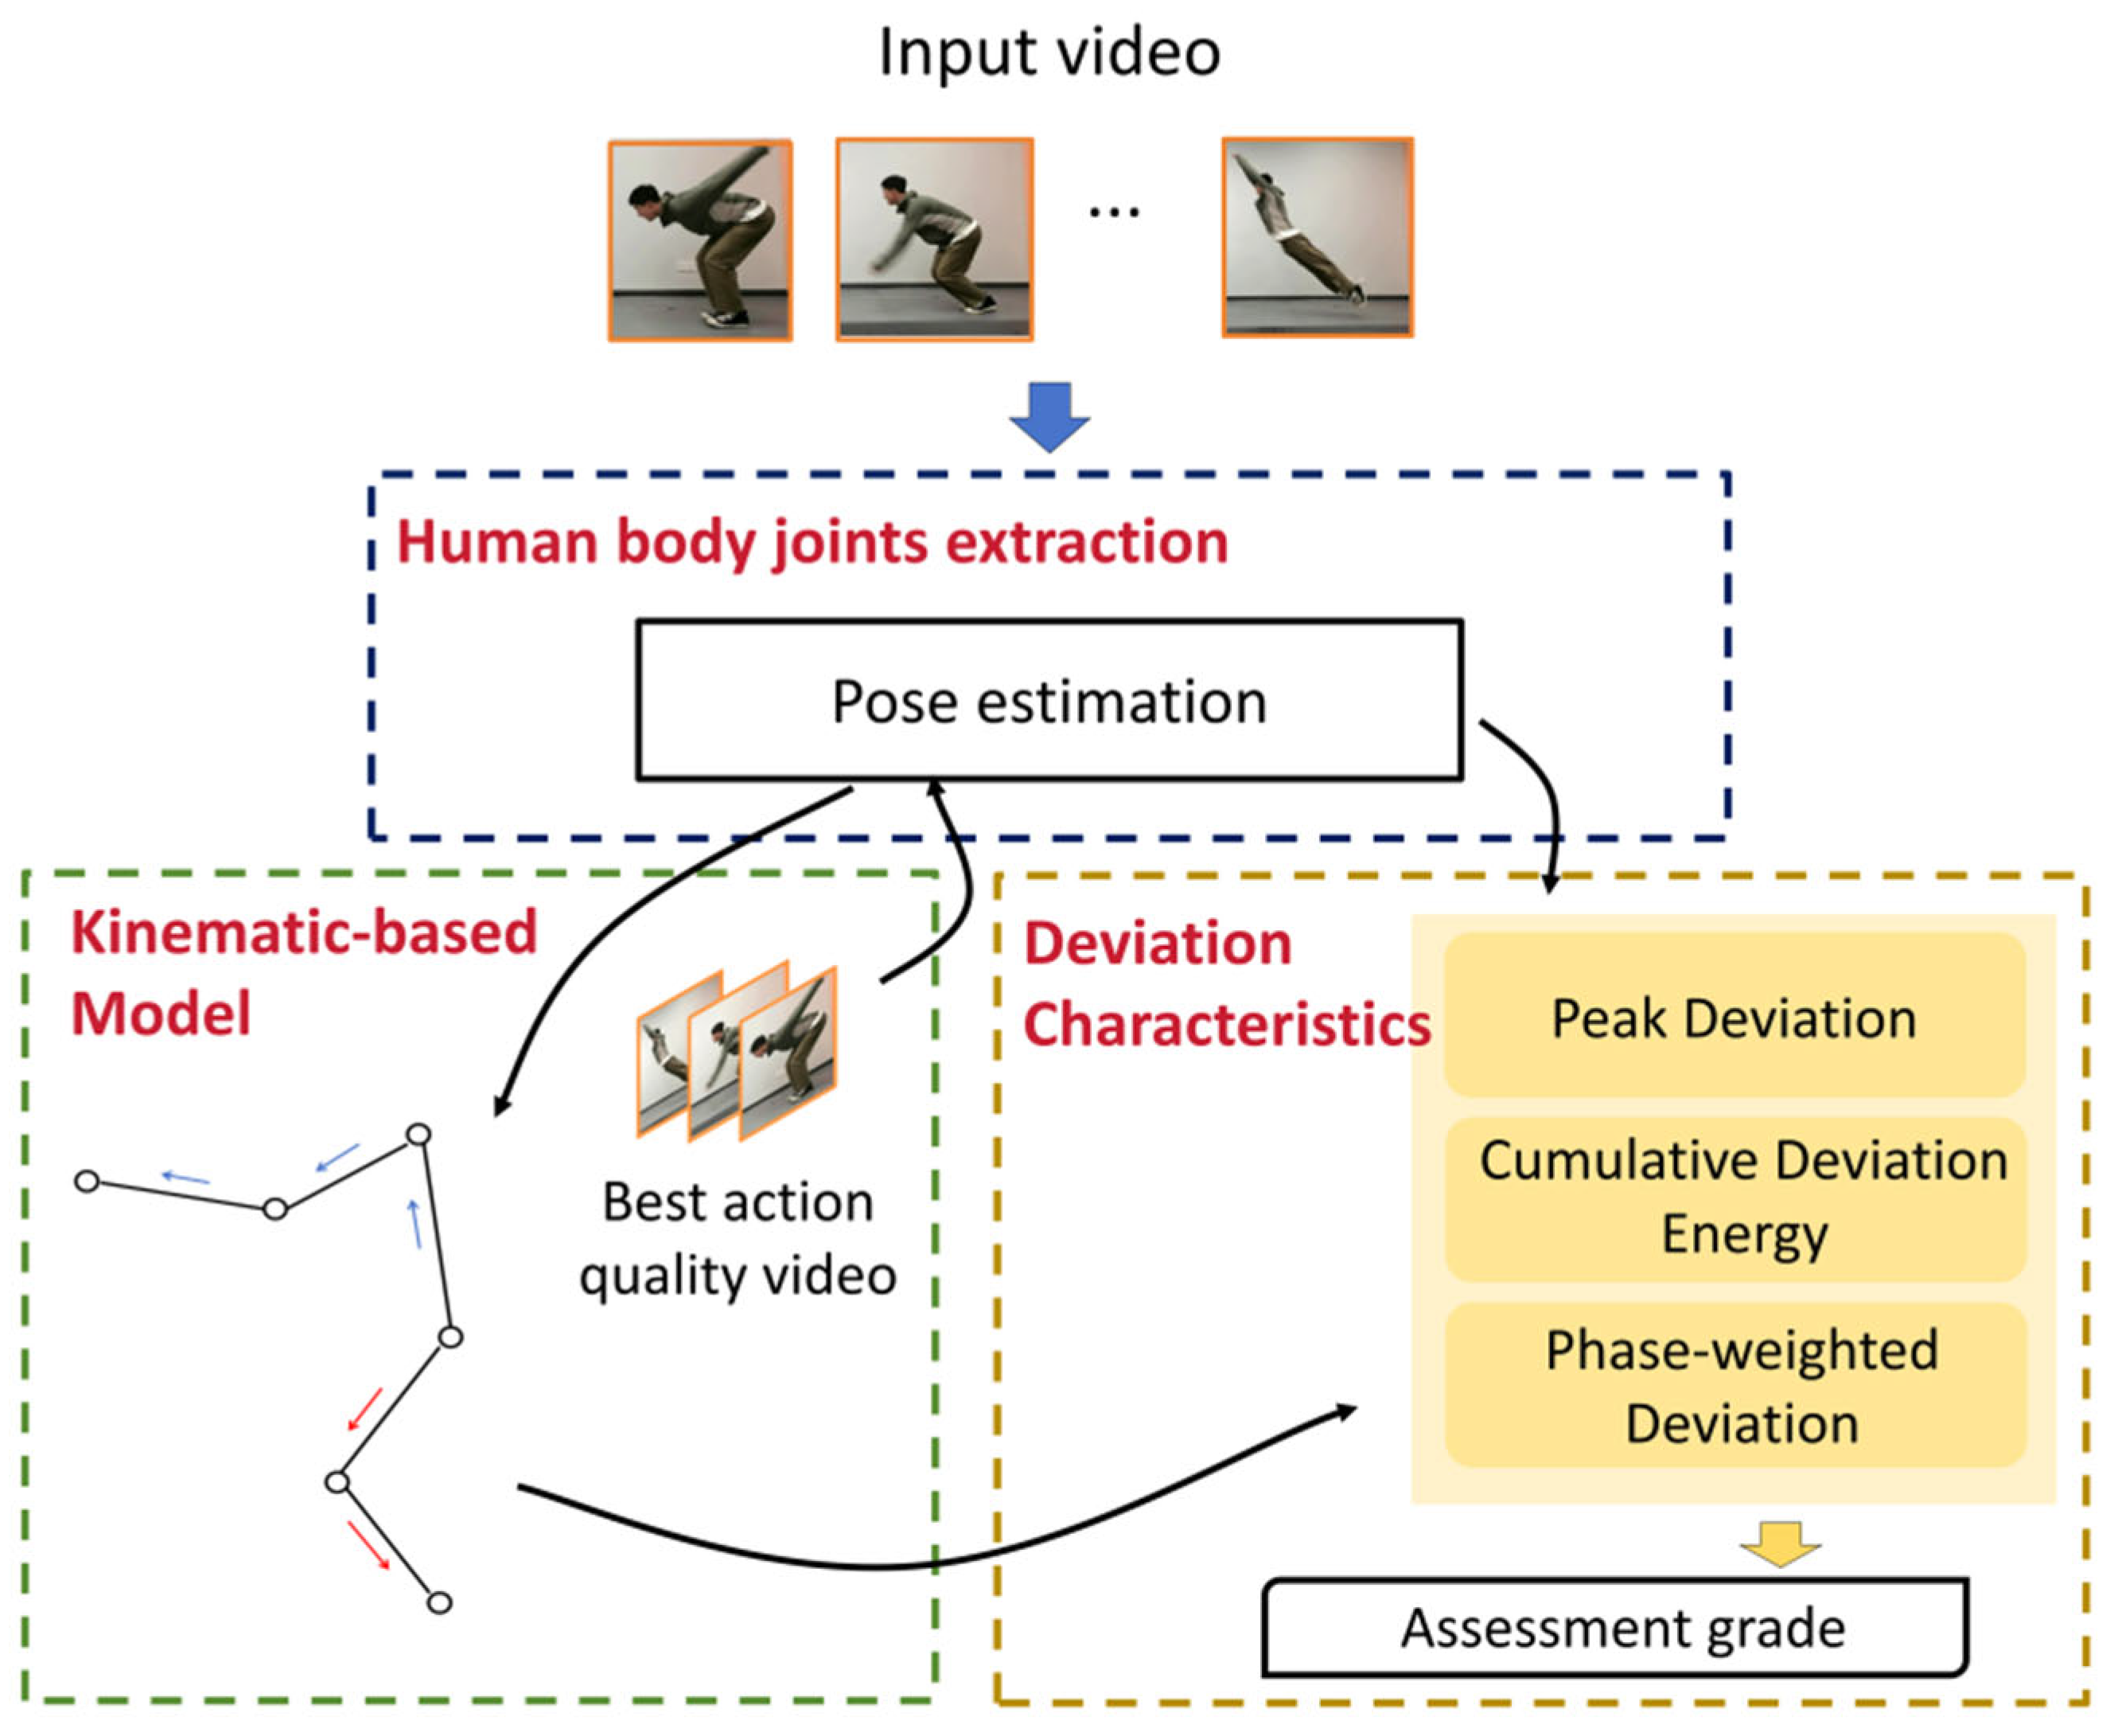
The framework diagram of the method is shown in Figure 1 and the main contributions of this paper could be summarized as follows:
Figure 1.
Action quality assessment based on kinematic reconstruction and deviation analysis.
A physics-driven evaluation framework is proposed, discarding the conventional scheme that directly takes expert observation data as static templates. Relying on forward kinematics and optimal samples, an innovative kinematic reference motion generator is developed, which fuses root joint trajectories and joint angle changes to solve kinematic reference trajectories complying with rigid body constraints and physical self-consistency. The standard ideal motion is thus abstracted into a computable dynamic physical model.
Multi-dimensional deviation features aligned with the physical benchmark are defined. For quantitative assessment under the new framework, three evaluation indicators are established: Peak Deviation (PD), Cumulative Deviation Integral (CDI) and Phase-Weighted Deviation (PWD). They quantify discrepancies between measured motions and the ideal physical model from instantaneous error amplitude, total error accumulation and temporal phase importance three physical perspectives separately.
An interpretable feature engineering workflow is built to convert raw observed data into high-level semantic features. Starting from joint coordinate data, the workflow sequentially conducts angle computation, time domain smoothing and kinematic reconstruction, and finally outputs physically interpretable deviation features. This pipeline guarantees the extracted features are stable, robust and can directly characterize movement quality.
2. Related Work
This section reviews existing AQA methods from three perspectives: deep learning-based approaches, handcrafted feature-based approaches, and physics-based methods. A summary comparison is provided in Table 1.
2.1. Deep Learning-Based Methods
Deep learning-based AQA methods model action quality assessment as end-to-end regression or classification tasks. Parmar and Morris [23] proposed a multi-task learning framework that simultaneously predicts action categories and quality scores, while their subsequent work [24] extended this framework to multiple Olympic events. Their earlier work [25] pioneered the use of video features for scoring Olympic events. Building on these foundations, recent methods have explored various architectures: Wang et al. [5] designed partially connected LSTMs with triplet losses for skeleton-based AQA; Zhou et al. [20] proposed hierarchical graph convolutional networks (HGCNs) for multi-scale motion feature extraction; Zhang et al. [15] introduced pose-guided transformers for fine-grained assessment; and Zeng and Zheng [17] developed multimodal frameworks fusing RGB video and skeletal data. Comprehensive surveys of this field have been provided by Zhou et al. [1], Lei et al. [3], and Liu et al. [18]. Despite achieving high accuracy on benchmark datasets, these methods suffer from limited interpretability, heavy dependence on large-scale annotations, and sensitivity to pose estimation noise.
2.2. Handcrafted Feature-Based Methods
Handcrafted feature-based methods follow a “coordinate extraction–feature engineering–model evaluation” pipeline, offering stronger interpretability. Template matching is the dominant paradigm: Su [26] used DTW to align user motion trajectories with standard templates for rehabilitation assessment. Hou et al. [27] proposed an interpretable two-stage AQA method combining 3D pose estimation with improved DTW for dynamic feature alignment. Lei et al. [28] designed effective skeletal representations using joint displacement sequences and self-similarity feature descriptors. Tao et al. [29] systematically compared different pose representations for online motion quality assessment. Som et al. [30] proposed Riemannian geometric approaches for measuring movement quality. In rehabilitation applications, Kinect-based systems have been widely adopted for gait measurement [31] and Parkinson’s disease assessment [32,33]. However, these methods fundamentally rely on data-driven similarity comparison, failing to incorporate physical constraints of human motion, and are sensitive to individual body type variations and pose estimation noise.
2.3. Physics-Based Methods
Human motion is governed by strict physical laws and biomechanical constraints, including bone length invariance and joint angle physiological ranges. Parametric human body models provide a physical foundation for motion analysis. Bogo et al. [34] proposed “Keep it SMPL,” which estimates 3D human pose and shape from a single image by optimizing SMPL parameters. Kanazawa et al. [35] further developed end-to-end recovery of human shape and pose directly from images. Kocabas et al. [36] proposed VIBE, which generates kinematically plausible motion sequences using adversarial learning. To improve physical plausibility, Choi et al. [37] proposed Pose2Mesh, recovering 3D human meshes from 2D poses using graph convolutional networks with skeletal topology constraints. Pavllo et al. [38] leveraged temporal convolutions with semi-supervised training to enforce temporal consistency in 3D pose estimation. Xie et al. [39] introduced physics-based constraints and contact force reasoning to refine imperfect pose estimates. However, these methods primarily focus on pose estimation and motion synthesis tasks, rather than action quality assessment. The application of kinematic reconstruction and physical deviation analysis to AQA remains largely unexplored, which motivates our present work.
2.4. Summary
Table 1 summarizes the key characteristics of representative AQA methods.
Table 1.
Comparison of representative AQA methods.
As shown in Table 1, existing methods commonly suffer from three main limitations: (1) limited physical interpretability, (2) being computationally heavy, and (3) lack of robustness to pose estimation noise. These gaps motivate the development of alternative approaches that incorporate kinematic constraints and physical plausibility into the assessment framework.
3. Methods
3.1. Kinematic-Based Rigid Body Trajectory Model
This study employed the standing long jump as the research subject and adopted a two-dimensional rigid body kinematics assumption as the modeling foundation. The model described limb movements through rotation angles and their corresponding rotation matrices. The model could derive kinematic trajectories using limb length constraints and angle variations. The following section detailed the specific derivation process.
First, OpenPose provided the raw joint positions in every frame. The study defined as the raw parent joint position and as the raw child joint position. It calculated the raw limb vector using Equation (1).
In human motion analysis, the change in relative angle between adjacent limb segments served as a key parameter. This parameter described the relative motion between body segments. The model considered two adjacent limb vectors, denoted as and . These vectors represented segments such as the thigh and lower leg. Equation (2) provided the calculation formula for the angle .
Based on the physiological characteristics of human limbs, this study introduced physical constraints into the model, positing that each limb segment maintained a constant length during motion. Accordingly, was defined as the original limb vector in the first frame. To ensure the model complied with this physical constraint, the constrained limb vector was derived by adjusting the direction of the original limb vector.
The relative rotational angle variation in the parent joint served as the key factor driving limb movement. The kinematic feature was quantified by computing the angular change between consecutive frames. The relative rotation angle of the parent joint was derived from the angular difference between the current frame and the previous frame. Let denote the parent joint angle in the current frame and represent the parent joint angle in the previous frame. Equation (4) showed the calculation of the angular change value.
Based on the angular change, the current kinematic limb vector was obtained. The calculation used a two-dimensional rotation matrix and the constrained limb vector from the previous frame. Equation (5) defined the two-dimensional rotation matrix.
The kinematically corrected limb vector was obtained by applying the rotation matrix. Equation (6) provided the specific calculation for this vector.
Finally, the kinematically corrected limb vector was added to the parent joint position. This addition produced the trajectory coordinate of the kinematic child joint, represented in Equation (7).
Under the constant limb length constraint, the reconstruction error of a child joint was bounded by the linear accumulation of errors from the root. The position error of a child joint, , could be approximated as:
where was the parent joint error, was the limb length, was the angular error, and was the unit tangent vector. Taking the norm gave the error bound:
For a kinematic chain with segments, the total error at the end joint was bounded by:
This linear bound guaranteed that moderate pose estimation noise did not cause exponential divergence, ensuring the robustness of the kinematic reconstruction.
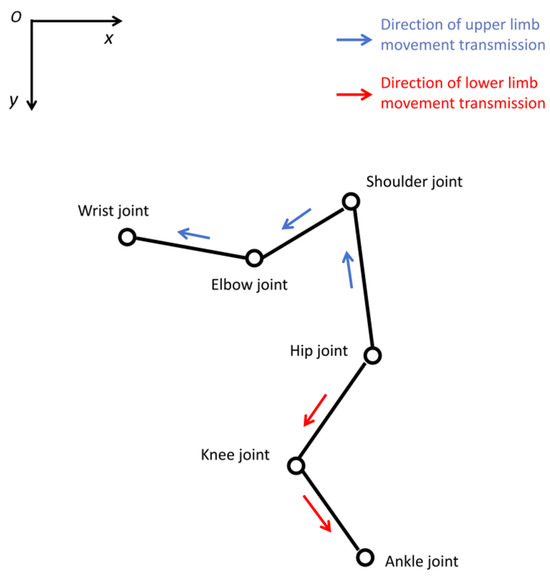
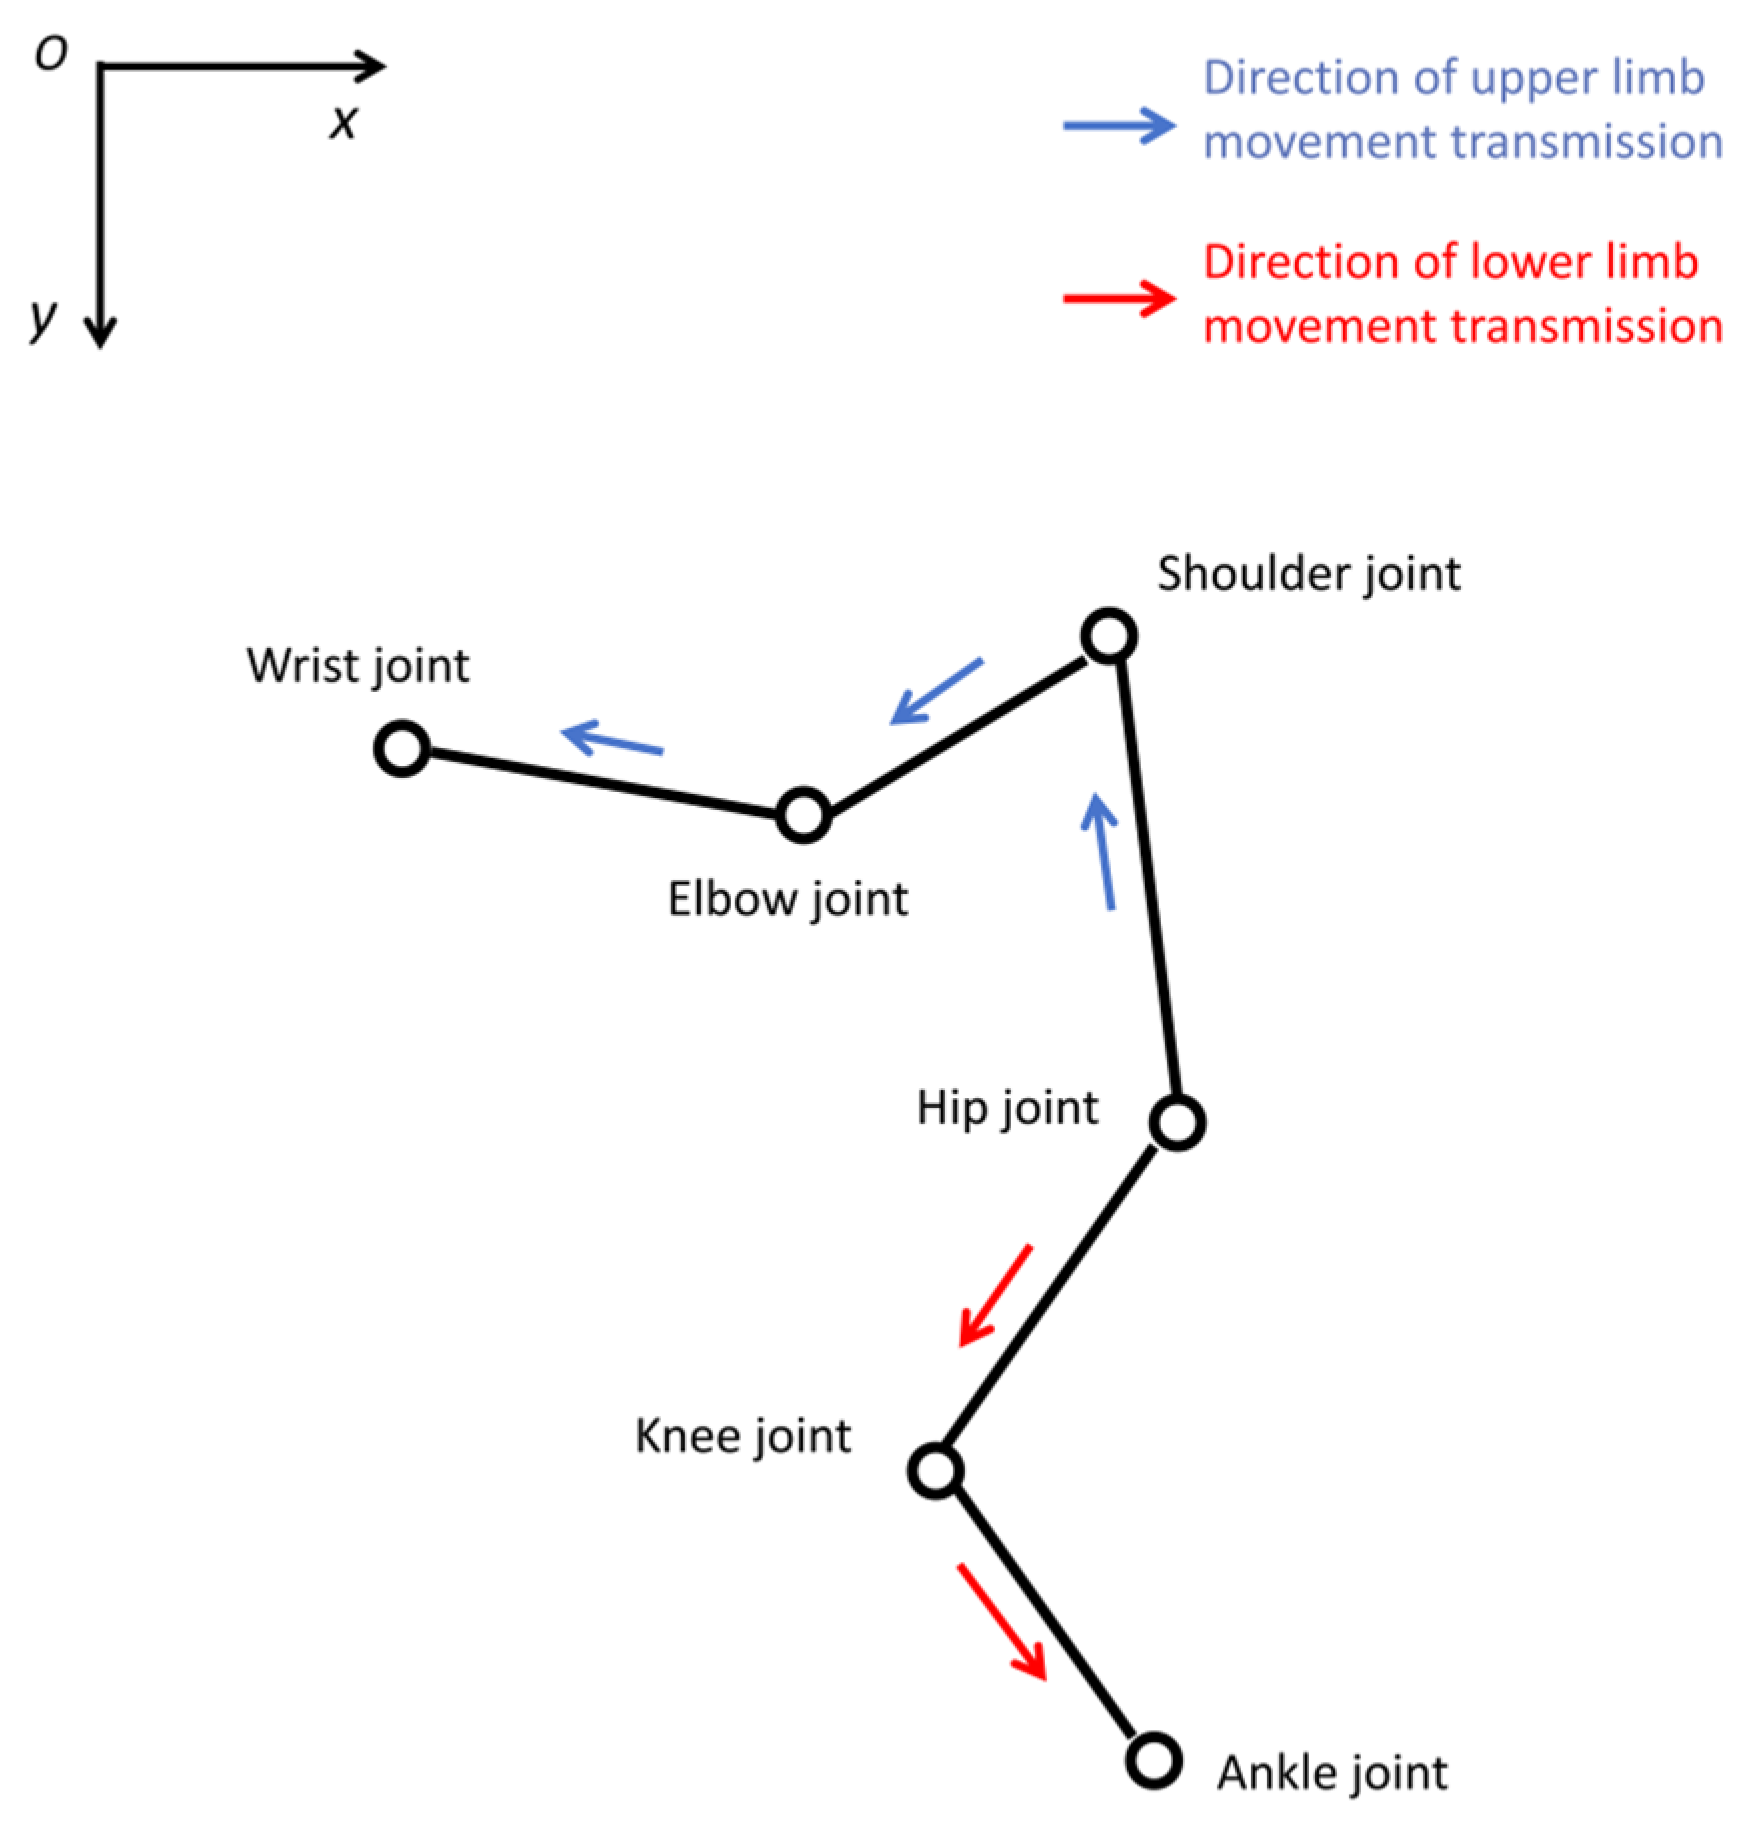
Table 2 detailed the kinematic parameter definitions for the major human limb segments. It included the parent joint, child joint, reference length and rotation angle parameters for each segment. These parameters provided the necessary input data for the subsequent kinematic analysis. Figure 2 presented a schematic diagram of the whole-body joint kinematics derivation based on a rigid body model. The illustration depicted a complete kinematic chain, starting from the hip joint and connecting through key nodes such as the knee and ankle joints, thereby visually representing the motion transfer relationships between the limb segments.
Table 2.
Definitions of kinematic parameters for major human limb segments.
Figure 2.
A schematic diagram of the whole-body joint kinematics derivation based on a rigid-body model.
All computational procedures described in this section were implemented in Python (version 3.9) using NumPy (version 1.24) and SciPy (version 1.11). OpenPose (version 1.7.0) was employed for 2D pose estimation. The DTW alignment was performed using the fastdtw library (version 0.3.4).
3.2. Boundary Conditions and Physical Constraints
To eliminate unnatural action artifacts such as limb length distortion, joint hyperextension and trajectory discontinuities, physical constraints and boundary conditions were imposed throughout the kinematic modeling process. The constraint was built to fit the action characteristics of the side view of standing long jump, and a complete restriction mechanism was established from three aspects: constant limb length constraint, physiological constraint of joint angle, and temporal smoothing constraint. All constraints were formulated based on real human structures and rigid body kinematics principles, which not only ensured the preciseness of mathematical recursion, but also matched the objective law of the actual human body movement.
The constant limb length constraint was the core constraint to ensure the rationality of kinematic derivation. Instead of adopting fixed statistical values, the initial length of each limb segment (thigh, shank, torso, upper arm, forearm) was calculated from the subject’s upright standard posture in the first frame of the video. The value represented the true length of the limb in a natural standing state, accurately matching the subject’s individual limb proportions, as shown in Equation (3). During the forward kinematics recursion across the entire motion cycle, all limb segments maintained the initial length constant, with no stretching, compression, or deformation induced by joint rotation or temporal variation. It should be noted that the constant length constraint applied to the trunk was an approximation, because the trunk could undergo substantial flexion during motions such as the standing long jump, leading to noticeable changes in the effective hip–shoulder distance. In our dataset, the maximum trunk flexion angle (the angle between the hip–shoulder vector and the vertical direction during the landing preparation phase) across all samples was 27°. Substituting this value into the error propagation bound of Equation (10) with a trunk length of 0.45 m yielded a maximum theoretical error at the shoulder joint of approximately 23 cm. This error was not negligible in absolute terms. A quantitative robustness analysis of this approximation on action quality grading was provided in Section 5.1.3.
The physiological constraint of joint angle was a constraint to ensure the action conformed to the human body structure. The joint angle constraint was set for flexion and extension movement, and the constraint range was determined by synthesizing empirical joint angle ranges calculated from 900 randomly sampled videos in our dataset using OpenPose and the published normative values of human joint range of motion [40,41], so as to avoid abnormal posture that violates physiological laws, such as joint hyperextension and reverse bending. Specifically, 10 subjects were randomly selected from each of the three proficiency levels (novice, regular fitness enthusiast, and trained individual) in our dataset, and 30 action videos were randomly sampled from each selected subject, yielding a total of 900 video samples. The OpenPose pose estimation algorithm was applied to extract joint coordinates from each frame, and the joint angles in the sagittal plane (i.e., the included angle between adjacent limb segment vectors) were calculated for the hip, knee, shoulder, and elbow joints. The resulting empirical angle ranges were then cross-validated with established normative values reported by Boone and Azen [40] and Macedo [41] to determine the final constraint boundaries. The specific constraint range was shown in Table 3.
Table 3.
Physiological range of motion for key human joints in the sagittal plane.
It should be particularly noted that the maximum extension angle of the shoulder joint in the sagittal plane is not an independent physiological parameter, but has a significant coupling relationship with the flexion angle of the elbow joint. As pointed out in reference [41], the long head of the biceps brachii spans both the shoulder and elbow joints. When the elbow joint is in an extended state, this muscle is passively stretched, and the tension it generates significantly limits the extension movement of the shoulder joint. Conversely, when the elbow joint is in a flexed state, the muscle tension is released, and the extension range of motion of the shoulder joint increases accordingly. Therefore, the standard measurement specification for human shoulder extension clearly requires the elbow joint to be maintained in a slightly flexed position.
The shoulder extension constraint range (−50°~160°) set in Table 3 of this study is precisely based on the normal values of human joint range of motion under this standard measurement posture, which is consistent with the literature basis for the constraint ranges of other joints. In the core action of this study, the typical posture during the upper limb backward swing preparation phase is significant shoulder extension and synchronous elbow flexion. Our statistical analysis of the full dataset showed that for all samples with shoulder extension angles less than −30°, the corresponding elbow flexion angles were all ≥62°, and 98.7% of the samples had elbow flexion angles ≥ 75°. Therefore, the fixed constraint range adopted in this study is safe and accurate in the core research scenario and will not allow anti-physiological abnormal postures.
The temporal smoothing constraint ensured the fluency and rationality of action in the temporal dimension, aligning with the continuous, non-abrupt nature of real human action. With a video acquisition frame rate of 60 fps, the study imposed a maximum absolute angle change limit of 5° between consecutive frames for all joints. It ensured smooth and uniform joint rotation, free from jitter, distortion, or abrupt posture changes, resulting in temporally continuous and natural ideal trajectories that were consistent with the dynamic evolution of real human actions.
These three types of constraints work synergistically to impose full-dimensional restrictions on the forward kinematic model, covering limb geometric structure, physiological joint motion, and temporal motion patterns. This ensures the generated ideal motion trajectories are physically rigorous, biomechanically rational, and practically executable, providing a reliable physical foundation for subsequent motion deviation quantification and motion quality assessment.
3.3. Deviation Feature Construction
The study termed the kinematically derived joint trajectories from Equations (5)–(7) as kinematic reference trajectories. It quantified the deviation between the tester’s movements and the perfect pattern by calculating frame-by-frame differences between the tester’s joint coordinates and the kinematic reference trajectories. was defined as the coordinate position of joint of the tester at frame , and its corresponding kinematic reference position was denoted as . The Euclidean distance deviation was calculated as shown in Equation (11).
where ( denotes the total number of frames), and τ denotes the normalized temporal position of the movement sequence, ranging from 0 (motion onset) to 1 (motion offset).
The following three deviation features were constructed from different dimensions to comprehensively evaluate action quality from different perspectives.
- (1)
- Peak Deviation (PD)
The PD was used to capture the maximum instantaneous error occurring during the execution of the motion for the specified joint , and its mathematical expression was shown in Equation (12).
- (2)
- Cumulative Deviation Integral (CDI)
The CDI was used to measure the overall cumulative intensity of deviations of the specified joint throughout the entire motion process, and its mathematical expression was shown in Equation (13).
- (3)
- Phase-Weighted Deviation (PWD)
The PWD introduced a temporal weight for the specified joint to emphasize the impact of deviations of this joint during the key phases of motion on the final score, and its mathematical expression was shown in Equation (14). The outcome of the standing long jump was not equally determined by all movement phases. It was primarily influenced by the take-off and landing phases, which were critical for achieving greater distance and a high technical score. In contrast, the preparation and aerial phases allowed for greater postural variability without significantly compromising the result. To integrate this domain knowledge into the assessment model while eliminating subjective bias from manual parameter setting, a grid search optimization strategy was implemented to determine the phase weight function .
A grid search method was employed to optimize the phase weights, with pre-defined candidate value sets for two motion phase categories: core phases with candidate values {0.7, 0.8, 0.9}, and non-core phases with candidate values {0.2, 0.3, 0.4}. All combinations of candidate weights were exhaustively evaluated on the standing long jump dataset, and the combination yielding the highest classification accuracy was selected as the final weight configuration.
The optimized piecewise constant weight function obtained via grid search was presented in Equation (15). In this equation, the take-off phase (corresponding to τ ∈ [0.3, 0.5]) and landing phase (corresponding to τ ∈ [0.8, 1.0]), which were identified as core motion phases, were assigned a weight of 0.8, whereas all other non-core phases were assigned a weight of 0.3.
4. Experiments
4.1. Evaluation Dataset
The proposed method was validated using a self-constructed dedicated dataset. Data collection involved capturing standing long jump motions using a Logitech C920 fixed camera without a wide-angle lens, which had a resolution of 1080 pixels and a frame rate of 60 fps, in an indoor environment with a plain white background and no clutter. The dataset consists of 50 subjects aged 19 to 26 years (mean 22.5 ± 2.1 years), with an equal gender distribution (25 males and 25 females), each performing the specified movement 100 times, yielding a total of 5000 valid samples. The subjects cover diverse physical characteristics (height ranging from 160 to 190 cm and weight ranging from 50 to 80 kg) and sports proficiency levels, including novices, regular fitness enthusiasts, and individuals with long jump or track and field foundations. The optical axis of the camera was positioned parallel to the ground and perpendicular to the direction of movement, placed 5 m from the take-off point at a height of 1 m, to fully record the entire movement from the preparatory posture to landing.
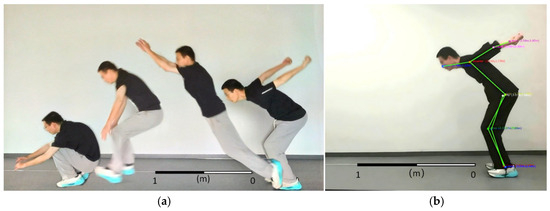
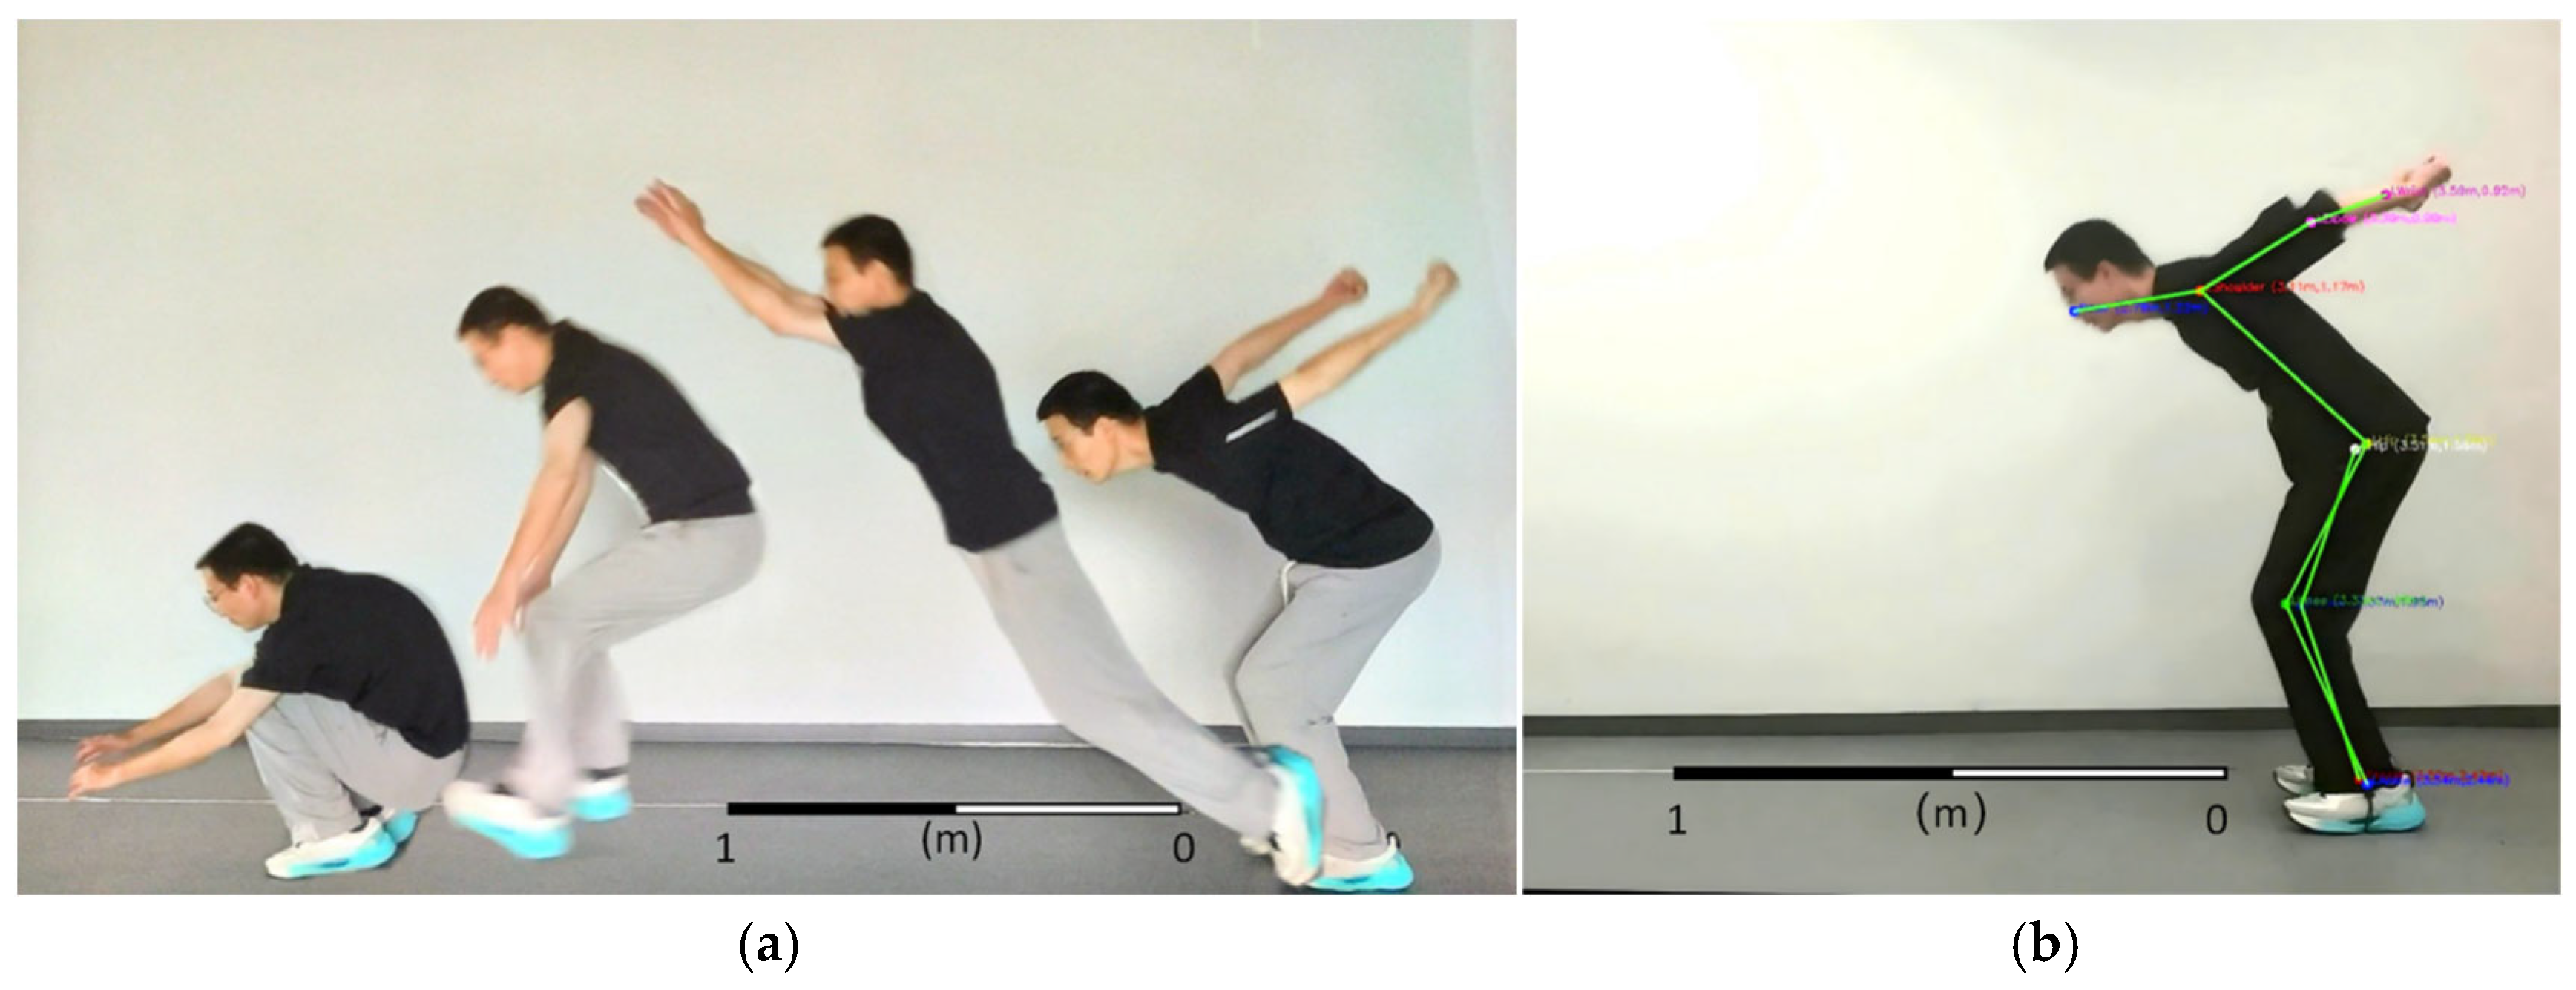
Three physical education coaches with professional referee evaluation experience were invited to independently assess the action quality of each sample into three grades (A, B, or C) without knowing the objective indicators and other coaches’ annotation results. The annotation basis included subjective technical indicators such as movement continuity, take-off explosive force, aerial posture, and landing stability. The Cohen’s Kappa coefficient of the three coaches’ annotation results was calculated to evaluate the annotation consistency. For samples with a Kappa coefficient lower than 0.7, three coaches re-annotated them after joint discussion. Finally, the labels of samples with consistent annotations from the three coaches were directly adopted, and the final labels of inconsistent samples were determined by the majority voting principle. To avoid data leakage and verify the model’s cross-subject generalization ability, the strict leave-one-subject-out cross-validation protocol was adopted. Specifically, the 50 subjects were treated as 50 independent sample groups. In each round of cross-validation, all 4500 samples from 45 subjects were chosen as the training set, while the remaining 500 samples from five subjects are selected as the test set. This procedure was repeated 10 times to ensure that each subject was included in the test set exactly once. The schematic diagram of standing long jump was shown in Figure 3a.
Figure 3.
(a) Schematic diagram of standing long jump; (b) Joint detection diagram of standing long jump.
Given the two-dimensional motion analysis framework adopted in this study, the original joint data were specifically optimized. Since head motion had minimal influence on the jumping movement, all redundant head joints were removed, retaining only the nose joint to represent the head. Furthermore, as left and right body joints overlapped in the 2D view, only the left-side limb joints (shoulder, elbow, wrist, hip, knee, and ankle) were selected for subsequent analysis. This simplification maintained the completeness of kinematic representation while significantly reducing computational cost. The joint detection diagram of standing long jump was presented in Figure 3b.
4.2. Cross-Action Validation Dataset
To further validate the effectiveness and generalizability of the proposed model across different action types, the study collected an additional dataset of squat motions, specifically the overhead squat as defined in the Functional Movement Screen (FMS). The overhead squat is a fundamental movement pattern that assesses lower limb mobility, core stability, and upper body coordination. It differs significantly from the standing long jump in several key aspects:
- (1)
- Movement Pattern: The squat involves vertical weight transfer and controlled descent/ascent, whereas the standing long jump requires horizontal propulsion and explosive take-off;
- (2)
- Joint Coordination: The squat demands greater knee and hip flexion with a relatively upright torso, while the jumping action involves sequential extension of hip, knee, and ankle joints in a ballistic manner;
- (3)
- Key Phase Segmentation: The squat is divided into descent, hold, and ascent phases, whereas the standing long jump consists of preparation, take-off, aerial, and landing phases. The key stages of the standing long jump are the take-off and landing phases, and the key stage of the squat is the hold phase.
These substantial differences provide a more rigorous and comprehensive test of the proposed method’s ability to generalize beyond a single action type.
The squat dataset was collected following the same protocol as the standing long jump dataset, comprising 50 subjects each performing 100 trials for a total of 5000 samples. Quality grades A, B, and C were assigned according to the FMS overhead squat criteria. A score of 3 (Grade A) requires the subject to squat below parallel with heels on the ground, torso parallel to the shins, and the bar held stable overhead. A score of 2 (Grade B) indicates that the same movement pattern can only be achieved with a 5 cm heel lift. A score of 1 (Grade C) is assigned when the subject cannot perform the required depth or trunk stability even with the heel lift. The annotation process followed the same three-step procedure described in Section 4.1, using three certified coaches, Cohen’s Kappa agreement assessment, and majority voting.
By evaluating our method on this squat dataset, we aim to demonstrate that the proposed physics-driven assessment paradigm is not action-specific but generalizable across different movement domains.
4.3. Feature Extraction and Processing
Feature extraction and processing served as the core link between raw motion data and model training, with its effectiveness directly determining the precision of movement quality characterization and the performance of the assessment model. This subsection detailed the feature extraction and optimization procedures performed on the constructed dataset. The workflow was implemented as follows.
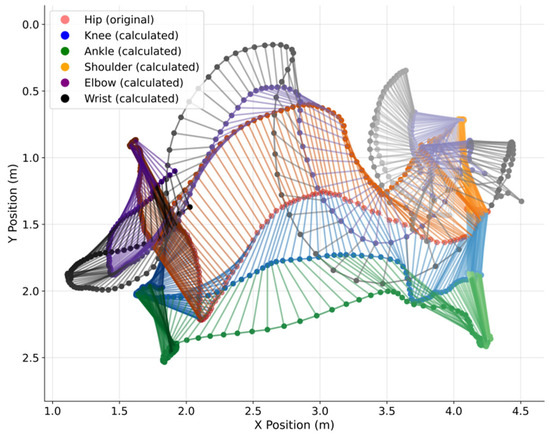
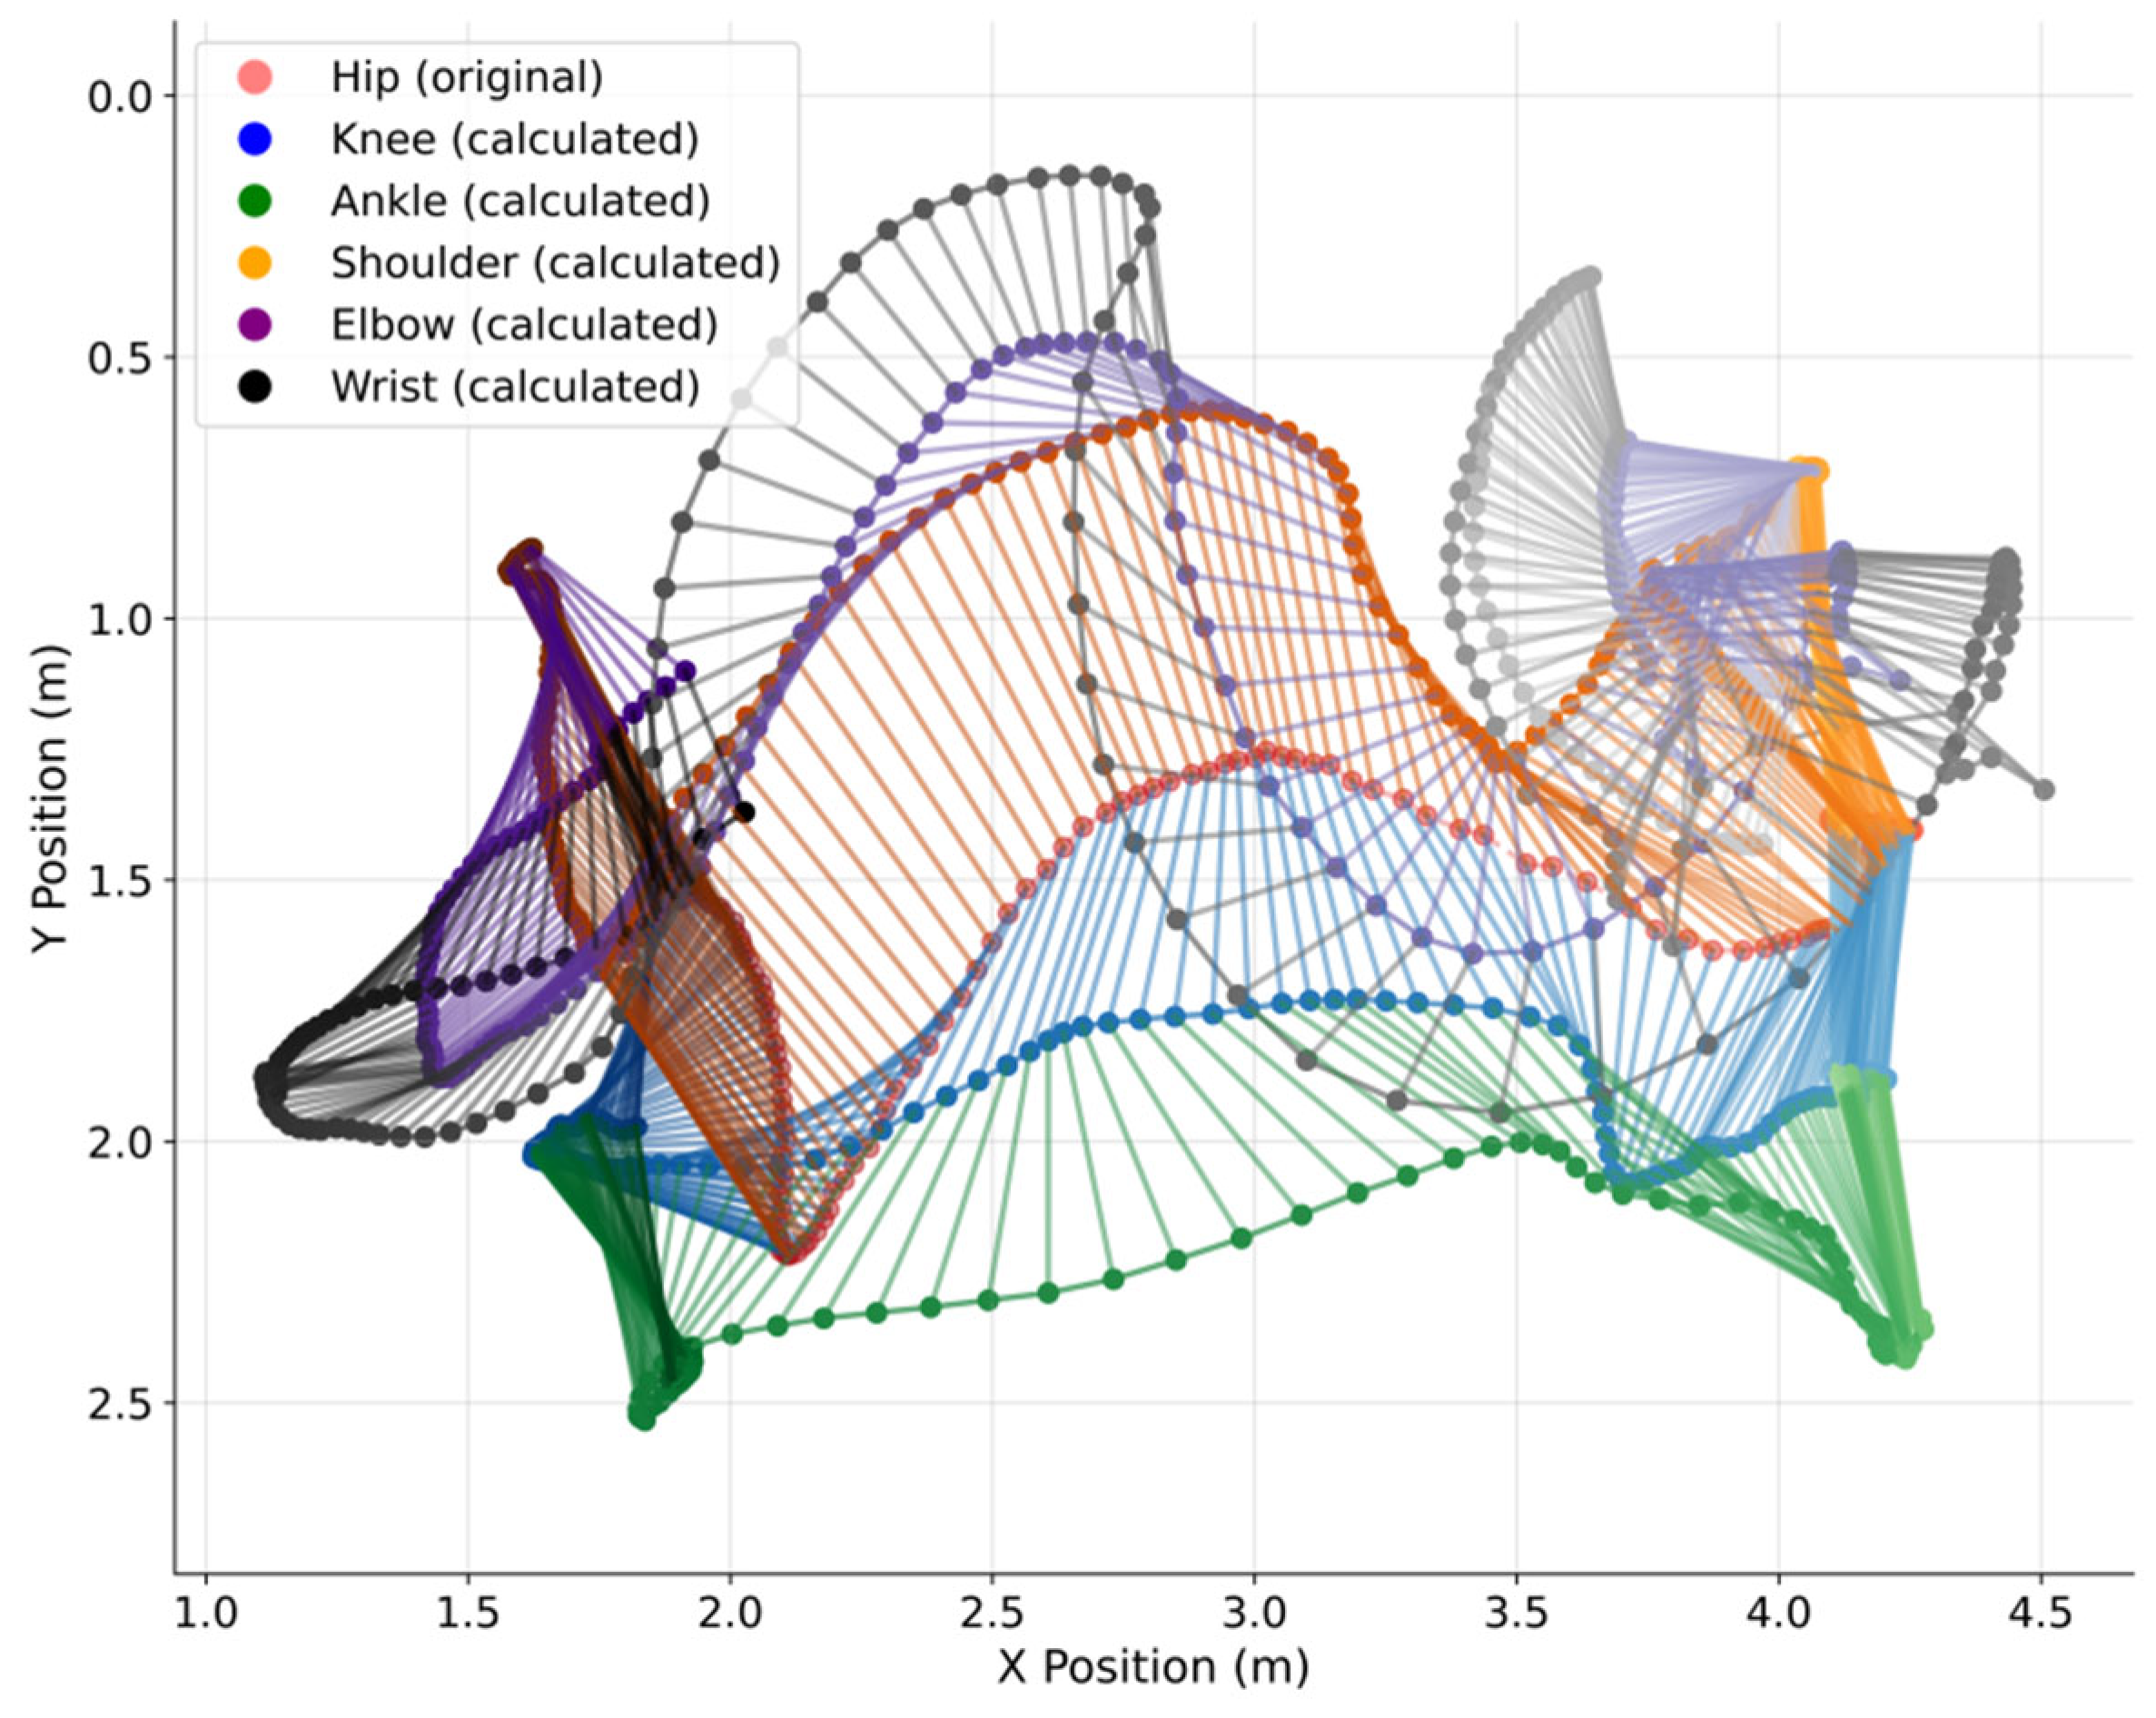
The first step in the workflow involved generating a physically plausible ideal trajectory based on exemplary samples. To overcome the limitations of conventional approaches that directly use observed data as templates, the study extracted kinematic relationships from a top-performance sample. Specifically, the method used the raw left hip joint trajectory as the root node input. It iteratively derived the trajectories of five child joints based strictly on the forward kinematics principles described in Section 3. These child joints included the left shoulder, left elbow, left wrist, left knee, and left ankle, denoted as , where . The trajectories strictly satisfied rigid body constraints, defining a physically self-consistent dynamic model of the ideal movement that provided an objective and interpretable benchmark for subsequent evaluation. The complete kinematic modeling diagram of joint trajectories was shown in Figure 4.
Figure 4.
Joint trajectory diagram of standing long jump after kinematic modeling.
Spatio-temporal alignment between the test trajectory and the kinematic reference trajectory was a key step in ensuring valid comparison. To eliminate the impact of differences in movement speed, the test trajectory was temporally aligned with the ideal trajectory using the DTW algorithm, enabling comparison at unified movement phases. For spatial alignment, the position of the left hip joint in the first frame was set as the reference. The initial position of the test sample was translated to coincide with the kinematic reference trajectory. This process ensured the subsequent deviation purely reflected differences in movement patterns.
Deviation feature calculation extracted quantitative indicators from the aligned trajectories. For each joint, the Euclidean distance between the joint’s position and the kinematic reference position was calculated frame by frame to obtain a deviation sequence . Three core features were extracted based on this sequence: Peak Deviation, , Cumulative Deviation Integral, , and Phase-Weighted Deviation, of each joint. These features quantified the degree of deviation between the joint trajectory and the kinematic reference pattern from three perspectives, namely the extreme value of error magnitude, the accumulation of total error, and the weight of errors in key phases.
Finally, each sample was represented as a 15-dimensional feature vector , expressed as: . The feature vector comprehensively characterized the deviation between the test movement and the ideal physical model from multiple perspectives, providing high-quality input for subsequent machine learning models.
4.4. Model Training and Evaluation
The study employed the Random Forest algorithm to construct a classification model, framing the action quality assessment task as a multi-label classification problem. As an ensemble learning method, Random Forest effectively handled high-dimensional features and mitigated overfitting by building multiple decision trees and aggregating their predictions. The experiment was conducted based on the 15-dimensional feature vectors extracted in the preceding section.
During the model training process, a grid search combined with five-fold cross-validation was used to optimize the key hyperparameters of the Random Forest. The parameters specifically tuned included the number of decision trees, the maximum depth of the trees and the minimum number of samples required to split an internal node. The optimization objective was to maximize the cross-validation accuracy, thereby identifying an optimal set of parameters that effectively captured the complex mapping relationship between the features and action quality grades.
Model performance was evaluated using multiple metrics to comprehensively assess the classification effectiveness. Accuracy was calculated as the ratio of correctly classified samples to the total number of samples, i.e., accuracy = (TP + TN)/(TP + TN + FP + FN), where TP, TN, FP, and FN represent the numbers of true positives, true negatives, false positives, and false negatives, respectively. In addition to accuracy, three class-level metrics were specifically reported: macro-average F1-score, weighted-average F1-score, and Cohen’s Kappa coefficient. The macro-average metric assigned equal importance to each class, making it suitable for evaluating the model’s ability to recognize minority classes. The weighted-average metric accounted for the distribution of samples across classes, providing a better reflection of the model’s overall performance on the dataset. Cohen’s Kappa coefficient excluded the effect of random agreement, offering a more rigorous measure of the consistency between the classifier’s predictions and the true labels.
To ensure statistical reliability, rigorous statistical validation was further conducted. First, the bootstrap method was employed to compute the 95% confidence intervals for all evaluation metrics, including accuracy, macro-average F1, weighted-average F1, and Kappa coefficient. Second, paired t-tests were performed on the repeated cross-validation folds to verify the statistical significance of performance differences between the proposed method and each baseline. A p-value < 0.05 was considered statistically significant.
4.5. Design of Comparative Experiments and Ablation Experiments
To comprehensively evaluate the advantages of the method proposed in this paper, this study systematically designed and conducted comparative experiments and ablation experiments. All experiments were carried out on the same dataset to ensure the comparability of results.
The comparative experiments aimed to evaluate the performance of the proposed pipeline against existing mainstream methods. For comprehensive evaluation, the proposed method was compared with three representative open-source skeleton-based action quality assessment (AQA) models, which are easy to adapt to new datasets. Specifically, three baseline models were selected: (1) an LSTM-based AQA model, (2) a graph convolutional network (GCN)-based AQA model, and (3) a transformer-based AQA model. These three architectures respectively represent the typical applications of recurrent neural networks, graph neural networks, and attention mechanisms in AQA tasks. All baseline models were obtained from public code repositories, with only minor modifications made to adapt to the dataset in this study. To ensure a fair comparison, the same preprocessing pipeline and the same leave-one-subject-out cross-validation protocol were adopted for all methods, using the dataset of this study. Subsequently, systematic performance comparisons between the proposed method and the three baselines were conducted under exactly the same conditions.
The ablation experiments were designed to verify the necessity of the core components in the proposed method. The first ablation experiment removed the kinematic modeling process and instead used the raw joint trajectories as the reference trajectories (denoted as original reference), aiming to explore the importance of kinematic reconstruction for generating physically reasonable and smooth trajectories. The second ablation experiment assessed the impact of the reference trajectory construction method by replacing the ideal trajectory derived from an exemplary sample with an average trajectory computed from multiple expert samples (denoted as average reference). The comparison analyzed whether deriving a kinematic reference motion pattern based on kinematic principles from a perfect sample offered advantages over simply integrating statistical averages from multiple samples. The third ablation experiments were designed to further verify the contribution of the proposed key deviation features. Specifically, each of the three deviation features was removed individually to validate the contribution of each single feature to the final performance. Meanwhile, the synergistic effects of different feature combinations (including PD + CDI, PD + PWD, and CDI + PWD) were also tested.
Through the above experimental design, the proposed action assessment framework could be thoroughly validated in terms of both overall performance and component contributions.
All experiments were conducted on a machine equipped with an NVIDIA GeForce RTX 4060 (8 GB) GPU, Intel Core i7 CPU, and 32 GB RAM. The operating system was Windows 10, with CUDA 11.8 and PyTorch 2.1.0 deployed for computation.
5. Results and Discussion
This section systematically presented and analyzed the experimental results detailed in Section 4. First, the effectiveness of the proposed kinematic modeling was qualitatively verified via visual analysis of the reconstructed trajectories. Then, quantitative evaluations and in-depth analyses were carried out from four core dimensions: sensitivity and robustness, assessment model performance, cross-action generalization capability, and deviation feature characteristics. The experimental results comprehensively validated the feasibility, robustness, physical interpretability, and cross-action adaptability of the proposed action quality assessment framework.
5.1. Sensitivity and Robustness Analysis
This section provides a systematic evaluation of the robustness and sensitivity of the proposed method from two aspects that are essential for practical deployment: the resistance of kinematic trajectory reconstruction to pose estimation noise, and the stability of assessment results under different reference sample selections and subject body type differences.
5.1.1. Robustness to Pose Estimation Noise
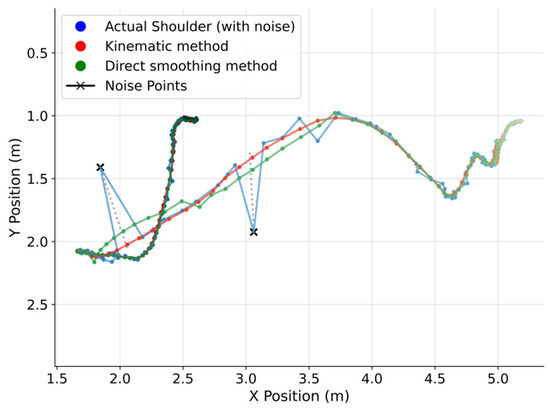
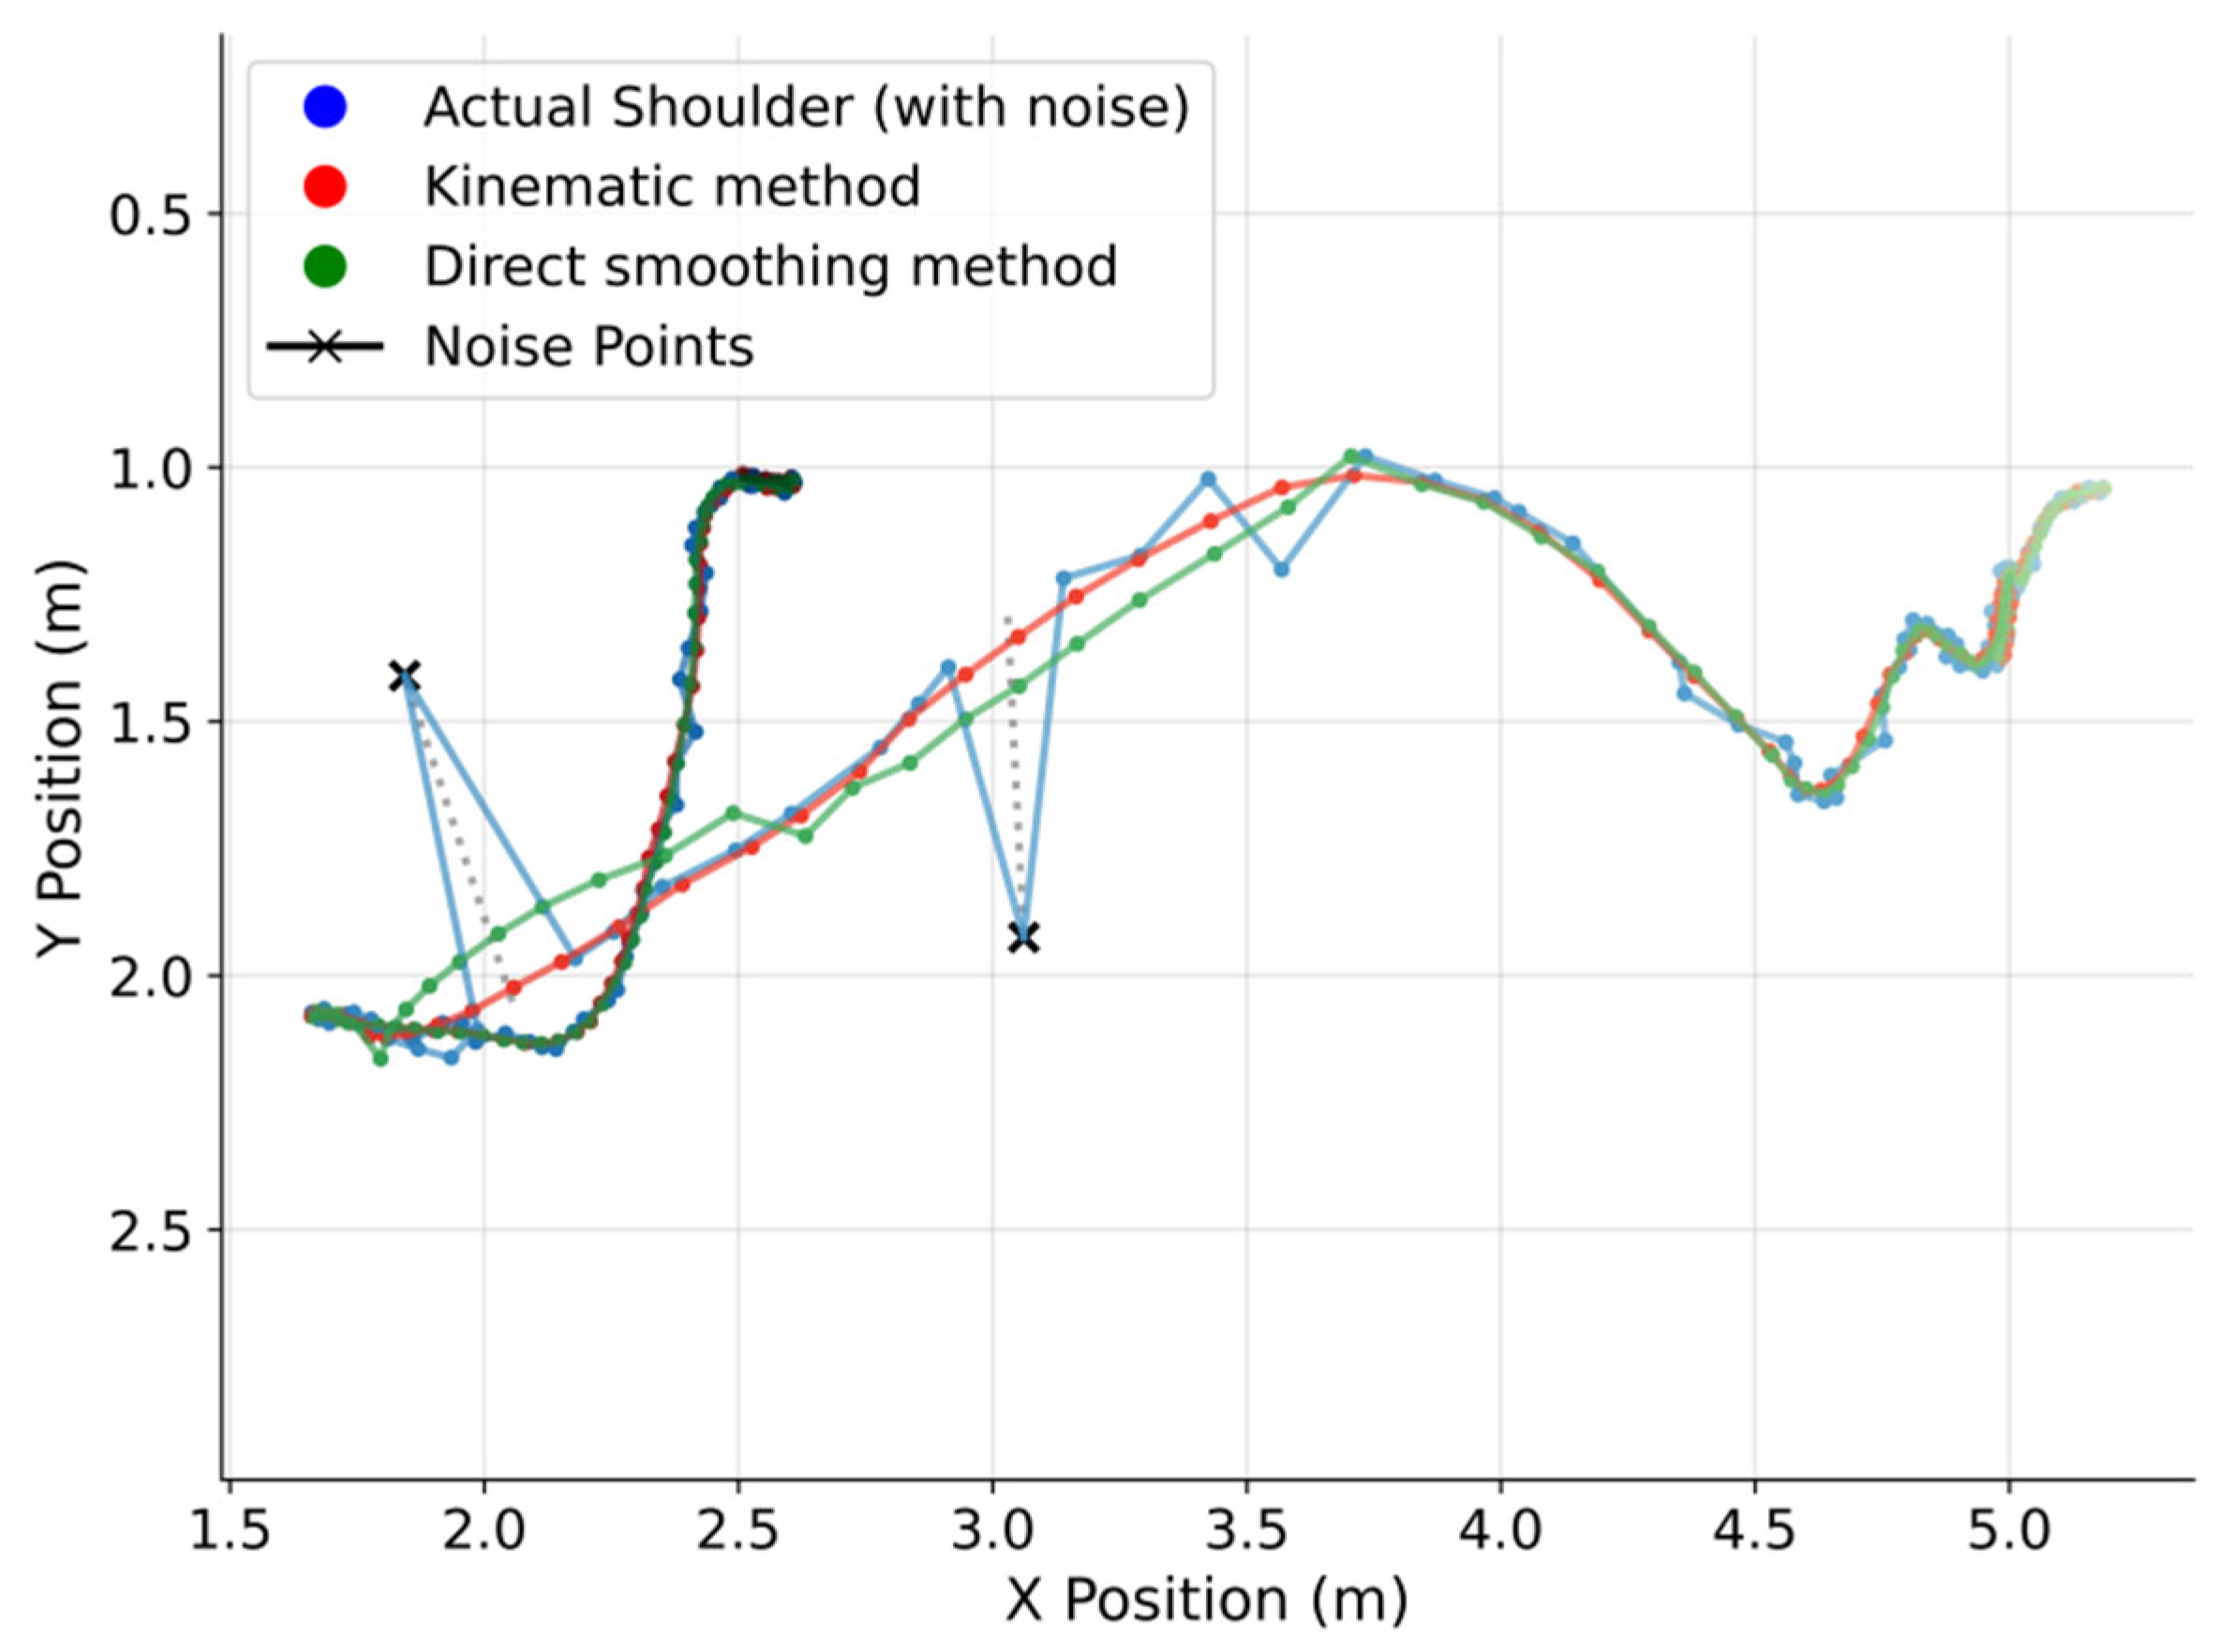
To validate the anti-noise performance of kinematic modeling in trajectory reconstruction, Figure 5 compared three trajectory processing schemes under simulated noise conditions, taking the left shoulder joint as an example: the raw OpenPose joint trajectory, the trajectory after direct smoothing, and the trajectory generated by the proposed kinematic model. Here, the Savitzky–Golay filtering method was selected as a representative direct smoothing approach for comparison.
Figure 5.
Comparison diagram of trajectories obtained through original trajectory, direct smoothing method, and kinematic modeling method.
As shown in Figure 5, the noisy raw OpenPose trajectory exhibited obvious random jitters, which were typical estimation errors introduced by practical pose detection algorithms. Although the Savitzky–Golay filtering method suppressed part of the noise, its smoothing effects is limited, and residual distortions as well as local over-smoothing remain, making it difficult to preserve kinematic rationality. In contrast, the proposed kinematic modeling approach exhibited overwhelming advantages: it effectively eliminated random noise, preserved smooth trajectory profiles, and reconstructed kinematically reasonable trajectories consistent with real human action by strictly enforcing rigid body physical constraints. The experimental results in Figure 5 were consistent with the theoretical error propagation bound derived in Section 3.1, further confirming that the proposed kinematic reconstruction method maintained physical plausibility under moderate noise conditions.
The superiority of the kinematic modeling approach originates from its underlying physical constraint mechanism, which is fundamentally different from conventional mathematical smoothing. By establishing rigid kinematic relationships between parent and child joints, the proposed method reconstructs trajectories that conform to biomechanical principles. As a result, it can recover high-quality motion curves from noisy observation data and laying a reliable foundation for subsequent action quality assessment.
5.1.2. Sensitivity to Reference Sample Selection and Body Type Differences
To analyze the influence of reference sample selection and subject body type differences on assessment performance, all subjects were classified into three body type categories (large, medium, small) based on height and lower limb length characteristics. Optimal high-grade samples were selected from each body type category to construct candidate reference trajectories, and two controlled experiments including same-body-type evaluation and cross-body-type evaluation were carried out.
The same-body-type evaluation scheme adopted reference samples from a given body type to assess test samples within the same-body-type category, while the cross-body-type evaluation scheme applied reference samples from one body type to test samples belonging to other body type categories. The two schemes were used to quantify the stability of model performance under body type matching conditions and the impact of body type discrepancy on assessment outcomes respectively.
Furthermore, an additional experiment was supplemented to eliminate the contingency brought by single reference selection. All A-grade samples in the dataset were separately adopted as independent reference trajectories for evaluation, and the final quantitative results were averaged to obtain stable statistical outcomes. This global average evaluation further reflects the overall generalization of the proposed method against random reference sample choices.
Results presented in Table 4 revealed that performance differences among distinct reference samples were minor in the same-body-type evaluation, which confirmed the robustness of the proposed method to reference sample selection within the same-body-type category. A certain degree of performance degradation was observed in the cross-body-type evaluation, but its performance was still within the acceptable range. Based on these findings, priority was recommended to be given to reference samples with body types similar to target subjects in practical applications.
Table 4.
Performance analysis of different reference samples.
5.1.3. Robustness to Trunk Flexion Condition
To quantitatively evaluate the performance of the rigid body kinematic model under significant trunk flexion, we performed a subgroup analysis on samples with large trunk flexion angles. The trunk flexion angle was defined as the maximum angle between the hip–shoulder vector and the vertical direction during the landing preparation phase. Using the upper quartile of the trunk flexion angles across all samples (approximately 15°) as the threshold, the samples were divided into a high-flexion group (>15°) and low-flexion group (≤15°). The already trained Random Forest model was applied to predict the quality grades for both groups, and the classification accuracies were calculated separately.
The experimental results were summarized in Table 5. The overall accuracy on the full dataset was 0.775. The low-flexion group (3771 samples) achieved an accuracy of 0.779, while the high-flexion group (1229 samples) achieved 0.758, a difference of 2.1 percentage points. The macro-average F1-score was 0.747 for the high-flexion group, lower than the 0.773 observed for the low-flexion group.
Table 5.
Model performance under different trunk flexion levels.
These results indicated that although the theoretical error estimated in Section 3.2 (up to 23 cm) was not negligible in absolute terms, the actual degradation in classification performance was limited (less than 3%). This could be attributed, on the one hand, to the inherent robustness of the proposed deviation features to smooth, bounded systematic errors, and on the other hand, to the fact that the quality grading of standing long jump primarily depended on lower limb performance, with upper limb errors contributing relatively little. Therefore, the proposed model exhibited acceptable practical robustness to trunk flexion.
5.2. Performance of the Evaluation Model
The performance of the proposed action quality assessment framework was quantitatively evaluated on the standing long jump dataset and the cross-action squat dataset. Comparative experiments with mainstream baseline models and ablation experiments of core components were conducted to verify the superiority of the kinematic reconstruction-based method, and cross-action tests were implemented to validate the generalization capability of the proposed paradigm. All experiments adopted the leave-one-subject-out cross-validation protocol, and four metrics (accuracy, macro-average F1-score, weighted-average F1-score, Cohen’s Kappa coefficient) were used for comprehensive evaluation.
5.2.1. Comparison with Mainstream Baseline Methods
Four representative AQA baseline methods were selected for comparative verification, covering both traditional template matching methods and mainstream deep learning architectures, in order to ensure a fair and comprehensive comparison. Specifically, the baseline methods included the dynamic time warping (DTW) algorithm, an LSTM-based deep learning model, a GCN-based deep learning model, and a transformer-based deep learning model.
The proposed kinematic reconstruction-based classification method achieved an accuracy of 0.775, a macro-average F1-score of 0.769, a weighted-average F1-score of 0.734, and a Kappa coefficient of 0.768 on the standing long jump dataset. As shown in Table 6, the proposed method significantly outperformed both the LSTM-based deep learning model and the traditional DTW-based method across all evaluation metrics. Specifically, it improved the classification accuracy by 0.022 (from 0.753 to 0.775) compared with the LSTM model and by 0.177 (from 0.598 to 0.775) compared with the DTW method. The macro-average F1-score was similarly improved by 0.029 (from 0.740 to 0.769) and 0.180 (from 0.589 to 0.769), respectively. Notably, the proposed method achieved competitive performance against the state-of-the-art transformer-based and GCN-based models, while additionally providing kinematics-based physical interpretability that these black-box deep learning methods lack.
Table 6.
Model performance comparison results on the standing long jump dataset.
All reported results in Table 6 are presented as point estimates with corresponding 95% confidence intervals: [0.762, 0.788] for accuracy, [0.755, 0.783] for macro-average F1, [0.721, 0.747] for weighted-average F1, and [0.754, 0.782] for the Kappa coefficient. Paired t-tests confirmed that the performance differences between the proposed method and each baseline were statistically significant (p < 0.05 for all comparisons with DTW, LSTM, GCN, and transformer), further demonstrating the reliability and robustness of the proposed approach.
5.2.2. Ablation Experiments of Core Components
The necessity and effectiveness of the two core components regarding to the proposed method were verified: kinematic reference trajectory construction and multi-dimensional deviation feature fusion. All ablation experiments were conducted on the standing long jump dataset with the same evaluation protocol.
Three different reference trajectory construction schemes were compared to validate the superiority of the proposed kinematic reference trajectory: the proposed kinematic reference trajectory, the raw joint trajectory (original reference) directly extracted by the pose estimation algorithm, and the average trajectory (average reference) calculated from multiple expert samples. The experimental results are presented in Table 7.
Table 7.
Ablation results of different reference trajectory construction schemes.
According to Table 7, the proposed kinematic reference trajectory achieved the optimal performance across all evaluation metrics. The original reference scheme suffered from severe pose estimation noise and trajectory distortion, leading to a significant performance drop, with a 9.3% decrease in accuracy compared with the proposed method. The average reference scheme partially suppressed noise through statistical averaging, but it diluted the key kinematic characteristics of optimal movements, resulting in lower performance than the proposed method, with a 2.4% decrease in accuracy. These results verified that the forward kinematics-based trajectory with rigid body constraints and physical rationality was more suitable as an evaluation benchmark for AQA.
The contribution of three designed deviation features, namely Peak Deviation (PD), Cumulative Deviation Integral (CDI), and Phase-Weighted Deviation (PWD), was verified through single-feature ablation and feature combination tests. The experimental results are shown in Table 8.
Table 8.
Ablation results of multi-dimensional deviation feature combinations.
Among the single-feature schemes, the PD feature achieved the highest performance, as it captured the maximum instantaneous error of movements, which was a key indicator of movement quality. The combination of any two features improved performance compared with single-feature schemes, and the fusion of all three features obtained the optimal result. This demonstrated that the three features complemented each other in characterizing movement quality from the perspectives of instantaneous error, cumulative error, and key phase weighting, and their synergistic effect significantly enhanced the evaluation accuracy of the model.
5.2.3. Cross-Action Generalization Performance Validation
To verify the generalization capability of the proposed method across different action types, the model was tested on the overhead squat dataset with the same experimental protocol. The cross-action performance results are presented in Table 9.
Table 9.
Cross-action generalization performance of the proposed method.
The proposed method maintained high evaluation accuracy on the overhead squat dataset, with an accuracy of 0.762 and a Kappa coefficient of 0.759. The performance degradation was less than 1.3% compared with that on the standing long jump dataset. The results indicated that the kinematic reconstruction and deviation analysis framework could adapt to different movement patterns and key motion phases, which verified the cross-action generalization capability of the proposed method. Unlike deep learning models that required retraining for new action types, the proposed method could be directly applied to the overhead squat dataset without additional training, which further demonstrated its practical applicability in real-world AQA scenarios.
5.3. Deviation Feature Analysis
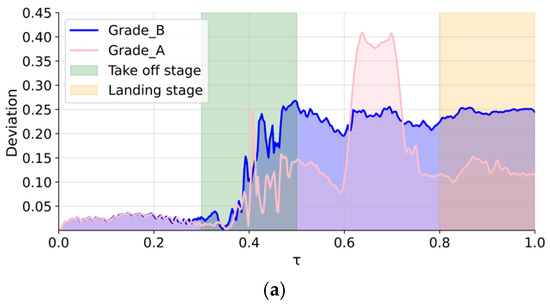
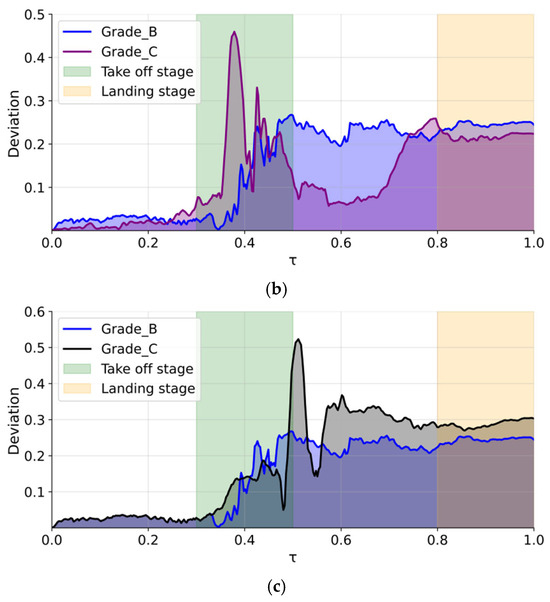
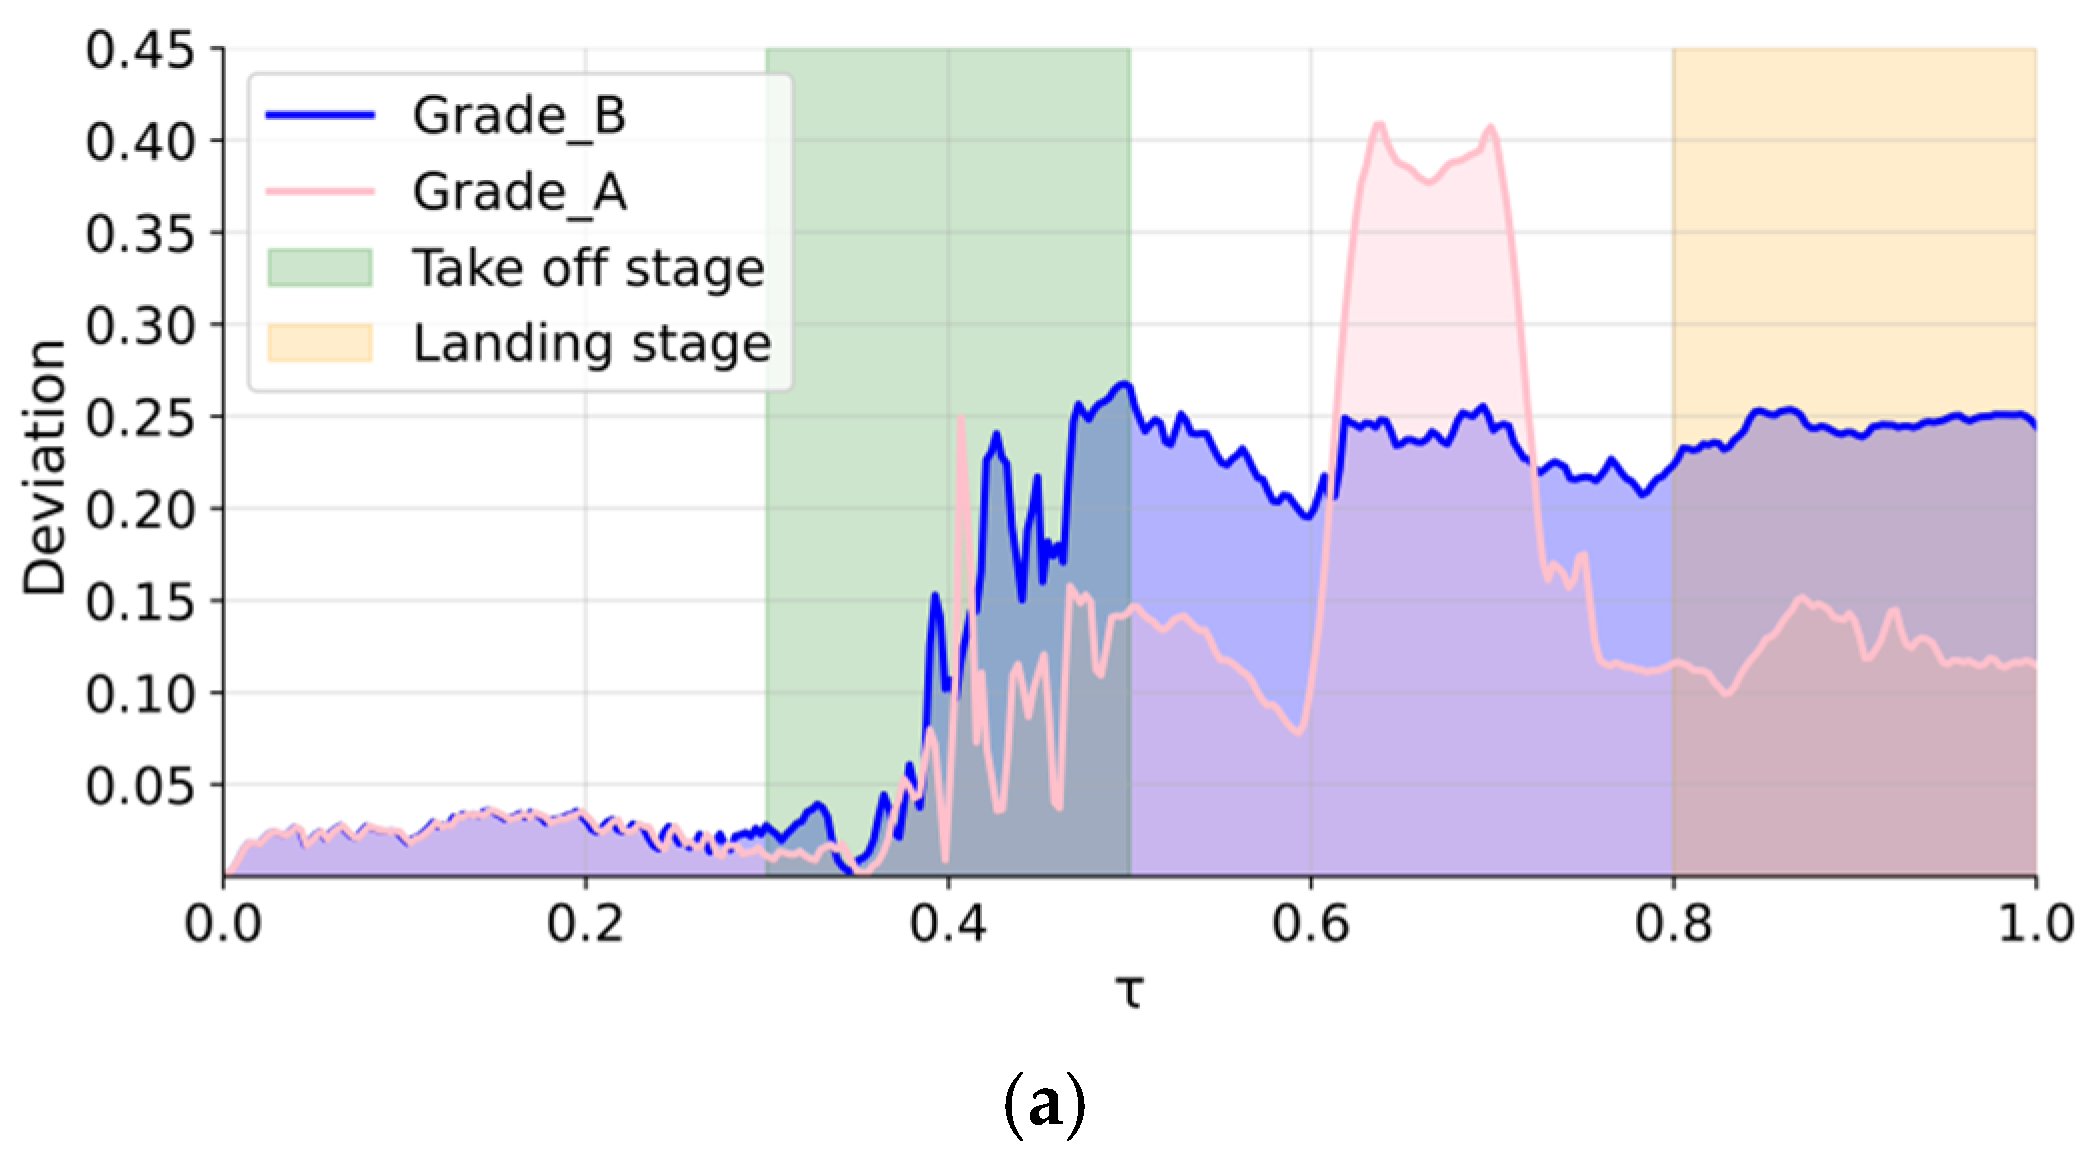
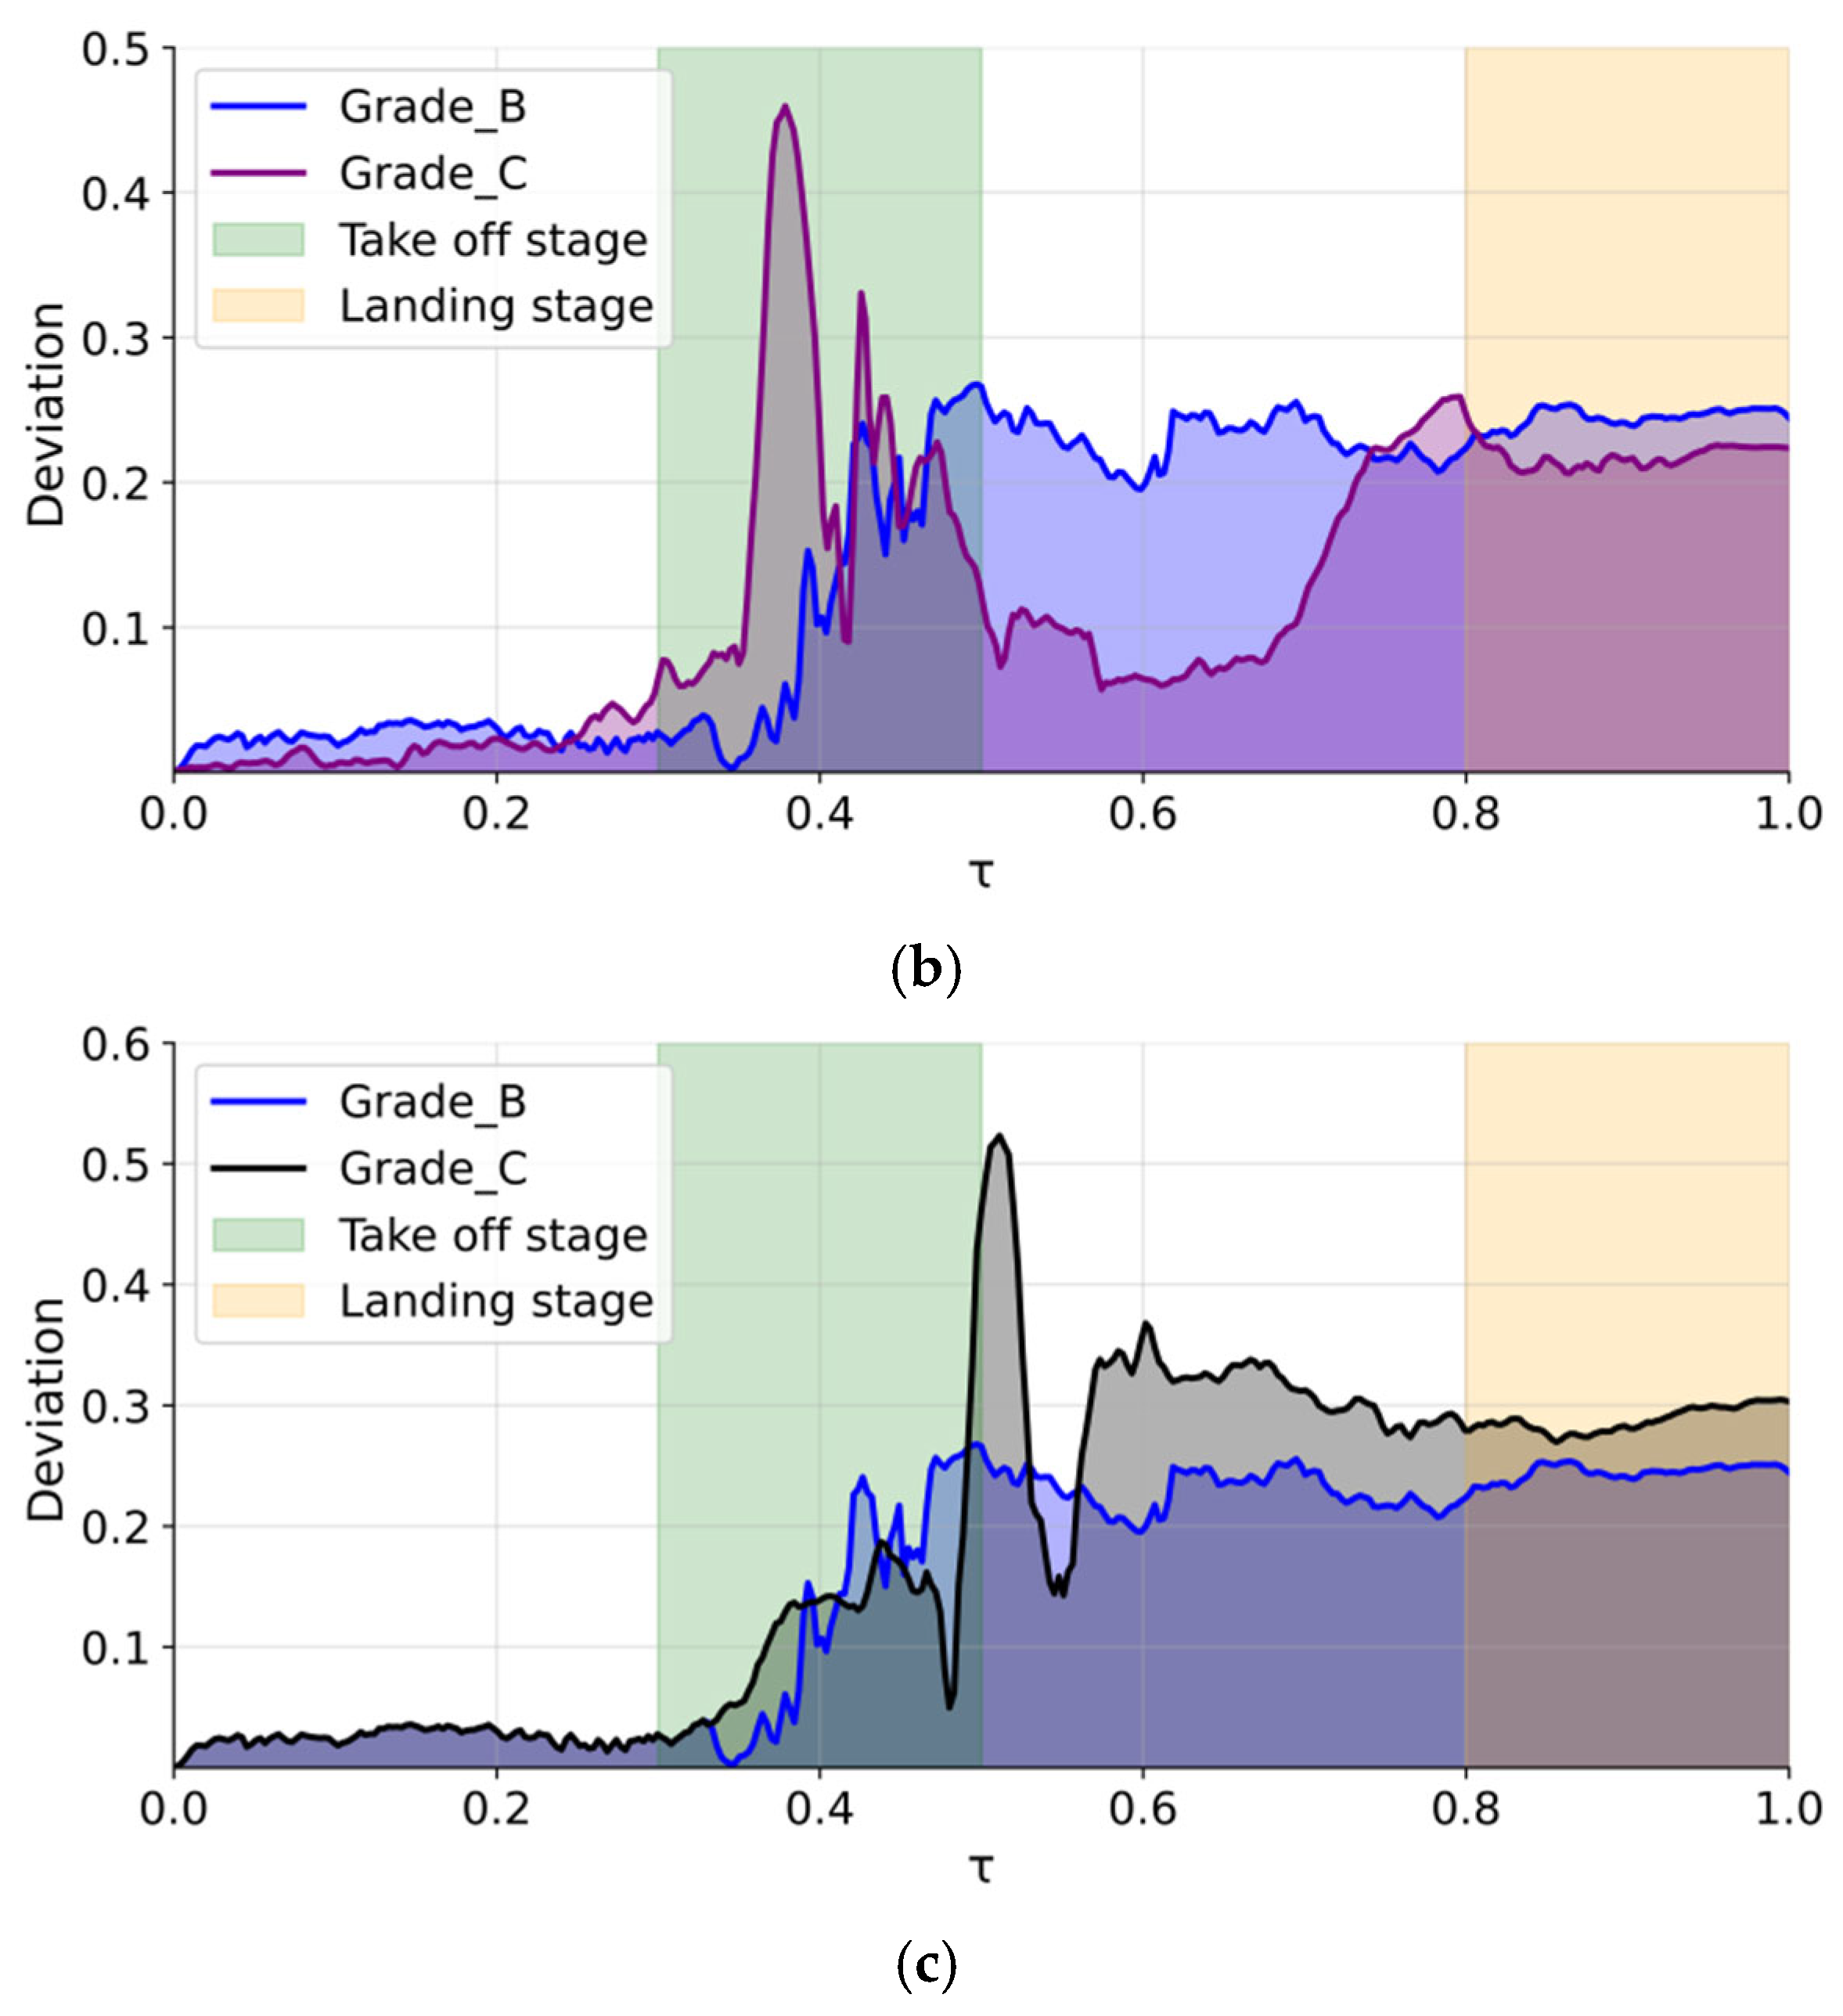
To gain deeper insights into the decision-making mechanism of the model and verify its consistency with human expert assessment logic, the study analyzed the characteristic deviation patterns in correctly classified cases. Figure 6 showed a comparison of the deviation features at the ankle joint between Grade B, Grade A and Grade C samples.
Figure 6.
(a) The deviation comparison between the grade B sample and the grade A sample; (b) the deviation comparison between the grade B sample and the grade C sample; (c) the deviation comparison between the grade B sample and the grade C sample.
As shown in Figure 6a, the Grade A sample exhibited a highly optimized phase control ability. Although its deviation in some non-critical phases was higher than that of the Grade B sample, its deviation values were significantly lower than those of the Grade B sample in key phases that determined technical effectiveness, such as take-off and landing. This finding highlighted the design value of the PWD feature: its weighting mechanism effectively emphasized the importance of critical phases, thereby enabling the model to identify high-quality movements that demonstrated excellence in core technical components despite minor imperfections in non-critical phases.
The results in Figure 6b further illustrated the significance of the PD. It could be observed that the deviation curve of the Grade C sample exhibited sharp and high-amplitude abnormal peaks within the key phase interval, while such peaks did not appear in the Grade A and Grade B samples. It indicated that the PD effectively captured severe, transient technical errors during action execution, which often served as decisive factors leading to degraded action quality.
Figure 6c presented the importance of the CDI. During the key phases, the instantaneous deviation amplitudes of the Grade B sample and the Grade C sample might be similar; however, the Grade C sample exhibited more sustained and frequent minor deviations throughout the entire motion cycle, resulting in a much higher integral value of its squared deviation than that of the Grade B sample. Therefore, the CDI feature captured the overall stability of the action, effectively distinguishing between actions that were locally flawed yet globally controllable (Grade B) and those that were globally unsteady with continuously accumulating errors (Grade C).
The comprehensive analysis showed that the three features quantify the action quality from the three orthogonal perspectives of key phase performance, maximum instantaneous deviation and overall error accumulation, which together constitute a comprehensive and robust evaluation system.
6. Conclusions
This study proposed and validated an action quality assessment method based on kinematic reconstruction and deviation analysis. By deriving a physically consistent kinematic trajectory from an exemplary sample as the evaluation benchmark, the method further calculated deviation features between the test sample and the benchmark and finally adopted a Random Forest model to achieve automated grading. Experimental results showed that this method outperformed the traditional DTW template matching method in indicators such as accuracy, F1-score, and Kappa coefficient. Moreover, ablation experiments confirmed the necessity of kinematic modeling in generating kinematic reference trajectories and its superiority over simple data averaging.
The limitations of this study were mainly reflected in the following five aspects: First, the construction of the kinematic trajectory relied on a single sample. Although it ensured kinematic consistency, its generalization ability might be constrained by the specific individual’s movement style. Second, the weight function in the PWD feature was set based on the prior knowledge of standing long jumps. While it highlighted the importance of critical phases, it lacked adaptive adjustment capability and might not meet the requirements of different sports events. Third, the study was limited to 2D motion analysis and failed to utilize 3D spatial information, which restricts the ability to fully characterize complex motion patterns. Fourth, the independent fixed joint angle constraints currently adopted do not consider the biomechanical coupling relationships between joints, especially the dependence of shoulder extension angle on elbow flexion angle. Although this treatment is reasonable and accurate in the core action scenarios of this study, it may reduce the rigor of kinematic modeling for actions involving complex upper limb postures. Finally, when the trunk undergoes large flexion, the constant trunk length assumption introduced a systematic error. Although this error mainly affected the upper limb joint trajectories and had limited impact on the core joints (hip, knee, ankle) used for evaluation in our dataset, this aspect remained a direction for improvement.
To address the limitations, future research will explore the following five directions in depth. First, the study will investigate a multi-expert fusion paradigm for kinematic trajectory generation, employing clustering analysis or generative techniques to derive more generalized standard movement patterns and reduce reliance on a single reference sample. Second, the study will develop adaptive weight learning algorithms that automatically optimize phase-specific importance weights in a data-driven manner, enabling the PWD feature to adapt to diverse sports disciplines. Third, the study will explore multi-view video-based 3D pose reconstruction and evaluation pipelines. By incorporating 3D kinematic constraints, the approach will achieve more comprehensive and precise action quantification, ultimately contributing to a more robust automated action assessment system. Fourth, introduce a multi-joint coupling constraint mechanism and establish a kinematic model that considers the biomechanical dependencies between joints, especially improving the shoulder–elbow coupling constraint, to enhance the model’s adaptability to complex upper limb movements. Finally, the study will explore the introduction of a flexible trunk model or a multi-segment spine representation to eliminate or further reduce the systematic error introduced by this assumption, thereby improving the kinematic reconstruction accuracy for movements with large trunk flexion.
Author Contributions
Conceptualization, H.H. and Y.L. (Yuanyuan Liu); methodology, F.Z. and Y.L. (Yingjie Liao); software, X.G.; validation, X.G., Y.L. (Yingjie Liao) and F.Z.; formal analysis, X.G.; investigation, X.G.; resources, H.H. and Y.L. (Yuanyuan Liu); data curation, X.G.; writing—original draft preparation, X.G.; writing—review and editing, F.Z. and H.H.; visualization, X.G.; supervision, Y.L. (Yuanyuan Liu) and Y.L. (Yingjie Liao); project administration, H.H.; funding acquisition, H.H. and Y.L. (Yuanyuan Liu). All authors have read and agreed to the published version of the manuscript.
Funding
This research received no external funding.
Institutional Review Board Statement
Not applicable.
Informed Consent Statement
Not applicable.
Data Availability Statement
The datasets used in this study are not publicly available, as they were collected and owned by Shanghai Ocean University and are subject to institutional data access restrictions.
Conflicts of Interest
The authors declare no conflicts of interest.
References
- Zhou, K.; Cai, R.; Wang, L.; Hubert, S.; Liang, X. A Comprehensive Survey of Action Quality Assessment: Method and Benchmark. arXiv 2024, arXiv:2412.11149. [Google Scholar]
- Qiu, Y.; Wang, J.; Jin, Z.; Chen, H.; Zhang, M.; Guo, L. Pose-guided matching based on deep learning for assessing quality of action on rehabilitation training. Biomed. Signal Process. Control 2022, 72, 103323. [Google Scholar] [CrossRef] [Scilit]
- Lei, Q.; Du, J.; Zhang, H.; Ye, S.; Chen, D. A Survey of Vision-Based Human Action Evaluation Methods. Sensors 2019, 19, 4129. [Google Scholar] [CrossRef] [Scilit] [PubMed]
- Lei, Q.; Li, H.; Zhang, H.; Du, J.; Gao, S. Multi-skeleton structures graph convolutional network for action quality assessment in long videos. Appl. Intell. 2023, 53, 21692–21705. [Google Scholar] [CrossRef] [Scilit]
- Wang, X.; Li, J.; Hu, H. Skeleton-Based Action Quality Assessment via Partially Connected LSTM with Triplet Losses. In Chinese Conference on Pattern Recognition and Computer Vision (PRCV); Springer Nature: Cham, Switzerland, 2022; pp. 220–232. [Google Scholar]
- Cao, Z.; Simon, T.; Wei, S.; Sheikh, Y. Realtime Multi-Person 2D Pose Estimation Using Part Affinity Fields. In Proceedings of the IEEE Conference on Computer Vision and Pattern Recognition, Honolulu, HI, USA, 21–26 July 2017; IEEE: Piscataway, NJ, USA, 2017; pp. 7291–7299. [Google Scholar]
- Fang, H.; Xie, S.; Tai, Y.; Lu, C. RMPE: Regional Multi-Person Pose Estimation. In Proceedings of the IEEE International Conference on Computer Vision (ICCV), Venice, Italy, 22–29 October 2017; pp. 2334–2343. [Google Scholar]
- Wei, S.; Ramakrishna, V.; Kanade, T.; Sheikh, Y. Convolutional pose machines. In Proceedings of the IEEE Conference on Computer Vision and Pattern Recognition, Las Vegas, NV, USA, 27–30 June 2016; IEEE: Piscataway, NJ, USA, 2016; pp. 4724–4732. [Google Scholar]
- Sun, K.; Xiao, B.; Liu, D.; Wang, J. Deep high-resolution representation learning for human pose estimation. In Proceedings of the IEEE/CVF Conference on Computer Vision and Pattern Recognition, Long Beach, CA, USA, 16–20 June 2019; IEEE: Piscataway, NJ, USA, 2019; pp. 5693–5703. [Google Scholar]
- Liu, J.; Hou, Q.; Cheng, M.; Wang, C.; Feng, J. Improving convolutional networks with self-calibrated convolutions. In Proceedings of the IEEE/CVF Conference on Computer Vision and Pattern Recognition, Seattle, WA, USA, 13–19 June 2020; IEEE: Piscataway, NJ, USA, 2020; pp. 10096–10105. [Google Scholar]
- Li, H.; Lei, Q.; Zhang, H.; Du, J.; Gao, S. Skeleton-based deep pose feature learning for action quality assessment on figure skating videos. J. Vis. Commun. Image Represent. 2022, 89, 103625. [Google Scholar] [CrossRef] [Scilit]
- Wang, S.; Yang, D.; Zhai, P.; Yu, Q.; Suo, T.; Sun, Z.; Li, K.; Zhang, L. A survey of video-based action quality assessment. In Proceedings of the 2021 International Conference on Networking Systems of AI, Shanghai, China, 19–20 November 2021; IEEE: Piscataway, NJ, USA, 2021; pp. 1–9. [Google Scholar]
- Wang, X.; Li, P.; Shen, Y. Attention-driven multimodal alignment for long-term action quality assessment. Appl. Soft Comput. 2025, 183, 113649. [Google Scholar] [CrossRef] [Scilit]
- Xu, J.; Yin, S.; Peng, Y. Human-centric fine-grained action quality assessment. IEEE Trans. Pattern Anal. Mach. Intell. 2025, 47, 6242–6255. [Google Scholar] [PubMed]
- Zhang, Y.; Li, X.; Chai, W.; Yan, C.; Wang, W.; Wang, G. Pose-guided transformer for fine-grained action quality assessment. IEEE Trans. Circuits Syst. Video Technol. 2025, 35, 7940–7952. [Google Scholar]
- Moodley, T.; van der Haar, D. I3D-AE-LSTM: Combining action representations using a 2-stream autoencoder for action quality assessment. Expert Syst. Appl. 2025, 278, 127368. [Google Scholar]
- Zeng, L.; Zheng, W. Multimodal action quality assessment. IEEE Trans. Image Process. 2024, 33, 1600–1613. [Google Scholar] [CrossRef] [Scilit] [PubMed]
- Liu, J.; Wang, H.; Stawarz, K.; Li, S.; Fu, Y.; Liu, H. Vision-based human action quality assessment: A systematic review. Expert Syst. Appl. 2025, 263, 125642. [Google Scholar]
- Gao, H.; Yu, S.; Iqbal, M.; Guizani, M. ResFNN: Residual Structure-Based Feedforward Neural Network for Action Quality Assessment in Sports Consumer Electronics. IEEE Trans. Consum. Electron. 2024, 70, 6653–6663. [Google Scholar]
- Zhou, K.; Ma, Y.; Shum, H.; Liang, X. Hierarchical Graph Convolutional Networks for Action Quality Assessment. IEEE Trans. Circuits Syst. Video Technol. 2023, 33, 7749–7763. [Google Scholar]
- Davis, J.; Bobick, A. The Representation and Recognition of Human Movement Using Temporal Templates. In Proceedings of the Computer Vision and Pattern Recognition, San Juan, PR, USA, 17–19 June 1997; IEEE Computer Society: Los Alamitos, CA, USA, 1997; pp. 928–934. [Google Scholar]
- Ahad, M.; Tan, J.; Kim, H.; Ishikawa, S. Motion history image: Its variants and applications. Mach. Vis. Appl. 2012, 23, 255–281. [Google Scholar]
- Parmar, P.; Morris, B.T. What and How Well You Performed? A Multitask Learning Approach to Action Quality Assessment. In Proceedings of the IEEE/CVF Conference on Computer Vision and Pattern Recognition (CVPR), Long Beach, CA, USA, 16–20 June 2019; pp. 304–313. [Google Scholar]
- Parmar, P.; Morris, B.T. Action Quality Assessment Across Multiple Actions. In Proceedings of the IEEE Winter Conference on Applications of Computer Vision (WACV), Waikoloa Village, HI, USA, 7–11 January 2019; pp. 1468–1476. [Google Scholar]
- Parmar, P.; Morris, B.T. Learning To Score Olympic Events. In Proceedings of the IEEE Conference on Computer Vision and Pattern Recognition Workshops (CVPRW), Honolulu, HI, USA, 21–26 July 2017. [Google Scholar]
- Su, C. Personal Rehabilitation Exercise Assistant with Kinect and Dynamic Time Warping. Int. J. Inf. Educ. Technol. 2013, 3, 448. [Google Scholar] [CrossRef] [Scilit]
- Hou, S.; Xia, A.; Lu, Z.; Yang, W. Interpretable two-stage action quality assessment via 3D human pose estimation and dynamic feature alignment. Vis. Comput. 2025, 41, 11463–11478. [Google Scholar] [CrossRef] [Scilit]
- Lei, Q.; Zhang, H.; Du, J.; Hsiao, T.; Chen, C. Learning effective skeletal representations on RGB video for fine-grained human action quality assessment. Electronics 2020, 9, 568. [Google Scholar] [CrossRef] [Scilit]
- Tao, L.; Paiement, A.; Damen, D.; Mirmehdi, M.; Hannuna, S.; Camplani, M.; Burghardt, T.; Craddock, I. A Comparative Study of Pose Representation and Dynamics Modelling for Online Motion Quality Assessment. Comput. Vis. Image Underst. 2016, 148, 136–152. [Google Scholar] [CrossRef] [Scilit]
- Som, A.; Anirudh, R.; Wang, Q.; Turaga, P. Riemannian Geometric Approaches for Measuring Movement Quality. In Proceedings of the IEEE Conference on Computer Vision and Pattern Recognition Workshops, Las Vegas, NV, USA, 26 June–1 July 2016; IEEE Computer Society: Los Alamitos, CA, USA, 2016; pp. 43–50. [Google Scholar]
- Stone, E.; Skubic, M.; Back, J. Automated Health Alerts from Kinect-Based In-Home Gait Measurements. In Proceedings of the 2014 36th Annual International Conference of the IEEE Engineering in Medicine and Biology Society, Chicago, IL, USA, 26–30 August 2014; IEEE: Piscataway, NJ, USA, 2014; pp. 2961–2964. [Google Scholar]
- Rocha, A.; Choupina, H.; Fernandes, J.; Rosas, M.; Vaz, R.; Cunha, J. Kinect V2 Based System for Parkinson’s Disease Assessment. In Proceedings of the 2015 37th Annual International Conference of the IEEE Engineering in Medicine and Biology Society, Milan, Italy, 25–29 August 2015; IEEE: Piscataway, NJ, USA, 2015; pp. 1279–1282. [Google Scholar]
- Ťupa, O.; Procházka, A.; Vyšata, O.; Schätz, M.; Mareš, J.; Vališ, M.; Mařík, V. Motion Tracking and Gait Feature Estimation for Recognising Parkinson’s Disease Using MS Kinect. Biomed. Eng. Online 2015, 14, 97. [Google Scholar] [CrossRef] [Scilit] [PubMed]
- Bogo, F.; Kanazawa, A.; Lassner, C.; Gehler, P.; Romero, J.; Black, M.J. Keep It SMPL: Automatic Estimation of 3D Human Pose and Shape from a Single Image. In Proceedings of the European Conference on Computer Vision (ECCV), Amsterdam, The Netherlands, 11–14 October 2016; pp. 12–17. [Google Scholar]
- Kanazawa, A.; Black, M.J.; Jacobs, D.W.; Malik, J. End-to-End Recovery of Human Shape and Pose. In Proceedings of the IEEE Conference on Computer Vision and Pattern Recognition (CVPR), Salt Lake City, UT, USA, 18–22 June 2018; pp. 7122–7131. [Google Scholar]
- Kocabas, M.; Athanasiou, N.; Black, M.J. VIBE: Video Inference for Human Body Pose and Shape Estimation. In Proceedings of the IEEE/CVF Conference on Computer Vision and Pattern Recognition (CVPR), Seattle, WA, USA, 13–19 June 2020; pp. 5252–5262. [Google Scholar]
- Choi, H.; Moon, G.; Lee, K.M. Pose2Mesh: Graph Convolutional Network for 3D Human Pose and Mesh Recovery from a 2D Human Pose. In Proceedings of the European Conference on Computer Vision (ECCV), Glasgow, UK, 23–28 August 2020; pp. 769–787. [Google Scholar]
- Pavllo, D.; Feichtenhofer, C.; Grangier, D.; Auli, M. 3D Human Pose Estimation in Video with Temporal Convolutions and Semi-Supervised Training. In Proceedings of the IEEE/CVF Conference on Computer Vision and Pattern Recognition (CVPR), Long Beach, CA, USA, 16–20 June 2019; pp. 7753–7762. [Google Scholar]
- Xie, K.; Wang, T.; Iqbal, U.; Guo, Y.; Fidler, S.; Shkurti, F. Physics-Based Human Motion Estimation and Synthesis from Videos. In Proceedings of the IEEE/CVF International Conference on Computer Vision (ICCV), Montreal, QC, Canada, 11–17 October 2021. [Google Scholar]
- Boone, D.C.; Azen, S.P. Normal Range of Motion of Joints in Male Subjects. J. Bone Jt. Surg. 1979, 61, 756–759. [Google Scholar] [CrossRef] [Scilit]
- Macedo, L.G. Normal Range of Motion of Joints in Female Subjects in Different Age Groups. Master’s Thesis, University of Alberta, Edmonton, AB, Canada, 2007. [Google Scholar]

Disclaimer/Publisher’s Note: The statements, opinions and data contained in all publications are solely those of the individual author(s) and contributor(s) and not of MDPI and/or the editor(s). MDPI and/or the editor(s) disclaim responsibility for any injury to people or property resulting from any ideas, methods, instructions or products referred to in the content. |
© 2026 by the authors. Licensee MDPI, Basel, Switzerland. This article is an open access article distributed under the terms and conditions of the Creative Commons Attribution (CC BY) license.