


Abstract
This article examines the challenges and solutions related to frequency deviation (FD) in Continental Europe’s electric power systems, focusing on the effectiveness of Combined Cycle Power Blocks (CCPBs) in managing these deviations. Since 2023, persistent and significant frequency deviations (FDs) have been a concern, leading to the establishment of a working group by the ENTSO-E System Operation Committee to develop a robust action plan. The study highlights the necessity of employing advanced control strategies in CCPB to enhance frequency quality and ensure stable system operation. It delves into the mechanisms of Automatic Generation Control (AGC) to maintain power balance and frequency stability through primary and secondary controls. These controls are critical in adapting to real-time changes in load and generation, thereby securing the power system’s reliability and efficiency. The paper also discusses the implementation of Frequency Containment Reserves (FCRs) and their role in stabilizing system frequency following disturbances by automatically adjusting power outputs. Additionally, the research explores the integration of the Baltic States into the European Union (EU) energy market, aiming for enhanced system security and reliability. After all, the Baltic States achieved full synchronization with the Continental Europe Synchronous Area (CESA). The outcomes confirm the suitability of the investigated CCPB for participation in AGC and FCR services under interconnected system operation.
1. Introduction
Considering the events that occurred on January 10, 2019, and the fact that since 2023, Continental Europe (CE) has been experiencing consistent and repeated frequency deviations (FDs), the ENTSO-E System Operation Committee and Market Committee decided to form a working group to examine all circumstances leading to FD and to develop an action plan to manage FD to prevent further degradation of frequency quality.
This article investigates methods for reducing frequency deviations and improving frequency quality, along with the measures for its reduction. The study is based on defining common FD goals and applying them to any synchronous Electric Power System (EPS). It also sets quality requirements for each Load Frequency Controller (LFC) block, which must assess the need to undertake FD reduction and quality assurance measures, for which these energy blocks are responsible. Depending on technological and market conditions, the reduction and improvement measures may differ for each Transmission System Operator (TSO), but their common goal is to reduce the individual contribution of LFC blocks to an acceptable, regulated, and standardized quality and safety level for the overall energy system. The article explains why the proposed method might be suitable for all generating units participating in frequency control.
The article presents an analysis model corresponding to generator parameters and capabilities and a trading market-based FD analysis. Possible quality improvement measures and further steps for FD reduction are discussed. The article formulates and highlights the following issues: (1) What influences the occurrence of FD? (2) What are the conditions for primary automatic generation control? (3) How is automatic generation management coordination carried out in the joint EPS? (4) What are the conditions for setting active power reserve volumes? (5) What could be the permissible zone of generator insensitivity? (6) How is the remaining reserve power of the joint EPS determined? (7) What decisions can be made to reduce the size of FD? (8) What is the action plan to ensure that the analyzed and proposed solutions are implemented? Frequency quality parameters in the CE synchronous zone have deteriorated over the past few years. Continuous system frequency measurements have shown that the frequency value more frequently and for longer periods deviates from the average nominal value of 50 Hz. The number of deviations, which was greater than 75 mHz and more than 100 mHz, has significantly increased. These growing trends indicate that especially large FD numbers over 100 mHz are rapidly increasing, while the number of 75 mHz variations has been high for some time. Last year’s statistics show that the number and intensity of deviations have particularly increased during the winter period [1].
The rate of change of frequency (RoCoF) has also been analyzed. It was observed that RoCoF is increasing from values that have always been lower than ±1.5 mHz/s and has recently reached even ±3 mHz/s regularly. All this leads to a threatening approach to the maximum frequency fluctuation limit values, at which generators’ Frequency Containment Reserve (FCR) function starts to operate.
A common goal for the Baltic States is greater energy supply independence through the diversification of primary energy sources. The integration of the Baltic States within common European Union (EU) energy market was a long-time strategic priority [2]. Hence, to support all these goals, a project of desynchronization of the Baltic States from IPS/UPS and synchronization with CE started when the Baltic successfully operated in “Island Mode” to test stability before joining the CESA.
At present, the power system of the Baltic States is no longer connected to the IPS/UPS power systems, instead participating in frequency regulation with its own demand and generation regulation. The Baltic States have interconnectors with the Nordic countries via Finland and Sweden, as well as an interconnector to Poland. The focus has shifted from “joining Europe” to strengthening the infrastructure they just connected. Since the Baltic constitutes a comparatively small synchronous area, maintaining frequency stability requires a combination of local reserve provision and cross-border coordination through interconnections with neighboring European systems. During high RoCoF events, the contribution of external support may be limited by interconnector capacity, power transfer constraints, reserve activation dynamics, and TSO coordination procedures. Consequently, sufficient local inertia, FCR availability, and generator frequency response capability remain key factors in ensuring the secure operation of the Baltic power system.
This paper includes details of performed on site tests and modeling studies on power plant generators. Great attention is also paid to the performance of the Combined Cycle Power Block (CCPB) [3,4,5,6,7,8].
2. Structure of the Combined Cycle Power Block
Combined Cycle Technology (CCT) is widely used in European energy sectors, and Combined Cycle (CC) gas turbines are currently among the most efficient devices compared to old, thermal, solid fuel power generation blocks. Strict EU emission standards require each country to increase fuel efficiency in electricity production. Most old, inefficient, and surplus devices have been replaced with fuel-efficient CCT, which currently achieves an efficiency of 60–70 percent. Due to high thermal efficiency, CC units achieve higher power than usual without using additional fuel resources, thus reducing the amount of emissions per kilowatt-hour of electricity produced, and significantly increasing the operational efficiency of the device [9,10,11,12,13,14,15,16,17,18,19].
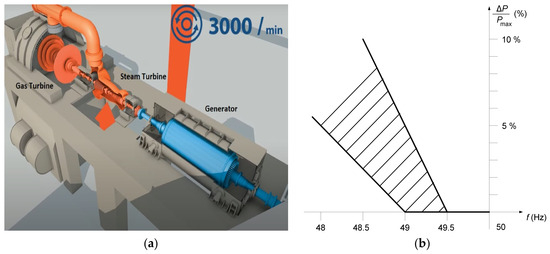
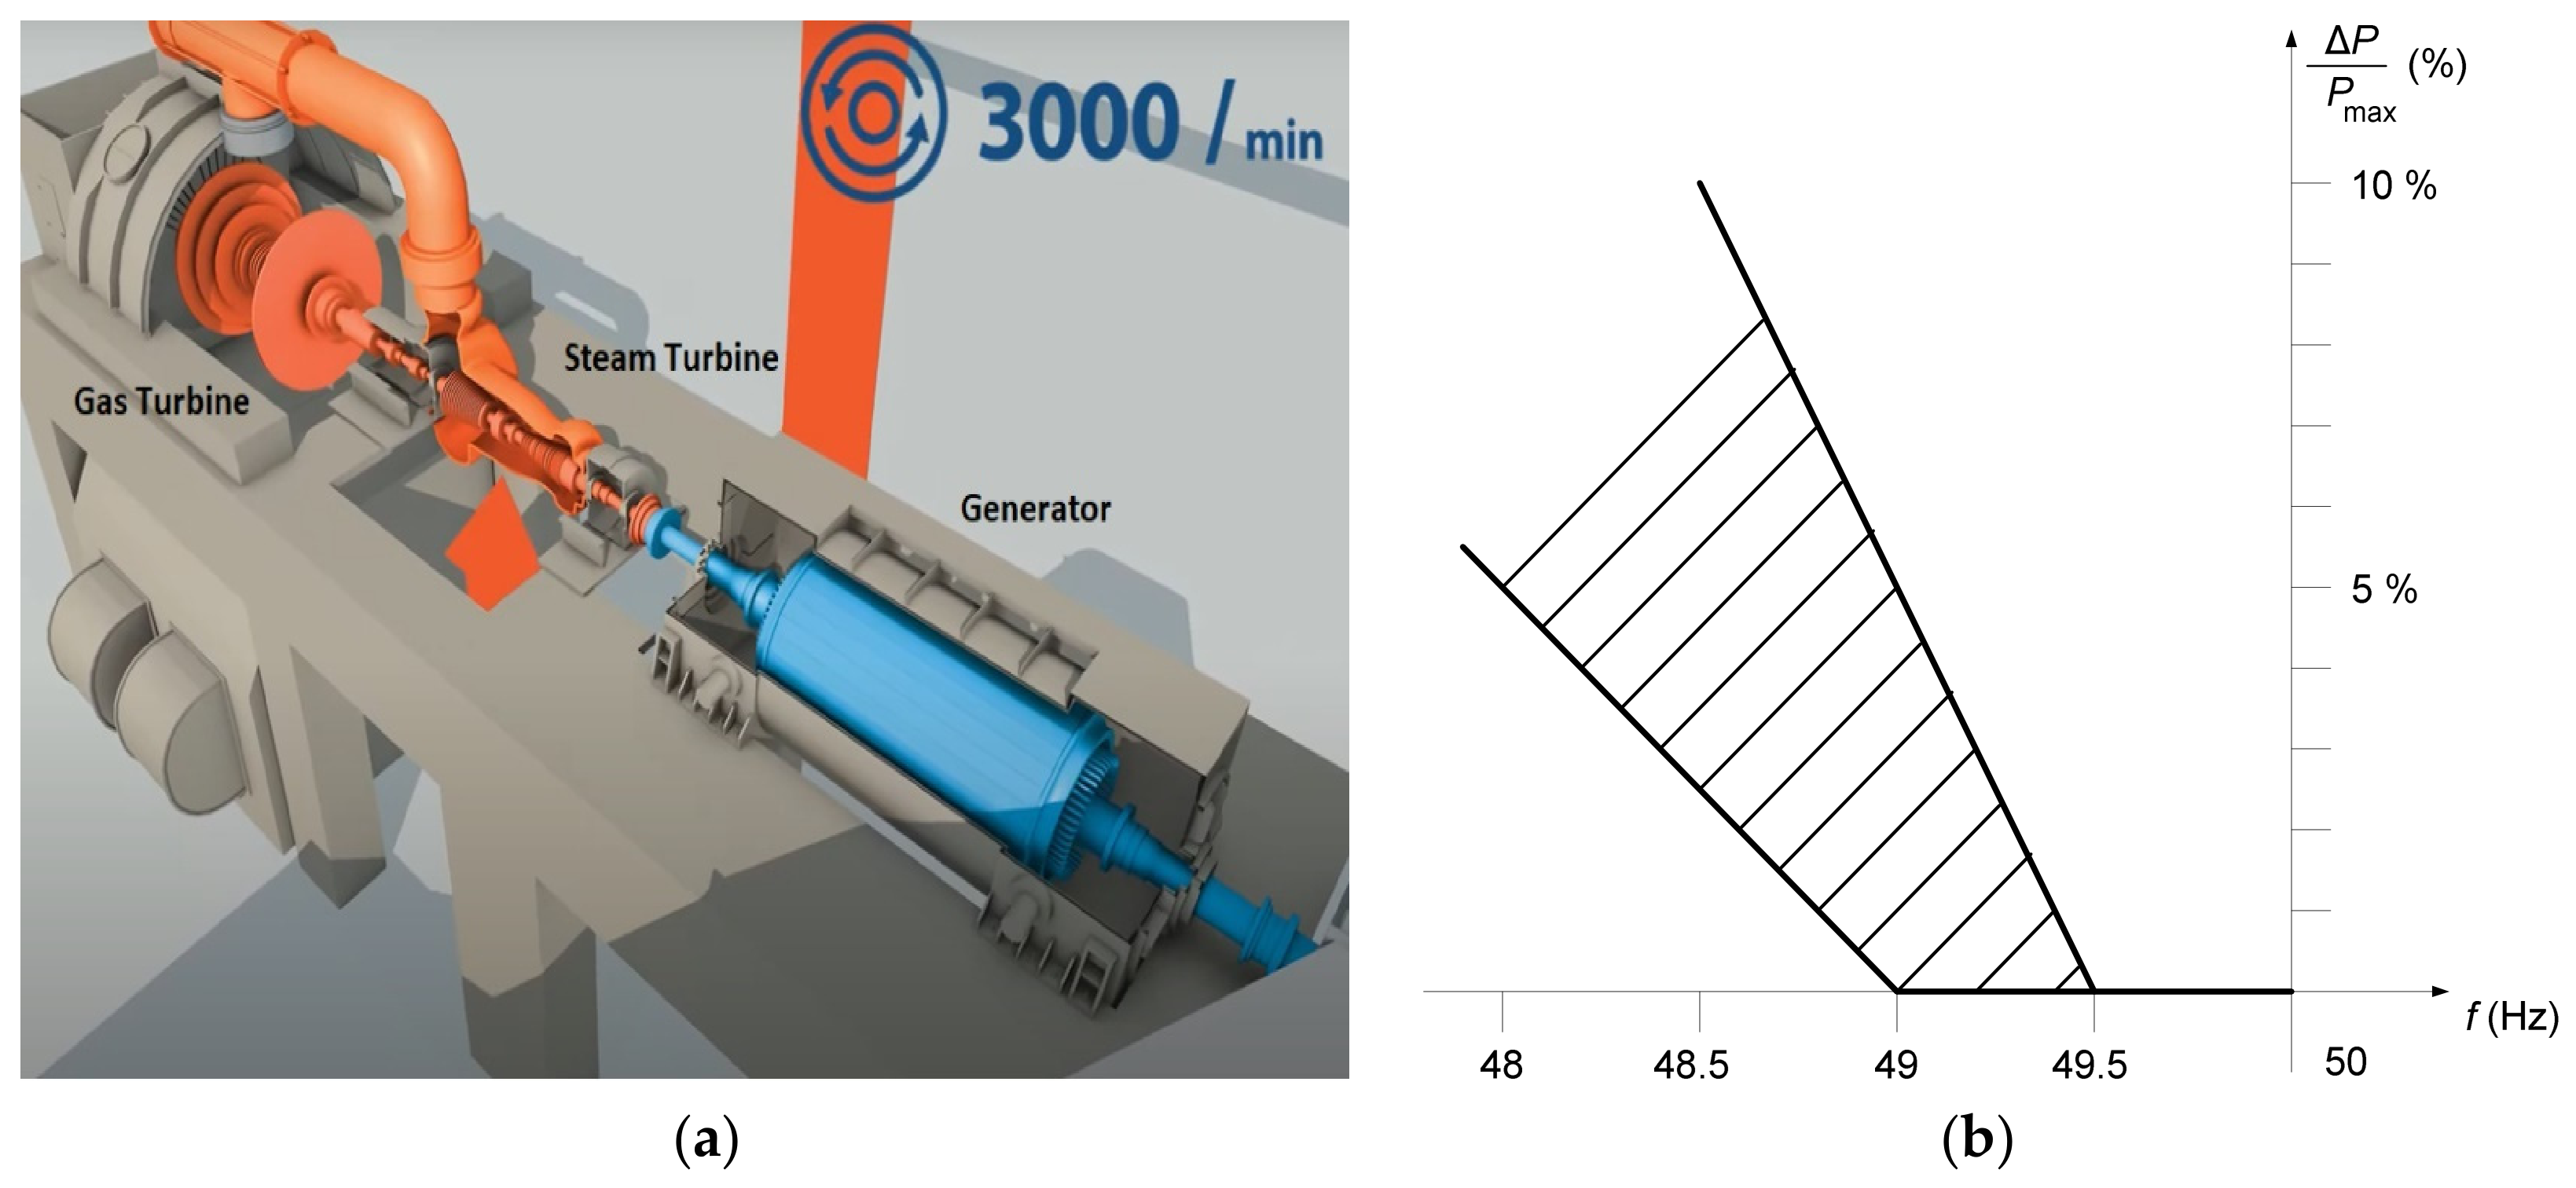
Electricity generated by Combined Cycle Power Plants (CCPPs) is traded on the international “Nord Pool” electricity exchange. Furthermore, according to agreements, there is trading in regulation and balancing electricity as well as participation in the regional reserves and ancillary services market. Electricity generated by CCPP is traded on the international "Nord Pool" electricity exchange. Furthermore, according to agreements, there is trading in regulation and balancing electricity as well as participation in the regional reserves and ancillary services market. The CCPB model is shown in Figure 1a. The operational relationship between system frequency deviations and the admissible reduction of active power output, reflecting grid-code requirements and technical limitations of generating units, is illustrated in Figure 1b.
Figure 1.
(a) Schematic representation of the investigated CCPB consisting of a gas turbine, a steam turbine, and synchronous generator subsystems. (b) Illustrative relationship between decreasing system frequency and the admissible reduction in active power output according to operational constraints and grid-code requirements.
The full power of the Combined Cycle Power Plant (CCPP) turbogenerator being analyzed is 524 MVA, with a current of 15.9 kA, voltage of 19 kV, rotor current of 2.6 kA, and excitation voltage of 750 V. The structure of the electromagnetic model of a turbogenerator was analyzed in [20].
In addition to main services, CCPP can also provide ancillary services. The ancillary services include:
- Frequency Restoration Reserve service, which is activated in the event of an imbalance in the power system due to uneven electricity production and consumption or disconnection of a production element (generator).
- Voltage control service not related to frequency regulation and balancing, managing reactive power and voltage. This service is activated when the EPS lacks voltage control capacity to ensure electricity quality, i.e., when the voltage value is not maintained within set limits.
- Emergency prevention and recovery service designed to restore the EPS after a complete disconnection (Blackout). In such cases, the CCPP is allowed, and it along with other generators maintains voltage and supplies electricity necessary for consumers after emergency mode.
- Isolated operation availability service not related to frequency regulation, aimed at ensuring that the capacities providing the service are available in the event of isolated EPS operation.
3. Automatic Generation Control of the Electrical Power System
The purpose of Automatic Generation Control (AGC) is to ensure the continuous maintenance of the inter-system active power balance within set limits for the EPS (control area) and to participate (proportionally to the generated power) in the frequency regulation of the joint system, as well as distribute loads to generators using automatic generation control devices, which consist of primary regulators (possessed by generators) and EPS secondary regulators that control only certain generators [21,22].
In this case, Automatic Power Control (APC) is designed for the management of EPS inter-system power balance deviations and frequency maintenance within set limits, as well as the distribution of loads among participating generators using primary and secondary regulation. The stability of the EPS frequency is maintained within allowable limits by the APC devices, addressing frequency deviations caused by mismatches between generation and consumption powers. The power plant block operates as a generation unit composed of several technologically linked parts, such as an electric generator, a steam turbine, and a steam boiler (see Figure 1a). Power and frequency regulation involves continuous maintenance of set power balances between control areas and the stability of the joint system frequency within allowable deviations. Power and frequency regulation is carried out by APC devices. Ensuring the proper functioning of APC, an important factor is the droop of the electric generator. This is the generator’s power-frequency characteristic (dependency of power deviation on frequency deviation). The droop of the generator is characterized by the droop coefficient ks, which is calculated as:
where fN is the nominal frequency 50 Hz; Δf is the frequency deviation from the nominal frequency; PN is the nominal active power of the generator; ΔP is the power deviation from the nominal active power of the generator. For primary frequency control, a decrease in system frequency results in an increase in generator active power output. Therefore, frequency deviation and active power change have opposite signs. In this paper, the droop coefficient is expressed as a positive quantity and is evaluated using the magnitude of the corresponding frequency and power deviations.
ks = −[(Δf/fN)/(ΔP/PN)] · 100,
The droop of the generator depends on the parameters of the primary regulator and the operating mode of the power plant block.
The generator’s dead band (db) is the range of frequency variation in which the primary regulator does not respond to frequency deviations due to the imperfections of its components. The goal is for the db to be as small as possible, but not larger than ±10 mHz. A specifically set db is defined as a dead zone, so each generator performing the APC function must be able to set a dead zone to ±20 mHz or ±200 mHz (±150 mHz). The insensitivity zones of the primary and secondary regulators are different.
The normal operating mode of the EPS, where the balance of active powers and other system operating parameters are maintained within permissible deviations, defines the characteristics of normal operation. Normal operation is characterized by safe and risky working conditions. Safe conditions are those where all system users are supplied with electricity of appropriate quality, all limit conditions are ensured, the N–1 criterion is met at all points in the energy system, and there are adequate power reserves in power plants and transmission lines. Risky conditions are those where the N–1 criterion is not ensured at any point in the system, as well as when generators from the power grid absorb reactive power [23,24].
The generator’s automatic device (primary regulator) controls the amount of energy supplied to the turbine according to the frequency deviation of the generator’s shaft. It forms the generator’s static characteristic. If it does not regulate the frequency, the primary regulator stabilizes the power generated by the generator. The primary regulator can operate both with and without a secondary regulator. Automatic power adjustment by the primary regulator according to a predefined frequency and power dependency is primary regulation. It stabilizes the frequency with a certain generator droop. A generator capable of performing primary regulation function must have an active power change range. The change range for primary regulation power adjustment is within which the primary regulator, upon experiencing a frequency deviation, can automatically change the generator’s power in both directions (reduce or increase it) [25,26].
Regulation ‘ahead‘ is the stabilization of sharp steam pressure before the turbine, acting on the turbine control valves. This regulation method ensures the work of the primary regulation by eliminating the result of primary regulation during the transition process, the duration of which is determined by the dynamic properties of the steam boiler. The power plant block temporarily (10–20 s) changes its power during frequency deviations.
Regulation ‘after‘ is the stabilization of sharp steam pressure before the turbine, acting on the fuel supply valves to the boiler. This method allows the generator’s primary frequency regulator to operate. The power plant block changes its power during frequency deviations. An EPS, in which no power plant block operates in the ‘ahead’ regulation mode, has the best self-regulation properties for frequency deviations, thus most effectively and economically ensuring system frequency stabilization.
The remaining reserve power, consisting of controlled active power, is used to eliminate (compensate for) deviations in the control area’s active power balance. The task of supporting reserve powers is to continuously ensure the required volumes of primary and secondary regulation reserve powers when these powers are used to maintain frequency stability.
The coefficient of power dependency on frequency (λ) characterizes the frequency-response characteristic of the joint EPS or control area. It represents the amount of active power change associated with a given FD and therefore reflects the self-regulation capability of the EPS. The coefficient λ is expressed in MW/Hz and depends on the aggregate droop characteristics of generators and frequency-sensitive loads. The joint system coefficient λJ is calculated as:
where ΔPJ is the active power imbalance of the joint system; ΔfJ is the corresponding frequency deviation of the synchronous system. The control area coefficient λCA is determined:
where ΔPCA is the active power deviation of the control area, determined from the net interchange power deviation; ΔfJ is the corresponding frequency deviation of the synchronous system.
λJ = ΔPJ/ΔfJ,
λCA = ΔPCA/ΔfJ,
The power plant block (generator) located in the joint EPS, whose automatic generation control is coordinated with the control of other blocks of the joint system, must ensure the execution of the planned (set) schedules of total active power exchanges among all system blocks (generators) and participate in eliminating frequency deviations in the EPS. Services necessary for ensuring the proper functioning of the electric power system, which are provided to electricity consumers together with electricity transmission and distribution services, are called system services. System services determine the quality of electricity supply. System services include frequency stability, voltage regulation, reliability of electricity supply, as well as system maintenance and management.
3.1. Conditions of Primary Automatic Generation Control
All generating units connected to the power system should be capable of participating in primary frequency regulation. This is a necessary condition for connection to the EPS. If a generator does not meet the requirements (the thermal power plant unit operates in ‘ahead’ regulation mode), it can pose a risk to the safety of the EPS (control area, control block, or joint energy system). The primary regulator can be turned off in a thermoelectric power plant only if, according to the specific operation of the thermoelectric power plant working in a combined heat and power generation mode, there are no other technical possibilities to regulate the temperature of the supplied thermoelectric water. The temporary exclusion of an individual generating unit from primary frequency regulation does not automatically reduce the overall frequency resilience of the control area, as the required FCR volumes are determined and maintained at the system level by the TSO. Nevertheless, extensive exclusion of generating units from primary regulation may reduce the aggregate frequency response capability and should therefore be carefully considered during reserve dimensioning and operational planning [27,28,29].
New or modernized generators participating in primary frequency regulation must meet the following requirements:
- The primary regulation range must be implemented within 30 s and must not be less than ±5% of the nominal generator power (when the generator is operating at any working point);
- The reserve of primary regulation power must be restored within 15 min., assuming that the system frequency has reached the set value during this period;
- The insensitivity zone of the primary regulator must be ±10 mHz, with the possibility of setting the dead zone to ±20 mHz.
The droop coefficient ks of the generator’s primary regulator must be set according to the requirements accepted by the EPS, i.e., within 2–8% range. Primary regulation is activated only for a portion of the EPS generators according to the actual active power mode conditions; all other generators capable of participating in primary regulation merely maintain constant power according to the load schedule.
3.2. Coordination of Automatic Generation Control in the Joint EPS
EPS can function as a separate control area, entering into the control block of neighboring countries’ electrical power systems, or as an autonomous part of a neighboring countries’ control area. The contribution of each control area to the joint system’s frequency control depends on the control area influence coefficient Ci. It is calculated as:
where En is the annual electricity production value of the n-th control area; EJ is the annual electricity production value of the joint system.
Ci = En/EJ,
The power dependency on frequency coefficient of the control area, δCA is calculated as:
where Ci is the control area influence coefficient; δJ is the joint system’s power dependency on frequency characteristic.
δCA = Ci × δJ,
3.3. Setting of Active Power Reserve Volumes
The methodology for setting active power reserve volumes is designed for planning and ordering the volumes of Frequency Containment Reserves (FCRs), Frequency Restoration Reserves (FRRs), and Replacement Reserves (RRs). FCR is an active power reserve that can be utilized to maintain the EPS frequency in case of a power imbalance. FRR is an active power reserve that can be used to restore the nominal frequency of the EPS, and in a synchronous zone consisting of more than one power and frequency control area, to restore the planned power balance value. Frequency restoration reserve can be divided into automatic frequency restoration reserve (aFRR) and manual frequency restoration reserve (mFRR).
RR is an active power reserve that can be used to restore or maintain the required level of frequency restoration reserves, preparing to compensate for additional system imbalance. FCR is automatically activated at full capacity in power generation or power storage facilities when a frequency change of ±200 mHz occurs, within a period no longer than 30 s. aFRR is automatically activated within a period not exceeding 5 min. mFRR is manually activated within a period not exceeding 15 min. RR is activated upon TSO instruction within a period not exceeding 12 h.
The setting of FCR volumes is conducted in accordance with the ‘Proposal of All Continental Europe TSOs for the rules on setting FCR volumes according to Article 153(2) of the European Commission regulation (EU) 2017/1485, dated 2 August 2017’, which was approved on 7 September 2018, under the provisions of Article 5 of the European Commission regulation (EU) 2017/1485 [30].
In accordance with the provisions of this regulation, the ordering of a generator’s FCR volumes in the EPS is performed when the system operates synchronously with CE electrical networks.
3.4. Effects of Frequency Deviations on Market Participants
Synchronous generation is designed and adapted to operate efficiently and safely within a limited operating range characterized by frequency and voltage. Frequency limits of rotating electrical machines raise significant concerns because deviations from the normal frequency range can cause damage or disrupt stable cycle operation of the generation.
Considering the operation and management strategy of such generation sources, other limitations may also be observed. The Network Code on requirements for grid connection of generators [31] allows power plant blocks to reduce active power output due to technical limitations associated with smaller frequency deviations, as illustrated in Figure 1b.
Although the Network Code permits larger frequency deviations under certain operating conditions, it remains important to evaluate their impact on both the power system and individual generating units. In the case of Combined Cycle Power Plants, frequency reduction affects not only the control system response but also the physical operating conditions of the gas turbine. As system frequency decreases, the rotational speed of the turbine-generator shaft is reduced, leading to a lower air mass flow through the gas turbine. As a result, the available turbine output power decreases naturally, even before any governor action takes place. Therefore, the reduction in power output during under-frequency operation is not solely a control-related issue but also a consequence of the turbine’s physical characteristics. Any attempt to maintain the original power output at reduced frequency requires additional energy input and must be evaluated with respect to the operational limits of the generating unit.
The proposed control enhancement does not seek to compensate for the inherent reduction in compressor mass flow during under-frequency operation by exceeding turbine thermal limits. Instead, it improves the dynamic deployment of available reserve capacity and governor response within the manufacturer-defined operational constraints, including firing temperature, thermal stress, and ramp-rate limitations.
3.5. Defining Maximum FD Targets and Expected Frequency Quality
The proposal by ENTSO-E requires investigating and determining what maximum FD value poses a threat to the security and stability of the EPS and what size of FDs can be considered acceptable and safe. The work aims to verify whether the proposed solutions are suitable and effective in reducing the size of FDs to an acceptable level.
The proposal for an acceptable FD size becomes clear only after recognizing that completely eliminating FDs is realistically impossible, as there will always be discrepancies between the system balancing schedule and the constantly changing load size.
The first objective is setting the maximum FD value: Analyzing a systemic disturbance that occurred in the CE synchronous zone and triggered the FCR, FD cannot decrease more than to 49.8 Hz, which means that the frequency fluctuation must always be less than 200 mHz. In the event of a systemic disturbance in the CE (double power plant shutdown), the reserve of the FCR function is about 3000 MW. Under standard conditions, this causes a quasi-static frequency deviation (3000 MW/27,000 MW/Hz), which is 111 mHz. However, as the load/consumption (increasing/decreasing), and the size of the active power designated for EPS regulation (increasing/decreasing) changes, the FD will be larger. Considering these variables, the proposed frequency deviation should be within the 100–120 mHz range. The overall FD limit should be 120 mHz. To ensure the 125 mHz limit, the absolute frequency deviation caused by FD can never be greater than 75 mHz.
The second objective is related to the quality goal stated in the System Operation Guideline (SO GL): Article 127 and Annex III of SO GL set the parameters defining frequency quality in CE, establishing ±50 mHz as the standard frequency variation range, which cannot be exceeded for more than 15,000 min per year. This measure includes both FD and frequency deviations due to EPS supply disruptions. Considering that statistically there are about 100 major systemic failures and about 2500 FD incidents per year, the majority of the allowable 15,000 min. will be consumed due to FD’s impact on the system. Given that there are 7 significant FD’s daily, the duration of FD over ±50 mHz cannot exceed 5 min for each FD incident [32].
With the introduction of the quarter-hour Market Time Unit (MTU) in the CE, Intraday–Market FDs decrease as the hours change, but FD slightly increases each time the quarter-hour changes.
4. CCPB Unit Investigation Procedures for Model Development
In order to improve existing mathematical and digital models of the power plant, several field investigations were performed on the investigated generating unit operating within the power system. This article is prepared to describe the purpose of the investigations, available information about CCPBs, the analysis approach and stages, as well as the investigations to be performed in detail.
The investigations described in this article were designed to understand and replicate the dynamic behavior of all power system-related subsystems of the CCPB. The analyses were used to determine system characteristics and to verify the developed mathematical model through digital simulations.
The plant data is split into two groups: generator and excitation data, and turbine and governor data. The information collected from the plant operator is presented in [20].
The methodology of analysis signal injection to the control loop is one of the critical points of the investigation. Separate methodologies are applied for voltage and frequency control systems [33].
4.1. Signal Injection to AVR
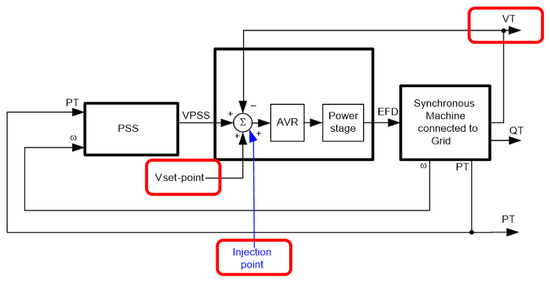
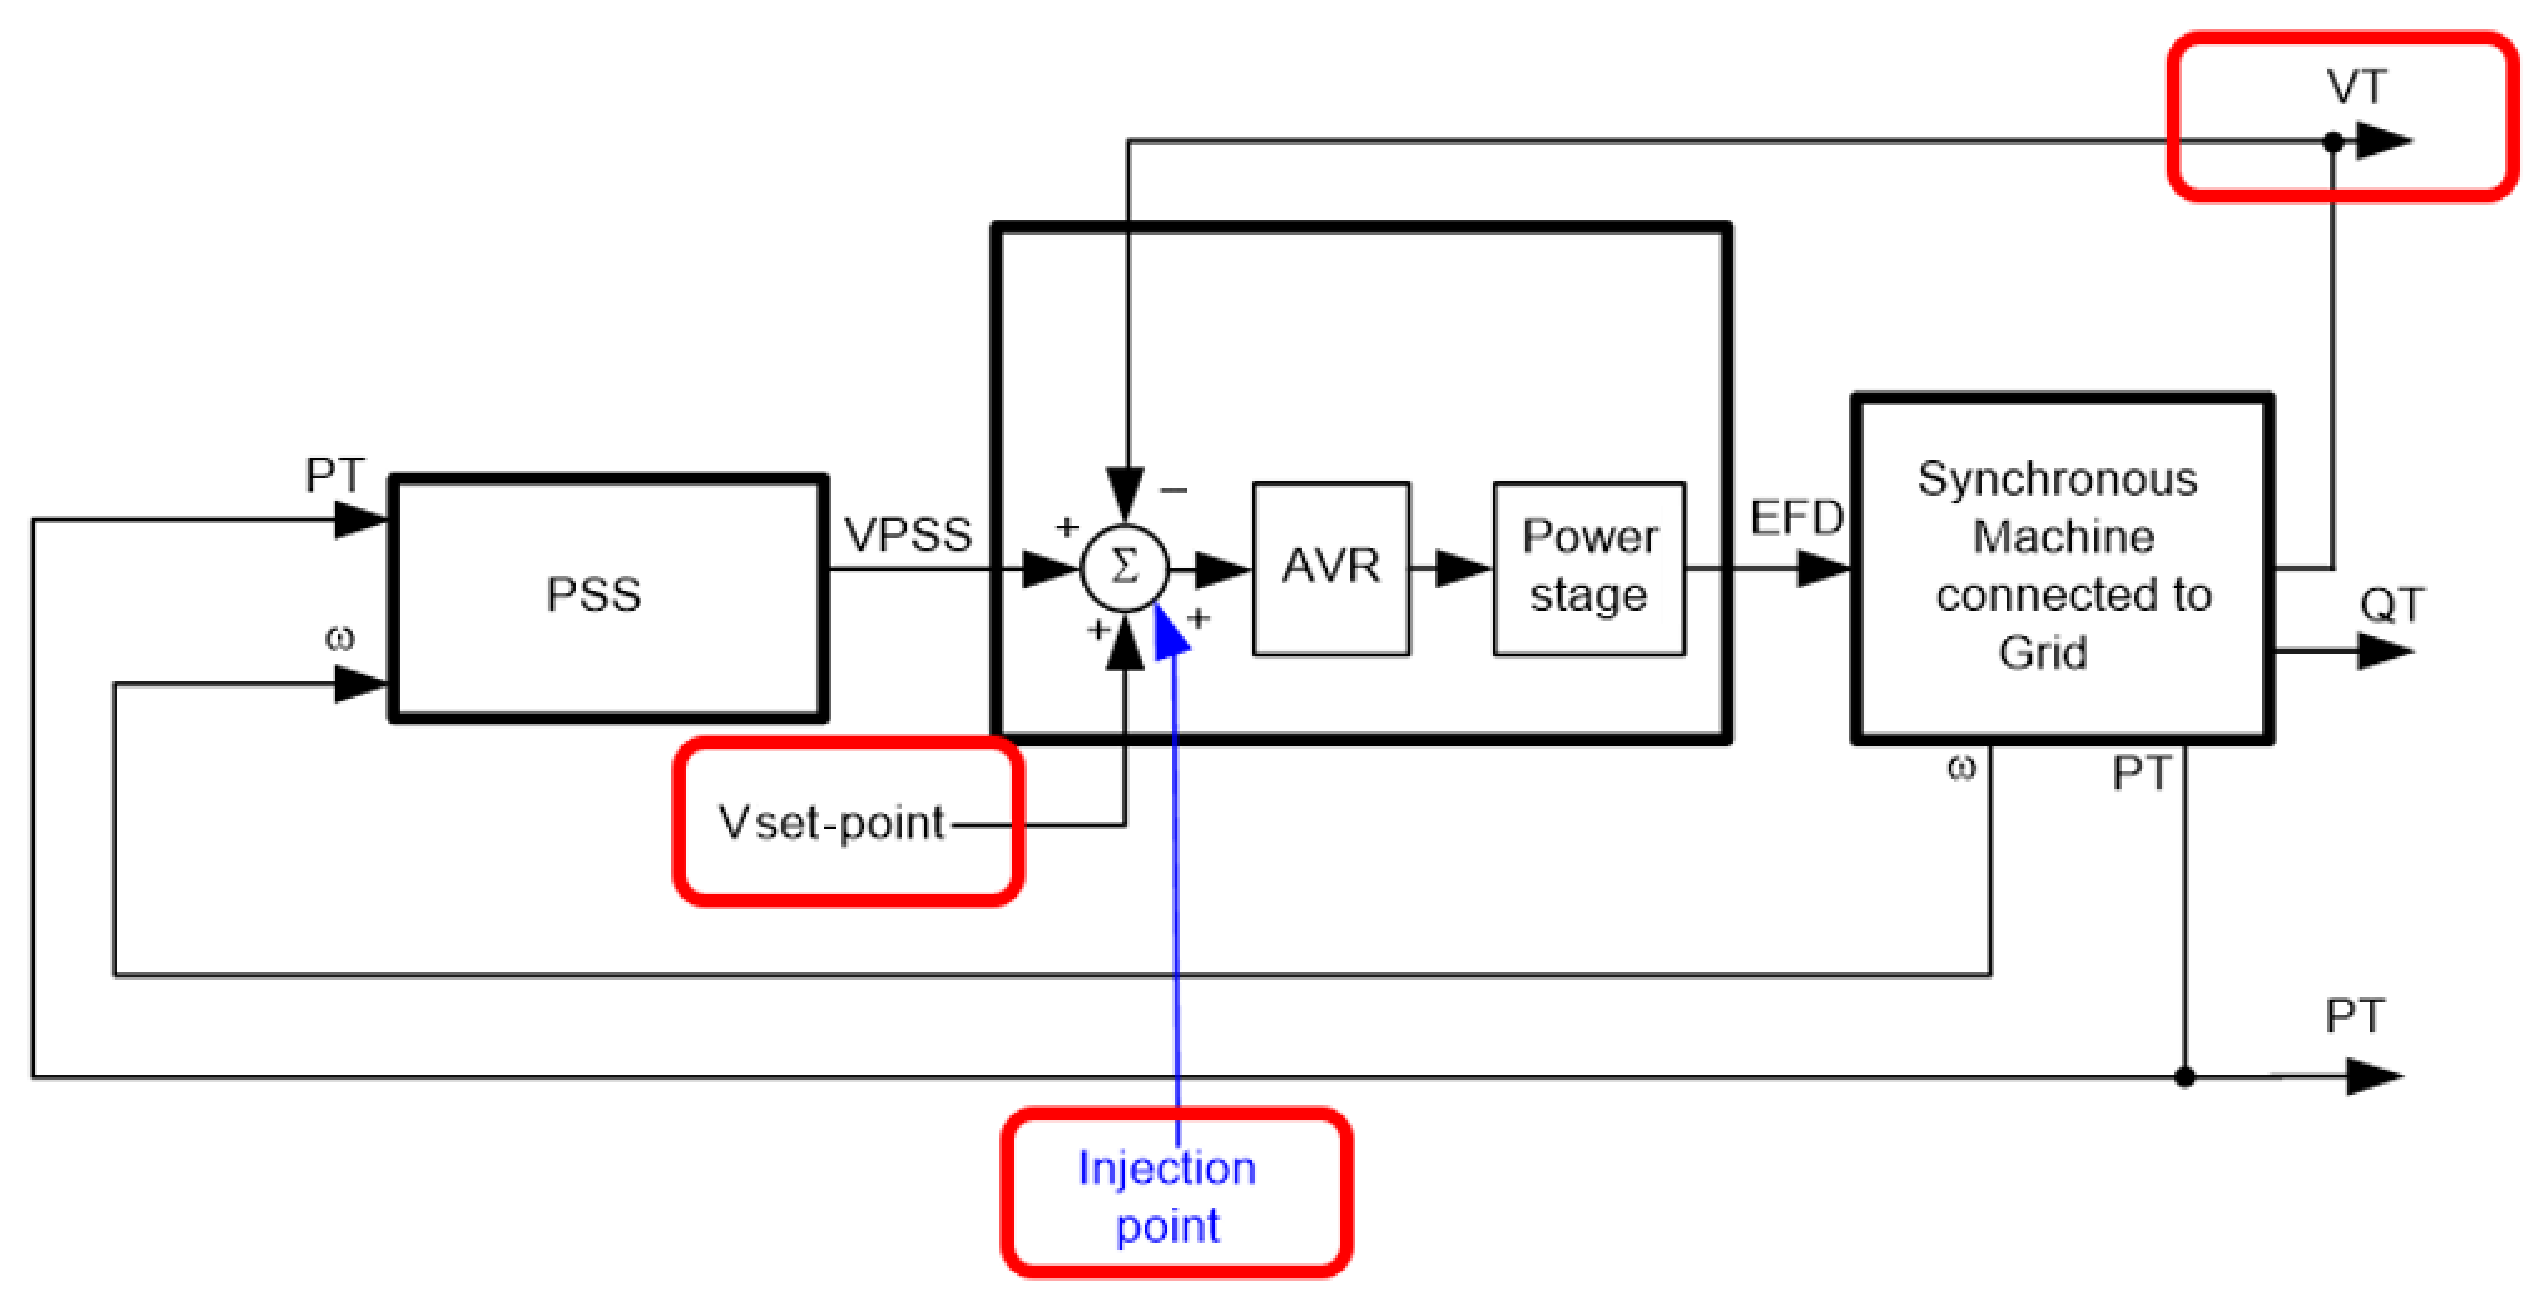
The idea in Automatic Voltage Regulator (AVR) analysis is to create a disturbance via a signal injection to the AVR summing point. Through this connection, an appropriate signal can be superposed on the AVR voltage set-point and a sudden change in the AVR voltage set-point can be created (see in Figure 2). However, whenever relevant, signal injection can be realized by manipulating V set-point or voltage measurement signal. Alternatively, internal signal generator(s) of the excitation system can also be utilized [34,35,36,37,38].
Figure 2.
AVR test configuration showing the voltage set-point signal injection point used for dynamic performance assessment and model validation of the excitation control system.
For the CCPB investigations, the voltage set-point was modified using the following signal-injection methods and equipment:
- The main function of AVR is to automatically maintain a set output voltage of the generator. The main purpose of an AVR is to control the output voltage of a synchronous generator. This is very important in ensuring stable and constant power regardless of changes in load or input power.
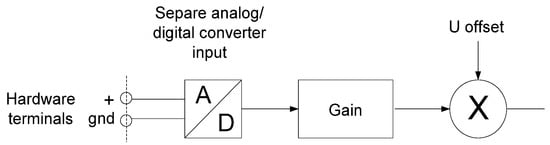
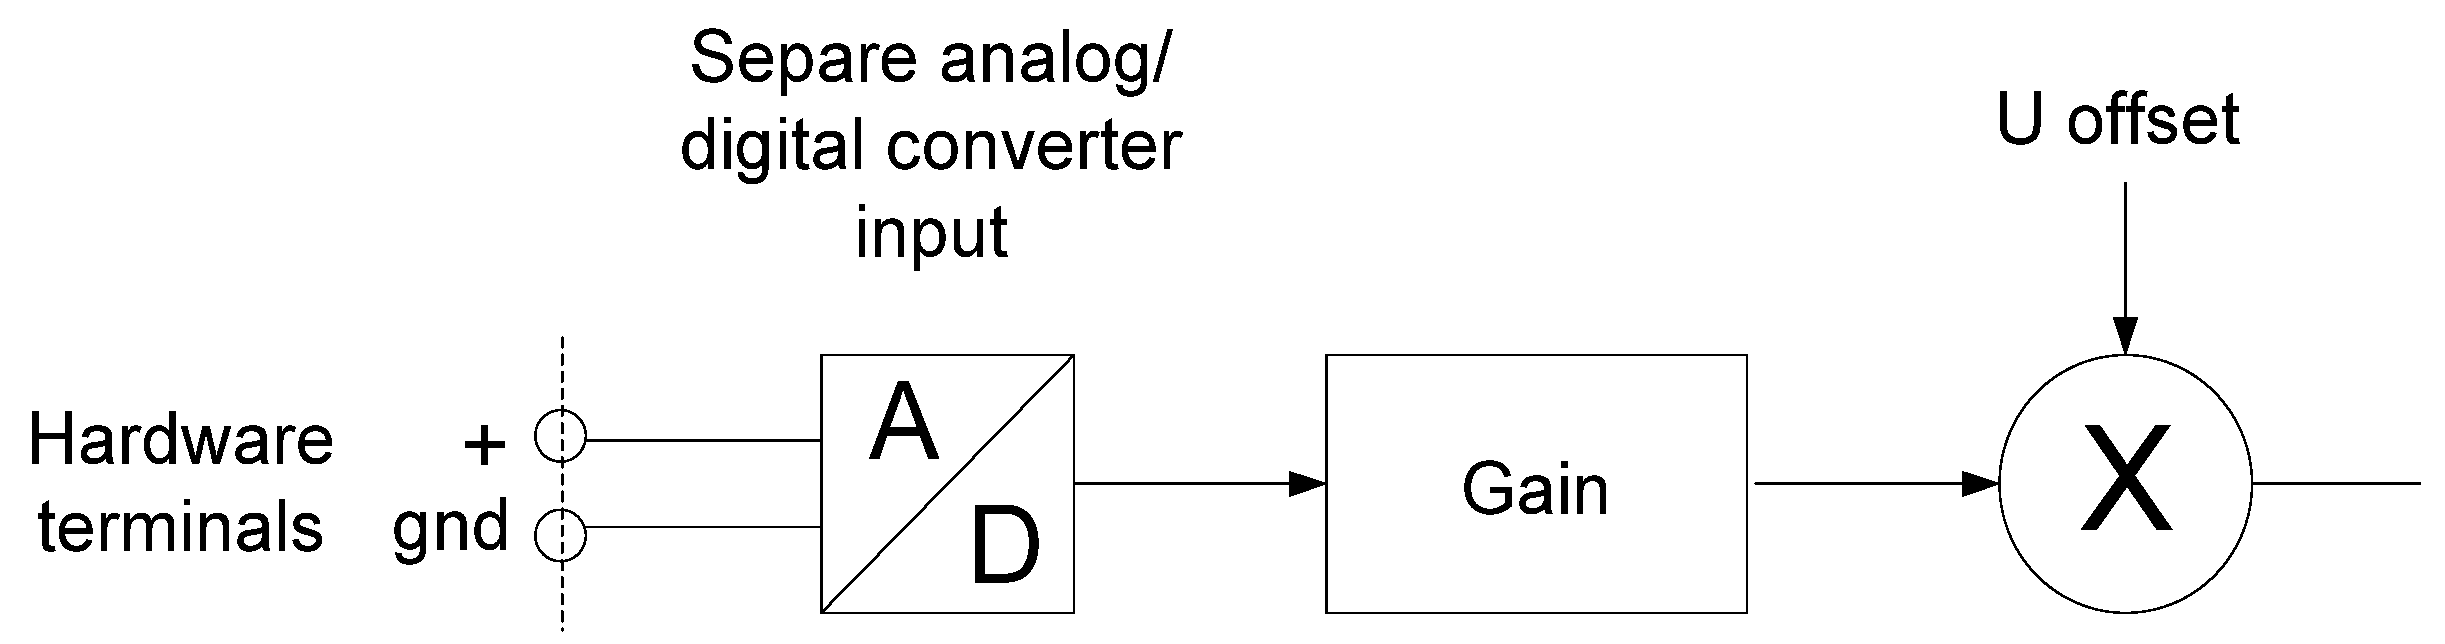
- Signal injection device connection to spare A/D converter input with gain and offset (see Figure 3). A signal injection device is used to inject a specific signal into a system to analyze system responses and to facilitate system calibration and tuning. The signal generator is the main component that generates the injected electrical signal. An interface or output module adapts the signal to be injected, ensuring that it is compatible with the system in terms of voltage, current, impedance, and connection type. Many signal injection devices have control interfaces that allow you to inspect signal properties such as amplitude, frequency, or waveform.Figure 3. Hardware configuration used to inject test signals into the excitation system during AVR and PSS investigations.
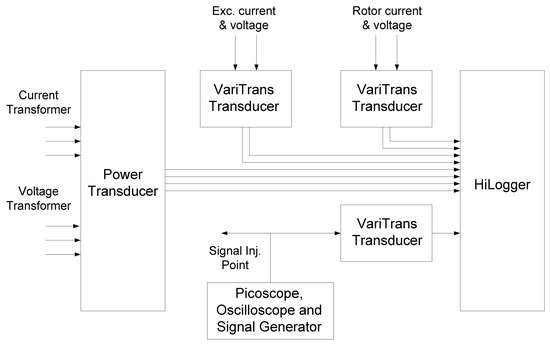
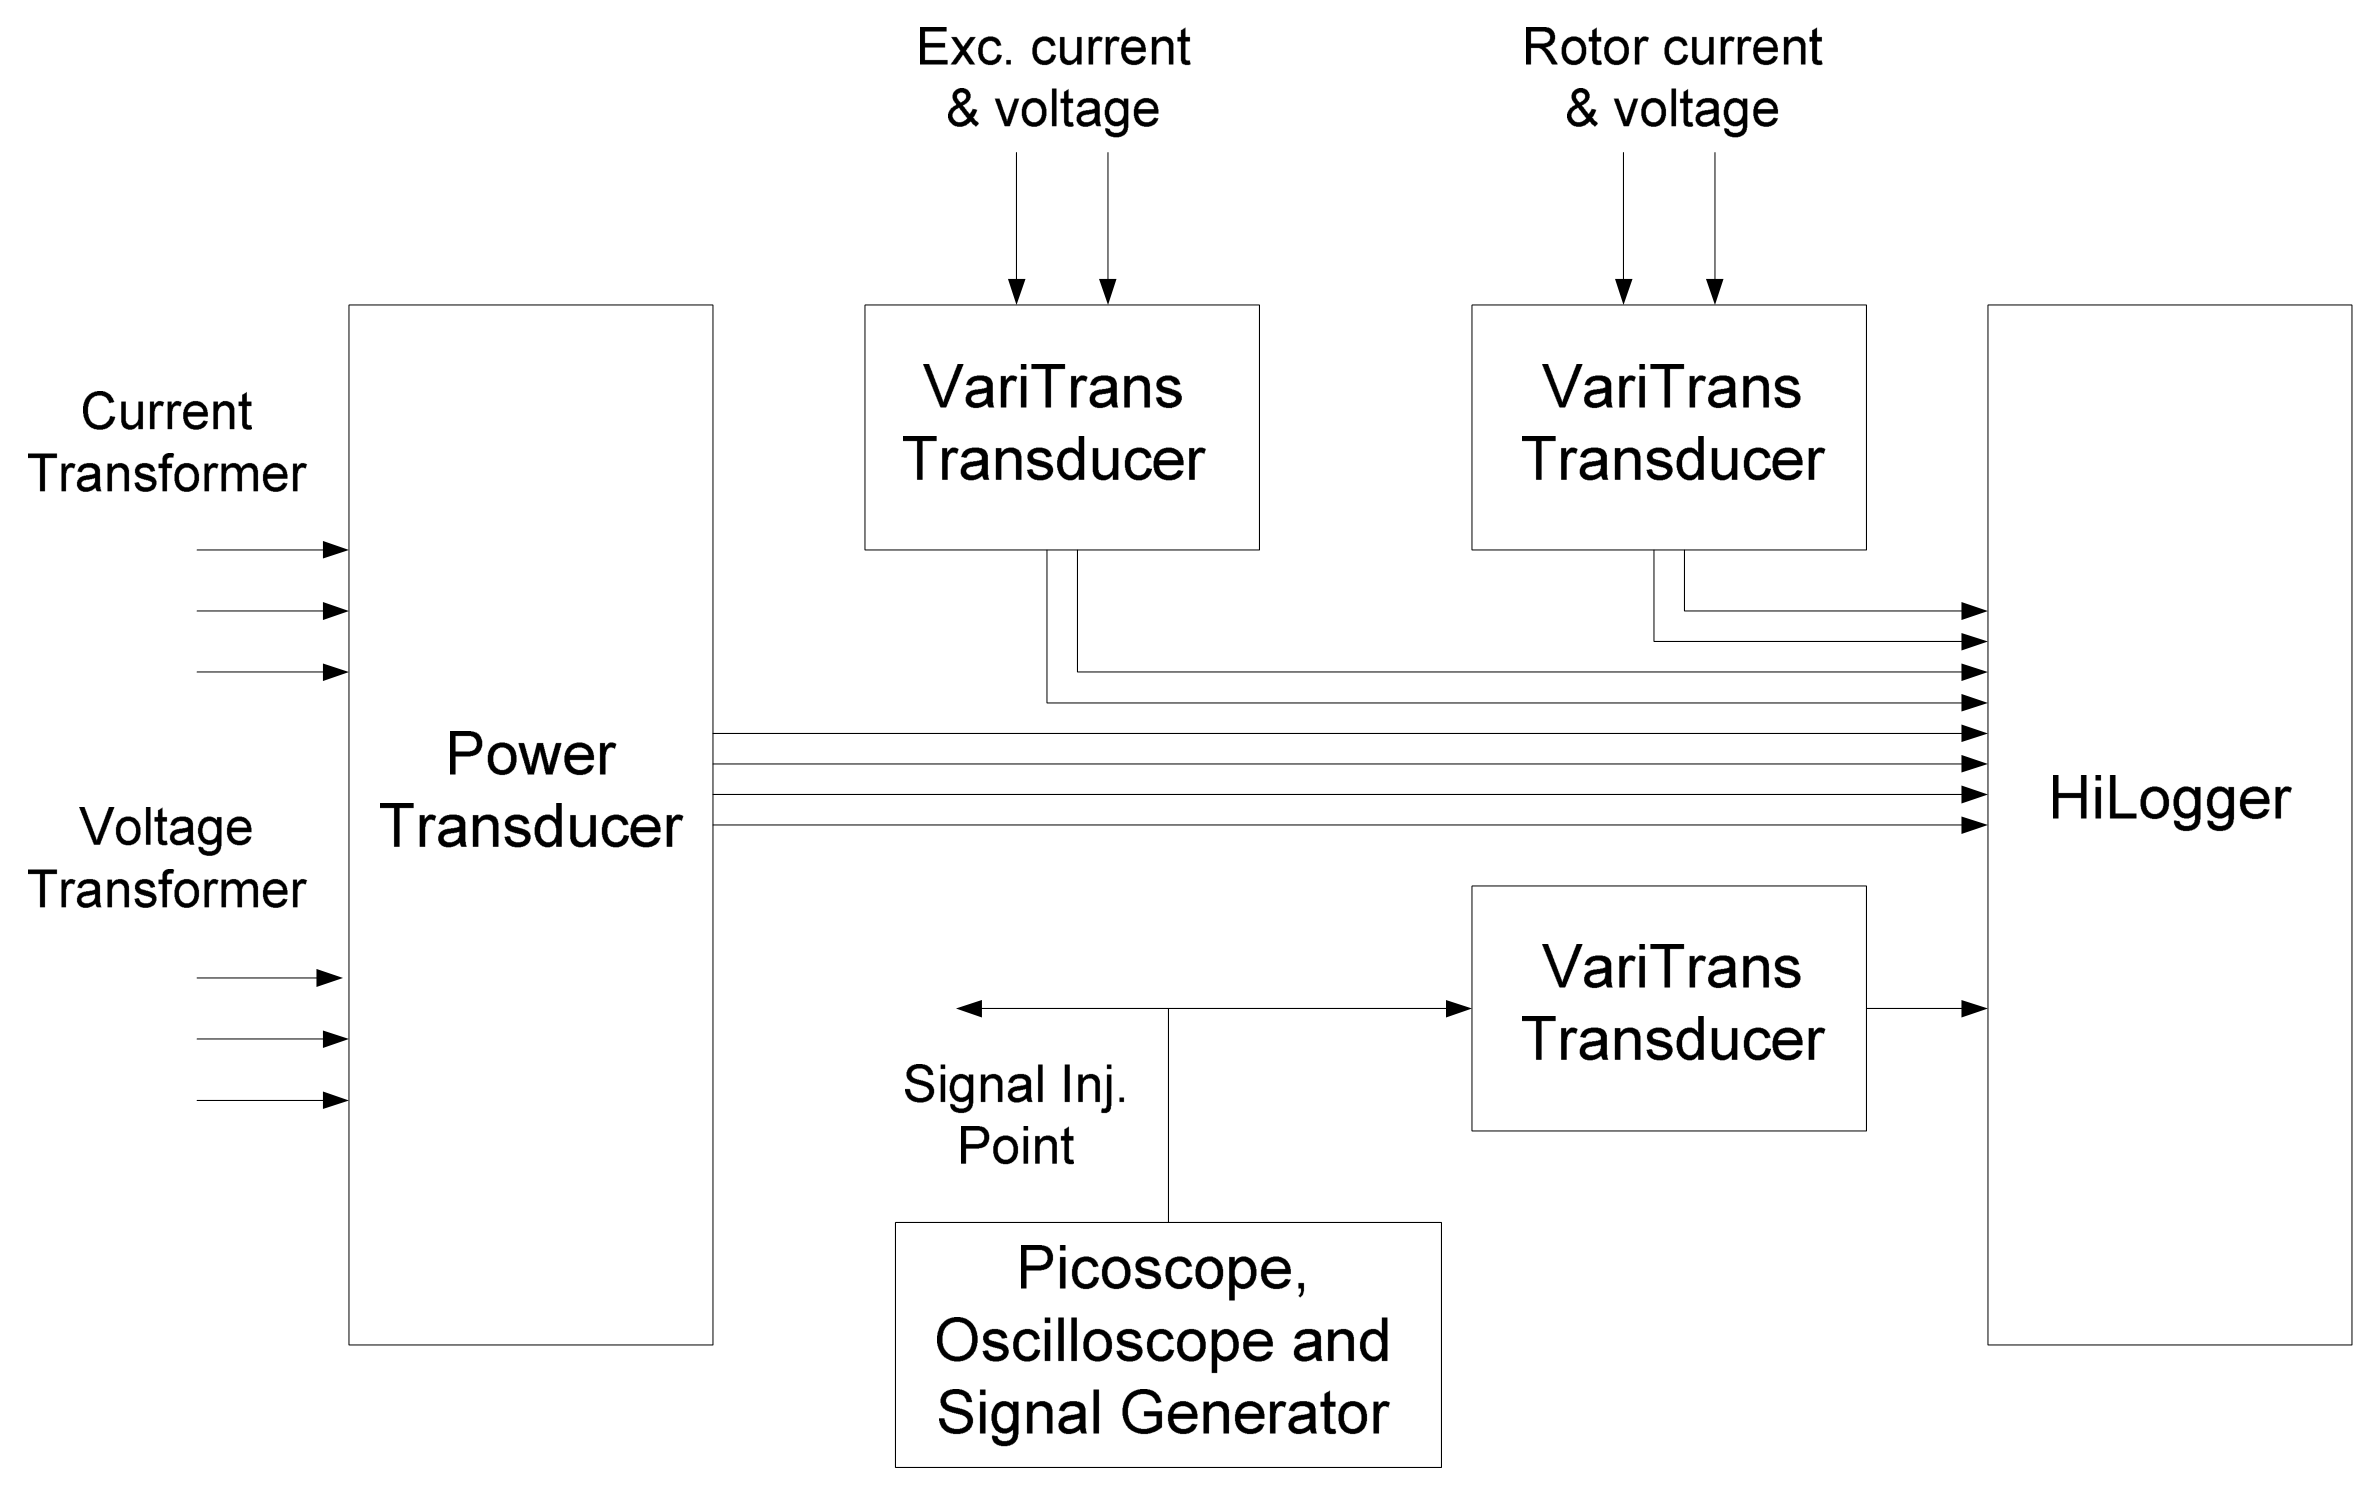
- A signal measuring instrument is needed to analyze electrical signals and is used in electronic testing. The main function of a signal measuring instrument is to accurately measure and analyze the characteristics of electrical signals, such as voltage, current, frequency, phase, and waveform. This allows you to accurately understand how the devices being analyzed perform under different conditions. When AVR system internal data logger is not sufficient, configuration given in Figure 4 will be utilized.Figure 4. Alternative measurement arrangement employed when the internal excitation-system data logger does not provide sufficient signal acquisition capability.
- Field voltage (EFD) is the voltage applied to the field windings of a synchronous generator. EFD regulates the strength of the magnetic field created by the field windings. By regulating EFD, the magnetic flux of the rotor can be controlled. When changing generators, EFD can regulate the output voltage and respond to changes in load. It ensures that the generator maintains the required voltage, regardless of load fluctuations.
- A Power System Stabilizer (PSS) is a critical component of power systems. It increases the stability of the power system by suppressing generator rotor oscillations by modulating the generator excitation control system. The PSS monitors signals that indicate the dynamic behavior of the power system, the generator rotor speed and the power angle. It processes these signals to identify oscillation modes that may affect the system stability. Based on the processed signals, the PSS adjusts the generator excitation control to neutralize the observed oscillations and effectively suppress them. The PSS sensors monitor various parameters such as rotor speed, electrical output power and system frequency. The controller processes the sensor inputs and determines the appropriate response. The actuator is part of the generator excitation system, regulated by PSS commands to change the EFD. The PSS works in conjunction with the AVR. While the AVR maintains the generator output voltage within the desired limits, the PSS focuses on increasing system stability by improving the suppression characteristics.
4.2. Signal Injection to Governor
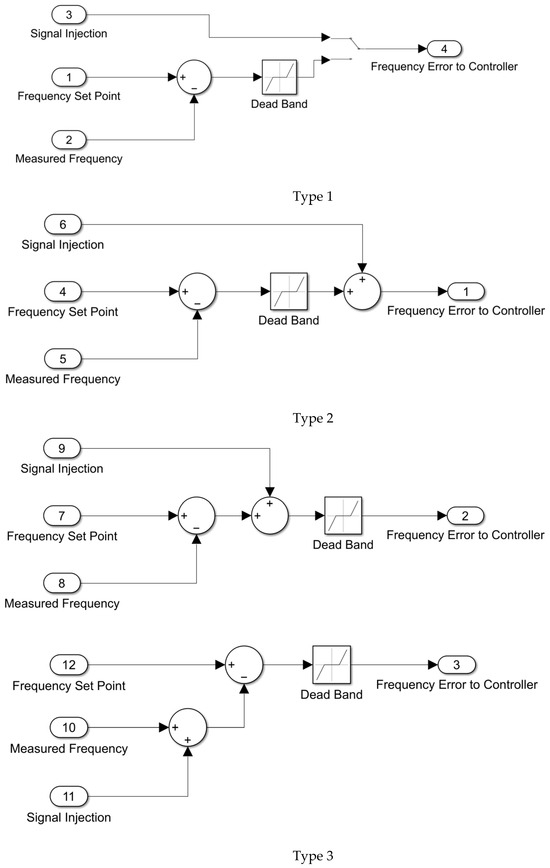
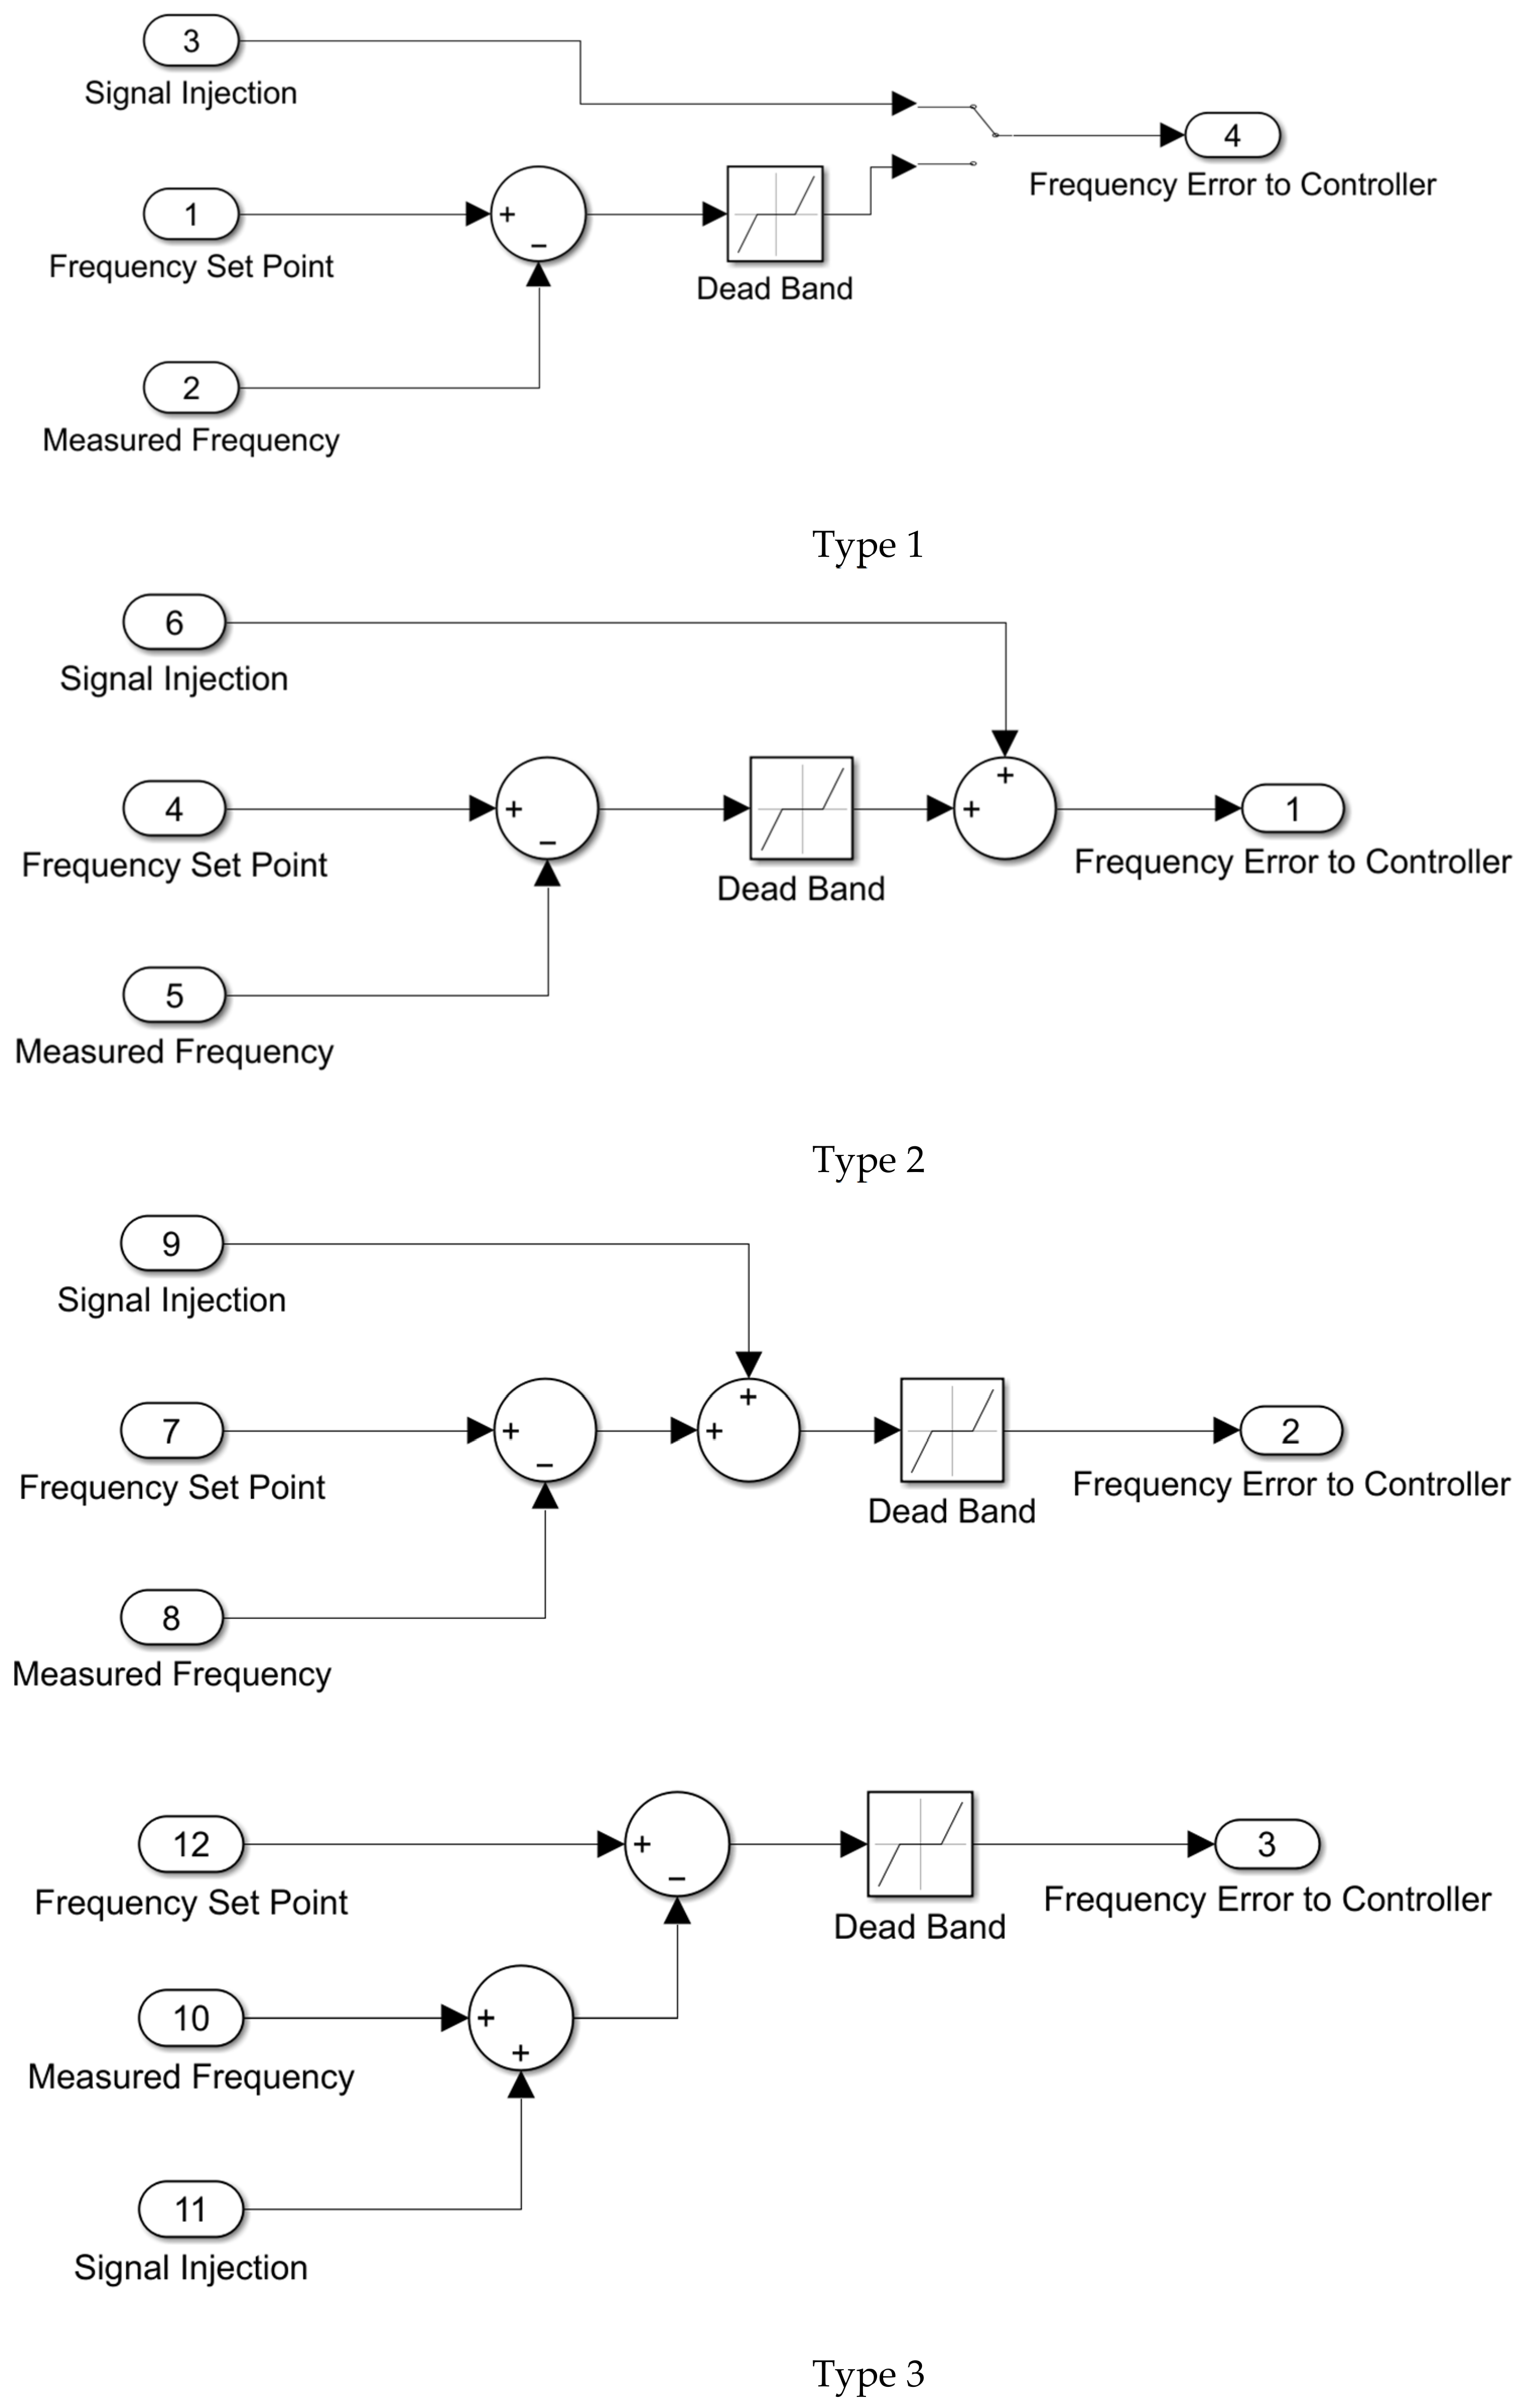
Like AVR investigations, Governor (GOV) investigations also require a signal injection to frequency and active power control loop. This can be realized via introducing a signal injection in the controller either internally utilizing the available testing function of the plant SCADA/governor, or via an external analog signal that will influence the speed measurement. Different signal injection possibilities may be observed depending on the controller structure. However, for analysis purposes, Type 1, or alternatively, Type 2 or Type 3, as given in Figure 5, are preferred.
Figure 5.
Alternative governor signal-injection configurations used for frequency-response investigations and turbine–governor model validation.
The dynamic model implemented in MATLAB/Simulink R2026a consists of interconnected governor, gas turbine, steam turbine, generator, excitation, and frequency control subsystems. The model parameters were derived from manufacturer documentation, commissioning data, and field measurements. The resulting model was validated against step-response tests performed on the generating unit under different operating conditions.
Step-input signals were selected exclusively for system identification and model validation purposes, as they provide a repeatable excitation of the governor–turbine control loop and allow direct comparison between measured and simulated responses. They are not intended to represent actual frequency variations occurring in interconnected power systems.
Model validation was performed by comparing measured and simulated responses with respect to response initiation time, rise characteristics, settling behavior, steady-state operating point, and overall dynamic response shape. Validation was conducted using field-test data obtained during AVR, governor, and frequency-response investigations. The observed agreement between measured and simulated responses was considered satisfactory for the intended governor, AVR, PSS, and frequency-response studies, confirming the suitability of the developed model for dynamic performance assessment and frequency-control analysis.
4.3. Unit Active Analysis Stages
The analysis stages are given step by step here:
- Saturation characteristics investigations. This analysis is to determine and validate the generator saturation characteristic (open-circuit generator characteristic) and shall be conducted with the unit operation in field current or field voltage control mode. Unit rotates at nominal speed with no-load condition and with the generator main breaker open-circuit characteristic [39,40,41,42]. Status of PSS is Off. Frequency measurement is used in PSS. The equipment uses the estimation of rotor speed based on compensated frequency for the PSS channel VSI2. The algorithm calculates the frequency of the phasor VT + jXq × I. Initially excitation is set to zero and initial terminal voltage level is zero. The excitation was progressively increased, and the armature terminal voltage was observed. The points where armature voltage equals in p.u. to (0, 0.1, 0.2, 0.3, 0.4, 0.5, 0.6, 0.65, 0.7, 0.75, 0.8, 0.85, 0.9, 0.94, 0.96, 0.98, 1, 1.02, 1.04, 1.06, 1.08, 1.1) rated voltage were taken. The shaft speed signal was also acquired and used for the correction of voltage.
Base quantities for modeling studies are: Stator voltage (VT) → 1.0 p.u. = 19.0 kV; Active power (P) → 1.0 p.u. = 524 MW, Reactive power (Q) → 1.0 p.u. = 524 MVar; Field voltage (EFD) → 1.0 p.u. = 187 V (based on air gap field current at rated stator voltage and field resistance 0.2212 Ohm at 100 deg); Field current (IFD) → 1.0 p.u. = 845 A (based on air gap field current at rated stator voltage); Set-point voltage → 1.0 p.u. = 100% = 19.0 kV. This p.u. convention is used by most standards and power system analysis software tools. Adopted p.u. base values are shown in Figure 2.
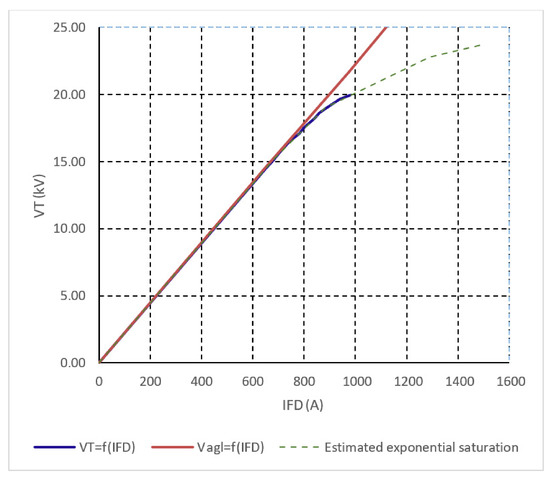
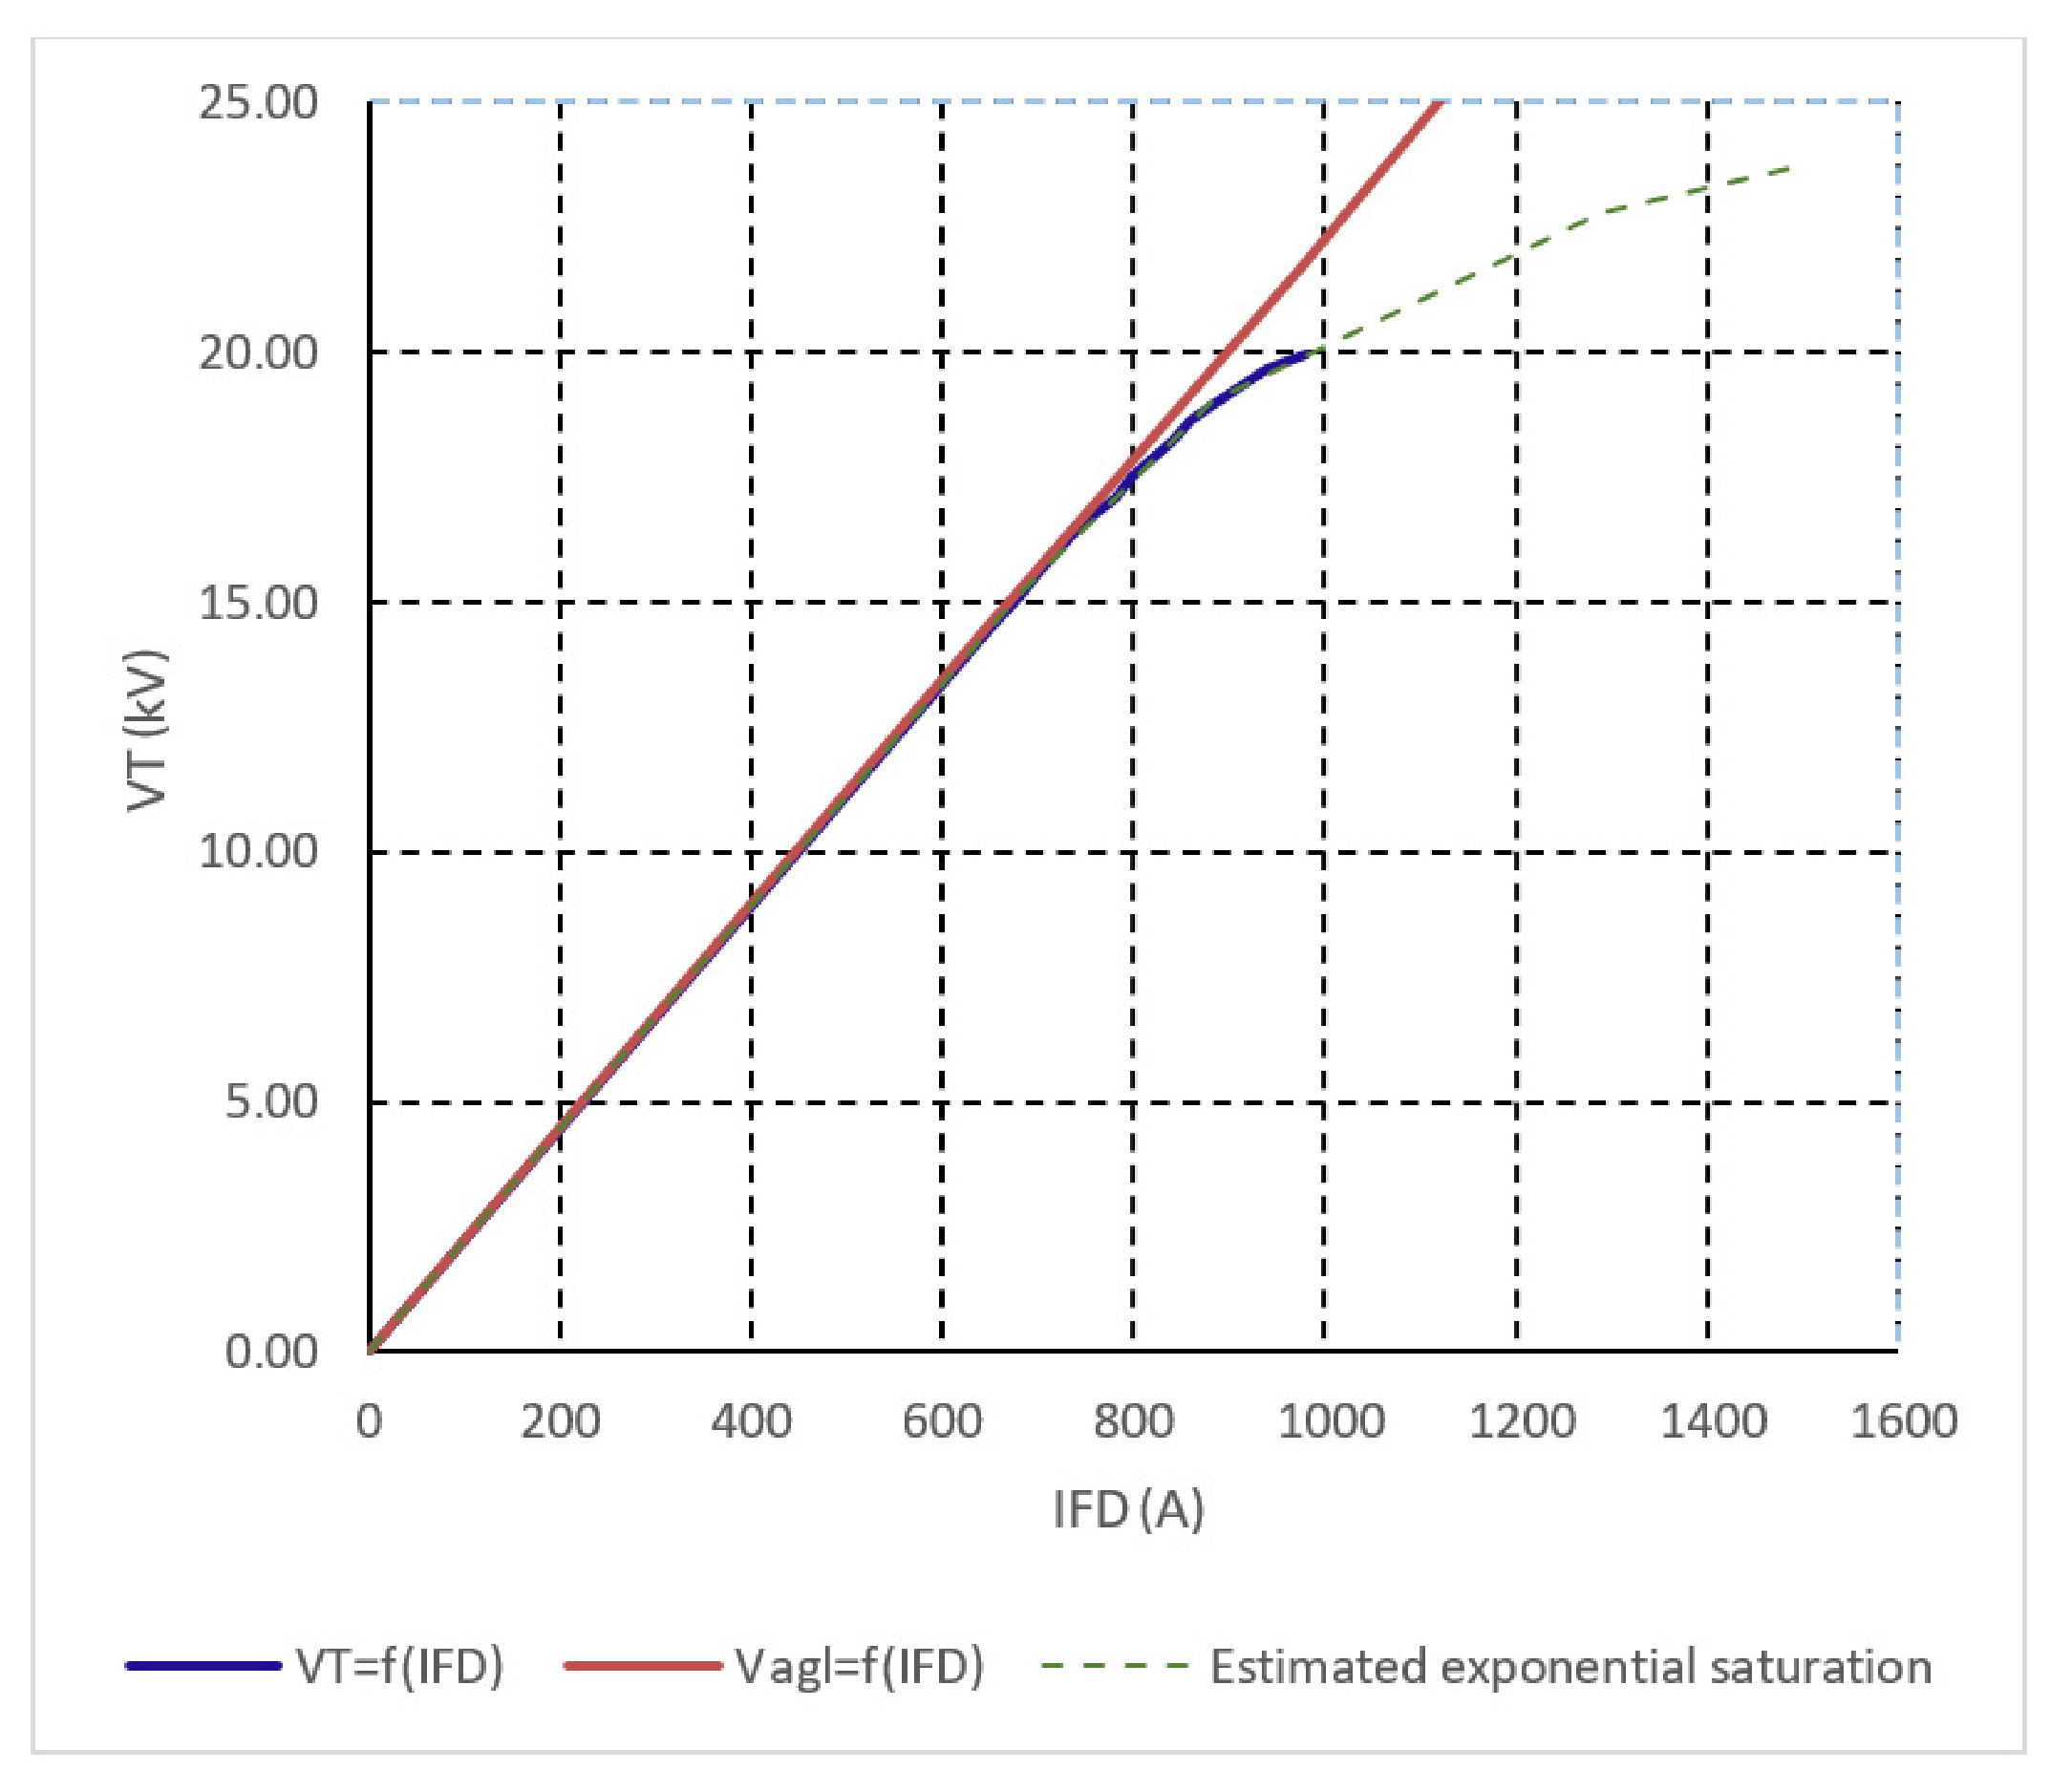
The open-circuit characteristic was obtained at rated rotational speed under no-load conditions. The open-circuit saturation characteristic analysis results are given in Table 1 and Figure 6.
Table 1.
Open-circuit saturation characteristic measurement data for the investigated 524 MVA synchronous generator.
Figure 6.
Open-circuit saturation characteristic of the investigated 524 MVA synchronous generator. The measured terminal voltage and air gap voltage characteristics are used to determine generator saturation parameters for dynamic model development and validation.
- 2.
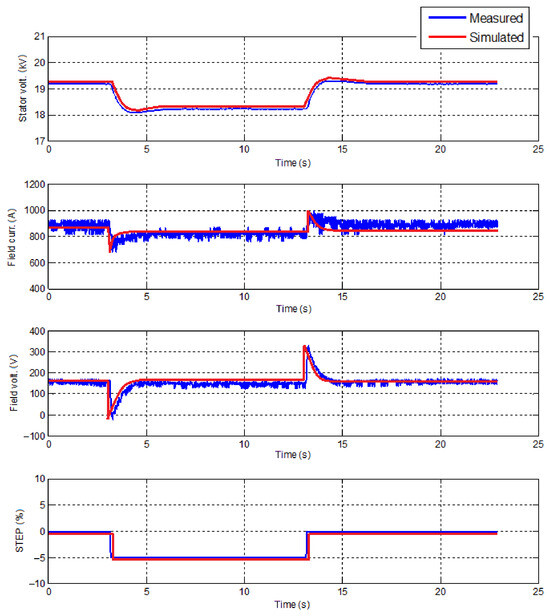
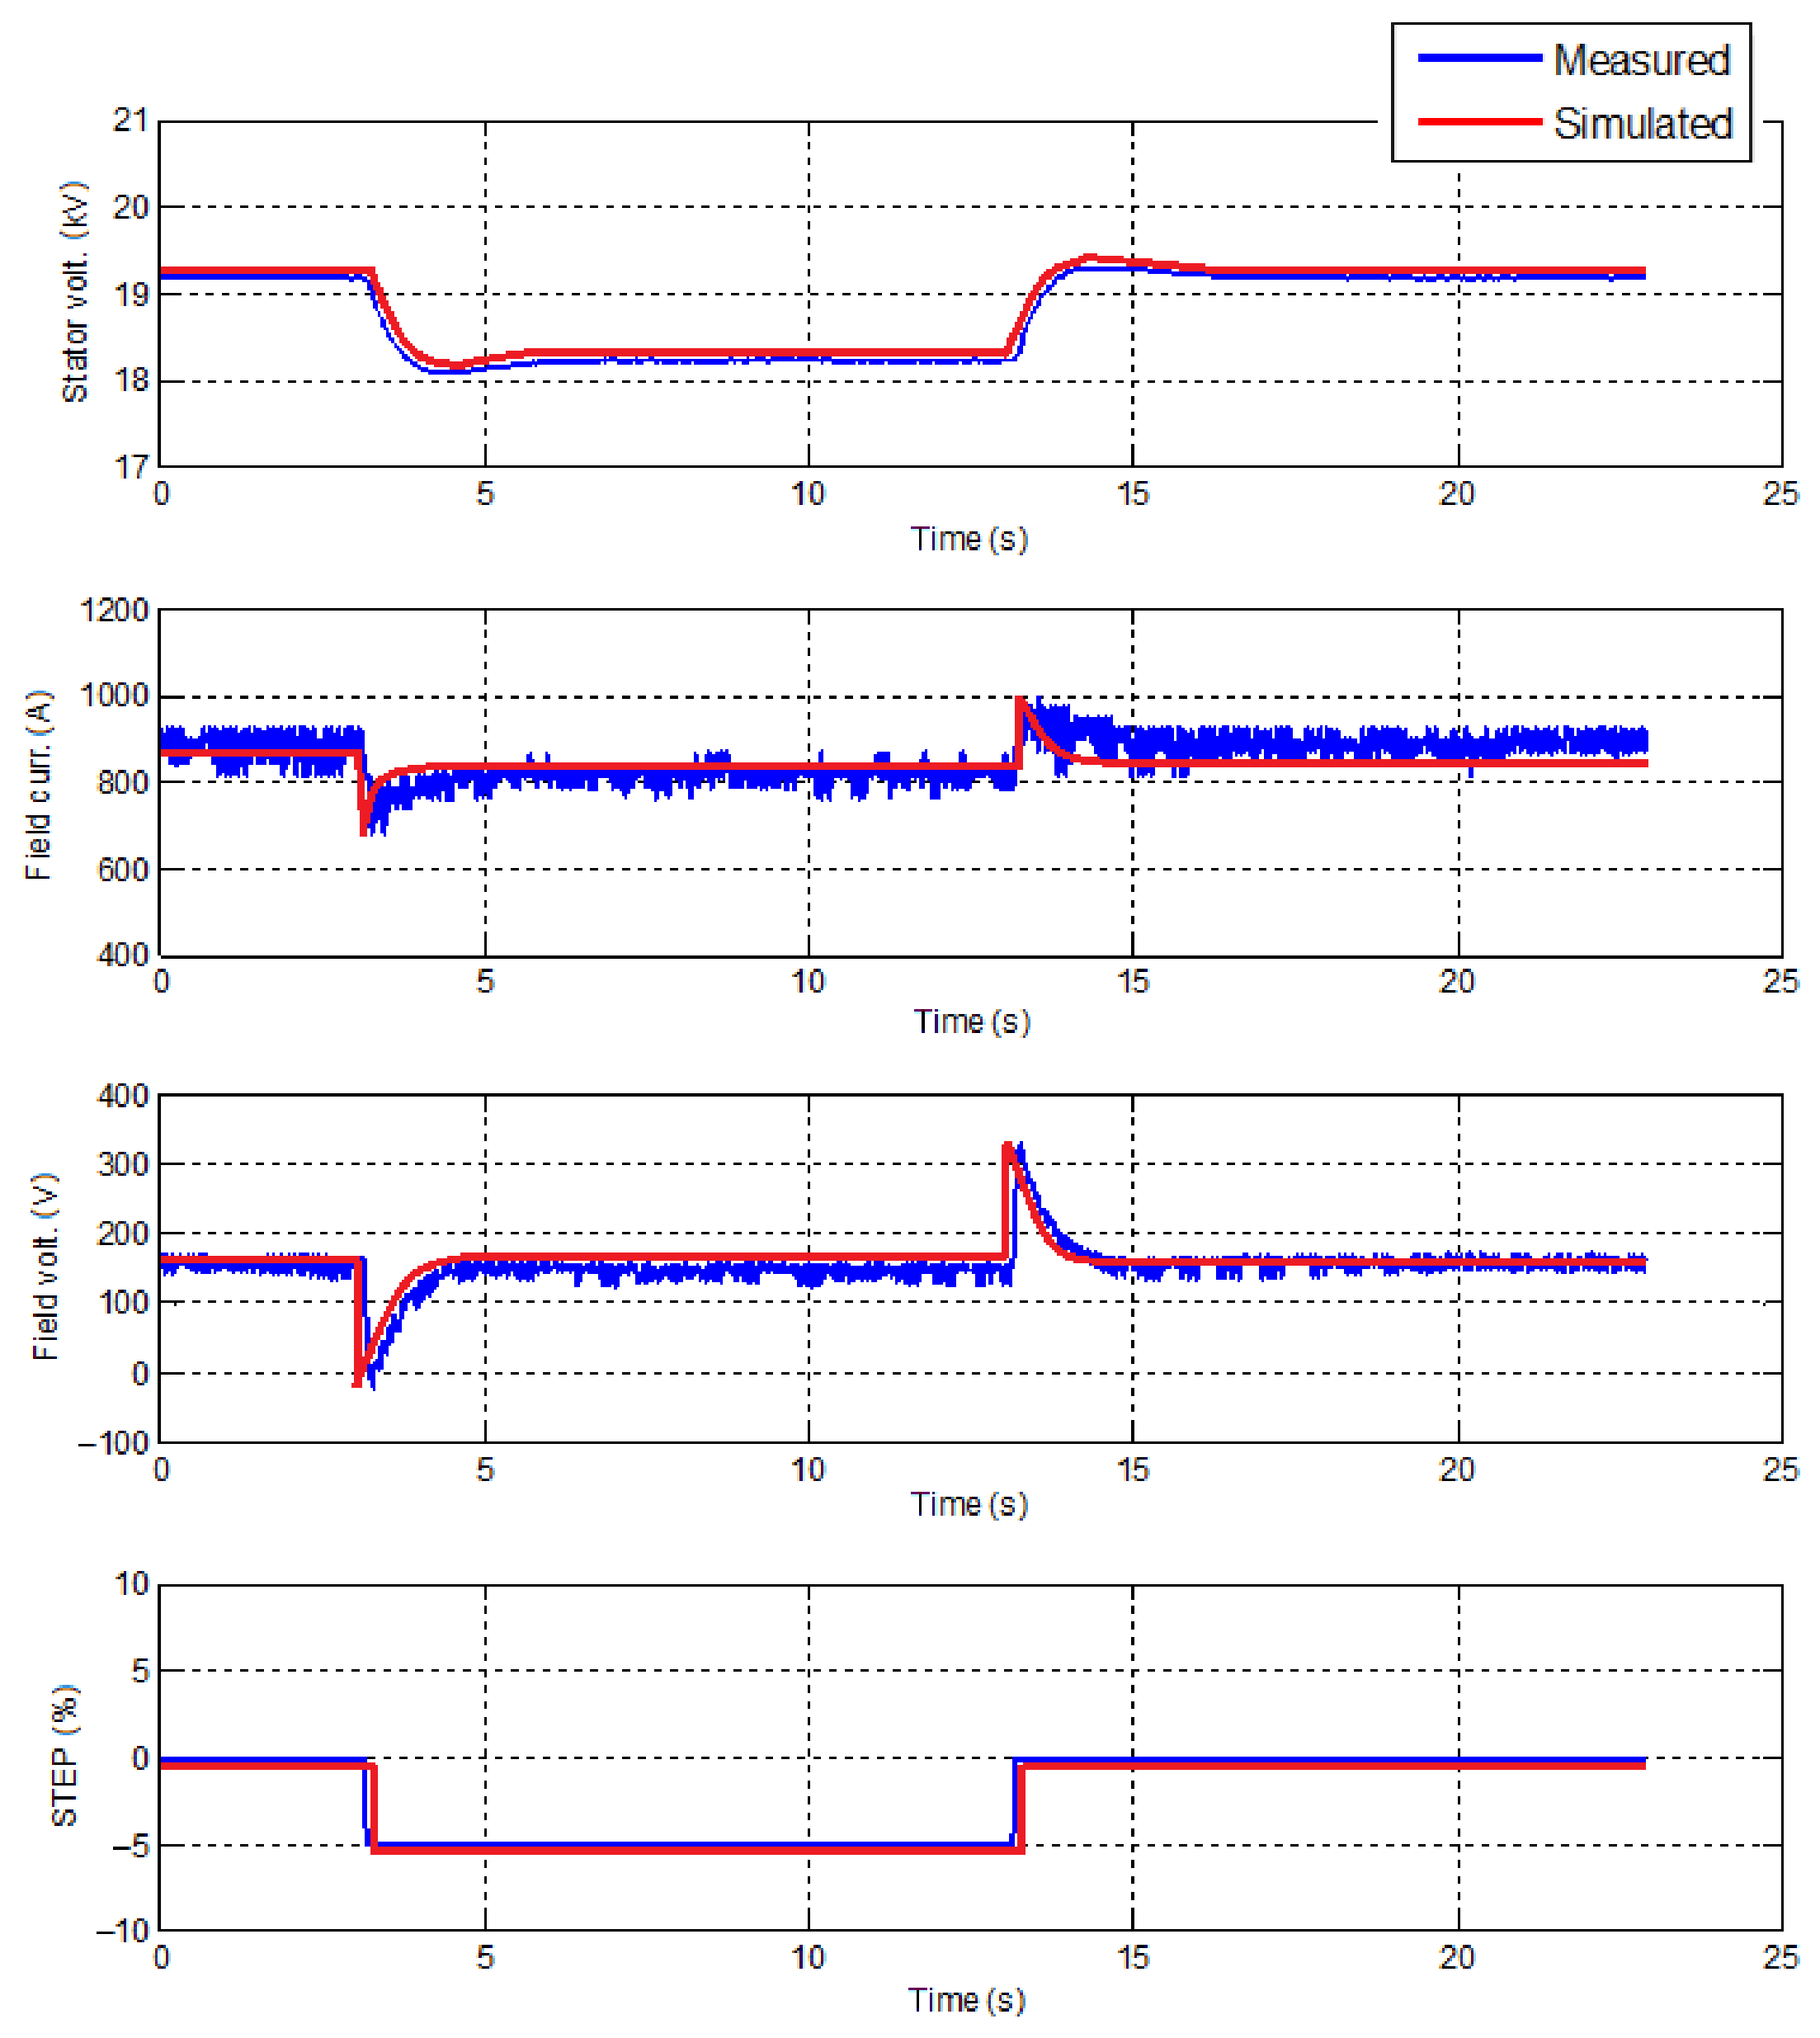
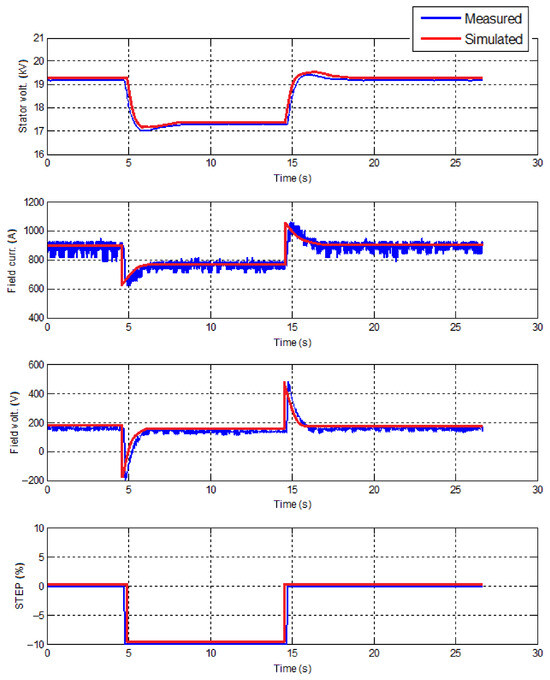
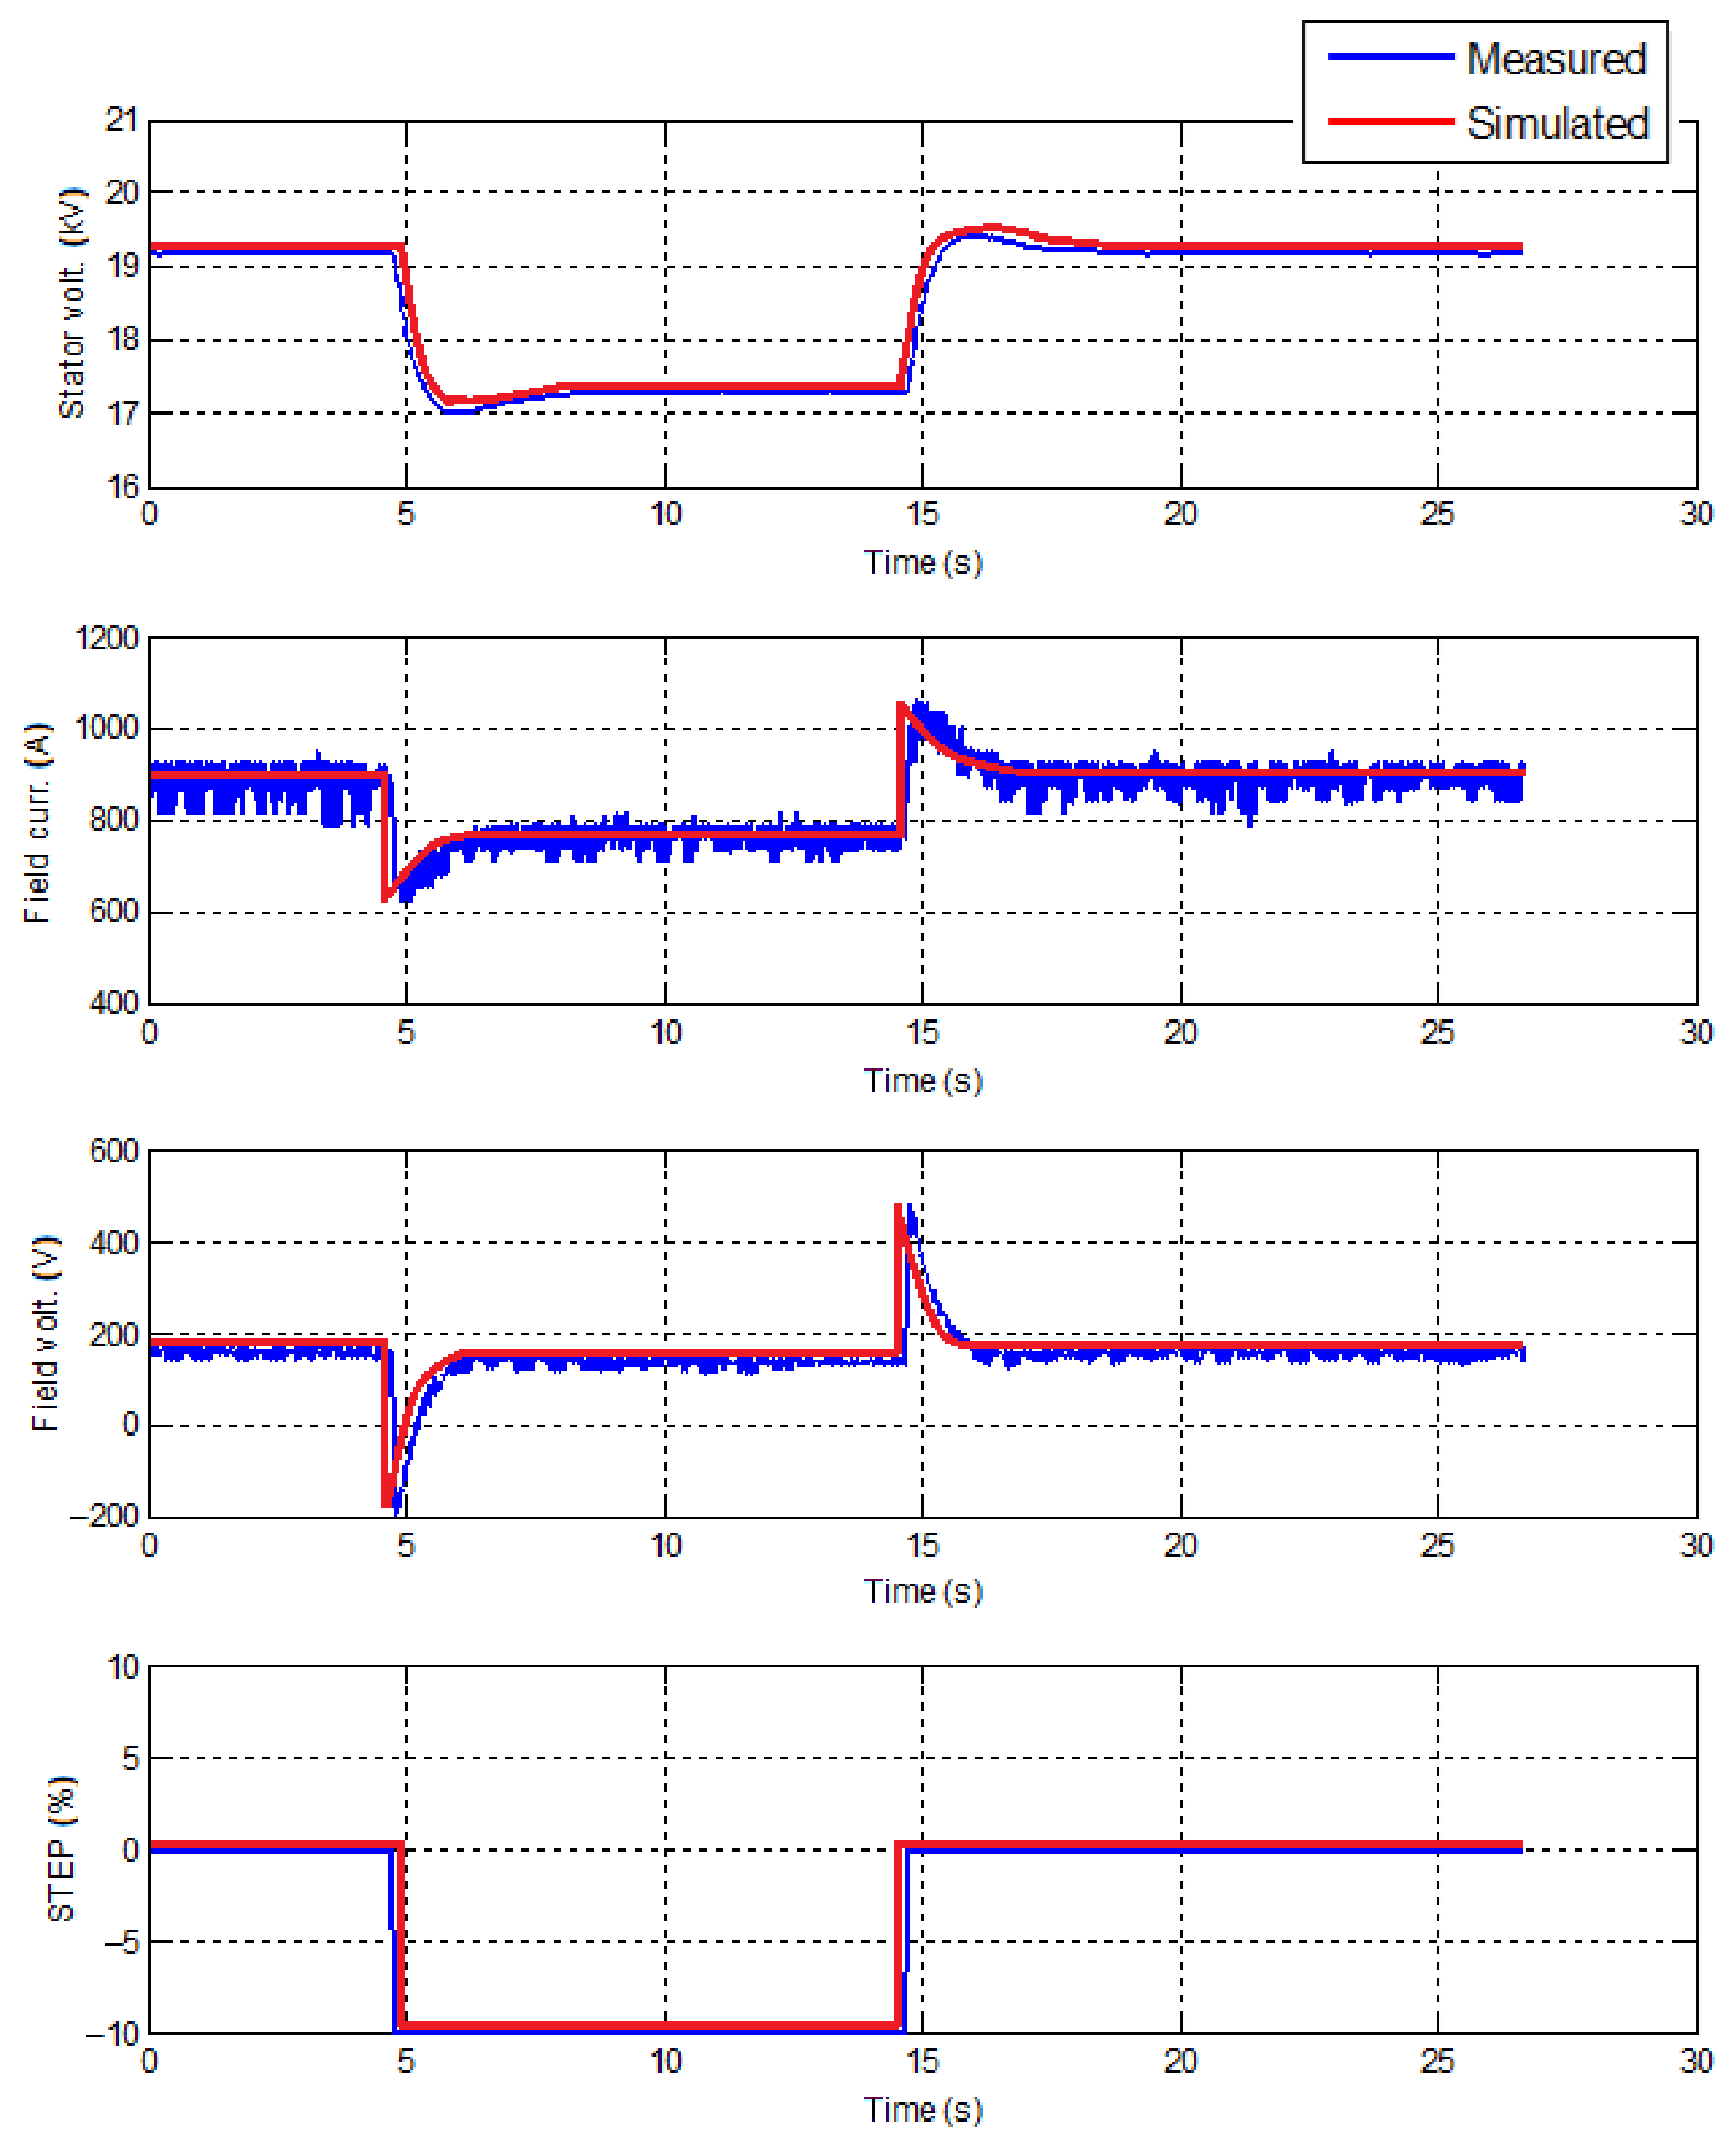
- Full-speed, no-load AVR investigations (step response). Step-response investigations are conducted to check whether the AVR is well tuned and to verify its simulation models. AVR includes the PSS function as well. Step-response investigations are not applicable to analysis damping of inter-area oscillations. AVR was set to voltage control mode [43,44,45,46,47]. The voltage was set to 1 p.u. It was changed to 0.95 p.u. in a step (−5% step). Next, after a pause the voltage set-point was changed to 1 p.u. (+5% step) in a step. The same was repeated with 10% step. Further, voltage set-point was set to 1 p.u. The voltage set-point was changed to 1.02 p.u. in a step (+2% step). After a pause, the voltage set-point was changed to 1 p.u. in a step (−2% step). It was performed for two cases: PSS Off and PSS On.
The step response was investigated under full-speed, no-load conditions. Figure 7 and Figure 8 show the results of 5% and 10% steps, respectively, on AVR set-point under full-speed, no-load conditions.
Figure 7.
Response of the AVR system to a −5%/+5% voltage set-point step under full-speed no-load operating conditions. Measured and simulated responses are compared to evaluate AVR tuning and validate the developed model. The results demonstrate stable voltage regulation and satisfactory agreement between field-test measurements and simulation results.
Figure 8.
Response of the AVR system to a −10%/+10% voltage set-point step under full-speed no-load operating conditions. Measured and simulated responses are compared to evaluate AVR tuning and validate the developed model under larger voltage disturbances. The results demonstrate stable voltage regulation and satisfactory agreement between field-test measurements and simulation results.
- 3.
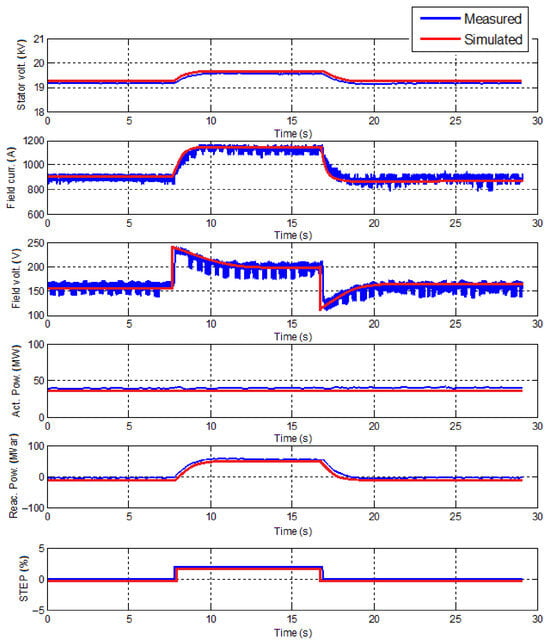
- The load was set to 40 MW for the on-load step-response analysis: the unit active power output was set to 40 MW and reactive power between 0 and 22.25 MVar. Status of PSS was Off. The voltage set-point was changed by +2% in a step. After a pause, voltage set-point was set back to normal in a step.
The generator synchronized at low load (2% step) and response on AVR set-point. Figure 9 shows the results of the 2% step on AVR set-point at low load (40 MW).
Figure 9.
Response of the AVR system to a ±2% voltage set-point step under low-load operating conditions (40 MW) with PSS disabled. Measured and simulated responses are compared to assess AVR performance and model accuracy under synchronized operation. The results indicate stable voltage control and satisfactory agreement between field-test measurements and simulation results.
- 4.
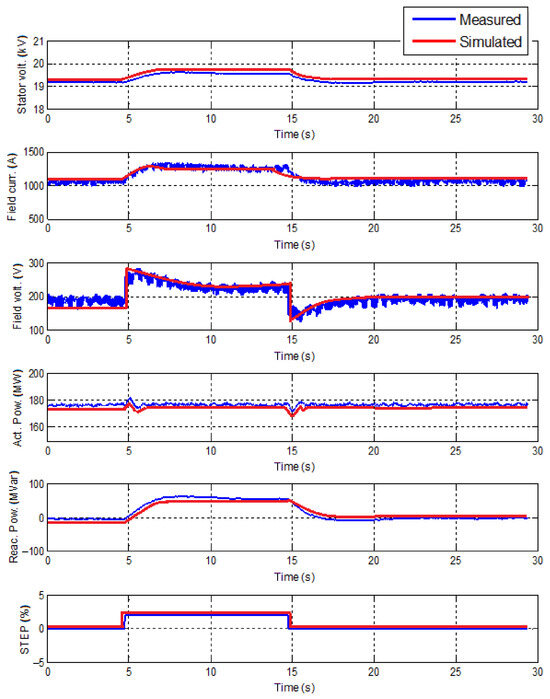
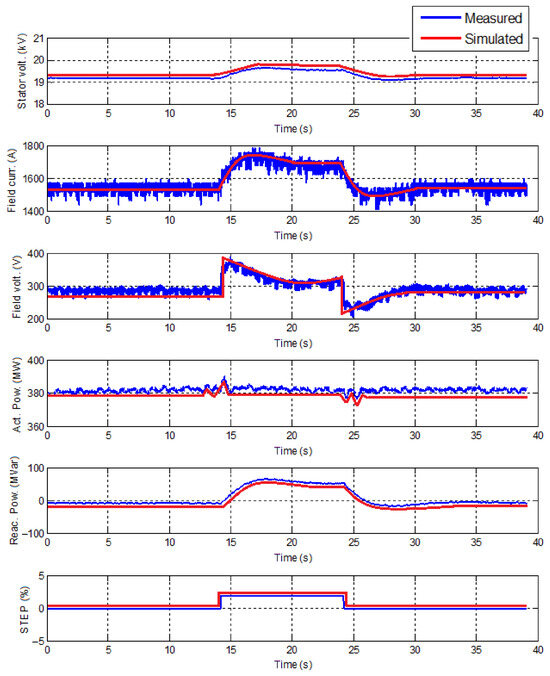
- The load was set to 180 MW for the on-load step-response analysis: the unit active power output was 180 MW and reactive power between 0 and 22.25 MVar. Status of PSS was On. The voltage set-point was changed by +2% in a step. After a pause, the voltage set-point was returned to its nominal value in a single step.
The generator was synchronized at medium load, and its response to an AVR set-point change was evaluated with the PSS enabled. Figure 10 shows the results of the 2% set-point step response at medium load (180 MW) with PSS On.
Figure 10.
Response of the AVR system to a ±2% voltage set-point step under medium-load operating conditions (180 MW) with PSS enabled. Measured and simulated responses are compared to evaluate AVR and PSS performance and validate the developed model under synchronized operation. The results demonstrate stable voltage regulation, effective damping characteristics, and satisfactory agreement between field-test measurements and simulation results.
- 5.
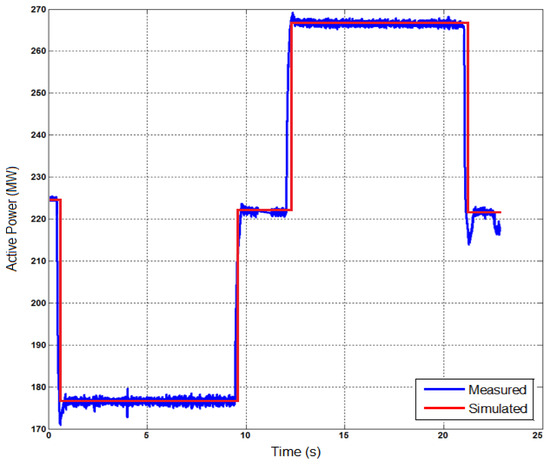
- (225 MW) Frequency step-response analysis (df = ±200 mHz / 50 Hz = 0.004 p.u.). This analysis is to determine complete governor and turbine response dynamic characteristics under different loading conditions. Unit was in regular control mode in which FCR service was provided. Analysis was repeated at low load and high load. For the low-load condition, unit initial power output was Pmin. + FCR, where Pmin. is the minimum stable active power point. For the high-load condition, unit initial power output was Pmax. − FCR, where Pmax. is the maximum generation level observed in the saturation analysis.
At first, the speed droop value (R) was set to 4%. Frequency-signal injection mode was turned on. A frequency deviation signal of +200 mHz (50.2 Hz) was applied. Frequency deviation signal was restored to zero value.
Next, the speed droop value (R) was kept the same (4%). Frequency signal in injection mode was kept on. The frequency deviation signal of −200 mHz (49.8 Hz) was applied. Frequency deviation signal was restored to zero value.
The investigation was performed by introducing a step change in the measured frequency signal while the unit was under isochronous mode of operation. This was implemented via introducing a signal injection in the controller either internally utilizing the available testing function of the plant governor, or via an external analog signal that influences the speed measurement.
Third, the speed droop value (R) was kept the same (4%). Frequency-signal injection mode was kept active. Constant 50 Hz signal was injected as a frequency measurement (or an equivalent action depending on the signal injection type). The controller was switched to isochronous operation mode. +200 mHz frequency deviation was injected in a step (or frequency measurement value was changed to 50.20 Hz) to the controller and was paused until the unit output power increases by more than 5%. Without waiting for stabilization, −200 mHz frequency deviation step was injected (or frequency measurement value was changed to 49.80 Hz) to the controller. Constant 50 Hz signal was injected as a frequency measurement (or an equivalent action depending on the signal injection type).
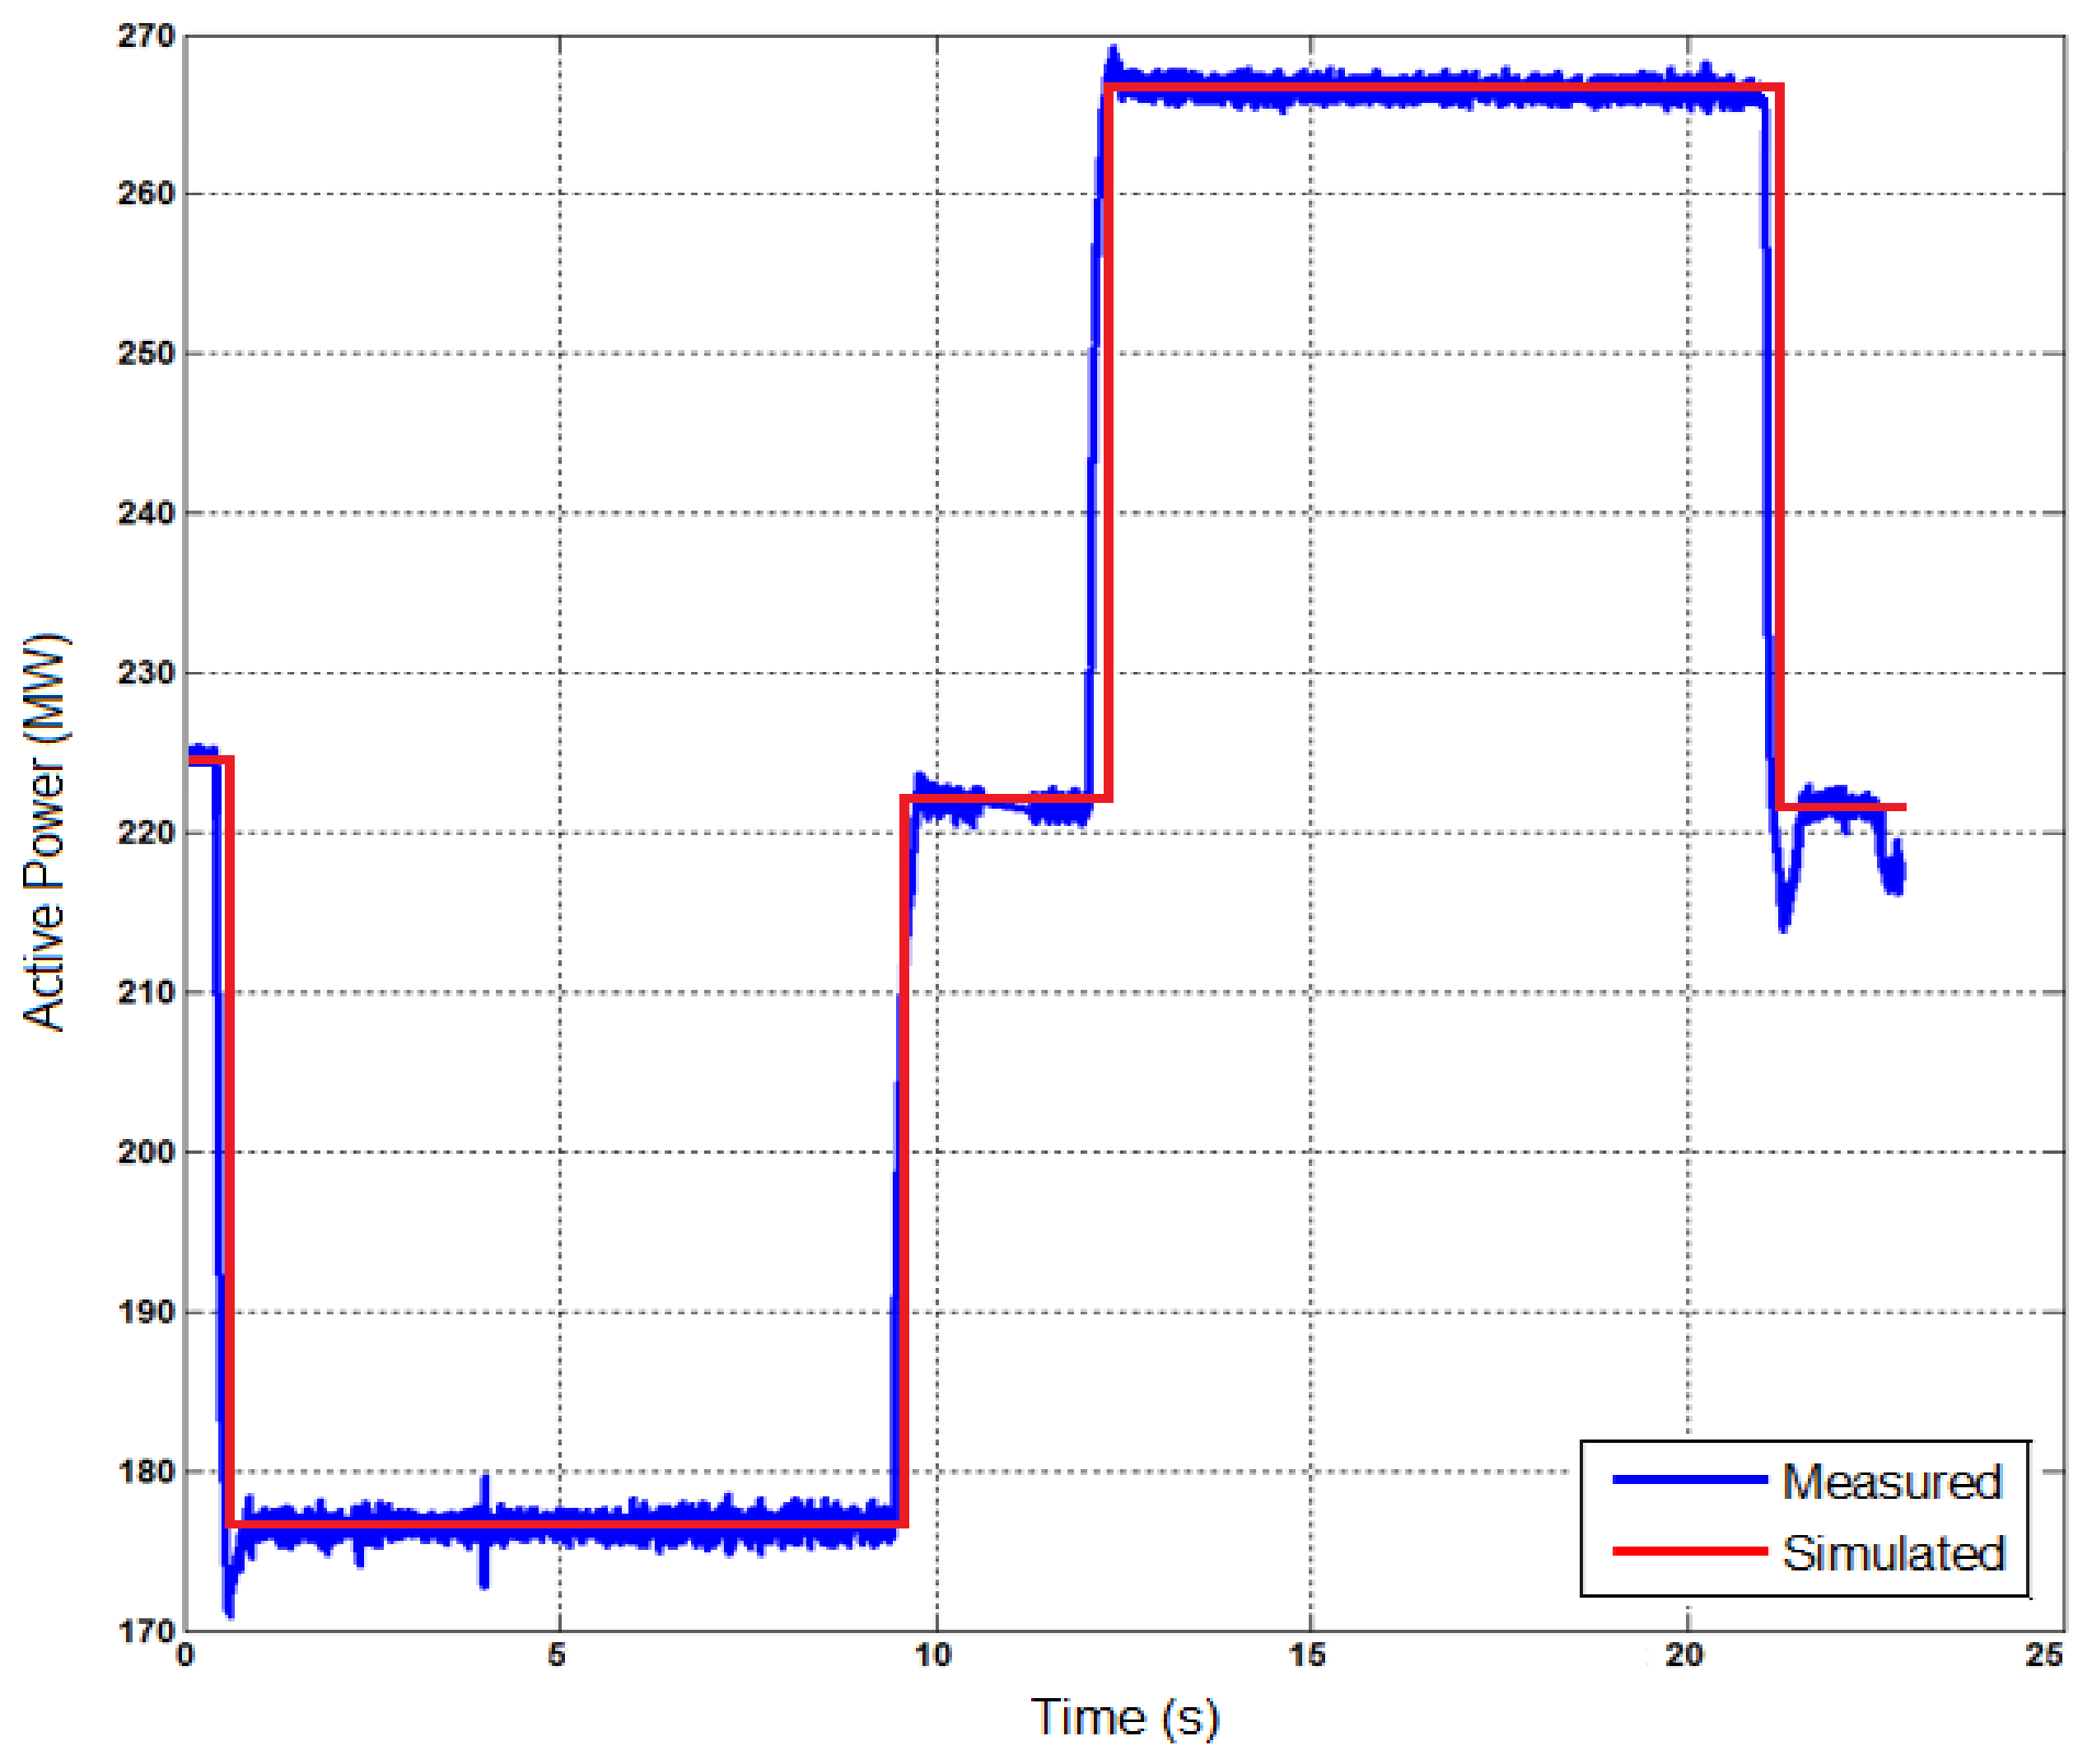
The results show that the unit power controller responds properly to frequency deviations at high load. However, as the maximum load level is reached, the response slows down as the unit responds in an upward direction. Even with this impact, the complete frequency response was activated within less than 30 s. Results of frequency (±200 mHz) deviation step response are shown in Figure 11.
Figure 11.
Response of the CCPB governor and turbine control system to a ±200 mHz frequency step disturbance at 225 MW active power output. Measured and simulated responses are compared to assess the dynamic frequency-response characteristics and model accuracy. The results confirm correct governor operation, timely frequency-response activation, and satisfactory agreement between field-test measurements and simulation results.
A dynamic model of the turbine–governor system was developed in MATLAB and validated against field-test measurements. Results indicate that the model represents unit behavior in case of disturbances.
- 6.
- Frequency-domain investigations were performed to evaluate the dynamic characteristics of the AVR and PSS of the investigated 524 MVA CCPB. The objective of the analysis was to assess the damping performance of the excitation control system and to identify the frequency ranges in which the PSS contributes to oscillation suppression.
The investigations were conducted under high-load operating conditions with the generator synchronized to the power system. A white-noise signal was injected into the AVR summing junction, and the resulting input and output signals were recorded for frequency-response analysis. The frequency-domain characteristics were obtained using Fourier-transform techniques. The tests were performed separately with the PSS disabled, enabling us to evaluate its influence on system dynamics.
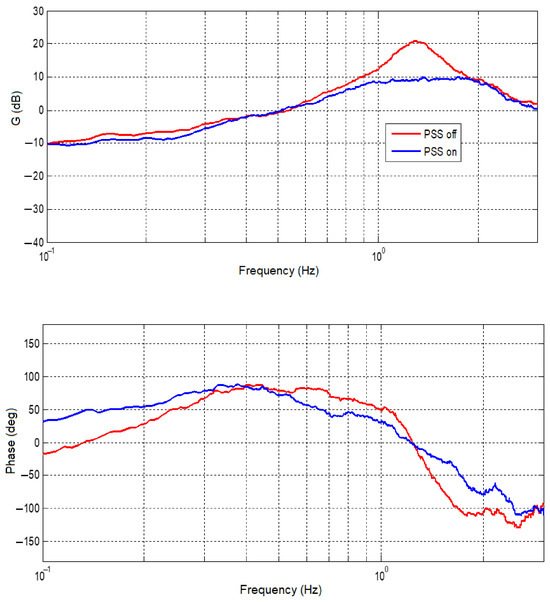
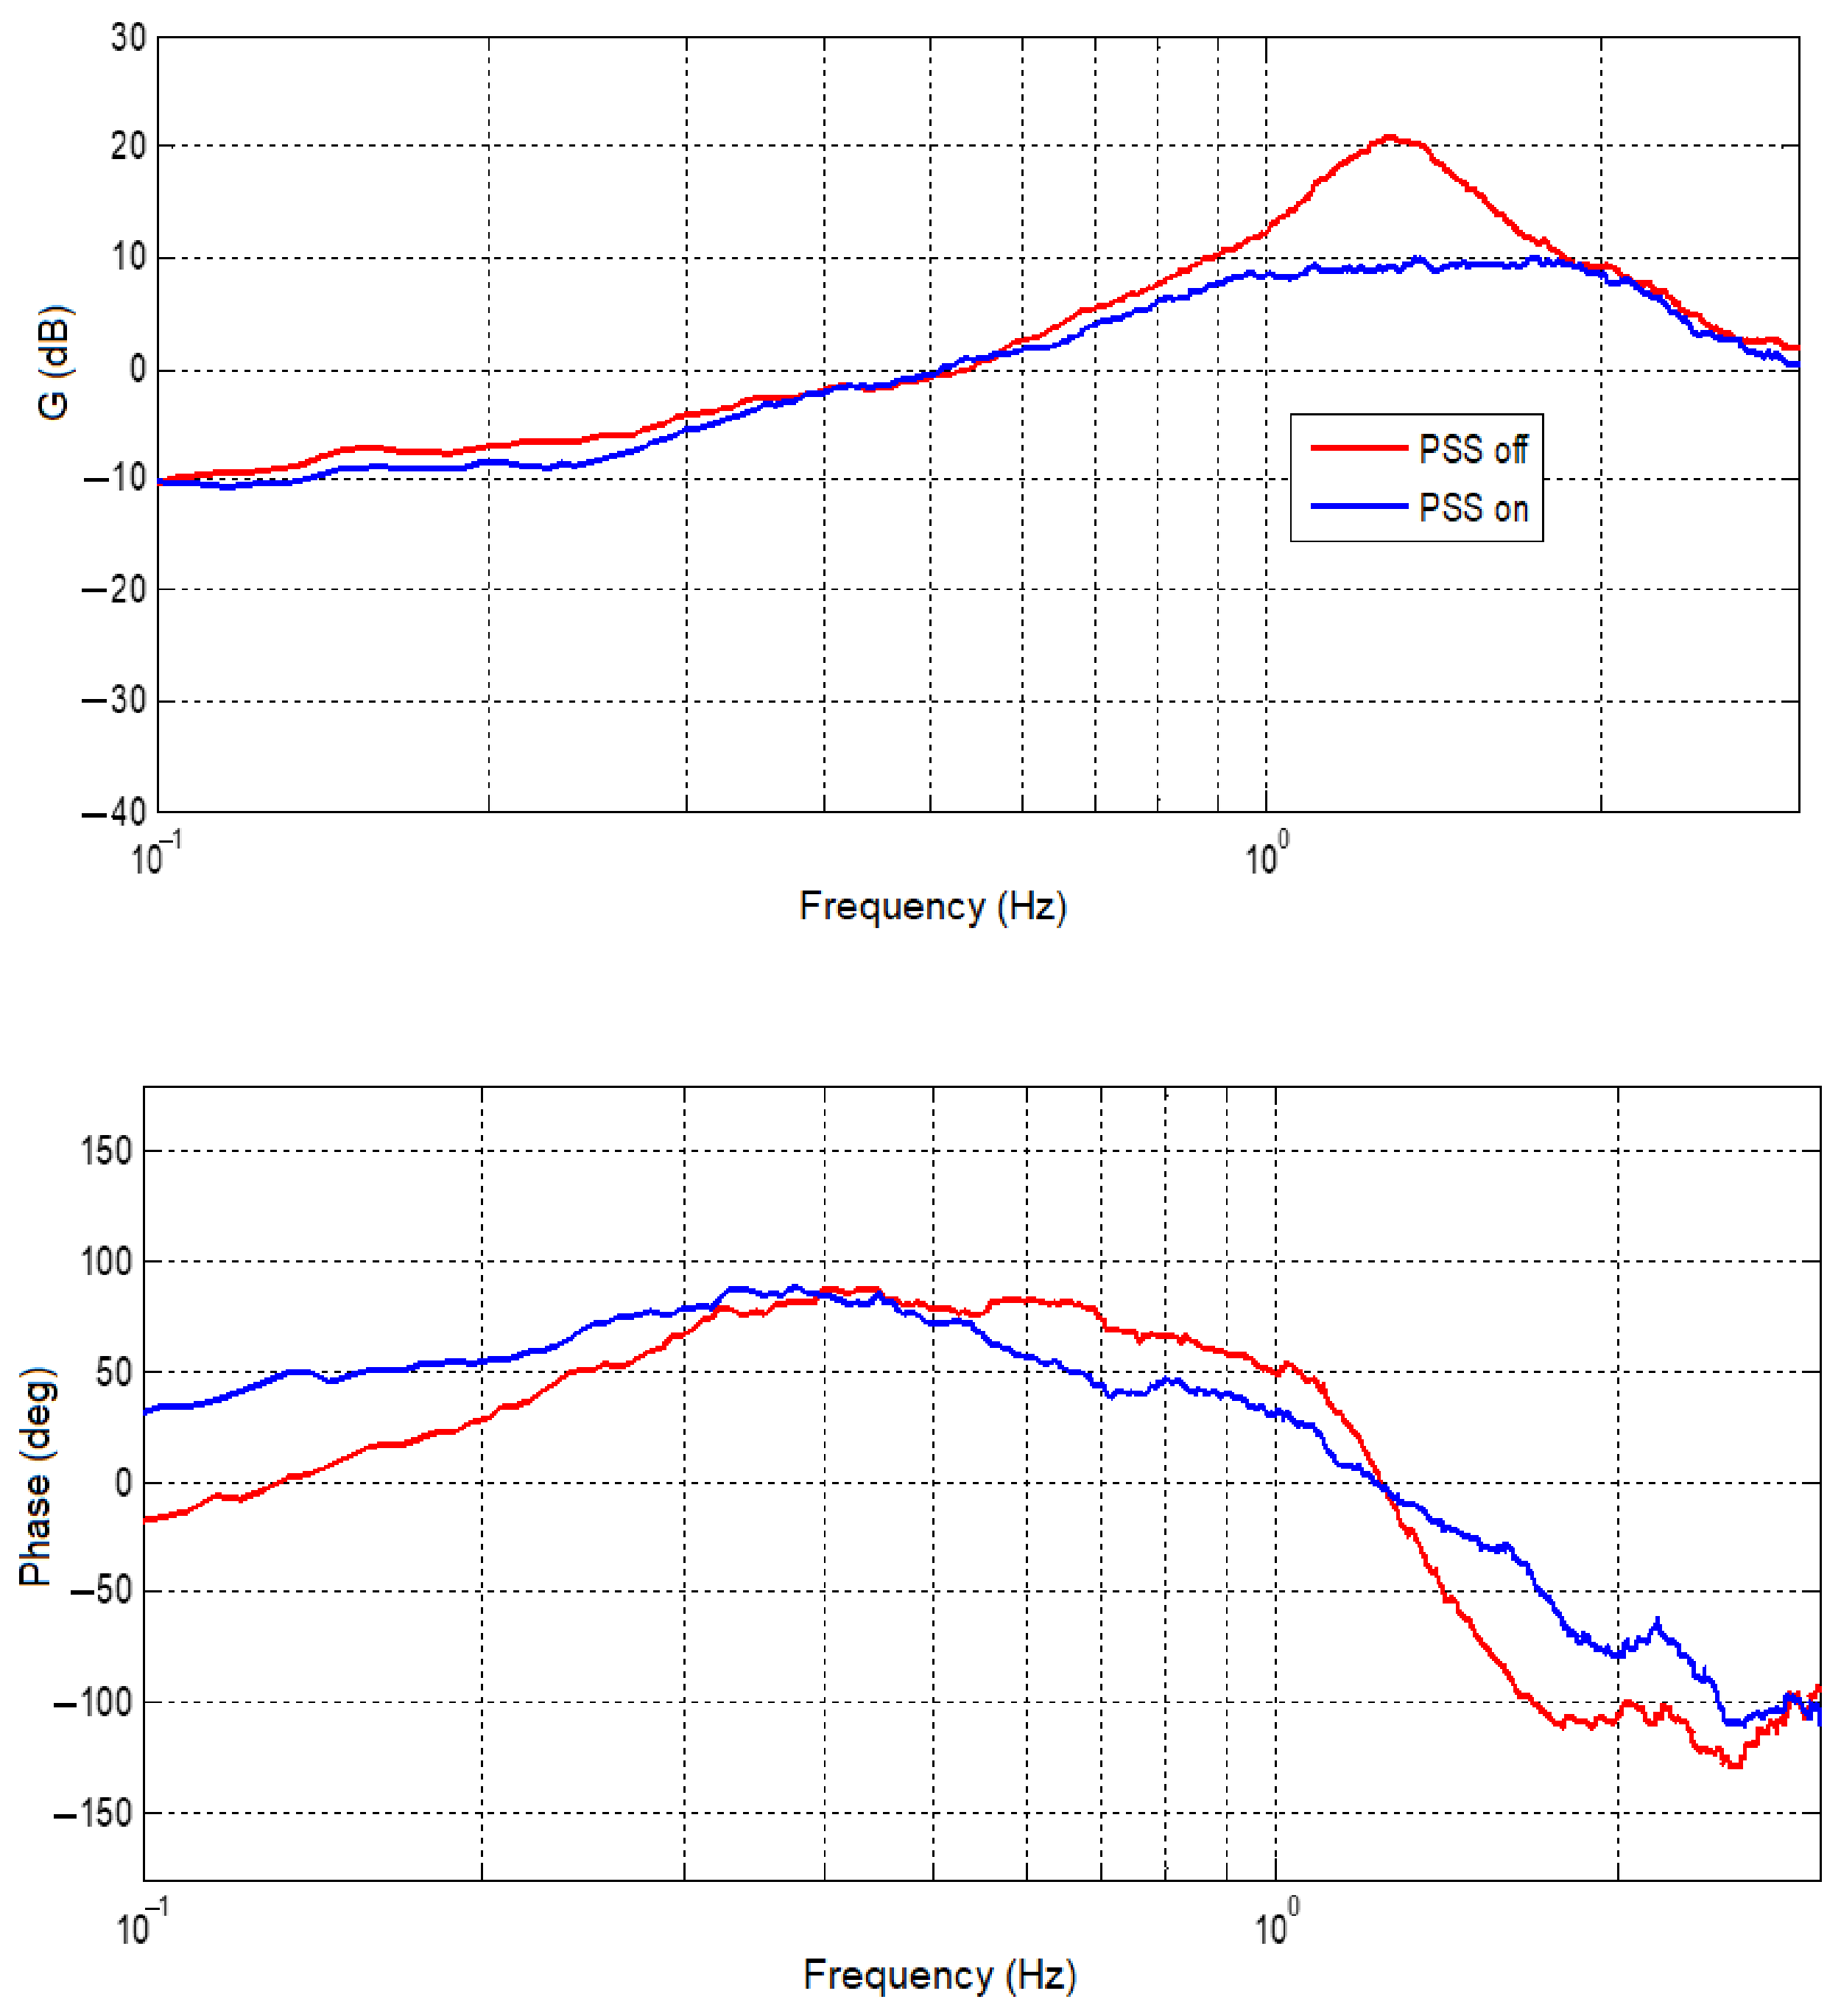
The frequency-response analysis allows the identification of local and inter-area oscillation modes and provides information on the effectiveness of the excitation control system in damping electromechanical oscillations. The comparison between the PSS Off and PSS On operating conditions is presented in Figure 12.
Figure 12.
Frequency-domain response of the AVR/PSS control system of the investigated 524 MVA CCPB under high-load operating conditions. The analysis was performed using frequency-signal injection to evaluate the damping characteristics of the excitation system. The responses obtained with PSS enabled (blue) and disabled (red) are compared, demonstrating improved damping of local oscillation modes and enhanced dynamic performance when the PSS is in operation.
The results show that the AVR is properly tuned and provides fast and stable voltage control. As shown in Figure 12, the PSS significantly improves the damping of the local oscillation mode occurring around 1.1 Hz. Furthermore, improved damping characteristics are observed at lower oscillation frequencies. In the frequency range between approximately 1.5 Hz and 2.1 Hz, the influence of the PSS on damping is limited, with no significant improvement or degradation of oscillatory behavior observed.
- 7.(a)
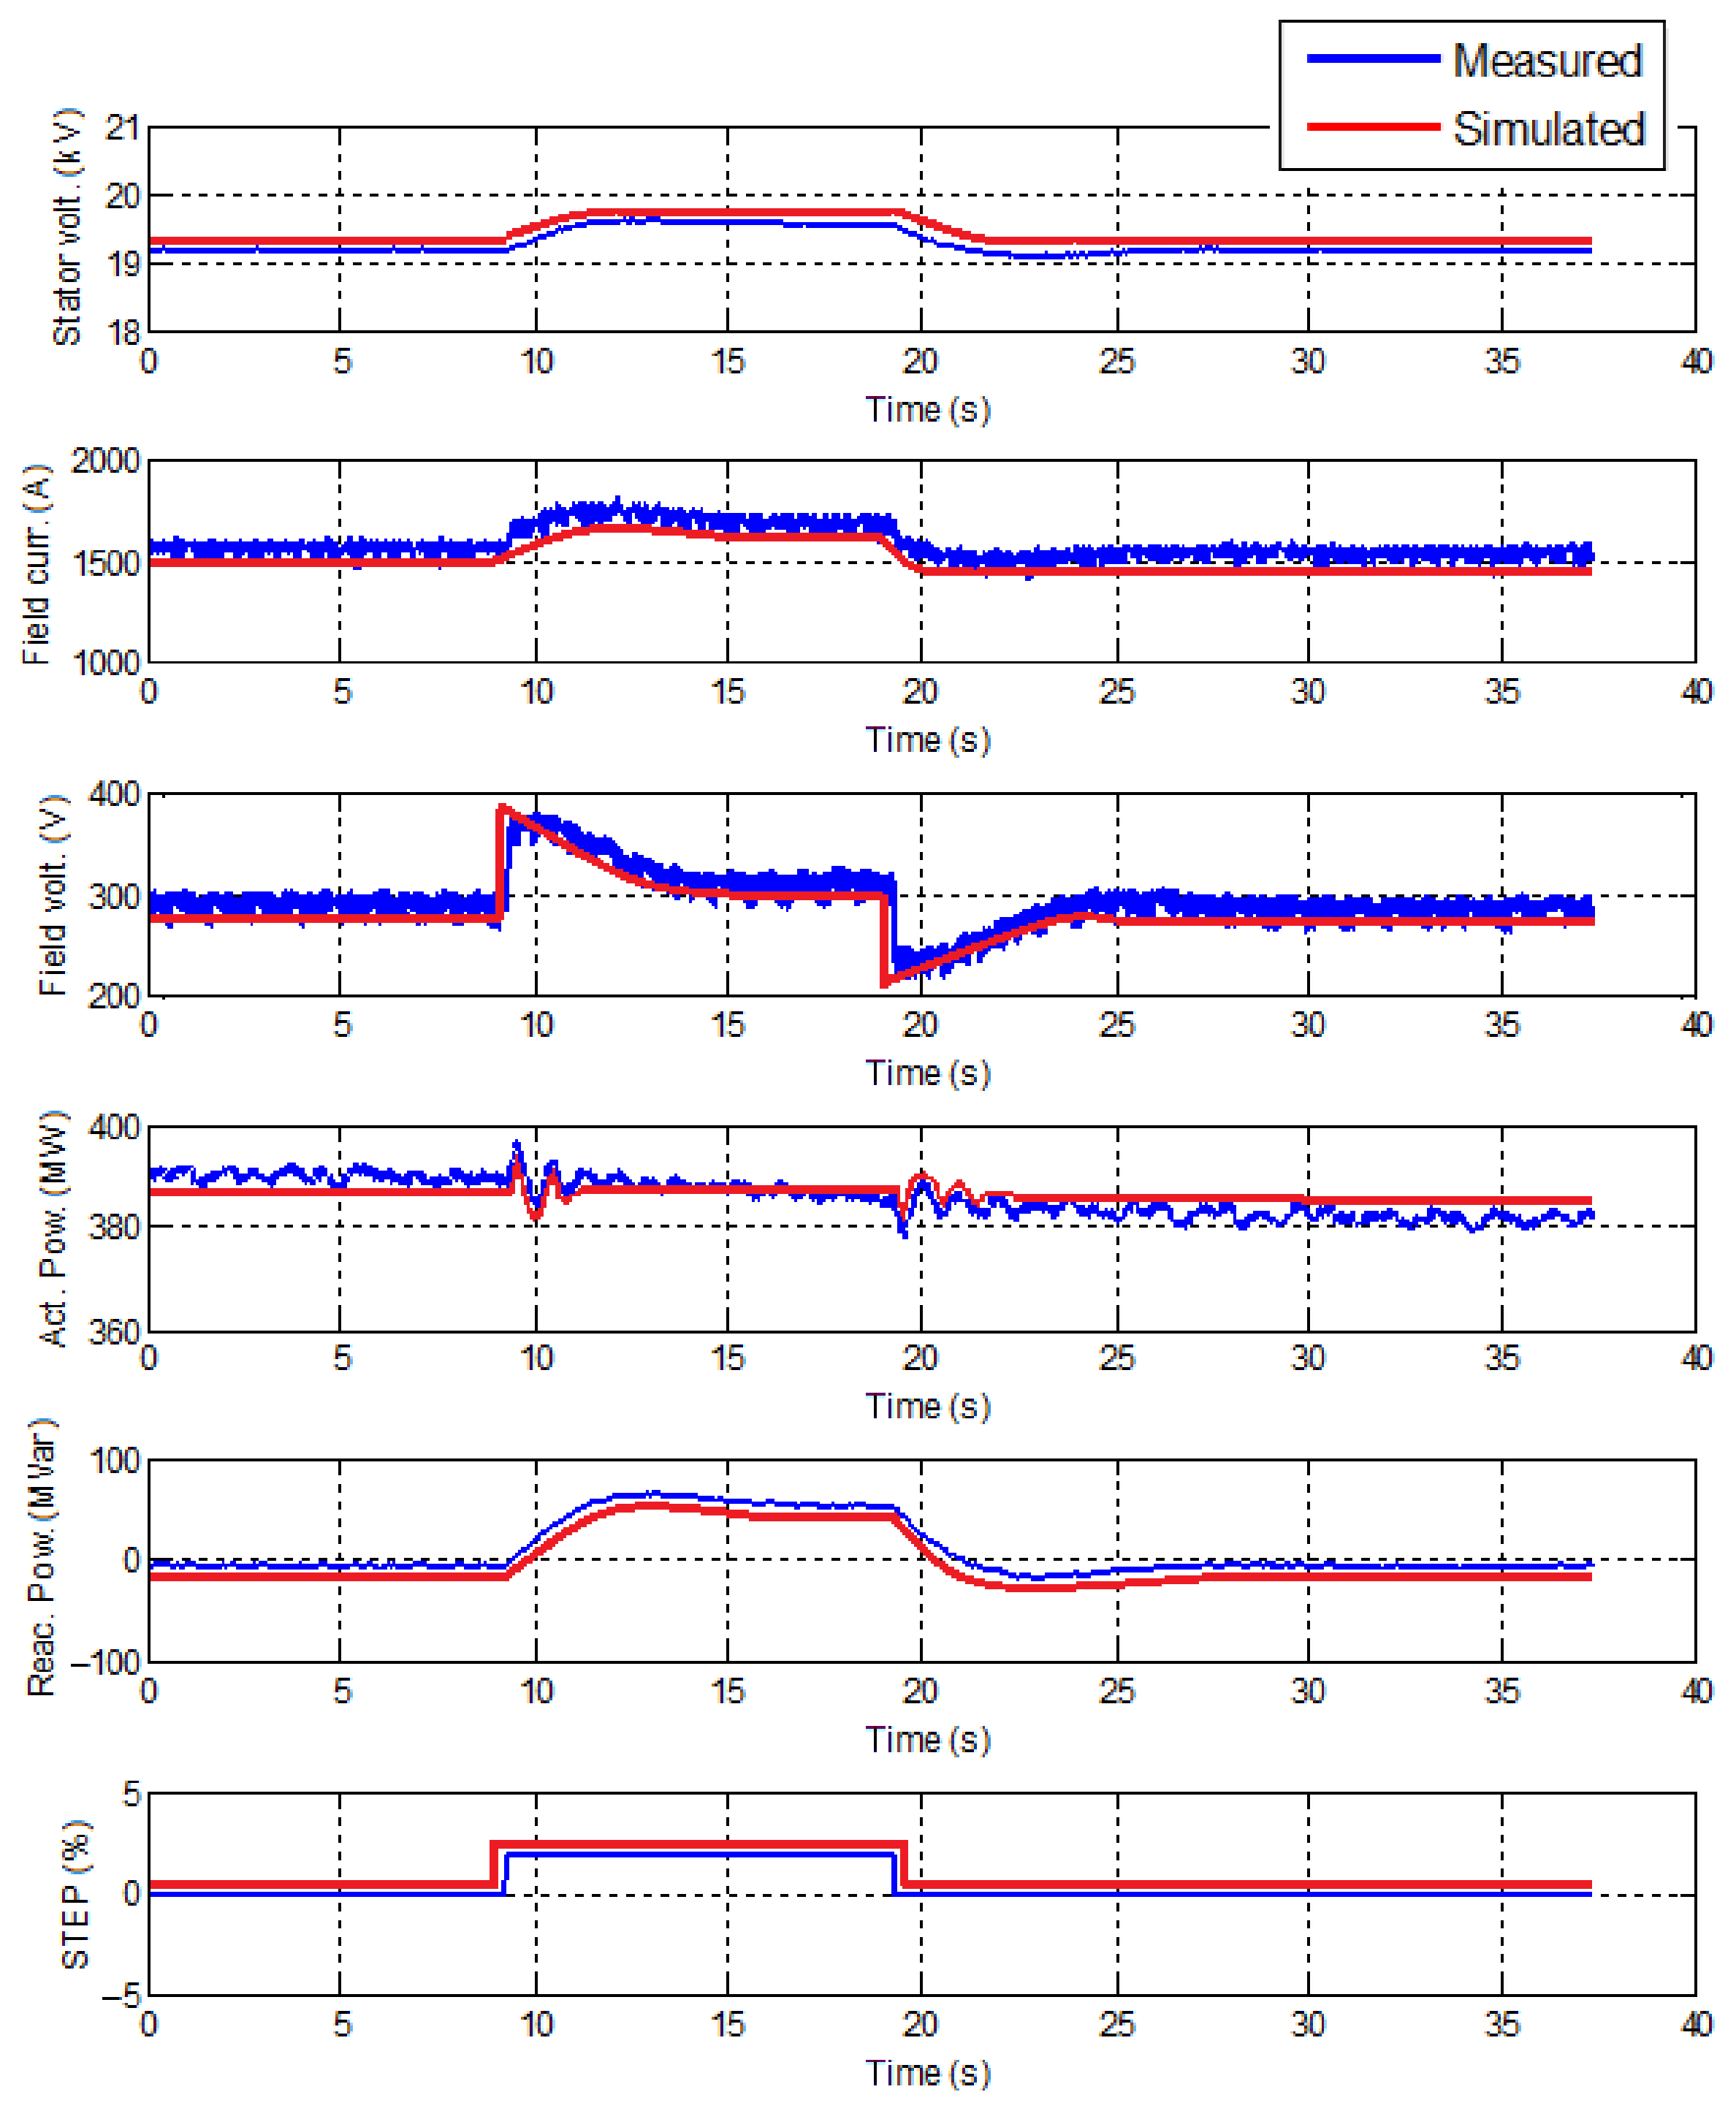
- The load was set to 380 MW for the on-load step-response analysis: the unit active power output was set to 380 MW (ramping rate 20 MW/min.) and reactive power between 0 and 22.25 MVar. Status of PSS was On. Change voltage set-point by +2% step was made. After a pause, the voltage set-point was set back to normal. 1/fα type noise signal for frequency range of 0.1–4.0 Hz with amplitude in range 1–3% was injected to the injection point.
- 7.(b)
- On load step response analysis: Status of PSS was Off. The voltage set-point was set to +2% by a step. The voltage set-point was set back to normal after a pause. 1/fα type noise signal for frequency range of 0.1–4.0 Hz with amplitude in range 1–3% was injected to the injection point.
Figure 13 shows the obtained results of the 2% set-point step response at high load (380 MW) with PSS On and Figure 14 with PSS Off at same load level.
Figure 13.
Response of the AVR system to a ±2% voltage set-point step under high-load operating conditions (380 MW) with PSS enabled. Measured and simulated responses are compared to evaluate AVR and PSS performance and validate the developed model under synchronized operation. The results demonstrate stable voltage regulation, effective damping characteristics, and satisfactory agreement between field-test measurements and simulation results.
Figure 14.
Response of the AVR system to a ±2% voltage set-point step under high-load operating conditions (380 MW) with PSS disabled. Measured and simulated responses are compared to assess AVR performance and validate the developed model. The results demonstrate stable voltage regulation and satisfactory agreement between field-test measurements and simulation results, while highlighting the influence of the PSS on oscillation damping characteristics.
The agreement between measured and simulated responses was evaluated by comparing the principal dynamic characteristics of the generating unit, including response time, settling behavior, steady-state operating point, and overall response shape. The comparison demonstrated satisfactory agreement between measured and simulated responses across the investigated operating conditions, confirming the suitability of the developed model for frequency-response and control-performance studies.
- 8.
- Turbine and governor system model validation investigations. Model validation was performed to assess the capability of the developed turbine–governor model to reproduce the dynamic behavior of the investigated CCPB under representative operating conditions. The validation focused on the response of the turbine control system to changes in active power demand, valve position, and frequency-control signals.
The investigations were conducted under synchronized operating conditions over a range of loading levels. The turbine control system was tested in valve-position control mode and power-control mode to evaluate the relationship between control commands, valve movement, and resulting active power output. For steam-turbine operation, the boiler control system was configured to follow turbine demand under coordinated control conditions.
The validation procedure consisted of applying incremental changes in valve position and active power set-points, typically corresponding to approximately 5% changes in active power output. The resulting responses were recorded and compared with simulation results. Particular attention was given to valve-position saturation effects, governor non-linearities, and possible mechanical backlash within the control mechanism.
The investigations also assessed the relationship between valve position and effective flow area. This analysis enabled the identification of saturation regions where further increases in valve position no longer produced proportional increases in flow or active power output. Such characteristics were incorporated into the developed model to improve its representation of the actual generating unit.
In addition, synchronization and loading investigations were performed to evaluate turbine–governor behavior during power-output changes. The measured responses were compared with simulation results with respect to response initiation time, transient behavior, settling characteristics, steady-state operating point, and overall response shape.
The comparison demonstrated satisfactory agreement between measured and simulated responses across the investigated operating conditions. The obtained results confirm that the developed turbine–governor model adequately represents the dynamic behavior of the investigated CCPB and is suitable for frequency-response, reserve-provision, and control-performance studies.
5. Discussion
The analysis conducted in this study emphasizes the critical importance of effective FD management in the European power grid, particularly focusing on the application of CCPB as a strategic component for stabilizing frequency deviations. The findings demonstrate that persistent and significant FDs have been a growing concern in Continental Europe’s electric power systems since 2023, necessitating improved control strategies and enhanced coordination mechanisms among energy blocks to maintain grid stability.
One of the primary solutions explored in the study is the deployment of AGC, which effectively balances power generation and demand in real time, thereby mitigating FD impacts. The integration of AGC with primary and secondary control measures enhances system reliability, ensuring frequency quality and reducing deviation risks. The research further discusses the implementation of FCR as a proactive measure for frequency stabilization post-disturbances. By dynamically adjusting power outputs, FCR provides a buffer against unexpected frequency drops, maintaining grid stability.
The study’s results suggest that advanced control techniques, coupled with strategic infrastructural adjustments, are vital for reducing the frequency deviation incidents that have become increasingly prevalent. Enhancing the coordination of power reserves, optimizing control of CCPB, and integrating robust frequency management strategies are fundamental steps toward a more resilient and stable European power grid.
6. Conclusions
This study investigated the dynamic performance of a CCPB under frequency-control and voltage-control conditions relevant to interconnected power-system operation. Field investigations, signal-injection tests, and model-validation procedures were performed to assess the performance of the governor, AVR, PSS, and FCR functionality.
The results demonstrate that the AVR provides fast and stable voltage control. The frequency-response analysis confirmed that the PSS provides effective damping of local oscillation modes around 1.1 Hz and improves damping performance at lower oscillation frequencies. For oscillation frequencies between approximately 1.5 Hz and 2.1 Hz, no significant influence of the PSS on damping characteristics was observed.
The governor system was found to provide a well-tuned response to frequency deviations and active-power set-point changes. The investigated CCPB was capable of delivering the required response in both directions within the specified activation time of 30 s under high-load operating conditions.
The conducted investigations also confirmed the suitability of step-response testing and frequency-signal injection methods for the identification and validation of governor and excitation-system dynamics. The results indicate that clear and repeatable test signals are required to accurately assess the dynamic characteristics of the generating unit and to establish reliable model validation conditions.
The validated CCPB model and the obtained field-test results provide a basis for assessing generating-unit participation in frequency-control services, including AGC and FCR provision. The study demonstrates the capability of the investigated unit to satisfy the technical requirements associated with frequency-response and reserve-provision services.
The results presented in this work relate to generating-unit performance and control-system validation. The study does not quantify system-wide impacts such as reductions in frequency deviations, RoCoF, ACE or FCR activation frequency, which would require dedicated power system-level simulations involving multiple generating units, network constraints, reserve allocation mechanisms, and operating scenarios. Such investigations are considered a subject for future research.
Author Contributions
Conceptualization, R.L., E.P. and R.D.; methodology, R.R., T.Š. and K.O.; software, M.K., T.Š. and E.P.; validation, R.L., R.D. and R.R.; formal analysis, K.O. and E.P.; investigation, M.K. and R.L.; resources, R.R., M.K., T.Š. and R.D.; data curation, R.L., K.O., T.Š. and R.R.; writing—original draft preparation, R.D., T.Š. and E.P.; writing—review and editing, R.L., R.D., K.O., M.K., E.P. and R.R.; visualization, R.L., R.R., M.K. and K.O. All authors have read and agreed to the published version of the manuscript.
Funding
This research was funded by the “Technology and Physics Science Excellence Center” (TiFEC) grant No. S-A-UEI-23-1, financed by the Research Council of Lithuania.
Data Availability Statement
The data presented in this study are available from the corresponding author upon reasonable request. The datasets include field-test measurements and model-validation data obtained from an operating combined cycle power plant. The data are not publicly available due to confidentiality and commercial restrictions.
Conflicts of Interest
The authors declare no conflicts of interest.
References
- Kez, D.A.; Foley, A.M.; Ahmed, F.; Morrow, D.J. Overview of frequency control techniques in power systems with high inverter-based resources: Challenges and mitigation measures. IET Smart Grid 2023, 6, 447–469. [Google Scholar] [CrossRef] [Scilit]
- Bompard, E.; Zalzar, S.; Huang, T.; Purvins, A.; Masera, M. Baltic power systems integration into the EU market coupling under different desynchronization schemes: A comparative market analysis. Energies 2018, 11, 1945. [Google Scholar] [CrossRef] [Scilit]
- Dotto, A.; Sacchi, R.; Satta, F.; Campora, U. Dynamic performance simulation of combined gas electric and steam power plants for cruise-ferry ships. Next Energy 2023, 1, 100020. [Google Scholar] [CrossRef] [Scilit]
- Azizipanah–Abarghooee, R.; Malekpour, M.; Aljarrah, R.; Karimi, M.; Terzija, V. Disturbance size estimation in Great Britain power system including combined cycle gas turbine power stations. Int. J. Elect. Power Energy Syst. 2024, 155, 109674. [Google Scholar] [CrossRef] [Scilit]
- Alpaslan, E.; Umut Karaoğlan, M.; Ozgur Colpan, C. Investigation of drive cycle simulation performance for electric, hybrid, and fuel cell powertrains of a small–sized vehicle. Int. J. Hydrogen Energy 2023, 48, 39497–39513. [Google Scholar] [CrossRef] [Scilit]
- Matallana, A.; Robles, E.; Ibarra, E.; Andreu, J.; Delmonte, N.; Cova, P. A methodology to determine reliability issues in automotive SiC power modules combining 1D and 3D thermal simulations under driving cycle profiles. Microelectron. Reliab. 2019, 102, 113500. [Google Scholar] [CrossRef] [Scilit]
- Sigue, S.; Abderafi, S.; Vaudreuil, S.; Bounahmidi, T. Design and steady-state simulation of a CSP–ORC power plant using an open–source co–simulation framework combining SAM and DWSIM. Therm. Sci. Eng. Prog. 2023, 37, 101580. [Google Scholar] [CrossRef] [Scilit]
- Hamedi, M.R.; Ghafory-Ashtiany, M.; Hosseini, M. Hybrid simulation modeling framework for evaluation of Thermal Power Plants seismic resilience in terms of power generation. Int. J. Disaster Risk Reduct. 2022, 78, 103120. [Google Scholar] [CrossRef] [Scilit]
- Ge, H.; Zhang, H.; Guo, W.; Song, T.; Shen, L. System simulation and experimental verification: Biomass–based integrated gasification combined cycle (BIGCC) coupling with chemical looping gasification (CLG) for power generation. Fuel 2019, 241, 118–128. [Google Scholar] [CrossRef] [Scilit]
- Hu, J.; Li, C.; Guo, Q.; Dang, J.; Zhang, Q.; Lee, D.-J.; Yang, Y. Syngas production by chemical–looping gasification of wheat straw with Fe–based oxygen carrier. Bioresour. Technol. 2018, 263, 273–279. [Google Scholar] [CrossRef] [Scilit] [PubMed]
- Álvaro, Á.J.; Paniagua, I.L.; Fernández, C.G.; Martín, J.R.; Carlier, R.N. Simulation of an integrated gasification combined cycle with chemical–looping combustion and carbon dioxide sequestration. Energy Convers. Manag. 2015, 104, 170–179. [Google Scholar] [CrossRef] [Scilit]
- Ersayin, E.; Ozgener, L. Performance analysis of combined cycle power plants: A case study. Renew. Sustain. Energy Rev. 2015, 43, 832–842. [Google Scholar] [CrossRef] [Scilit]
- Ganjehkaviri, A.; Jaafar, M.M.; Hosseini, S. Optimization and the effect of steam turbine outlet quality on the output power of a combined cycle power plant. Energy Convers. Manag. 2015, 89, 231–243. [Google Scholar] [CrossRef] [Scilit]
- Yazawa, K.; Koh, Y.R.; Shakouri, A. Optimization of thermoelectric topping combined steam turbine cycles for energy economy. Appl. Energy 2013, 109, 1–9. [Google Scholar] [CrossRef] [Scilit]
- Petrakopoulou, F.; Tsatsaronis, G.; Morosuk, T.; Carassai, A. Conventional and advanced exergetic analyses applied to a combined cycle power plant. Energy 2012, 41, 146–152. [Google Scholar] [CrossRef] [Scilit]
- López Paniagua, I.; Rodríguez Martín, J.; González Fernandez, C.; Jiménez Alvaro, Á.; Nieto Carlier, R. A new simple method for estimating exergy destruction in heat exchangers. Entropy 2013, 15, 474–489. [Google Scholar] [CrossRef] [Scilit]
- Aydin, H. Exergetic sustainability analysis of LM6000 gas turbine power plant with steam cycle. Energy 2013, 57, 766–774. [Google Scholar] [CrossRef] [Scilit]
- Bejan, A.; Moran, M.J. Thermal Design and Optimization; John Wiley & Sons: Hoboken, NJ, USA, 1996. [Google Scholar]
- Dincer, I.; Rosen, M.A. Exergy: Energy, Environment and Sustainable Development; Elsevier: Amsterdam, The Netherlands, 2012. [Google Scholar]
- Deltuva, R.; Lukočius, R.; Otas, K. Dynamic stability analysis of isolated power system. Appl. Sci. 2022, 12, 7220. [Google Scholar] [CrossRef] [Scilit]
- Carmona, S.; Rios, S.; Pena, H.; Raineri, R.; Nakic, G. Combined cycle unit controllers modification for improved primary frequency regulation. IEEE Trans. Power Syst. 2010, 25, 1648–1654. [Google Scholar] [CrossRef] [Scilit]
- Kakimoto, N.; Baba, K. Performance of gas turbine–based plants during frequency drops. IEEE Trans. Power Syst. 2003, 18, 1110–1115. [Google Scholar] [CrossRef]
- Zografos, D.; Ghandhari, M.; Eriksson, R. Power system inertia estimation: Utilization of frequency and voltage response after a disturbance. Elect. Power Syst. Res. 2018, 161, 52–60. [Google Scholar] [CrossRef] [Scilit]
- Wang, J.; Wang, F.; Zhang, Z.; Li, S.; Rodríguez, J. Design, and implementation of disturbance compensation–based enhanced robust finite control set predictive torque control for induction motor systems. IEEE Trans. Ind. Inform. 2017, 13, 2645–2656. [Google Scholar] [CrossRef] [Scilit]
- Meegahapola, L. Characterization of gas turbine dynamics during frequency excursions in power networks. IET Gener. Transm. Distrib. 2014, 12, 1733–1743. [Google Scholar] [CrossRef] [Scilit]
- Lalor, G.; Ritchie, J.; Flynn, D.; O’Malley, M.J. The impact of combined–cycle gas turbine short–term dynamics on frequency control. IEEE Trans. Power Syst. 2005, 20, 1456–1464. [Google Scholar] [CrossRef] [Scilit]
- Giovanelli, C.; Kilkki, O.; Sierla, S.; Seilonen, I.; Vyatkin, V. Task allocation algorithm for energy resources providing frequency containment reserves. IEEE Trans. Ind. Inf. 2019, 15, 677–688. [Google Scholar] [CrossRef] [Scilit]
- Shinoda, K.; Benchaib, A.; Dai, J.; Guillaud, X. Over– and under–voltage containment reserves for droop–based primary voltage control of MTDC grids. IEEE Trans. Power Deliv. 2022, 37, 125–135. [Google Scholar] [CrossRef] [Scilit]
- Miletić, M.; Krpan, M.; Pavić, I.; Pandžić, H.; Kuzle, I. Optimal primary frequency reserve provision by an aggregator considering nonlinear unit dynamics. IEEE Trans. Power Syst. 2024, 39, 3045–3058. [Google Scholar] [CrossRef] [Scilit]
- European Union. Establishing a guideline on electricity transmission system operation. Commission regulation (EU) 2017/1485 of 2 August 2017. Off. J. Eur. Union 2017, L 220, 1–120. [Google Scholar]
- European Union. Establishing a network code on requirements for grid connection of generators. Commission regulation (EU) 2016/631 of 14 April 2016. Off. J. Eur. Union 2016, L 112, 1–68. [Google Scholar]
- Mo, O.; D’Arco, S.; Suul, J.A. Evaluation of virtual synchronous machines with dynamic or quasi–stationary machine models. IEEE Trans. Ind. Electron. 2017, 64, 5952–5962. [Google Scholar] [CrossRef] [Scilit]
- Chen, Y.C.; Dhople, S.V.; Domínguez–García, A.D.; Sauer, P.W. Generalized injection shift factors. IEEE Trans. Smart Grid 2017, 8, 2071–2080. [Google Scholar] [CrossRef] [Scilit]
- Wu, C.-J.; Jou, L.-H.; Wu, D.-K.; Jan, J.S. Authors’ reply to comments on “Three-Arm AC automatic voltage regulator”. IEEE Trans. Ind. Electron. 2012, 59, 649–651. [Google Scholar] [CrossRef] [Scilit]
- Ekinci, S.; Hekimoğlu, B. Impoved Kidney–Inspired algorithm approach for tuning of PID controller in AVR system. IEEE Access 2019, 7, 39935–39947. [Google Scholar] [CrossRef] [Scilit]
- Furat, M.; Cücü, G.G. Design, implementation, and optimization of sliding mode controller for automatic voltage regulator system. IEEE Access 2022, 10, 55650–55674. [Google Scholar] [CrossRef] [Scilit]
- Köse, E. Optimal control of AVR system with tree seed algorithm–based PID controller. IEEE Access 2020, 8, 89457–89467. [Google Scholar] [CrossRef] [Scilit]
- Rodrigues, F.; Molina, Y.; Araujo, C. Simultaneous tuning of AVR and PSS using particle swarm optimization with two stages. IEEE Lat. Am. Trans. 2020, 18, 1623–1630. [Google Scholar] [CrossRef] [Scilit]
- Hamidifar, S.; Kar, N.C. A trigonometric technique for characterizing magnetic saturation in electrical machines. In Proceedings of the XIX International Conference on Electrical Machines, Rome, Italy, 6–8 September 2010. [Google Scholar] [CrossRef] [Scilit]
- Dalal, A.; Singh, A.K.; Kumar, P. Effect of saturation on equivalent circuit analysis of induction motor in practical scenario. In Proceedings of the 2013 Annual IEEE India Conference, Mumbai, India, 13–15 December 2013. [Google Scholar] [CrossRef] [Scilit]
- El–Serafi, A.M.; Kar, N.C. Methods for determining the q–axis saturation characteristics of salient–pole synchronous machines from the measured d–axis characteristics. IEEE Trans. Energy Conv. 2003, 18, 80–86. [Google Scholar] [CrossRef]
- Zeng, D.; Zhang, B.; Wang, X.; Yang, P.; Ge, Q.; Li, Y. Analysis of traction characteristics in single–sided linear induction motors with composite secondary considering magnetic saturation and hysteresis. In Proceedings of the 2021 13th International Symposium on Linear Drives for Industry Applications, Wuhan, China, 1–3 July 2021. [Google Scholar] [CrossRef] [Scilit]
- Alsakati, A.A.; Vaithilingam, C.A.; Alnasseir, J.; Jagadeeshwaran, A. Transient stability improvement of power system using power system stabilizer integrated with excitation system. In Proceedings of the 2021 11th IEEE International Conference on Control System, Computing and Engineering, Penang, Malaysia, 27–28 August 2021. [Google Scholar] [CrossRef] [Scilit]
- Khalil, E.Z.; Eliwa, A.E.-F.E.-S.; Sabry, W. A design of a modified power system stabilizer for power system transient stability enhancement. In Proceedings of the 2018 Twentieth International Middle East Power Systems Conference, Cairo, Egypt, 18–20 December 2018. [Google Scholar] [CrossRef] [Scilit]
- Selim, F.; Attia, A.-F. Power system stabilizer with self–tuning based on hierarchical Fuzzy logic controller. In Proceedings of the 2022 23rd International Middle East Power Systems Conference, Cairo, Egypt, 13–15 December 2022. [Google Scholar] [CrossRef] [Scilit]
- Liu, L.; Wu, Q.H.; Kang, H.; Zhou, X. Switching power system stabilizer and its coordination for enhancement of multi–machine power system stability. CSEE J. Power Energy Syst. 2016, 2, 98–106. [Google Scholar] [CrossRef] [Scilit]
- Obaid, A.Z.; Mejeed, A.R.; Al-Mashhadani, A. Investigating the impact of using modern power system stabilizers on frequency stability in large dynamic multi–machine power system. In Proceedings of the 2020 55th International Universities Power Engineering Conference, Turin, Italy, 1–4 September 2020. [Google Scholar] [CrossRef] [Scilit]

Disclaimer/Publisher’s Note: The statements, opinions and data contained in all publications are solely those of the individual author(s) and contributor(s) and not of MDPI and/or the editor(s). MDPI and/or the editor(s) disclaim responsibility for any injury to people or property resulting from any ideas, methods, instructions or products referred to in the content. |
© 2026 by the authors. Licensee MDPI, Basel, Switzerland. This article is an open access article distributed under the terms and conditions of the Creative Commons Attribution (CC BY) license.