Article

Effects of Fracture Roughness on Frictional Behavior and Rupture Dynamics of Hard Rocks


1
State Key Laboratory of Lithospheric and Environmental Coevolution, Institute of Geology and Geophysics, Chinese Academy of Sciences, Beijing 100029, China
2
College of Earth and Planetary Sciences, University of Chinese Academy of Sciences, Beijing 100049, China
3
Xinjiang Key Laboratory of Geohazard Prevention, Xinjiang Institute of Engineering, Urumqi 830023, China
4
State Key Laboratory of Intelligent Geotechnics and Tunnelling, Shenzhen University, Shenzhen 518060, China
5
College of Civil and Transportation Engineering, Shenzhen University, Shenzhen 518060, China
*
Author to whom correspondence should be addressed.
Appl. Sci. 2026, 16(13), 6473; https://doi.org/10.3390/app16136473
Submission received: 12 May 2026 / Revised: 15 June 2026 / Accepted: 21 June 2026 / Published: 29 June 2026
(This article belongs to the Section Earth Sciences)

Abstract

Surface roughness is ubiquitous in hard rock discontinuities at different scales and plays a critical role in governing frictional behavior and rupture dynamics. In this study, triaxial shear tests were conducted on sawcut smooth fractures and tension-induced rough fractures to investigate frictional behavior, roughness evolution, and rupture dynamics with increasing shear cycles. The results demonstrate that rough fractures exhibit higher shear strength and more intense stick-slip behavior than smooth fractures, but show strength weakening and reduced stress drops with shear cycle. In contrast, smooth fractures display relatively stable strength and stress drops. These differences in frictional behavior are governed by roughness evolution. Although roughness decreases in both fracture types after shearing, rough fractures experience degradation nearly an order of magnitude greater than that of smooth fractures. The initial stick-slip event on rough fractures generates the largest stress drop and apparent breakdown work. In addition, analyses of stress drop and energy dissipation reveal that friction drops for different types of fracture are concentrated within the range of 0.01 to 0.3. These findings highlight the critical role of roughness evolution in fault stability and provide valuable insights for seismic hazard assessment in deep underground engineering.

1. Introduction

Rock discontinuities at different scales, including joints, fractures, and faults, are ubiquitously distributed within underground rock masses [1,2,3]. These discontinuities not only represent inherent mechanical weaknesses in rock masses but also serve as primary pathways for fluid migration, thereby exerting a significant influence on the stability and safety of underground engineering. With the advancement of underground space utilization and resource extraction activities (i.e., tunneling, deep mining, and enhanced geothermal system), engineering disturbances can substantially modify the in situ stress field, potentially triggering fault instability or reactivation [4,5]. Stable shear slip along fractures or faults may lead to quasi-static failures, manifested as surrounding rock deformation or tunnel squeezing. In contrast, sudden unstable sliding is commonly associated with rapid energy release, resulting in dynamic hazards such as fault-slip rockbursts and induced seismicity [6,7]. Therefore, the understanding of the frictional behavior of fracture and fault is of critical importance for the safe construction and long-term operation of deep underground engineering.
The frictional behavior of fractures is largely controlled by their surface roughness. Fracture roughness exhibits consistent self-affine, from laboratory specimens to field-scale faults [8,9]. Consequently, extensive research has focused on simulating fault mechanical behavior through laboratory shear experiments and linking detailed observations of fracture morphology with frictional response [10,11]. In experimental studies, bare fractures with varying roughness, such as those generated through tensile or shear process, are commonly employed to represent unfilled faults, as they effectively replicate the geometric heterogeneity of natural rough fractures [12,13]. Numerous studies have investigated the effects of roughness on shear behaviors, including shear strength, stick-slip characteristics, and frictional healing [14,15,16]. However, the range of roughness examined in existing studies is limited, leading to apparently contradictory observations. For example, some studies report that stick-slip behavior predominantly occurs on relatively smooth, sawcut fractures [17,18], whereas others observe more pronounced stick-slip events on rougher fractures [19,20]. Similarly, experiments on tensile fractures with interlocked configurations indicate that stick-slip behavior occurs only within a relatively narrow range of roughness, beyond which fractures exhibit stable sliding [16]. These inconsistent results demonstrate that fracture roughness plays a fundamental role in governing shear behavior, and that transitions between slip modes (e.g., stable sliding and stick-slip) are closely associated with the evolution of fracture roughness.
The shear stress acting on fractures is primarily supported by interlocked asperities resulting in highly heterogeneous stress distributions on the fracture surface [21,22]. During shearing, microscopic process, such as asperity engagement, climbing, shearing, and wear, collectively form the physical basis for friction evolution, dilation, and sliding stability [16,23]. For brittle rocks, asperities shearing or rupture leads to the rapid release of stored elastic energy, manifested as an abrupt decrease in shear stress (i.e., stress drop) accompanied by energy radiation. This behavior is commonly observed in laboratory experiments as stick-slip events. At the macroscopic scale, this mechanism is analogous to stress release along pre-existing faults during natural earthquakes. In seismology, the static stress drop, τ , defined as the difference between the average shear stress on a fault before and after slip, is a key parameter controlling seismic energy release and rupture dynamics [24]. From an energy perspective, the total elastic energy ( E t o t a l ) released during an earthquake is partitioned into three main components: frictional heat ( E H ) associated with overcoming residual shear stress, breakdown work ( W b ) required to damage asperities and create new fracture surfaces, and radiated seismic energy ( E R ) [25,26,27]. Both breakdown work and stress drop represent the energy required to overcome fault strength and facilitate slip, and are manifested through roughness degradation [28]. However, quantitative relationships linking stress drop, breakdown work, and roughness degradation have received limited investigation.
In this study, we conduct laboratory experiments to identify and quantify the relationship between frictional behavior and fracture roughness evolution. Triaxial shear tests were performed on granite specimens containing sawcut smooth fractures and tension-induced rough fractures, respectively. Multiple loading-induced stick-slip events were generated to simulate fault rupture behavior under stress perturbations. During the experiments, stress and displacement were precisely monitored to capture the dynamic characteristics of sliding instabilities. By combining these mechanical measurements with quantitative assessments of fracture roughness before and after shearing, we analyzed the influence of roughness evolution on shear strength, stress drop, and slip modes. This research specifically focuses on how progressive shear-induced roughness evolution modulates frictional behavior and energy dissipation. Furthermore, by integrating our experimental results with existing findings from fault studies across different scales, we provide a cross-scale analysis on friction evolution and stick-slip processes. These results advance the understanding of the physical mechanisms governing fault reactivation and offer insights relevant to hazard assessment and risk mitigation in deep underground engineering and seismically active regions.

2. Materials and Methods

2.1. Sample Preparation and Test Apparatus

The granodiorite samples used in the triaxial shear tests were sourced from a quarry in Suizhou City, Hubei Province, China. Optical microscope analysis revealed that the rock is composed of approximately 33% quartz, 34% feldspar, 19% amphibole, and 14% other minor minerals. Following the testing standards suggested by the International Society for Rock Mechanics [29], a series of uniaxial compression and Brazilian tensile splitting tests were conducted to characterize the basic mechanical behaviors of the intact granite, as summarized in Table 1.
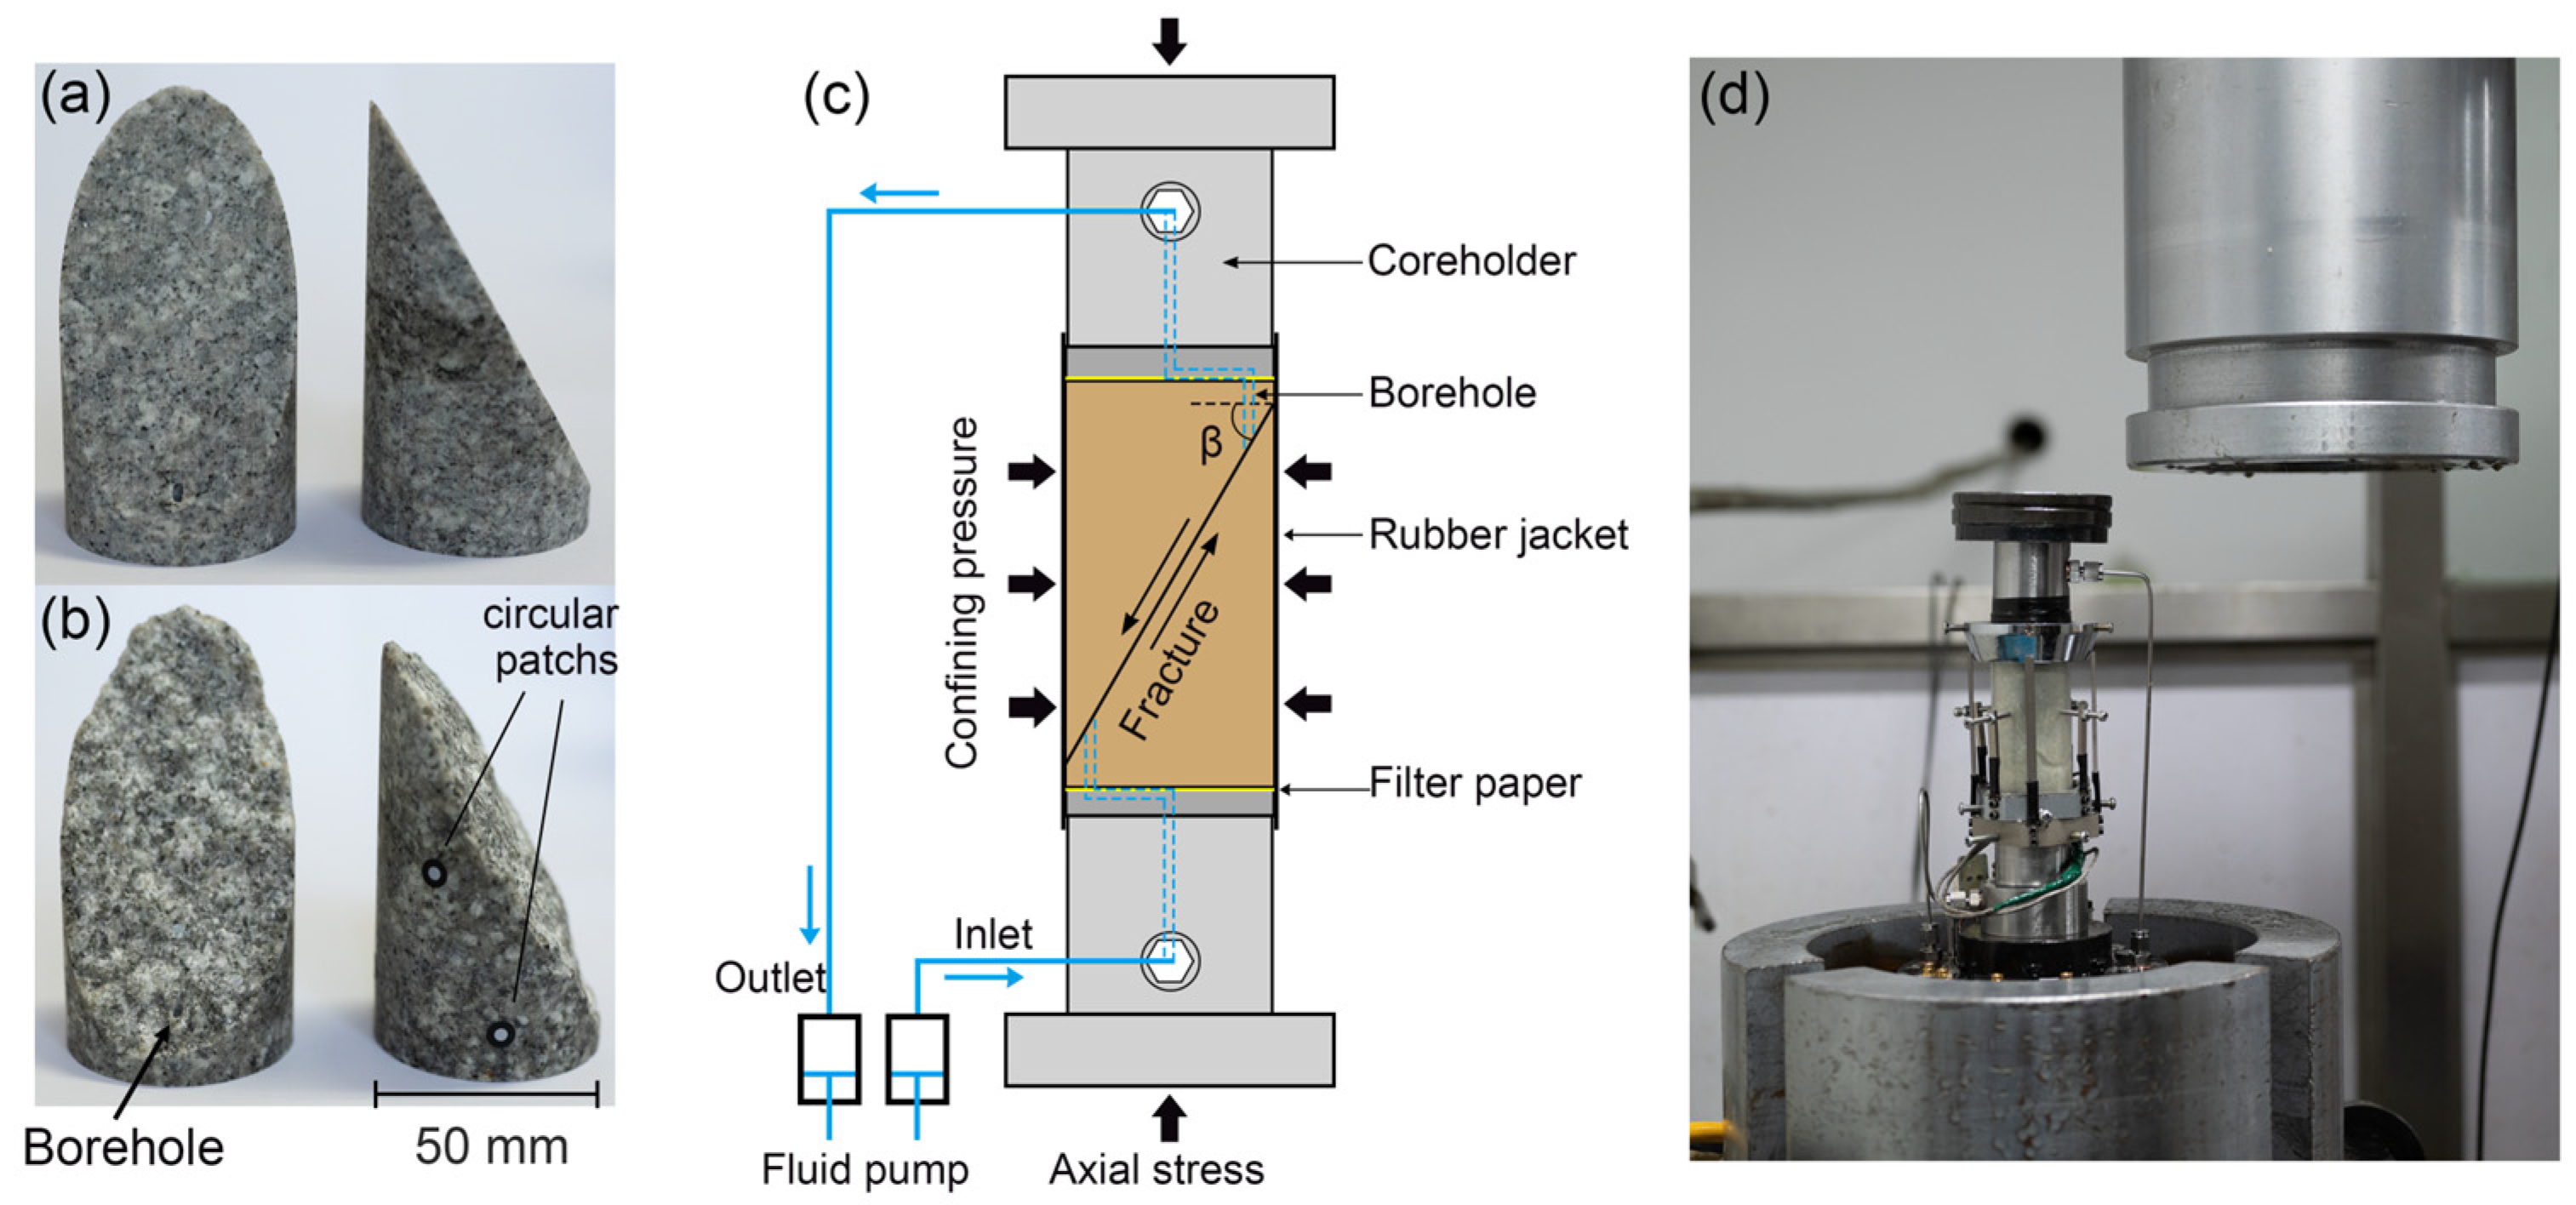
Two types of cylindrical specimens containing an inclined fracture were prepared for this study: sawcut smooth fracture samples (SF1–SF4, Figure 1a) and tension-induced rough fracture samples (RF1–RF4, Figure 1b). Smooth fractures were produced by cutting granite cores with dimensions of 100 mm × 50 mm (height × diameter) at an inclination angle of 30° to the core axis using a diamond saw. Rough fractures were generated by Mode I tensile splitting of cubic granite blocks, followed by reassembly and directional coring to produce 50 mm diameter specimens with a 30° inclined fracture. The tension-induced rough fractures produced by this preparation method represent fresh fracture surfaces that have not undergone shear, wear, gouge production, or complex stress histories. This preparation method has been successfully applied in previous laboratory studies of fracture friction [16,30,31]. In addition, two boreholes with a diameter of 2.0 mm were drilled parallel to the sample axis to serve as fluid channels between the injection system and the fracture, as shown in Figure 1. It should be noted that all tests were conducted on fully saturated specimens, as pore water has a significant influence on the mechanical behavior of rock fractures [32]. Since this study primarily focuses on frictional behavior, the hydraulic response of the fractures is not discussed in detail.
Triaxial shear tests were conducted on both types of specimens using a servo-hydraulic TAW triaxial testing apparatus (Figure 1c). equipped with an axial loading system (capacity 2600 kN, accuracy ±0.3%) and a confining pressure system (capacity 100 MPa, accuracy ±0.3%). The normal and shear stresses acting on the inclined fracture were controlled by the axial stress ( σ 1 ) and confining pressure ( σ 3 ). The assembled experimental specimen is shown in Figure 1d. The fluid pressure was maintained at P i n = P o u t = 0.5 MPa. The shear stress ( τ ) and effective normal stress ( σ n ) acting on the fracture plane can be calculated as
τ = 1 2 σ 1 σ 3 sin 2 β
σ n = 1 2 σ 1 + σ 3 + ( σ 1 σ 3 ) cos 2 β P i n
where σ 1 and σ 3 are the axial stress and confining pressure, respectively, both recorded at a sampling frequency of 100 Hz; β is the angle between the normal to the fracture plan and the core axis, which is 60° in this study.
The normal and shear stresses on the fracture were maintained by the servo-controlled axial stress and confining pressure during fluid injection. These stresses were also corrected by considering the change in fracture contact area and the deformation of Teflon layers during the experiments [31]. The shear displacement along the fracture ( d l s ) was calculated as
d l s = d l s i n β = l F K b s i n β
where d l is the axial shortening attributable to fracture slip; l is the load point displacement; F is the deviator force; K b is the elastic stiffness of the rock blocks (1447 kN/mm with an accuracy of ±1.2%), derived from the Young’s modulus of the granite. The shear displacement was also measured at a sampling frequency of 100 Hz. Note that we carefully inspected the stress-time series for all recorded stick-slip events. In every event, the pre-slip peak stress and the post-slip residual stress were captured across multiple consecutive sample points and exhibited a clear, smooth transition without truncation. While the static stress drop is well resolved at 100 Hz, the same sampling rate may not fully capture the high-frequency components of the stick-slip events. Consequently, the energy estimates provided in this study are approximate and may underestimate the actual energy.

2.2. Experimental Procedure

Taking σ 3 = 20 MPa as an example, the procedure was as follows. The jacketed specimen was placed inside the triaxial cell (Figure 1d), which was then sealed and filled with silicone oil. An initial axial stress of 1 MPa and a confining pressure of 1 MPa were applied gradually to ensure proper specimen seating. Subsequently, σ 1 and σ 3 were increased simultaneously at a constant rate until the target pressure of 20 MPa was reached. The pore-fluid pump was then started to maintain a constant fluid pressure of P i n = P o u t = 0.5 MPa. After that, σ 3 was held constant while the axial piston advanced at a fixed displacement rate of 1 μm/s, causing the differential stress to increase until the shear stress on the fracture exceeded its frictional strength. At this stage, fracture activation (stick-slip) occurred, accompanied by audible slip events. Axial displacement continued until 4~8 stick-slip events were recorded, after which the test was terminated and the axial and confining stresses were removed. The specimen was then replaced, a new confining pressure was set, and the procedure was repeated. In total, eight tests were conducted: four confining pressure levels ( σ 3 = 10, 15, 20, and 25 MPa), each tested on both a smooth and a rough specimen. Table 2 provides an overview of the experimental procedure and some results.

2.3. Fracture Roughness Characterization

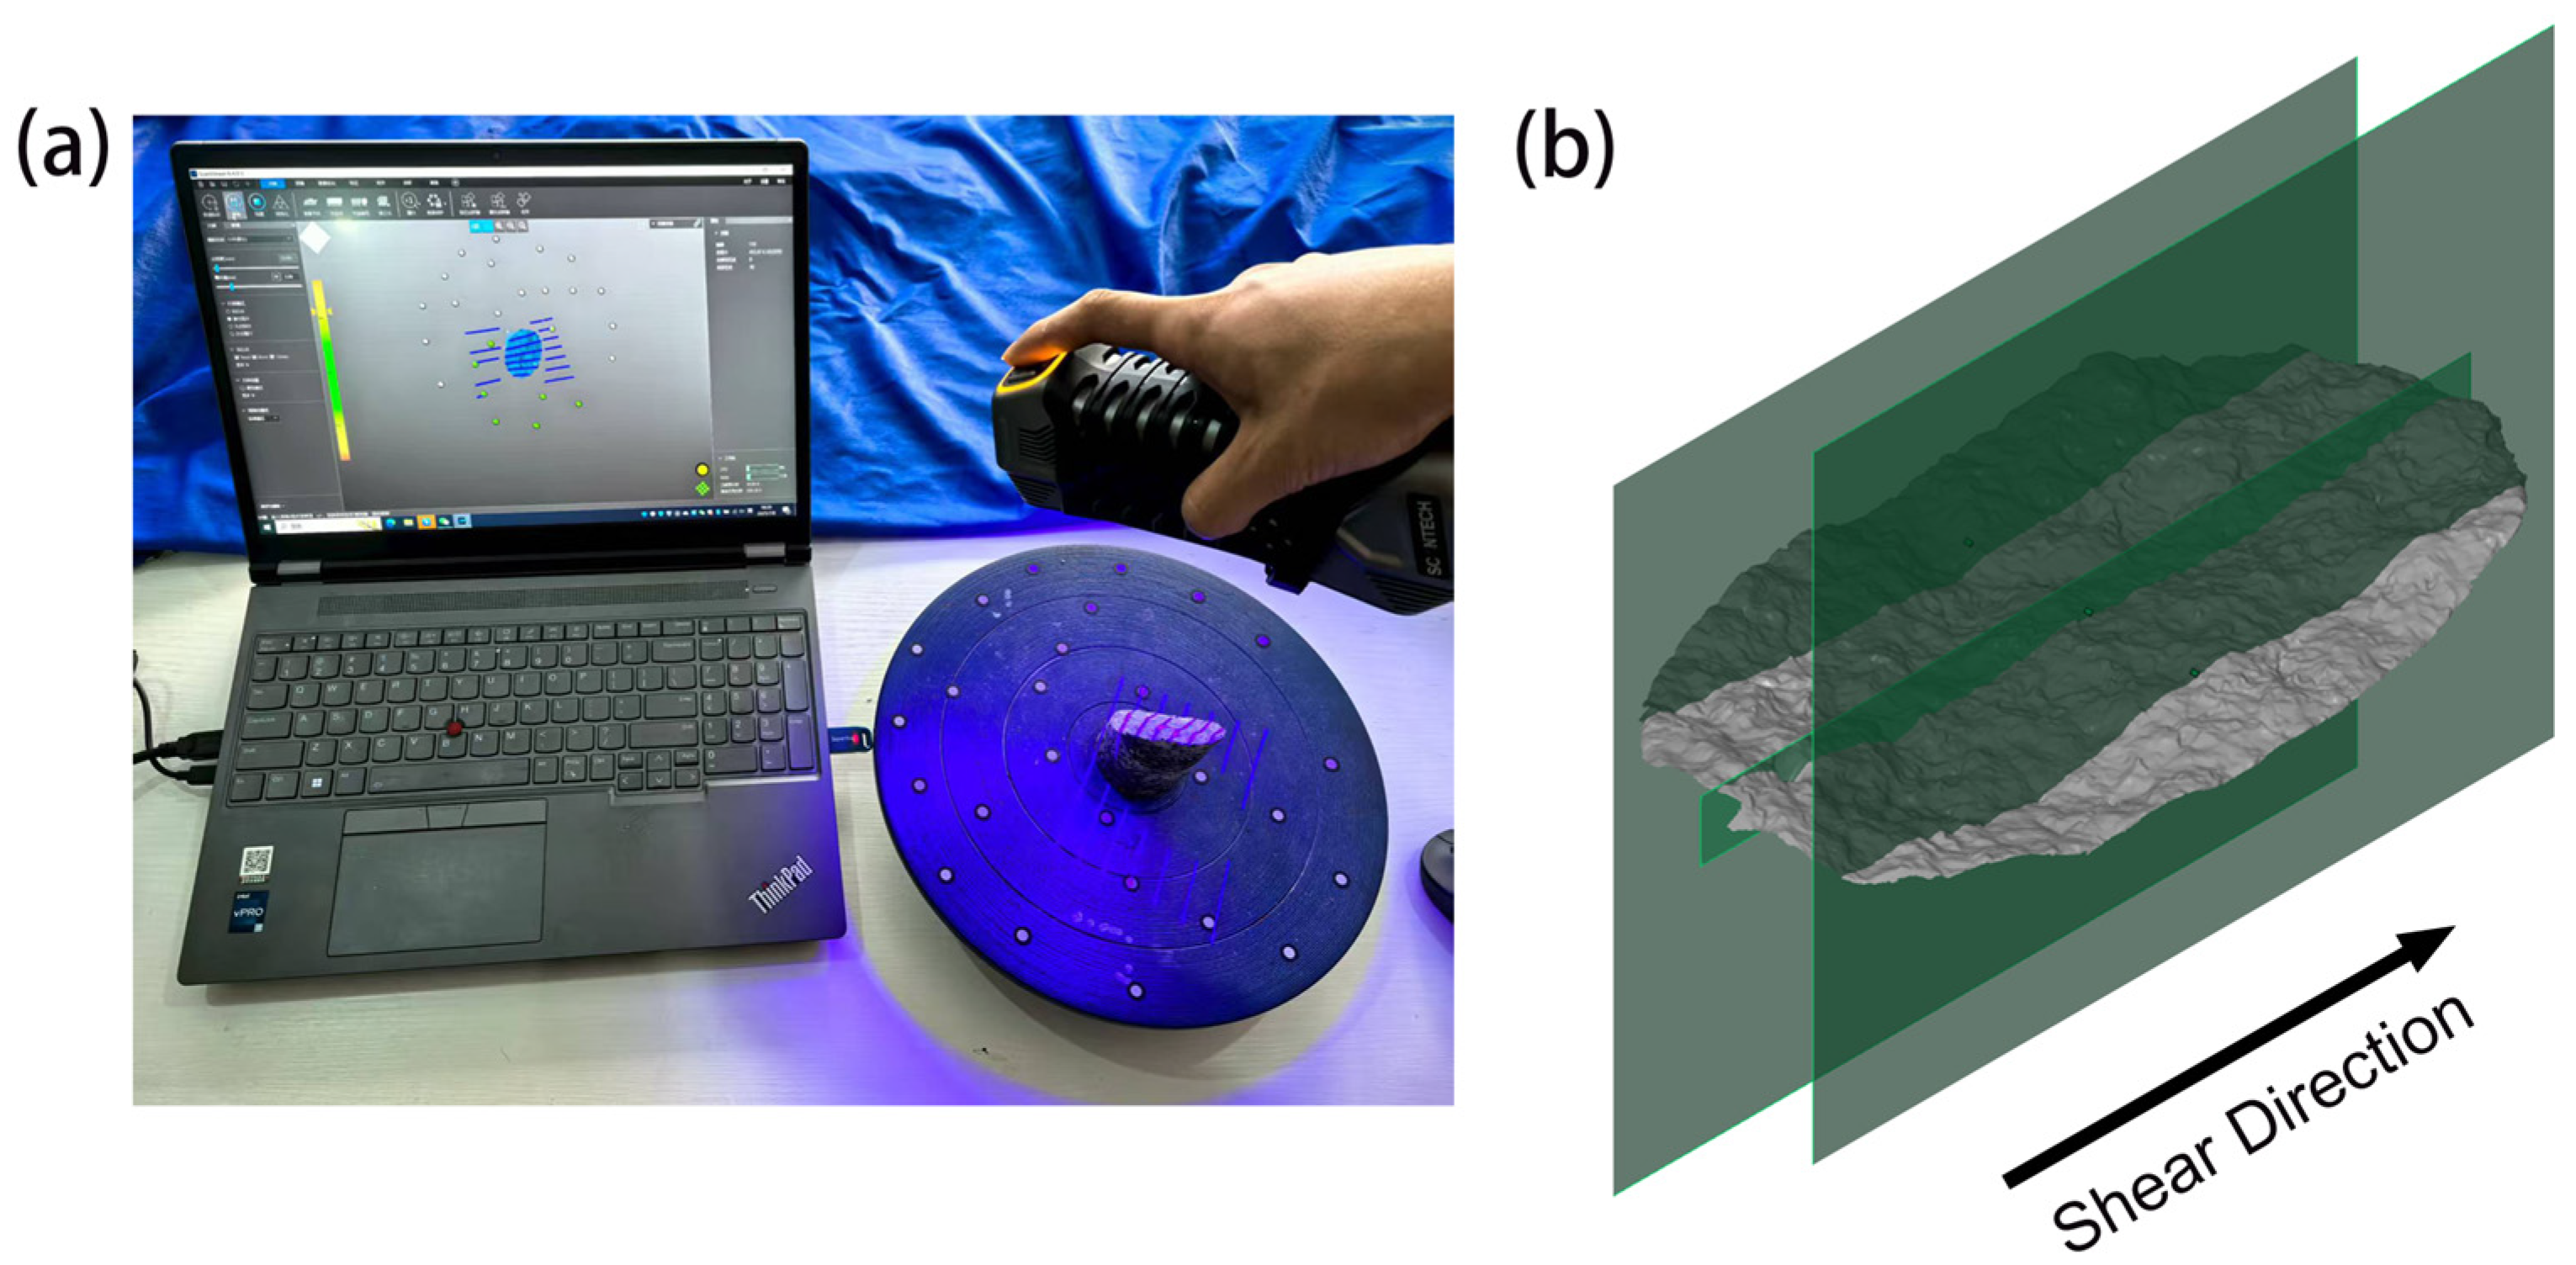
Fracture roughness and its evolution during shearing were quantitatively characterized through surface morphology measurements (Figure 2a). These measurements were taken before and after the experiments using a three-dimensional laser scanner (SIMSCAN 30; Scantech (Hangzhou) Co., Ltd., Hangzhou, China), which has a maximum spatial resolution of 0.02 mm. To facilitate accurate comparison of shear-induced roughness degradation, several circular markers with a diameter of 3 mm were affixed to the sides of the specimens, as shown in Figure 1b. Following laser scanning, the digitized data were exported to STL format, and the fracture morphology was reconstructed using the GOM Inspect software (version 2018). To minimize boundary effects and ensure consistency among samples, an elliptical region was extracted from each reconstructed fracture surface. Surface roughness was quantified using the root mean square ( R M S y ) of the height distribution along the slip direction [33,34]. R M S y was calculated from 2D profiles using the following equation:
R M S y = 1 L 0 L Z 2 x d x 0.5
where Z x is the height deviation at position x relative to the reference line, and L is the evaluation length.
As the three-dimensional fracture surface can be regarded as a composite of multiple two-dimensional profiles, each fracture surface was uniformly divided into 20 profiles along its major axis. For each profile, R M S y was calculated using a sampling interval of 0.5 mm, as illustrated in Figure 2b. It should be noted that each sample consists of two complementary surfaces (i.e., upper and lower fracture surfaces); therefore, the overall R M S y was determined by averaging the R M S y values obtained from both surfaces.

3. Results

3.1. Typical Shear Behavior

3.1.1. Stress Evolution

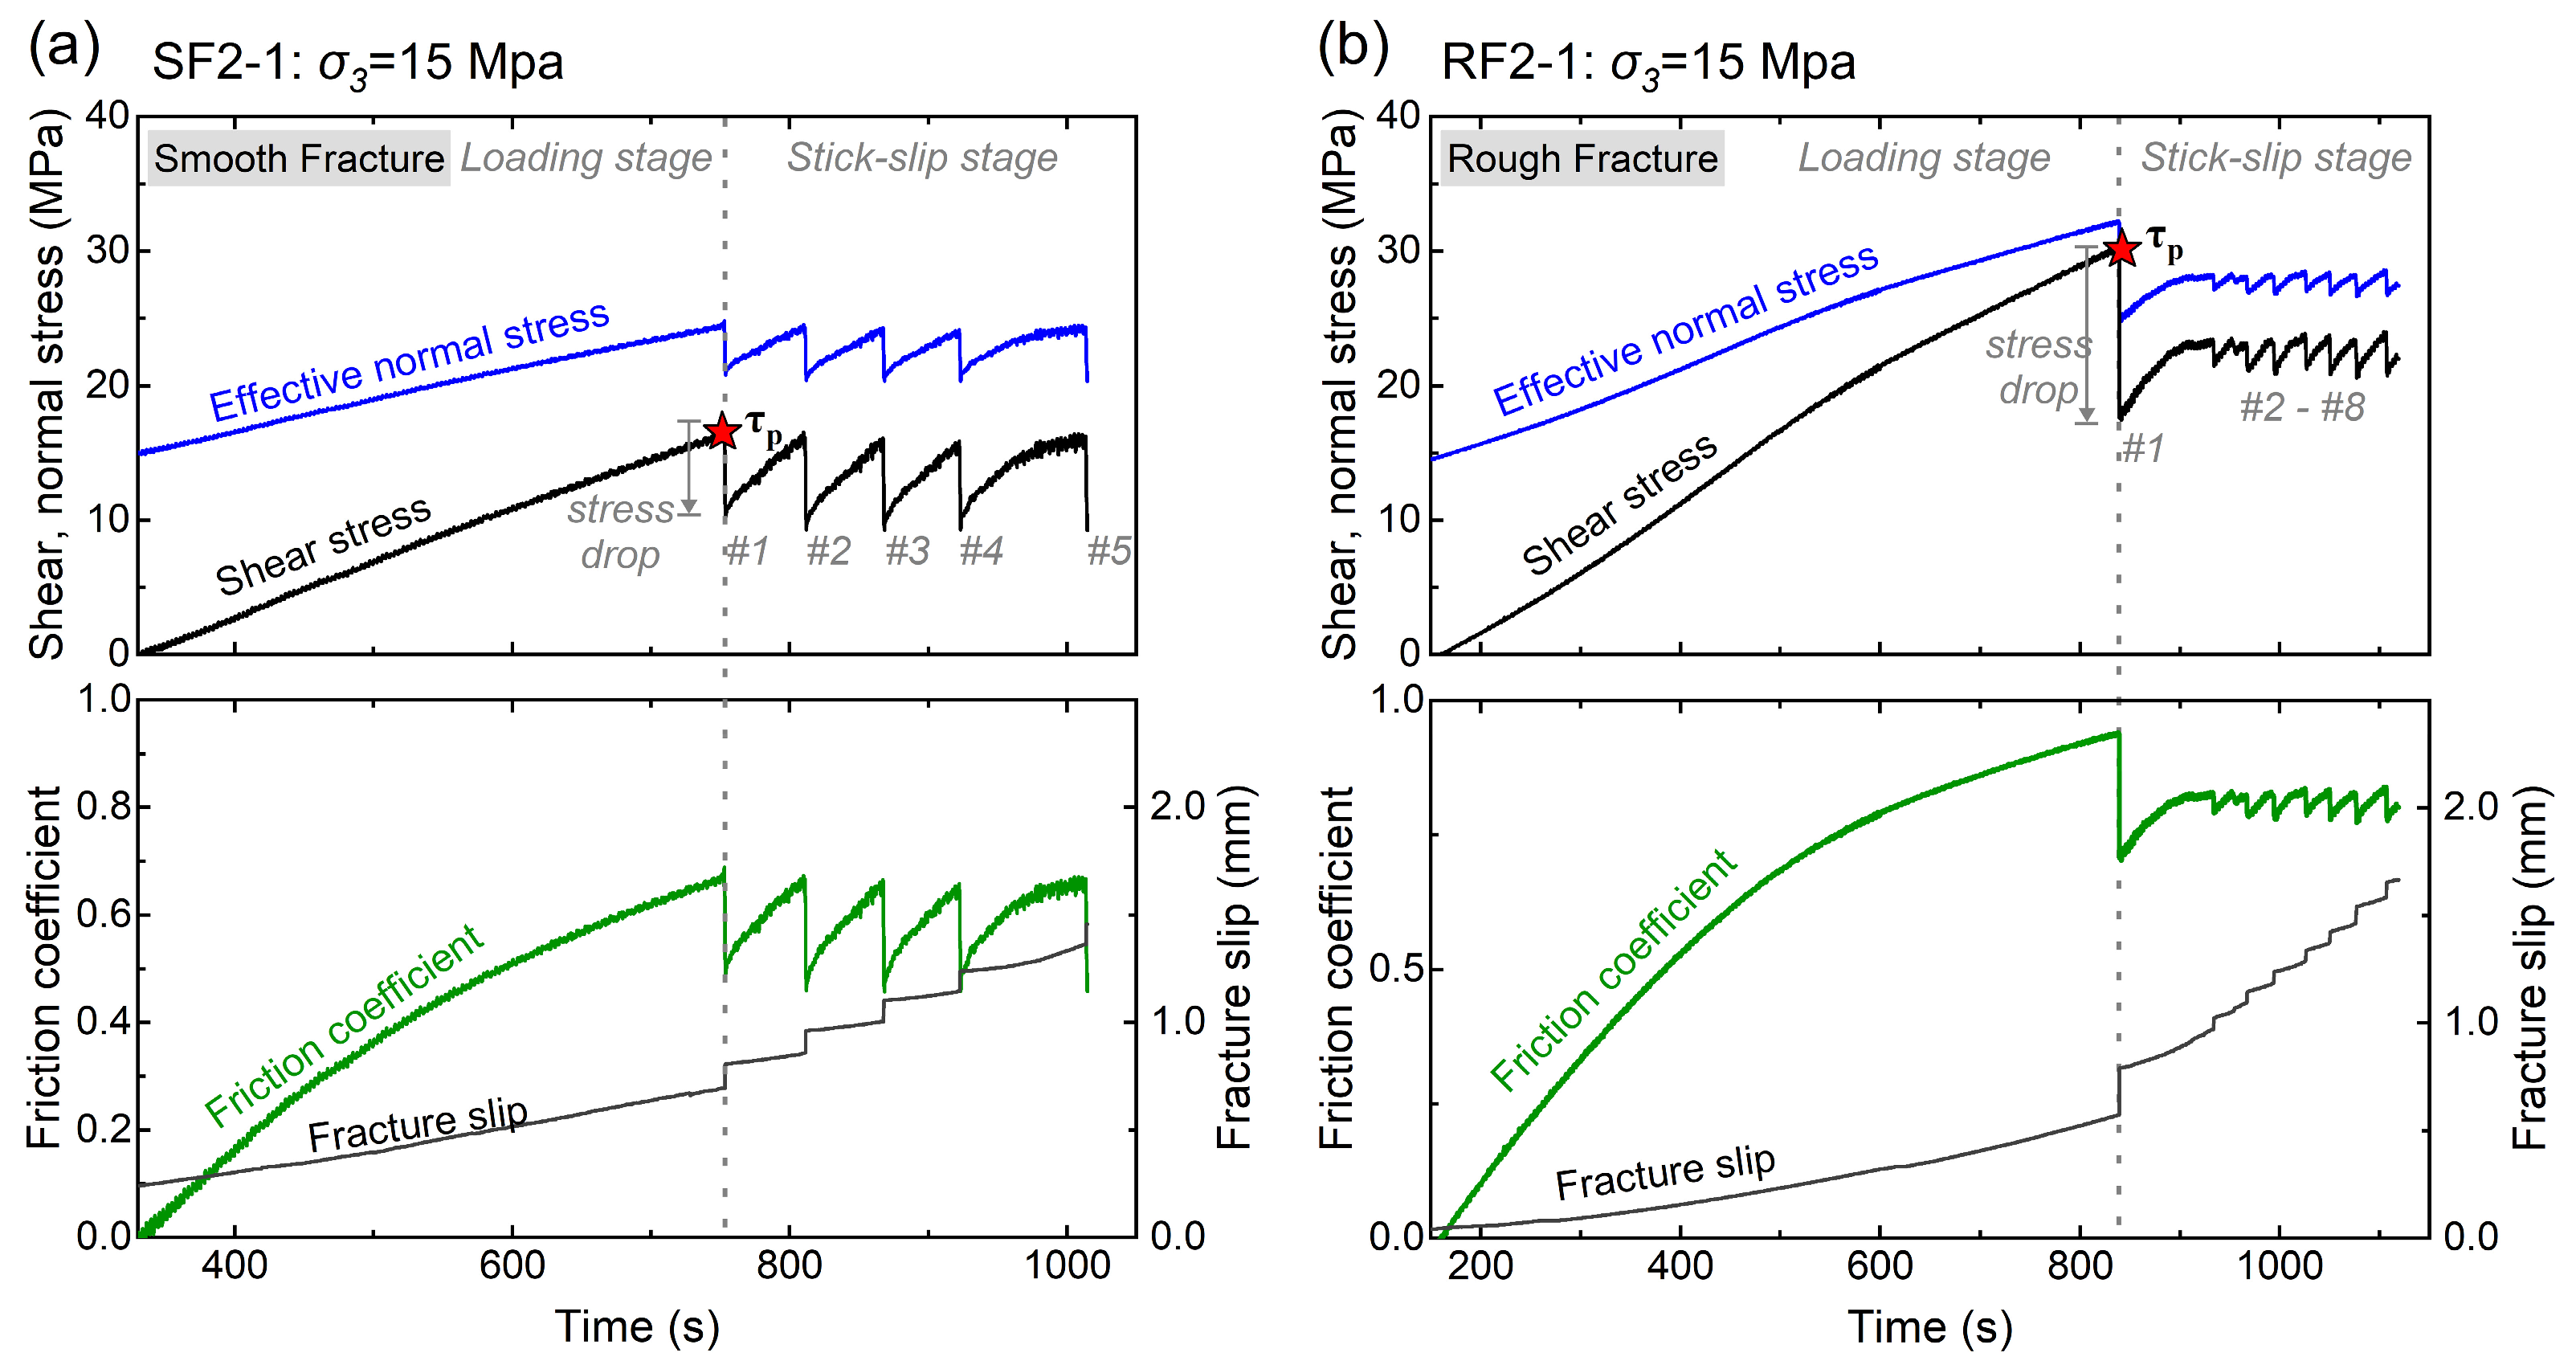
Figure 3 illustrates the evolution of normal stress, shear stress, fracture slip, and friction coefficient (defined as the ratio of shear stress to normal stress) for smooth and rough fractures during loading at σ 3 = 15 MPa. The experimental process can be divided into two distinct stages: a loading stage and a loading-induced stick-slip stage. During the loading stage, smooth and rough fractures exhibit similar behavior. Normal and shear stresses increase approximately linearly, while fracture slip and friction coefficient gradually increase until the peak shear strength is reached. It is generally assumed that when the instantaneous friction coefficient exceeds the static friction threshold, dynamic rupture is triggered along the fracture, corresponding to the initiation mechanism of fault reactivation [35]. In the experiments, once peak shear strength was attained, the shear stress dropped abruptly to a residual level, accompanied by a sudden increase in slip displacement, indicating the onset of loading-induced stick-slip stage.
During the stick-slip stage, multiple loading-induced stick-slip events were recorded. Each event was characterized by a pronounced shear stress drop and an audible acoustic emission, indicating partial release of the accumulated elastic strain energy. Two distinct stress evolution patterns were observed for smooth and rough fractures, respectively. For smooth fractures, five similar stick-slip events were observed (#1–#5 in Figure 3a). After reaching peak shear strength, shear stress dropped sharply and then gradually recovered to a similar peak level as axial loading continued. The peak shear stress, stress drop magnitude, and slip displacement remained nearly constant with increasing shear cycles, suggesting that repeated stick-slip did not significantly alter the shear behavior of smooth fracture. In contrast, rough fractures exhibited more complex stick-slip behavior. To characterize the slip events on both fracture types, we classified them as large or small events based on the ratio of stress drop to shear stress. Large events were defined by stress drops exceeding 0.3 times the shear stress, which produced distinct slip displacement (e.g., events #1–#5 in Figure 3a and event #1 in Figure 3b). Small events had stress drops below 0.3 times the shear stress, resulting in comparatively small slip displacements (e.g., events #2–#8 in Figure 3b). A detailed description is provided in Section 3.2.1. These contrasting frictional behaviors observed for smooth and rough fractures are primarily attributed to differences in fracture surface morphology [36]. Moreover, the results indicate that rough fractures are more sensitive to shear cycling, with progressive roughness evolution leading to a weakening of stick-slip intensity.

3.1.2. Failure Envelope of Loading-Induced Stick-Slip Events

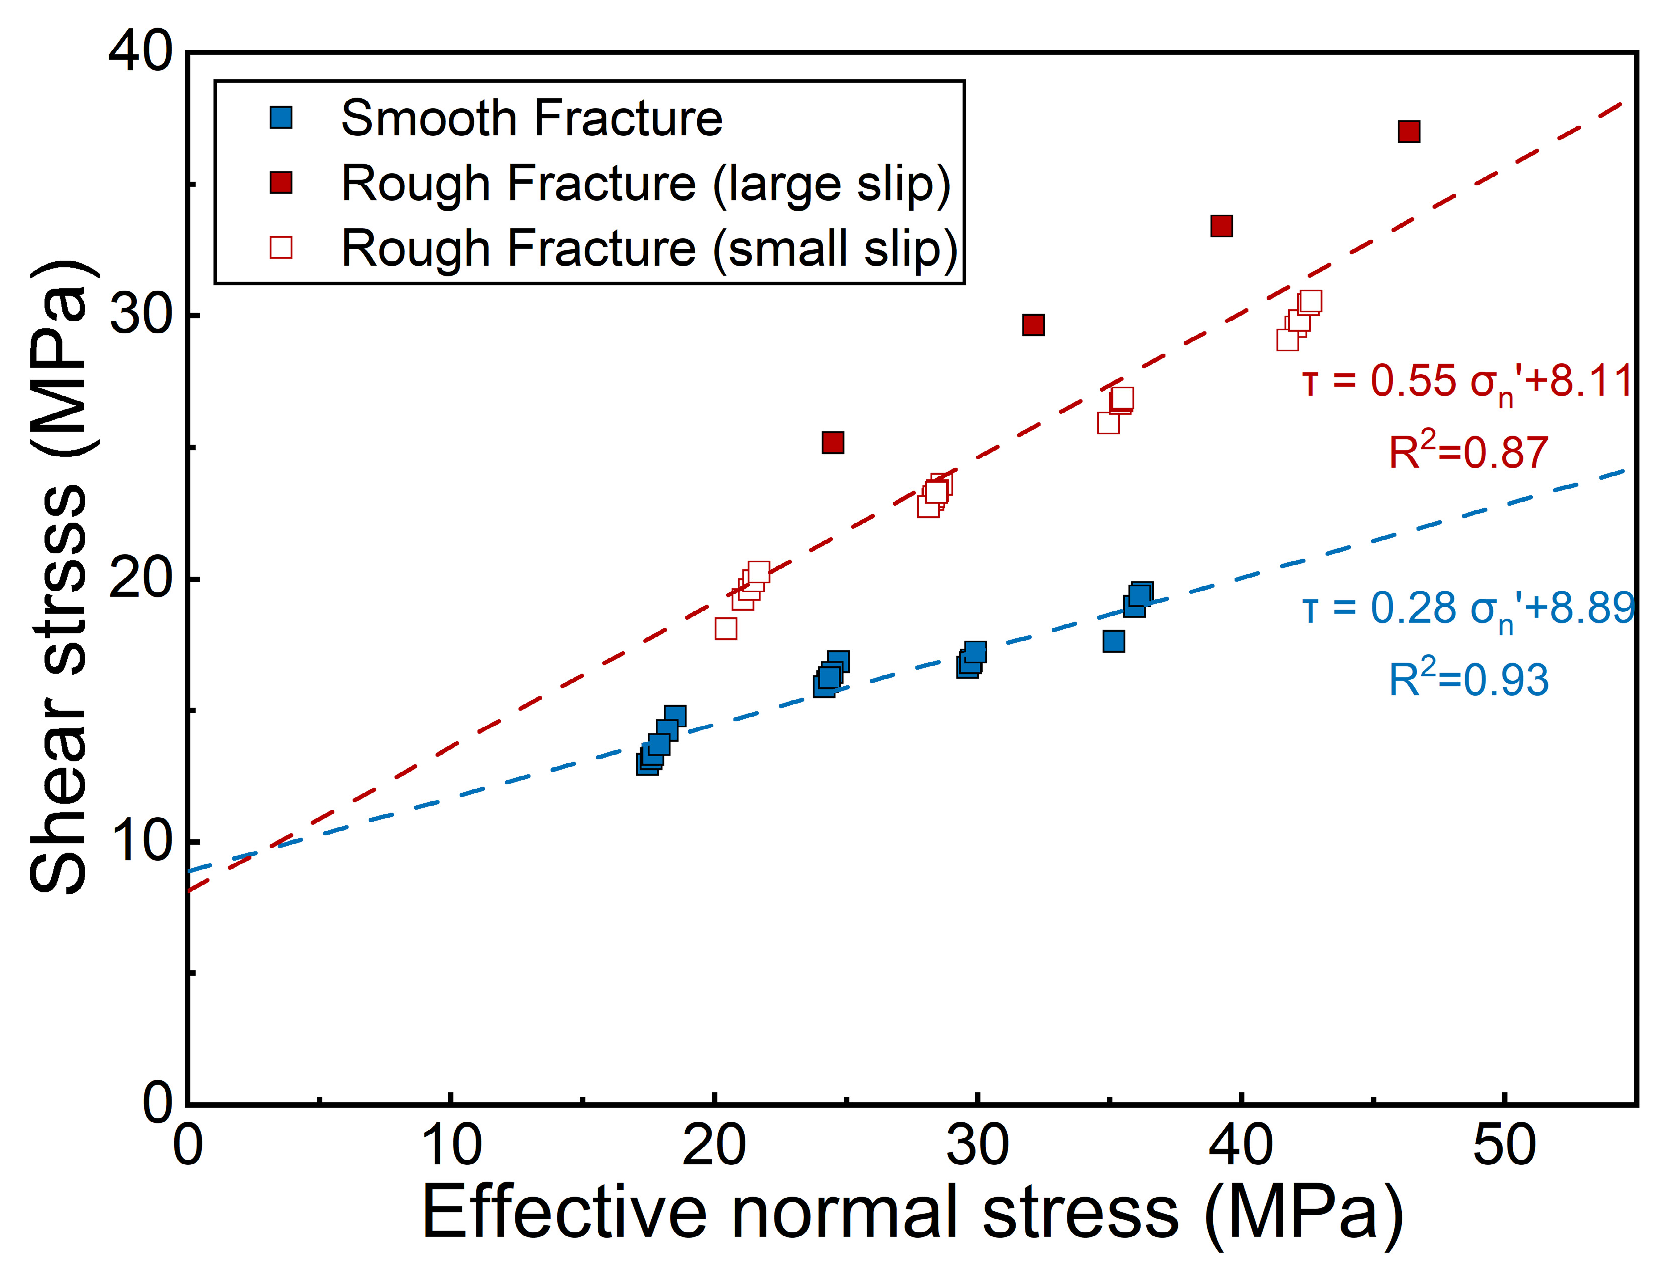
The shear strength of fractures can be derived from loading-induced stick-slip events under varying confining pressure. Based on the peak shear strength recorded during stick-slip event, failure envelopes were constructed separately for smooth and rough fractures, as shown in Figure 4. The experimental data were fitted using the Mohr–Coulomb failure criterion, in which shear stress is assumed to be linearly proportional to normal stress. Under identical normal stress conditions, rough fractures exhibit higher peak shear strength than smooth fractures. The corresponding average peak friction coefficients were 0.55 for rough fractures and 0.28 for smooth fractures, indicating that fracture surface roughness significantly enhances shear strength, although it remains substantially lower than that of intact rock.
Notably, rough fractures exhibited their highest shear strength in the first shear cycle, as shown in Figure 4. This anomalously high strength is attributed to strong asperity interlocking. As shearing progressed, stick-slip events induced extensive asperity damage, resulting in a marked reduction in shear strength during subsequent events. The decrease in shear strength is most pronounced during the first shear cycle and becomes progressively less significant in later cycles. In contrast, the shear strength of smooth fractures remained relatively stable throughout repeated stick-slip cycles, reflecting limited morphological evolution [37,38].

3.1.3. Evolution of Fracture Roughness

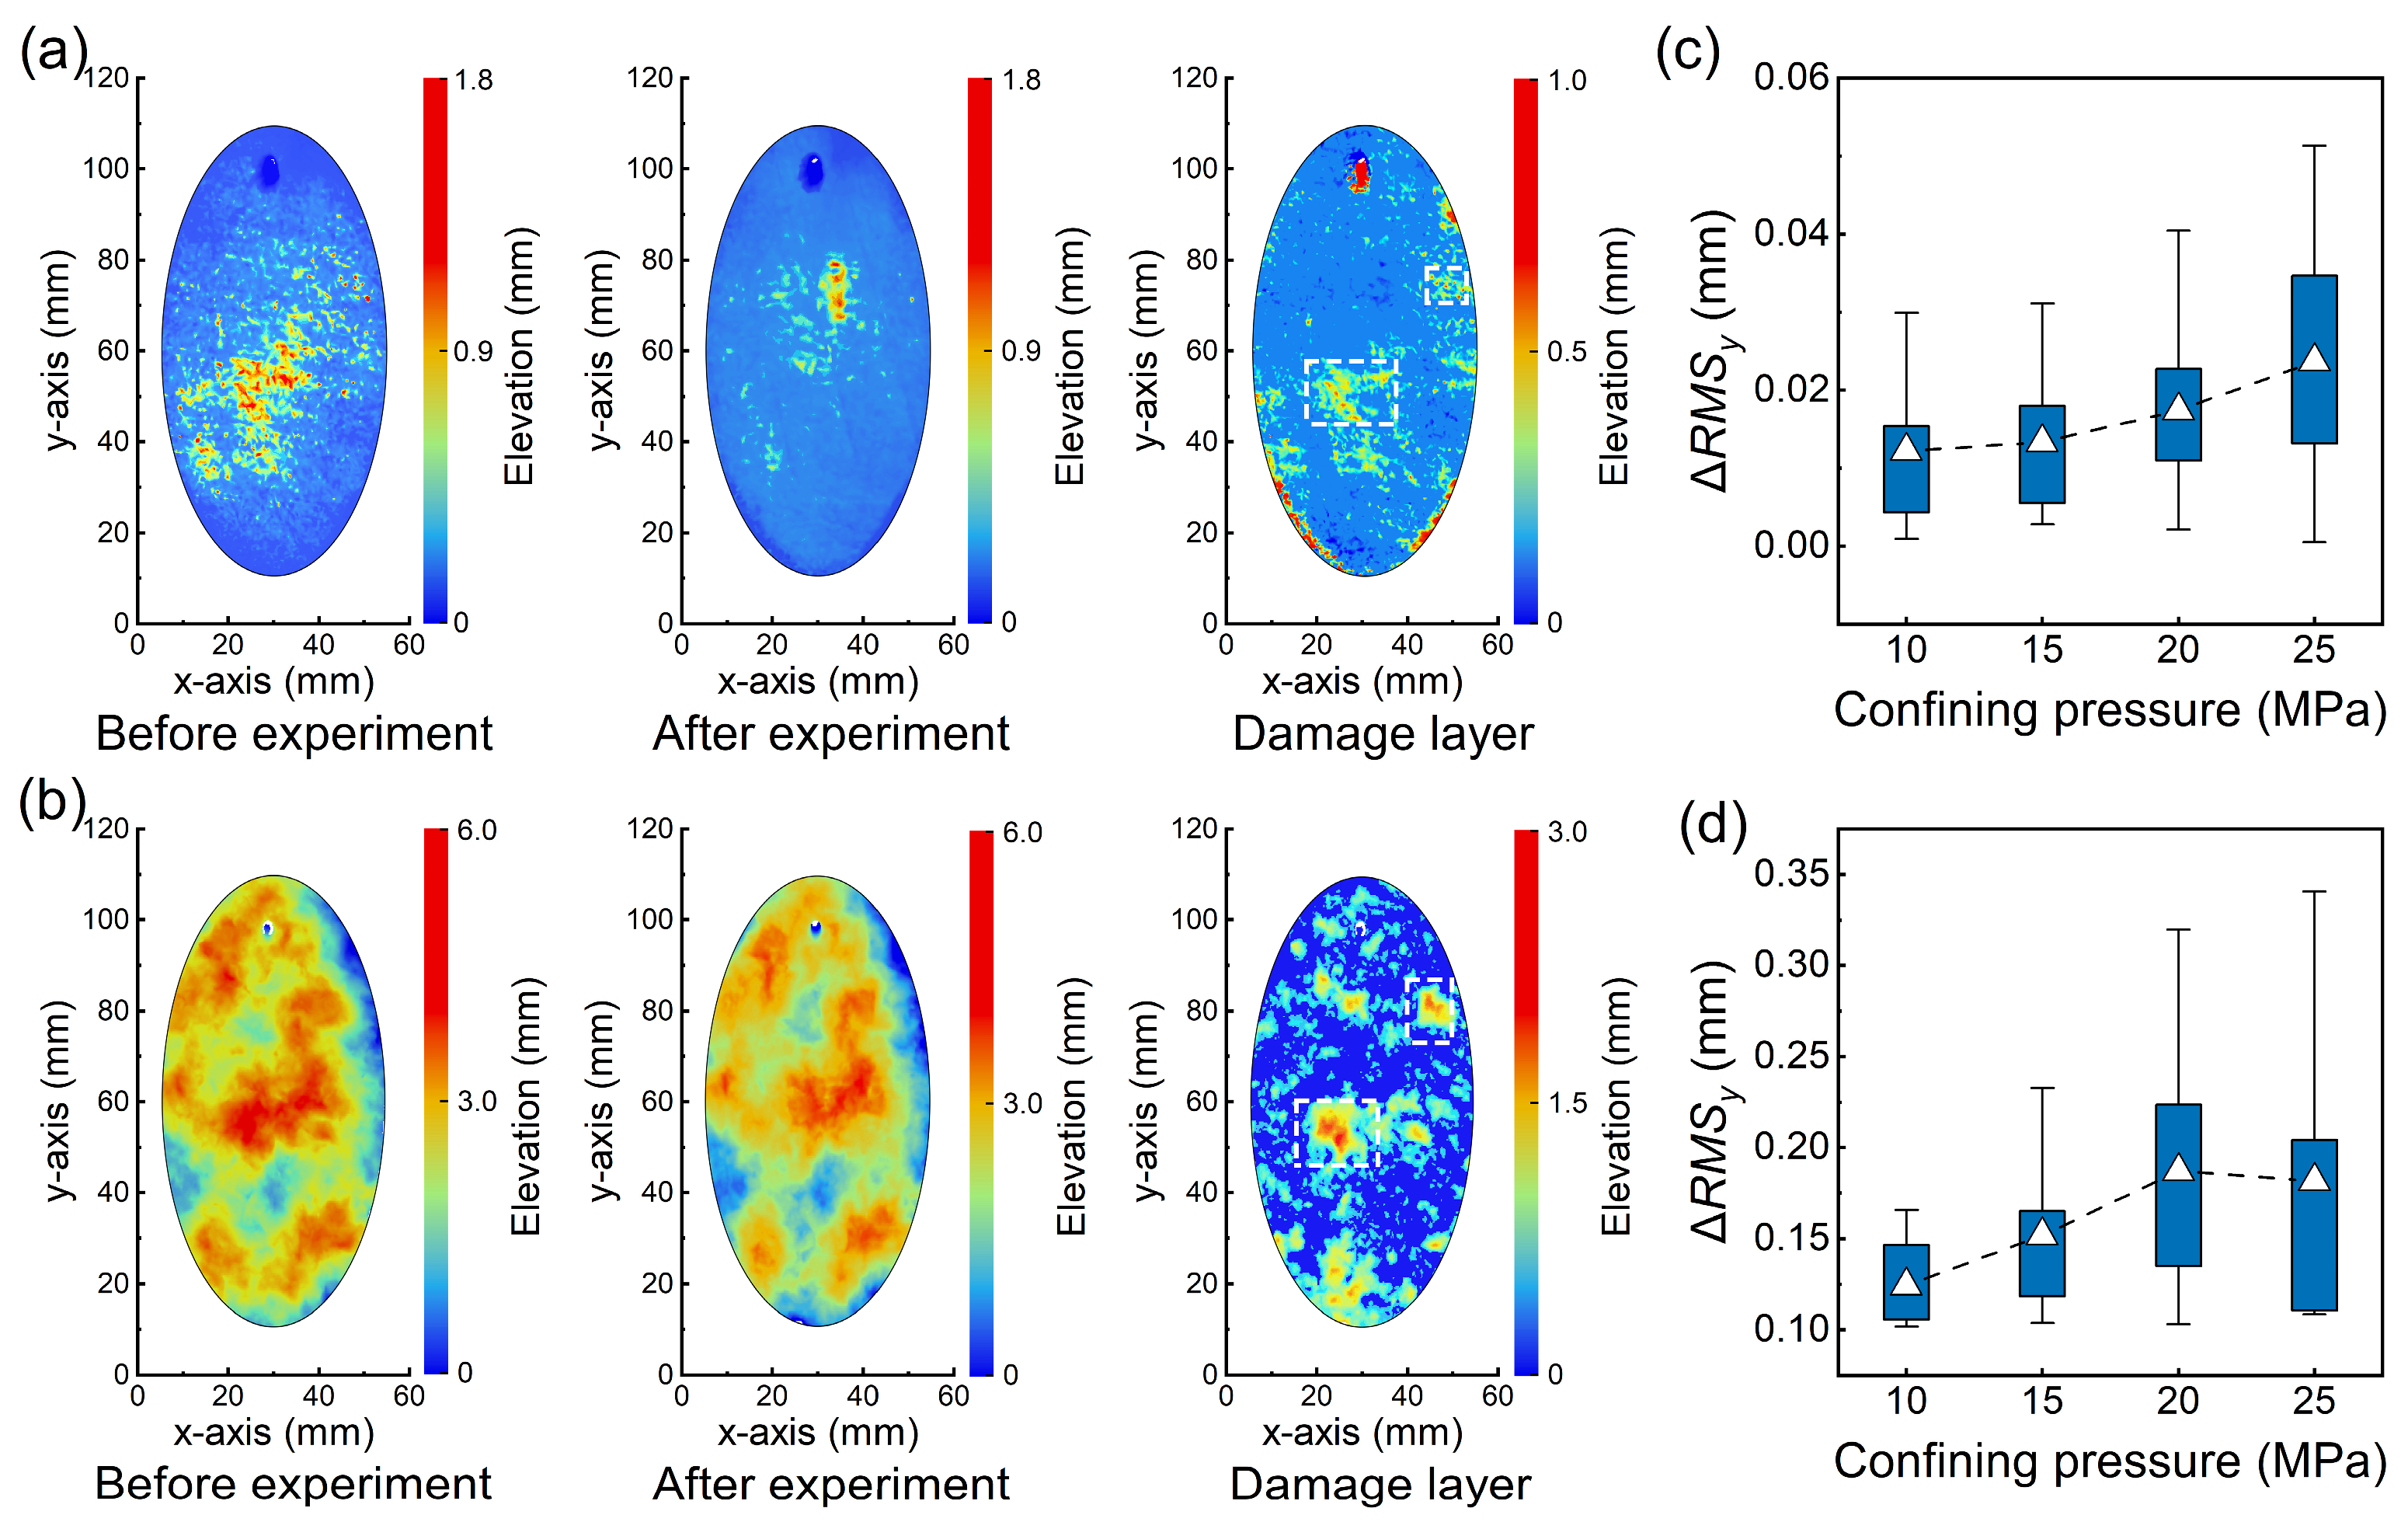
Figure 5 presents the surface roughness of smooth and rough fractures before and after triaxial shear tests under a confining pressure of σ 3 = 15 MPa. As the upper and lower fracture surfaces are mirror-symmetric, only the lower surface is shown. In the topographic contour maps, the x-axis (perpendicular to the shear direction), y-axis (parallel to the shear direction), and z-axis represent the minor axis, major axis, and asperity height, respectively. The color scale, ranging from dark blue to dark red, denotes elevation from low to high relative to the minimum surface height. During shear displacement, fracture surface asperities progressively degrade due to abrasion and shearing. To quantitatively visualize shear-induced roughness degradation, a damage layer was derived by subtracting the post-shear surface elevation from the initial elevation, as illustrated in Figure 5.
For smooth fractures, the initial surface morphology was spatially uniform and relatively flat (Figure 5a). After shearing, only minor morphological changes were observed, with no pronounced macroscopic wear features. Repeated sliding resulted in the formation of a thin and relatively uniform layer of fine-grained gouge distributed along the sliding surface. In contrast, rough fracture exhibited pronounced surface relief, with a maximum height difference of approximately 6 mm. After shearing, asperities on rough fracture surfaces showed clear signs of fragmentation, indicating intense localized damage, as illustrated within the white rectangle area of the damage layer in Figure 5. In this study, fracture roughness was quantified using the sample-scale root mean square roughness parameter ( R M S y ). To characterize roughness evolution, a roughness degradation index R M S y was defined as the difference between R M S y values measured before and after shearing. As shown in Figure 5c,d, R M S y decreased after shearing for all specimens, indicating progressive smoothing of the fracture surfaces. The magnitude of roughness degradation increased with confining pressure, suggesting enhanced asperity damage under higher normal stress conditions. Notably, the R M S y of rough fractures was approximately one order of magnitude greater than that of smooth fractures. Post-test observations further support this interpretation: a uniformly distributed fine powder on smooth fracture surfaces reflects relatively homogeneous abrasion, whereas the presence of crushed particles on rough fracture surfaces suggests that larger asperities were either abraded or sheared off.

3.2. Rupture Dynamics

3.2.1. Stress Drop

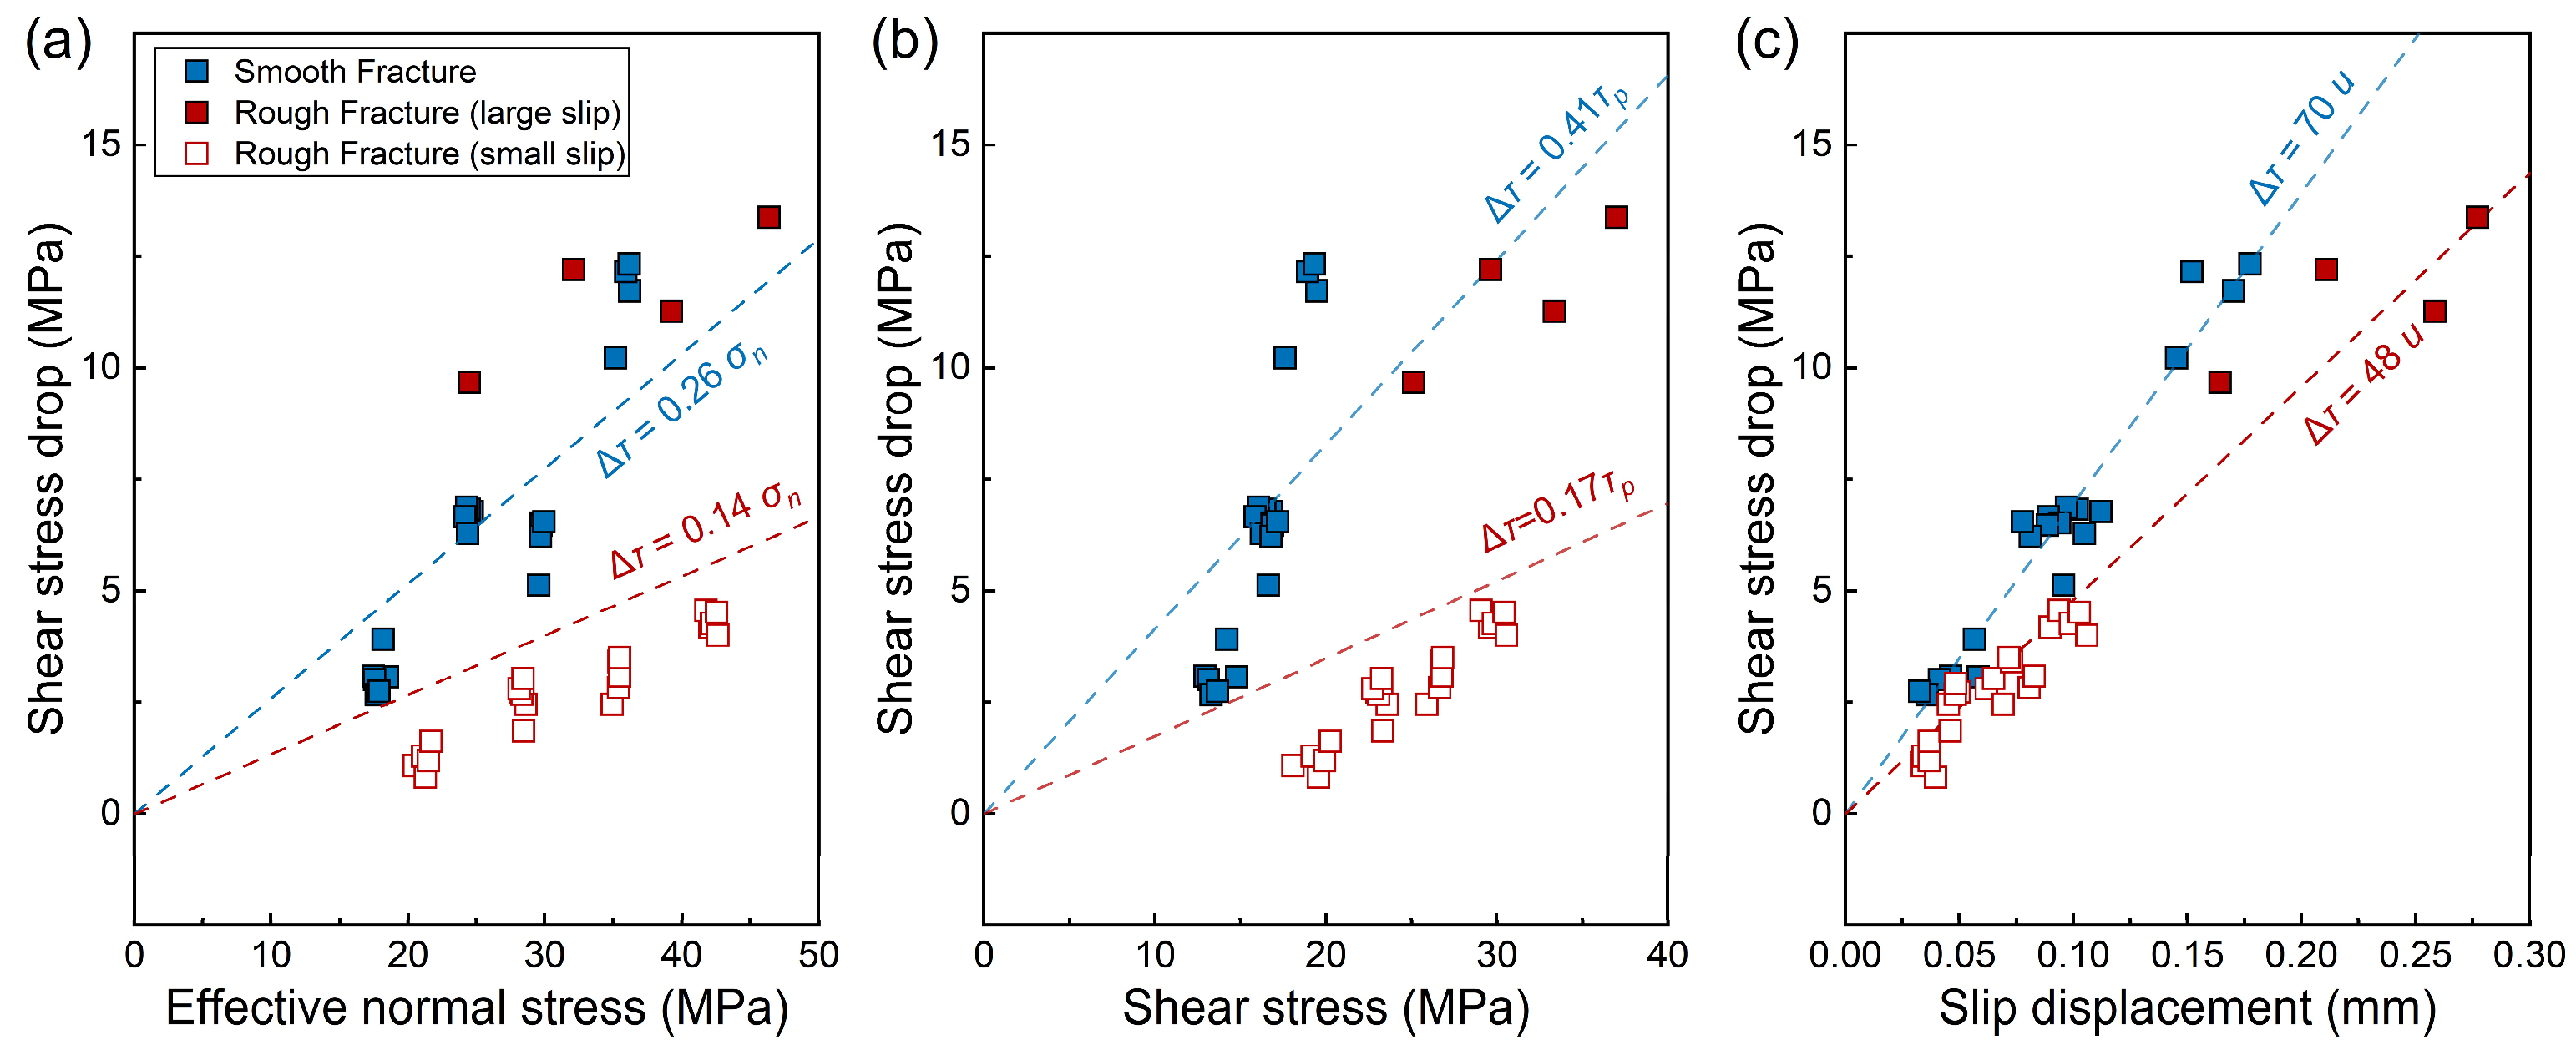
Stress drop is a widely used source parameter for characterizing earthquakes and shear ruptures, as it directly reflects the degree of stress release during rupture. In this study, stress drop is defined as the difference between the peak shear stress and the residual shear stress recorded by pressure sensors. As shown in Figure 6a, stress drop exhibits a positive correlation with normal stress for both smooth and rough fractures, consistent with previous observations [39,40,41]. This trend indicates that higher background stress promotes stronger rupture instabilities, in agreement with field observations showing that deep excavation tend to induce more intense rockbursts [42,43]. Overall, under identical normal stress conditions, the average stress drop for smooth fractures is greater than that for rough fractures [16], and the ratios of stress drop to normal stress are 0.26 and 0.14, respectively. Notably, the stress drop associated with the initial stick-slip events (i.e., the large slip events) on rough fractures is significantly greater than smooth fractures. This observation suggests that strongly interlocked asperities in rough fractures can accumulate substantial elastic energy during loading, which is rapidly released during initial shear failure. Moreover, the intense stick-slip event occurring in the first shear cycle (i.e., the large-slip event) of rough fractures generates a significantly larger stress drop than subsequent events. These findings demonstrate that stress drop release in rough fractures depends markedly on the shear cycle, and that roughness degradation (particularly during the initial stick-slip event) noticeably weakens the intensity of stick-slip behavior.
To further assess the relative magnitude of stress release, Figure 6b illustrates the relationship between stress drop and peak shear stress. Overall, stress drop increases with peak shear stress. The ratios of stress drop to peak shear stress are approximately 0.41 for smooth fractures and 0.17 for rough fractures, indicating that about 41% and 17% of the peak shear stress is released during slip, respectively. Notably, large slip events on rough fractures release up to 37% of the peak shear stress, approaching values observed for smooth fractures. The reduced stress drop during subsequent events is attributed to progressive asperity damage, which diminishes the ability of the fracture surface to store elastic energy and thereby weakens stick-slip behavior. Figure 6c further shows that stress drop is positively correlated with slip displacement. Linear relationships are observed for both fracture types, with proportionality coefficients of approximately 70 MPa/mm for smooth fractures and 48 MPa/mm for rough fractures. Importantly, both large and small slip events follow this linear trend, suggesting a consistent relationship between stress drop and slip displacement across different rupture modes.

3.2.2. Breakdown Work During Stick-Slip Events

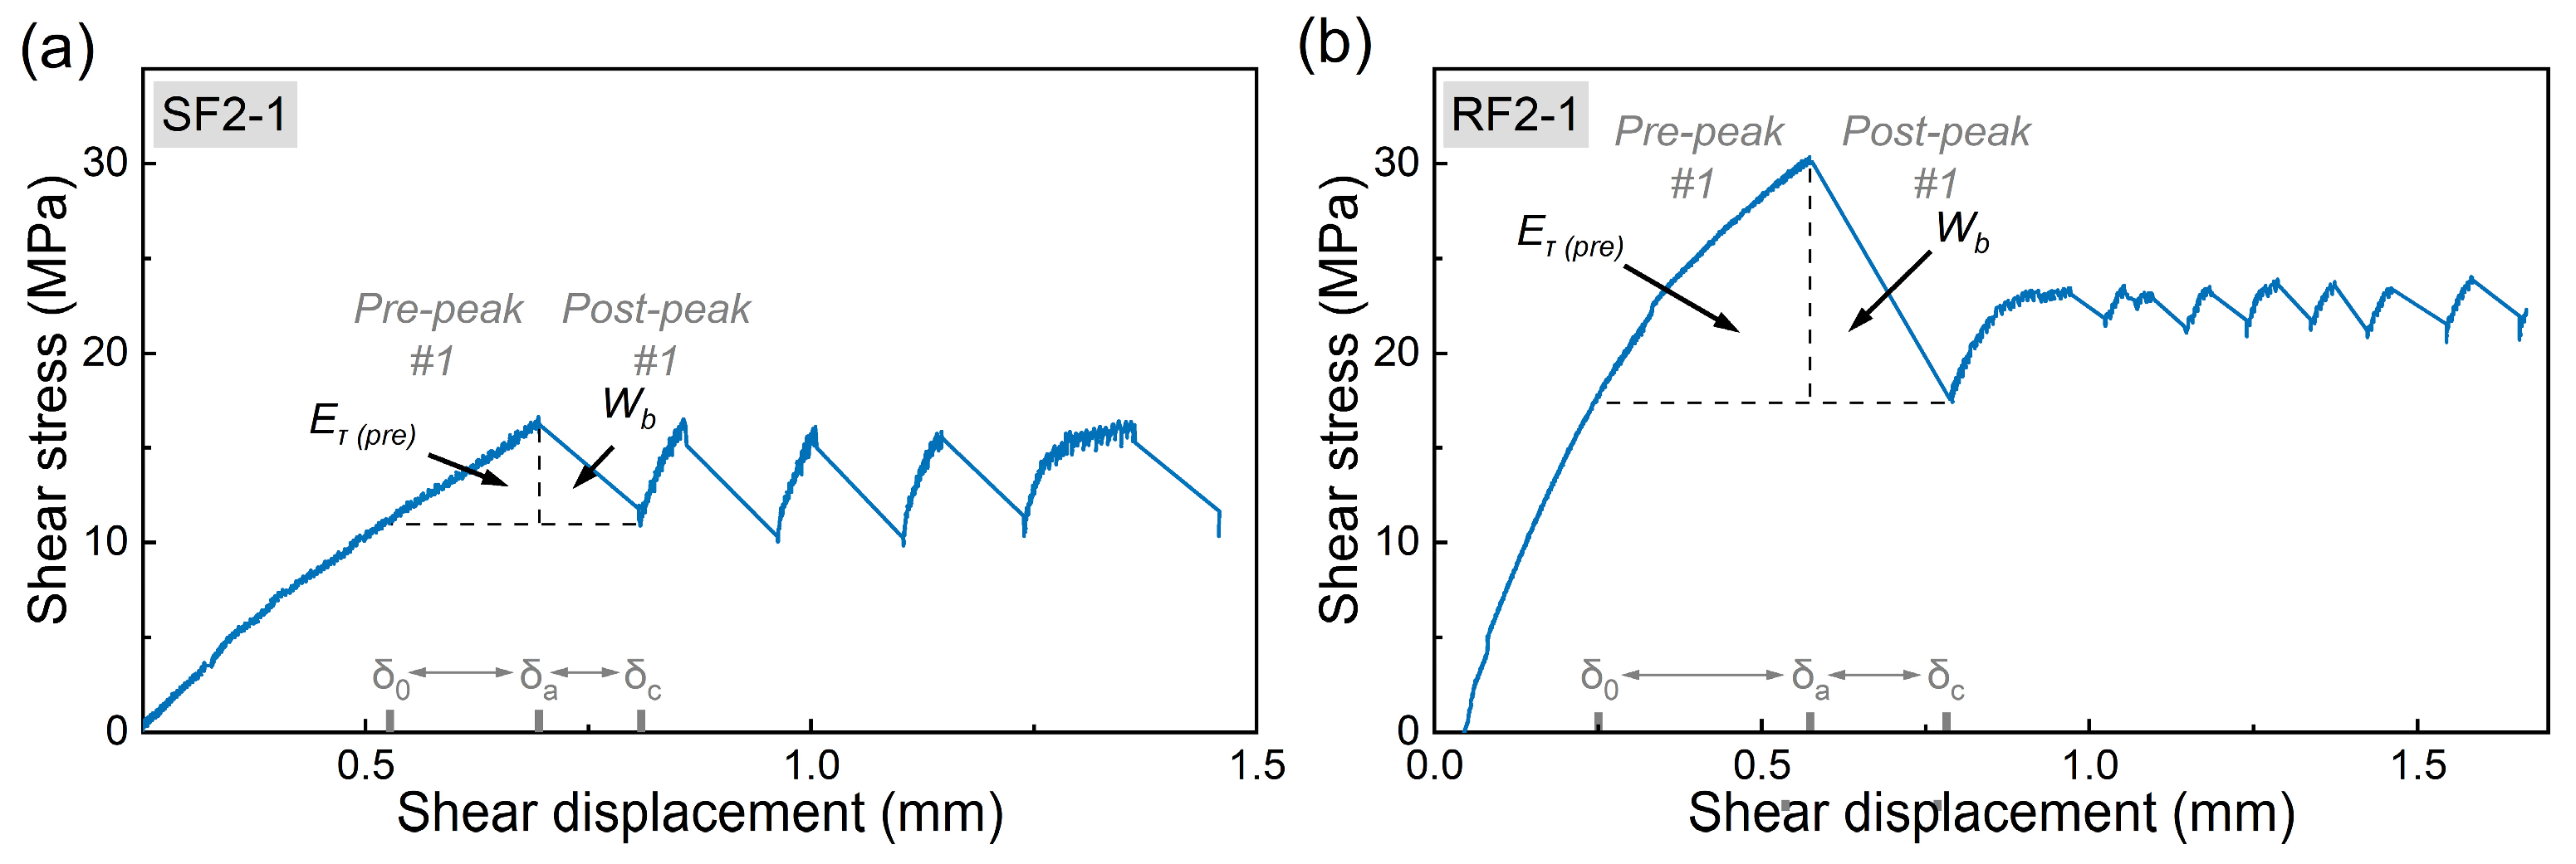
In this study, we focus on the stored elastic energy during the preparatory loading stage and the energy dissipation throughout the entire shearing process [44]. Representative shear stress-displacement curves for smooth and rough fractures are shown in Figure 7a and Figure 7b, respectively. Several characteristic displacements are defined to describe the shear process: δ a denotes the displacement during the strengthening stage; δ c represents the total breakdown slip at which peak shear strength drops to the residual shear stress τ r ; and δ 0 corresponds to the slip displacement at which the shear stress-displacement curve intersects τ = τ r . For each stick-slip event, two primary energy components were identified (excluding heat energy). The first is the pre-peak accumulated energy E τ p r e , which reflects elastic energy storage and micro-fracturing within the sample and was calculated using Equation (5). The second component is the apparent breakdown work W b , which represents the energy dissipated during post-peak frictional sliding and was calculated using Equation (6) [26].
E τ p r e = δ 0 δ a τ u τ r d u
W b = δ a δ c τ u τ r d u
It is important to emphasize that the apparent breakdown work W b calculated here is an apparent mechanical work derived solely from the macroscopic stress-displacement curves. This quantity does not separately resolve radiated seismic energy or frictional heat, and therefore it should not be interpreted as a complete energy budget of the rupture. The 100 Hz sampling rate also limits the resolution of high-frequency dynamic components. Consequently, W b represents an upper-bound estimate of the mechanical energy dissipated during post-peak slip, with the understanding that a portion of the true breakdown work may be carried away as radiated energy or heat. A full partitioning of energy into fracture damage, radiated energy, and heat would require supplementary measurements such as acoustic emission, high-speed slip data, or calorimetry, which are beyond the scope of the present study [27,45].
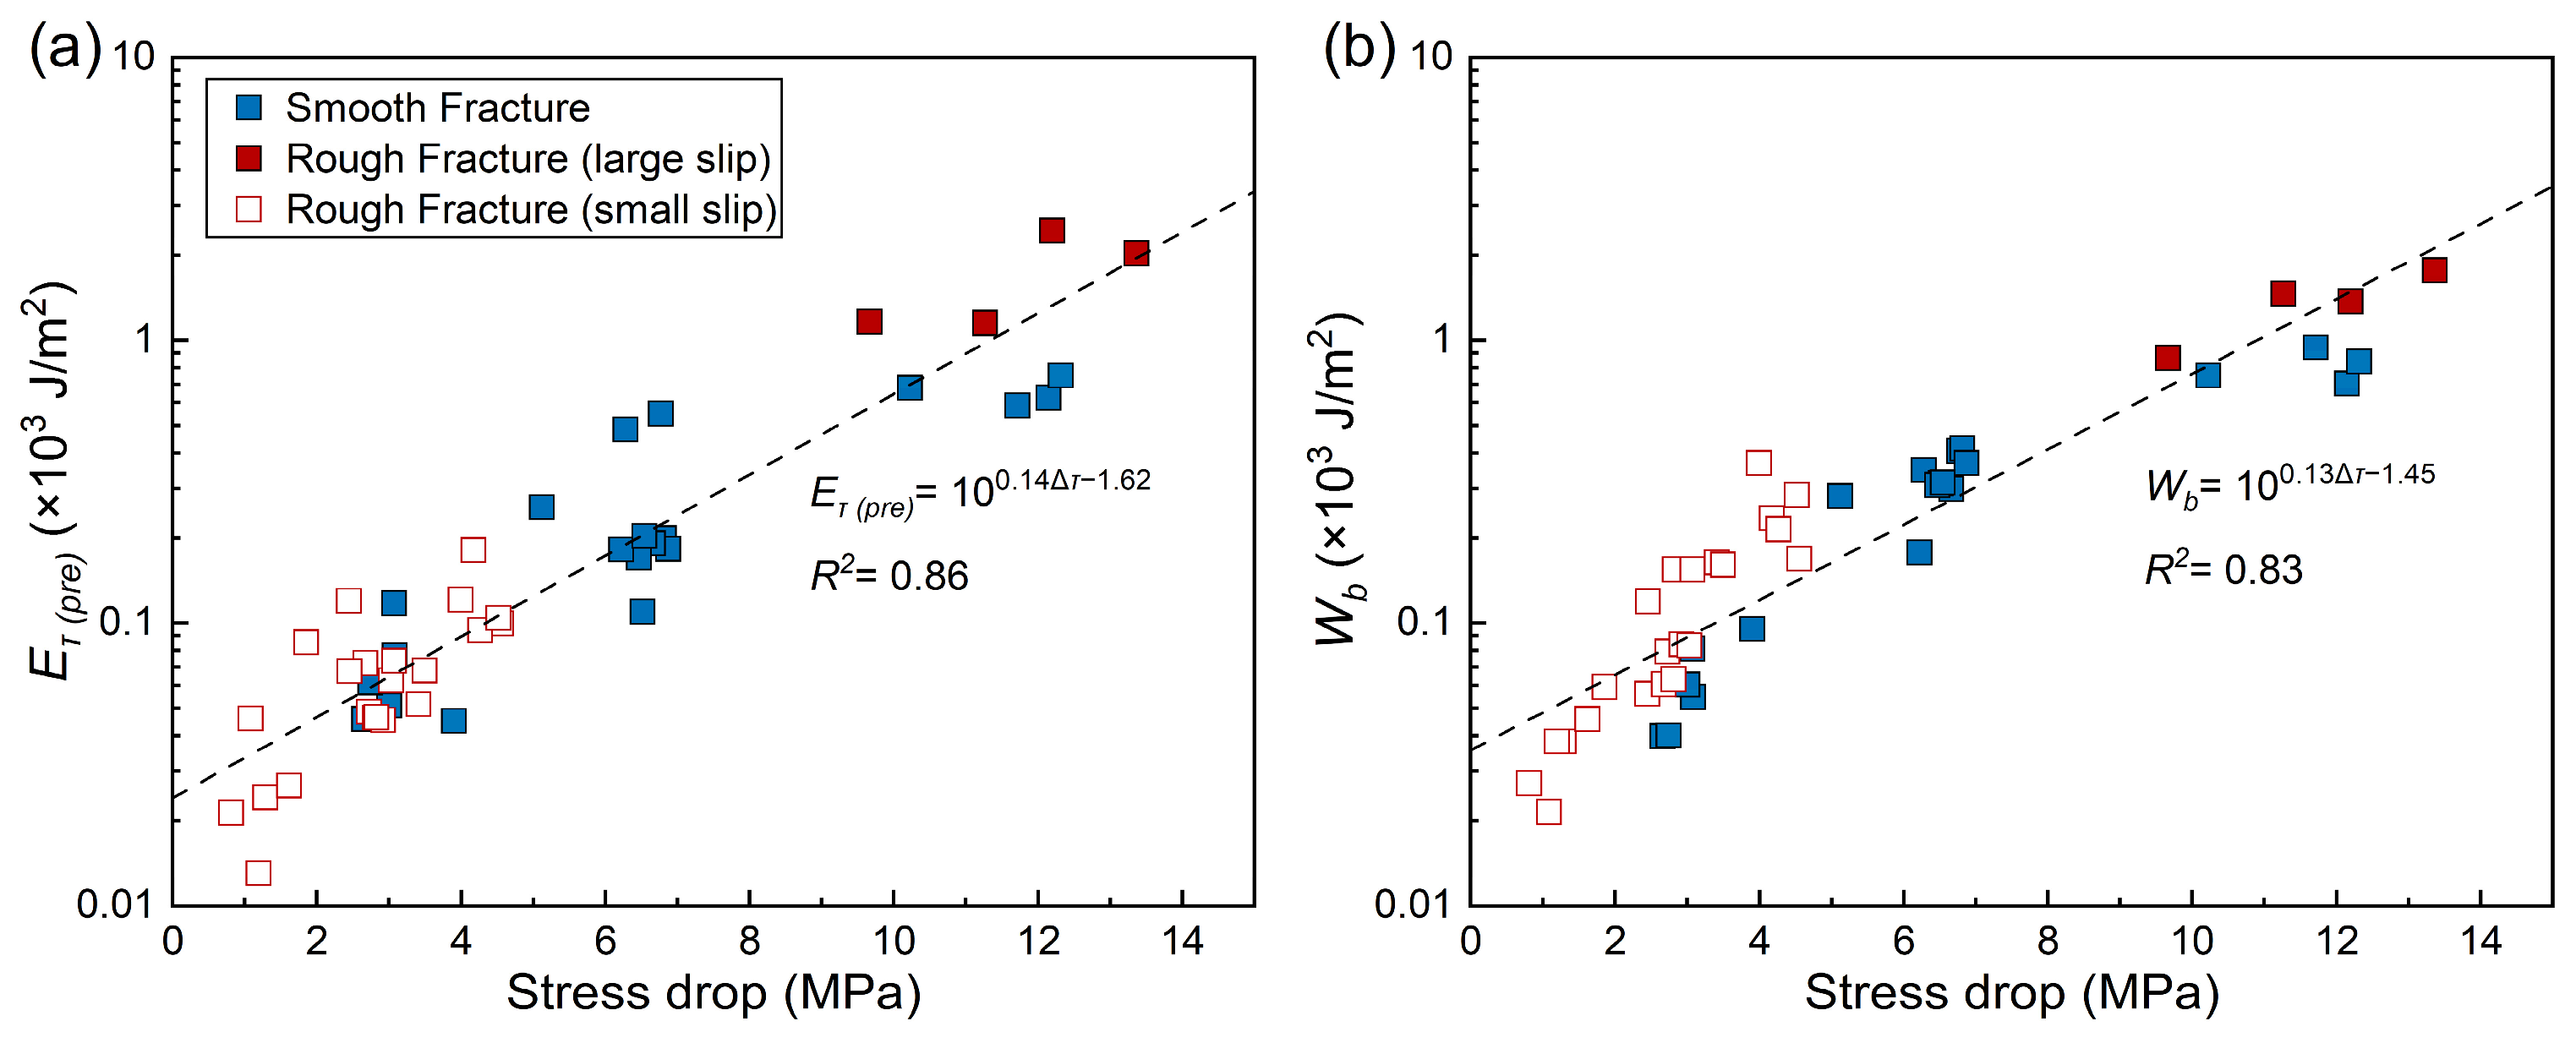
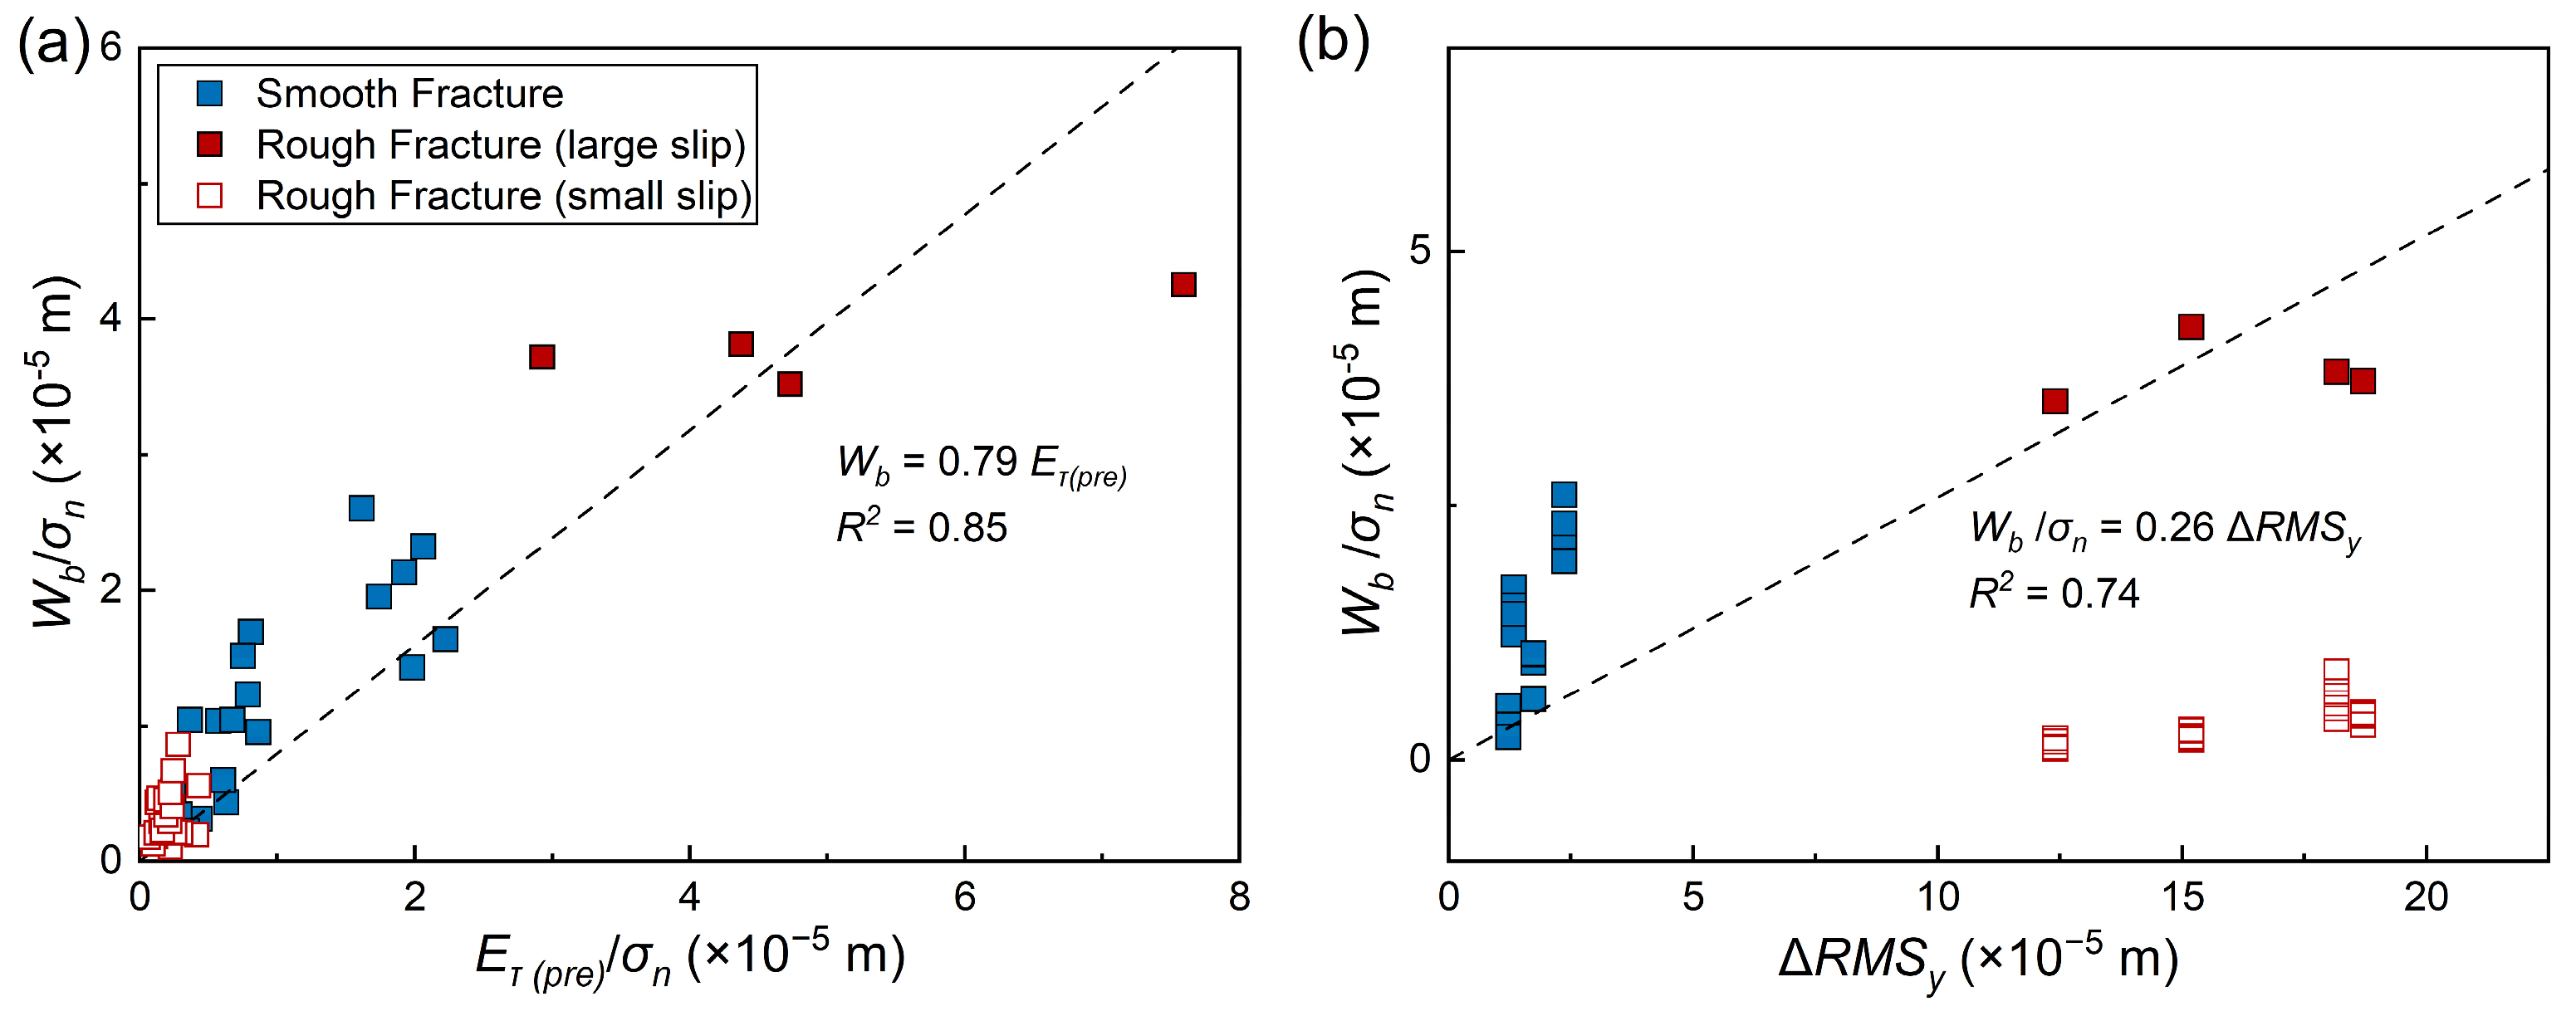
We first examined the relationship between these energy components and stress drop. As shown in Figure 8a,b, stress drop exhibits a clear power-law relationship with both E τ p r e and W b , independent of fracture roughness. This suggests that stress drop recorded important information of the rupture process. To enable comparison across different stress conditions, the energy components were normalized by the corresponding normal stress. A comparison of the two normalized energy components reveals that the ratio between E τ p r e and W b remains approximately constant across all stick-slip events (Figure 9a). Furthermore, the relationship between normalized W b and roughness degradation ( R M S y ) was analyzed. As shown in Figure 9b, normalized W b correlates well with R M S y for all stick-slip events on smooth fractures and for large slip events on rough fractures. For smooth fracture, the normalized W b remains relatively stable across events. In contrast, rough fractures exhibit significant variability: large slip events show markedly higher normalized W b than small slip events. This behavior is consistent with previous studies reporting enhanced energy dissipation during rupture of rough, interlocked fractures [46]. It should be noted that this relationship is primarily applicable to interlocked fractures. We infer that W b , as manifested by fracture roughness degradation, is largely controlled by the fragmentation and shearing of the largest asperities, which predominantly occurs during large slip events. Compared with smooth fractures, interlocked rough fractures require substantially more energy to overcome macroscopic geometric barriers during rupture [47].

4. Discussion

4.1. Effects of Roughness on Frictional Behavior

Asperities on fracture surfaces play a dominant role in governing friction evolution [21,23]. Their geometric characteristics control the true contact area of fracture interface and thus exert a primary influence on effective shear strength [48]. In the present shear experiments, the measured apparent frictional strength represents a macroscopic composite parameter that integrates the average mechanical contribution of individual asperities. The experimental results demonstrate that rough fractures consistently exhibit higher peak shear strength than smooth fractures. This finding is consistent with crustal-scale field observations showing that fault shear strength increases with surface roughness and that large earthquakes preferentially nucleate along relatively smooth or planar fault segments [49]. In contrast to a single stick-slip event commonly reported in previous experiments [5,50], fractures in this study remained in a continuously unstable state under sustained axial loading, producing multiple stick-slip events. Notably, smooth and rough fractures exhibit distinct frictional evolution patterns with increasing shear cycles. The shear strength of smooth fractures remains relatively constant, whereas rough fractures display a general decrease in shear strength with successive slip events. These contrasting responses are attributed to differences in roughness evolution, asperity damage mechanisms, and gouge accumulation during repeated shearing [51,52].
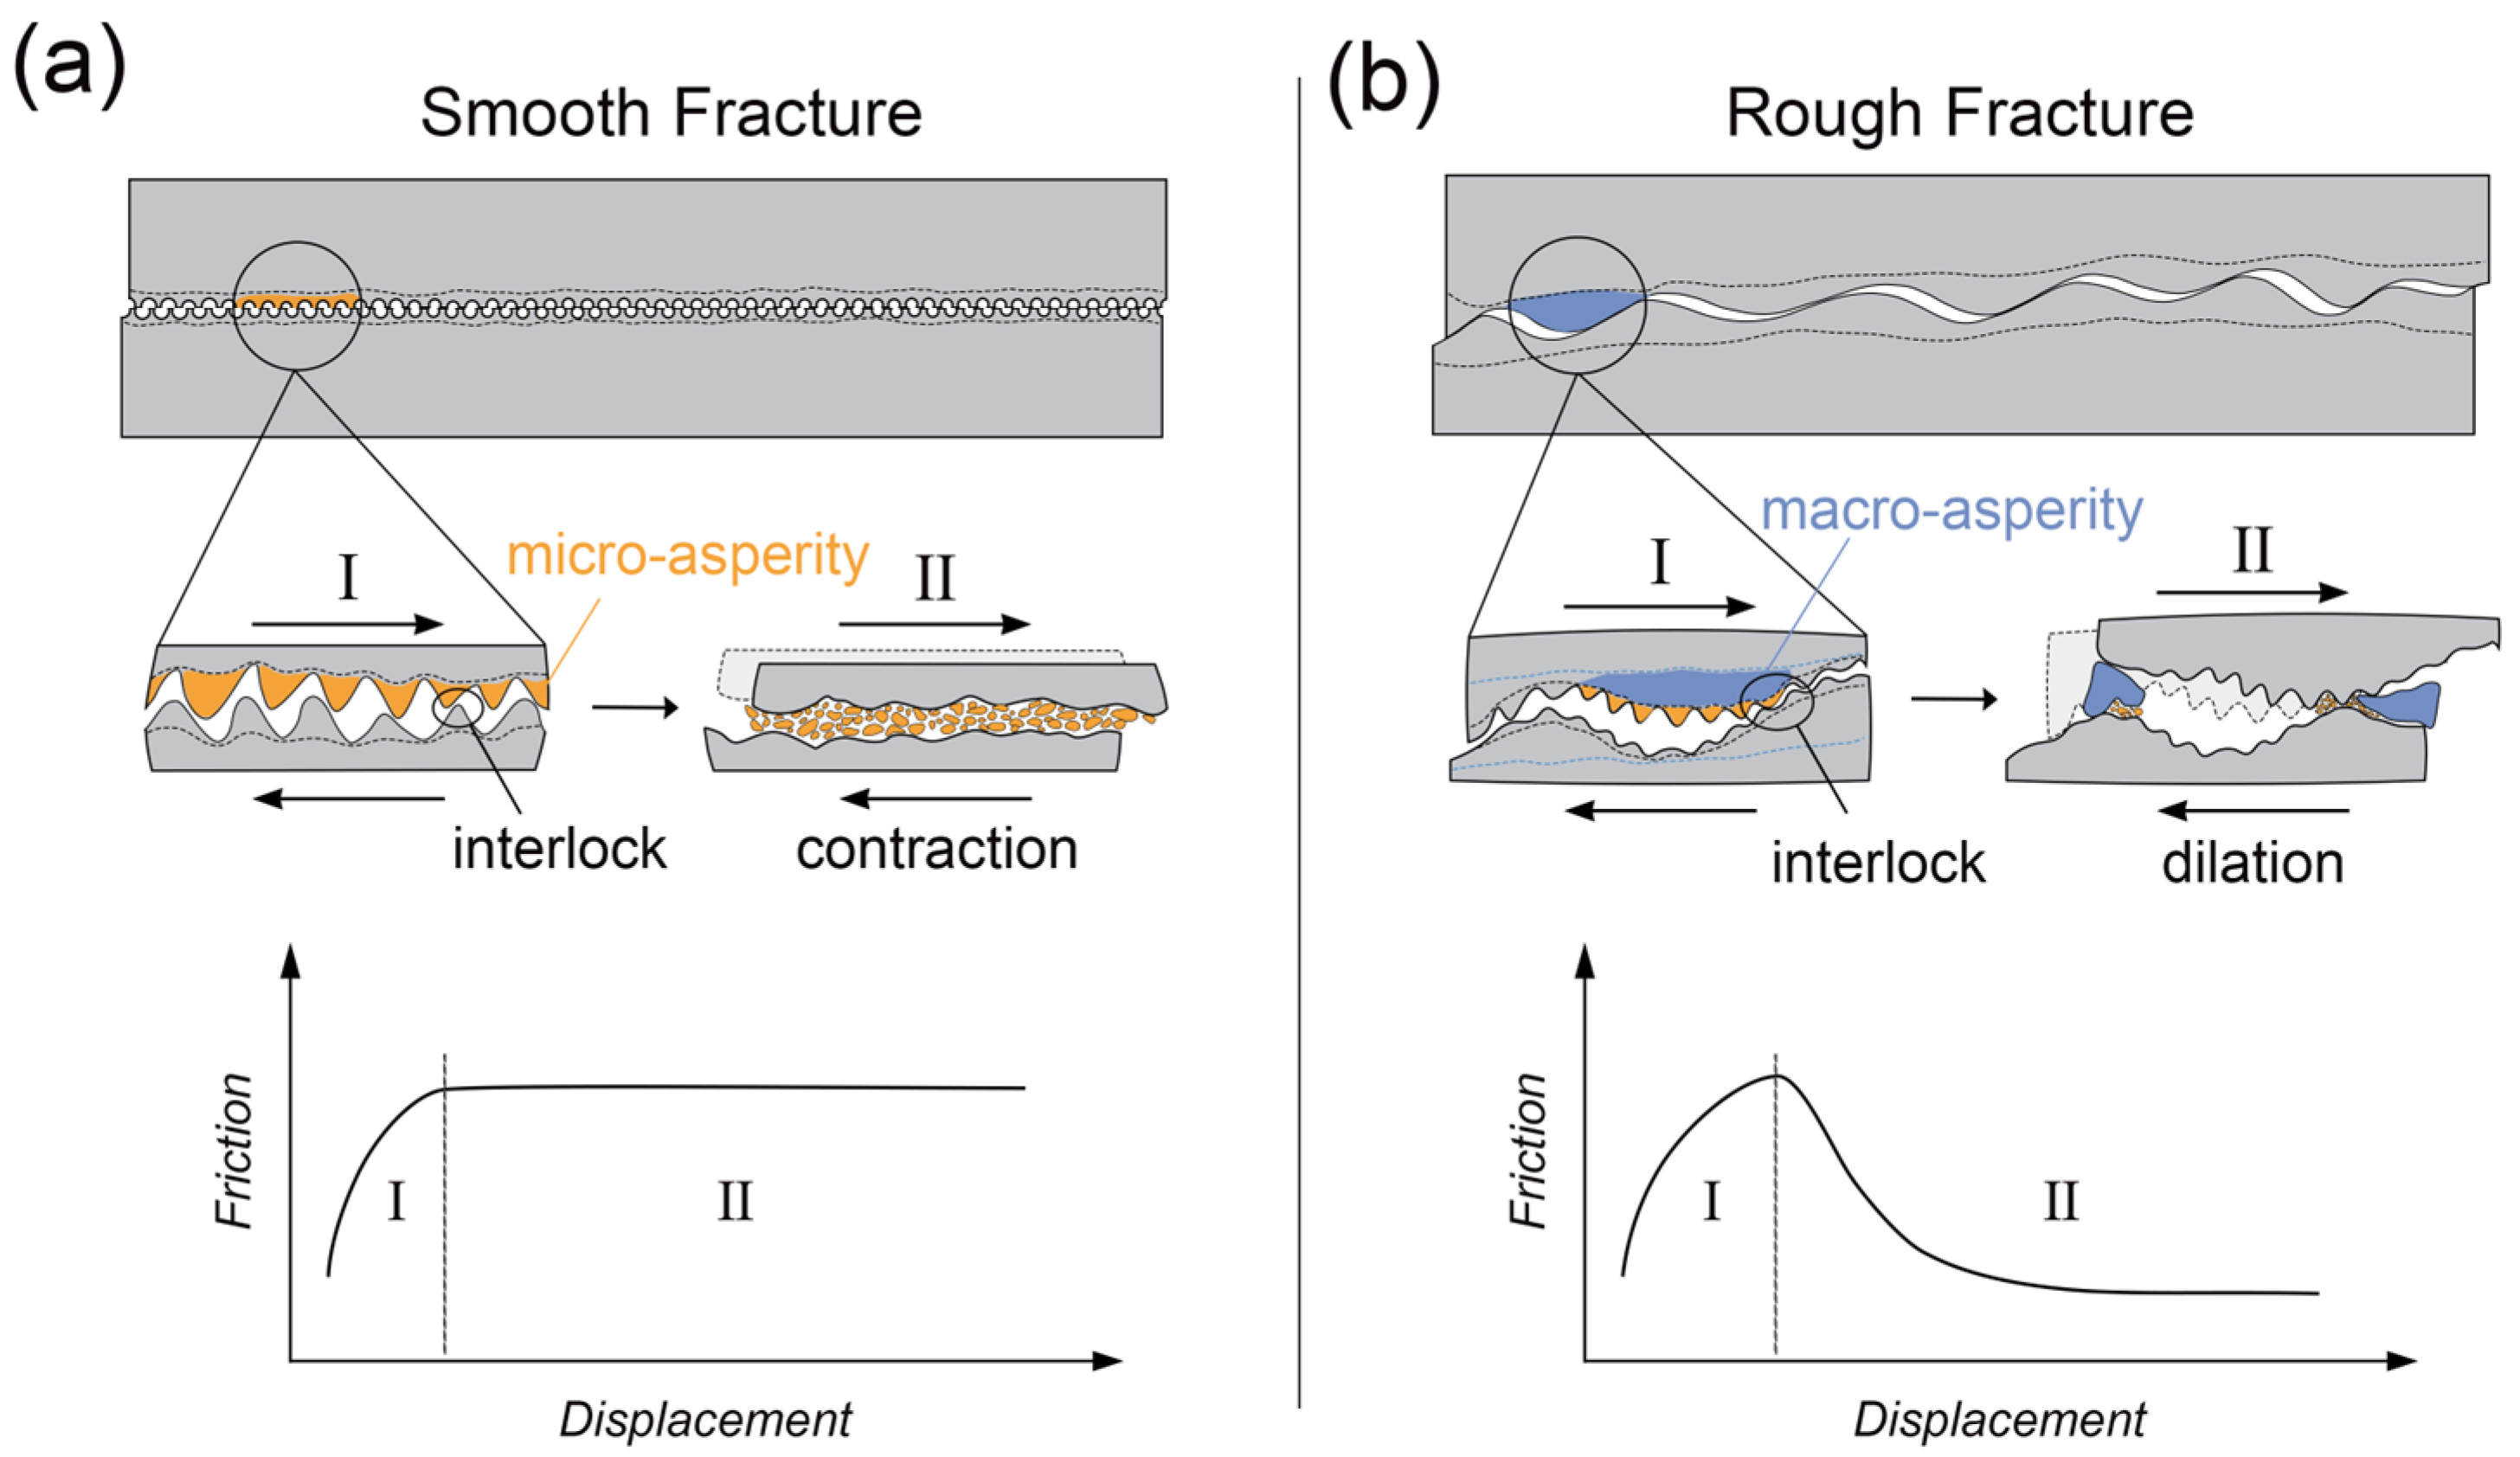
Based on observations from our frictional evolution experiments, two representative frictional evolution scenarios are identified, as schematically illustrated in Figure 10. Generally, frictional evolution can be divided into two stages according to the progression of sliding behavior: stage I (pre-peak friction) and stage II (post-peak friction). During stage I, shear displacement promotes asperity collision and interlocking, leading to a gradual increase in friction for both smooth and rough fractures. Because macro-asperities on rough fractures are larger and more strongly interlocked than the micro-asperities on smooth fractures, the frictional strengthening during this stage is more pronounced for rough fractures (Figure 10). During stage II, both smooth fractures dominated by micro-asperities and rough fractures dominated by macro-asperities exhibit brittle slip behavior under the applied confining pressure range (Figure 3). For smooth fractures, repeated shear cycles primarily damage micro-asperities and generate limited amounts of fine gouge, resulting in minor roughness degradation [23,53]. In this study, the gouge layer formed on smooth fractures remains thin due to the initially flat surface morphology, and its influence on frictional evolution is therefore limited (Figure 10a). In contrast, rough fractures experience pronounced degradation due to the shearing-off and fragmentation of macro-asperities. The measured R M S y values show varying degrees of reduction after successive slip events, which strongly correlate with the observed decrease in shear strength (Figure 4 and Figure 5). Previous studies have similarly demonstrated that roughness degradation leads to a reduction in fracture shear strength [14,54]. Combined with W b dissipated during shear cycles, we consider the most significant roughness degradation occurs during the initial stick-slip events (large slip events), resulting in a substantial decrease in shear strength during subsequent cycles. Thereafter, roughness degradation is dominated by damage to residual micro-asperities, producing a more gradual decline in both roughness and shear strength. In addition, the decrease in shear strength with shear cycle can also be related to the accumulation of gouges. In the initial stick-slip event, large amounts of gouges were generated which contribute to the decrease in shear strength. Due to the reduction of newly generated gouges in the subsequent shear slip, the decrease in shear strength tends to be gentle.
The above analysis represents an idealized interpretation of fault friction evolution based on asperity damage processes and stress changes observed in laboratory shear experiments. It is recognized that fault friction in natural systems is governed by multiple interacting factors, including fault geometry, stress state, orientation, scale effects, and gouge properties [52,54,56]. Consequently, both laboratory experiments and field investigations should consider the coupled influence of these factors to develop more comprehensive and universally applicable theoretical frameworks for fault friction and rupture behavior.

4.2. Comparison of Stress Drop Magnitude

The stress drop of smooth fractures shows a strong dependence on normal stress, whereas that of rough fractures is controlled by the combined effects of normal stress and shear cycles, as shown in Figure 6a. In particular, the stress drop associated with large slip events on rough fractures is significantly greater than the average stress drop observed for smooth fractures. This observation contrasts with previous experimental studies, which generally reported larger stress drops for smooth fractures than for rough fractures [12,57]. We attribute this apparent discrepancy to the substantial difference in fracture roughness between the two fracture types. In this study, the R M S y values of smooth and rough fractures are approximately 0.03 mm and 2 mm, respectively, representing a roughness contrast of nearly two orders of magnitude. This pronounced roughness difference leads to fundamentally distinct asperity contact characteristics. During the loading stage, strong asperity interlocking in rough fractures generates high shear resistance, facilitating the accumulation of greater elastic strain energy and resulting in more intense stick-slip behavior during large slip events. Following the initial rupture, however, macro-asperities are progressively sheared off, reducing the capacity to store elastic energy and leading to weaker stick-slip events in subsequent shear cycles. In addition, Morad et al. [16] demonstrated that stress drop exhibits a non-linear dependence on surface roughness, identifying a critical roughness (7 μm in their study) corresponding to the maximum stick-slip events. Fractures with roughness either above or below this threshold tend to exhibit stable sliding (i.e., reduced stick-slip amplitude).
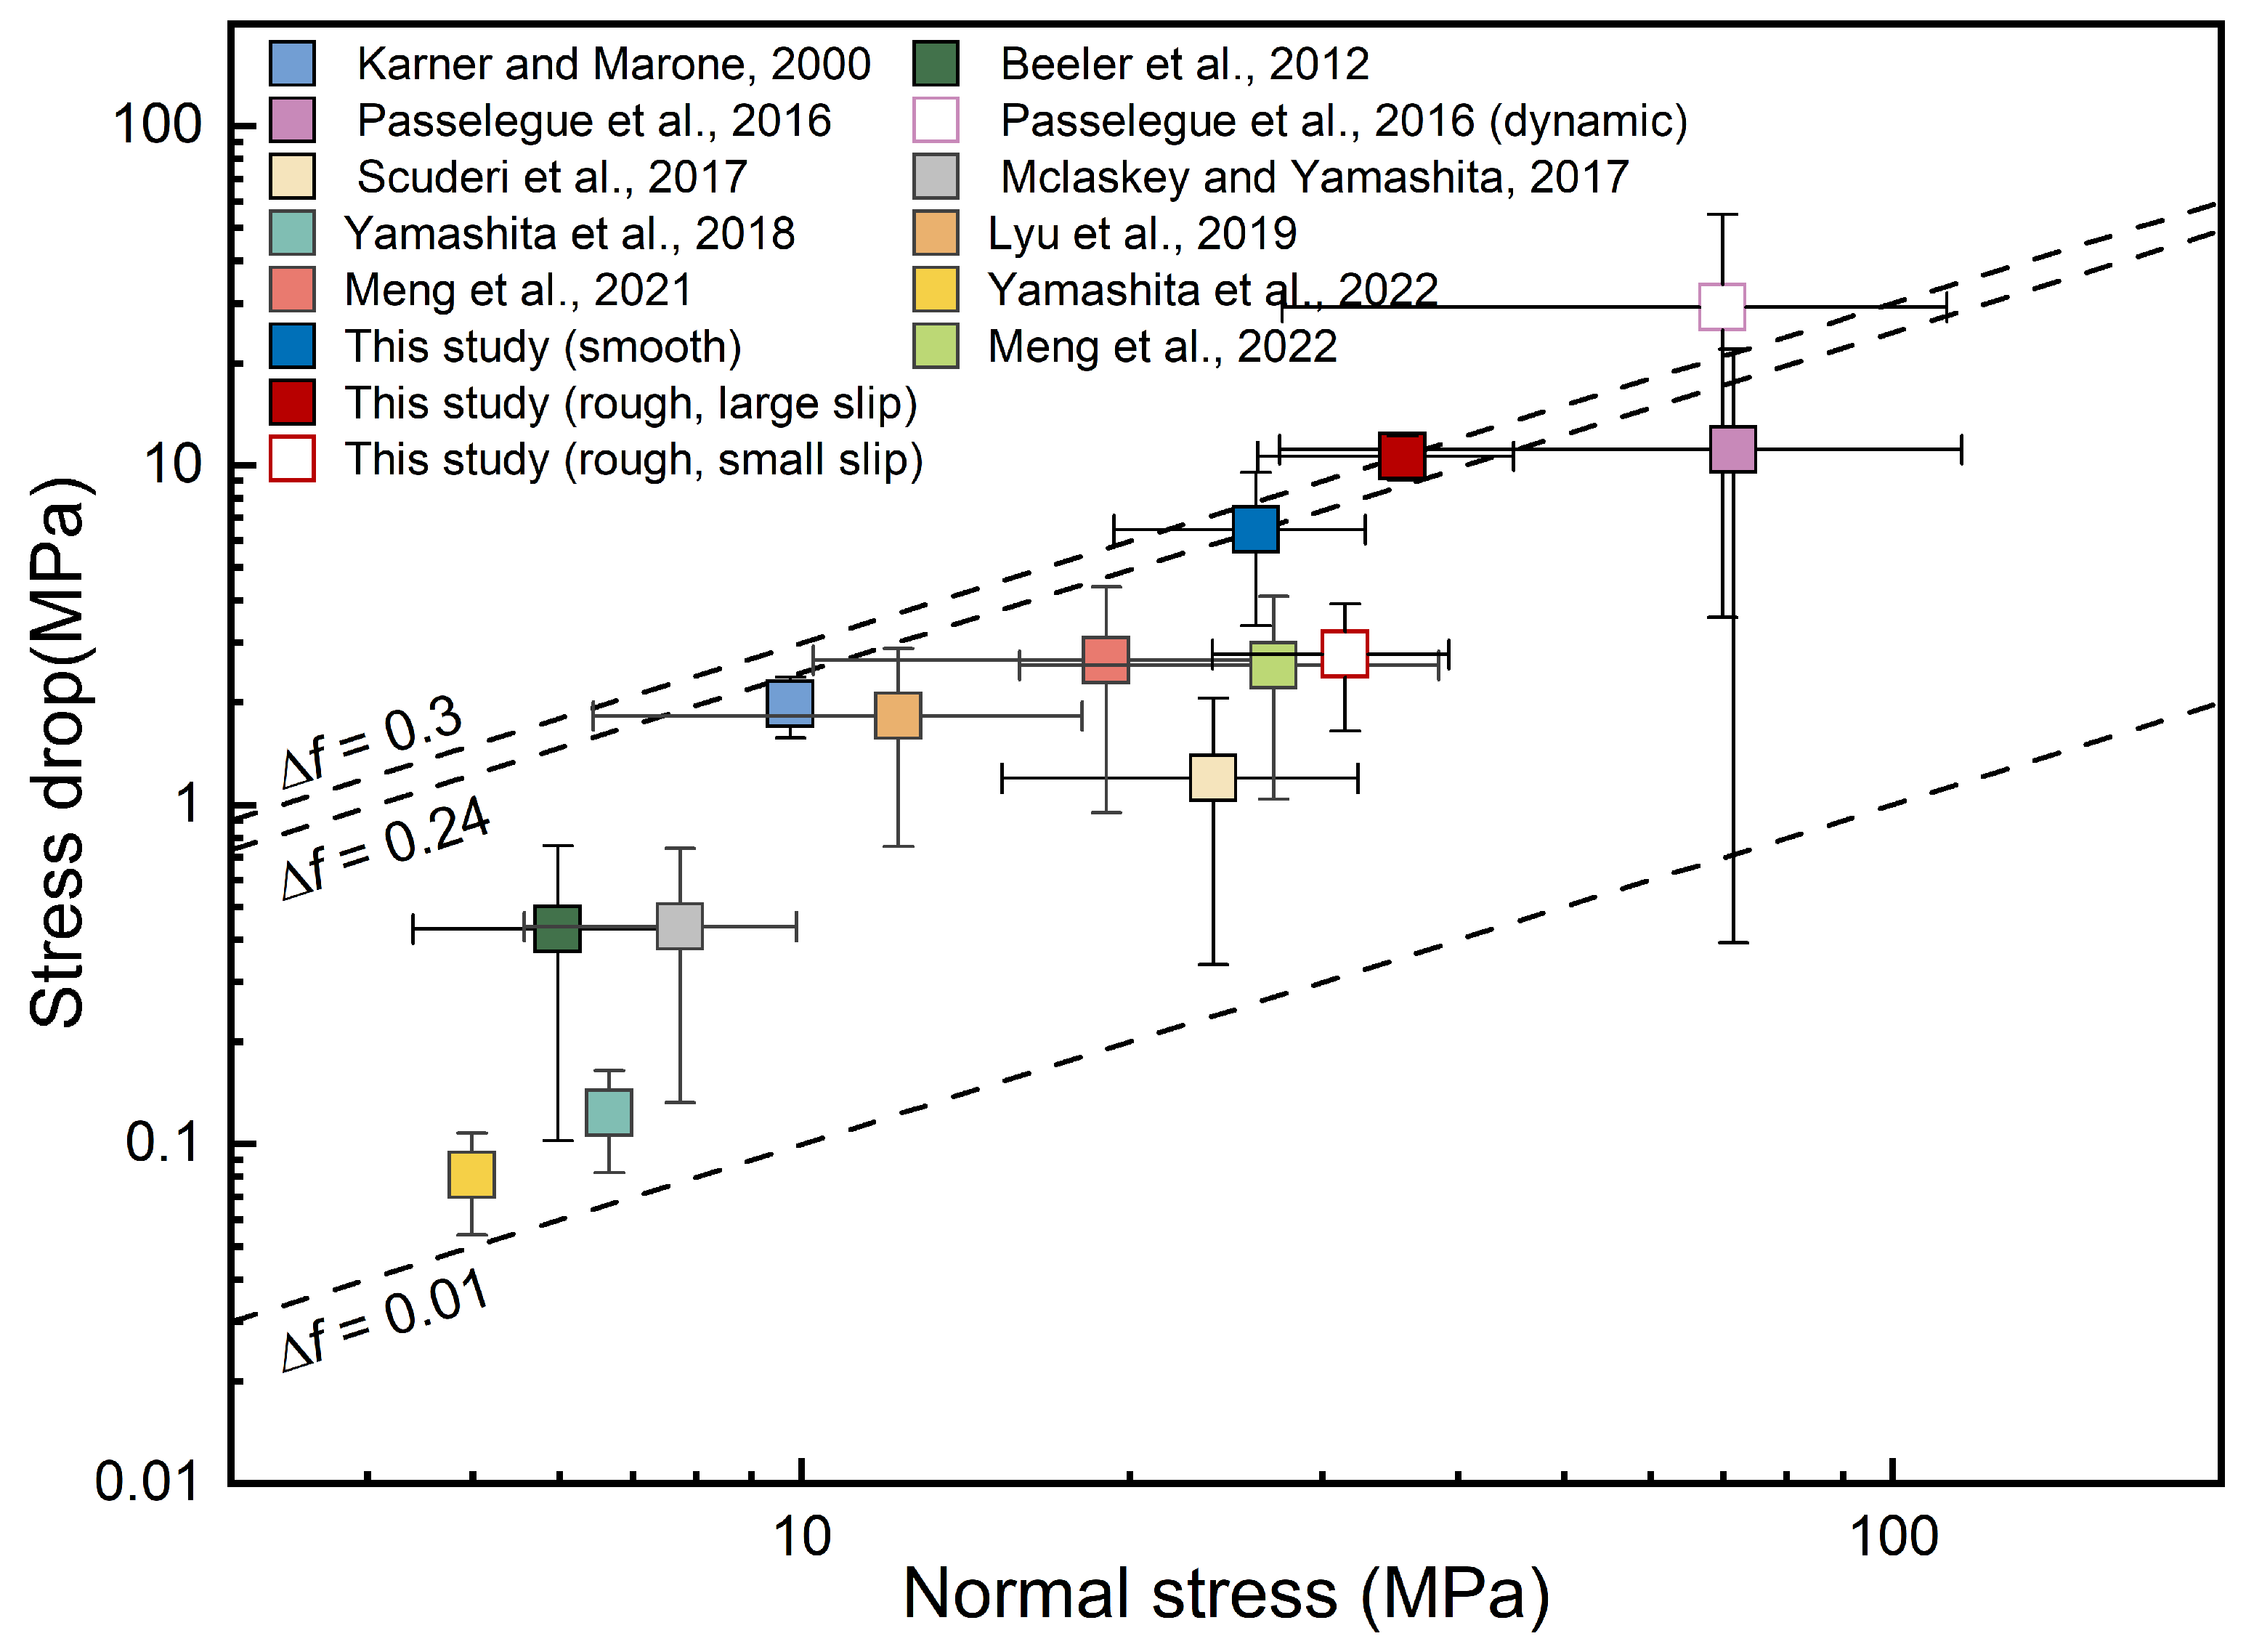
The observed correlations between dynamic parameters (e.g., stress, slip displacement, and apparent breakdown work) and morphological parameters (e.g., initial roughness and roughness degradation) with stress drop in our experiments suggests that stress drop records critical information about the rupture process. To further investigate the relationship between stress drop and normal stress, we compared the stress drop values obtained in this study with those reported in previous studies [38,41,58,59,60,61,62,63,64]. These studies encompass a wide range of fracture types (e.g., sawcut versus tension-induced fractures; bare versus gouge-filled interfaces) and experimental configurations (e.g., direct shear and triaxial loading systems). As shown in Figure 11, stress drop generally increases with normal stress across a wide range of normal stress. The friction drop f for most data ranges from 0.01 to 0.3, with an average of about 0.24. Here, f is defined as the ratio of stress drop to normal stress. This indicates that the influence of fracture type and experimental configuration on stress drop is relatively limited. In this research, the friction drop associated with large slip events on rough fractures is greater than that of small slip events, indicating that the influence of shear cycle on stress drop cannot be neglected. It should be noted that the stress drop discussed here corresponds to static stress drop. Passelègue et al. [41] reported that static and dynamic friction drops are comparable ( f = 0.1–0.3) under low normal stress conditions. At higher normal stress, however, dynamic friction drops can reach values as high as 0.6 (indicated by hollow squares in Figure 11), and the discrepancy between static and dynamic stress drops increases with increasing normal stress. Moreover, stress drop is governed by the coupled effects of multiple factors, including system stiffness, gouge properties, fluid conditions, scale effects, and slip rate [32,65,66]. Consequently, comparing stick-slip events across existing studies and linking them to seismic observations remains challenging. More refined experimental studies are required to disentangle the coupled roles of these parameters and to better constrain frictional behavior under crustal stress conditions.

4.3. Implications for Natural Faults

In human engineering activities, including enhanced geothermal systems (EGS), hydraulic fracturing for shale gas, geological carbon sequestration (GCS), and deep mining, the reactivation of existing faults or slip along newly formed faults can trigger seismic events [68,69,70]. The experimental results presented in this study demonstrate that fracture morphological heterogeneity plays a critical role in controlling fault strength, rupture style, and energy dissipation under well-controlled laboratory conditions. With due caution, these findings may provide a useful laboratory perspective for understanding certain aspects of induced seismicity and fault-slip rockbursts, though direct extrapolation to natural earthquakes remains challenging given the vastly greater complexity of natural faults.
Rough fractures in our experiments exhibit large stress drops during the initial shear cycle. This observation suggests that, at the laboratory scale and in the absence of gouge, fluids, or significant alteration, initial geometric roughness can promote unstable slip. If one cautiously extends this idea to engineering contexts, fresh, rough fracture surfaces—such as those that may be encountered in newly excavated mine faces—could be associated with a higher potential for energetic slip. However, this interpretation remains preliminary; in natural and mining-induced settings, numerous other factors (e.g., variable stress states, heterogeneous lithology, gouge layers, pore fluids, and thermal pressurization) are likely to dominate the nucleation and severity of fault-slip events. Therefore, our results offer only a partial and idealized insight, rather than a direct explanation for why newly developed mining faces are more prone to severe fault-slip rockbursts. Furthermore, the transition from pronounced strength reduction in the initial shear cycle to more stable strength in subsequent cycles suggests that the dynamic evolution of fracture roughness during slip may influence fault stability, potentially contributing to the evolving seismic potential of faults. These inferences should be further tested under conditions that more closely replicate the complexity of natural fault zones.

4.4. Limitations

We note that RMS roughness captures the overall surface amplitude but does not fully describe the scale- and direction-dependent complexity of the fracture topography; future studies incorporating additional metrics such as fractal dimension or directional roughness would provide a more complete characterization and facilitate comparison with natural fault surfaces. In addition, we note that the present study is based on a limited number of experiments: smooth and rough specimens at each of four confining pressures, with no replicate tests under identical conditions. Consequently, the trends reported should be regarded as characteristic observations rather than statistically robust relationships. Stick-slip event is inherently variable, especially for rough fractures, and event-to-event variations in stress drop and breakdown work were observed within each test. Where appropriate, we discuss this variability, but formal statistical measures (e.g., confidence intervals) are not provided. In future work, we plan to incorporate AE source location, high-speed slip measurements, local strain gauges, or dynamic fracture imaging in replicate experiments to directly test these inferences and assess their generality.

5. Conclusions

In this study, a series of triaxial shear tests were conducted on sawcut smooth fractures and tension-induced rough fractures to investigate the effects of fracture roughness on frictional behavior, roughness evolution, and rupture dynamics. We also compare our results with previous studies. The main conclusions are as follows:
(1)
Rough fractures exhibit higher shear strength and stronger stick-slip behavior than smooth fractures but show notable strength weakening and reduced stress drops with shear cycles. In contrast, smooth fractures display relatively stable strength and stress drops.
(2)
Stick-slip events were observed in all tested fractures, with stress drops positively correlated with normal stress. Compared with smooth fractures, rough fractures exhibited complex slip patterns including large and small slip events. We consider that the damage of asperities on rough fractures alters shear behavior, exhibiting a trend of weakening the intensity of stick-slip events and transitioning to stable sliding.
(3)
These differences in frictional behavior are governed by roughness evolution. Quantitative root mean square (RMS) analysis indicates that although roughness decreases in both fracture types after shearing, the roughness degradation of rough fractures is nearly an order of magnitude greater than that of smooth fractures.
(4)
Analyses of stress drop and energy dissipation reveal that the initial stick-slip event on rough fractures produces substantially larger stress drops and apparent breakdown work than subsequent events. This indicates that undisturbed faults with pronounced initial roughness face a more severe risk of instability upon reactivation.

Author Contributions

Conceptualization, Q.M. and Y.S.; methodology, Q.M. and Y.S.; software, Q.M.; validation, X.Y., H.M. and I.A.; formal analysis, Y.S.; investigation, X.Y.; resources, Y.S.; data curation, Q.M.; writing—original draft preparation, Q.M.; writing—review and editing, Y.S.; visualization, X.Y.; supervision, Y.S.; project administration, Y.S.; funding acquisition, Y.S. and S.Q. All authors have read and agreed to the published version of the manuscript.

Funding

This research was funded by the National Natural Science Foundation of China (Grant No. U25B20213), the Science and Technology Partnership Program of the Shanghai Cooperation Organization and International Science and Technology Cooperation Program, the Xinjiang Department of Science and Technology (Grant No. 2023E01005) and the Third Xinjiang Scientific Expedition Program (Grant No. 2022xjkk1305).

Institutional Review Board Statement

Not applicable.

Informed Consent Statement

Not applicable.

Data Availability Statement

The original data supporting the conclusions of this article will be made available by the authors without undue reservation.

Conflicts of Interest

The authors declare no conflicts of interest.

References

  1. Gratchev, I.; Kim, D.H.; Yeung, C.K. Strength of Rock-like Specimens with Pre-Existing Cracks of Different Length and Width. Rock Mech. Rock Eng. 2016, 49, 4491–4496. [Google Scholar] [CrossRef]
  2. Meng, F.; Zhou, H.; Li, S.; Zhang, C.; Wang, Z.; Kong, L.; Zhang, L. Shear Behaviour and Acoustic Emission Characteristics of Different Joints Under Various Stress Levels. Rock Mech. Rock Eng. 2016, 49, 4919–4928. [Google Scholar] [CrossRef]
  3. Yang, X.; Li, L.; Sun, P.; Wang, S.; Li, F. Laboratory Investigation of the Shear Failure Process and Strength Characteristics of a Rock Mass Containing Discontinuous Joints under Water Pressure Influence. Bull. Eng. Geol. Environ. 2022, 81, 95. [Google Scholar] [CrossRef]
  4. Foulger, G.R.; Wilson, M.; Gluyas, J.; Julian, B.R.; Davies, R. Global Review of Human-Induced Earthquakes. Earth Sci. Rev. 2017, 178, 438–514. [Google Scholar]
  5. Ji, Y.; Wu, W.; Zhao, Z. Unloading-Induced Rock Fracture Activation and Maximum Seismic Moment Prediction. Eng. Geol. 2019, 262, 105352. [Google Scholar] [CrossRef]
  6. Gao, F.; Kang, H.; Li, J. Numerical Simulation of Fault-Slip Rockbursts Using the Distinct Element Method. Tunn. Undergr. Space Technol. 2021, 110, 103805. [Google Scholar] [CrossRef]
  7. Xu, D.; Hu, Q.; Si, H. Measurement and Inversion of the Stress Distribution in a Coal and Rock Mass with a Fault. Int. J. Geomech. 2021, 21, 06021029. [Google Scholar] [CrossRef]
  8. Powers, P.M.; Jordan, T.H. Distribution of Seismicity Across Strike-Slip Faults in California. J. Geophys. Res. Atmos. 2010, 115, B05305. [Google Scholar]
  9. Sagy, A.; Brodsky, E.E.; Axen, G.J. Evolution of Fault-Surface Roughness with Slip. Geology 2007, 35, 283. [Google Scholar] [CrossRef]
  10. Brodsky, E.E.; Gilchrist, J.J.; Sagy, A.; Collettini, C. Faults Smooth Gradually as a Function of Slip. Earth Planet. Sci. Lett. 2011, 302, 185–193. [Google Scholar] [CrossRef]
  11. Candela, T.; Renard, F.; Klinger, Y.; Mair, K.; Schmittbuhl, J.; Brodsky, E.E. Roughness of Fault Surfaces over Nine Decades of Length Scales. J. Geophys. Res. 2012, 117, B08409. [Google Scholar] [CrossRef]
  12. Harbord, C.W.A.; Nielsen, S.B.; Paola, N.D.; Holdsworth, R.E. Earthquake Nucleation on Rough Faults. Geology 2017, 45, 931–934. [Google Scholar] [CrossRef]
  13. Morad, D.; Lyakhovsky, V.; Hatzor, Y.H.; Sagy, A. Stress Heterogeneity and the Onset of Faulting Along Geometrically Irregular Faults. Geophys. Res. Lett. 2022, 49, e2021GL09759. [Google Scholar] [CrossRef]
  14. Barton, N.R.; Choubey, V. The Shear Strength of Rock Joints in Theory and Practice. Rock Mech. 1977, 10, 1–54. [Google Scholar] [CrossRef]
  15. Mcbeck, J.; Mair, K.; Renard, F. Decrypting Healed Fault Zones: How Gouge Production Reduces the Influence of Fault Roughness. Geophys. J. Int. 2021, 225, 759–774. [Google Scholar] [CrossRef]
  16. Morad, D.; Sagy, A.; Tal, Y.; Hatzor, Y.H. Fault Roughness Controls Sliding Instability. Earth Planet. Sci. Lett. 2022, 579, 117365. [Google Scholar] [CrossRef]
  17. Goebel, T.H.W.; Sammis, C.G.; Becker, T.W.; Dresen, G.; Schorlemmer, D. A Comparison of Seismicity Characteristics and Fault Structure Between Stick–Slip Experiments and Nature. Pure Appl. Geophys. 2015, 172, 2247–2264. [Google Scholar]
  18. Mclaskey, G.C. Preslip and Cascade Processes Initiating Laboratory Stick Slip. J. Geophys. Res. Solid Earth 2014, 119, 6323–6336. [Google Scholar] [CrossRef]
  19. Dong, P.; Xia, K.; Xu, Y.; Elsworth, D.; Ampuero, J. Laboratory Earthquakes Decipher Control and Stability of Rupture Speeds. Nat. Commun. 2023, 14, 2427. [Google Scholar] [CrossRef] [PubMed]
  20. Meng, F.; Yuen, W.L.N.; Hui, Z.; Zaiquan, W. Comparative Study on Dynamic Shear Behavior and Failure Mechanism of Two Types of Granite Joint. Eng. Geol. 2018, 245, 356–369. [Google Scholar] [CrossRef]
  21. Bahaaddini, M.; Hagan, P.C.; Mitra, R.; Khosravi, M.H. Experimental and Numerical Study of Asperity Degradation in the Direct Shear Test. Eng. Geol. 2016, 204, 41–52. [Google Scholar] [CrossRef]
  22. Fang, Z.; Dunham, E.M. Additional Shear Resistance from Fault Roughness and Stress Levels on Geometrically Complex Faults. J. Geophys. Res. Solid Earth 2013, 118, 3642–3654. [Google Scholar] [CrossRef]
  23. Reches, Z.; Lockner, D.A. Fault Weakening and Earthquake Instability by Powder Lubrication. Nature 2010, 467, 452–455. [Google Scholar] [CrossRef] [PubMed]
  24. Brune, J.N. Tectonic Stress and the Spectra of Seismic Shear Waves from Earthquakes. J. Geophys. Res. 1970, 75, 4997–5009. [Google Scholar] [CrossRef]
  25. Abercrombie, R.E.; Rice, J.R. Can Observations of Earthquake Scaling Constrain Slip Weakening? Geophys. J. R. Astron. Soc. 2010, 162, 406–424. [Google Scholar]
  26. Cocco, M.; Aretusini, S.; Cornelio, C.; Nielsen, S.B.; Spagnuolo, E.; Tinti, E.; Di Toro, G. Fracture Energy and Breakdown Work During Earthquakes. Annu. Rev. Earth Planet. Sci. 2023, 51, 217–252. [Google Scholar] [CrossRef]
  27. Ortega-Arroyo, D.; O’Ghaffari, H.; Pe, M.; Gong, Z.; Fu, R.R.; Ohl, M.; Cattania, C.; Plümper, O. “Lab-Quakes”: Quantifying the Complete Energy Budget of High-Pressure Laboratory Failure. AGU Adv. 2025, 6, e2025AV001683. [Google Scholar]
  28. Xu, S.; Fukuyama, E.; Yamashita, F.; Kawakata, H.; Mizoguchi, K.; Takizawa, S. Fault Strength and Rupture Process Controlled by Fault Surface Topography. Nat. Geosci. 2023, 16, 94–100. [Google Scholar] [CrossRef]
  29. Wang, L.; Kwiatek, G.; Renard, F.; Guérin-Marthe, S.; Rybacki, E.; Bohnhoff, M.; Naumann, M.; Dresen, G. Fault Roughness Controls Injection-Induced Seismicity. Proc. Natl. Acad. Sci. USA 2024, 121, e2310039121. [Google Scholar] [CrossRef] [PubMed]
  30. Ulusay, R. The Present and Future of Rock Testing: Highlighting the ISRM Suggested Methods. In The ISRM Suggested Methods for Rock Characterization, Testing and Monitoring: 2007–2014; Ulusay, R., Ed.; Springer International Publishing: Cham, Switzerland, 2015; pp. 1–22. [Google Scholar] [CrossRef]
  31. Ji, Y.; Zhuang, L.; Wu, W.; Hofmann, H.; Zang, A.; Zimmermann, G. Cyclic Water Injection Potentially Mitigates Seismic Risks by Promoting Slow and Stable Slip of a Natural Fracture in Granite. Rock Mech. Rock Eng. 2021, 54, 5389–5405. [Google Scholar] [CrossRef]
  32. Dou, Z.; Gao, T.; Zhao, Z.; Li, J.; Shang, D. The Role of Water Lubrication in Critical State Fault Slip. Eng. Geol. 2020, 271, 105606. [Google Scholar] [CrossRef]
  33. Jang, H.S.; Kang, S.S.; Jang, B.A. Determination of Joint Roughness Coefficients Using Roughness Parameters. Rock Mech. Rock Eng. 2014, 47, 2061–2073. [Google Scholar] [CrossRef]
  34. Tatone, B.S.A.; Grasselli, G. Quantitative Measurements of Fracture Aperture and Directional Roughness from Rock Cores. Rock Mech. Rock Eng. 2012, 45, 619–629. [Google Scholar] [CrossRef]
  35. Sibson, R.H. Load-Strengthening versus Load-Weakening Faulting. J. Struct. Geol. 1993, 15, 123–128. [Google Scholar] [CrossRef]
  36. Goebel, T.H.W.; Kwiatek, G.; Becker, T.W.; Brodsky, E.E.; Dresen, G. What Allows Seismic Events to Grow Big? Insights from b-Value and Fault Roughness Analysis in Laboratory Stick-Slip Experiments. Geology 2017, 45, 815–818. [Google Scholar]
  37. Meng, F.; Yue, Z.; Li, M.; Han, J.; Cai, Q.; Wang, W.; Hu, D.; Zhang, C. Frictional Sliding Behaviour of Rough Fracture in Granite Under True Triaxial Loading with Implications for Fault Reactivation. Rock Mech. Rock Eng. 2024, 57, 197–217. [Google Scholar]
  38. Yamashita, F.; Fukuyama, E.; Xu, S.; Mizoguchi, K.; Kawakata, H.; Takizawa, S. Rupture Preparation Process Controlled by Surface Roughness on Meter-Scale Laboratory Fault. Tectonophysics 2018, 733, 193–208. [Google Scholar] [CrossRef]
  39. Bayart, E.; Svetlizky, I.; Fineberg, J. Fracture Mechanics Determine the Lengths of Interface Ruptures That Mediate Frictional Motion. Nat. Phys. 2015, 12, 166–170. [Google Scholar] [CrossRef]
  40. Leeman, J.R.; Saffer, D.M.; Scuderi, M.M.; Marone, C. Laboratory Observations of Slow Earthquakes and the Spectrum of Tectonic Fault Slip Modes. Nat. Commun. 2016, 7, 11104. [Google Scholar] [CrossRef] [PubMed]
  41. Passelègue, F.X.; Schubnel, A.; Nielsen, S.; Bhat, H.S.; Deldicque, D.; Madariaga, R. Dynamic Rupture Processes Inferred from Laboratory Microearthquakes. J. Geophys. Res. Solid Earth 2016, 121, 4343–4365. [Google Scholar] [CrossRef]
  42. Feng, X.-T.; Yang, C.-X.; Kong, R.; Zhao, J.; Zhou, Y.; Yao, Z.; Hu, L. Excavation-Induced Deep Hard Rock Fracturing: Methodology and Applications. J. Rock Mech. Geotech. Eng. 2022, 14, 1–34. [Google Scholar] [CrossRef]
  43. Keneti, A.; Sainsbury, B.A. Review of Published Rockburst Events and Their Contributing Factors. Eng. Geol. 2018, 246, 361–373. [Google Scholar] [CrossRef]
  44. Ohnaka, M. A Constitutive Scaling Law and a Unified Comprehension for Frictional Slip Failure, Shear Fracture of Intact Rock, and Earthquake Rupture. J. Geophys. Res. Atmos. 2003, 108, 2080. [Google Scholar] [CrossRef]
  45. Dresen, G.; Kwiatek, G.; Goebel, T.; Ben-Zion, Y. Seismic and Aseismic Preparatory Processes Before Large Stick–Slip Failure. Pure Appl. Geophys. 2020, 177, 5741–5760. [Google Scholar] [CrossRef]
  46. Morad, D.; Reches, Z.; Sagy, A.; Hatzor, Y.H. Energy Dissipation During Shear Along Experimental Rough Faults. J. Geophys. Res. Solid Earth 2024, 129, e2023JB028605. [Google Scholar] [CrossRef]
  47. Newman, P.J.; Ashley Griffith, W. The Work Budget of Rough Faults. Tectonophysics 2014, 636, 100–110. [Google Scholar] [CrossRef]
  48. Dieterich, J.H. Time-dependent Friction in Rocks. J. Geophys. Res. 1972, 77, 3690–3697. [Google Scholar] [CrossRef]
  49. Wang, K.; Bilek, S.L. Invited Review Paper: Fault Creep Caused by Subduction of Rough Seafloor Relief. Tectonophysics 2014, 610, 1–24. [Google Scholar] [CrossRef]
  50. Wu, W.; Zhao, Z.; Duan, K. Unloading-Induced Instability of a Simulated Granular Fault and Implications for Excavation-Induced Seismicity. Tunn. Undergr. Space Technol. 2017, 63, 154–161. [Google Scholar]
  51. Kwiatek, G.; Martínez-Garzón, P.; Goebel, T.; Bohnhoff, M.; Ben-Zion, Y.; Dresen, G. Intermittent Criticality Multi-Scale Processes Leading to Large Slip Events on Rough Laboratory Faults. J. Geophys. Res. Solid Earth 2024, 129, e2023JB028411. [Google Scholar]
  52. Noël, C.; Giorgetti, C.; Scuderi, M.M.; Collettini, C.; Marone, C. The Effect of Shear Displacement and Wear on Fault Stability: Laboratory Constraints. J. Geophys. Res. Solid Earth 2023, 128, e2022JB026191. [Google Scholar] [CrossRef]
  53. Beeler, N.M.; Tullis, T.E.; Blanpied, M.L.; Weeks, J.D. Frictional Behavior of Large Displacement Experimental Faults. J. Geophys. Res. Solid Earth 1996, 101, 8697–8715. [Google Scholar] [CrossRef]
  54. Wang, F.; Meng, F.; Zhang, J.; Wang, S.; Xiu, Z.; Xu, Z. Cross-Effects of Roughness and Shear Cycle on Frictional Behavior and Damage Characteristics of Faults in Granite. Eng. Geol. 2026, 361, 108493. [Google Scholar] [CrossRef]
  55. Fang, Y.; Elsworth, D.; Ishibashi, T.; Zhang, F. Permeability Evolution and Frictional Stability of Fabricated Fractures with Specified Roughness. J. Geophys. Res. Solid Earth 2018, 123, 9355–9375. [Google Scholar] [CrossRef]
  56. Qi, S.; Zheng, B.; Guo, S.; Luo, G. A New Shear Strength Criterion for Rock Discontinuities Considering Roughness Degradation and Loading Rate Effect. Int. J. Rock Mech. Min. Sci. 2025, 194, 106231. [Google Scholar] [CrossRef]
  57. Aubry, J.; Passelègue, F.X.; Escartín, J.; Gasc, J.; Deldicque, D.; Schubnel, A. Fault Stability Across the Seismogenic Zone. J. Geophys. Res. Solid Earth 2020, 125, e2020JB019670. [Google Scholar] [CrossRef]
  58. Karner, S.L.; Marone, C. Effects of Loading Rate and Normal Stress on Stress Drop and Stick-Slip Recurrence Interval. In Geocomplexity and the Physics of Earthquakes; Washington DC American Geophysical Union Geophysical Monograph Series; American Geophysical Union: Washington, DC, USA, 2000. [Google Scholar]
  59. Lyu, C.; Rivière, J.; Yang, Q.; Marone, C. On the Mechanics of Granular Shear: The Effect of Normal Stress and Layer Thickness on Stick-Slip Properties. Tectonophys. Int. J. Geotecton. Geol. Phys. Inter. Earth 2019, 763, 86–99. [Google Scholar] [CrossRef]
  60. Mclaskey, G.C.; Yamashita, F. Slow and Fast Ruptures on a Laboratory Fault Controlled by Loading Characteristics. J. Geophys. Res. Solid Earth 2017, 122, 3719–3738. [Google Scholar] [CrossRef]
  61. Meng, F.; Song, J.; Wong, L.N.Y.; Wang, Z.; Zhang, C. Characterization of Roughness and Shear Behavior of Thermally Treated Granite Fractures. Eng. Geol. 2021, 293, 106287. [Google Scholar] [CrossRef]
  62. Scuderi, M.M.; Collettini, C.; Viti, C.; Tinti, E.; Marone, C. Evolution of Shear Fabric in Granular Fault Gouge from Stable Sliding to Stick Slip and Implications for Fault Slip Mode. Geology 2017, 45, 731–734. [Google Scholar]
  63. Yamashita, F.; Fukuyama, E.; Xu, S. Foreshock Activity Promoted by Locally Elevated Loading Rate on a 4-m-Long Laboratory Fault. J. Geophys. Res. Solid Earth JGR 2022, 127, e2021JB023336. [Google Scholar]
  64. Beeler, N.; Kilgore, B.; McGarr, A.; Fletcher, J.; Evans, J.; Baker, S.R. Observed Source Parameters for Dynamic Rupture with Non-Uniform Initial Stress and Relatively High Fracture Energy. J. Struct. Geol. 2012, 38, 77–89. [Google Scholar] [CrossRef]
  65. Giorgetti, C.; Violay, M. The Influence of Loading Path on Fault Reactivation: A Laboratory Perspective. Geophys. Res. Lett. 2021, 48, e2020GL091466. [Google Scholar] [CrossRef]
  66. Rast, M.; Madonna, C.; Selvadurai, P.A.; Wenning, Q.C.; Ruh, J.B. Importance of Water-Clay Interactions for Fault Slip in Clay-Rich Rocks. J. Geophys. Res. Solid Earth 2024, 129, e2023JB028235. [Google Scholar] [CrossRef]
  67. Meng, F.; Wong, L.N.Y.; Guo, T. Frictional Behavior and Micro-Damage Characteristics of Rough Granite Fractures. Tectonophysics 2022, 842, 229589. [Google Scholar] [CrossRef]
  68. Rutqvist, J. The Geomechanics of CO2 Storage in Deep Sedimentary Formations. Geotech. Geol. Eng. 2012, 30, 525–551. [Google Scholar] [CrossRef]
  69. Vilarrasa, V.; Carrera, J. Geologic Carbon Storage Is Unlikely to Trigger Large Earthquakes and Reactivate Faults through Which CO2 Could Leak. Proc. Natl. Acad. Sci. USA 2015, 112, 5938–5943. [Google Scholar] [PubMed]
  70. Zoback, M.D.; Gorefick, S.M. Earthquake Triggering and Large-Scale Geologic Storage of Carbon Dioxide. Proc. Natl. Acad. Sci. USA 2012, 109, 10164–10168. [Google Scholar] [CrossRef] [PubMed]
Figure 1. Samples and apparatus configuration. (a) Sawcut smooth fracture samples. (b) Tension-induced rough fracture samples. (c) Schematic illustration of the sample assembly installed in the triaxial cell; (d) Triaxial test cell with the assembled sample.
Applsci 16 06473 g001
Figure 2. Procedure for fracture roughness acquisition. (a) Measurement of fracture morphology using 3D laser scanning. (b) Extraction of the profiles from specific cross-sections.
Applsci 16 06473 g002
Figure 3. Evolution of effective normal stress, shear stress, fracture slip, and friction coefficient during loading-induced stick-slip events on (a) smooth and (b) rough fractures at σ 3 = 15 MPa.
Applsci 16 06473 g003
Figure 4. Mohr–Coulomb failure envelopes for smooth and rough fractures.
Applsci 16 06473 g004
Figure 5. Fracture surface roughness before and after triaxial shear tests ( σ 3 = 15 MPa) for (a) smooth and (b) rough fractures, as well as damage layers derived from asperity elevation changes. And the variation of R M S y for (c) smooth and (d) rough fractures under different confining pressure. Note that the white box in the damage layers indicates the region of intense localized damage.
Applsci 16 06473 g005
Figure 6. Relationship between stress drop and (a) effective normal stress, (b) shear stress, and (c) slip displacement.
Applsci 16 06473 g006
Figure 7. Typical curves of shear stress-displacement for (a) smooth and (b) rough fractures illustrating E τ p r e and W b during the initial stick-slip event.
Applsci 16 06473 g007
Figure 8. Relationships between stress drop and (a) E τ p r e and (b) W b for smooth and rough fractures.
Applsci 16 06473 g008
Figure 9. Normalized energy components during stick-slip events. (a) Relationship between normalized pre-peak energy and W b for smooth and rough fractures. (b) Relationship between normalized W b and R M S y . Note that the linear fit in Figure 9b is applied to the data from smooth fractures and the large slip events on rough fractures.
Applsci 16 06473 g009
Figure 10. Conceptual model of asperity and friction evolution of (a) smooth and (b) rough fractures (modified after Fang et al., [55]).
Applsci 16 06473 g010
Figure 11. Comparison of the dependence of stress drop on normal stress obtained in this study with results from previous laboratory experiments [38,41,58,59,60,61,62,63,64,67]. The black dash lines correspond to the estimated values of friction drops f .
Applsci 16 06473 g011
Table 1. Mechanical properties of the granite samples used in the experiments.
PropertyDensity
(g/cm3)
UCS
(MPa)
Tensile Strength
(MPa)
Young’s Modulus
(GPa)
Poisson’s RatioCohesion
(MPa)
Internal Frictional Angle (°)
Value2.64124.56.8463.50.2629.446
Table 2. Summary of experimental procedures and some results.
Sample NO.Confining Pressure (MPa)Number of Stick-Slip Events R M S y
(mm)
Axial Disp. Rate (m/s)Fluid Pressure (MPa)
( P i n = P o u t )
SF11060.0121 × 10−60.5
SF21550.013
SF32050.017
SF42540.024
RF11060.13
RF21580.15
RF32060.19
RF42560.18
Disclaimer/Publisher’s Note: The statements, opinions and data contained in all publications are solely those of the individual author(s) and contributor(s) and not of MDPI and/or the editor(s). MDPI and/or the editor(s) disclaim responsibility for any injury to people or property resulting from any ideas, methods, instructions or products referred to in the content.