


Abstract
Healthy and sustainable food consumption implies not only making conscious food choices but also limiting food waste. Interventions targeting choices are effective only if the healthier food selected is not wasted on the plate. The aims of the study were: to quantify plate and service waste in hospital canteens, characterize plate waste (PW), and compare PW before and after an intervention aimed at promoting healthy and sustainable food choices. A descriptive study was conducted in three Italian hospital canteens. Trays of users who gave consent were photographed (N = 1624). PW was quantified visually. Energy, nutrients, and environmental indicators were estimated using portion sizes, recipes provided by the canteens, food composition, and environmental databases. Both plate and service waste varied substantially across canteens. Post-intervention PW was 4.7% (C1: 6.1%, C2: 2.0%, C3: 2.6%) of the served food, corresponding on average to 33.1 g/tray, 43.6 kcal/tray, 69.6 g CO2 eq./tray and 61.8 LH2O/tray. Side dishes contributed most to the total PW. The canteen where PW decreased significantly compared to pre-intervention (C2: −48.9 g/tray in median among wasters) was the one with the least improvement in food choices. These findings highlight the importance of considering waste when implementing food choice interventions.
1. Introduction
Achieving healthy diets for both the population and the planet requires not only a shift in our food choices towards diets richer in plant foods and plant proteins, but also significant improvements in all food practices and a substantial reduction in food losses and food waste [1]. Recent data indicate that 19% of global food production is wasted in the later stages of the food chain, and an additional 13% is lost in the early stages of the food supply chain [2]. From a food security perspective, this means wasting energy and nutrients that could have been vital for others. From a sustainability perspective, this results in nearly 30% of the world’s agricultural land being used and 8–10% of global greenhouse gas emissions being generated [2]. Waste produced at different stages of the food supply chain is defined as food loss and food waste. Specifically, food loss includes the amount of food lost before reaching the retail level [2], while food waste is defined as the amount of edible [3]—or edible and inedible [2]—food discarded from retail to consumption. Focusing on food waste, Sustainable Development Goal 12.3 aims to halve it by 2030 [4]. However, only a small number of countries that have consistently tracked food waste for years are demonstrating progress, and with less than ten years remaining until 2030, food waste still reached about 132 kg per person in 2022, representing one-fifth of all food available to consumers [2,5].
Food waste can be further divided into household waste (global average of 79 kg per capita per year), retail waste (global average of 17 kg per capita per year), and food service waste (global average of 36 kg per capita per year). The latter in particular shows incomplete data coverage worldwide due to practical limitations in data collection and the presence of multiple subsectors representing different establishment types (e.g., work, school, hospital and prison canteens, event catering, restaurants, markets, and mobile food vendors) [2]. Food service waste can be further divided into waste produced by catering (kitchen waste and service loss) and waste produced by users on the plate (plate waste, PW). Among the food service sector, hospital food service showed the highest PW, while popular restaurants had the lowest [6]. PW in collective catering may depend on multiple factors (portion and plate size, type of food, palatability, social influences, price, user characteristics, personal awareness, and habits) [7], some of which indirectly depend on well-reasoned food choices. Food choice, food consumption, and food waste can be viewed as interconnected stages of the same behavioral pathway. In food service settings, individuals select foods according to personal preferences as well as contextual and environmental factors. These choices influence actual consumption patterns and, consequently, the quantity and type of food left uneaten. Therefore, monitoring plate waste levels is also a very useful parameter following interventions aimed at steering food consumption towards healthier choices. In fact, an intervention may be considered fully effective only if the healthier food chosen by users is not subsequently wasted on the plate. The ultimate goal of health- and sustainability-focused interventions should not only be to choose meals richer in plant-based products, but also to waste less of the plant-based foods themselves. Unfortunately, previous data have shown that the higher the quality of the diet (according to the Healthy Eating Index-2015), the greater the amount of food wasted [8]. Conversely, in Italian households, higher adherence to the Italian dietary guidelines’ indicator was associated with better food waste behaviors (e.g., planning food purchase and use, no compulsive buying, monitoring stored food, cooking the right quantities, using leftovers) [9].
In the food service context, while several studies have investigated food waste and others have evaluated interventions aimed at promoting healthier and more sustainable food choices, evidence linking these two aspects remains limited. Some authors found no difference in PW after an intervention nudging healthier choices in a worksite canteen [10], while others observed that changing nutritional standards in school catering (e.g., requiring that one of the three components selected is a fruit or vegetable and increasing vegetable portion sizes and variety) also reduced vegetable waste, suggesting that interventions promoting healthy diets may be part of food waste reduction strategies [11]. Therefore, additional evidence assessing both food choices and plate waste is essential to determine whether healthier and more sustainable selections are ultimately consumed rather than discarded, providing a more comprehensive evaluation of the overall success of the intervention.
In this context, the aim of the study was to characterize plate waste in terms of weight, energy, nutrients, environmental indicators, and food categories, following a health- and environment-oriented intervention on users’ food choices, and to compare plate waste data with those observed before the intervention. The secondary aim was to broaden the waste analysis by quantifying food wasted on the counter at the end of the service.
2. Materials and Methods
This is part of a broader project aimed at developing measures to improve nutritional and environmental awareness among hospital employees. The project is a collaboration between the Department of Medicine at the University of Udine (Italy), stakeholders responsible for food services, hospital management of the Friuli Centrale Healthcare University Trust in the province of Udine (Italy), and the local network of Health Promoting Hospitals and Health Services (HPH&HS). Results from the initial assessment of food choices and plate waste have already been reported in previous papers [12,13]. The present paper refers to a second assessment in the same hospital canteens, conducted after an intervention designed to increase healthier food choices for both people and the environment. The setting, data collection, and analysis were consistent with those of the first assessment [12].
This second assessment was conducted in three hospital canteens in the province of Udine: Udine (canteen 1, C1), Palmanova (canteen 2, C2), and San Daniele del Friuli (canteen 3, C3). These canteens are managed differently (C1 and C2 are managed by an external catering service; C3 is managed internally) and have different numbers of users per day (C1: 450–480 users/day; C2: 100–120 users/day; C3: 90 users/day). The target population included all hospital employees who had lunch at the canteens during the observed weeks (Monday to Friday) in September 2023, which was the same period as the first assessment (August–September 2022), to avoid biases related to food seasonality in data comparison. In these canteens, the meal has a fixed price, regardless of the composition of the tray, and can include: a first course (i.e., a cereal-based dish such as pasta, rice, or a vegetable soup), a second course (i.e., the main protein source, such as meat, fish, eggs, cheese, or legume-based preparations), a salad or side dish (i.e., cooked vegetables, legumes, or potatoes), grated cheese (considered separately when not part of the standard recipes but added at the users’ discretion), bread or bread substitutes, and a dessert or fruit.
As in the pre-intervention assessment, lunch trays, each marked with a unique code, were photographed by researchers before and after the meal. During lunch, participants were asked to sign written informed consent and complete a questionnaire, both marked with the same code. Information on sex, age, and type of work (shift work/non-shift work) was also collected in the questionnaire.
Trays associated with questionnaires that were returned empty were excluded from the analysis. All data were analyzed in aggregate form so that the identity of individual participants could not be traced. The study was approved by the Institutional Review Board of the University of Udine, Italy. All subjects gave their informed consent to participate, and all study procedures complied with the ethical standards of the Declaration of Helsinki.
2.1. Food Choice Intervention
The intervention was implemented during the two months preceding the week of analysis and consisted of multiple elements, combined differently according to structural possibilities and canteen management [14]. No control group was included because the intervention was implemented at the organizational level across all participating hospital cafeterias as part of a broader institutional health promotion initiative. Educational material was displayed in the common spaces of the hospital canteen; thus, all users were inevitably exposed to the intervention. Briefly, the intervention included: (1) an educational component with posters on the healthy eating plate [15], Mediterranean diet food pyramid [16], ultra-processed foods, and the daily recommended tray composition, selected by dietitians from the local Department of Prevention based on the rotational menu in C1 and C2 (the menu was available in advance only in the externally managed canteens); (2) a nudging component with posters on descriptive social norms [17] adapted to the present context and displayed next to the corresponding foods targeted for nudging (fruit, vegetables, and in C1, water); and (3) a nudging component based on environmental restructuring of the canteen, in C1, introducing self-service for fruit, salad, and legumes, and in C2, reversing the flow of dish selection so that the service began with salad and side dishes instead of first and second courses.
The food offering was not affected by the intervention at this stage of the project. However, although the period of the year and canteen management were unchanged in this second assessment compared to the first, the dishes offered were not the same as in the first assessment, due to menu variability.
2.2. Plate Waste
Identification and quantification of the foods on the trays were carried out through a blind analysis of photographs by trained researchers, supported by information on the daily menu, recipes, and standard portion sizes provided by the catering company.
Plate waste (PW), defined as the amount of food served but not eaten, was quantified using a modified Comstock scale considering quarters (0%, 25%, 50%, 75%, 100%) of the standard portion (100%) [12,18] and expressed as the percentage of food discarded relative to food served, as well as the weight in grams of discarded food estimated based on the standard portion size. Inedible food (e.g., bones) was excluded from this analysis. To characterize PW from a nutritional perspective, the energy and macronutrient composition (proteins, lipids, carbohydrates, sugars, fiber, and fatty acids) of the PW were estimated by matching each ingredient of the recipes with foods from the Italian Food Composition Database for Epidemiological Studies (BDA) [19,20]. To obtain environmental indicators (i.e., carbon footprint—CF; water footprint—WF, selected based on data availability in the literature) of PW, ingredients were also matched to those in the SU-EATABLE LIFE dataset [21], a comprehensive and harmonized database of CF and WF of foods. As in the pre-intervention analysis [12], these data, together with the estimated amount in grams of each wasted dish, allowed calculation of the energy, nutrient composition, CF, and WF of total PW, in accordance with the standard methodology for calculating the food composition of a complex recipe based on its ingredients [22].
Food waste remaining on the counter was directly weighed using a scale at the end of service each day of analysis. Only foods that were to be effectively discarded were counted.
2.3. Statistical Analysis
A descriptive analysis was conducted on the variables collected through the questionnaire (sex, age, professional profile, and shift/no-shift work). Age was treated as a categorical variable, grouped as follows: I, ≤34 years; II, 35–54 years; and III, ≥55 years. The prevalence of trays containing PW was calculated (N, %) and PW was characterized using descriptive statistics for its weight, energy, and nutrient content (proteins and lipids—total, animal and vegetal—available and soluble carbohydrates, fiber, saturated, monounsaturated, and polyunsaturated fatty acids), environmental indicators (CF and WF), and food course category (first course, second course, side dish, bread and substitutes, fruit, salad, dessert, hard grating cheese, and, in C1 only: sugary drinks). Data on the categories of wasted food were reported both as a percentage of the total amount of PW and as a percentage of the served amount of each category. Descriptive analyses were performed for the total sample and for the subsample of trays containing waste, in each canteen and overall.
Data were presented as N (%) or as medians and 1st–3rd quartiles as the distribution of the variables deviated from normality (Shapiro–Wilk test) and exhibited a right-skewed pattern. However, means (and standard deviation) or differences between means were reported when the total sample (fully and not fully consumed trays) was considered, because the median was zero for most variables.
Differences in the distribution of continuous variables (PW weight, energy, nutrients, and environmental indicators) between the three canteens were tested using the Kruskal–Wallis test. The Dunn test with Bonferroni correction was then performed as a post hoc analysis. In addition, to test differences between T0 and T1, the same PW variables were compared using the Wilcoxon rank sum test. Changes in the prevalence of trays containing plate waste before and after the intervention were analyzed using the Chi-square test. Odds ratios with 95% confidence intervals were calculated to quantify the effect size. To further investigate factors associated with plate waste generation, a multivariable logistic regression analysis was performed using the presence or absence of PW as the dependent variable. Independent variables included sex, age, type of work, canteen, study period (T0, T1), energy content of the meal, and type of tray (beef, meat without beef, fish, vegetarian, vegan). Odds ratios (ORs) and 95% confidence intervals (95% CI) were calculated.
Additional analyses were performed, including only the first access to the canteen by each user (each participant was considered only once). The aim was to examine PW based on sex (male, female) and age group. Differences in PW prevalence were assessed using the Chi-square test, PW variables were compared between females and males using the Wilcoxon rank sum test, and across age groups using the Kruskal–Wallis test followed by Dunn’s post hoc test with Bonferroni correction.
Data were analyzed using Stata/MP version 13.0 (64-bit; StataCorp LP, College Station, TX, USA). Data visualization was performed using Microsoft Excel (Microsoft Corp., Redmond, WA, USA). p-values < 0.05 were considered statistically significant.
3. Results
A total of 1624 lunch meals were analyzed: 1005 in C1, 348 in C2, and 271 in C3. Based on the mean number of daily users provided by the canteen staff [13], response rates were 45% in the largest canteen (C1), 61% in C2, and 64% in C3. Due to the submission of a blank questionnaire, 30 trays were excluded from the analysis in C1, and 17 in C3. A complete description of the sample is available in a previous paper [14].
Table 1 presents the characteristics of each canteen sample, both overall and divided into fully consumed trays and trays with leftovers (not fully consumed trays). Trays belonging to females accounted for 52% in C1, 58% in C2, and 63% in C3. The mean age was 42 ± 12 years in C1, 46 ± 11 years in C2, and 48 ± 10 years in C3, with most of the sample in group II (35–54 years) in C2 and C3. Participants in C1 were younger than those in C2 and C3. In C3, there were more females, shift workers, and younger users in the group who fully consumed their meal compared to the other group. In the other canteens, the fully and not fully consumed trays groups were more evenly distributed.
Table 1.
Characteristics of the sample grouped by canteen and fully/not fully consumed trays.
3.1. Plate Waste Quantification and Its Nutritional and Environmental Characteristics
Globally, 4.7% of the food served in the three canteens was wasted (6.1% in C1, 2.0% in C2, and 2.6% in C3). However, more than half of the trays in each canteen had no PW (66.1%), so the median value of each PW variable was zero. Specifically, the percentage of fully consumed trays was 59.4% in C1, 78.7% in C2, and 75.3% in C3. In total, over five days, users who gave consent wasted the following amounts of edible food: 44.5 kg in C1, 4.2 kg in C2, and 4.9 kg in C3 (Table S1). Overall, the per capita (mean) PW was 33.1 g/tray and 43.6 kcal/tray, contributing to a per capita waste of 69.6 g CO2 eq. and 61.8 L H2O (Table 2). The highest values for all waste variables were observed in C1, the largest canteen (by user rate) managed by an external catering company: PW exceeded the overall mean values by 11.2 g/tray, 15.1 kcal/tray, 23.8 gCO2 eq./tray, and 21.9 LH2O/tray.
Table 2.
Plate waste characteristics (weight, energy, carbon footprint, and water footprint) in the whole sample, considering each canteen individually and all canteens together (N = 1624).
Considering the not fully consumed tray groups separately, it is possible to characterize the nutritional composition and environmental indicators of PW in each canteen and overall (Table 3). Median PW composition in the three canteens ranged between 2.1 and 4.7 g of protein, 2.3–3.6 g of lipids, 6.0–16.3 g of total carbohydrates, and 0.7–1.3 g of fiber per tray containing waste. PW in C2 was lighter than in C1 and contained less energy, protein, saturated and polyunsaturated fatty acids than in the other two canteens (p < 0.0001). It also corresponded to a lower carbon footprint. Conversely, PW in C1 was the highest. In total, over five days in the three canteens, considering only users who agreed to participate, 70,854 kcal, 3.4 kg of protein (58% of animal origin), 0.9 kg of fiber, and 0.4 kg of polyunsaturated fatty acids (PUFA) were wasted, along with 100,329 L of water, and 113 kg of CO2 eq emitted.
Table 3.
Nutritional composition and environmental indicators of plate waste in each canteen and across all canteens (C1 + C2 + C3). Only trays containing waste were considered (N = 551).
Stratifying by sex and considering only the first canteen access (N = 791, of whom 444 were female and 347 male), more females (65.5%) than males (63.4%) produced PW. However, this difference was not significant (p = 0.532). Stratifying by age group (N = 232 group I, N = 396 group II, and N = 163 group III), there was an almost significant difference in PW distribution (p = 0.064): 40.5% of the youngest group (≤34 years), 31.6% of the middle group, and 37.4% of the oldest group (≥55 years) produced PW. This difference became significant when analyzing the quantity of PW produced (p = 0.0333), and the Dunn test confirmed this difference, but only between group I and group II.
Multivariable logistic regression analysis identified canteen site (C1, C2, C3) and meal energy content as the main independent predictors of PW occurrence. Compared with C1, the probability of generating plate waste was significantly lower in C2 (OR = 0.46, 95% CI: 0.36–0.57, p < 0.001) and C3 (OR = 0.53, 95% CI: 0.41–0.68, p < 0.001). Higher meal energy content (scaled per 100 kcal increase) was associated with a greater likelihood of plate waste (p < 0.001), whereas sex, age, work schedule, tray type, and time (T0, T1) were not significantly associated with PW occurrence. The proposed model is well-calibrated (low Briar score) but has low discriminatory power (AUC close to 50%).
3.2. Wasted Food Categories
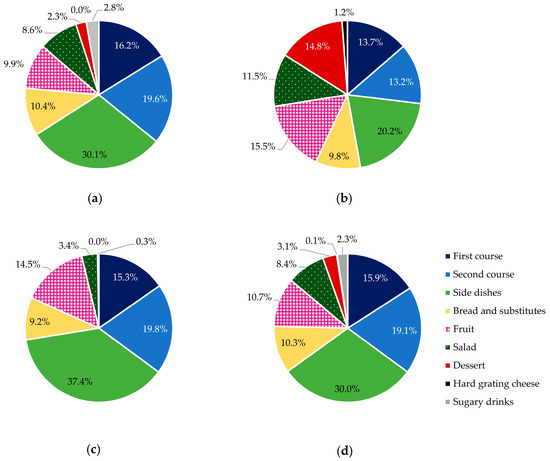
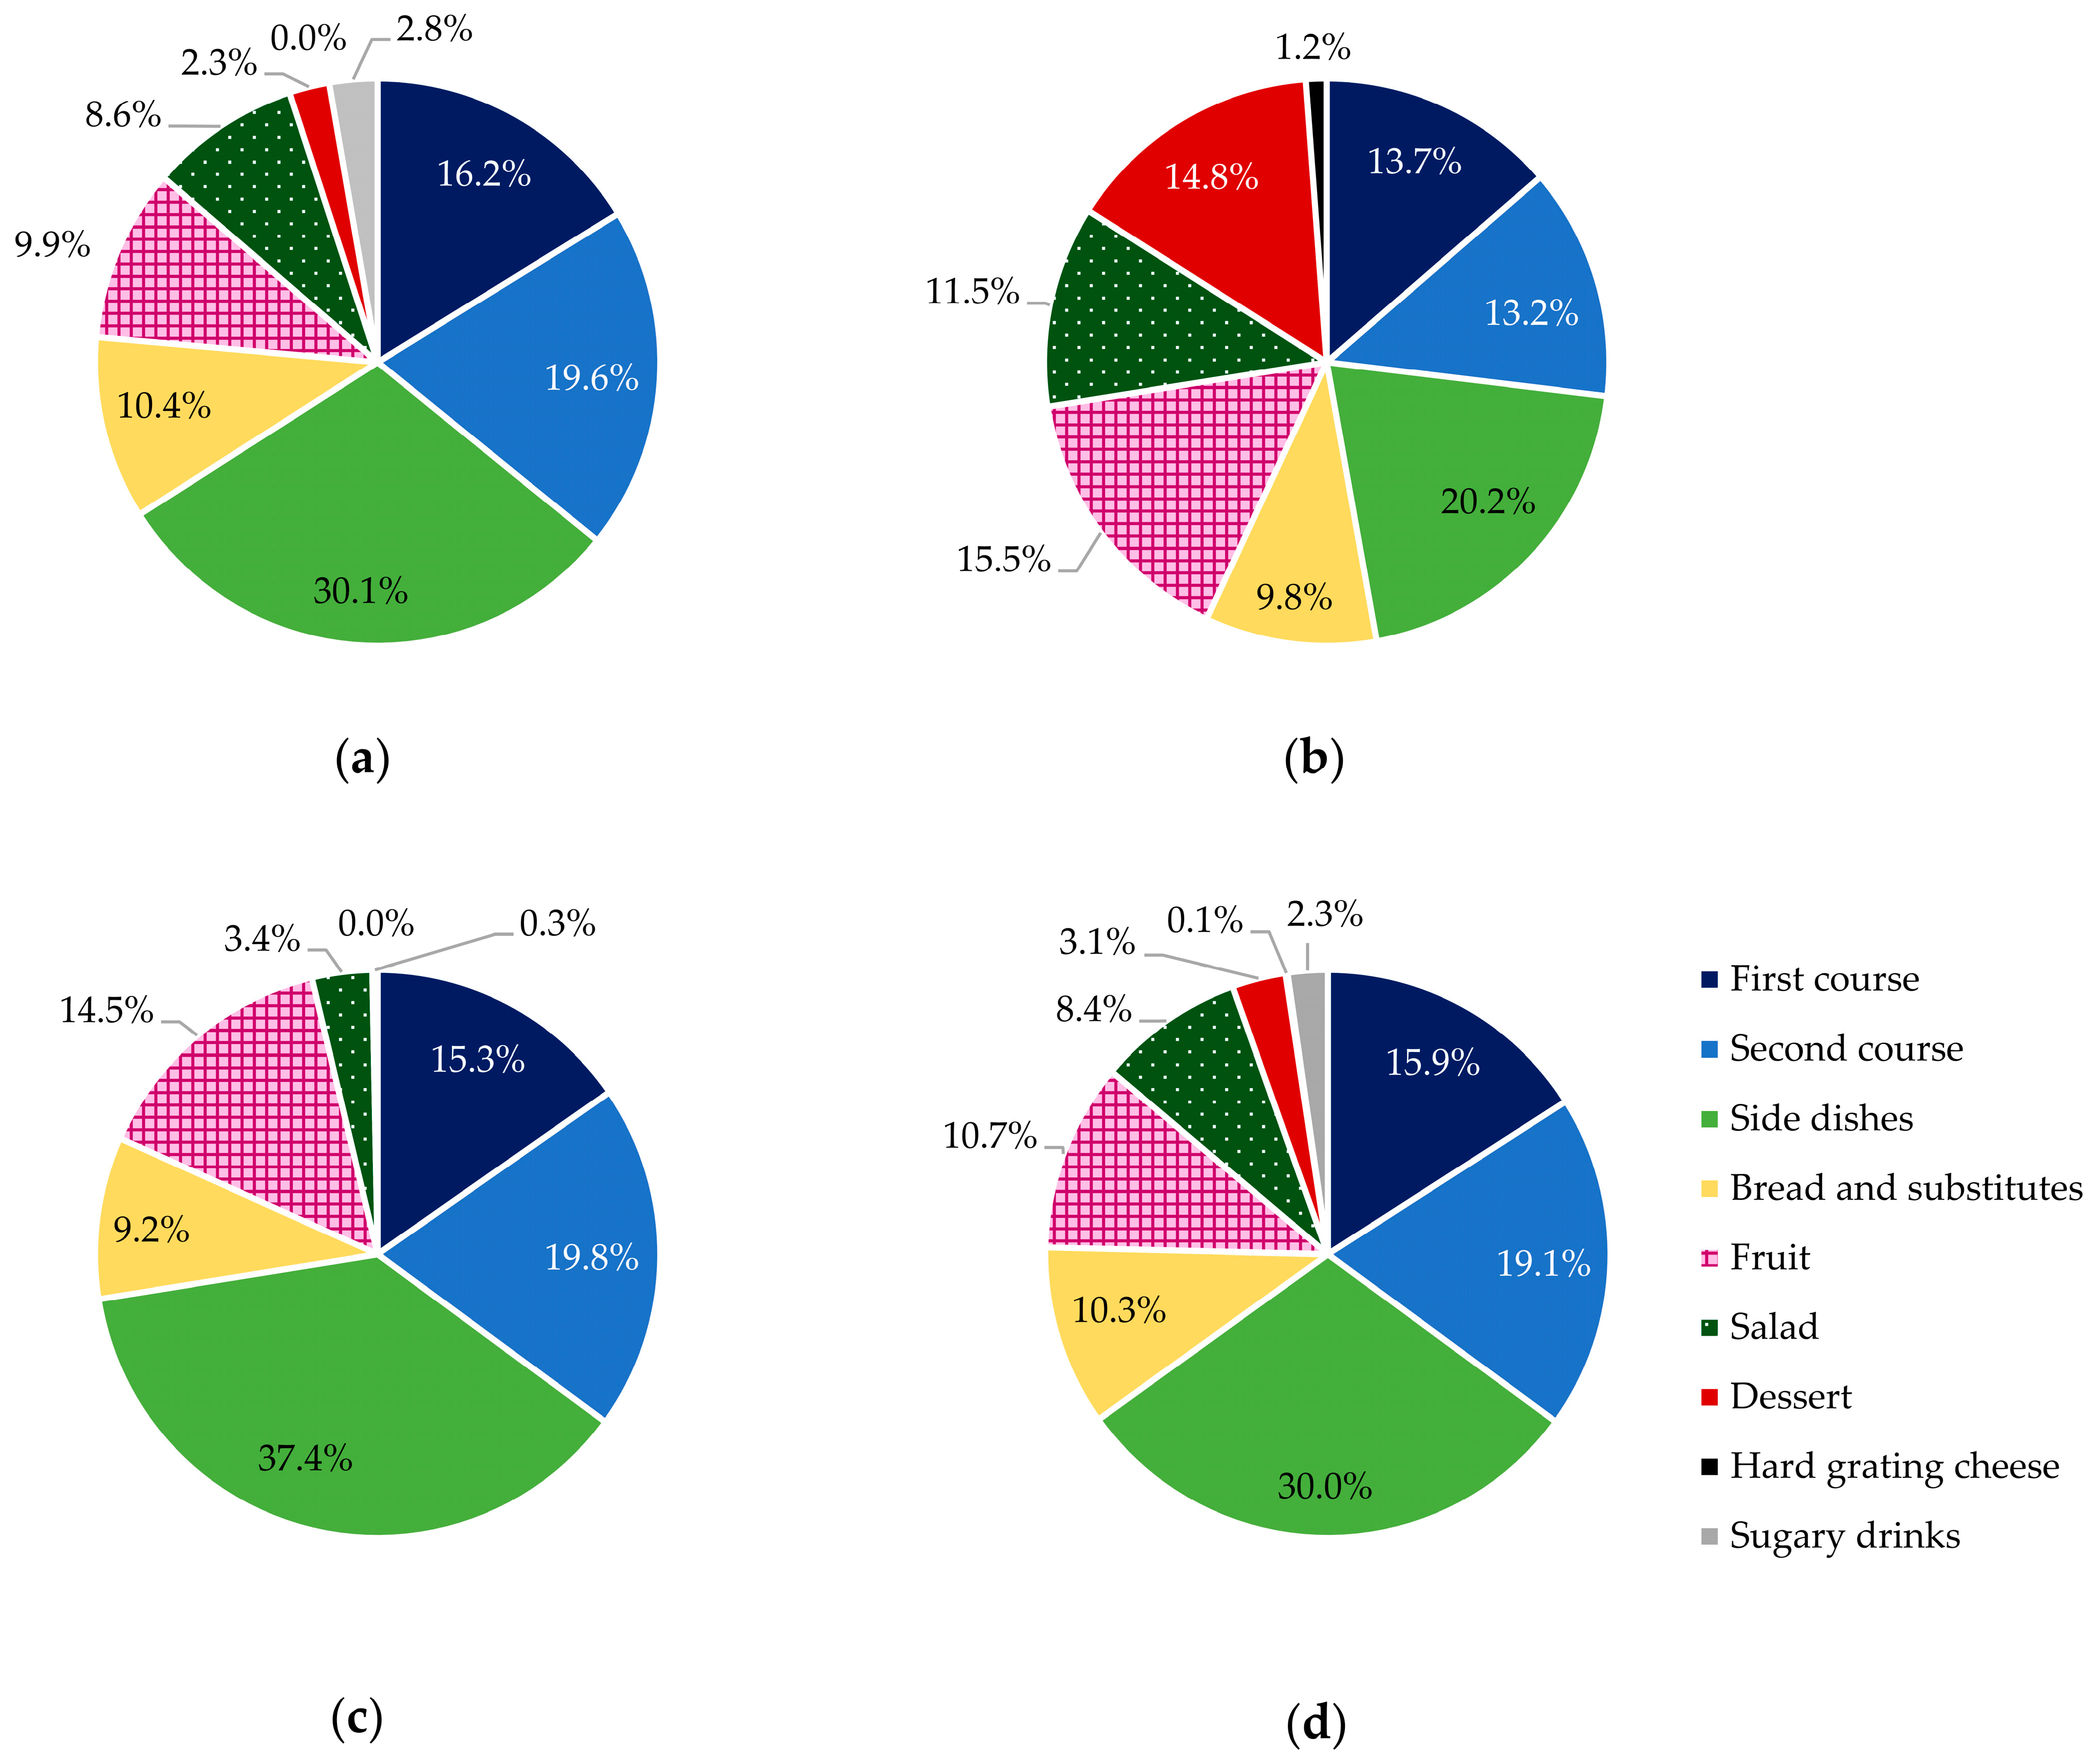
Considering the total amount of PW produced, side dishes were the main wasted food category (Supplementary Table S1), accounting for 30% of total PW (Figure 1). Figure 1 also shows that in both C1 and C3, the second largest contributor to total PW was second courses, while in C2 it was fruit (16%). When examining the percentage PW calculated based on the served food of each course category (Supplementary Table S1), about 6% of side dishes, 5.1% of salad, 4.8% of second courses, and 3.8% of fruit selected by users were wasted, while bread and substitutes were the most wasted in terms of served amount (13.4%).
Figure 1.
Percentage contribution to the total amount of plate waste by food course category in (a) C1, (b) C2, (c) C3, and (d) overall.
3.3. Quantification of Food Waste on the Counter
The quantity of food waste present at the end of the day in the service counter containers and therefore wasted without being served (unlike plate waste) was also considered. The food excluded from this analysis included: reused vegetables, fruit, yogurt/puddings, bread, and bread substitutes. In C1, a total of 66.8 kg of prepared food was thrown away during one week of analysis; in C2 84.1 kg, and in C3 8.3 kg. On average, the daily counter waste was 13.4 ± 6.7 kg in C1, 16.8 ± 5.7 kg in C2, and 1.7 ± 0.7 kg in C3. Table 4 provides the quantification of service waste, divided by food course category. In each canteen, the food category with by far the highest level of waste at the serving counter was first courses (e.g., soup, pasta, rice, and sauces for dressing them), followed by side dishes including cooked vegetables, potatoes, and pulses; salad (i.e., raw vegetables); and, finally, second courses (e.g., meat, fish, eggs, vegan burgers).
Table 4.
Service waste produced over five days, grouped by food course category, considering each canteen individually and all canteens together.
3.4. Comparison with Pre-Intervention Data
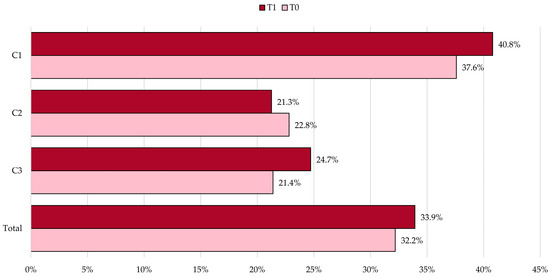
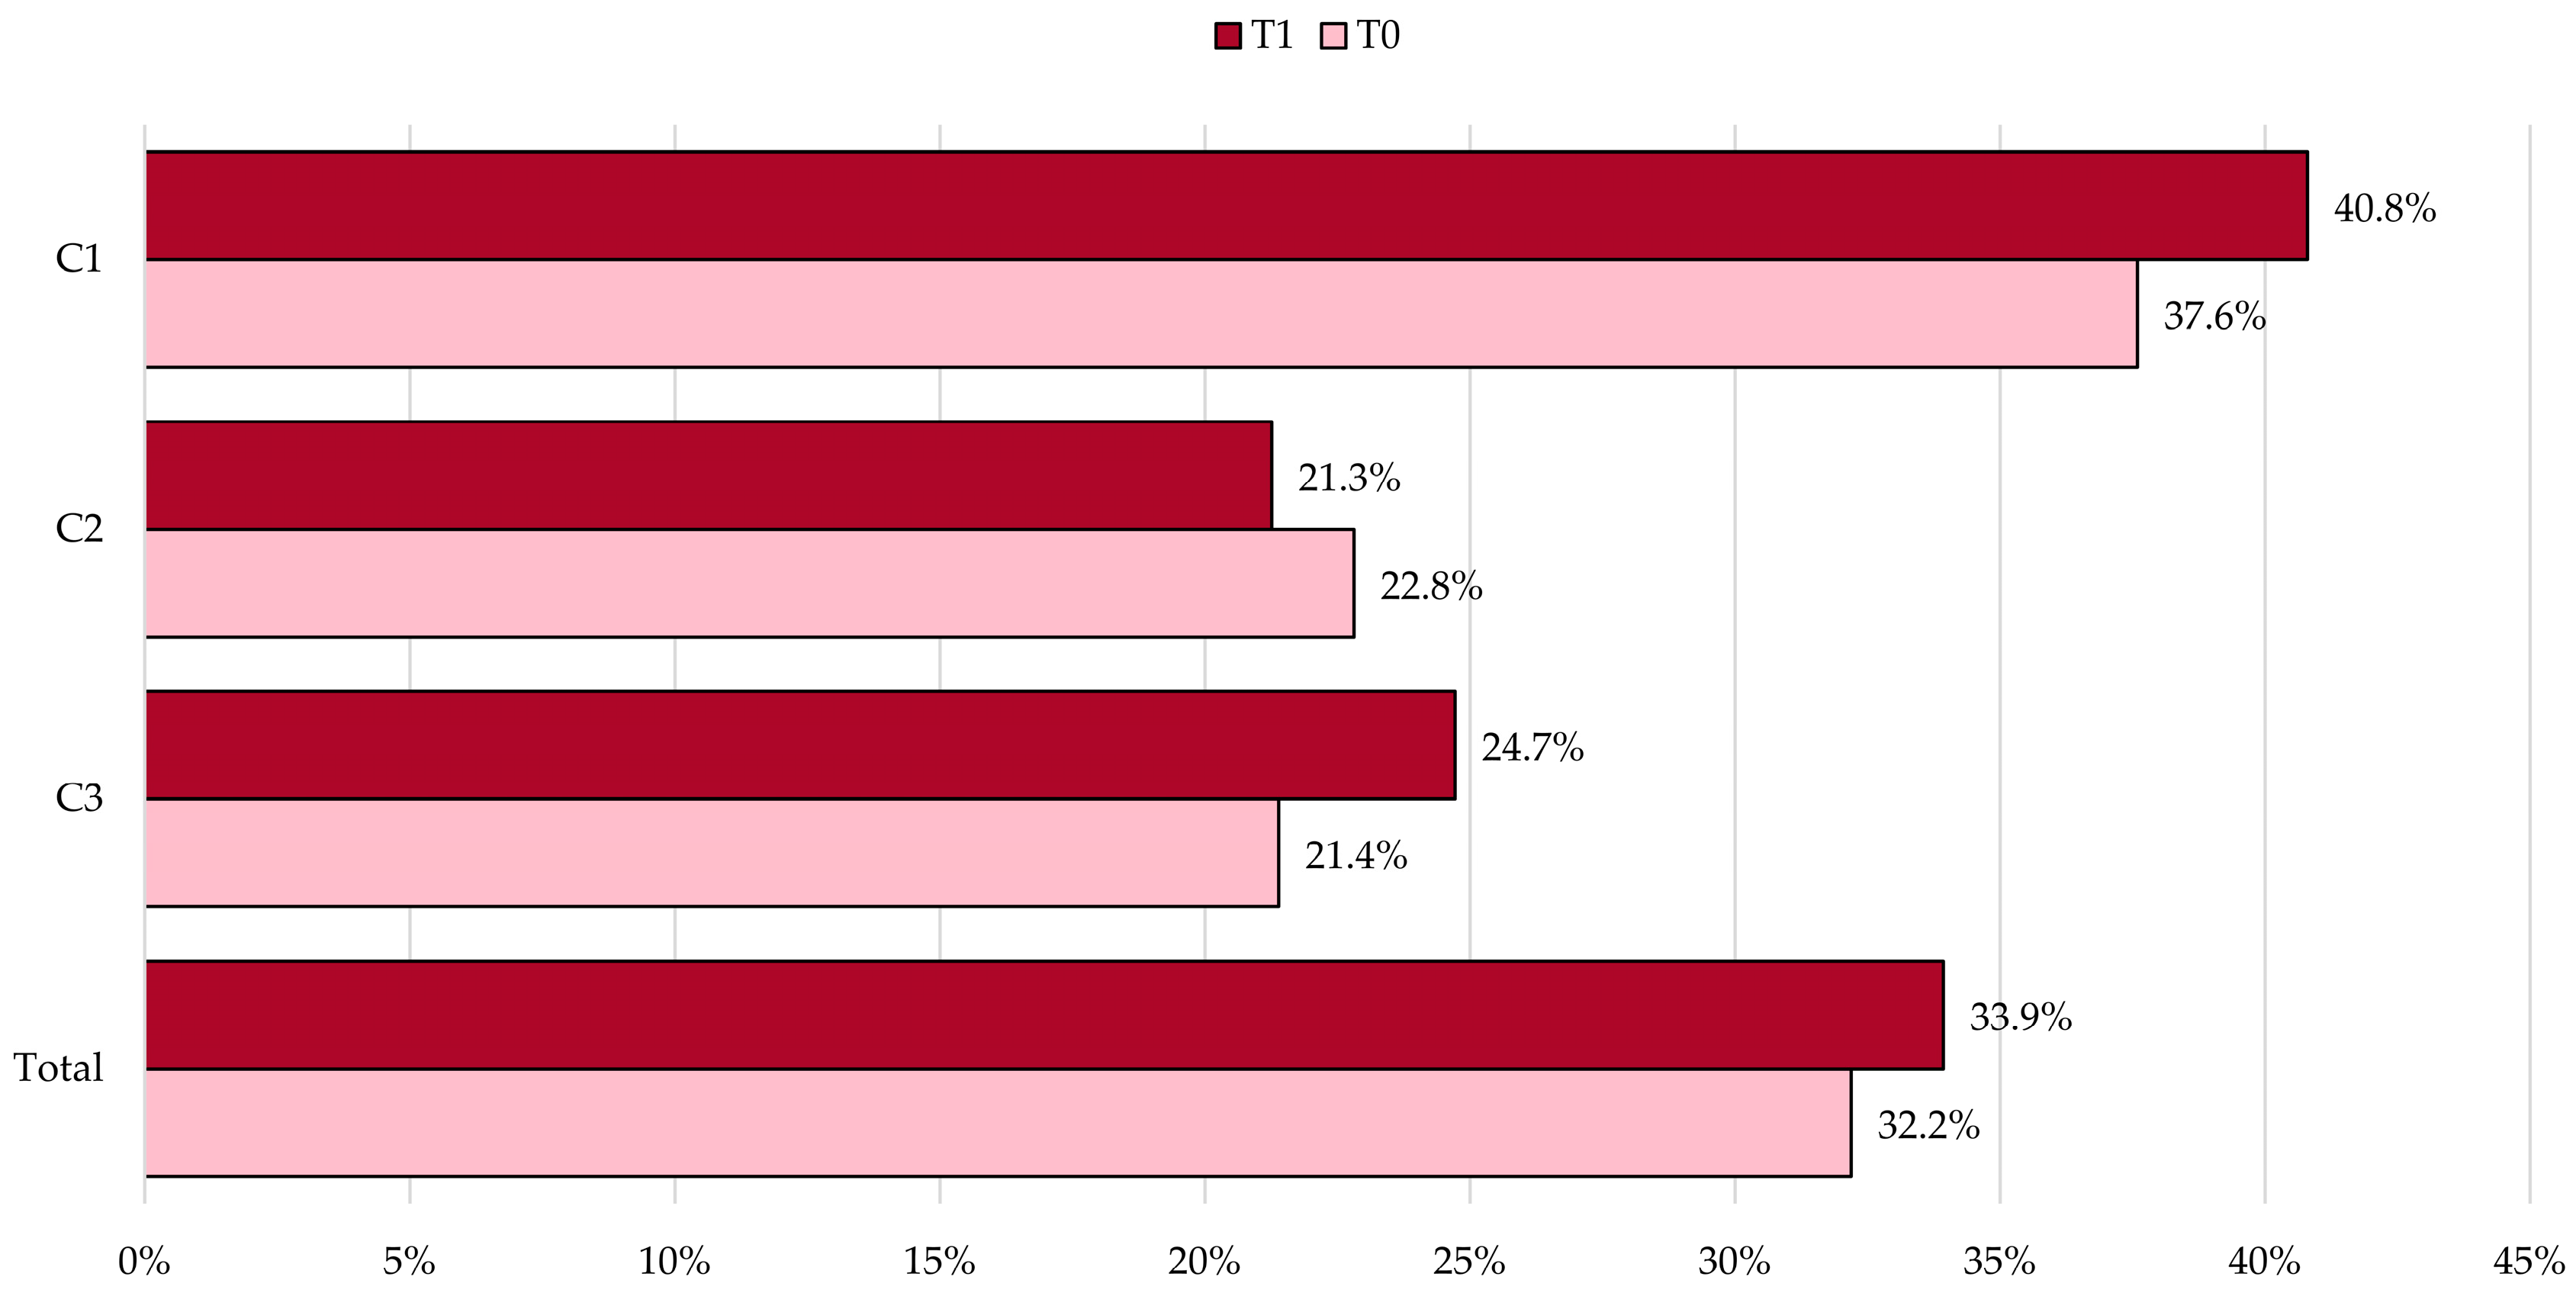
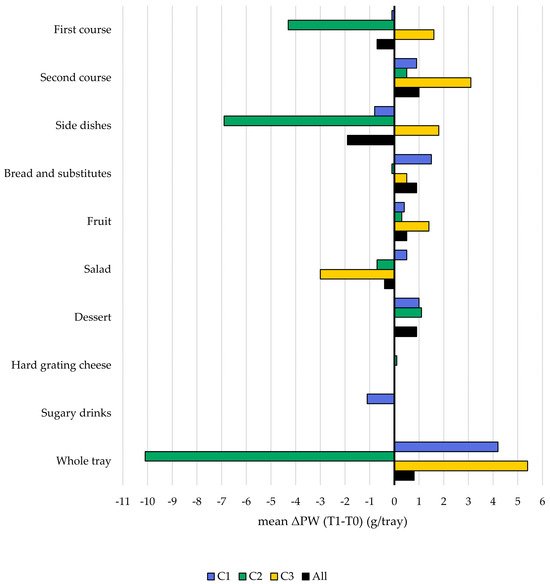
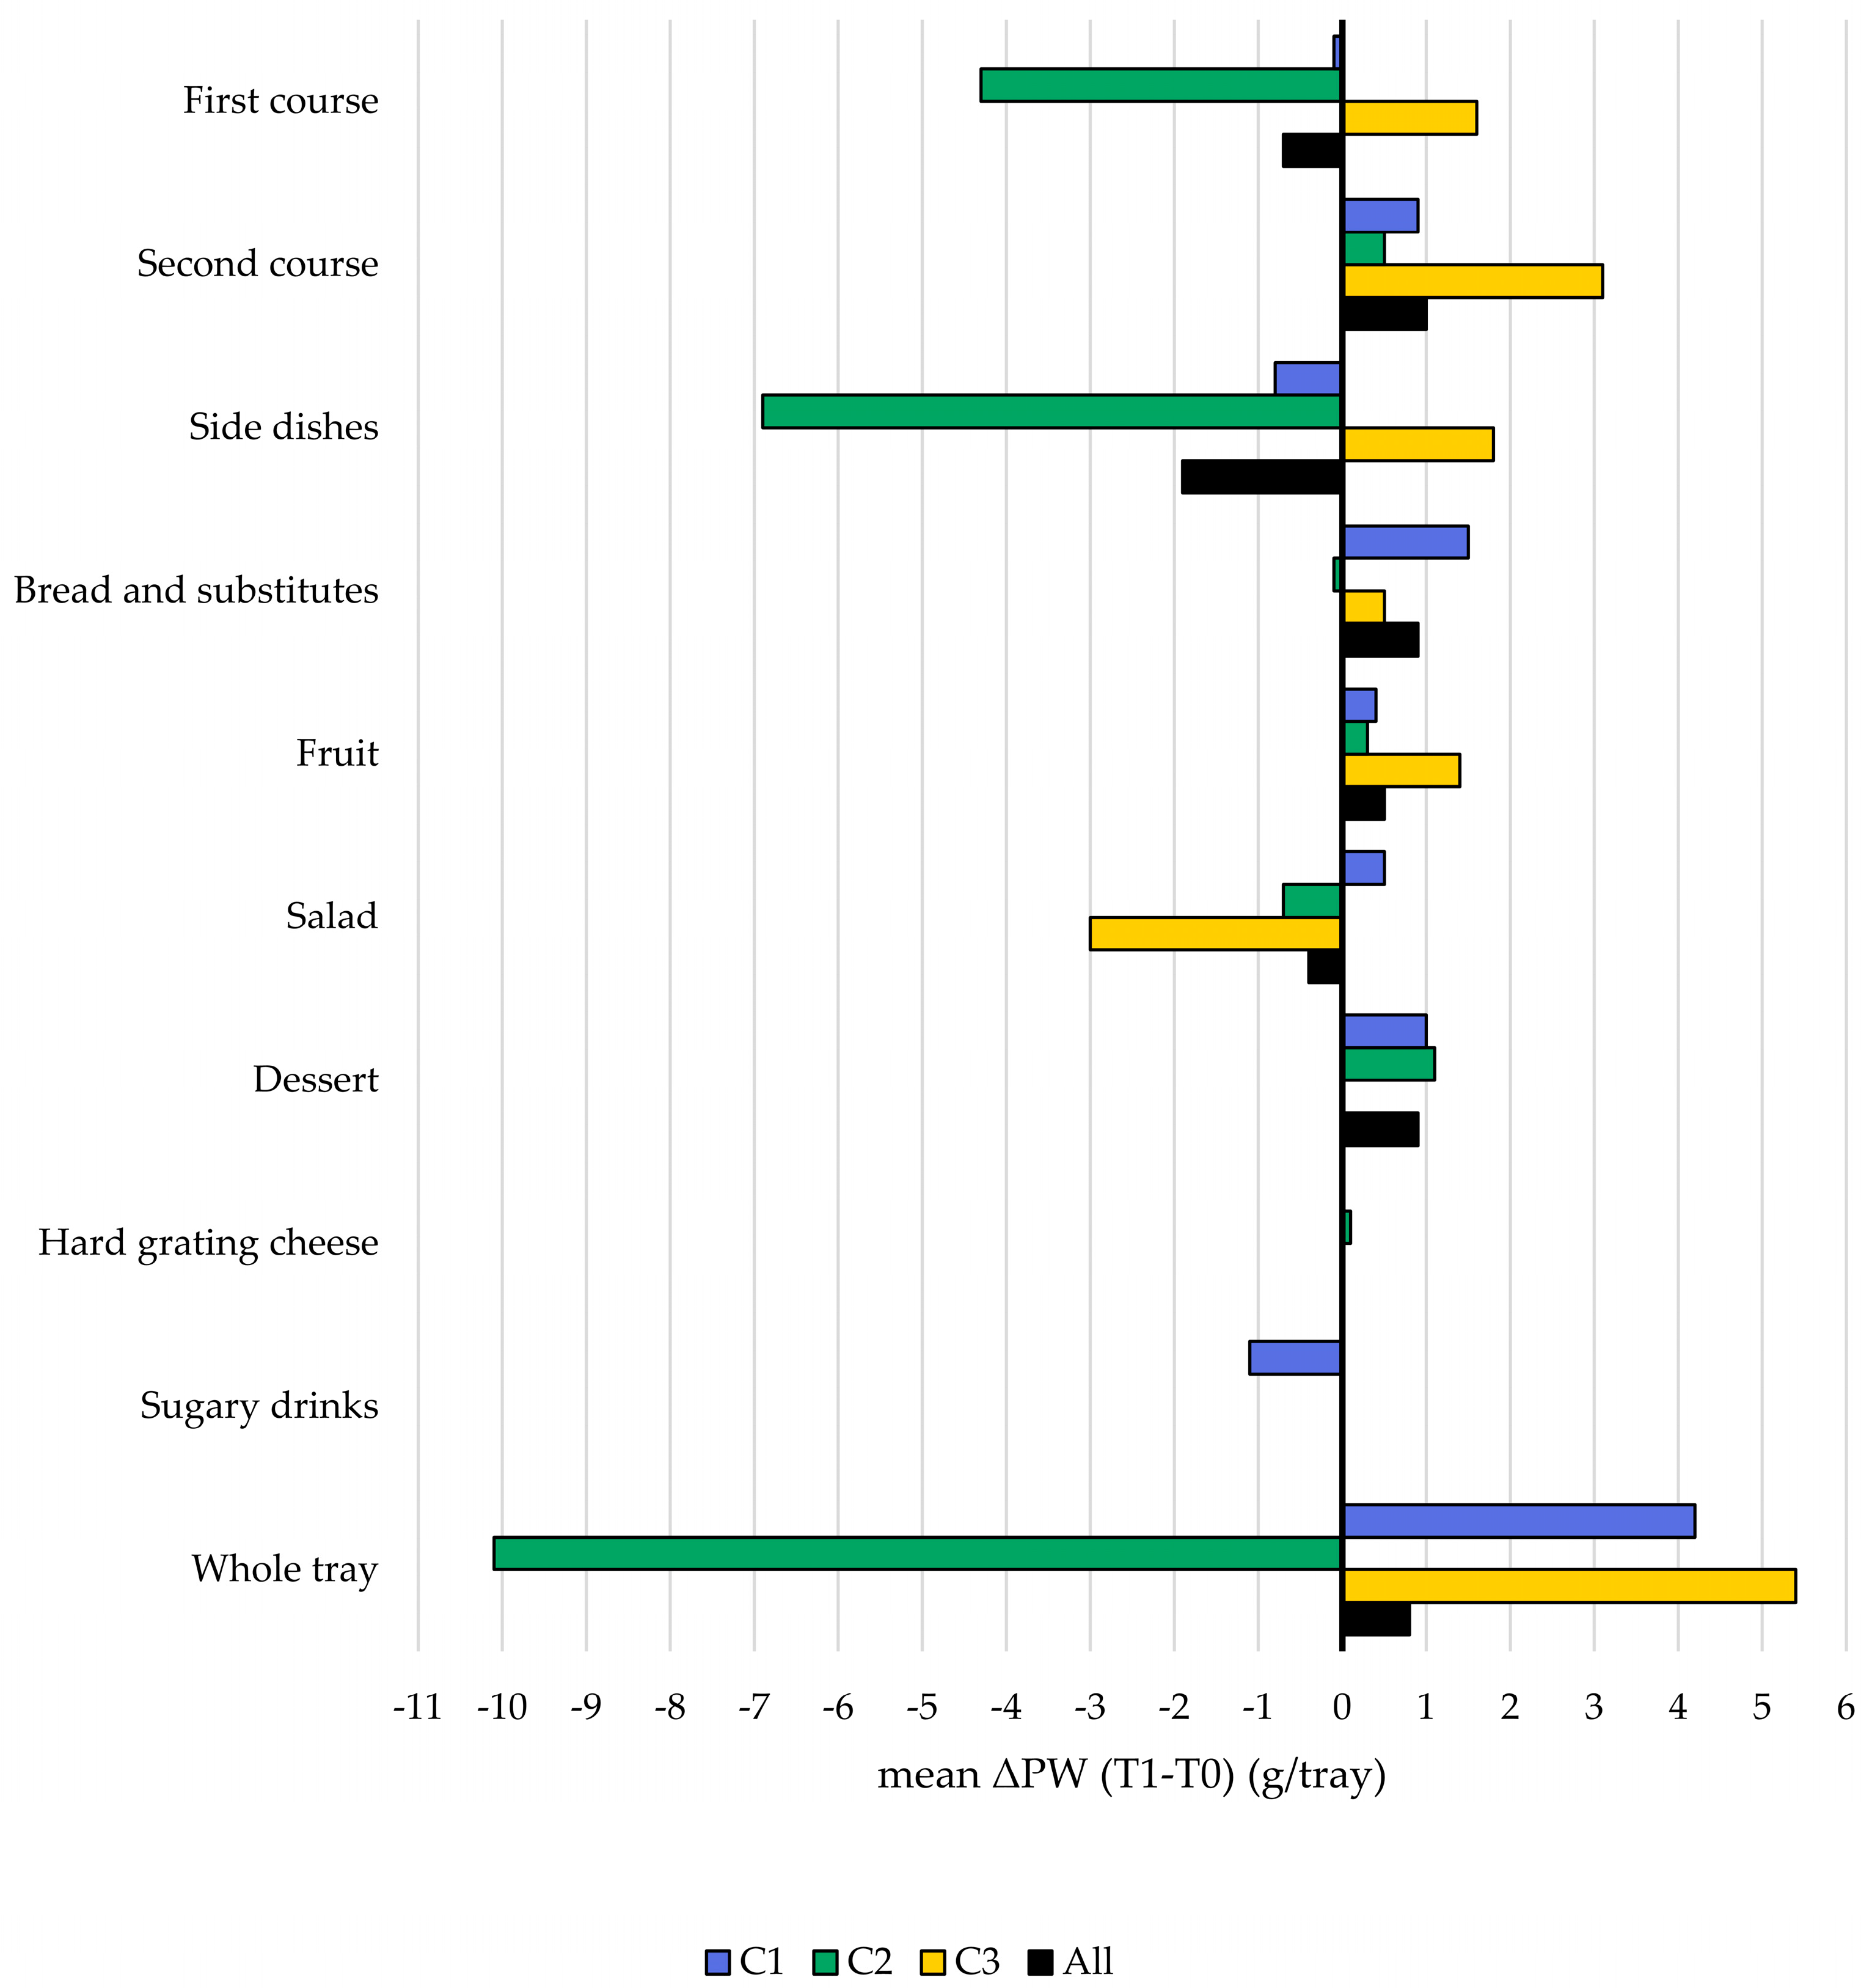
Figure 2 shows the prevalence of trays containing PW at T0 and T1. Although in C2 the prevalence slightly decreased from 22.8% to 21.3%, overall, the prevalence of trays containing PW increased after the intervention, from 32.2% to 33.9%. However, this difference was not statistically significant (p = 0.330; OR = 1.08; 95% CI: 0.92–1.27), even when the three canteens were analyzed separately. Regarding PW weight, we observed an increased mean and median value among wasters (Table 5) in C1 and C3, and a decreased mean and a significantly decreased median value among wasters (Table 5) in C2, with a clear decrease in first course and side dish waste in C2, and an increase in second course waste in C3 (Figure 3). Furthermore, for side dish waste in C2, there was a significant decrease (p= 0.006) in the number of trays containing it at T1 (3.7%) compared to T0 (9.2%).
Figure 2.
Prevalence of trays containing plate waste in the three canteens and in total, before (T0) [12] and after (T1) the food choice intervention.
Table 5.
Comparison of the nutritional composition and environmental indicators of plate waste before (T0) [12] and after the intervention (T1). Only trays containing waste were considered.
Figure 3.
Differences in the mean weight of plate waste before (T0) [12] and after (T1) the food choice intervention in the three canteens and in total, for the whole tray and by food course category.
Consistent with the weight data, there was a general decrease in nutrient waste and its environmental indicators in C2 (Table 5). Although the difference in weight was not significant in the other two canteens, the energy density of PW increased. Moreover, in C3, both waste of animal proteins and animal lipids increased, along with environmental data.
4. Discussion
The present study examines the quantity and characteristics of plate waste following an intervention aimed at improving food choices among hospital canteen users. Accordingly, the results focus on: (1) expanding data on PW among hospital canteen users, (2) providing new data on service waste, and (3) comparing data from before and after the intervention. Data on changes in food choices after the intervention were reported elsewhere [14]. At T1 (post-intervention), the largest canteen, which had more daily users and was managed externally by a catering company, produced more PW than the other two canteens. Overall, as at T0 [12], PW remained consistent with the literature for similar settings. PW decreased in one canteen after the intervention and slightly increased in the other two. Notably, the intervention on food choices led to fewer positive changes in the canteen where the amount and prevalence of plate waste decreased. Conversely, this canteen had the highest counter food waste.
4.1. Food Waste Quantification
Results showed that more than half of the trays in each canteen had no PW. Moreover, when the amount of wasted food was analyzed, 4.7% of the food served was found to be wasted on the plate, similar to the pre-intervention assessment [12]. Despite the considerable heterogeneity in adult food service establishments in terms of cultural context, service model, menu planning, portioning practices, and pricing systems, which makes comparison challenging, the amount of PW observed in this study was similar to that observed in a hospital cafeteria where meals were sold directly to users and/or workers before a specific intervention to reduce food waste [23]. The results were also similar to those reported in a hospital cafeteria for employees where menus had a fixed price [10], and higher than the amount of PW found in a hospital cafeteria for employees where food was paid for by weight [10]. Conversely, higher values were reported at lunch in a hospital food hall in Turkey [24] and in various workplace or university settings [25,26], in some cases even after interventions to raise PW awareness [27,28,29].
In the present study, higher meal energy content was independently associated with a greater likelihood of PW, indicating that larger or more energy-dense meals may be less likely to be fully consumed. Moreover, the canteen site also emerged as a significant independent predictor of PW, with waste in C1 significantly higher than in the other two canteens. Thus, C1 showed the highest values, similar to those observed in the Turkish hospital canteen [24], while C2 and C3 showed lower or more comparable values to those of the other hospital canteens [10,23]. It is noteworthy that the percentage of trays with PW in C1 remained consistently the highest throughout the study period (T0–T1) compared with the other canteens (C1: 38–41%; C2: 23–21%; C3: 21–25%). These differences between C1 and the other two canteens may be explained by different responses to the intervention by employees, different dishes offered, and/or the larger size (i.e., higher user rate) of C1 compared with C2 and C3. In addition, other factors should be investigated in future studies, such as satisfaction with food quality and adequacy of portion size, for example by adding questions on the reasons for plate waste to the questionnaire.
Despite the overall low PW observed in C2 and C3, significant differences were found between these two canteens when service counter food waste was analyzed. The largest differences in service waste were observed between C3, the only canteen with internal management, and the other two externally managed canteens with high (C1) and low (C2) user rates (C1: +58.5 kg of service waste; C2: +75.8 kg compared with C3 in one week of analysis). A flexible organization of daily menus in this internally managed canteen may have facilitated the reuse of food in other preparations, thereby reducing service waste. Indeed, in C3, some vegetables were reported to be reused the following day to produce, for example, soups, and therefore were not weighed as service waste. However, there were also minor differences between C1 and C2, which have the same external management but different user rates: C1 is the largest canteen with almost 450–480 daily users, while C2 is a small canteen with approximately 100–120 users per day. Therefore, a speculative interpretation of these results is that management and organization of the canteen (e.g., menu planning that considers the reuse of certain foods and food production planning based on actual user rates) can be key to preventing service waste. This additional analysis also made it clear that PW cannot be considered in isolation, as C2 was the most virtuous canteen in terms of PW (total produced by participating users: 4.2 kg; hypothetical total considering the user rate for 5 days: 6.1–7.3 kg), but the worst in terms of service food waste (total: 84.1 kg). It can also be hypothesized that where less food was wasted on the plate, users chose less food, resulting in more food remaining on the counter if the amount offered is not adjusted to new user habits. Previous studies have already highlighted the importance of avoiding overproduction and improving planning in buffet-style canteens to reduce service waste [23,30].
4.2. Plate Waste and Demographic Characteristics
Results showed no statistically significant differences in either the prevalence of trays with PW or the amount of PW between males and females, contrary to what is reported in most studies in the literature [31,32,33,34,35,36] and in the pre-intervention assessment regarding PW amount [12]. However, we cannot exclude the possibility that the intervention itself may have indirectly modified PW behaviors differently by sex, thus levelling those differences. In contrast, age-related differences in PW found in the previous assessment [12] were partially confirmed. The youngest group (≤34 years) wasted the most, particularly more than the middle group (35–54 years), with a statistically significant difference. Although few data were found on age differences in PW in food service for adults of working age [37], with mixed results, the most compelling evidence is that older people waste less, but mainly in households [36,38,39], where management and educational/social models play a determining role. Furthermore, in the multivariable regression model, sex and age were not independently associated with PW occurrence after adjustment for the other covariates.
4.3. Plate Waste Characterization
In the total sample, wasted food on the plate accounted for a mean of 43.6 kcal, 69.6 g CO2 eq., and 61.8 L H2O per tray. Overall over five days in the three canteens, 70,854 kcal were wasted, 113 kg CO2 eq were produced, and 100,329 L of water were used solely to produce wasted food. In line with the findings on PW amount, the highest mean values for all parameters were observed in C1: PW of 58.7 kcal/tray, 93.4 g CO2 eq./tray, and 83.7 L H2O/tray, corresponding to about 10% of the middle value of the reference range for a complete meal [40] wasted without being eaten.
Considering only trays with leftovers, it was possible to characterize PW in terms of median nutrient content per not fully consumed tray. Alarmingly, it was also found that, on average, more plant proteins were wasted in each canteen than animal proteins, despite national and international recommendations to increase the consumption of plant protein sources for human and planetary health [1,41]. In total, the amount of wasted energy and nutrients was 70,854 kcal, 3.4 kg of protein, 2.4 kg of lipids (of which 0.4 kg were PUFA), 9.1 kg of carbohydrates, and 0.9 kg of fiber. This count includes only trays from users who gave their consent to participate in the study, representing approximately half of all users accessing these canteens during the five working days of analysis. Therefore, actual weekly PW should be almost double.
The category that contributed most to the total amount of PW was side dishes, both overall and in each canteen, as seen in the pre-intervention assessment [12]. However, unlike the pre-intervention results, C2 showed a smaller percentage contribution (20%) than the other canteens. In contrast to these results, a Spanish study presenting aggregated data (home and out-of-home waste), found that bread was the main contributor to total waste (25%), while side dishes accounted for only 7% of total waste [36]. On the other hand, Silva and colleagues [42] found in a Portuguese university canteen that the main wasted foods were salad and vegetables, particularly as PW.
Considering fruit, side dishes, and salad (vegetables) together, they account for almost half of the total wasted food (49%), amounting to 26.4 kg/week of PW produced by approximately 50% of the users who agreed to participate in the study. Reducing fruit and vegetable waste by promoting their consumption is not only a health goal but also a sustainability goal, as the environmental load is driven not by high impact indicators themselves, but by the large quantities of food wasted. Fruit waste also entails a significant company cost, and therefore represents a loss of nutrients, money, and biomass. The primary proposed strategies for food waste management are reduction and reuse/donation [43]. In the case of PW, donation is not a feasible option, so reuse and reduction should be prioritized. A simple strategy for “reuse” may be to encourage the takeaway of fruit that is not consumed during the meal, transforming a potential waste into a healthy afternoon snack. Moreover, it is essential to characterize wasted food to support the selection of appropriate waste management options. Indeed, after reduction and reuse, another feasible option for service waste and plate waste is the recovery of energy and nutrients from leftovers, and to achieve this, it is important to know the potential of the waste produced in each setting.
4.4. Plate Waste Modifications After the Intervention on Healthy and Sustainable Food Choices
To our knowledge, only a few studies have compared data on PW following an intervention not focused on reducing PW, but on improving the health aspects of food choices in collective catering settings [10,11]. Contrary to the findings of Cohen and colleagues [11], but in line with the other study [10], we found that the amount of PW remained substantially unchanged after the intervention aimed at promoting healthy and sustainable food choices, (although in our case with an increase particularly in its energy density) except in one canteen (C2), where the amount of PW decreased and, at the same time, the intervention did not seem to have worked properly [14]. One possible speculative explanation for this paradoxical finding is that users who maintained their usual food choices may have selected foods more closely aligned with their preferences and therefore consumed a larger part of the meal. In fact, in C2, the intervention did not seem to have worked properly because (1) side dish and fruit consumption did not increase in the post intervention assessment, but only salad consumption increased, and only at the threshold of statistical significance; (2) the choice of beef-based dishes, which have the worst environmental profile [13], remained unchanged; and (3) the macronutrient composition of the meal did not improve adequately, remaining unbalanced towards fats and low in fiber. However, the energy content, and correspondingly, the CF and WF of the meal, decreased. This scenario, combined with the results on PW—which decreased significantly in the post-intervention assessment among those who wasted something (median: −48.9 g/tray and −48.0 kcal/tray), with a significant decrease in fiber waste and in waste of vegetal protein and lipids relative to animal ones—suggests that the intervention may have indirectly sensitized users to the importance of eating vegetables. Therefore, they possibly chose them to the same extent as before [14] but ate them instead of leaving them on their plate. This hypothesis is reinforced by the fact that the PW of side dishes decreased the most after the intervention: on average, each user wasted 10 g less of side dishes per tray compared to the pre-intervention period and, considering the total amount of PW produced, the contribution of side dish waste decreased from 42% [12] to 20%. The lower CF and WF of PW after the intervention may be explained by the lower CF and WF of choices and the lower amount of PW in general, rather than by an actual reduction in waste of beef-based or other unsustainable dishes. Indeed, it must be noted that the lower amount and energy content of PW also corresponded to a lower (but still reasonably sufficient) energy content of the chosen meal: users chose less and consequently wasted less food, as also confirmed by the regression results. Several studies in the literature confirm that smaller portions are associated with smaller PW [44,45] and that excessive portions are the main declared reason for PW [46]. In the present study, the portion size was not changed, but users independently chose a less caloric meal, showing a similar effect.
In C3, the intervention appears to have increased vegetable choices (side dishes and salad) [14]. However, we found that while salad waste decreased, side dish waste increased in parallel, thus weakening the hypostasized effectiveness of the intervention. This pattern may suggest a mismatch between the intention to consume (food choice) and the actual behavior (consumption), which is conceptually similar to the intention–behavior gap described in the literature [47]. In this context, it reflects a discrepancy between what users value as the food they ideally want to eat (e.g., vegetables), and what they actually consume. We may also speculate that cooked side dishes were more prone to this phenomenon compared to raw vegetables, as they may be more sensitive to issues such as preparation quality, presentation, or over-portioning relative to consumers’ preferences. Therefore, these results highlight that it is pointless to increase the choice of vegetables if they are then wasted on the plate as this nullifies both the nutritional and environmental goals. Moreover, food leftovers have a higher environmental impact than consumed food, since not only are the resources used to produce them wasted, but additional resources are also required to manage the waste. A particularity of C3 is that the choice of beef-based dishes also increased significantly post-intervention [14]. This is contrary to the aim of reducing beef consumption, given its much higher environmental impact compared to other protein sources [21] and the infrequent consumption suggested by dietary guidelines [48,49], as well as by the educational material displayed in the dining room during the intervention. The observed increase in beef selection was attributed to the fact that, by chance, beef was not offered at T0, whereas at T1, several second courses available during the week of analysis were beef-based [14]. Following this rise in selections, beef was also detected in PW. Although the increases in the prevalence of PW (+3.3%) and the total amount of PW per tray were not statistically significant, a trend was observed, with a median increase of +8.7 g/tray, +30.6 kcal/tray (p < 0.05), and +2.3 g/tray of protein wasted (p < 0.005). Notably, there was a significant increase in animal protein, animal lipids, and environmental indicators, indicating greater waste of unsustainable animal-based dishes (e.g., beef). Thus, beef was offered more frequently as a second course, chosen more often, but also wasted more. Second courses were wasted more than in the pre-intervention assessment, when other second courses (mainly pork and chicken) were offered instead of beef. The mean amount of waste from second courses, which in Italy traditionally contain meat, cheese, or fish, increased in C3 after the intervention (+3 g/tray on average), as did the percentage contribution of second courses to total PW (from 4% to 20%). Furthermore, both food choices and PW had higher energy and environmental indicators at T1 than at T0: users selected more energy-dense and less sustainable meals and also wasted more of them.
In C1, vegetable selections increased after the intervention, while beef selection as a second course decreased [14]. As in C3, there was a parallel trend of increased PW, both in the prevalence of trays with leftovers (+3.2%), in its median amount (+1 g/tray, not significant), and in energy content (+7 kcal/tray, p < 0.05). However, in this case, differences in wasted food categories were not apparent. Like the other canteens, changes in the energy content of food choices corresponded to changes in the energy content of PW.
Overall, the results indicate that improvements in food choices do not necessarily lead to improvements in actual food consumption. In two canteens, the intervention appeared to encourage healthier food selections, particularly vegetables, but this was not consistently accompanied by reductions in plate waste. These findings suggest that food choice and food consumption should be evaluated together when assessing the effectiveness of interventions aimed at promoting healthier and more sustainable eating behaviors.
4.5. Strengths and Limitations
The strengths and limitations of this study reflect those reported in the paper on pre-intervention assessment [12]. Briefly, the main strengths are plate waste was not self-reported but visually estimated by trained researchers from photographs; recipes and portion sizes were provided by canteen staff; and the high response rate (almost 50%) allows for reliable estimates. However, generalizability remains limited due to the high variability of setting, food offering, and service modalities in the food sector. The main limitations are: variability in the menu between T0 and T1, which could have influenced both food choices and plate waste independently of the intervention; heterogeneity of the interventions between the canteens; lack of a causal design; absence of specific questions on the reasons for PW (e.g., palatability, portion size); possible selection bias (non-mandatory participation in the study may have selected users with more time or greater interest in the topic) and observation bias (possible behavioral change to meet perceived expectations); visual estimations of PW; and the use of only two indicators of environmental impact (CF and WF). Moreover, due to the use of the SU-EATABLE LIFE dataset for environmental data estimations, which includes data up to the market level, underestimation may have occurred. One limitation identified in the first assessment—which has now been resolved—concerned the analysis of food service waste. In the present paper, we also quantified food waste generated at the service point, broadening the food waste analysis.
5. Conclusions
This study contributes to the currently limited evidence on food and plate waste in institutional food services for adult employees and on the relationship between interventions promoting healthier and more sustainable food choices and plate waste. The findings suggest that improvements in food choices are not necessarily accompanied by reductions in plate waste, highlighting the importance of evaluating food selection and actual consumption together.
In this study, plant-based foods were among the most wasted food categories, particularly in the two canteens where vegetable choices were increased following the intervention. This highlights the importance of combining interventions promoting healthy eating with strategies aimed at reducing waste of healthy foods. Moreover, in the present analysis, cafeteria site and meal energy content were the main independent determinants of plate waste, corroborating the hypothesis that both contextual factors of the food service setting and food choices may influence plate waste generation.
These findings imply that future interventions to promote healthier and more sustainable eating behaviors should be accompanied by strategies to improve the acceptability of menu options, optimize portion sizes, and monitor plate waste alongside food choices. Given the uncontrolled design of the study, the observed changes cannot be interpreted as causal effects of the intervention. Future studies incorporating behavioral and contextual measures are needed to better understand the mechanisms linking food choice, food consumption, and plate waste, and to identify the most effective strategies for simultaneously improving dietary quality and reducing food waste.
Supplementary Materials
The following supporting information can be downloaded at https://www.mdpi.com/article/10.3390/app16136453/s1, Table S1: Amount of plate waste by course category in each canteen and in the total sample.
Author Contributions
Conceptualization, L.L., L.B. and M.P.; methodology, F.F., D.M., E.M., C.L.G., P.C., D.Z., M.D., L.G., F.C., A.C. (Angelica Cosolo), M.M., L.L., L.B. and M.P.; formal analysis, F.F., E.M. and M.D.; investigation, F.F., D.M., E.M. and L.B.; data curation, F.F., D.M., E.M., C.L.G., P.C. and D.Z.; writing—original draft preparation, F.F., D.M. and E.M.; writing—review and editing, C.L.G., P.C., D.Z., M.D., L.G., F.C., A.C. (Angelica Cosolo), M.M., L.L., E.S., A.C. (Alessandro Conte), L.B. and M.P.; visualization, F.F.; supervision, L.L., E.S., A.C. (Alessandro Conte), L.B. and M.P.; project administration, L.L., L.B. and M.P. All authors have read and agreed to the published version of the manuscript.
Funding
This research received no external funding.
Institutional Review Board Statement
The study was conducted in accordance with the Declaration of Helsinki and approved by the Institutional Review Board of the University of Udine (protocol code 108/2022, date of approval: 6 July 2022, amendment protocol code 122/2023, date of approval: 3 July 2023).
Informed Consent Statement
Informed consent was obtained from all subjects involved in the study.
Data Availability Statement
The raw data supporting the conclusions of this article will be made available by the authors on request.
Acknowledgments
We would like to thank all the staff of the canteens for providing menus and recipes and for their precious support in data collection.
Conflicts of Interest
The authors declare no conflicts of interest.
Abbreviations
The following abbreviations are used in this manuscript:
| PW | Plate Waste |
| C1 | Canteen 1 |
| C2 | Canteen 2 |
| C3 | Canteen 3 |
| T0 | Pre-intervention assessment |
| T1 | Post-intervention assessment |
| CF | Carbon footprint |
| WF | Water footprint |
| FCT | Fully consumed trays |
| NCT | Not fully consumed trays |
| PUFA | Polyunsaturated Fatty Acids |
References
- Willett, W.; Rockström, J.; Loken, B.; Springmann, M.; Lang, T.; Vermeulen, S.; Garnett, T.; Tilman, D.; DeClerck, F.; Wood, A.; et al. Food in the Anthropocene: The EAT-Lancet Commission on healthy diets from sustainable food systems. Lancet 2019, 393, 447–492. [Google Scholar] [CrossRef] [Scilit] [PubMed]
- United Nations Environment Programme. The 2024 Food Waste Index Report; United Nations Environment Programme: Nairobi, Kenya, 2024; ISBN 9789280741391. [Google Scholar]
- FAO. The State of Food and Agriculture 2019. Moving Forward on Food Loss and Waste Reduction; FAO: Rome, Italy, 2019. [Google Scholar]
- United Nations Transforming Our World: The 2030 Agenda for Sustainable Development. Available online: https://sdgs.un.org/2030agenda (accessed on 23 June 2026).
- United Nations Department of Economic and Social Affairs. The Sustainable Development Goals Report 2025. New York. (Revision August 2025). Available online: https://unstats.un.org/sdgs/report/2025/The-Sustainable-Development-Goals-Report-2025.pdf (accessed on 23 June 2026).
- Guimarães, N.S.; Reis, M.G.; Fontes, L.d.A.; Zandonadi, R.P.; Botelho, R.B.A.; Alturki, H.A.; Saraiva, A.; Raposo, A. Plate Food Waste in Food Services: A Systematic Review and Meta-Analysis. Nutrients 2024, 16, 1429. [Google Scholar] [CrossRef] [Scilit] [PubMed]
- Zhao, X.; Manning, L. Food plate waste: Factors influencing insinuated intention in a university food service setting. Br. Food J. 2019, 121, 1536–1549. [Google Scholar] [CrossRef] [Scilit]
- Conrad, Z.; Niles, M.T.; Neher, D.A.; Roy, E.D.; Tichenor, N.E.; Jahns, L. Relationship between food waste, diet quality, and environmental sustainability. PLoS ONE 2018, 13, e0195405. [Google Scholar] [CrossRef] [Scilit] [PubMed]
- Grant, F.; Rossi, L. Sustainable choices: The relationship between adherence to the dietary guidelines and food waste behaviors in Italian families. Front. Nutr. 2022, 9, 1026829. [Google Scholar] [CrossRef] [Scilit] [PubMed]
- Lassen, A.D.; Beck, A.; Leedo, E.; Andersen, E.W.; Christensen, T.; Mejborn, H.; Thorsen, A.V.; Tetens, I. Effectiveness of offering healthy labelled meals in improving the nutritional quality of lunch meals eaten in a worksite canteen. Appetite 2014, 75, 128–134. [Google Scholar] [CrossRef] [Scilit] [PubMed]
- Cohen, J.F.W.; Richardson, S.; Parker, E.; Catalano, P.J.; Rimm, E.B. Impact of the New U.S. Department of Agriculture School Meal Standards on Food Selection, Consumption, and Waste. Am. J. Prev. Med. 2014, 46, 388–394. [Google Scholar] [CrossRef] [Scilit] [PubMed]
- Fiori, F.; Menis, D.; Cautero, P.; Zago, D.; Driutti, M.; Lesa, L.; Conte, A.; Scarpis, E.; Brunelli, L.; Parpinel, M. Plate waste in hospital canteens: A nutritional and environmental analysis in north-eastern Italy. Front. Nutr. 2025, 12, 1542280. [Google Scholar] [CrossRef] [Scilit]
- Menis, D.; Fiori, F.; Cautero, P.; Zago, D.; Beorchia, Y.; Dallan, L.; Vettorazzo, P.; Lesa, L.; Conte, A.; Scarpis, E.; et al. Sustainability and nutritional composition of food offer and choices in three hospital canteens in Italy. Heliyon 2024, 10, e39317. [Google Scholar] [CrossRef] [Scilit] [PubMed]
- Mansutti, E.; Fiori, F.; Menis, D.; Cautero, P.; Graziani, C.L.; Zago, D.; Driutti, M.; Lesa, L.; Grillone, L.; Cortelazzo, F.; et al. Sustainability and nutritional composition of food choices in hospital canteens: A pre-post intervention study. medRxiv 2026, 2026.04.02.26349952. [Google Scholar] [CrossRef] [Scilit]
- The Nutrition Source, Department of Nutrition, Harvard T.H. Chan School of Public Health. Healthy Eating Plate. Available online: https://nutritionsource.hsph.harvard.edu/healthy-eating-plate/translations/italian/ (accessed on 23 June 2026).
- Serra-Majem, L.; Tomaino, L.; Dernini, S.; Berry, E.M.; Lairon, D.; de la Cruz, J.; Bach-Faig, A.; Donini, L.M.; Medina, F.-X.; Belahsen, R.; et al. Updating the Mediterranean Diet Pyramid towards Sustainability: Focus on Environmental Concerns. Int. J. Environ. Res. Public Health 2020, 17, 8758. [Google Scholar] [CrossRef] [Scilit]
- Thomas, J.M.; Ursell, A.; Robinson, E.L.; Aveyard, P.; Jebb, S.A.; Herman, C.P.; Higgs, S. Using a descriptive social norm to increase vegetable selection in workplace restaurant settings. Health Psychol. 2017, 36, 1026–1033. [Google Scholar] [CrossRef] [Scilit]
- Comstock, E.M.; St Pierre, R.G.; Mackiernan, Y.D. Measuring individual plate waste in school lunches. Visual estimation and children’s ratings vs. actual weighing of plate waste. J. Am. Diet. Assoc. 1981, 79, 290–296. [Google Scholar] [CrossRef] [Scilit]
- Carioni, G.; Fiori, F.; Radice, D.; Bianco, R.; Parpinel, M.; Gnagnarella, P. Update of the food composition database for epidemiological studies in Italy: Focus on cereals and cereal products. J. Food Compos. Anal. 2025, 146, 107928. [Google Scholar] [CrossRef] [Scilit]
- Gnagnarella, P.; Salvini, S.; Parpinel, M. Food Composition Database for Epidemiological Studies in Italy. Version 1. 2022. Available online: https://bda.ieo.it/ (accessed on 28 January 2022).
- Petersson, T.; Secondi, L.; Magnani, A.; Antonelli, M.; Dembska, K.; Valentini, R.; Varotto, A.; Castaldi, S. A multilevel carbon and water footprint dataset of food commodities. Sci. Data 2021, 8, 127. [Google Scholar] [CrossRef] [Scilit] [PubMed]
- Vásquez-Caicedo, A.; Bell, S.; Hartmann, B. Report on Collection of Rules on Use of Recipe Calculation Procedures Including the Use of Yield and Retention Factors for Imputing Nutrient Values for Composite Foods. WP2.2 Composite Foods. 2008. Available online: https://www.fao.org/uploads/media/EuroFIR_recipe_calculation_procedures_including_yield_and_re-2008_02.pdf (accessed on 23 June 2026).
- Strotmann, C.; Friedrich, S.; Kreyenschmidt, J.; Teitscheid, P.; Ritter, G. Comparing Food Provided and Wasted before and after Implementing Measures against Food Waste in Three Healthcare Food Service Facilities. Sustainability 2017, 9, 1409. [Google Scholar] [CrossRef] [Scilit]
- Yüksel, A.; Önal, H.Y. A study of plate waste in a food service. Prog. Nutr. 2021, 23, e2021089. [Google Scholar] [CrossRef] [Scilit]
- Zhang, D.; Zhang, P.; Xue, L.; Wu, L. Food waste and its associated environmental impacts in workplace buffet-style canteens in Beijing, China. Front. Sustain. Food Syst. 2024, 8, 1455756. [Google Scholar] [CrossRef] [Scilit]
- Sebbane, M.; Costa, S. Food leftovers in workplace cafeterias: An exploratory analysis of stated behavior and actual behavior. Resour. Conserv. Recycl. 2018, 136, 88–94. [Google Scholar] [CrossRef] [Scilit]
- Machado, C.C.B.; Chaves, V.S.; de Souza Abreu, V. Índice de resto ingestão antes e após campanha de conscientização de comensais. Rev. Estud. Ciências Ambient. E Saúde 2019, 46, 1–7. [Google Scholar] [CrossRef] [Scilit]
- Bicalho, A.H.; Lima, V.O.B. Impacto de uma intervenção para redução do desperdício em uma Unidade de Alimentação e Nutrição. Nutrire 2013, 38, 269–277. [Google Scholar] [CrossRef] [Scilit]
- Ellison, B.; Savchenko, O.; Nikolaus, C.J.; Duff, B.R.L. Every plate counts: Evaluation of a food waste reduction campaign in a university dining hall. Resour. Conserv. Recycl. 2019, 144, 276–284. [Google Scholar] [CrossRef] [Scilit]
- Silvennoinen, K.; Nisonen, S.; Pietiläinen, O. Food waste case study and monitoring developing in Finnish food services. Waste Manag. 2019, 97, 97–104. [Google Scholar] [CrossRef] [Scilit] [PubMed]
- Du, W.; Xue, L.; Xu, D.; Zhang, H.; Liu, G.; Duan, H.; Dong, J.; Chen, J.; Zhang, H. The effects of an online food waste reduction platform in university canteens in Wuhan, China. J. Clean. Prod. 2024, 468, 142991. [Google Scholar] [CrossRef] [Scilit]
- Kuo, C.; Shih, Y. Gender differences in the effects of education and coercion on reducing buffet plate waste. J. Foodserv. Bus. Res. 2016, 19, 223–235. [Google Scholar] [CrossRef] [Scilit]
- Vizzoto, F.; Tessitore, S.; Testa, F.; Iraldo, F. Plate waste in foodservice outlets: Revealing customer profiles and their support for potentially contentious measures to reduce it in Italy. Resour. Conserv. Recycl. 2021, 174, 105771. [Google Scholar] [CrossRef] [Scilit]
- Betz, A.; Buchli, J.; Göbel, C.; Müller, C. Food waste in the Swiss food service industry—Magnitude and potential for reduction. Waste Manag. 2015, 35, 218–226. [Google Scholar] [CrossRef] [Scilit] [PubMed]
- Bernaert, N.; Rycke, E.D.; Hunninck, M.; Vlaemynck, G.; Van Pamel, E.; Vangeyte, J.; Willekens, A.; Cool, S.; Bosch, S.; Maselyne, J.; et al. Monitoring plate and preparation food waste in residential facilities for elderly people: A case study in Flanders (Belgium). Waste Manag. 2025, 195, 189–199. [Google Scholar] [CrossRef] [Scilit] [PubMed]
- Partearroyo, T.; Samaniego-Vaesken, M.d.L.; Ruiz, E.; Aranceta-Bartrina, J.; Gil, Á.; González-Gross, M.; Ortega, R.M.; Serra-Majem, L.; Varela-Moreiras, G. Plate Waste Generated by Spanish Households and Out-of-Home Consumption: Results from the ANIBES Study. Nutrients 2020, 12, 1641. [Google Scholar] [CrossRef] [Scilit] [PubMed]
- Cerrah, S.; Yigitoglu, V. Determining the effective factors on restaurant customers’ plate waste. Int. J. Gastron. Food Sci. 2022, 27, 100469. [Google Scholar] [CrossRef] [Scilit]
- Grant, F.; Di Veroli, J.N.; Rossi, L. Characterization of household food waste in Italy: Three year comparative assessment and evaluation of seasonality effects. Waste Manag. 2023, 164, 171–180. [Google Scholar] [CrossRef] [Scilit] [PubMed]
- Aschemann-Witzel, J.; Jensen, J.H.; Jensen, M.H.; Kulikovskaja, V. Consumer behaviour towards price-reduced suboptimal foods in the supermarket and the relation to food waste in households. Appetite 2017, 116, 246–258. [Google Scholar] [CrossRef] [Scilit] [PubMed]
- LIFE SU-EATABLE. LIFE16 GIC/IT/000038. Reducing Carbon Emissions in the EU Through Sustainable Diets. Guidelines for Promoting Sustainable Diets at Canteens of Worksites and Universities. 2019. Available online: https://www.sueatablelife.eu/m/media/SEL_Guidelines_SustainableDiets_Canteens_Workplaces_Universities.pdf (accessed on 23 June 2026).
- Società Italiana di Nutrizione Umana (SINU). LARN-Livelli di Assunzione di Riferimento di Nutrienti ed Energia per la Popolazione Italiana. V Revisione; Giugno 2024; Biomedia: Milano, Italy, 2024; ISBN 9788886154765. [Google Scholar]
- Silva, S.S.; Pereira, A.C.; Marques, B.; Liz Martins, M. Inadequacy of Meals Served and Food Waste in a Portuguese University Canteen. Sustainability 2024, 16, 4317. [Google Scholar] [CrossRef] [Scilit]
- US-EPA. Protection A. Wasted Food Scale. Available online: https://www.epa.gov/sustainable-management-food/wasted-food-scale (accessed on 23 June 2026).
- Ofei, K.T.; Holst, M.; Rasmussen, H.H.; Mikkelsen, B.E. Effect of meal portion size choice on plate waste generation among patients with different nutritional status. An investigation using Dietary Intake Monitoring System (DIMS). Appetite 2015, 91, 157–164. [Google Scholar] [CrossRef] [Scilit] [PubMed]
- Lorenz-Walther, B.A.; Langen, N.; Göbel, C.; Engelmann, T.; Bienge, K.; Speck, M.; Teitscheid, P. What makes people leave LESS food? Testing effects of smaller portions and information in a behavioral model. Appetite 2019, 139, 127–144. [Google Scholar] [CrossRef] [Scilit] [PubMed]
- Pires, I.; Machado, J.; Rocha, A.; Liz Martins, M. Food Waste Perception of Workplace Canteen Users—A Case Study. Sustainability 2022, 14, 1324. [Google Scholar] [CrossRef] [Scilit]
- Sheeran, P. Intention—Behavior Relations: A Conceptual and Empirical Review. Eur. Rev. Soc. Psychol. 2011, 12, 3283. [Google Scholar] [CrossRef] [Scilit]
- CREA-NUT Linee Guida per Una Sana Alimentazione. 2018. Available online: https://www.crea.gov.it/web/alimenti-e-nutrizione/-/linee-guida-per-una-sana-alimentazione-2018 (accessed on 23 June 2026).
- Sofi, F.; Martini, D.; Angelino, D.; Cairella, G.; Campanozzi, A.; Danesi, F.; Dinu, M.; Erba, D.; Iacoviello, L.; Pellegrini, N.; et al. Mediterranean diet: Why a new pyramid? An updated representation of the traditional Mediterranean diet by the Italian Society of Human Nutrition (SINU). Nutr. Metab. Cardiovasc. Dis. 2025, 35, 103919. [Google Scholar] [CrossRef] [Scilit] [PubMed]

Disclaimer/Publisher’s Note: The statements, opinions and data contained in all publications are solely those of the individual author(s) and contributor(s) and not of MDPI and/or the editor(s). MDPI and/or the editor(s) disclaim responsibility for any injury to people or property resulting from any ideas, methods, instructions or products referred to in the content. |
© 2026 by the authors. Licensee MDPI, Basel, Switzerland. This article is an open access article distributed under the terms and conditions of the Creative Commons Attribution (CC BY) license.