


Abstract
The rapid growth of sophisticated malware, including polymorphic, metamorphic, and zero-day threats, has made traditional signature-based and heuristic detection methods increasingly insufficient in modern desktop computing environments. As cyber threats continue to evolve in both complexity and scale, the demand for intelligent and adaptive malware detection mechanisms capable of identifying previously unseen attacks has become more critical than ever. In this study, we propose a novel deep learning framework for three-dimensional malware image classification that utilizes visual representation learning to improve malware detection performance. The proposed framework converts raw malware binaries into three-dimensional grayscale and RGB image representations, allowing hidden structural and spatial patterns within malware samples to be analyzed more effectively. By transforming malware data into multi-dimensional visual forms, the proposed system facilitates the process of automatically learning hierarchical features by CNN through multi-dimensional visualization of malware binary codes. In addition, an optimization technique using Genetic Algorithms is implemented within this architecture to improve classification performance and stability. The proposed evolutionary algorithm performs an effective search process within the large parameter space of 3D-CNN, leading to the identification of models that facilitate learning. It is shown that multi-dimensional visualization of malware achieves improved classification performance. It can be concluded that the combination of three-dimensional malware visualization, deep learning, and genetic optimization is promising for the development of future intelligent malware detection tools.
1. Introduction
Malware, which is also known as malicious software, is intentionally created to be able to gain unauthorized access, disrupt operations, damage, or steal confidential information from computer systems, network connections, and other digital infrastructures. Malware represents a wide array of attacks such as computer viruses, worms, trojans, ransomware, spyware, and other harmful programs, which take advantage of the vulnerabilities found within an information system in order to compromise its confidentiality, integrity, and availability. As a result of different factors such as the underlying architecture of the systems, user habits, software environment, and security practices, different computing environments are vulnerable to malware attacks at various levels.
Desktop computing environments are among the most popular targets for cyberattacks, especially those that run on the Windows operating system because of its popularity in organizational settings and accessibility to organizational data. Such computing environments represent highly attractive targets for the purpose of carrying out attacks involving ransomware, trojans, and advanced persistent threats (APTs) [1]. The Android platform, characterized by its open application architecture and capacity for third-party software installation, stands out as one of the mobile ecosystems most vulnerable to malware attacks, with the common types being spyware, adware, banking trojans, and credential stealers.
Malware may be transmitted in various ways, however malspam and malvertisement are the two most common vectors used in this dissemination process, as detailed in Figure 1 [2]. According to the definition provided, malspam refers to junk emails that manipulate the recipient into visiting malicious websites or downloading malicious files in malware such as Agent Tesla. Malvertising, on the other hand, involves spreading malware through advertisements on online websites, which direct users to either visit exploit kits, phishing pages, or carry out drive-by downloads. They work effectively as methods of spreading malware as they concentrate on manipulating the actions of people instead of taking advantage of vulnerabilities found within applications. This explains why there is a tendency to target computer systems that provide high access capabilities to critical resources and connectivity in addition to sufficient computational power [3].
Figure 1.
Top Initial Infection Vectors [2].
Detection methods capable of both identifying and classifying malware should be created by expert researchers because current malware attacks are increasingly becoming a bigger threat to the modern world and the digital infrastructure is faced with an urgent need to deal with them [4]. Traditionally, malware detection methods are built on signatures and, additionally, involve some heuristic and behavioral approaches to increase their detection rates. Detection based on signatures, being considered the main approach for almost all antivirus software, works according to the principles of finding distinctive byte patterns and hashes compared to those stored in malware databases [5]. Although it is highly efficient for known threats, this detection approach requires historical data, thus preventing it to detect unknown malware such as zero-day and polymorphic threats which frequently change their signatures. On the other hand, heuristic-based detection relies on the rules and patterns formulated by experts to find signs of suspicious software behavior in newly developed malware that was not discovered earlier [6]. Moreover, behavior detection and anomaly detection analyze system actions through observation of API calls, monitoring network resource usage, and monitoring changes in files [7]. In terms of analysis methods, static approaches analyze malware code without its execution, while dynamic ones include monitoring and executing its actions in a sandbox environment. Non-learning approaches specifically require manual development of signatures and patterns, which might complicate this process significantly due to the complex nature of modern malware attacks [8].
Traditional malware detection techniques often struggle against modern threats such as polymorphic and zero-day malware because they rely heavily on predefined signatures and manually crafted rules. To address these limitations, machine learning and deep learning approaches have gained significant attention due to their ability to automatically learn discriminative patterns from malware data [9,10]. In particular, deep learning models can extract hierarchical features directly from raw inputs, reducing the need for manual feature engineering and improving adaptability to previously unseen threats [11].
Advancements recently made in deep learning algorithms have been very effective in contributing to the field of malware image recognition, whereby the executable binaries are transformed into an image using computer vision [12]. The concept of transforming the raw binary codes into grayscale or RGB images makes it possible for the malware samples to exhibit distinct visual features [13]. With the aid of CNNs, visual representation allows a machine learning model to autonomously discover the complex hierarchy of features from the imagery itself without having to perform manual feature extraction steps, which are typical of many existing static and dynamic malware analysis techniques [14]. Malware families frequently share similar visual features despite any obfuscation efforts employed during code construction, which makes image-based malware analysis well-suited for identifying malware families. In recent times, the focus of research has shifted away from basic two-dimensional grayscale visual representations and instead towards exploring novel three-dimensional and multi-channel visualizations.
The main contributions of this study can be summarized as follows:
- In this work, we propose a deep learning approach for malware detection based on three-dimensional (3D) image representations. The volumetric representation preserves additional relationships within executable files and provides an alternative feature space for malware classification. The effectiveness of this representation is investigated through comparative experiments using different 3D encoding strategies.
- Our approach offers two 3D representations of malware—namely 3D grayscale and 3D RGB volumes obtained directly from executable files’ byte sequences, enabling malware behavior analysis from various perspectives.
- An RGB representation approach that is aware of the executable’s structure is created using the PE file structure, wherein different components are mapped into different color channels.
- Customized 3D Convolutional Neural Networks (3D-CNN) are created and evaluated systematically by means of the architecture search process for finding optimal channel designs in malware classification tasks.
- A genetic algorithm (GA) driven mechanism for the automatic hyperparameter tuning for crucial training aspects like learning rate, weight decay, and dropout is introduced in the system to achieve more accurate and stable results.
- An overall malware analysis framework is developed that involves all of the major stages from dataset construction, transformation into a volume-based format, preprocessing, malware classification by deep learning approaches, and optimization, to the end-to-end testing stage.
- Experimental evaluations on a massive collection of executable files show that the proposed framework yields outstanding accuracy rates over 99% in malware detection tasks under full-scale conditions.
- Results show that by combining multidimensional malware visualization and optimization-driven deep learning techniques, one can obtain a scalable malware detection solution, capable of classifying even new malware families.
The rest of this paper is organized as follows. Section 2 provides an extensive literature survey that includes an overview of the state-of-the-art approaches used in detecting malware, from the basic heuristics and signatures to the recent deep learning and visualization approaches. The method proposed in this paper is introduced in Section 3, in which malware files are encoded using 3D colored representation, and then detected using deep learning algorithms through a hyperparameter optimization process based on a Genetic Algorithm. Section 4 demonstrates the experimentation setup and results of classifying various malware families using the proposed 3D-CNN approach. In Section 5, the advantages of the proposed 3D colored representation technique are highlighted. Finally, Section 6 summarizes the paper.
2. Literature Review
Considering the fast-paced advancement of the malware development cycle in terms of polymorphism and zero-days which keep adapting their structure and behavior, making it extremely difficult for signature-based and heuristics-based techniques to detect them, learning-based techniques are receiving increasing attention in detecting these kinds of malware because they enable greater adaptability, scalability, and generality than their counterpart techniques. Among all different techniques in the domain of malware classification using learning approaches, one that has gained considerable popularity lately is the representation of malware files as visual information, which includes multidimensional images of them.
Recent studies, kind of suggest that turning complicated and high-dimensional data into image-style depictions can actually boost classification outcomes in computer vision as well as cybersecurity. Like, for instance, 3D object information can be reshaped into a set of 2D grayscale snapshots and then processed with CNN based systems such as DenseNet and EfficientNet, which often ends up giving strong multi label performance on usual benchmarks such as ModelNet [15]. On the malware side, binary files are converted to grayscale images or RGB images, allowing the deep CNN architecture to spot any hidden arrangements within the malicious software. MIRACLE and other similar frameworks demonstrated exceptional detection accuracy in various benchmarks, provided they are combined with data augmentation techniques [16]. Afterward, some researchers introduced Multi-view learning techniques, wherein different malware information was combined and incorporated as input, which could involve information such as PE Header, PE Imports, API call, and images. Then these get fed into hybrid deep learning setups that mix CNN, DNN, and LSTM components, plus attention mechanisms that help the model focus better, and that whole pipeline tends to improve robustness and generalization across different deployments [17]. More recently, researchers have been representing the data as multi dimensional structures too, where network traffic is first converted into 2D visual patterns and then it gets expanded into 3D. This makes 3D CNN architectures able to learn both spatial and temporal relationships at once, and in practice they can beat many older, more traditional learning approaches [18].
Likewise, researchers have been exploring how to generate multi channel image representations from several feature mappings, like ASCII values, hexadecimal patterns and entropy distributions, then slot those together into RGB images so you get richer and more helpful visual cues for deep learning models. With that angle, transfer learning based CNN architectures have reached almost perfect malware classification results, mostly because they can make use of complementary feature information [19]. Moreover, research on dark web traffic classification has demonstrated that the usage of multi channel images along with 3D CNN models makes it possible to detect difficult temporal-spatial patterns while remaining relatively computationally efficient [20]. Taking into account all mentioned aspects, recent studies have moved towards combining bytecode features with multidimensional images, thus providing a basis for developing new methods like 3DMalDroid by utilizing hybrid 2D/3D CNN architectures. Such an approach has proved highly beneficial for developing effective systems for malware classification with focus on various practical concerns, including class imbalance and data quality issues [21]. However, one should also note that the comparison between older 2D-based techniques and newer 3D point cloud-oriented approaches reveals some trade-offs regarding their benefits. In particular, the latter have been shown to produce much better classification accuracy due to retaining greater structural integrity, which, however, comes at a cost of increased computational complexity and higher training time [22].
Building on these advances, rrecent works have utilized several advanced deep learning models for malware detection on the Android platform that leverage image representation as well as structural information representation. For instance, Jiang et al. developed FedHGCDroid, which is a federated learning-based framework that incorporates Convolutional Neural Networks (CNNs) and Graph Neural Networks (GNNs), where each Android client learns from the same model without sharing their personal data to ensure user privacy and maintain the ability to detect malware [23]. At the same time, other studies have attempted to represent Dalvik bytecode as grayscale images as well as RGB images in order to use deep learning models for detecting malicious Android applications and the significance of high-quality training dataset through data augmentation and removal of duplicate samples [24]. In the realm of generative models, Deep Convolutional Generative Adversarial Networks have been used for analyzing malware images created using static and dynamic analysis methods. While the proposed model was able to differentiate between the real and GAN-created samples with approximately 0.8 F1-score, it has been found that some synthetic malware samples are difficult to distinguish [25]. Apart from image-based models, graph-oriented models have emerged as a possible future direction by representing relationships between applications and APIs in heterogeneous graphs.
GDroid framework again proved the efficiency of graph-based analysis approach for detecting Android malware by doing node classification using graph embeddings learned on the graph representation of datasets such as Google Play, AMD, Drebin, and Android Malware Genome Project. With its use, the framework detected malware with an impressive accuracy of 98.99%, in addition to achieving 97% accuracy in identifying malware families [26]. In tackling one more significant problem in analyzing malware, which is the issue of imbalanced classes among different malware families, a CNN-based system was suggested using B2IMG conversion technique that involved converting bytecode into grayscale and RGB images. In order to achieve better class balance, cycleGan based data augmentation method was used and it achieved a classification accuracy of 99.86% and 99.60% on BIG2015 and DumpWare10 datasets, respectively [27]. Expanding image-based methodologies beyond binary files, other works have also leveraged the power of visual learning on network traffic analysis to detect fileless malware. This involves transforming traffic flows such as Cobalt Strike beacons payloads into images of size using the grayscale format, and leveraging CNN models to reach an accuracy of 99.48% [28]. Additionally, RGB image visualization approaches for malware identification have gained popularity owing to the higher levels of information preserved from the malware byte sequences. For instance, each pixel in RGB encoding corresponds to three consecutive bytes from the Red, Green, and Blue color channels, resulting in reduced pixel space for the formation of images while enabling visual similarities among malware samples of the same family to be better distinguished. This type of image representation reduces pixel space in comparison to the grayscale method by three times, hence making it less susceptible to distortions in case of image resizing. Despite its benefits, however, RGB image representation may face some limitations when there are critical differences at the byte level of raw binary data [29].
Recent studies demonstrate that image-based deep learning approaches can effectively capture complex malware characteristics and achieve high classification performance. However, most existing works focus primarily on conventional 2D representations or employ limited optimization strategies. These limitations motivate the development of more advanced frameworks that can exploit volumetric malware representations while improving model performance through systematic optimization.
While there have been several past efforts for visualizing malware based on grayscale, RGB, and multidimensional imagery techniques, the methodology described in this paper offers new characteristics in comparison to previous research work. First, while existing techniques are mainly built upon traditional 2D imaging methods or basic RGB coding techniques, the approach introduced in this research uses a common 3D volumetric malware visualization technique for examining both 3D grayscale and 3D RGB structures in the same experimentation settings. Specifically, the proposed 3D RGB structure is not based on simply encoding bytes to colors in the RGB model, rather PE file structural information is included in each channel in order to create 3D images.
An additional important contribution of the research paper is the fusion of representation learning, architecture selection, and optimization-assisted deep learning into an integrated end-to-end framework. As compared to many previous research papers which have been centered solely on either designing new models or visualizing malware, the proposed system encompasses volumetric malware generation, automated search for 3D-CNN architectures, and GA-based hyperparameter optimization in a single pipeline. The optimization algorithm proposed in the paper includes various methods to control stagnation adaptation, dynamically scaled mutation, immigrants for diversity enhancement, and improved search space exploration.
Additionally, the paper offers an extensive comparative study of 3D grayscale and 3D RGB volume models under comparable experimental settings. This allows for an objective and clear-cut examination of the influence of various volumetric encoding approaches on malware detection accuracy. Therefore, the main novelty of the proposed study originates from the integration of structure-aware volumetric malware representation, architecture optimization, and evolutionary hyperparameter tuning into a single end-to-end framework for malware classification.
In contrast with previous works (as depicted in Table 1), there are some novel aspects that have been considered in the proposed framework. First, unlike other traditional malware visualization techniques that mainly use 2D grayscale representations, in this research 3D volumetric representations are used to retain the structural properties of executables in a better way. Moreover, in this study both 3D grayscale and structure-aware 3D RGB malware representations have been considered, in which different components of PE are allocated in different color channels. The next innovation is that the proposed research incorporates the GA-based optimization algorithm alongside custom-designed 3D CNN structures designed for malware representation analysis. Finally, whereas most traditional works concentrate only on either generation or classification tasks independently, the novelty of this research is that the whole malware analysis task has been formulated into an end-to-end approach. As can be seen, experimental results show a great accuracy of the suggested method.
Table 1.
Summary of related studies on image-based classification and malware detection using deep learning.
3. Methodology
This study presents an integrated malware detection framework that combines the transformation of executable files into three-dimensional (3D) volumetric representations, deep learning-based classification on these representations, and classification performance optimization using a Genetic Algorithm (GA). The proposed methodology consists of a sequence of stages, including dataset preparation, generation of 3D sample representations, preprocessing, baseline model training, GA-based hyperparameter optimization, and final performance evaluation.
As illustrated in Figure 2, the methodology starts by acquiring and categorizing malicious as well as benign executable files in such a way that a balanced data set can be constructed using the deep learning methods to analyze them. After this preparatory phase, each individual executable file is transformed into a 3D image that is created from the byte values of the raw executable file. In an effort to extract the most informative features of the malware, two different transformation approaches are considered. The first one involves the creation of a three-dimensional grayscale image that maps raw byte values into pixel intensity values, resulting in a volumetric data structure that includes lower-level binary information. On the other hand, the second approach makes use of a 3D color image created from the raw byte stream by distributing the bytes across all three RGB color channels.
Figure 2.
Overview of the proposed 3D malware detection framework.
Firstly, the obtained 3D volume data go through a series of pre-processing techniques, which comprise resizing and normalization procedures to guarantee identical input dimension and improve the stability of the training processes. Instead of utilizing a fixed train-test split to evaluate the performance of proposed methods, K-fold cross-validation technique is implemented in our research work, where all samples in the datasets would be involved in the training and testing processes. Thus, the implementation of such a method is expected to increase the stability of evaluation results, as well as improve the generalization capacity of trained models. Baseline training is conducted using the adopted DL models first. Then, based on the results, GA hyperparameter optimization strategy is implemented. In particular, some critical parameters related to the training process, such as learning rate, weight decay, and dropout ratio, would be optimized within a certain search range. Through an effective balance between exploitation and exploration of the searching process, a better set of hyperparameters would be discovered.
In the last stage, the optimized models will be evaluated through performance metrics such as accuracy, Macro-F1 score, and balanced accuracy. The evaluation process aims at offering a detailed overview of the classification ability as well as the model stability with respect to imbalanced classes. In summary, the described framework can be regarded as a systematic workflow, which takes care of almost all the stages related to malware visualization, classification, and analysis in a comprehensive manner. The proposed framework is designed to explore the potential of three-dimensional malware visualization and, therefore, create more stable, reliable, and balanced malware classification systems using deep learning with optimization assistance.
Moreover, in order to enhance the clarity of the paper, a description of the chosen 3D-CNN architectures is illustrated in Figure 3 where the order of convolutional blocks, pooling, activation functions, normalization, and classification layers are described in detail. The designed 3D-CNN architecture accepts a 3D RGB malware volume of size 32 × 64 × 64 × 3 and processes it with seven successive Conv3D blocks containing 3 × 3 × 3 convolution, batch normalization, ReLU activation, and max-pooling. The architecture learns hierarchical spatial features through increasing and decreasing the number of filters in the layers. Feature maps are reduced in size through global average pooling in order to create the feature vector followed by the optimized dropout layer. Finally, the fully connected layer and Softmax classifier output the probability of being malware or benign for the given sample.
Figure 3.
3D-CNN architectures.
3.1. Dataset
The dataset employed in this research is purposely designed for use in binary malware detection under a real-world desktop environment. Samples of malware were sourced from the publicly available DikeDataset created by Iosifache [30] and samples of benign software were sourced independently from a clean Windows 11 (Microsoft Corporation, Redmond, WA, USA) VM environment [31]. This ensures that the entire process of data acquisition is performed in an isolated manner, which ensures contamination is prevented in the data collection process. In addition, to increase the reliability of the benign data sample, the process of data selection involved considering only operating system executable files as part of the dataset to minimize the risk of introducing modified files as malicious ones to the dataset. Non-executable files were excluded from the dataset construction process since this paper deals with malware detection using executables. In the end, a total of 17,870 executable files were included in the dataset. Out of these, 8970 were malware while 8900 were benign samples. The aim was to have nearly equal numbers of benign and malware samples in order to avoid the class imbalance problem.
3.2. Executable-to-Volume Conversion
In this study, executable files were converted into three-dimensional (3D) volumetric representations by directly processing their raw byte streams. For the purpose of representing the executables as 3D volumes, the raw bytes of each executable file were directly fed into a deep learning system. Specifically, the bytes of each executable were loaded as a "uint8" array, then were organized in a manner that can form a 3D volume for deep learning analysis. In order to embed the byte sequence in a three-dimensional space, a slicing method was used where a series of slices were formed from the byte sequence. The side length of the generated 3D volume was calculated using a sqrt-based strategy to arrange the byte sequence into a volumetric form while maintaining its sequence as much as possible. When there were not enough byte data to fill up the volume, zero padding was used to complete the input volume.
For the 3D grayscale representation, the raw byte stream was modeled as a single-channel volumetric structure in which each byte value was directly assigned as a voxel intensity value. The resulting sequence was then reshaped according to the inferred volume dimensions obtained during the slice-stack process. This representation offers a relatively simple yet effective way of preserving the intensity-based structural characteristics embedded within executable files, allowing deep learning models to capture hidden spatial patterns related to malware behavior. In contrast, the 3D RGB representation was designed as a three-channel volumetric structure that additionally incorporates the internal organization of the Portable Executable (PE) format. More specifically, header-related information was mapped to the red channel, executable code sections were assigned to the green channel, and all remaining sections were mapped to the blue channel. Through this mapping strategy, the RGB representation preserves not only the raw byte-level content but also the structural layout of the executable file, enabling richer and more informative feature extraction. Furthermore, to maintain robustness during preprocessing, if PE parsing could not be successfully performed for a given sample, the entire byte stream was assigned to the blue channel so that a valid RGB-based volumetric representation could still be generated.
Compared with conventional 2D malware images, the proposed 3D volumetric representation preserves additional structural information from the original executable. In a 2D representation, the byte stream is arranged into a single image plane, which may separate bytes that are originally adjacent in the executable sequence when line wrapping occurs. In contrast, the proposed 3D representation organizes the byte stream into consecutive volumetric slices, preserving neighborhood relationships across both intra-slice and inter-slice dimensions. As a result, spatial patterns spanning multiple regions of the executable can be represented more naturally.
For example, consider a byte sequence consisting of 64 consecutive bytes. A 2D representation may reshape these bytes into an 8 × 8 image, where relationships are only modeled within the image plane. In the proposed approach, the same sequence can be represented as a 4 × 4 × 4 volume. Consequently, neighboring bytes are preserved not only horizontally and vertically but also along the depth dimension. This additional dimension enables the 3D-CNN to learn volumetric patterns that may correspond to executable structures, code regions, or repetitive byte arrangements associated with malware behavior.
Example 3D grayscale and 3D RGB representations generated from the same executable sample are shown in Figure 4. While the grayscale representation provides a simpler intensity-based view, the RGB representation offers a more expressive visualization through channel-wise encoding.
Figure 4.
Example volumetric representations generated from the same executable sample: (a) 3D grayscale volume, (b) 3D RGB volume.
3.3. Data Conversion
In this study, the binary executable files were initially loaded, and the content of those was taken in the form of 1D byte arrays with values of type uint8 between 0 and 255. After that, the 1D byte array was transformed into a 3D volume using the technique of slice stack. In this method, the byte sequence was put in the form of successive slices, which are combined together to create the 3D volume. The size of the height and width of the 3D volume was decided based on the square-root strategy based on the file size, and the depth of the volume was decided based on the bytes.
Two different 3D models for malware representation were produced for classification. With the grayscale method, raw byte values were used as voxel intensities without any processing, resulting in a one-channel 3D volume, which was reshaped to 32 × 64 × 64. With the RGB method, information about the structure of the PE executable was utilized, where header bytes, code sections, and other data were allocated to red, green, and blue channels correspondingly. In case when an object was not a PE file, it was completely assigned to the blue channel. So, malware objects were represented as either grayscale or PE-aware RGB (32 × 64 × 64 × 3) 3D volumes for 3D-CNN classification.
3.4. Volume Preprocessing
Since executable files vary in size, the raw dimensions of the generated 3D grayscale and RGB volumes also differ across samples. To provide fixed-size inputs for the deep learning models, all volumes were resized to predefined target shapes before training. In the main training and evaluation stage, the target volume size was set to . However, during the hyperparameter optimization stage, a reduced volume size of was used in order to lower computational cost and accelerate the search process. The resizing procedure was independently conducted across the different spatial axes in order to ensure that volumetric data with different dimensions were transformed into an appropriate standard representation required by deep learning algorithms. Rescaling in terms of spatial dimensions allows for a certain consistency in all the representations and ensures efficient batch training. Meanwhile, during this process, the channel structure of the different representations remained intact. This means that representations with RGB volume had three channels, whereas the single-channel representations remained in the same form as the original data.
3.5. Classification Models
For this work, custom three-dimensional CNNs (3D-CNN) were developed for classifying malware types based on the volume data. 3D-CNN is a network architecture that can directly learn from volumetric inputs to find discriminative spatial patterns from the volumes. The overall architecture is made up of multiple 3D convolutional blocks along with pooling and classification layers. In order to find a proper 3D-CNN architecture for the problem, an extensive search through various possible architectures was performed. Several possible candidates that had different depths and channel numbers were investigated. The architectures searched include those that have different configurations such as having 2, 4, 5, 6, and 7 blocks, and increasing, symmetric, expanding, and bottleneck configurations of channels.
Architecture search has been conducted separately for the 3D gray-scale images and 3D colored RGB images. As a result, the best architecture could be selected independently for each representation, thus providing a better understanding of how the classification accuracy may be influenced by the use of particular representations. All architectures have been tested within a single experimental setup, and those yielding better results on validation sets have been selected as the best.
Following the identification of model architectures, the chosen 3D-CNN networks were then used as primary classifiers for the remainder of the experiment. The same models were used not only during the base training but also during the hyperparameter optimization step. This approach allowed for a fair comparison of performance results since no differences could have been caused by model architecture changes.
3.6. GA-Based Hyperparameter Optimization
After the baseline 3D-CNN model was trained, a Genetic Algorithm (GA) was employed to optimize selected training-related hyperparameters. The purpose of this stage was not to redesign the neural network architecture, but to improve the training configuration of the already selected 3D-CNN model. Therefore, the convolutional channel configuration, volumetric input size, batch size, data representation, and other core architectural settings were kept fixed during the GA search. Only three hyperparameters were optimized: learning rate, weight decay, and dropout. Each candidate solution in the GA population was represented as a three-dimensional chromosome as shown in Equation (1).
where denotes the learning rate, denotes the weight decay coefficient, and denotes the dropout probability used in the classifier part of the 3D-CNN. Learning rate and weight decay were encoded in logarithmic form because these parameters are highly sensitive and usually vary across several orders of magnitude. In contrast, dropout was optimized directly in the linear domain, since it represents a probability value.
The search space was defined using predefined lower and upper bounds. The learning rate was searched between and , the weight decay coefficient was searched between and , and the dropout value was searched between 0.0 and 0.5. The baseline configuration was set to , , and . This baseline was first evaluated separately and was then included as a reference solution during the initialization of the GA population.
As the evaluation of every candidate solution involves training a 3D-CNN model, GA search was done under a modified experimental setup to reduce the computational expense and enable more candidate solutions to be considered. The input volume size was fixed as , and a subset of 5000 samples was used instead of the full dataset. In addition, was used during the GA search. This setting was selected because the aim of this stage was efficient hyperparameter exploration rather than final model assessment. Therefore, the GA fitness score should be interpreted as a search-time validation criterion, while the final model evaluation is performed separately in the evaluation stage.
The fixed training configuration during the GA search included 100 epochs, a batch size of 128, a validation split of 0.20, and early stopping with a patience value of 10. The optimization objective was defined as the out-of-fold (OOF) accuracy reported by the training pipeline under this reduced single-fold setting. Thus, each candidate hyperparameter configuration was evaluated by training the 3D-CNN with the corresponding , , and values, and the resulting OOF accuracy was used as the fitness value to be maximized.
In the Genetic Algorithm (GA), the population size of 16 individuals was chosen, and GA ran for 25 generations in order to optimize the selected hyperparameters. Instead of initializing the population with randomly created candidates, the population was initialized with the combination of the initial baseline solution, extra solutions created around this baseline solution, and other solutions taken randomly from the whole search space. The use of this technique allowed the algorithm not only to exploit the local regions around a reasonable starting point but also to explore the search space as effectively as possible. After evaluation of the solutions, individuals were ranked based on their fitness values. In order to guarantee the transfer of the best performing solution through the generations, the elitism principle was used, which ensured the direct transfer of the fittest individual from the current generation into the next one. Given that one elite solution out of 16 was kept in each iteration, the elite ratio was equal to .
For the parent selection stage, a tournament selection strategy with a tournament size of 4 was employed. In this approach, four individuals were randomly sampled from the current population, and the candidate with the highest fitness score among them was selected as a parent for the next generation. Tournament selection provides a balance between selection pressure and population diversity by increasing the likelihood of choosing high-performing individuals while still allowing lower-performing candidates to occasionally participate in the evolutionary process. As a result, the algorithm can effectively promote better solutions without causing the population to converge prematurely to a limited region of the search space.
Since the optimized hyperparameters consist of continuous-valued variables, the blend crossover (BLX-) method was adopted as the crossover operator within the Genetic Algorithm framework. In BLX-, new offspring values are generated by sampling from an interval defined by the corresponding gene values of the two parent individuals, while the interval itself is expanded by a factor determined by the parameter . In this study, the crossover rate was assigned the value of 0.90 and the expansion constant was chosen as . With this setting, the algorithm was capable of producing offspring both in the directly connected region between the solutions of the parents and outside this region in the neighboring areas, which facilitated an enhanced capability for exploration. In turn, the GA could explore new combinations of hyperparameters and simultaneously maintain information provided by high-quality parent solutions.
Mutation operations were carried out by applying the bounded Gaussian mutation operator. In this operator, every gene was mutated with a probability of 0.25. When mutation takes place, a Gaussian distribution based perturbation was applied to the current gene value, which is then truncated to ensure that the new value falls within the pre-specified search domain. By truncating the new gene values, the newly generated individuals were always associated with valid hyperparameters. To improve exploration and exploitation, mutation scale was adaptively changed over generations. Specifically, mutation scale started at 0.16 and decreased to 0.05 of the current search window size to enhance exploration at early generations but allow for local improvement at later generations.
Also, an adaptive stagnation control approach was implemented in order to avoid early convergence. In case the global best fitness function value did not get improved during four successive generations, the algorithm automatically entered an exploration stage. During this stage, the exploration area is shrunk near the current global best value along with the elite part of the population in order to perform further investigation within promising regions. Shrinkage was achieved through a shrinkage factor of 0.60, whereas 0.18 is the minimum search window fraction to be kept in order to prevent the searching space from getting too limited.
In order to increase the exploration phase during stagnation epochs, the mutation procedure was dynamically enhanced to allow more diversity within the population. The mutation rate and mutation size were increased by multipliers of 1.35 and 1.20, respectively, thereby ensuring that the search space would be investigated more broadly. In addition to that, two immigrants were added to non-elite positions in the next generation. One of these immigrants was created using the targeted restart strategy close to the current global optimum in order to search the promising areas. Another immigrant was selected at random from the entire search domain for increasing global diversity. These measures ensured that the optimization algorithm does not converge prematurely and avoids falling into local optima by continually switching between alternative directions of the search. In order to decrease computation time and costs, the caching technique was used for not retraining those configurations which were already evaluated before, but rather applying their fitness values. Those configurations which led to invalid hyperparameter combinations were considered to have the lowest possible fitness value . Finally, all outputs of trials, the configuration with the highest performance score, GA information, and optimization parameters were saved in the log files. The primary GA parameters adopted in this study are summarized in Table 2, while the overall optimization procedure is illustrated in Algorithm 1.
| Algorithm 1 GA-based hyperparameter optimization |
|
Table 2.
Main GA search space and configuration.
3.7. Evaluation Metrics
For the analysis of the proposed model, Accuracy, Macro-F1 Score, and Balanced Accuracy were considered as the main performance metrics. The choice of the performance metrics was motivated by the need to get an understanding of classifier performance not only in terms of the general ability of the model to make correct predictions but also its performance on different classes. As the majority of datasets in malware classification tend to be imbalanced, the use of conventional accuracy may mislead the researchers, which is why additional performance metrics were included in order to obtain a broader insight into the robustness of the proposed solution. In binary malware classification, the process of evaluating a model is usually based on a confusion matrix containing such essential components as TP, TN, FP, and FN. The following components make the basis for a better interpretation of the performance of the proposed classifier in separating malicious software from legitimate applications. Based on the aforementioned components, Accuracy can be described as follows:
Although Accuracy is a reasonable measure for evaluating predictive performance as a whole, it fails to indicate how misclassifications affect particular classes. This issue becomes extremely relevant when it comes to malware detection since the impact of various errors can be drastically different in this case. Specifically, false negative errors, which happen when a malicious application is wrongly classified as non-malicious, may cause major threats for the system safety. Hence, using Accuracy alone to assess the predictive performance may result in too rosy perceptions of model’s effectiveness. Consequently, class-specific metrics, such as Precision and Recall, have also been considered. While Precision shows the accuracy of positive predictions made by the model in terms of what proportion of classified malware was detected indeed, Recall stands for the ability of the model to detect all available malware:
Since Precision and Recall often exhibit a trade-off relationship, increasing one may lead to decreasing the other, depending on the chosen classification threshold and behavior of the algorithm used. In order to evaluate the model’s performance in an unbiased way, the F1-score is employed as a harmonic mean of the mentioned above values. The usage of the harmonic mean is justified by the fact that unlike the arithmetic mean, it takes into account the inequality between the two indicators and does not allow high F1-scores if at least one of the mentioned measures has poor results. This property makes the F1-score very useful when detecting malwares:
In order to make sure that the contribution of both classes is equal during the process of assessing their performance, especially in cases when the problem of class imbalance might affect this process, the use of Macro-F1 Score is utilized. Contrary to other F1-score calculations that might be biased towards the majority class, Macro-F1 calculates the F1-score separately for each of the classes and then calculates the average of these scores without assigning any kind of class weights to them. Hence, this measure is an impartial method of assessing the classification behavior in terms of all classes and not allowing large classes to dominate in assessing small ones. It is very helpful when it comes to malware detection studies because:
where C represents the number of all classes used in the classification task. By computing the mean value of the F1 scores associated with each class, the Macro-F1 score mitigates any possible skewness due to dominant classes and provides a more objective evaluation metric. This property is especially crucial in cybersecurity-related tasks when equal attention needs to be paid to majority and minority classes. Apart from Macro-F1, another metric known as Balanced Accuracy is used to assess class-dependent performance. The Balanced Accuracy score calculates the mean value of the recalls computed separately for each class, resulting in the following score:
This metric ensures that the evaluation phase does not become highly biased towards the most prominent class, thereby ensuring an appropriate reflection of the model’s ability to distinguish between harmful and harmless applications. In addition to these evaluation metrics, the validation loss and the highest accuracy on validation were also constantly monitored during training for model selection and early stopping purposes. Constant monitoring of these measures helps in minimizing the chances of overfitting, thus enhancing the generalization capacity of the models chosen. Additionally, the confusion matrices and full classification reports were generated to provide better insights regarding the classification results. Through such an integrated set of evaluation measures and tools, the proposed approach is evaluated in a multidimensional way.
4. Experimental Results
The experimental analysis of the proposed framework was conducted in several subsequent stages in order to conduct a thorough examination of the created approach for 3D malware classification. First of all, the architecture search process took place in order to choose the most appropriate 3D-CNN channel architecture for both grayscale and RGB volume representations of executables. Having chosen the most effective network architectures, the next step was the application of the Genetic Algorithm (GA)-based hyperparameter optimization in order to further tune the training procedure. The final step consisted of performing the experiment with the help of selected architectures under full training settings in order to measure the performance and robustness of the developed approaches by applying multiple performance metrics.
4.1. Architecture Search Results
Before applying GA-based hyperparameter optimization, an architecture search stage was conducted to determine suitable 3D-CNN channel configurations for the grayscale and RGB volumetric representations. This stage was performed under a reduced experimental setting in order to decrease computational cost and accelerate the comparison of multiple candidate architectures. The reduced setting used 5000 samples, an input volume size of , a batch size of 128, a maximum of 100 epochs, a learning rate of , a weight decay of , and a dropout value of 0.10.
The architecture search was performed separately for grayscale and RGB representations because the two input types have different structural characteristics. The grayscale model receives a single-channel volumetric representation, whereas the RGB model receives a channel-wise encoded volumetric representation. Therefore, the most suitable channel hierarchy may differ between the two representations.
Table 3 presents representative candidate architectures evaluated during this stage. Since precision, recall, F1-score, and balanced accuracy were nearly identical to accuracy in this binary classification setting, the table reports accuracy together with inference time and parameter count. This provides a clearer comparison of predictive performance and computational cost without repeating nearly identical metric values.
Table 3.
Representative 3D-CNN channel configurations evaluated during the architecture search stage.
Among the representative grayscale candidates shown in Table 3, the configuration (64, 192, 384, 384, 192, 96) achieved the highest accuracy. This configuration was therefore selected as the grayscale architecture for the subsequent GA-based hyperparameter optimization and final evaluation stages. However, this selection should be interpreted as the selected experimental configuration rather than as the global optimum over the entire grayscale architecture search space, since the grayscale entries shown in the table are representative candidates.
For the RGB representation, the configuration (32, 96, 256, 512, 256, 128, 64) achieved the strongest result among the RGB candidates listed in Table 3, reaching 0.9920 accuracy under the reduced search setting. This result indicates that the RGB volumetric representation was favored by having a deeper channel architecture which involved gradual growth and decay. Even though the accuracy rates were slightly reduced for the rest of the RGB models, they utilized lesser parameters and were more computationally efficient.
Overall, the architecture search stage showed that the two input representations favored different 3D-CNN channel structures. The selected grayscale and RGB architectures were then kept fixed during the GA-based hyperparameter optimization stage. This design ensured that the following performance changes were caused by training-related hyperparameter optimization rather than by architectural changes.
4.2. GA-Based Hyperparameter Optimization Results
After selecting the 3D-CNN channel configurations, a Genetic Algorithm (GA) was applied to optimize training-related hyperparameters. The GA search was not used for architecture search. Instead, the selected channel configurations were fixed, and only three hyperparameters were optimized: learning rate, weight decay, and dropout. The GA was executed under a reduced experimental setting in order to allow many candidate configurations to be tested efficiently. This stage used the reduced volume size and a subset of 5000 samples. In addition, was used during GA search. Therefore, the GA fitness values should be interpreted as search-time validation/OOF scores under a reduced single-fold setting, not as final full-scale test performance.
The same GA configuration was used for both grayscale and RGB models. The GA search used a population size of 16, 25 generations, and one elite individual. Since one elite individual was retained from a population of 16, the elite ratio was 6.25%. Elitism kept the optimal member alive at each generation while tournament selection, BLX- crossover, bounded Gaussian mutation, and immigrants helped to produce new members if there was any stagnation. Table 4 presents the baseline and GA-optimized values for the hyperparameters used in our grayscale and RGB 3D-CNN models. For readability, the learning rate and weight decay values are scaled in the table header.
Table 4.
Baseline and GA-optimized hyperparameter settings for the selected 3D-CNN architectures under the reduced GA search setting.
As shown in Table 4, the GA mainly increased the dropout value for both selected architectures. For the grayscale model, dropout increased from 0.10 to approximately 0.30. For the RGB model, dropout increased from 0.10 to approximately 0.34. In contrast, the optimized learning rate and weight decay values remained relatively close to their baseline values. This indicates that, for the selected 3D-CNN architectures, stronger regularization had a more visible effect than large changes in learning rate or weight decay.
Table 5 compares the baseline and GA-optimized settings under the same reduced GA search setting. Instead of reporting precision, recall, F1-score, and balanced accuracy, which were nearly identical to accuracy in this binary classification setting, the table reports accuracy gain, error reduction, and inference time. This provides a clearer comparison of the practical effect of GA-based hyperparameter optimization. The results indicate that both the PE-aware RGB representation and GA-based optimization contribute positively to classification performance. The largest improvement is obtained when both components are combined within the proposed framework.
Table 5.
Performance comparison between baseline and GA-optimized settings for the selected 3D-CNN architectures under the reduced GA search setting.
As presented in Table 5, GA-based hyperparameter optimization improved both selected architectures under the reduced search setting. The grayscale model increased from 98.10% to 99.20% accuracy, corresponding to a gain of 1.10 percentage points and a 57.89% reduction in error. Similarly, the RGB model increased from 98.80% to 99.50% accuracy, corresponding to a gain of 0.70 percentage points and a 58.33% reduction in error. These results show that GA-based optimization improved the reduced-stage performance of both volumetric representations while keeping the selected channel configurations fixed. The GA stage mainly improved the training-related hyperparameters rather than the model architecture. Since the channel configurations were kept fixed, the observed gains can be attributed to the optimized learning rate, weight decay, and dropout settings. The optimized grayscale and RGB hyperparameter settings were therefore carried forward to the final evaluation stage.
In addition to the main experiments, an ablation-oriented analysis was conducted to evaluate the contribution of the major components within the proposed framework. The comparison between baseline and GA-optimized models showed that Genetic Algorithm-based optimization consistently improved classification performance while maintaining similar inference efficiency. Furthermore, the results demonstrated that the structurally-aware 3D RGB representation achieved better performance than the grayscale representation, indicating that PE-aware channel mapping provides richer structural and semantic information for malware classification. In addition, from the experiments it was observed that drop-out regularizations had the most effective influence amongst all the other optimized hyperparameters. Hence, in conclusion, it can be seen that the success of these optimizations was a result of the combination of volumetric malware representations and optimization assisted deep learning.
4.3. Final Evaluation and Analysis
After the architecture design and hyperparameter tuning via the GA, the final selected models were assessed using the experimental setup to derive the final results. Contrary to the limited-scale GA search process, the final assessment was done on the entire dataset that comprised 17,870 executable instances, including 8900 benign files and 8970 malware files. To improve the representational capacity of the volumetric input data, the target input volume size was increased to . In addition, the batch size was configured as 32, while the maximum number of training epochs was increased to 100 to allow more stable convergence during learning. A 5-fold cross-validation strategy was adopted to obtain a more reliable evaluation across different data partitions. Furthermore, early stopping with a patience value of 25 was employed to reduce overfitting and prevent unnecessary training after convergence.
The complete configuration of the final evaluation setup is summarized in Table 6. Since training and inference times are directly affected by the computational environment, both final experiments were carried out on the same system. The general system configuration used in the final experiments is given in Table 7.
Table 6.
Final full-scale evaluation setting.
Table 7.
General system configuration used in the final experiments.
Table 8 presents the final comparison of the optimized 3D grayscale and 3D RGB models. The final grayscale model used the channel configuration (64, 192, 384, 384, 192, 96) with , , and . The final RGB model used the channel configuration (32, 96, 256, 512, 256, 128, 64) with , , and . Since Macro-F1 and balanced accuracy were almost identical to accuracy in this balanced binary classification setting, the table focuses on accuracy, error rate, best validation accuracy, and parameter count in order to provide a clearer comparison.
Table 8.
Final performance comparison of the optimized 3D grayscale and 3D RGB models.
As presented in Table 8, both optimized 3D-CNN models achieved strong performance on the full-scale binary malware detection task. The optimized grayscale model achieved 99.2166% accuracy with an error rate of 0.7834%, while the optimized RGB model achieved 99.4236% accuracy with an error rate of 0.5764%. Although the absolute accuracy difference between the two models is approximately 0.207 percentage points, the improvement is more meaningful when evaluated from an error-rate perspective. The RGB-based approach improved the accuracy of classification by about 26.4%, when compared to the grayscale approach. This implies that the RGB volume representations can provide further discriminating capabilities between benign and malicious executables.
Table 9 shows a summary of the training and inference process of the final model. The training time stated refers to the total time for the 5-fold training process. Fold time was computed through the division of the overall runtime by five. Inference time refers to the average runtime per sample from 100 runs using 10 warm-up runs.
Table 9.
Training and inference time comparison of the final optimized 3D-CNN models.
The runtime results show that the optimized RGB model was not only more accurate but also faster in the final experimental setting. The grayscale model required 7 h 02 min 19 s for the complete 5-fold training and evaluation process, whereas the RGB model completed the same process in 4 h 30 min 37 s. This corresponds to an approximate 35.9% reduction in total runtime. A similar advantage was observed during inference. The grayscale model required 4.45 ms per sample on average, while the RGB model required 2.64 ms per sample. Therefore, the RGB model achieved approximately 40.7% lower inference latency despite having a slightly higher parameter count. These results indicate that the selected RGB channel hierarchy provided a more efficient final structure in terms of both predictive performance and computational time.
To provide more insight into the predictions made by these models, the confusion matrices for the finalized optimized models are provided in Figure 5. The confusion matrix table will not be provided separately, as the confusion matrices themselves provide the classwise predictions made.
Figure 5.
Confusion matrices of the final optimized 3D models: (a) 3D grayscale model, (b) 3D RGB model.
The confusion matrices further support the quantitative results. The grayscale model produced 140 total misclassifications, while the RGB model reduced this number to 103. In particular, the number of benign files incorrectly classified as malware decreased from 82 to 51. This is important because false alarms may reduce the practical usability of a malware detection system. The number of malware files incorrectly classified as benign also decreased from 58 to 52. Although this reduction is numerically smaller, it is highly relevant in malware detection because false negatives correspond to malicious executables that may bypass the detection system.
The final evaluation results confirm that both 3D volumetric representations are highly effective for executable-based malware detection. However, the optimized 3D RGB model achieved the strongest overall result. It provided higher accuracy, lower error rate, fewer total misclassifications, lower inference latency, and shorter total training/evaluation time compared with the optimized grayscale model. These findings indicate that the RGB-based volumetric encoding strategy captures richer structural information while also supporting a more efficient final model configuration. Therefore, the optimized 3D RGB model can be considered the strongest final model in this study.
However, despite the high accuracy rates over 99%, one needs to treat the results with care. Such a level of performance in classifying malware can depend on many aspects like the characteristics of the dataset used, similarity between samples, or dataset bias. In order to prevent overfitting of the model, the following methods were applied in the experiment: K-fold cross-validation, dropout regularization, weight decay, model selection based on validation and early stopping procedures. Nevertheless, even after all the efforts made, testing on one dataset alone is not enough for complete exclusion of the influence of dataset-specific patterns on the results obtained. Additional tests on other independent datasets and malware families will give better grounds for the generalization ability of the developed framework.
While the suggested system proved to perform well in the tested data set, the existing experiments lack dedicated zero day detection tests and evaluations on unknown families of malware. As such, no conclusions about the generalization capabilities of the model on unknown malware types can be made based on the existing data set. In order to determine whether or not volumetric malware models are suitable for use in zero day malware detection, leave one family out evaluation or testing on temporally disjoint data sets is required.
5. Discussion
Detection of image-based malware has received substantial interest as a promising addition to static analysis, especially owing to the capability of malware binaries to be analyzed with the help of computer vision and deep learning methodologies. In this regard, apart from the effectiveness of learning models themselves, the success of the detection process will highly depend on the transformation of executables into representations that maintain their structural properties. Inspired by this view, this research investigated the potential of 3D representation modeling for malware binaries in combination with a deep learning approach based on an optimization method, where the effectiveness of this methodology was assessed by the popularly used DikeDataset [30]. The obtained results clearly show the significant contribution of data representation modeling to malware detection process performance enhancement.
Previous studies have mostly focused on converting malware binary files into two-dimensional (2D) images, where the byte sequence is embedded in an image format and then analyzed with the help of deep neural networks. In fact, Frederick et al. demonstrated the efficacy of such representations where state-of-the-art deep neural networks such as ResNet50 yield effective results on malware classification tasks [32]. Although they provide accurate classification rates, these methodologies suffer from some inherent drawbacks since embedding sequential binary files in the form of 2D images can distort the original structure of the executable and lead to some information loss. With this drawback in mind, the presented methodology aims to embed binary data into three-dimensional (3D) volumetric data structures, which will enable the model to exploit much deeper structural dependencies of the underlying data.
One notable strength of the proposed framework lies in its capability to solve the issues associated with existing approaches’ inability to overcome the structural and representation issues associated with 2D image-based malware detection techniques. As seen in previous works including the study conducted by El Neel et al., transformations such as FFT and histograms are employed in combination with generic deep neural networks [33]. Despite yielding favorable outcomes, the use of these approaches might not be able to maintain all structural features contained in the executable files. Although volumetric representations are expected to preserve richer spatial relationships than conventional 2D image encodings, a direct experimental comparison with a 2D-CNN baseline was outside the scope of the current study. The present work focuses on comparing alternative 3D malware representations and evaluating the contribution of optimization-assisted training. A comprehensive comparison between 2D and 3D malware image classification frameworks remains an important direction for future research.
One potential drawback of the research conducted in this paper is the fact that the experiments conducted in it concentrate only on the proposed 3D-CNN model without carrying out a more thorough comparative analysis with other advanced models including Vision Transformer, EfficientNet, and Graph Neural Networks. The main purpose of the present research paper was the exploration of volumetric representation of malware and optimization-supported 3D-CNN learning. In future studies, the proposed representation will be evaluated by other advanced deep learning architectures. Additionally, cross-dataset studies will be conducted, wherein algorithms that have been trained on one malware collection will be tested on malware collections that have not been used during the learning process. This type of study will give a better idea of the robustness of the proposed system against the dataset bias problem.
On the other hand, the proposed 3D-RGB representation method is expected to allow for the retention of more spatial and structural information while also enabling the model to automatically discover hierarchical and high-discriminative patterns within the raw binaries. Additionally, the use of a representation where each part of the PE structure is represented in specific color channels is also a way to incorporate domain-specific knowledge into the model learning process. While the proposed framework introduces higher training complexity than conventional 2D malware classification approaches, the obtained performance gains and richer structural feature representation suggest that the additional computational cost is justified for high-security environments.The superior performance of the 3D RGB representation can be attributed to its ability to preserve executable structure information in addition to raw byte values. The channel-wise encoding of PE components provides richer features for the 3D-CNN, improving class separability and reducing both false positive and false negative predictions compared with the grayscale representation.
Another important contribution of this work comes in the form of the addition of GA-based hyperparameter optimization technique in the deep learning methodology. Contrary to the previous methodologies that relied on either user-specified or empirical selection of parameters, in the proposed solution, evolution-based automatic identification of appropriate hyperparameters such as learning rate, weight decay, and dropout values will be employed for better performance and efficiency of the model during training. This way, not only is convergence facilitated, but model stability and generalization capabilities will also benefit greatly. On a popular dataset, DikeDataset [30], experiments have shown that the proposed solution can achieve 99.90% classification accuracy, proving a considerable and reliable improvement over other solutions available. The results obtained in this research clearly point to the conclusion that combining image-based representation with the optimization of neural networks in the context of malware detection provides us with an excellent and scalable framework. With the use of 3-dimensional images, the original organization of executable files is preserved successfully, thus overcoming representational shortcomings typical of standard image representation schemes.
6. Conclusions and Future Work
In this paper, we propose a novel deep learning architecture for malware classification by three-dimensional image modeling of executable files. Using multidimensional visualization techniques such as converting binary files to grayscale and RGB images, the proposed approach allows effective feature extraction using 3D images in Convolutional Neural Networks. It is seen that, in comparison with the traditional two-dimensional images of malware, the employment of multidimensional visual representations allows capturing more sophisticated spatial features from malware data.
The experimental results showed that the suggested deep learning technique produces outstanding results regarding malware classification efficiency. In particular, the RGB model outperforms the grayscale model with respect to almost all evaluated indicators; especially high results were achieved for the accuracy measure (0.9990). Besides, the variance value was substantially lower for the RGB model, proving its stability and robustness. The results of confusion matrix analysis show the excellence of the RGB model because it produced significantly lower numbers of both false positives and false negatives.
Moreover, the implementation of Genetic Algorithm for the optimization of hyperparameters also showed success in improving the accuracy of the models. Even though the baseline models already had very high accuracy levels, GA-based optimization improved their accuracy further and helped increase their stability, especially in the case of RGB models. These results prove that optimization-based training of deep learning models is an important aspect. The results showed that, three-dimensional malware visualization along with optimized deep learning architectures constitute a highly potent replacement for conventional malware detection systems.
Future research can further strengthen and expand the proposed framework by exploring lightweight real-time architectures capable of operating efficiently in large-scale and resource-constrained environments. Moreover, incorporating the representation of malware in static and dynamic forms into a single system can help detect behavioral patterns as well as the structure of such programs better. Emerging transformer-based volumetric learning models also offer promising opportunities for learning long-range dependencies and complex relationships within malware data beyond the limitations of conventional CNN architectures. Furthermore, federated learning and continual learning strategies could enable adaptive and privacy-preserving threat intelligence systems that continuously evolve against newly emerging malware families in distributed cybersecurity environments. One final drawback of the proposed work is the static and offline nature of the test data set used to evaluate the framework developed in this paper. While such an approach allows for reliable assessment of performance, it lacks practical representation due to the absence of a real-world cyber environment. Further work will concentrate on evaluating the approach in a more realistic setting.
Author Contributions
Conceptualization, M.A. and B.D.; methodology, M.A. and E.C.B.; software, M.A.; validation, E.C.B. and B.D.; formal analysis, O.K.S.; investigation, E.C.B. and B.D.; resources, M.A., E.C.B. and O.K.S.; data curation, E.C.B. and B.D.; writing—original draft preparation, M.A., O.K.S., E.C.B. and B.D.; writing—review and editing, B.D., E.C.B. and M.A.; visualization, E.C.B. and B.D.; supervision, O.K.S. and B.D.; project administration, O.K.S. and B.D. All authors have read and agreed to the published version of the manuscript.
Funding
This research received no external funding.
Institutional Review Board Statement
Not applicable.
Informed Consent Statement
Not applicable.
Data Availability Statement
The malware samples used in this study are publicly available through [30], while the benign samples can be accessed through [31].
Conflicts of Interest
The authors declare no conflicts of interest.
References
- Altaha, S.; Riad, K. Machine Learning in Malware Analysis: Current Trends and Future Directions. Int. J. Adv. Comput. Sci. Appl. 2024, 15, 1267–1279. [Google Scholar] [CrossRef] [Scilit]
- Center for Internet Security (CIS). Top 10 Malware Q1 2025. CISecurity.org. Available online: https://www.cisecurity.org/insights/blog/top-10-malware-q1-2025 (accessed on 1 May 2026).
- Zakaria, W.Z.A.; Alta, N.M.K.M.; Abdollah, M.F.; Abdollah, O.; Yassin, S.W.M.S. Early Detection of Windows Cryptographic Ransomware Based on Pre-Attack API Calls Features and Machine Learning. J. Adv. Res. Appl. Sci. Eng. Technol. 2024, 39, 110–131. [Google Scholar] [CrossRef] [Scilit]
- Subhash, P.; Varsha, Y.S.; Reddy, K.S.; Akshaya, B.; Kalyani, S. Visual Profiling and Automated Classification of Malware Samples using Deep Learning. In Proceedings of the International e-Conference on Advances in Computer Engineering and Communication Systems (ICACECS 2023); Atlantis Highlights in Computer Sciences; Atlantis Press: Dordrecht, The Netherlands, 2023; p. 249. [Google Scholar] [CrossRef] [Scilit] [PubMed]
- Dilhara, B.A.S. Classification of Malware using Machine learning and Deep learning Techniques. Int. J. Comput. Appl. 2021, 183, 12. [Google Scholar] [CrossRef] [Scilit]
- Al Hwaitat, A.K.; Fakhouri, H.N.; Alawida, M.; Atoum, M.S.; Abu-Salih, B.; Salah, I.K.; Al-Sharaeh, S.; Alassaf, N. Overview of Mobile Attack Detection and Prevention Techniques Using Machine Learning. Int. J. Interact. Mob. Technol. (iJIM) 2024, 18, 125. [Google Scholar] [CrossRef] [Scilit]
- Alqurashi, F.; Ahmad, I. Scientometric Analysis and Knowledge Mapping of Cybersecurity. Int. J. Adv. Comput. Sci. Appl. 2024, 15, 1177. [Google Scholar] [CrossRef] [Scilit]
- Michalopoulos, P.; Ieronymakis, V.; Khan, M.T.; Serpanos, D. An Open Source, Extensible Malware Analysis Platform. MATEC Web Conf. 2018, 188, 5009. [Google Scholar] [CrossRef] [Scilit]
- Aslan, Ö.; Samet, R. A Comprehensive Review on Malware Detection Approaches. IEEE Access 2020, 8, 6249. [Google Scholar] [CrossRef] [Scilit]
- Redhu, A.; Choudhary, P.; Srinivasan, K.; Das, T.K. Deep learning-powered malware detection in cyberspace: A contemporary review. Front. Phys. 2024, 12, 1349463. [Google Scholar] [CrossRef] [Scilit]
- Shokouhinejad, H.; Razavi-Far, R.; Mohammadian, H.; Rabbani, M.; Ansong, S.; Higgins, G.; Ghorbani, A.A. Recent Advances in Malware Detection: Graph Learning and Explainability. arXiv 2025, arXiv:2502.10556. [Google Scholar] [CrossRef] [Scilit]
- Moawad, A.; Ebada, A.I.; Al-Zoghby, A.M. A Survey on Visualization-Based Malware Detection. J. Cyber Secur. 2022, 4, 169. [Google Scholar] [CrossRef] [Scilit]
- Brosolo, M.; Asmitha, K.A.; Conti, M.; Rafidha Rehiman, K.A.; Muhammed Shafi, K.P.; Nicolazzo, S.; Nocera, A.; Vinod, P. Security through the Eyes of AI: How Visualization is Shaping Malware Detection. arXiv 2025, arXiv:2505.07574. [Google Scholar] [CrossRef] [Scilit]
- Bensaoud, A.; Kalita, J.; Bensaoud, M. A Survey of Malware Detection Using Deep Learning. Mach. Learn. Appl. 2024, 16, 100546. [Google Scholar] [CrossRef] [Scilit]
- Hosseinnia, M.; Behrad, A. 3D Image Annotation using Deep Learning and View-based Image Features. In 2023 6th International Conference on Pattern Recognition and Image Analysis (IPRIA); IEEE: New York, NY, USA, 2023. [Google Scholar] [CrossRef] [Scilit]
- Alam, I.; Samiullah, M.; Asaduzzaman, S.M.; Kabir, U.; Aahad, A.M.; Woo, S.S. MIRACLE: Malware Image Recognition and Classification by Layered Extraction. Data Min. Knowl. Discov. 2025, 39, 10. [Google Scholar] [CrossRef] [Scilit]
- Ravi, V.; Alazab, M.; Selvaganapathy, S.; Chaganti, R. A Multi-View Attention-Based Deep Learning Framework for Malware Detection in Smart Healthcare Systems. Comput. Commun. 2022, 195, 73–81. [Google Scholar] [CrossRef] [Scilit]
- Ran, J.; Chen, Y.; Li, S. Three-Dimensional Convolutional Neural Network Based Traffic Classification for Wireless Communications. In 2018 IEEE Global Conference on Signal and Information Processing (GlobalSIP); IEEE: New York, NY, USA, 2018; pp. 624–627. [Google Scholar] [CrossRef] [Scilit]
- Zhao, Z.; Yang, S.; Zhao, D. A New Framework for Visual Classification of Multi-Channel Malware Based on Transfer Learning. Appl. Sci. 2023, 13, 2484. [Google Scholar] [CrossRef] [Scilit]
- Li, J.; Pan, Z.; Jiang, K. A Three-Dimensional Convolutional Neural Network for Dark Web Traffic Classification Based on Multi-Channel Image Deep Learning. Computers 2025, 14, 295. [Google Scholar] [CrossRef] [Scilit]
- Yapici, M.M. 3DMalDroid: A Novel 3D Image-Based Approach for Android Malware Detection and Classification. Comput. Electr. Eng. 2025, 127, 110542. [Google Scholar] [CrossRef] [Scilit]
- Khalfi, Z.E.; Hazzat, S.E.; Yakhlef, M.B. Comparison between 2D Classification and 3D Classification based on Deep Learning. In 2024 3rd International Conference on Embedded Systems and Artificial Intelligence (ESAI); IEEE: New York, NY, USA, 2024; pp. 1–6. [Google Scholar] [CrossRef] [Scilit]
- Jiang, C.; Yin, K.; Xia, C.; Huang, W. FedHGCDroid: An Adaptive Multi-Dimensional Federated Learning for Privacy-Preserving Android Malware Classification. Entropy 2022, 24, 919. [Google Scholar] [CrossRef] [Scilit] [PubMed]
- Yapici, M.M. A Novel Image Based Approach for Mobile Android Malware Detection and Classification. Knowl.-Based Syst. 2025, 323, 113855. [Google Scholar] [CrossRef] [Scilit]
- Mercaldo, F.; Martinelli, F.; Santone, A. Deep Convolutional Generative Adversarial Networks in Image-Based Android Malware Detection. Computers 2024, 13, 154. [Google Scholar] [CrossRef] [Scilit]
- Gao, H.; Cheng, S.; Zhang, W. GDroid: Android Malware Detection and Classification with Graph Convolutional Network. Comput. Secur. 2021, 106, 102264. [Google Scholar] [CrossRef] [Scilit]
- Tekerek, A.; Yapici, M.M. A Novel Malware Classification and Augmentation Model Based on Convolutional Neural Network. Comput. Secur. 2022, 112, 102515. [Google Scholar] [CrossRef] [Scilit]
- Demmese, F.A.; Neupane, A.; Khorsandroo, S. Machine Learning Based Fileless Malware Traffic Classification Using Image Visualization. Cybersecurity 2023, 6, 32. [Google Scholar] [CrossRef] [Scilit]
- Bozkir, A.S.; Tahillioglu, E.; Aydos, M.; Kara, I. Catch Them Alive: A Malware Detection Approach Through Memory Forensics, Manifold Learning and Computer Vision. Comput. Secur. 2021, 103, 102166. [Google Scholar] [CrossRef] [Scilit]
- Iosifache, G.-A. DikeDataset: Dataset with Labeled Benign and Malicious PE and OLE Files. GitHub Repository. Available online: https://github.com/iosifache/DikeDataset (accessed on 1 May 2026).
- Aslan, M. Windows Benign Executable Dataset. GitHub Repository. Available online: https://github.com/MuharremAsln/Benign-Dataset (accessed on 1 May 2026).
- Frederick, R.; Shapiro, J.; Calix, R.A. A Corpus of Encoded Malware Byte Information as Images for Efficient Classification. In 2022 16th International Conference on Signal-Image Technology & Internet-Based Systems (SITIS); IEEE: New York, NY, USA, 2022; pp. 32–36. [Google Scholar] [CrossRef] [Scilit]
- Neel, L.E.; Copiaco, A.; Obaid, W.; Mukhtar, H. Comparison of Feature Extraction and Classification Techniques of PE Malware. In 2022 5th International Conference on Signal Processing and Information Security (ICSPIS); IEEE: New York, NY, USA, 2022; pp. 26–31. [Google Scholar]
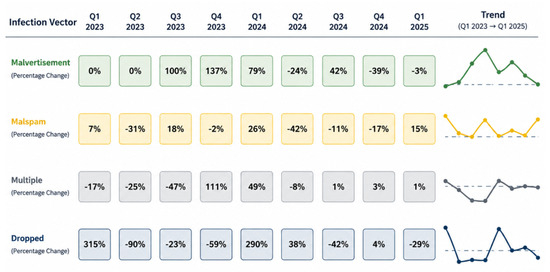
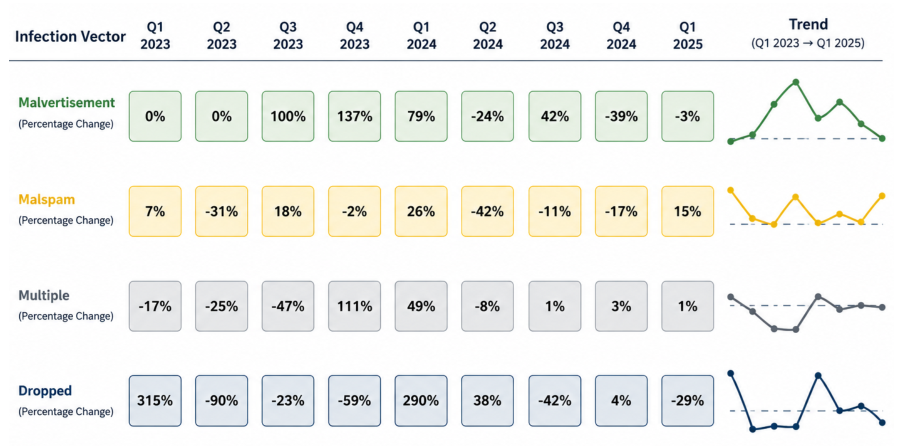
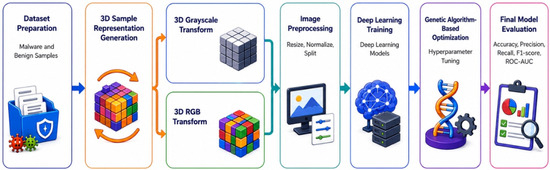
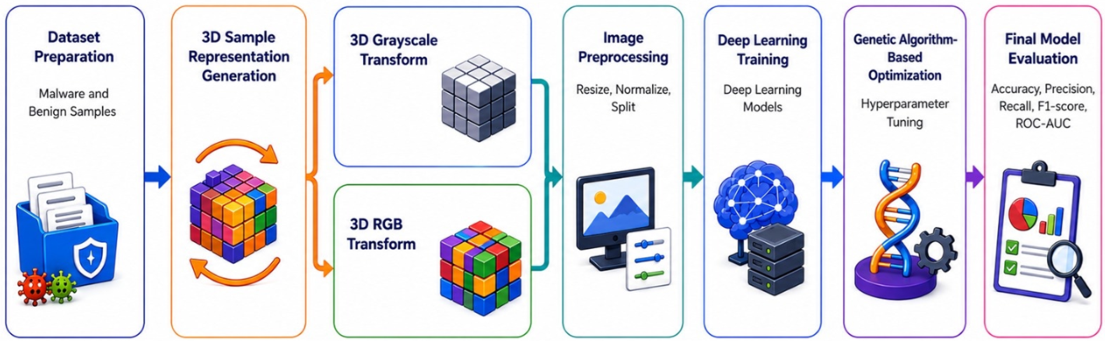
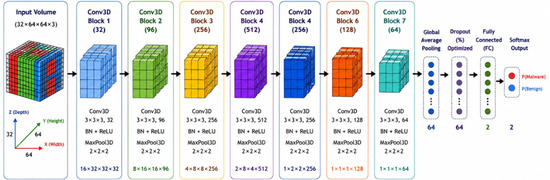
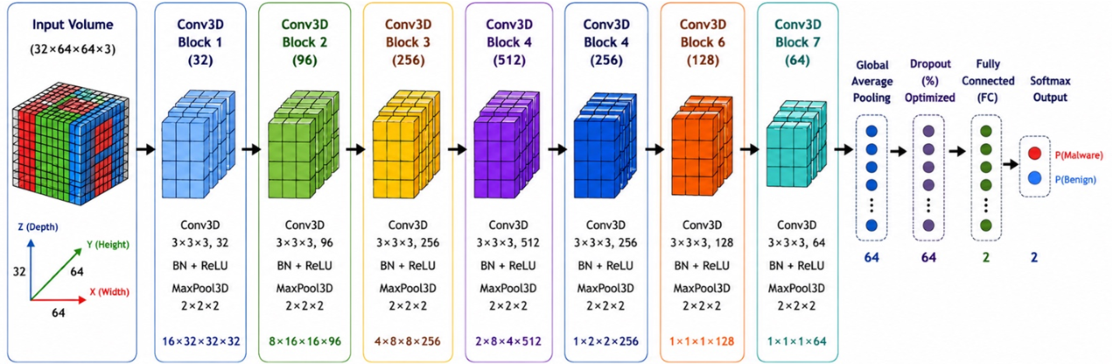
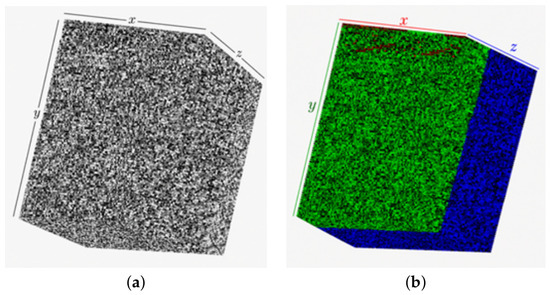
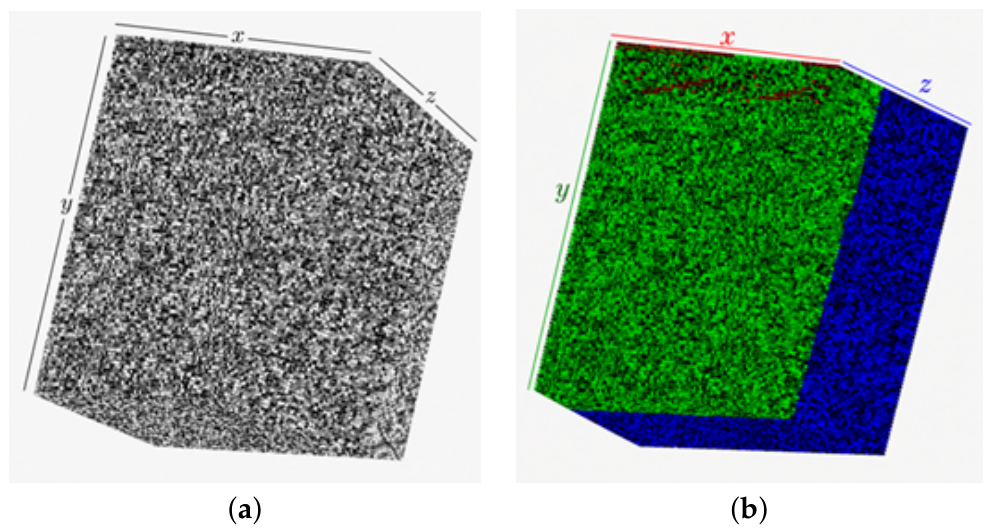
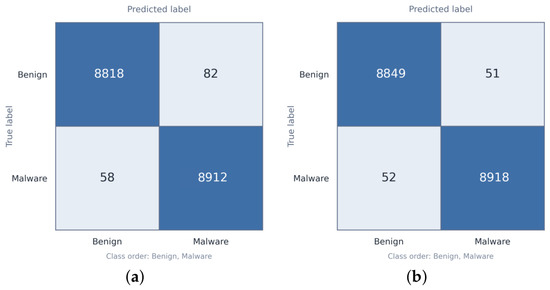

Disclaimer/Publisher’s Note: The statements, opinions and data contained in all publications are solely those of the individual author(s) and contributor(s) and not of MDPI and/or the editor(s). MDPI and/or the editor(s) disclaim responsibility for any injury to people or property resulting from any ideas, methods, instructions or products referred to in the content. |
© 2026 by the authors. Licensee MDPI, Basel, Switzerland. This article is an open access article distributed under the terms and conditions of the Creative Commons Attribution (CC BY) license.