


Abstract
Particle accelerators are complex facilities that collide particles at extreme high speed, aiming to discover new physics. In this context, high-energy calorimeter systems play a crucial role, as they provide the particle energy quantity, which is important information for the potential new discoveries. Therefore, this work evaluates the performance of the commonly used Optimal Filter (OF) method and several Convolutional Neural Network (CNN) architectures in reconstructing the amplitude and phase of simulated signals that represent the response pulses produced by high-energy calorimeters. The comparison is conducted using quantitative metrics—including RMS, MAE, MedAE, and Coefficient of Determination. The results show that different CNN architectures exhibit varying performances depending on the calorimeter cell occupancy rate but generally outperform the typical linear OF method, providing more accurate signal reconstructions. Considering all evaluated occupancy levels (10%, 50%, 80%, and 100%), the CNN-based approaches achieved an average improvement of approximately 79% in amplitude RMS and 62% in amplitude standard deviation when compared to the OF method. For phase estimation, the CNNs achieved improvements of approximately 26% for both RMS and standard deviation metrics. Although the proposed strategy requires a large execution time due to the training process across multiple folds, these findings indicate that CNNs are promising alternatives for calorimeter energy reconstruction, particularly in high-occupancy conditions such as those expected for high-luminosity experiments.
1. Introduction
In high-energy physics, parameter estimation plays a fundamental role in the analysis of phenomena resulting from particle collisions [1], forming the basis for the reconstruction of physical quantities and for the efficient operation of trigger systems under high-event-rate conditions [2,3,4]. These computational procedures enable the identification of relevant signals amid the large volume of data produced in modern accelerators [5], as extensively discussed in classical works on fast electronics and detection techniques in particle physics [6,7,8]. This ability to achieve precise signal reconstruction and triggering is essential both for the search for new particles and for the experimental validation of fundamental physics models [9].
In this sense, calorimeter systems play a central role in this process. In large-scale experiments, they are highly segmented detection systems designed to measure the energy deposited by particles through electromagnetic or hadronic cascades that develop across alternating layers of active and absorptive materials [10]. These detectors provide extremely fast responses and detailed energy-deposition profiles, not only enabling high-resolution measurements of energy and position but also supporting the efficient operation of online trigger systems [6,11,12,13].
The way signals from calorimeters are sampled depends directly on both the detector type and the operational regime, as well as on the properties of the incident particles [14]. Consequently, the application of robust digital filtering methods becomes indispensable to mitigate contributions from electronic noise, intrinsic material fluctuations, or nonlinear effects, ensuring faithful reconstruction of the physical parameters extracted from each event [15]. In current experiments, the extremely high data rates require techniques capable of discriminating signal and noise in near-real time. Such trigger systems rely on the information provided by the calorimeter systems where the energy from each readout cell is reconstructed [16]. In this context, classical processing approaches and modern deep-learning-based methods have been increasingly explored to optimize calorimeter energy reconstruction [17,18].
Among linear methods, the Wiener Filter has been investigated as an alternative to the Optimal Filter, demonstrating improvements of up to 35% in energy estimation uncertainty under high pile-up conditions in the ATLAS Tile Calorimeter [19]. A deconvolution-based estimator was also proposed as a luminosity-independent approach capable of identifying and separating overlapping pulse components, while a Maximum Likelihood formulation has further extended the linear estimation framework for calorimeter systems [20]. On the nonlinear side, Artificial Neural Networks deployed on FPGAs have been shown to outperform the standard Optimal Filter both in energy resolution and in bunch-crossing assignment for the ATLAS LAr Calorimeter upgrade [21], and CNN-based architectures have been applied to pulse amplitude and arrival time reconstruction in scintillating crystal calorimeters [22]. Graph Neural Networks have also been evaluated for energy regression in highly segmented calorimeters, demonstrating gains over conventional approaches for both single particles and jets [18].
While shallow Artificial Neural Networks (ANNs) represent an early nonlinear alternative with a single hidden layer [23], deep learning models, composed of multiple stacked layers capable of learning hierarchical representations, have enabled substantially more expressive signal reconstruction, with CNNs emerging as a particularly effective class for time-series data [24].
Among nonlinear approaches, CNNs are particularly well-suited for this problem because calorimeter pulses are one-dimensional time series, and convolutional operations naturally extract local waveform features, such as rising edges, decay regions, and pile-up distortions, without requiring manual feature engineering, unlike simpler fully-connected networks that treat all time samples as independent inputs [23,24]. Despite these advances, a systematic comparison between the classical Optimal Filter and lightweight 1D-CNN architectures under controlled pile-up conditions (with explicit evaluation across multiple occupancy regimes) remains limited in the literature, motivating the present study.
Within this context, the present work addresses a core challenge in high-energy calorimetry: the Optimal Filter (OF), despite being extensively used for energy reconstruction [25,26,27,28], is a linear method that assumes Gaussian noise and a known pulse shape, conditions that become increasingly violated as occupancy grows and signal pile-up introduces nonlinear distortions. This fundamental limitation motivates the investigation of Convolutional Neural Networks (CNNs) as a nonlinear alternative capable of learning complex waveform patterns directly from data, without relying on explicit noise models. Therefore, this work systematically compares the performance of the OF and several lightweight 1D-CNN architectures applied to amplitude and phase estimation in a calorimeter readout channel across multiple occupancy regimes. To this end, simulated data generated with the Pulse Generator library is employed, similarly to recent works [20,29]. This framework reproduces pulse shapes characteristic of calorimeters used in high-energy physics experiments. In this study, typical unipolar pulses are considered, allowing a controlled evaluation of the reconstruction methods under a simplified yet representative signal model.
The remainder of this paper is organized as follows. Section 2 provides background on high-energy calorimeter systems and their signal characteristics. Section 3 describes the two reconstruction methods under investigation: the Optimal Filter and the Convolutional Neural Network, along with the cross-validation strategy adopted. Section 4 presents the data simulation framework and the segmentation strategy employed. The experimental results and comparative analysis are discussed in Section 5. Finally, Section 7 summarizes the main findings and outlines directions for future work.
2. High-Energy Calorimeters
In high-energy physics experiments, calorimeters are designed to absorb nearly all the energy of particles produced in collisions and to measure the amount deposited in their sensitive elements. This makes them central components of modern detectors, as they enable the measurement of both charged and neutral particles (such as photons and neutrons), thereby allowing the reconstruction of neutral mesons, the determination of missing transverse energy, and the identification of relevant physical states [30].
A fundamental characteristic of these systems is their segmentation (granularity). Many calorimeters employ a highly segmented multilayer structure that combines absorbers and active layers, each equipped with independent readout electronics. This transverse and longitudinal segmentation provides detailed energy-deposition profiles, which are essential for trajectory reconstruction, particle identification, and energy calibration [6].
To study reconstruction methodologies without relying on real collisions, several simulation frameworks have been developed, such as Pulse Generator [31] and the Lorenzetti Showers that simulate six layers (three electromagnetic and three hadronic) to investigate innovative reconstruction strategies and trigger algorithms [32].
The detector granularity directly affects the calorimeter cell occupancy rate and the complexity of reconstructing the response signals from each readout channel. In high-luminosity environments, the large number of simultaneous collisions increases the likelihood of signal overlap (pile-up) across multiple cells. The higher the segmentation, the more delicate the treatment of these effects becomes, requiring techniques capable of handling not only electronic noise but also cross-talk, saturation, and cell-to-cell response variations. Studies performed with the Lorenzetti simulator, for example, show that ring-like patterns in deposited energy can assist in calibrating pulses in highly segmented calorimeters operating under high pile-up [33].
Another essential aspect is the calorimeter response time. Timing resolution is critical for mitigating pile-up effects and enabling real-time trigger systems, as delays in determining the signal time can lead to the overlap of pulses originating from subsequent interactions [10]. Thus, ultrafast calorimeters are indispensable in experiments with high event rates.
The choice of calorimeter type—homogeneous or sampling—as well as the materials that compose it, depends directly on the experimental requirements for energy resolution, particle density, response latency, and radiation tolerance. In particular, highly segmented calorimeters are widely employed in future detector proposals, enabling the use of particle-flow-based algorithms that exploit fine granularity to improve jet energy resolution [34].
Once the calorimeter type and constituent materials are defined, it becomes possible to employ detailed simulation tools capable of modeling the geometry, physical processes, and detector response, thereby enabling the study of new reconstruction methodologies that, when integrated into real systems, aim to provide more accurate results in shorter processing times [35].
3. Materials and Methods
3.1. The Optimal Filter Method
The calorimeter frontend electronics provide an analog signal that is digitized in order to be digitally processed. A well-known approach is based on a linear, simple and fast response digital filter called Optimal Filter (OF) [26]. The OF method enables the reconstruction of the amplitude (A), phase () and pedestal (p) of a digital pulse from its discrete samples [28]. The measured signal can be described as , where A is the true pulse amplitude, is a reference pulse sample at the time, represents the temporal shift, p is the pedestal and is the electronic noise.
Since the time delay is typically small, a first-order Taylor expansion of is performed:
where and .
The amplitude estimate is computed through the linear combination
where are the Optimal Filter weights.
To ensure that the estimator is unbiased, the condition must hold.
Assuming that the sample noise follows a Gaussian distribution with zero mean and substituting the digital samples into the amplitude estimator:
For this equality to hold for any values of A, , and p, the following constraints are imposed:
The weights are determined by minimizing the estimator variance, which is equivalent to minimizing
where is the noise covariance matrix, and , and are the Lagrange multipliers associated with the constraints.
Thus, the linear system of the Optimal Filter must satisfy:
Rewriting in matrix form:
On the other hand, the phase reconstruction is performed through an analogous linear estimator,
where are the Optimal Filter weights for phase estimation.
To ensure that this estimator is also unbiased, the condition must hold.
Assuming the same noise distribution as in the amplitude case, substituting the digital samples into the phase estimator yields:
To ensure immunity to amplitude and pedestal variations, the following constraints are imposed:
Under these conditions, the estimator reduces to , which must then be divided by the pulse amplitude—either the true value or an estimate obtained from Equation (2)—to recover the phase .
The weights are determined by minimizing the estimator variance (Equation (5)) subject to the constraints above. Thus, for phase reconstruction, the Optimal Filter linear system must satisfy:
which, in matrix form, reads:
It is worth noting that the OF weights derived above are optimal under the assumption of stationary Gaussian noise and a single, isolated pulse. Under pile-up conditions, the noise is no longer stationary and the single-pulse assumption is violated, causing the OF to lose its optimality. This degradation is precisely the operational limitation that motivates the investigation of nonlinear alternatives such as CNNs, which do not rely on these assumptions and can instead learn reconstruction mappings directly from overlapping waveform data.
3.2. Convolutional Neural Network
Although recent works have explored a variety of deep learning architectures for calorimeter signal reconstruction, including Graph Neural Networks [18] and recurrent approaches [21], the present work focuses on CNNs due to their well-established suitability for fixed-length one-dimensional time series, computational efficiency, and compatibility with hardware accelerators such as FPGAs, as discussed in the following.
Deep learning refers to a class of machine learning methods based on artificial neural networks (ANNs) with multiple stacked layers, enabling the automatic learning of hierarchical feature representations from raw data [23]. While shallow ANNs with a single hidden layer have been applied to signal processing tasks, they treat input samples as independent features and rely on global mappings, limiting their ability to capture local temporal structures. CNNs constitute a specialized subclass of deep learning models designed to process grid-structured data through shared convolutional filters, making them naturally suited for sequential signals such as calorimeter pulses [24].
Convolutional Neural Networks are naturally adapted to their one-dimensional form (1D-CNN) in the context of time series. Their typical architecture is composed of convolutional layers, responsible for extracting local patterns; pooling layers, which reduce dimensionality and mitigate overfitting; and dense (fully connected) layers, which combine the extracted features to produce the final prediction [23].
Considering the problem of estimating the amplitude and phase of the calorimeter response signals in signal pile-up conditions, a Convolutional Neural Network (CNN) approach configured for regression tasks was employed. The signal pile-up introduces nonlinear components to the noise, which the typical linear OF method is not able to deal with. To this end, the CNN input consisted of a matrix obtained after the segmentation stage, in which each row represents a pulse reconstructed from the free-running samples. Each pulse was paired with its corresponding true amplitude value, used as the training target. The choice of CNNs over other nonlinear architectures is motivated by the nature of the problem. Fully-connected ANNs, while capable of approximating nonlinear functions, treat all time samples as independent inputs and do not exploit the local temporal structure of the pulse waveform, requiring a larger number of parameters to achieve equivalent representational capacity. Recurrent Neural Networks (RNNs), although designed for sequential data, are optimized for long-range temporal dependencies and introduce higher computational complexity, which is undesirable in the context of fast calorimeter readout [23]. CNNs, by contrast, apply shared convolutional filters that explicitly exploit local correlations in the time domain, making them computationally efficient and well-suited for fixed-length pulse waveforms with consistent local patterns across different occupancy conditions [24].
The main advantage of CNNs in this context lies in their ability to automatically learn local correlations within the pulse’s temporal waveform—such as rising edges, decay regions, and subtle distortions introduced by electronic noise. These structures are difficult to model explicitly using linear methods such as the Optimal Filter. As a result, the network acts as a trainable feature extractor, producing effective filters for different occupancy regimes and yielding a more robust amplitude reconstruction, even under high noise levels or shape distortions [24].
To ensure stability during training, the samples were normalized and the pedestal was removed beforehand. The networks were trained using the MSE loss function, the Adam optimizer, early stopping with a patience of three epochs, and dropout regularization. These mechanisms help mitigate overfitting and contribute to model generalization across different occupancy conditions.
Additionally, the evaluated CNNs are lightweight architectures with moderate complexity, which favors their potential implementation in accelerated hardware such as GPUs or FPGAs. This characteristic makes them promising candidates for fast calorimeter signal reconstruction in high event-rate environments, such as those expected in next-generation high-luminosity experiments. Prior work has demonstrated that neural network inference can be executed on FPGAs with latencies of only a few clock cycles while utilizing a small fraction of available hardware resources [21], and that FPGA-compatible compression of ML models can achieve latencies suitable for real-time front-end processing [36]. These results suggest that once trained offline, the CNN architectures evaluated in this work could be deployed in inference mode on such devices, meeting the stringent latency requirements of online trigger systems in high-luminosity experiments.
3.3. Cross Validation
The validation of the methods was performed using K-Fold Cross Validation, applied differently to the Optimal Filter and the Convolutional Neural Networks, according to the characteristics of each approach.
For the OF, the validation procedure was executed separately for each occupancy level. For every occupancy setting, the data were divided into partitions, with 90% used for fitting the filter weights and 10% reserved for evaluation, ensuring that the performance was assessed individually under different pulse-overlap conditions.
For the CNNs, in contrast, cross-validation was applied to the complete dataset while keeping the occupancy level only as an associative attribute. In this way, the training process simultaneously used information from all occupancy conditions, allowing the network to better generalize amplitude reconstruction across different scenarios. After each of the 100 iterations, the evaluation was carried out separately for each occupancy level, ensuring a fair and direct comparison with the performance obtained by the OF.
4. Data Simulation
4.1. Pulse Generator Library
Since performing real collisions for every new study is unfeasible, simulators capable of reproducing the expected signals under different experimental conditions are employed. One such simulator is the Pulse Generator (v1.1.0), which produces signals according to user-defined parameters, providing information such as sampling time, true amplitude, pulse samples, and true phase [31].
For this study, simulations were carried out to generate 2,000,000 time samples with amplitudes following an exponential distribution with a mean of 100 ADC counts, phase uniformly distributed between and 5 ns, a constant pedestal of 30 ADC counts, and a deformation parameter of 0.01 ADC counts. These parameters are typically found in modern calorimeter systems and have been adopted in previous work [19,20]. The Pulse Generator also allows the simulation of different occupancy levels, which represent the probability that a calorimeter channel receives signals resulting from a collision [37,38]. These levels range from 0% to 100%, with higher values corresponding to a greater likelihood of pulse pileup. In the case of zero occupancy, only electronic noise is present.
It is worth noting that, unlike full-detector simulation frameworks such as Lorenzetti Showers [32], the Pulse Generator operates at the level of a single readout channel, without modeling detector geometry, shower development, or inter-channel effects such as crosstalk. Within this single-channel model, occupancy is implemented as an independent Bernoulli trial per bunch crossing: for each sampling position in the free-running stream, a signal pulse is present with probability equal to the occupancy level, or absent (noise only) with the complementary probability [19,37,38]. The resulting pile-up model is therefore stochastic rather than deterministic: at 100% occupancy, every bunch crossing contributes a signal pulse, whereas at intermediate levels such as 50%, signal pulses are present in approximately half of the bunch crossings on average. When consecutive bunch crossings both contain pulses, their individual contributions are superimposed within the same 7-sample readout window, producing the characteristic pile-up distortions that degrade amplitude and phase reconstruction. The amplitudes of overlapping pulses are drawn independently from the same exponential distribution described above, and their phases are drawn from the uniform distribution over [−5, 5] ns. This model captures the essential features of out-of-time pile-up in a controlled and reproducible single-channel setting [19].
Although the use of simulated data enables a controlled and reproducible evaluation of the reconstruction methods, it is important to acknowledge the inherent limitations of this approach. The Pulse Generator models electronic noise as additive and Gaussian, and assumes a fixed, idealized pulse shape, whereas real calorimeter signals may exhibit non-Gaussian noise contributions, gain variations, temperature-dependent shape distortions, cross-talk between readout channels, and detector aging effects [6,10]. Furthermore, the exponential amplitude distribution and the simplified pile-up model adopted here, while representative of typical operating conditions, do not fully reproduce the complexity of actual collision environments such as those encountered at the LHC. In particular, the model does not simulate shower development, as real electromagnetic and hadronic cascades produce signals with complex time structure that is not captured by a single exponential pulse, nor does it account for the shaping effects introduced by front-end electronics such as preamplifiers, which modify the pulse shape in a detector-specific manner. These simplifications were deliberately chosen to provide a clean methodological benchmark; however, validation on more realistic simulation frameworks and, ultimately, on real detector data remains an important direction for future work.
4.2. Data Segmentation Strategy
For the application of the Optimal Filter estimation method, the data must be organized into matrices with 7 columns (due to the use of a pulse with seven time samples) and rows. Each row of the matrix corresponds to a complete pulse (calorimeter response for a given collision), represented by its seven time samples, whose estimated amplitude will later be compared with the reference value (known from simulation). However, the library used provides the signals in a free-running (or streaming) format, that is, as a single column containing continuous samples without explicit segmentation between pulses. This format requires the adoption of a partitioning technique to reconstruct the matrix arrangement needed for OF processing.
The strategy adopted, referred to as windowing, reorganizes the continuous time series into sets of samples with controlled overlap. In the case of “windowing 7”, for example, the first seven samples of the series form the seven columns of the first row of the matrix, while the fourth entry of the true-amplitude column is used as the reference for this pulse. The next set consists of samples with indices 2 to 8, whose reference amplitude corresponds to the fifth entry in the amplitude column, and so on until all data are processed. This procedure ensures structural compatibility between the data and the mathematical model of the Optimal Filter, while preserving the temporal coherence of the simulated pulses.
5. Results and Discussions
5.1. Architecture Selection
To evaluate the performance of Convolutional Neural Networks in comparison to the Optimal Filter method, multiple CNN architectures were initially designed with the goal of identifying those that exhibited the best performance for each occupancy level. To enable a fair comparison among models, a standardized set of training hyperparameters was defined, as presented in Table 1. Each architecture was then trained and evaluated independently for the considered occupancy levels following these parameters.
Table 1.
Standardized training configurations for all CNN architectures.
Next, a reference architecture (CNN-1) was defined, from which all other variants were derived. Each subsequent architecture incorporates a specific modification—such as an increased number of convolutional or dense layers, variations in the number of filters, changes in kernel size, replacement of the activation function, or expansion of the dense layers—allowing for a controlled assessment of the individual impact of each modification on reconstruction performance. The full configurations of the evaluated architectures are presented in Table 2.
Table 2.
Architectural configurations of the evaluated Convolutional Neural Networks.
5.2. Amplitude Reconstruction
With all architectures defined, each model was computationally implemented and subjected to the training and energy reconstruction process for four selected occupancy levels (10%, 50%, 80%, and 100%). Both the CNNs and the Optimal Filter method were applied to the same datasets, enabling a direct comparison between linear and nonlinear approaches. The choice of these occupancy levels allows evaluating how each method behaves as the number of simultaneous events increases, a scenario that naturally introduces more contamination, noise, and pulse-shape distortion.
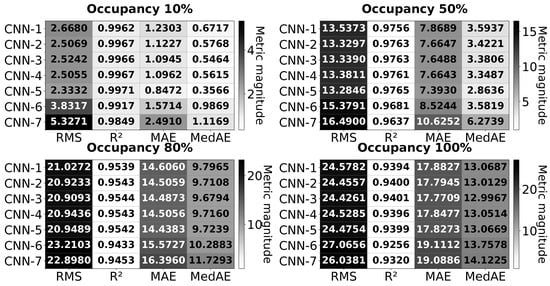
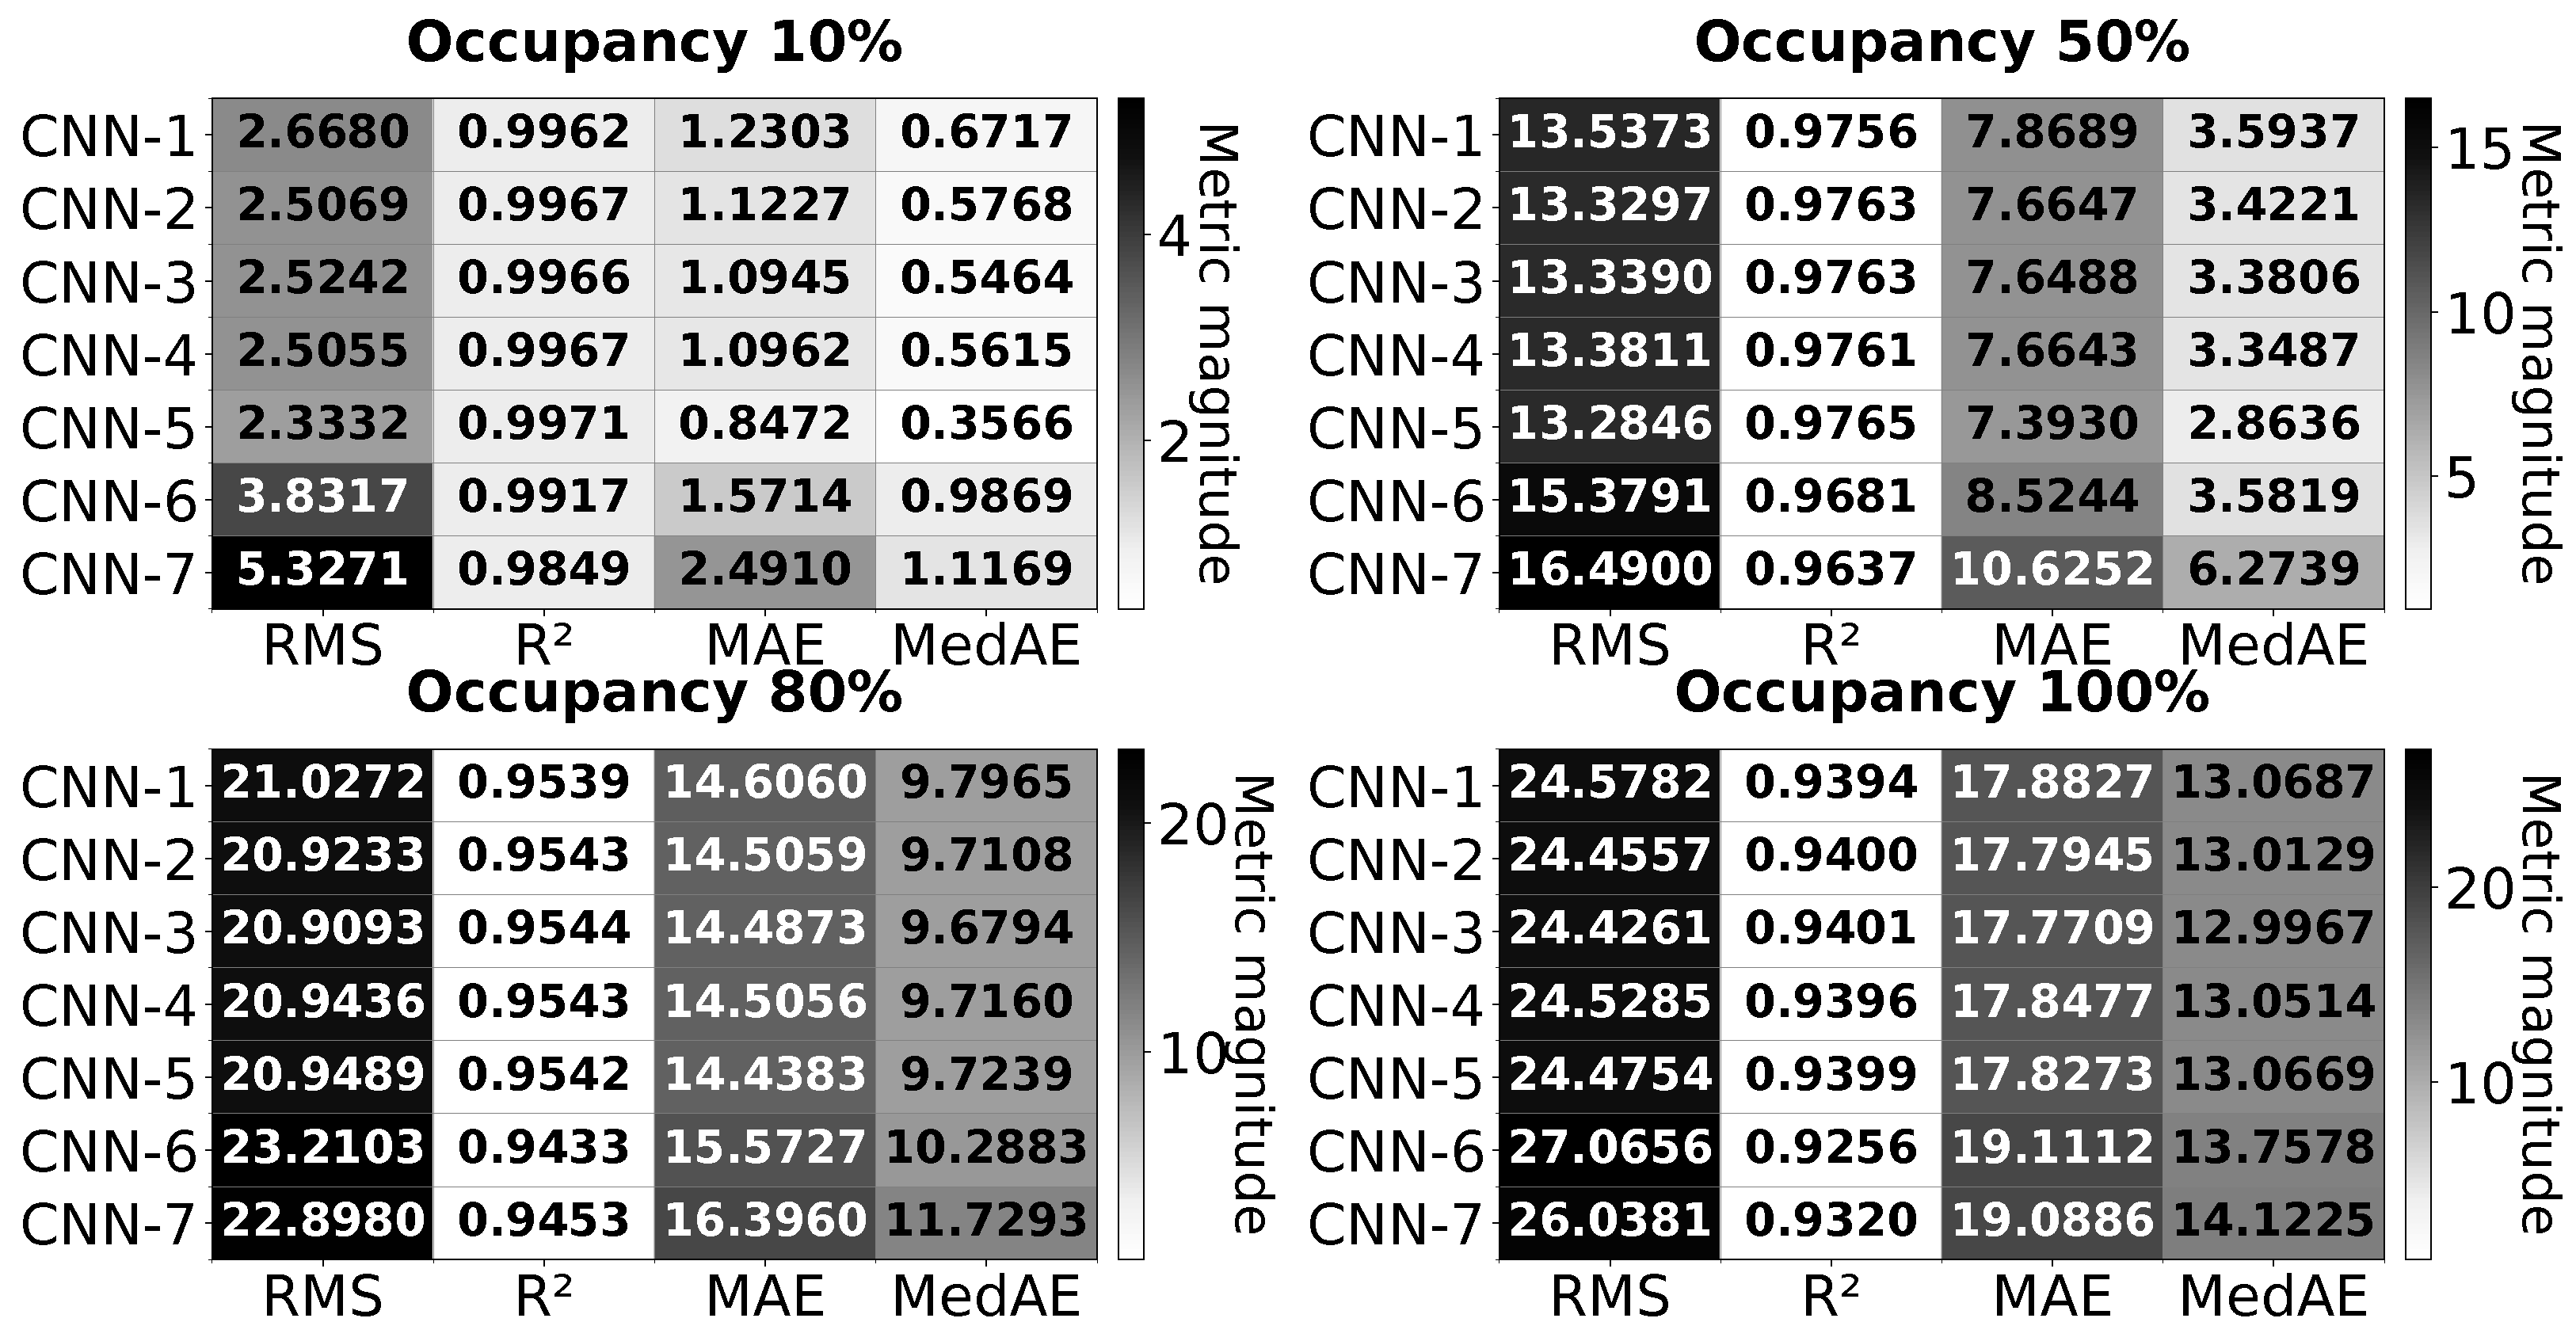
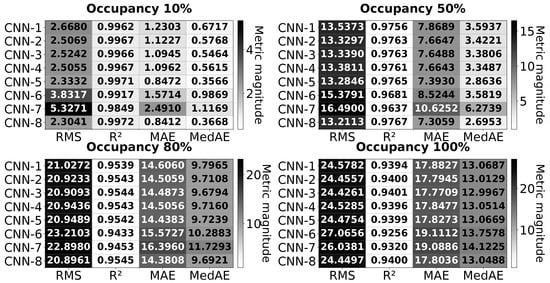
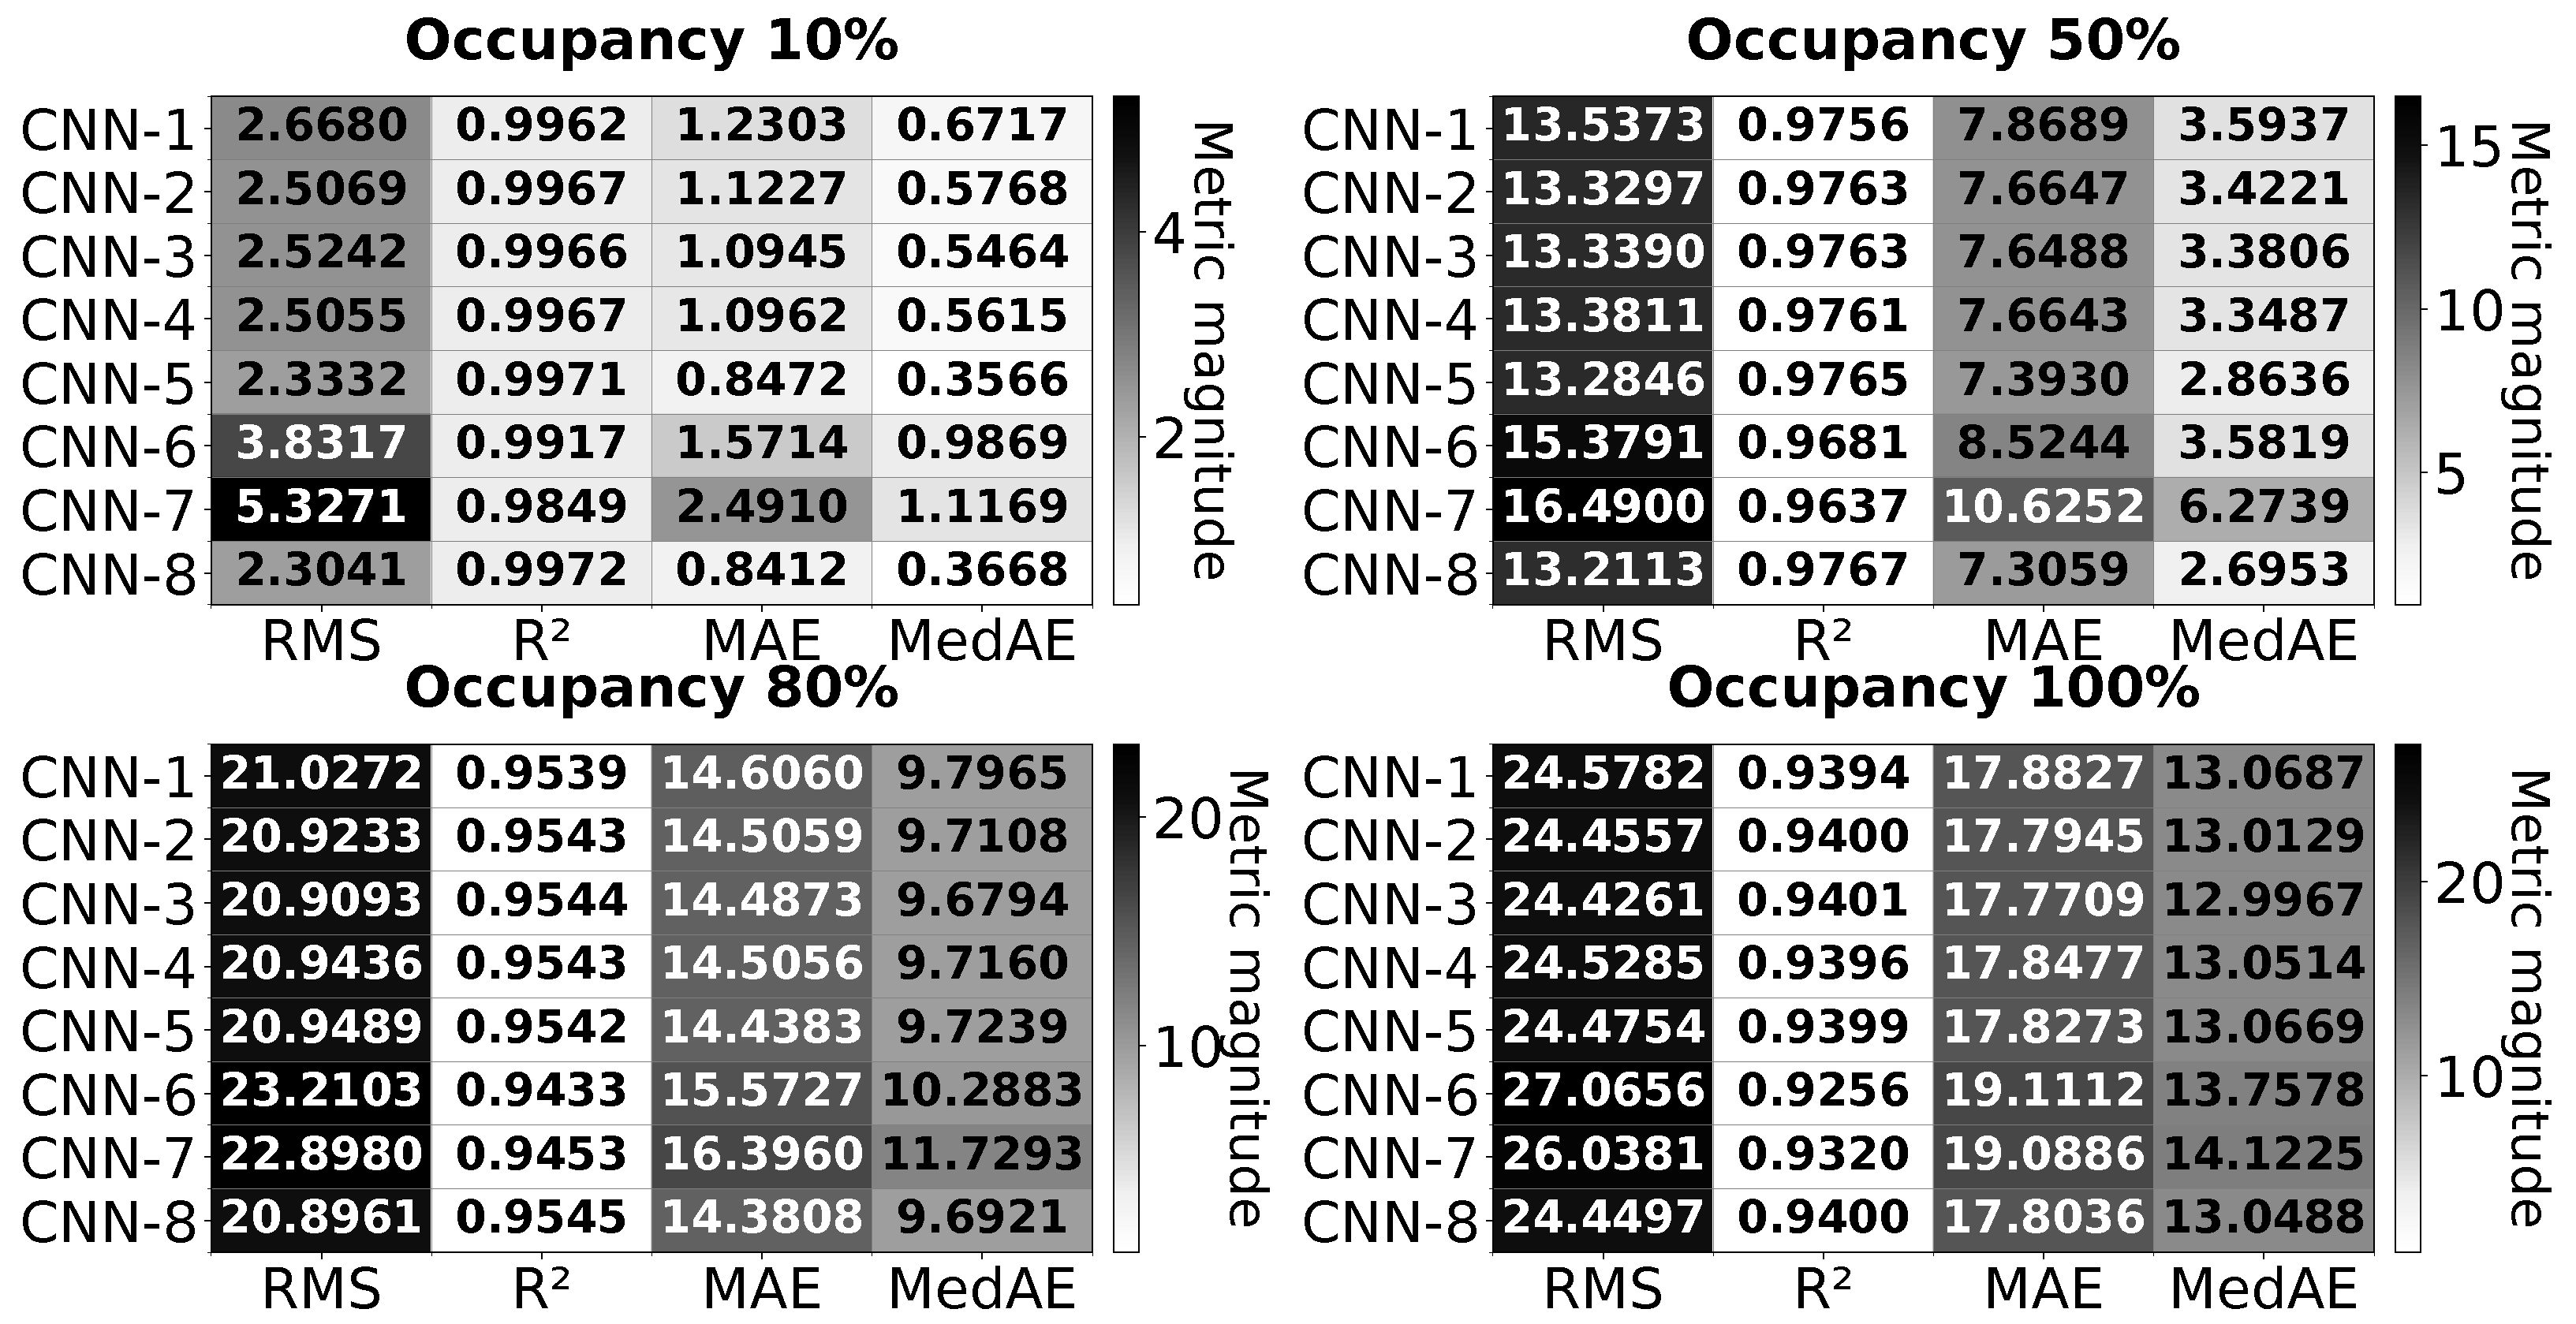
The initial goal is to investigate whether any of the seven evaluated architectures exhibits a consistently superior performance across all occupancy levels, considering the average values of the metrics obtained over the 100-fold cross-validation process. Figure 1 presents the CNN results for four evaluation metrics (Root Mean Square—RMS, coefficient of determination—, Mean Absolute Error—MAE, and Median Absolute Error—MedAE.), used both among the architectures themselves and in comparison to the reference method, the Optimal Filter.
Figure 1.
Comparison among the different CNN architectures for each occupancy level with RMS, MAE and MedAE are expressed in ADC counts, while is dimensionless.
Based on the evaluated metrics, it is observed that for occupancies 10% and 50%, the architecture with the best overall performance is CNN-5, while for occupancy 80%, CNN-3 yields lower RMS and MedAE values and an coefficient closer to 1, despite presenting a slightly higher MAE than CNN-5; since improvements are observed in three out of four metrics, CNN-3 is adopted as the best-performing architecture for this occupancy. For occupancy 100%, CNN-3 also yielded the best results. In most of these scenarios, the selected architectures exhibited lower RMS, MAE, and MedAE values, along with values closer to 1, indicating a higher ability to reconstruct the amplitude.
With the best architecture for each occupancy level identified, energy reconstruction using the Optimal Filter method was performed, allowing for a direct comparison with the selected CNNs. The results are presented in Table 3. It can be observed that, for all analyzed occupancy levels, the CNNs consistently outperformed the OF, exhibiting substantially lower errors in all four evaluated metrics.
Table 3.
Comparison between the Optimal Filter method and the CNN for energy estimation at different occupancy (OCC) levels.
These numerical improvements carry direct physical significance for calorimeter operation. A reduction in the RMS value of the amplitude error is generally associated with improved energy resolution, a key figure of merit for particle identification and invariant-mass reconstruction in collision events [6]. As occupancy increases, the OF exhibits a progressive decline in , explained by the increasing violation of its underlying assumptions: the OF weights are derived assuming stationary Gaussian noise and a single isolated pulse per window (Section 3.1), and under pile-up, overlapping pulses introduce non-Gaussian, non-stationary contamination that the filter cannot distinguish from the pulse of interest. As this residual error grows with occupancy, it eventually exceeds the natural variance of the reference amplitude distribution, causing to become negative, indicating that, at 100% occupancy, the OF reconstruction is less accurate than simply predicting the mean amplitude. Such degradation may adversely affect the quality of energy estimates provided to downstream trigger and reconstruction algorithms. By contrast, the CNN-based approaches maintain values above 0.94 across all evaluated occupancy levels, suggesting that they constitute promising candidates for energy reconstruction under severe pile-up conditions similar to those foreseen in future high-luminosity collider environments [13].
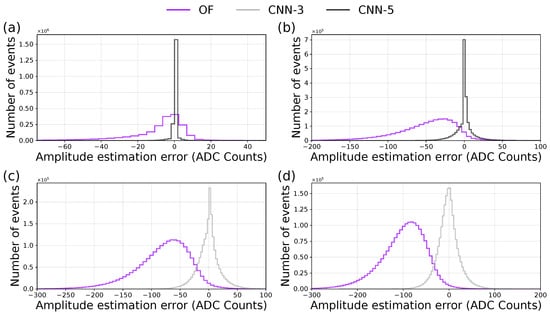
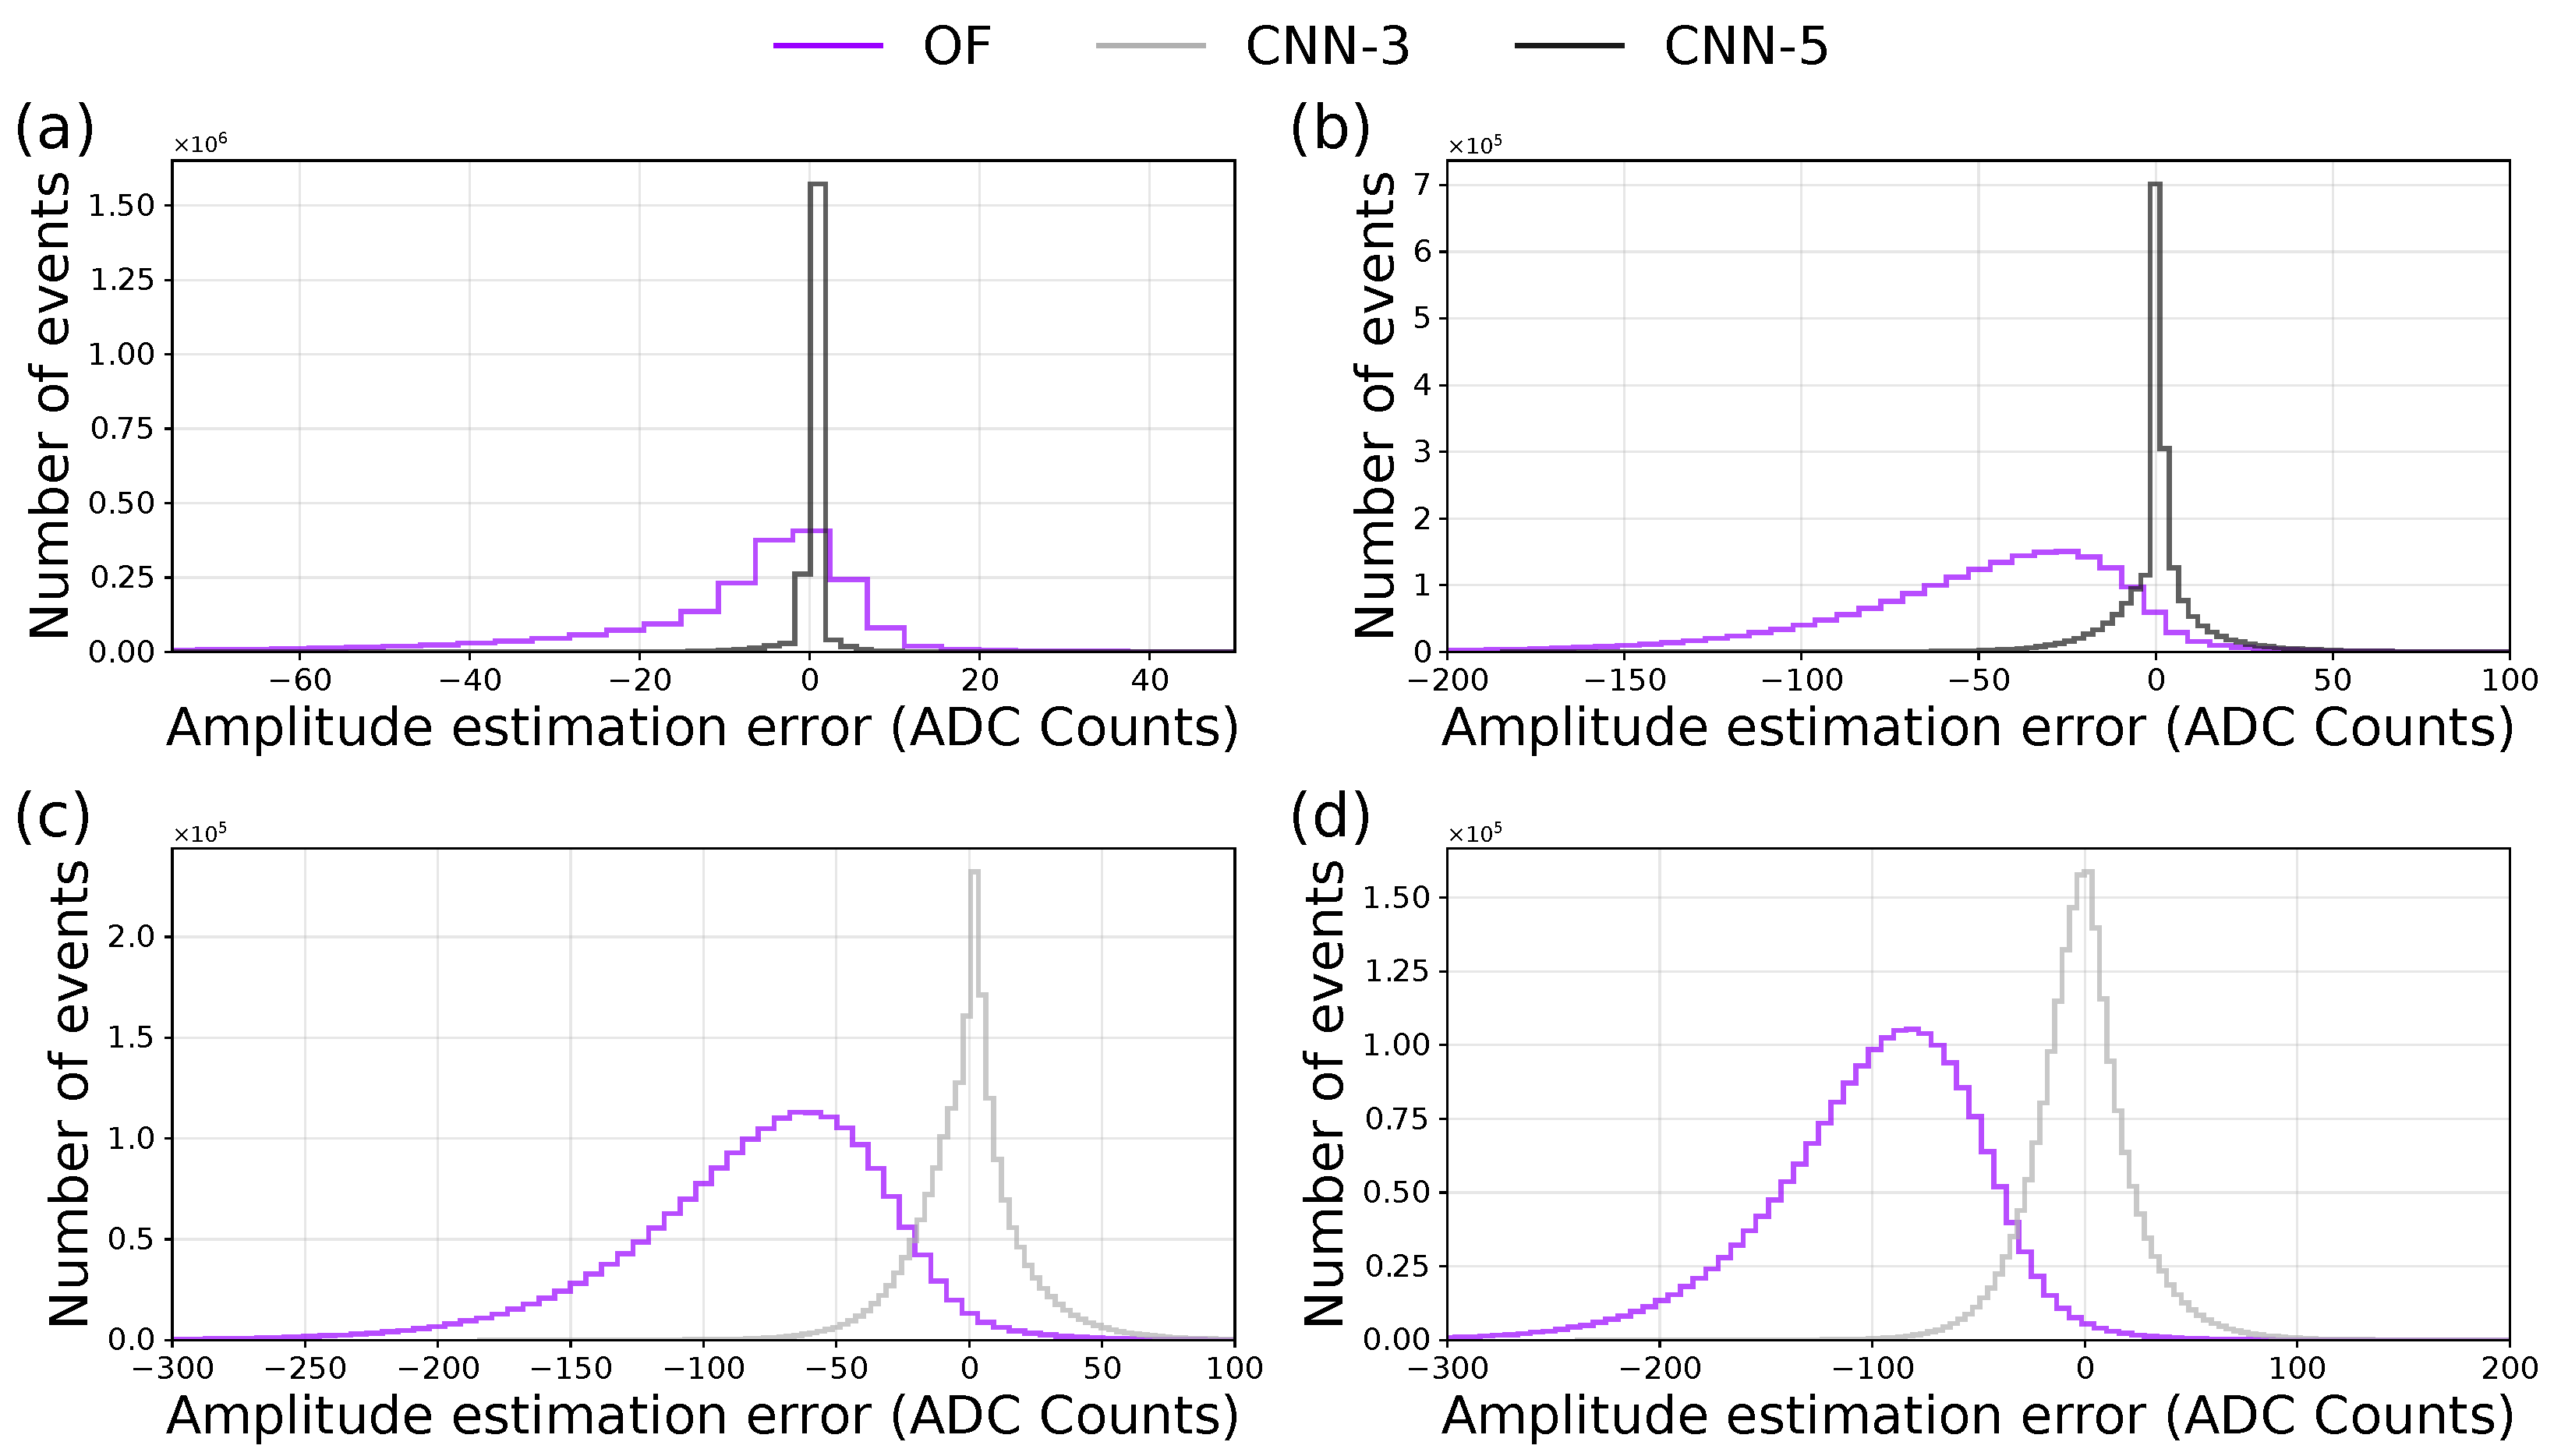
In addition to the numerical metrics presented in Table 3, the analysis of the energy estimation also benefits from visual indicators, particularly regarding the dispersion and central tendency of the estimation error. Figure 2 shows comparative histograms between the best CNN architecture selected for each occupancy level and the Optimal Filter, providing a complementary qualitative assessment.
Figure 2.
Comparative histogram of the amplitude estimation error between the CNN and the OF for occupancies (a) 10%, (b) 50%, (c) 80%, and (d) 100%.
It is observed that for all analyzed occupancies, the CNNs exhibit lower error dispersion compared to the OF, indicating greater reconstruction stability, with more concentrated distributions and error means significantly closer to zero, whereas the OF displays broader tails and larger shifts.
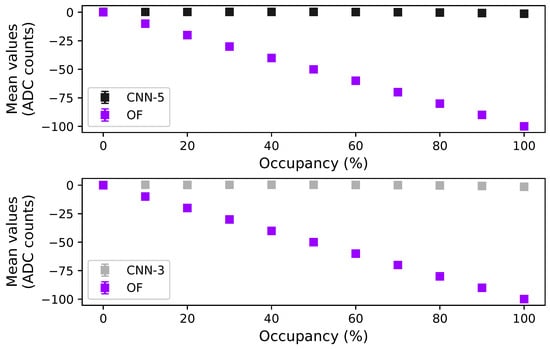
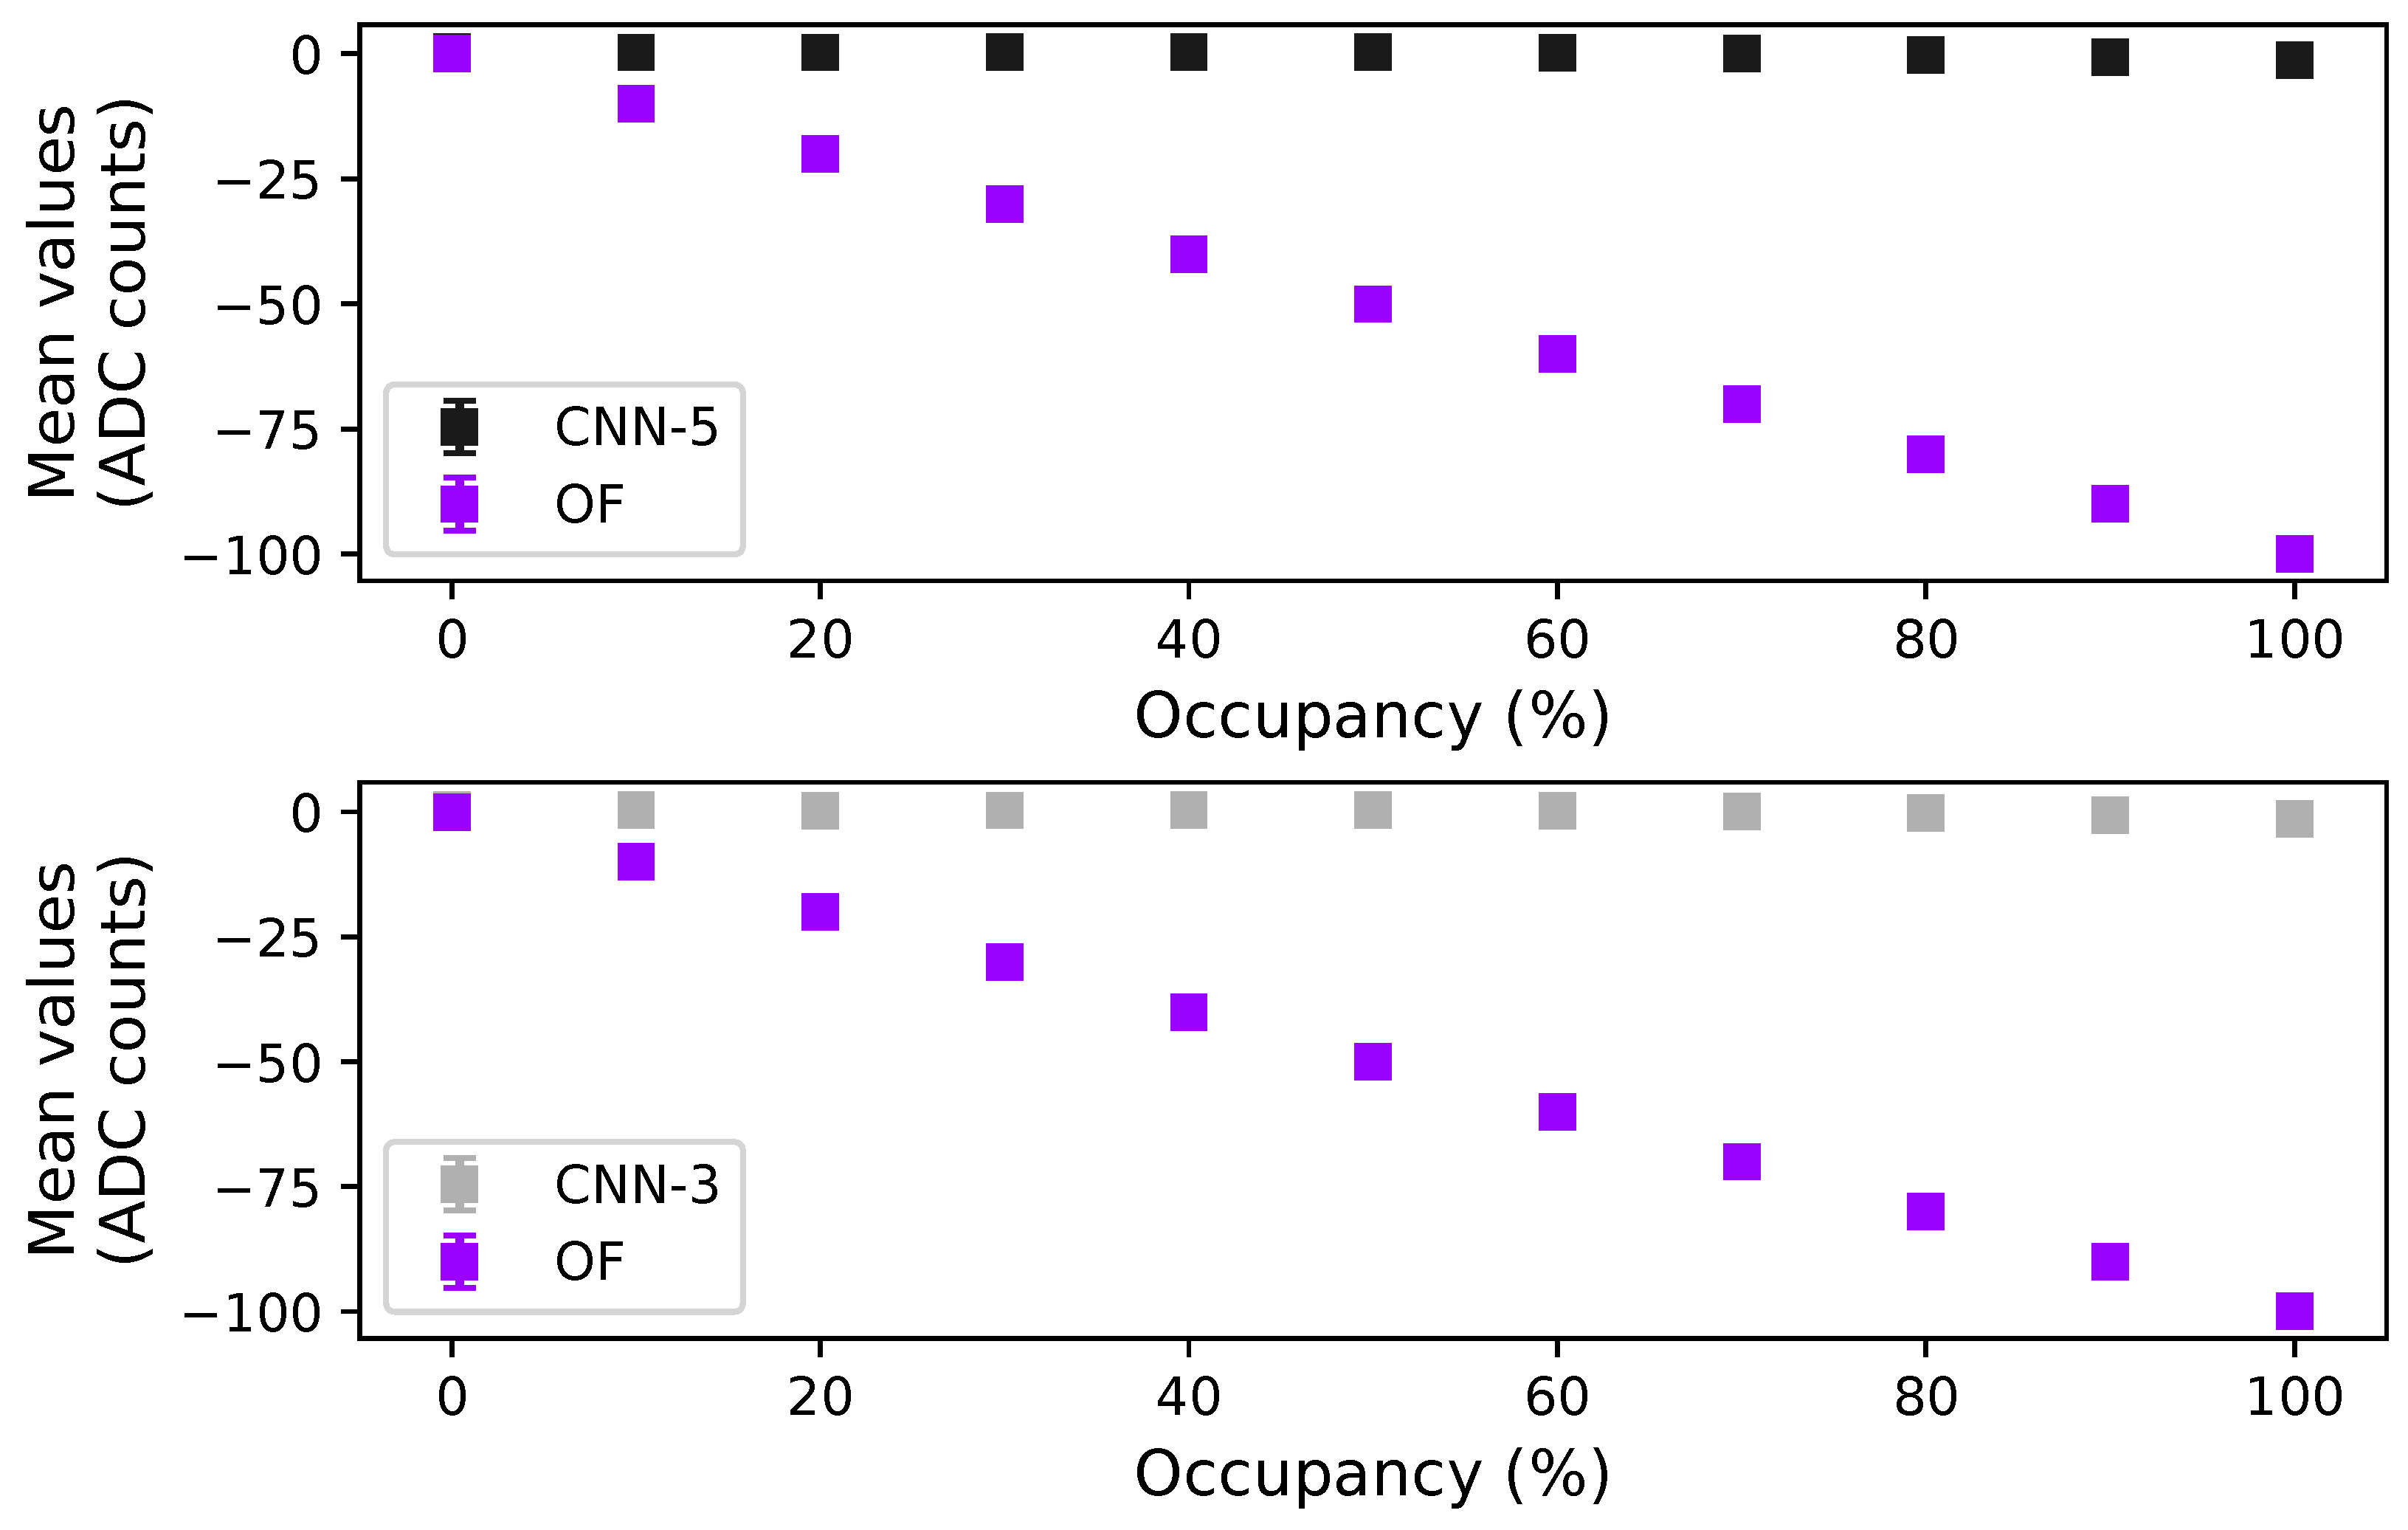
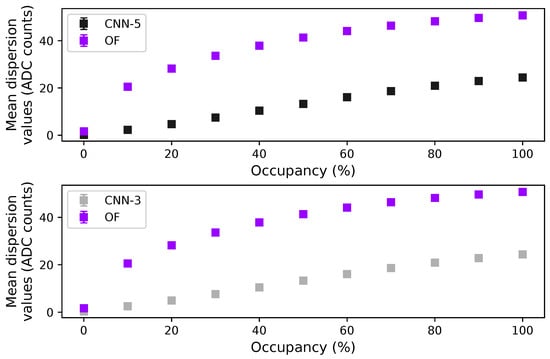
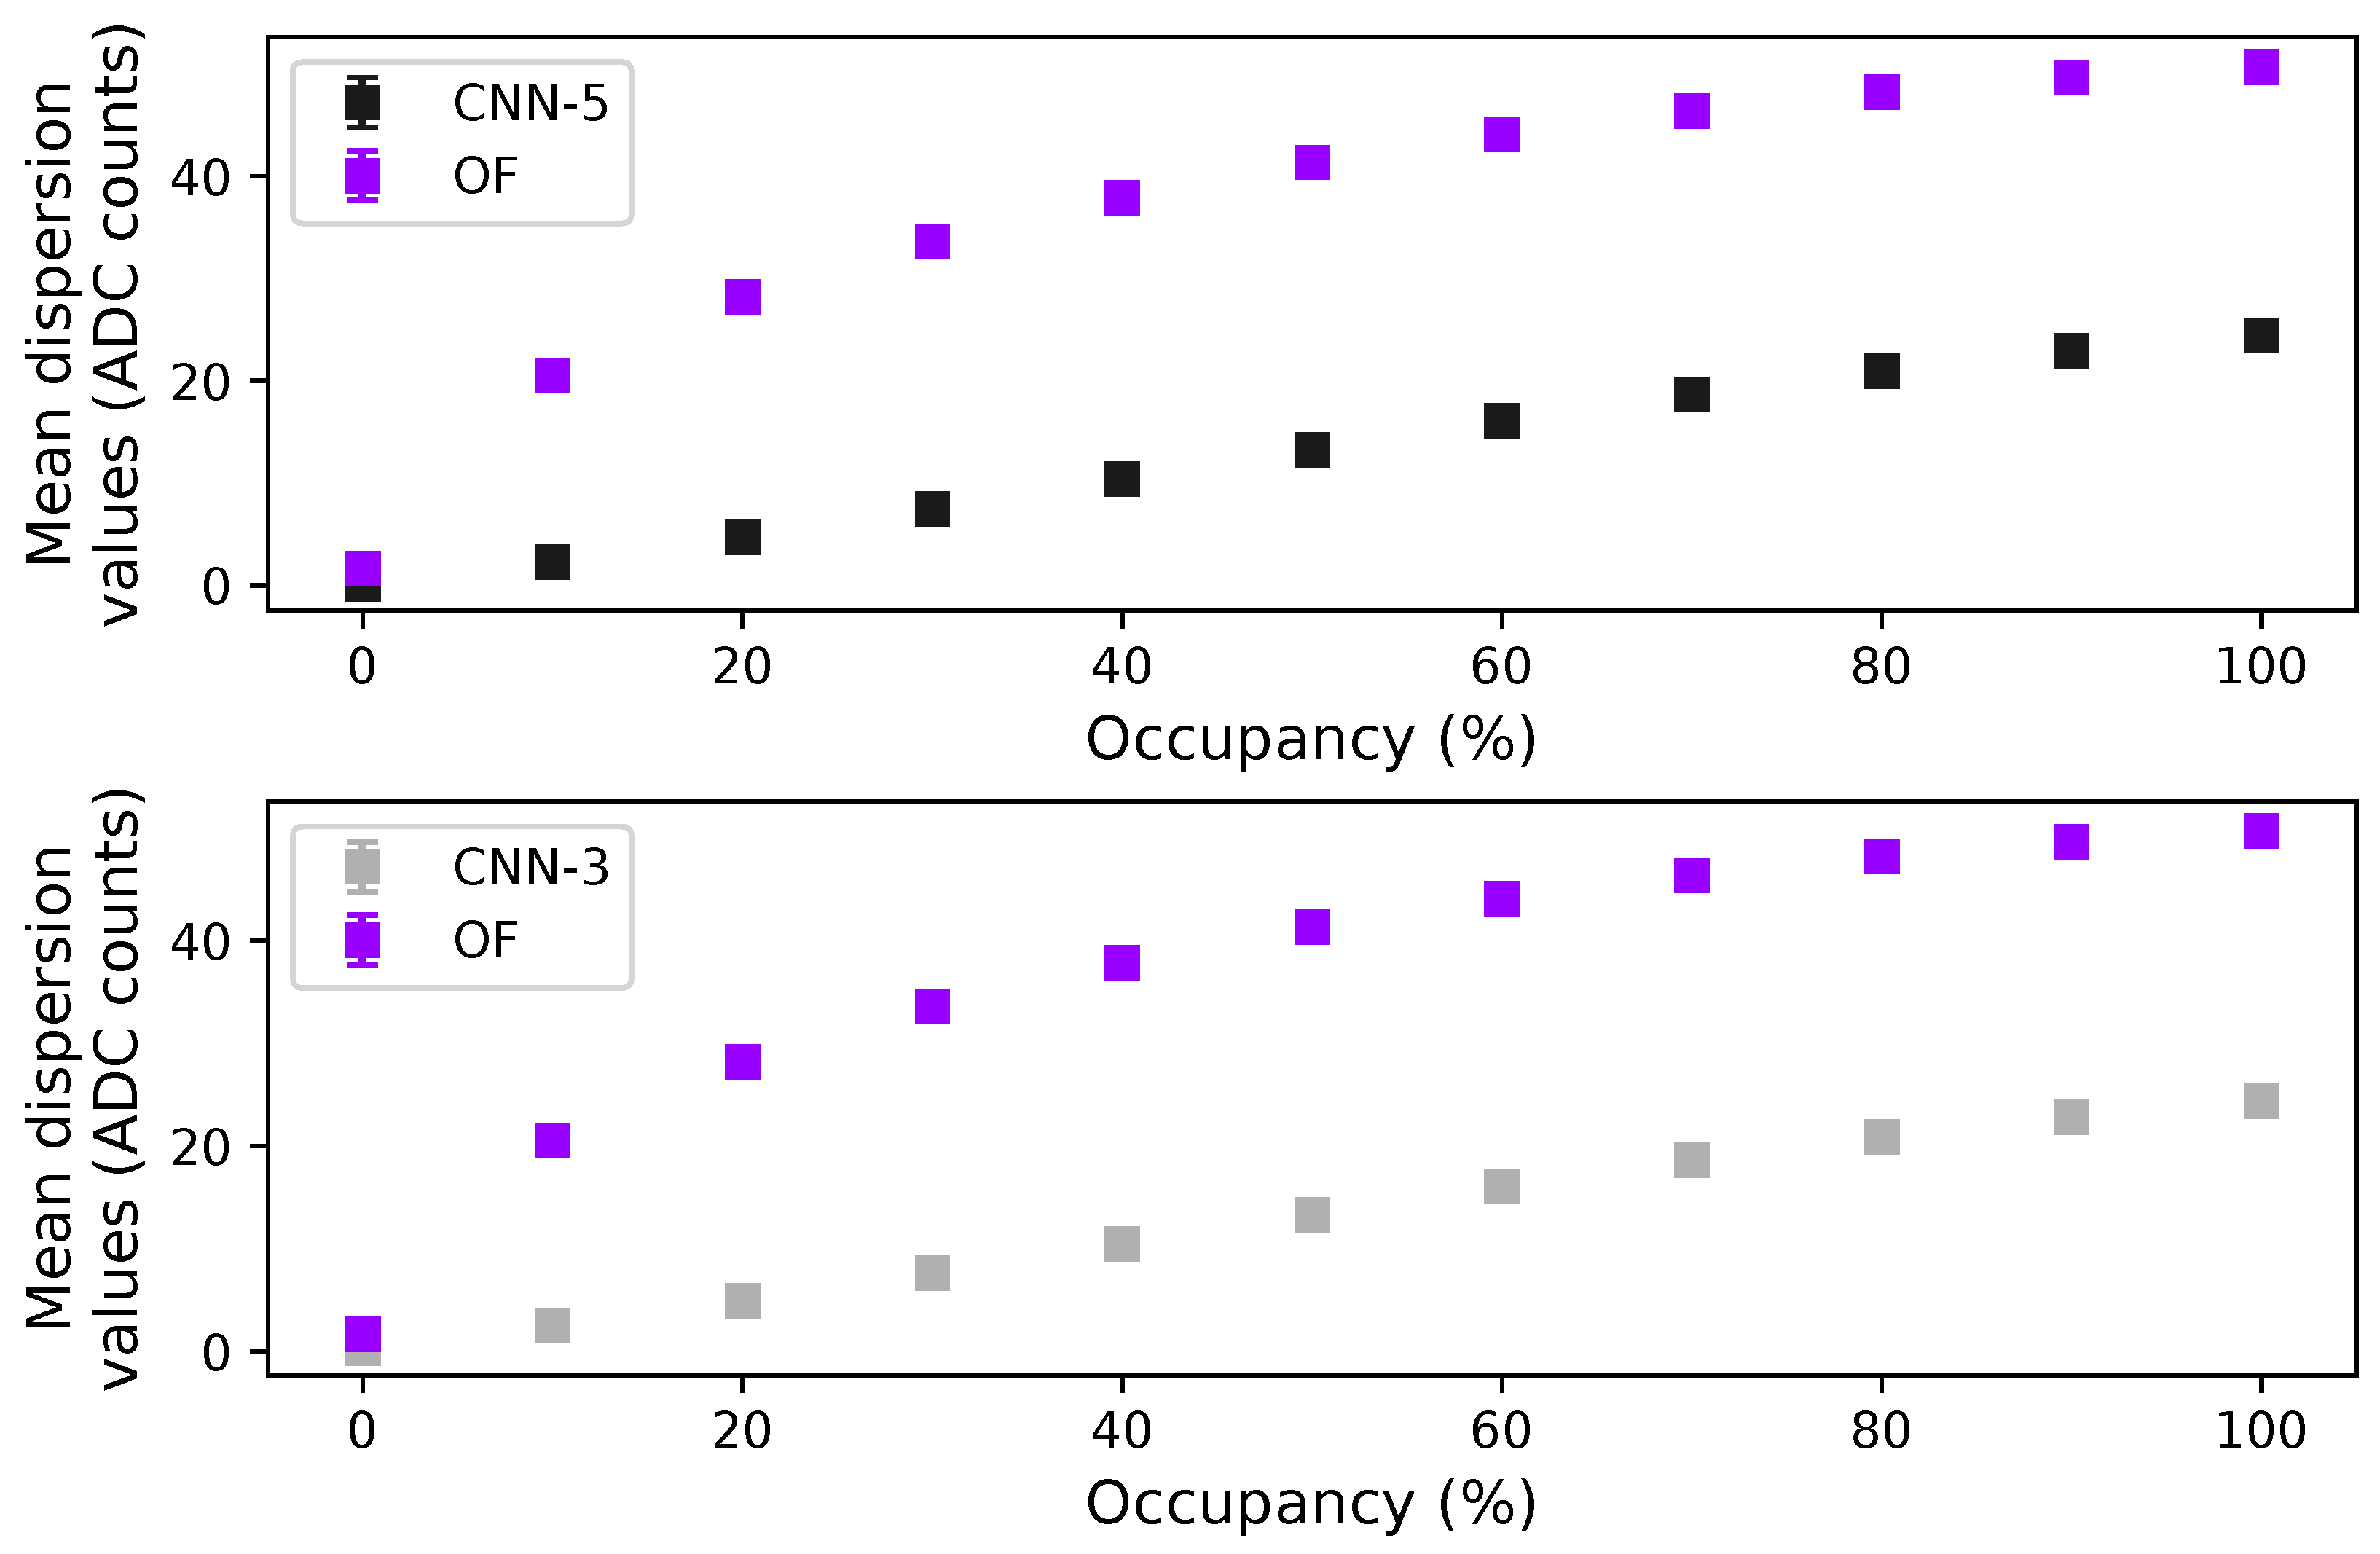
Figure 3 and Figure 4 further refine this analysis by showing the evolution of the mean estimation error and its dispersion as a function of occupancy. As the occupancy increases, the OF method exhibits a progressive deviation of the mean error from zero, accompanied by a significant growth in the dispersion. In contrast, the CNN-based approaches maintain mean error values consistently closer to zero across all occupancy scenarios, indicating a more stable and unbiased behavior. Although the dispersion of the CNN estimations also increases with occupancy, this growth remains systematically smaller than that observed for the OF, demonstrating greater robustness under conditions of high pulse overlap.
Figure 3.
Mean values of the ampitude estimation error comparing the Optimal Filter with the selected CNN architectures.
Figure 4.
Mean dispersion values of the amplitude estimation error comparing the Optimal Filter with the selected CNN architectures.
Both figures also include the standard deviation associated with each metric. However, in all cases, these deviations are small compared to the scale of the plots, making them only noticeable when the figures are inspected with zoom.
5.3. Phase Reconstruction
Following amplitude reconstruction using the proposed methods, phase reconstruction was carried out. To this end, was estimated using the OF and subsequently divided by the amplitude to recover the phase (). Three different approaches were compared: division by the true amplitude associated with each pulse, division by the amplitude estimated by the OF method, and division by the amplitude estimated by the best-performing CNN for each occupancy level.
With the aim of comparing the performance of these three approaches, metrics similar to those presented in Table 3 were evaluated, as shown in Table 4. From the obtained results, it can be observed that, for all occupancy levels considered, the convolutional neural network architectures produced results closer to those obtained using the Real Amplitude (RA). This indicates that the CNN-based approaches provided a more accurate amplitude reconstruction, corroborating the behavior previously discussed.
Table 4.
Comparison between the Optimal Filter method and the CNN for phase estimation at different occupancy (OCC) levels.
The negative values obtained for the coefficient of determination () indicate that the variance of the estimation error was larger than the variance of the reference signal itself. The metric is defined as
where represents the reference values, the estimated values, and the mean of the reference data. Therefore, negative values occur when the residual error term becomes larger than the natural variance of the reference signal around its mean. In practical terms, this indicates that the estimation error remained significantly high for all evaluated approaches and occupancy conditions, despite the CNN-based methods still presenting comparatively better reconstruction performance than the OF approach in most scenarios. It is worth noting that the markedly larger negative magnitudes observed here, compared to those reported for amplitude reconstruction in Table 3, arise from the normalization term in Equation (9) rather than from a proportionally worse reconstruction: since the reference phase is uniformly distributed within a narrow interval ( to 5 ns), its variance around the mean is intrinsically small, so the same absolute estimation error produces a substantially larger negative than would be obtained for a quantity with broader natural spread, such as the amplitude. This also explains why even the Real Amplitude (RA) case (representing the best-case scenario, in which the true amplitude is used for division) still yields large negative values, despite producing visibly concentrated error distributions in Figure 5.
Figure 5.
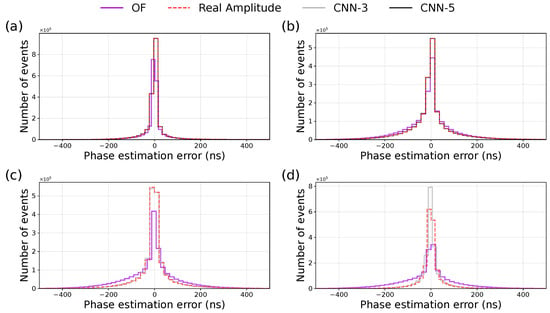
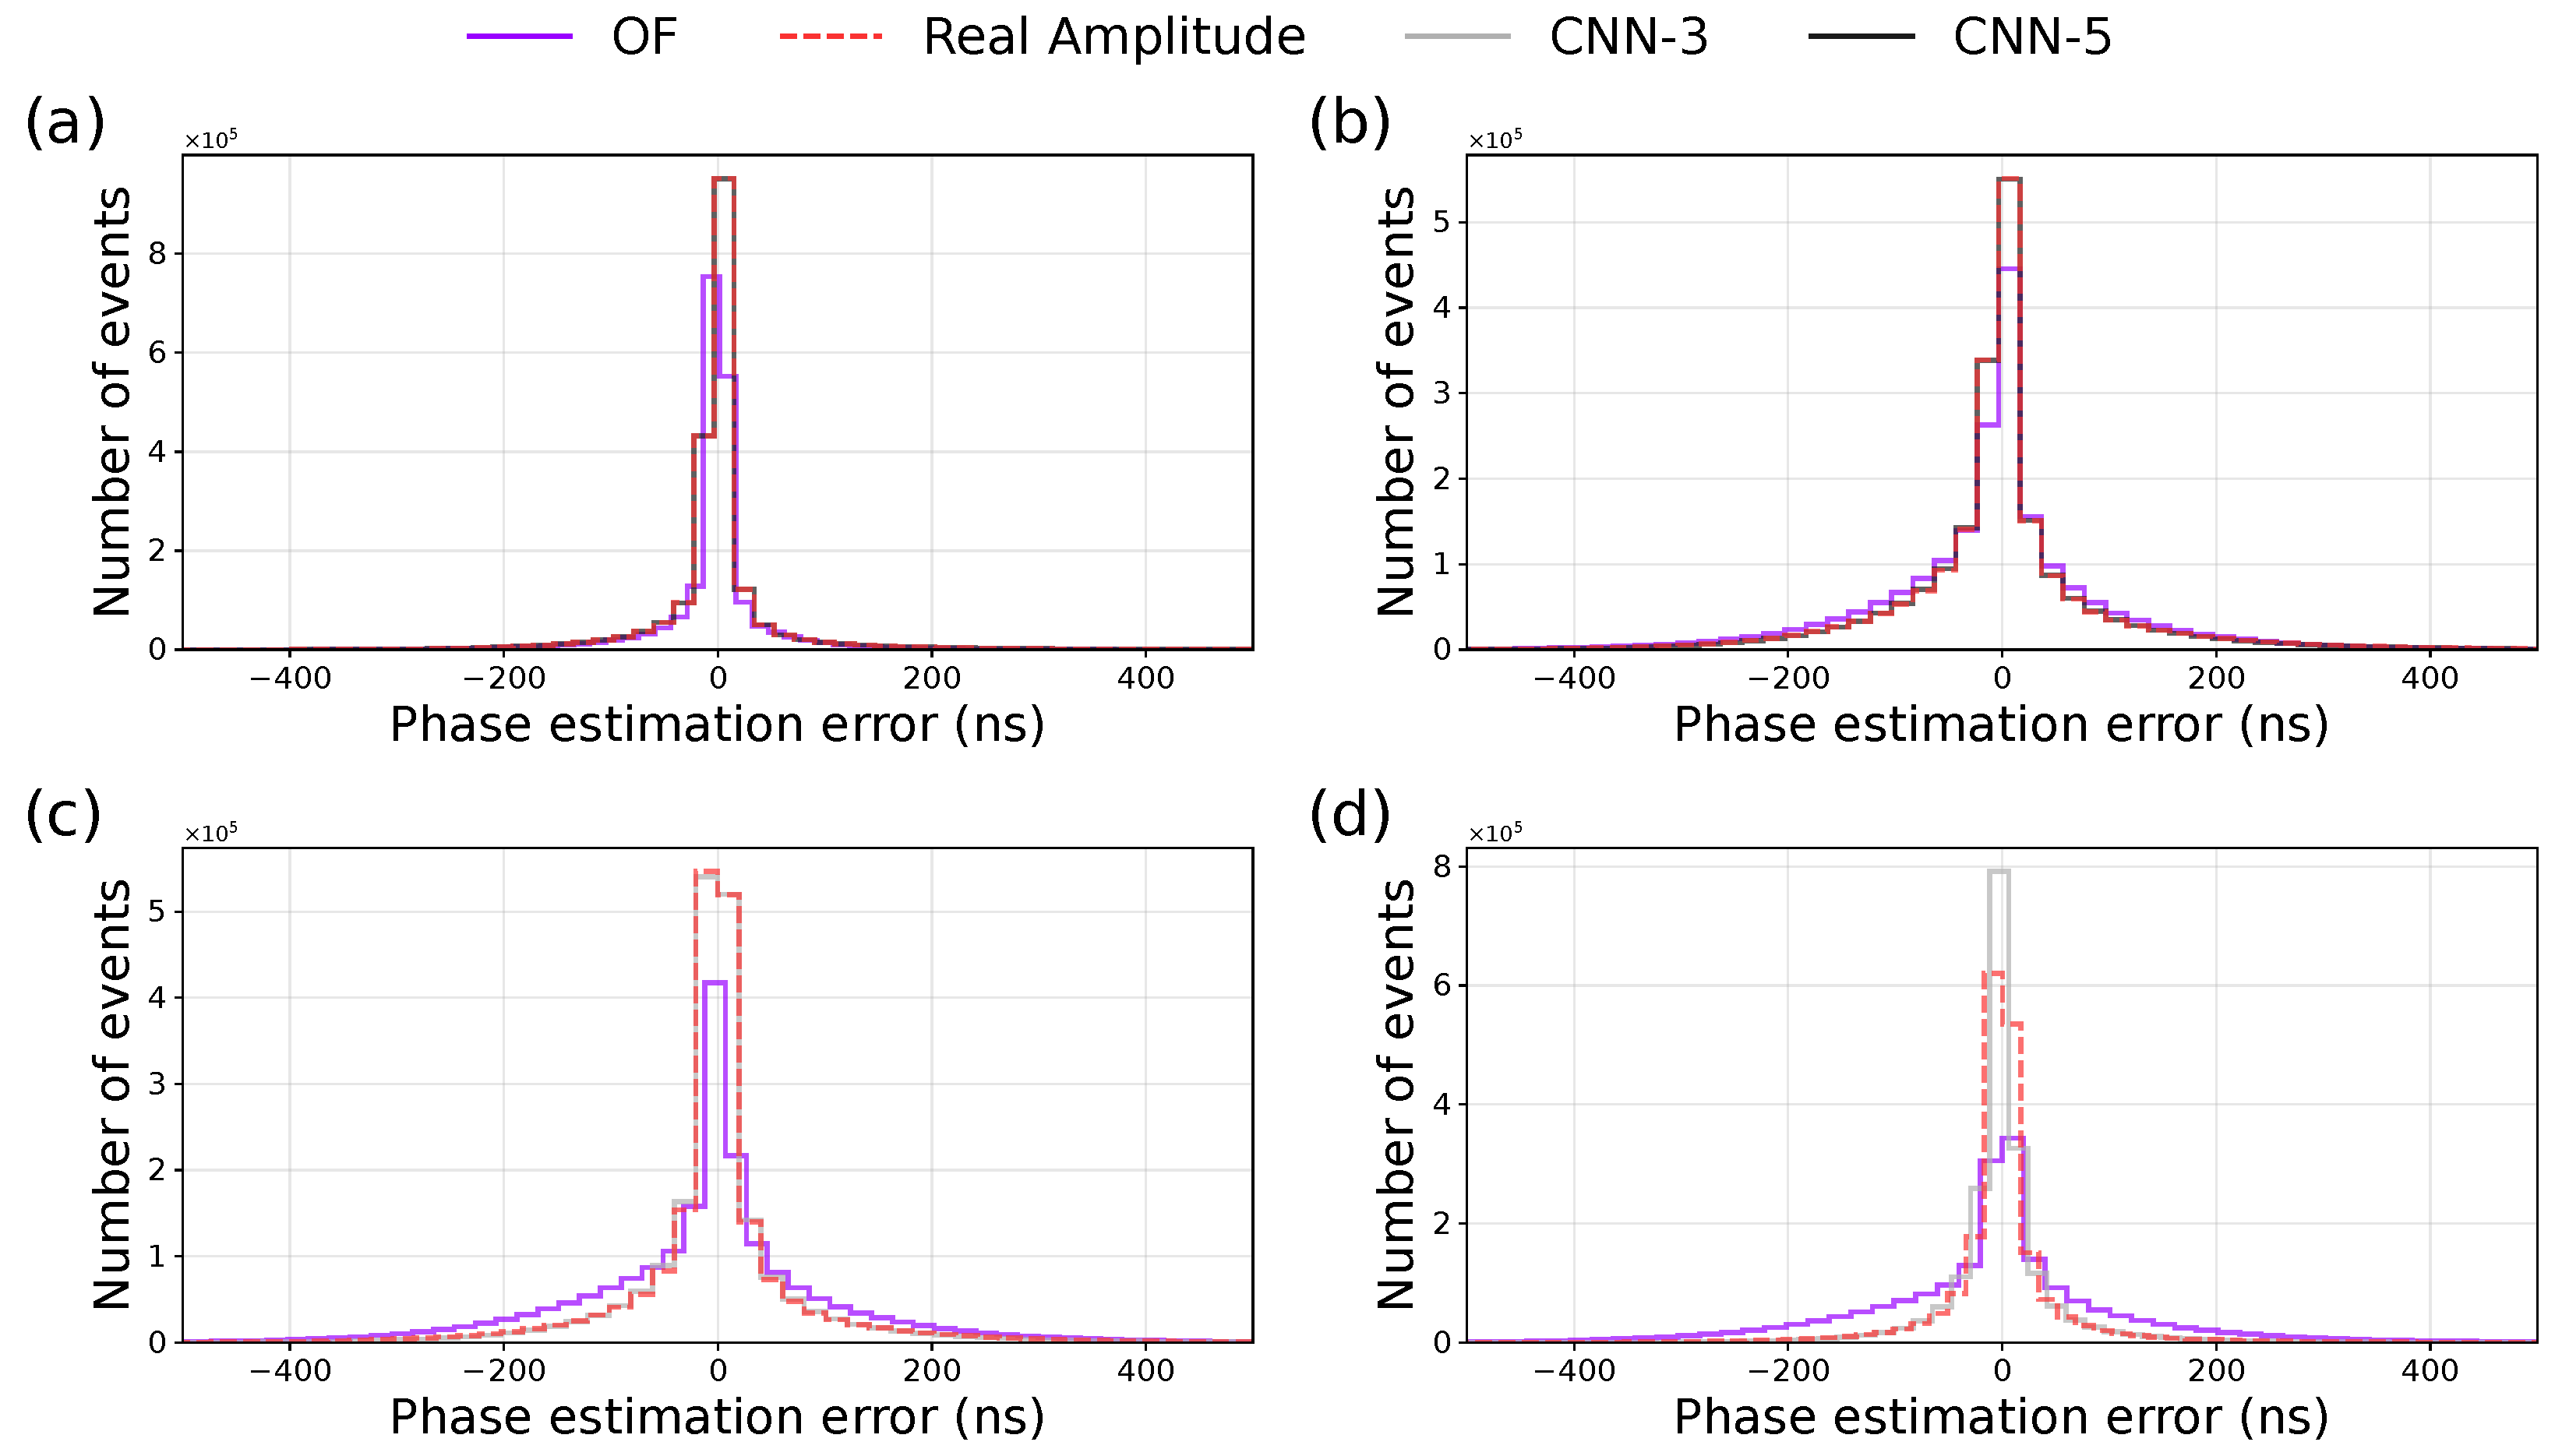
Histograms of the phase estimation error for occupancies (a) 10%, (b) 50%, (c) 80%, and (d) 100%, comparing three reconstruction approaches: division by the OF-estimated amplitude, by the true amplitude, and by the CNN-estimated amplitude.
Despite the globally elevated estimation errors observed for phase reconstruction, the relative improvements achieved by the CNN-based approaches carry relevant physical implications. Phase estimation, or timing reconstruction, directly affects the ability of the trigger system to correctly assign energy deposits to the appropriate bunch crossing, a critical requirement in high-luminosity environments [13]. Timing errors of the magnitude observed for the OF at high occupancy levels can lead to the misassignment of energy deposits to adjacent bunch crossings, degrading the quality of event reconstruction and potentially compromising the identification of rare physics processes [6]. The CNN-based approaches, by reducing the phase RMS by approximately 26% on average compared to the OF, demonstrate a meaningful improvement in this regard, particularly at higher occupancy levels where the OF deteriorates most severely. Furthermore, the CNN-estimated amplitude consistently approaches the performance of the true amplitude reference (RA) across all occupancy levels, indicating that the amplitude reconstruction quality directly propagates into more accurate phase estimates.
In addition to the quantitative metrics presented in Table 4, another way to evaluate the reconstruction performance of the proposed approaches is through the analysis of the phase estimation error histograms, shown in Figure 5.
From Figure 5, it can be observed that for most occupancy levels, phase estimation using the OF-estimated amplitude exhibits greater dispersion, with the exception of the 10% occupancy case, where all three approaches yield comparable dispersions. As occupancy increases, the dispersion associated with the OF grows substantially, while the mean error remains close to zero across all cases. At 10% occupancy, the reconstructions obtained using the CNN-estimated amplitude and the true amplitude are nearly overlapping, indicating that the CNN amplitude estimation error was sufficiently small. For occupancies of 50% and 80%, partial overlap between the CNN and true amplitude curves is still observed, further suggesting good amplitude reconstruction by the CNNs. Finally, at 100% occupancy, the CNN yields a mean error closer to zero compared to the true amplitude case; however, its dispersion is slightly larger in the tails of the distribution away from zero.
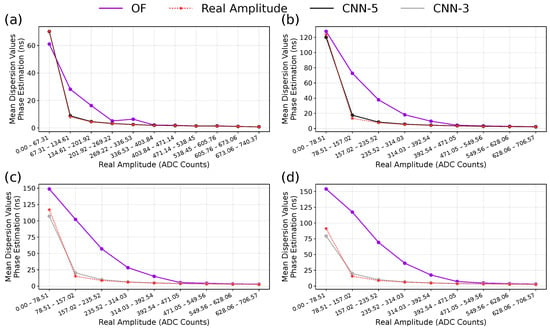
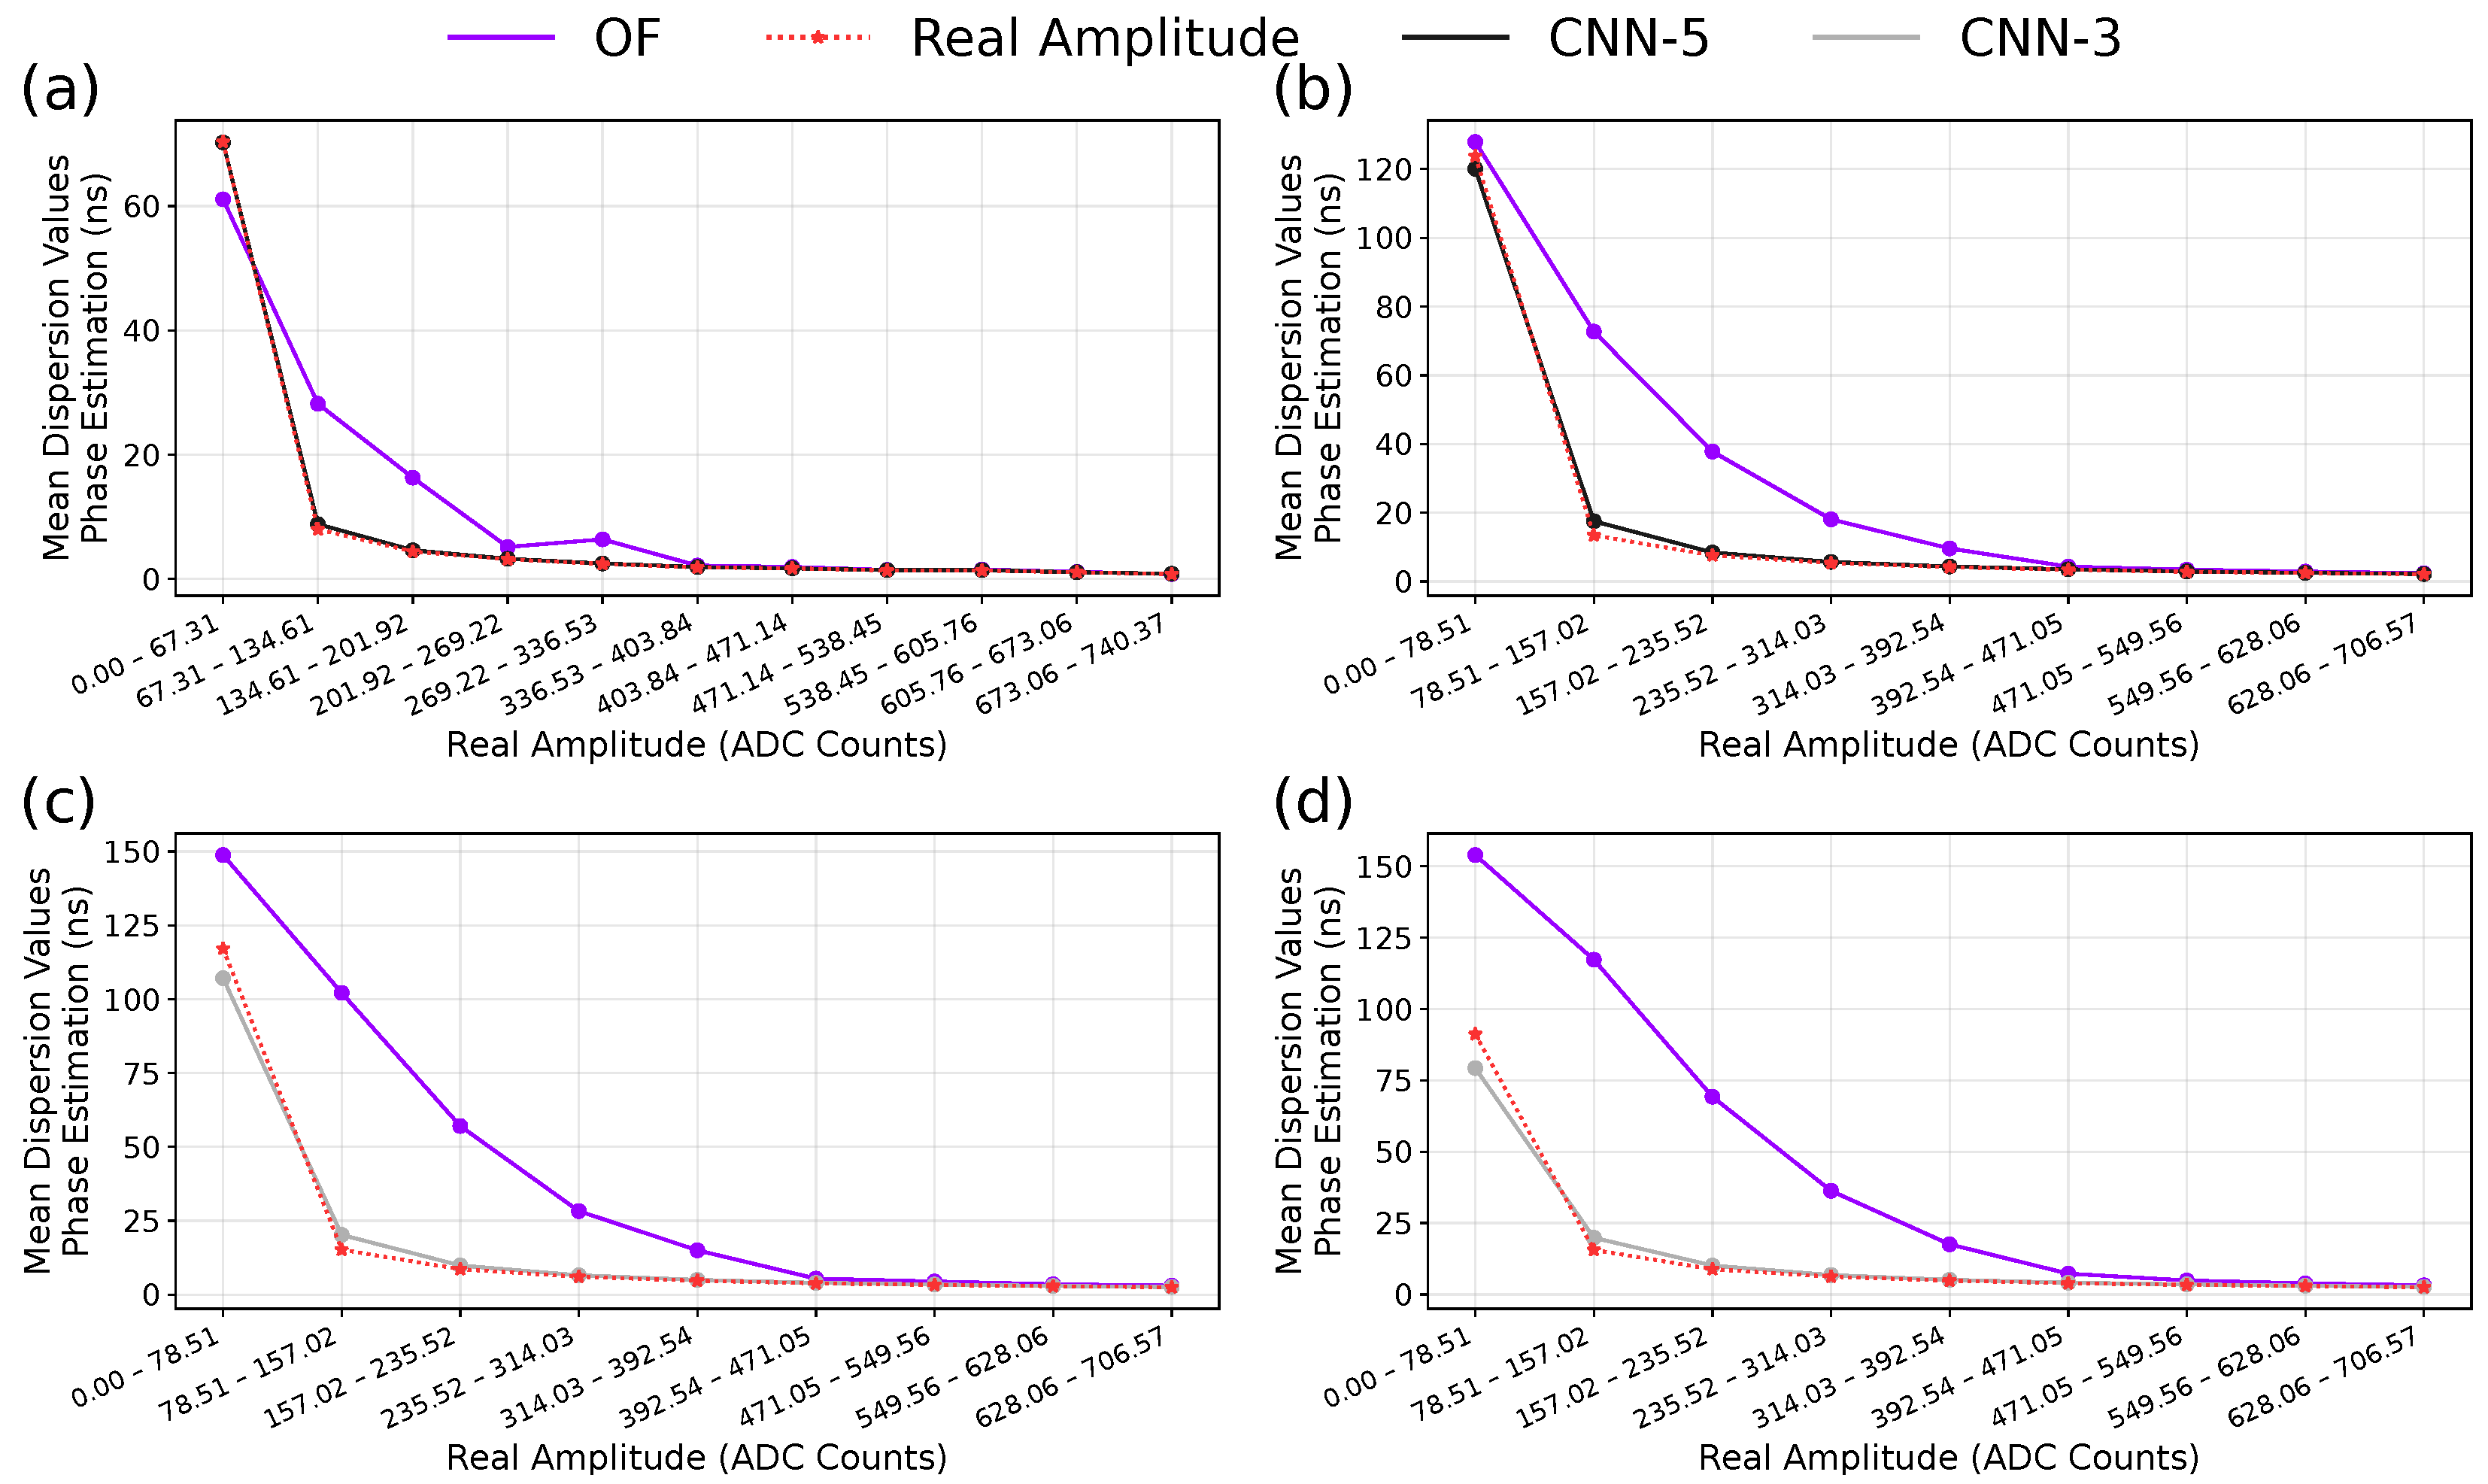
Another way to assess reconstruction performance is through the analysis of mean phase estimation dispersion as a function of true amplitude interval. It is worth noting that, for phase estimation, divisions by the estimated amplitude were normalized to ten for true amplitude values below ten ADC counts, in order to avoid division by very small numbers and the resulting overflow in the vertical axis, thereby preventing the introduction of outliers without compromising the overall reconstruction quality. Figure 6 presents the mean dispersion values of the phase estimation.
Figure 6.
Mean phase estimation dispersion as a function of true amplitude interval for occupancies (a) 10%, (b) 50%, (c) 80%, and (d) 100%, comparing the OF, the true amplitude, and the best-performing CNN architecture for each occupancy level.
From Figure 6, it can be observed that the OF consistently exhibits higher dispersion values across most occupancy levels, particularly in the low-amplitude region. This behavior is especially relevant since low-amplitude signals represent the most frequent events in the dataset, meaning that the OF’s degraded performance in this regime affects a substantial portion of the total data volume. In contrast, the CNN-based approaches maintain significantly lower dispersion values throughout this range, demonstrating superior phase reconstruction stability precisely where it matters most. As the true amplitude increases, the dispersion decreases rapidly for all methods; however, the OF exhibits a notably slower convergence, maintaining comparatively elevated dispersion values across the low-to-intermediate amplitude range before eventually converging at higher amplitude values.
5.4. CNN-8: Combined Architecture
With the goal of investigating whether combining the architectural improvements from the best-performing networks for the studied occupancy levels (CNN-3 and CNN-5) could yield further gains, a new convolutional neural network (CNN-8) was designed. This architecture builds upon the base model (CNN-1) by incorporating two modifications: an increased kernel size, from to , and an expanded fully connected stage, going from one to two dense layers with 64 and 32 neurons, respectively. A comparison between the previously evaluated architectures and CNN-8 is presented in Figure 7.
Figure 7.
Comparison between the previously evaluated CNN architectures and the newly proposed CNN-8 for each occupancy level. RMS, MAE, and MedAE are expressed in ADC counts, while is dimensionless.
From Figure 7, it can be observed that at 10% occupancy, CNN-8 achieves an improvement only in RMS relative to the best-performing architecture for that level (CNN-5), whereas at 50% occupancy it outperforms CNN-5 across all four metrics. At 80% occupancy, CNN-8 yields better results than CNN-3 in terms of RMS, , and MAE. At 100% occupancy, however, the new architecture performs worse than CNN-3, which had previously delivered the best results for that occupancy level.
From a practical deployment perspective, the selection between these architectures may be guided by the expected occupancy regime of the target experiment. In scenarios where the calorimeter occupancy is anticipated to remain below 50%, such as in moderate-luminosity runs or peripheral collision events, the results obtained in this study suggest that CNN-5 may be the most suitable option, as its expanded dense stage provided superior performance at lower pile-up levels, where pulse shapes are less distorted. For high-occupancy conditions, with occupancy levels at or above 80%, CNN-3 appears to be preferable, since its larger convolutional kernel size enables the capture of broader temporal correlations associated with severe pile-up. In cases where the occupancy regime is not known a priori or varies significantly during operation, CNN-8 may be considered as a compromise architecture, albeit at a marginally higher computational cost and without consistent performance gains across all evaluated occupancy levels. Regarding the second dense layer in CNN-8 specifically, the results do not demonstrate that this additional layer provides a statistically meaningful improvement, suggesting that the added representational capacity does not translate into better generalization for the signal lengths and occupancy conditions evaluated here. While these observations are specific to the simulated datasets and occupancy scenarios considered in this work, they may provide useful guidance for selecting an appropriate architecture without requiring the retraining of all evaluated models.
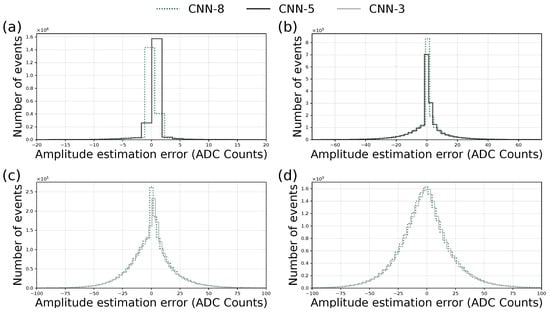
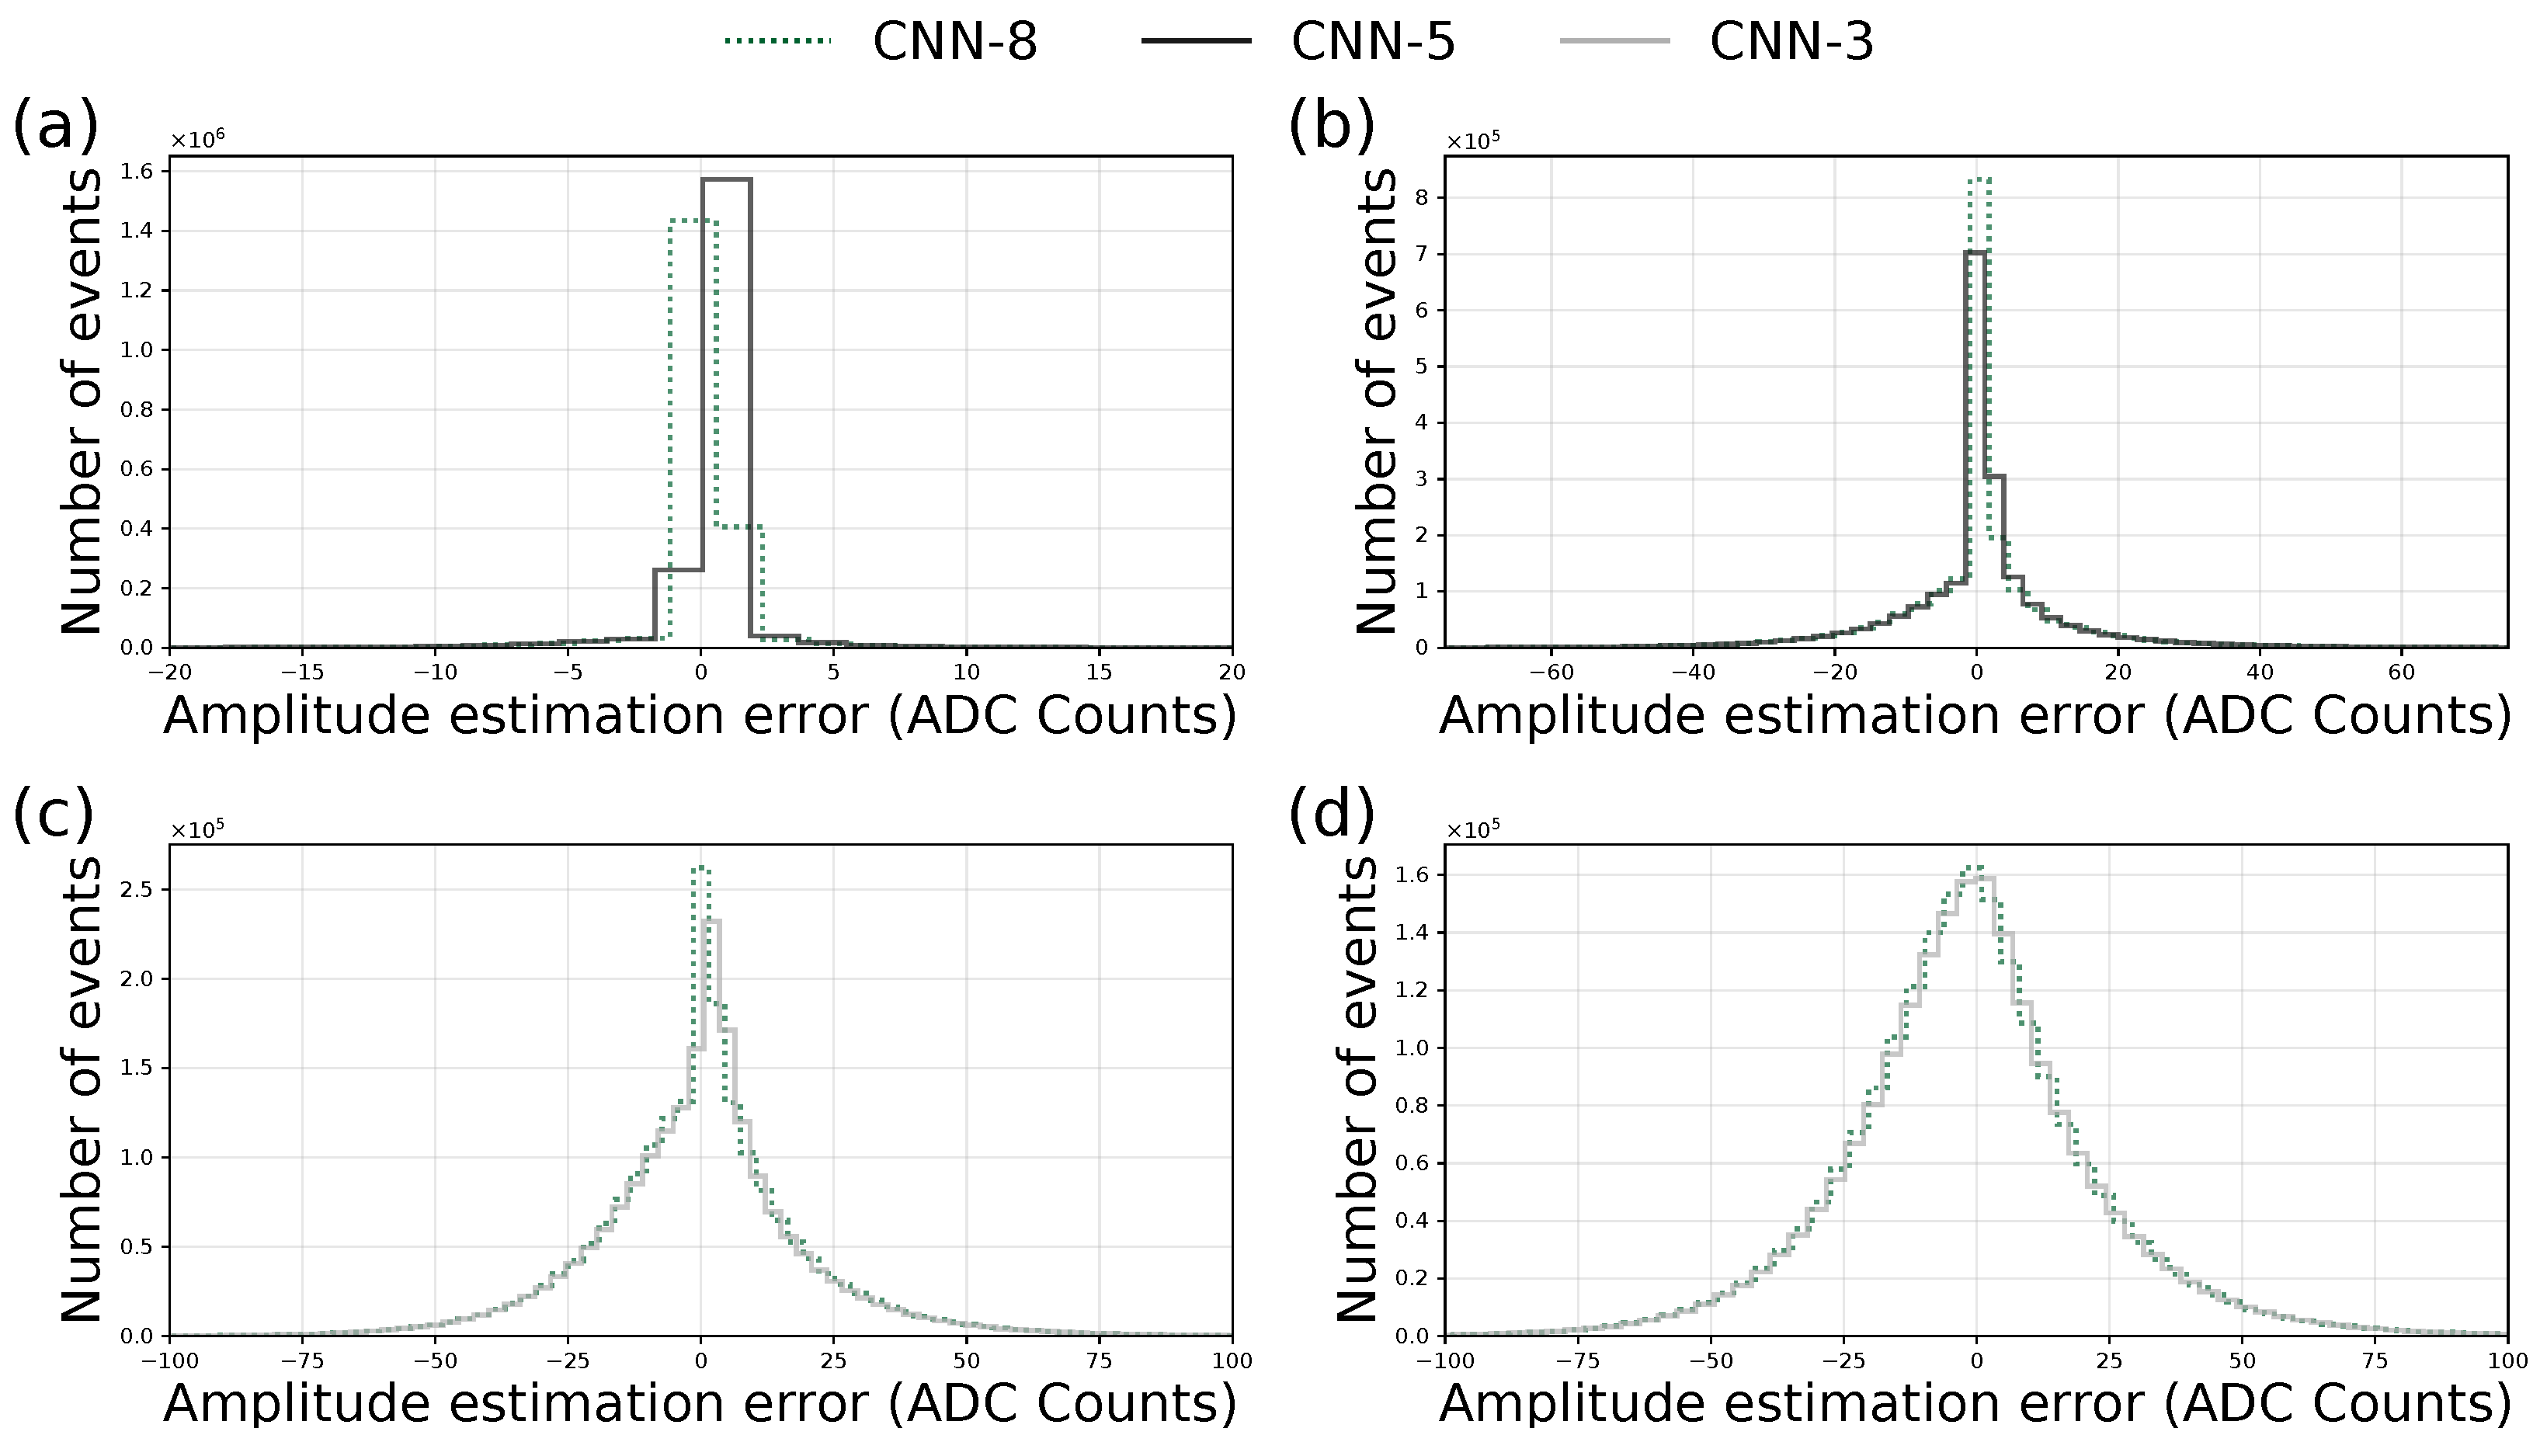
Following the same approach presented previously, the CNN architectures will be compared both for amplitude and phase estimation. Figure 8 presents the amplitude estimation error histograms for the three CNN architectures under study.
Figure 8.
Histograms of the amplitude estimation error for occupancies (a) 10% (CNN-5), (b) 50% (CNN-5), (c) 80% (CNN-3), and (d) 100% (CNN-3), comparing three reconstruction approaches: CNN-3, CNN-5 and CNN-8.
From Figure 8, it can be observed that for occupancies of 10%, 50%, and 80%, CNN-8 yields a mean error closer to zero along with a slightly lower dispersion. At 100% occupancy, however, the new architecture presents a marginally larger dispersion and a mean error slightly more distant from zero.
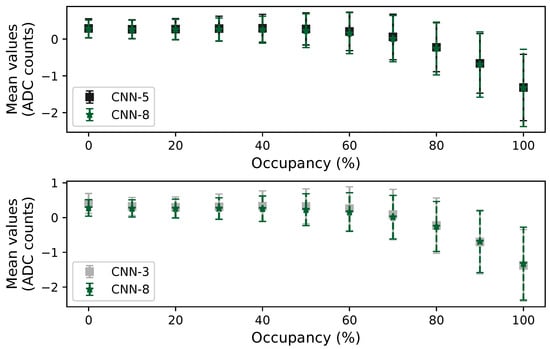
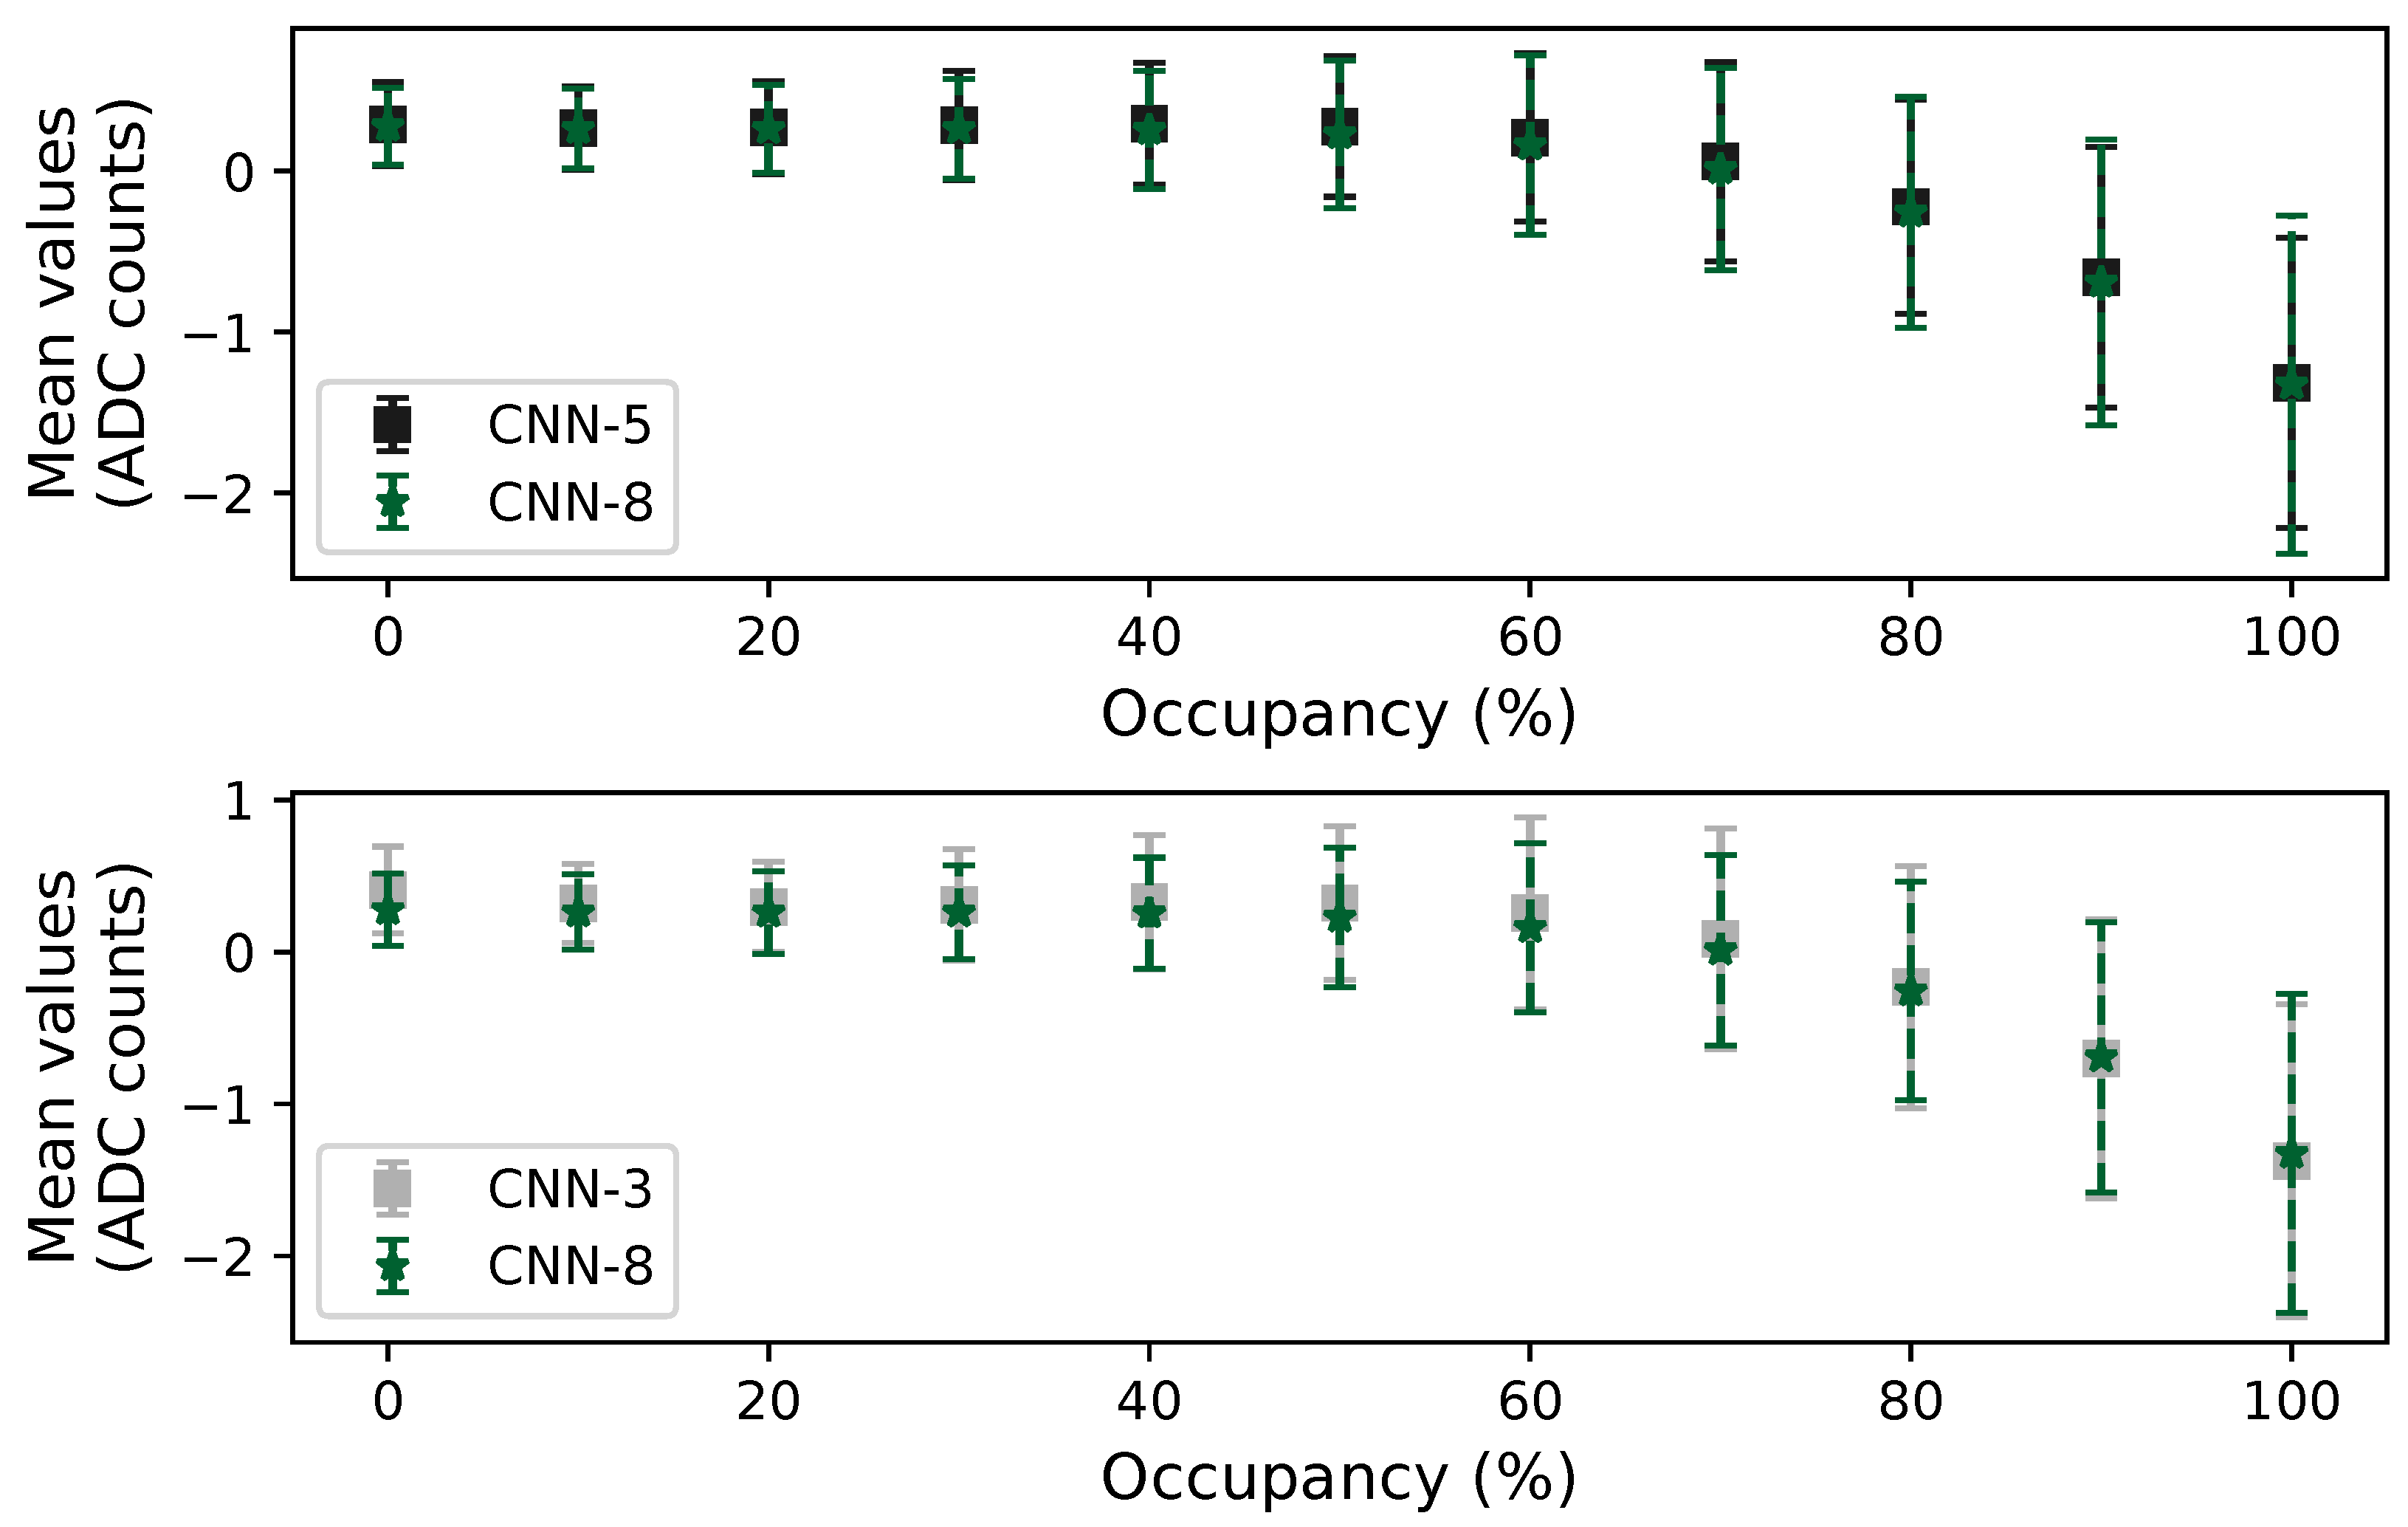
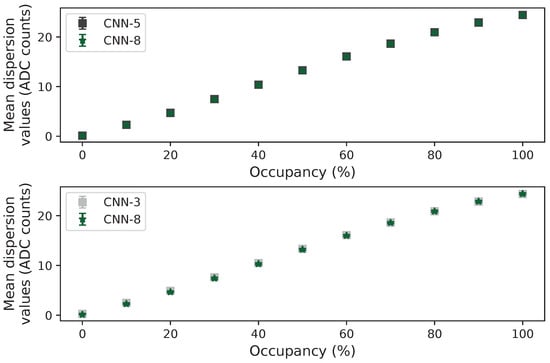
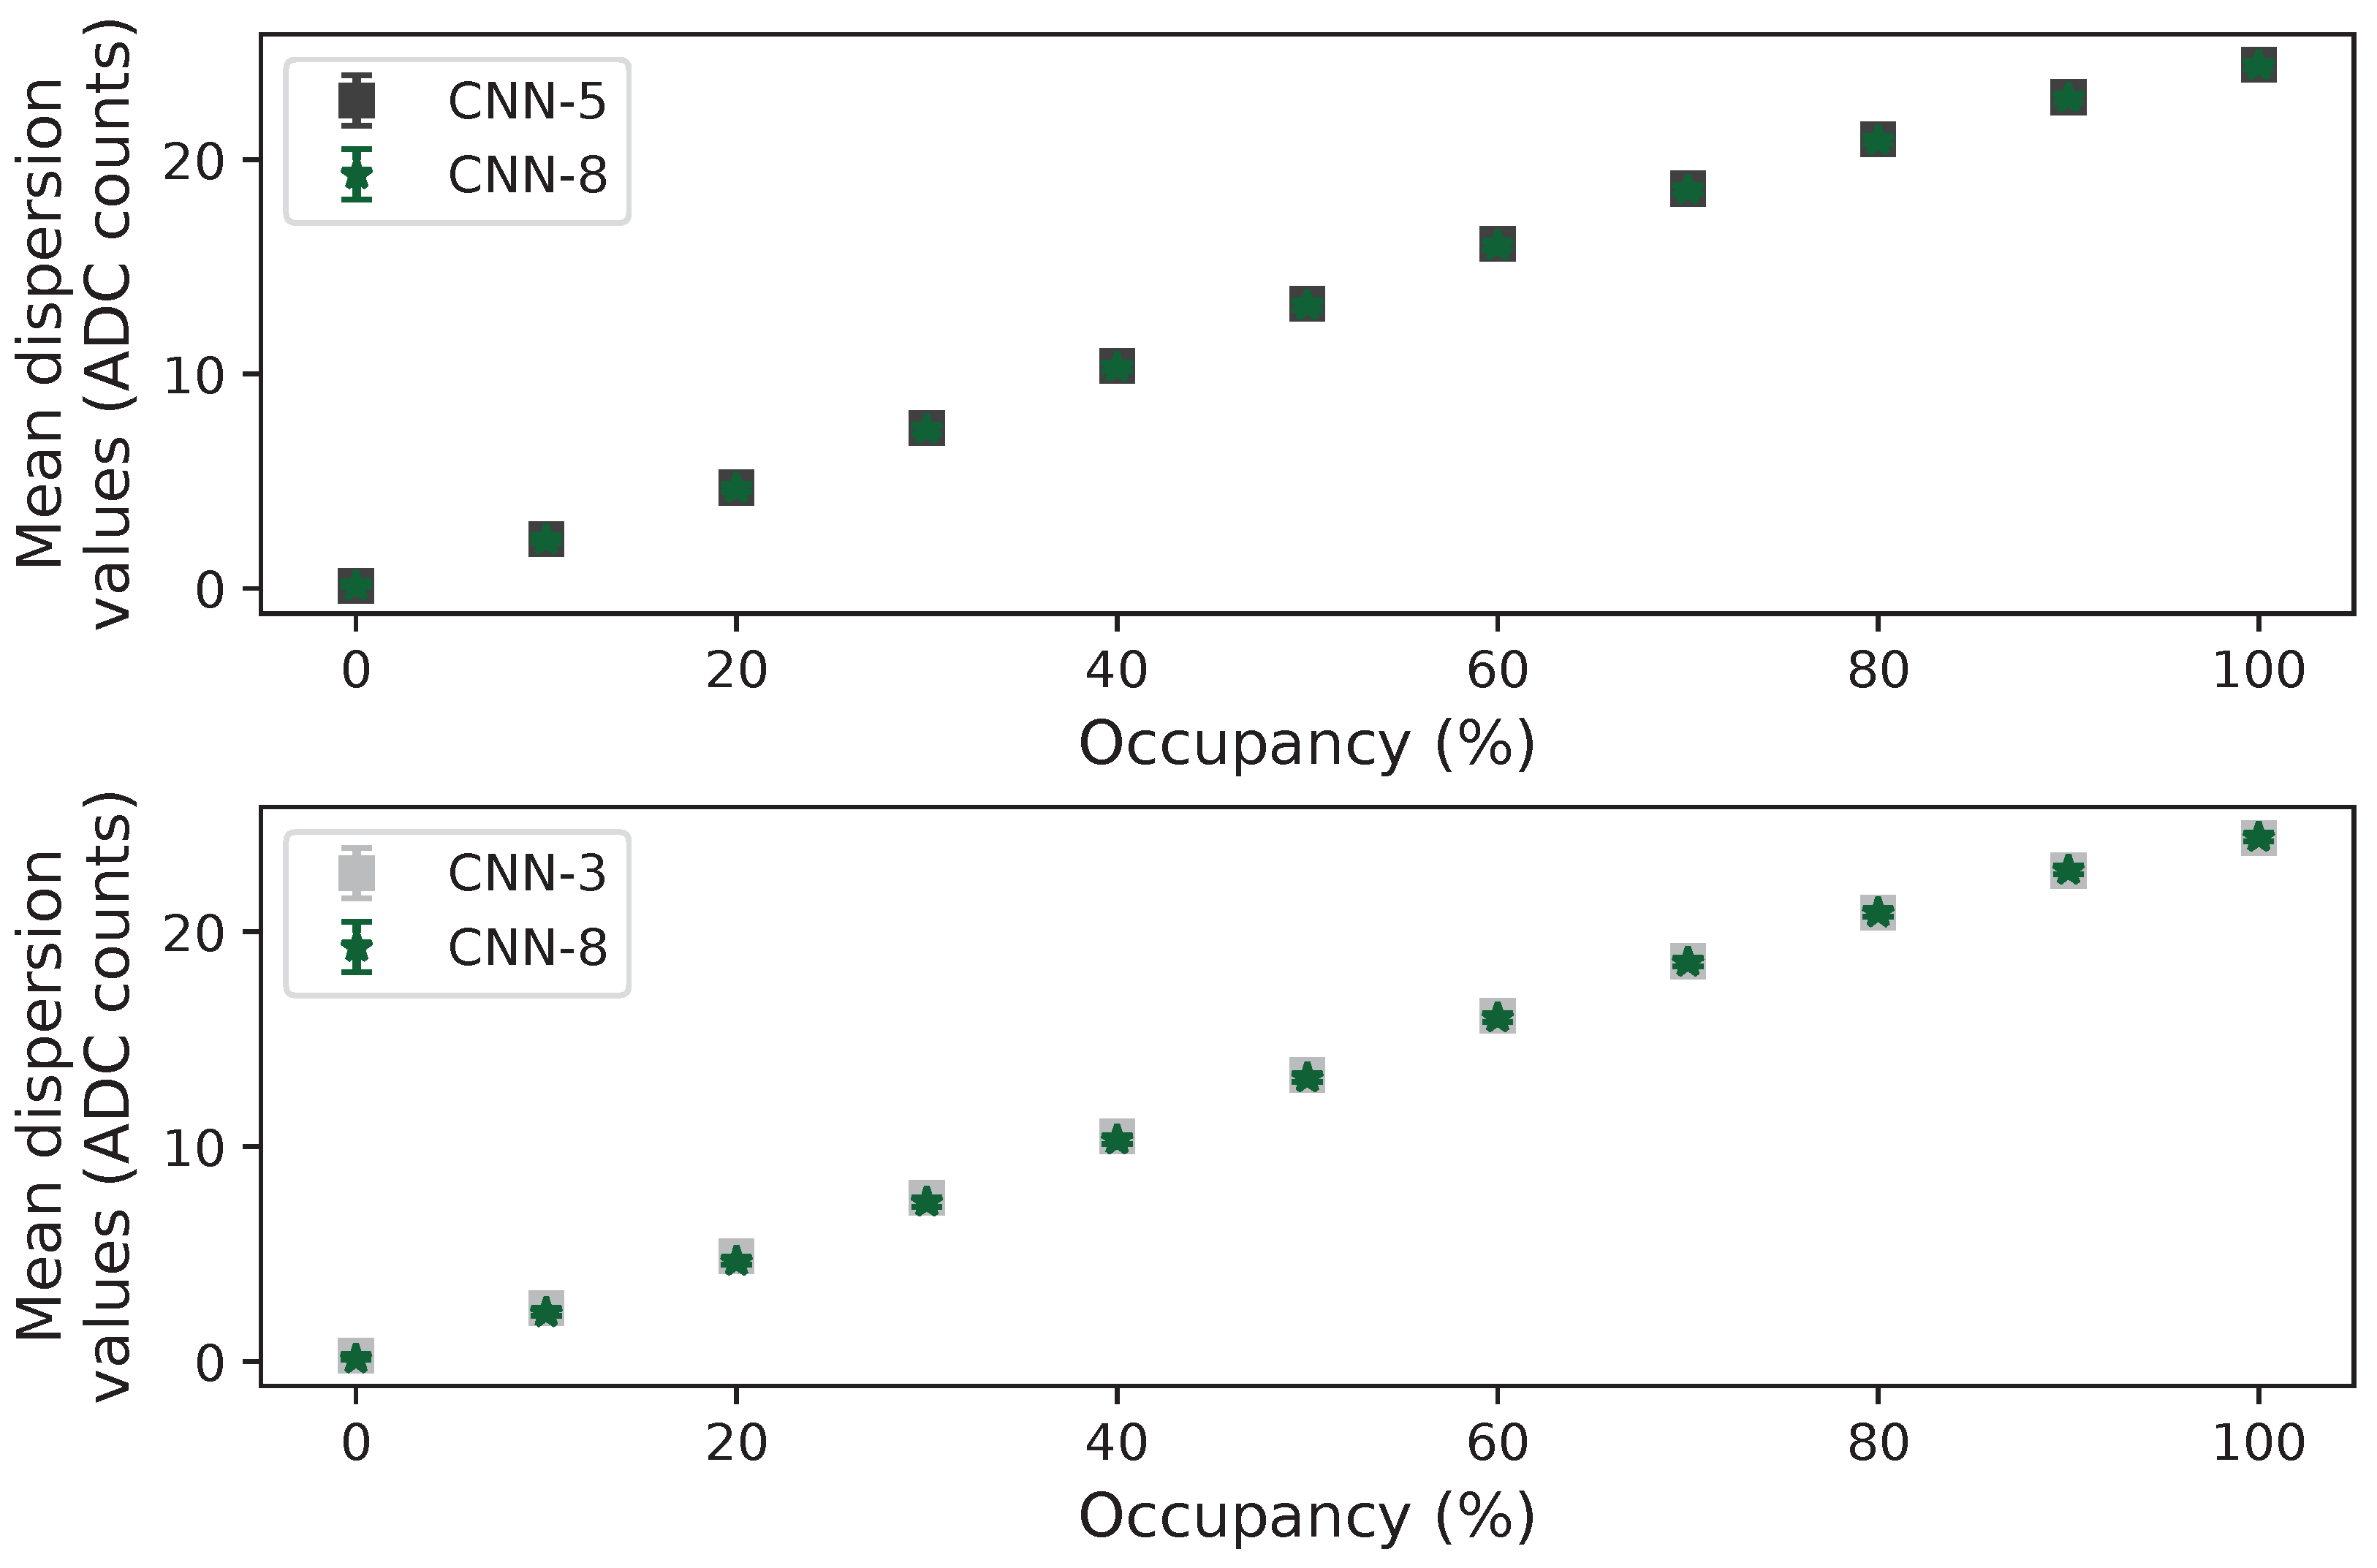
Figure 9 and Figure 10 present the behavior of the three CNN architectures across all occupancy levels in terms of mean estimation error and dispersion, including the corresponding standard deviations. The results show that all architectures achieve very similar performances, with only minor differences in both the mean values and the dispersion metrics throughout the occupancy range. Although small variations can be observed when analyzing the standard deviation bars in detail, the overall behavior remains remarkably consistent among the three CNN models.
Figure 9.
Mean values of the phase estimation error comparing the previously evaluated CNN architectures and the newly proposed CNN-8 for all occupancies.
Figure 10.
Mean dispersion values of the phase estimation error comparing the previously evaluated CNN architectures and the newly proposed CNN-8 for all occupancies.
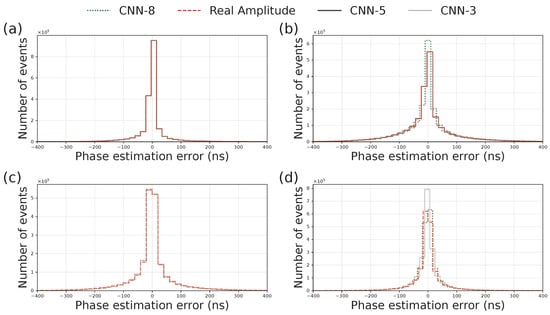
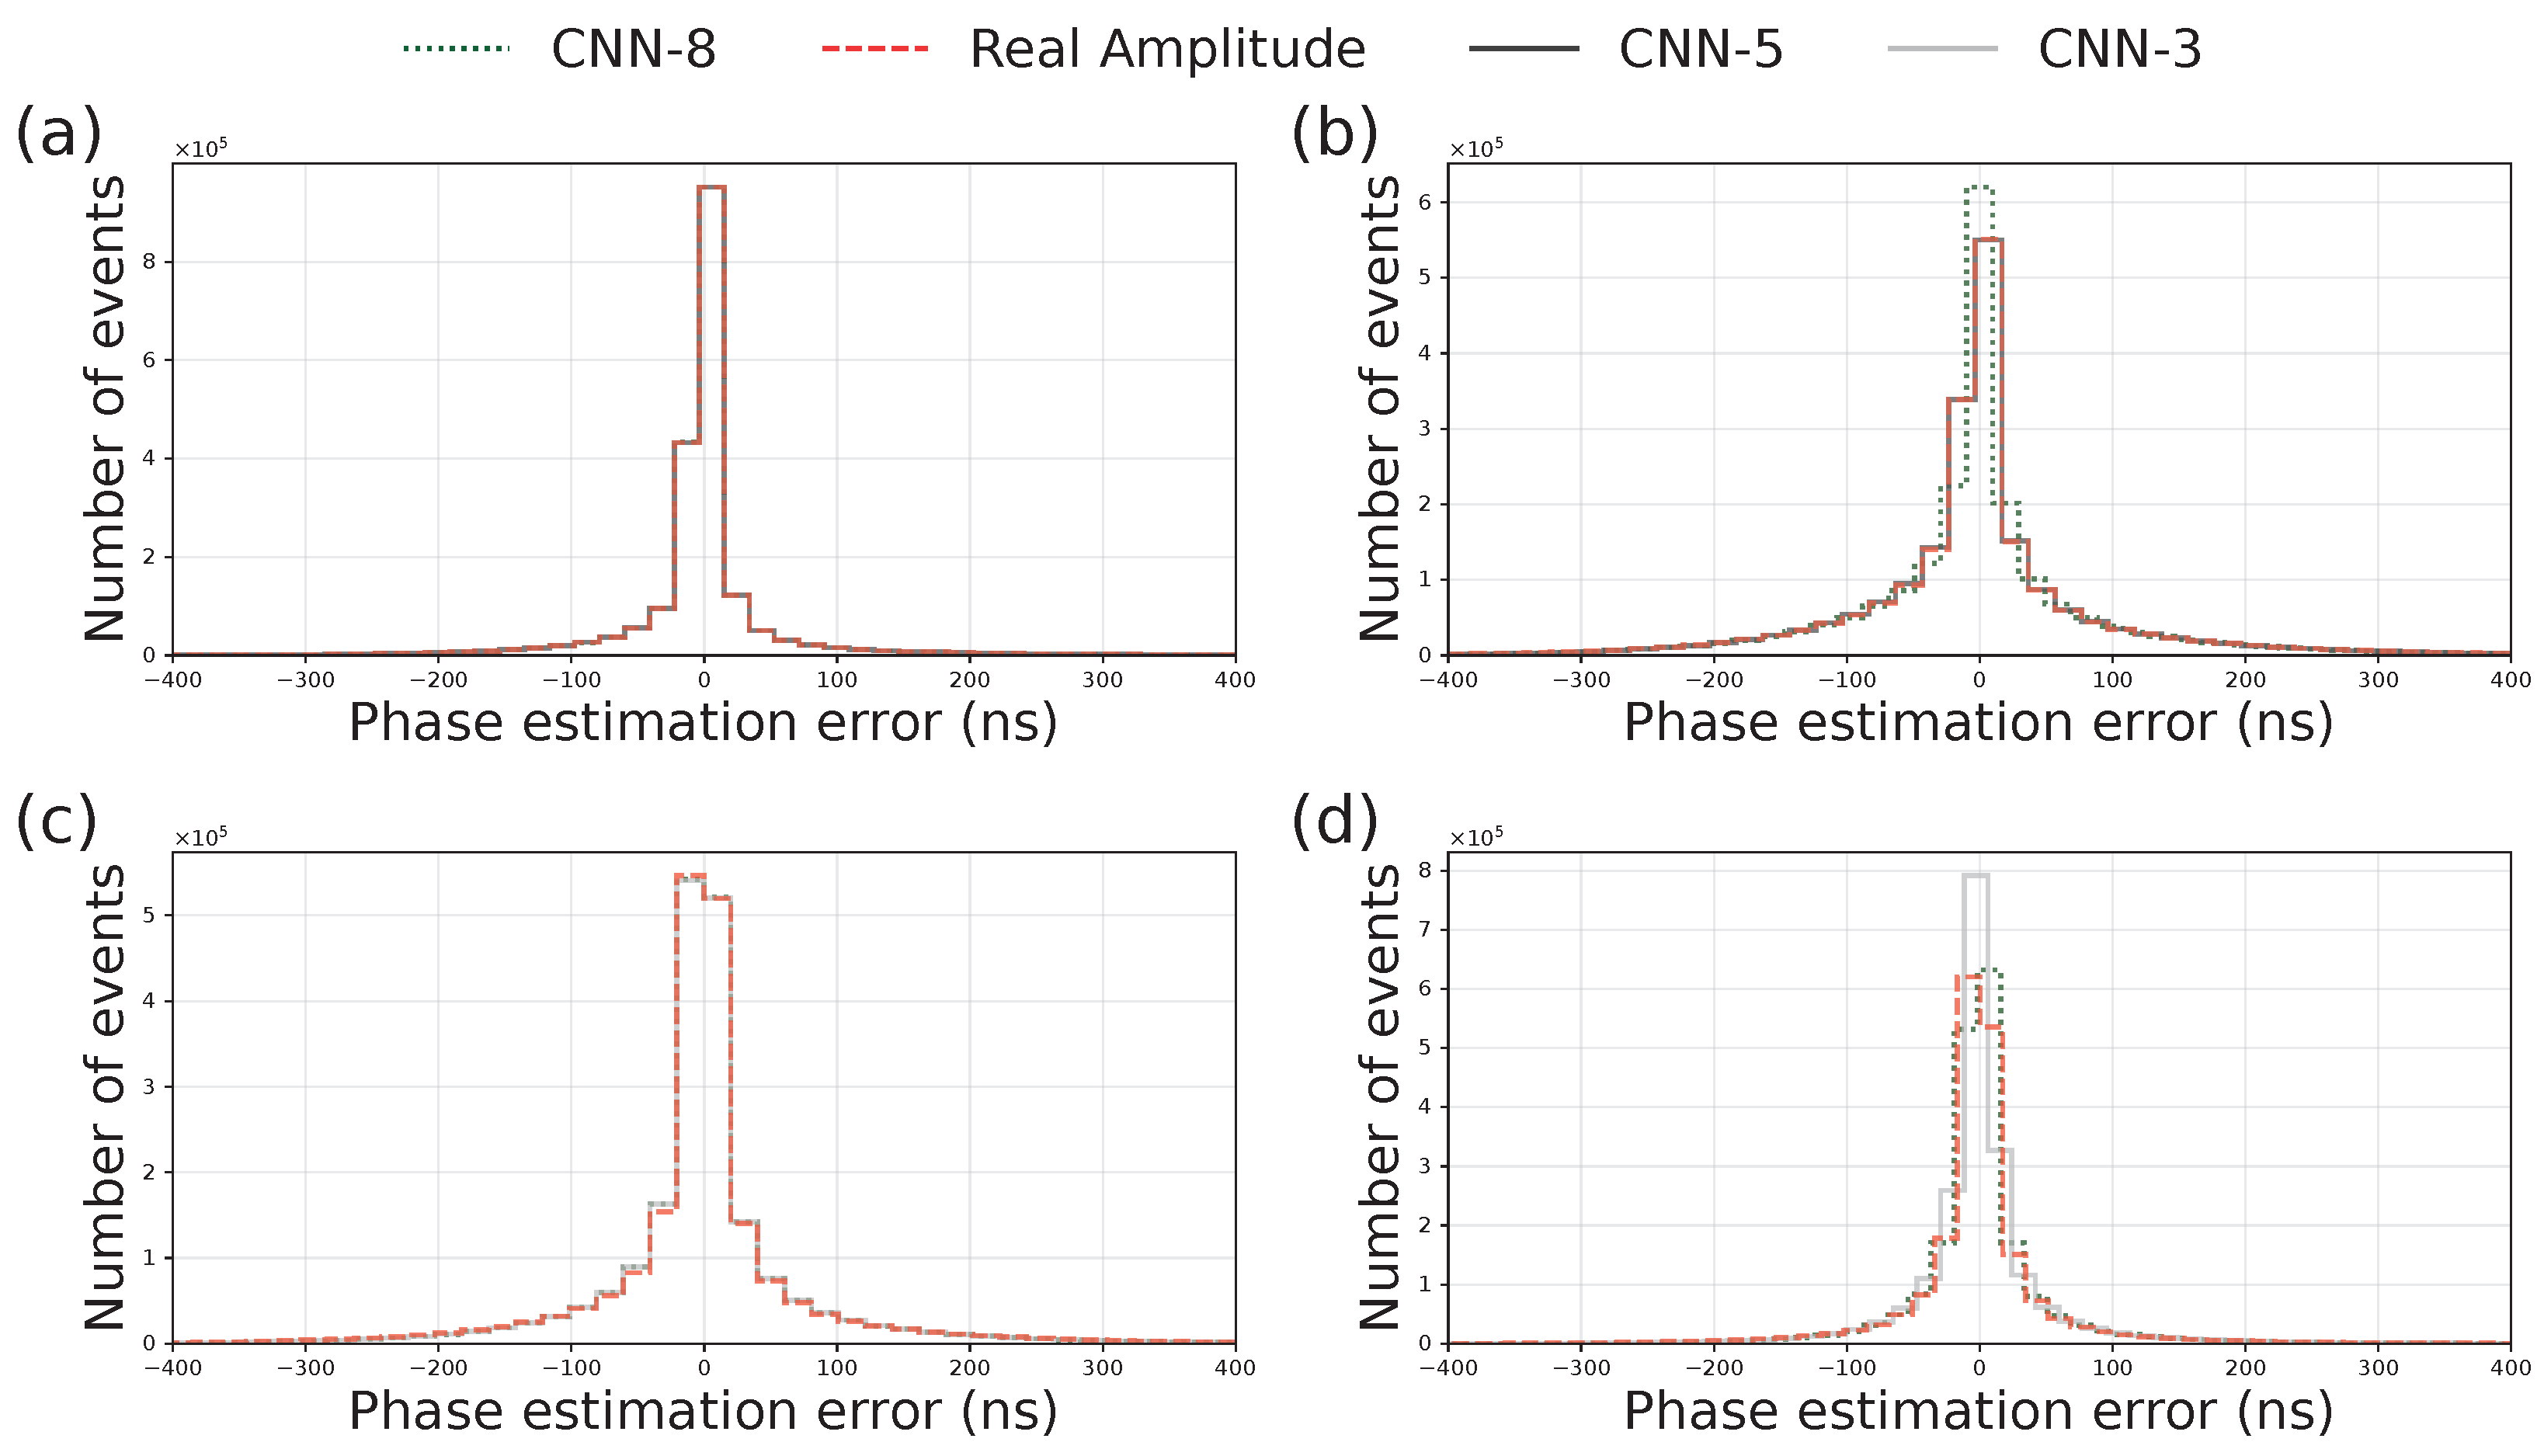
Following the amplitude reconstruction analysis, phase estimation was carried out using each of the three architectures alongside the true amplitude, in order to assess how the amplitude estimation quality influences phase reconstruction. Figure 11 presents the phase estimation error histograms for the three CNN architectures and the true amplitude reference.
Figure 11.
Histograms of the phase estimation error for occupancies (a) 10% (CNN-5), (b) 50% (CNN-5), (c) 80% (CNN-3), and (d) 100% (CNN-3), comparing three reconstruction approaches: CNN-3, CNN-5, CNN-8 and Real Amplitude.
From Figure 11, it can be observed that at 10% occupancy, all three CNN architectures and the true amplitude yield nearly overlapping distributions, indicating comparable performance across all approaches. At 50% occupancy, CNN-8 produces a mean error closer to zero, while CNN-5 shows distributions largely overlapping with the true amplitude reference. At 80% occupancy, CNN-8 and CNN-3 exhibit overlapping responses, whereas the true amplitude presents a slight deviation. Finally, at 100% occupancy, all methods yield noticeably distinct distributions: CNN-3 achieves a mean error closest to zero, albeit at the cost of a slightly larger dispersion.
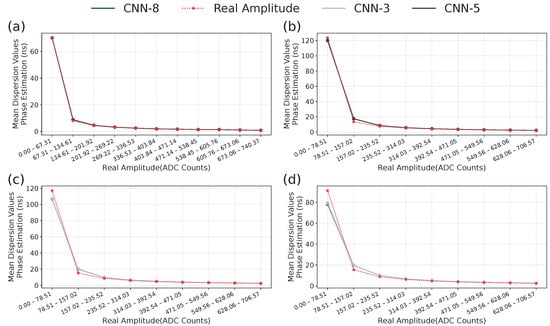
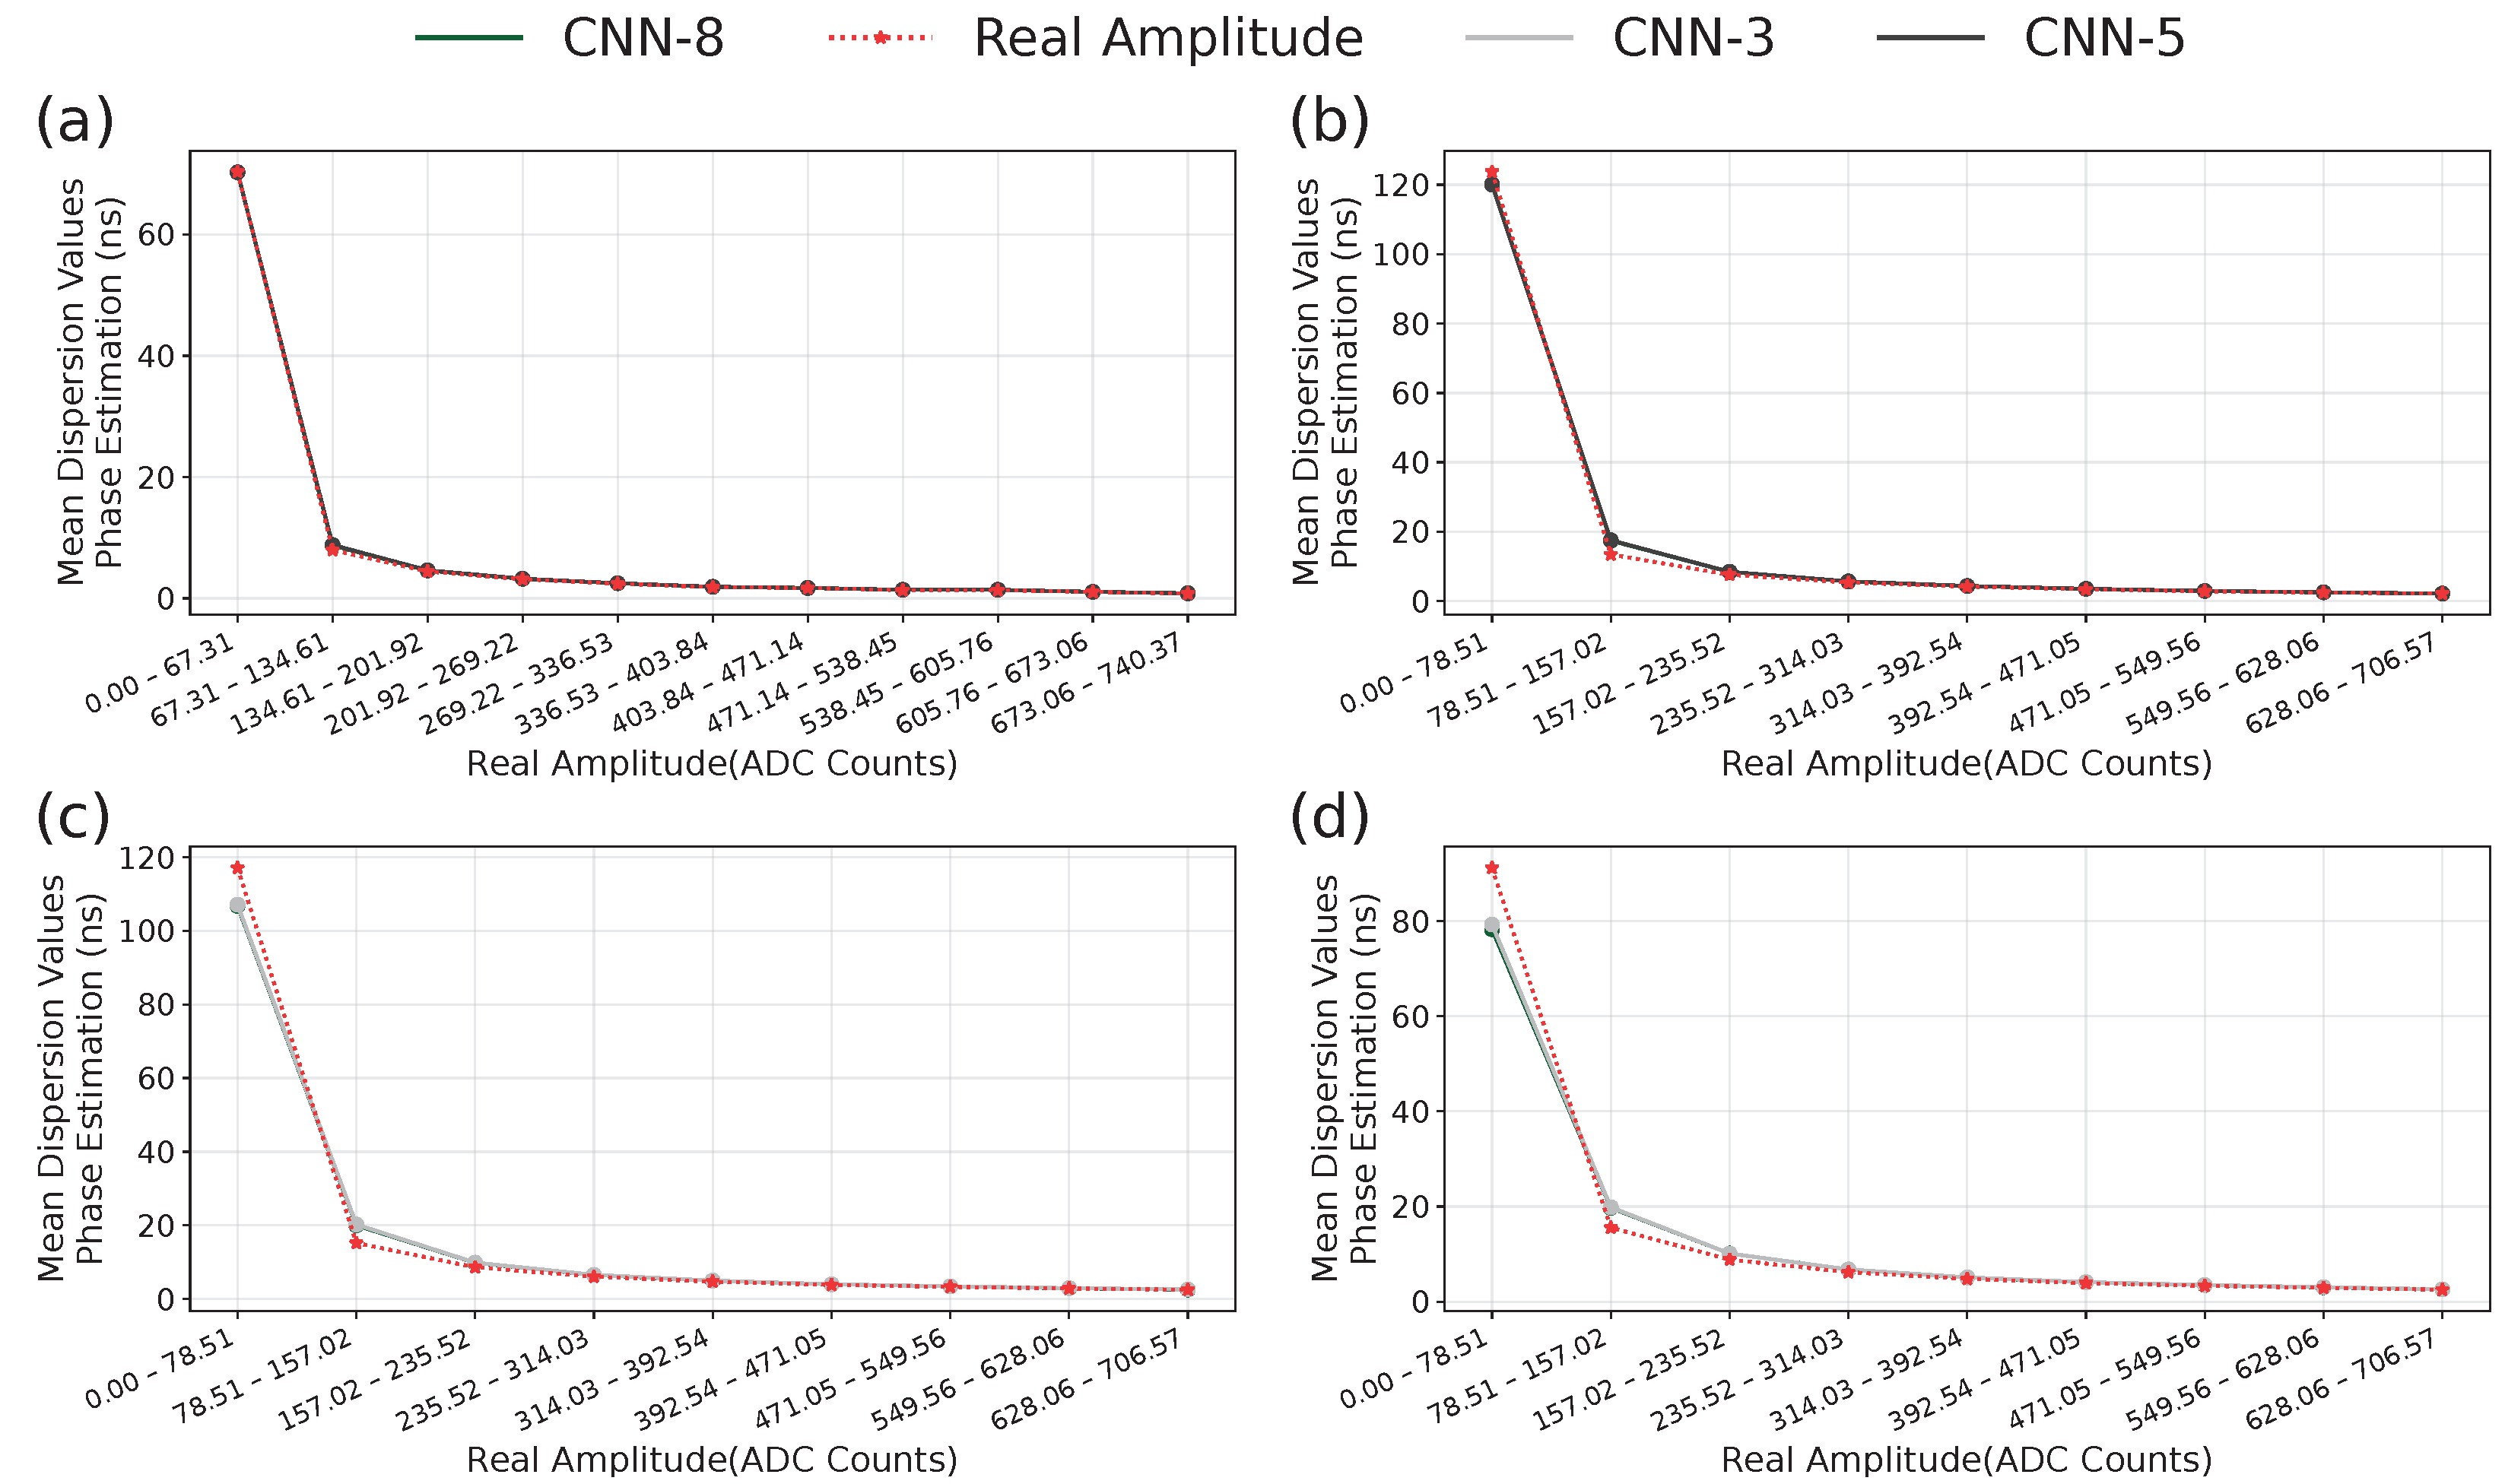
Figure 12 presents the mean phase estimation dispersion as a function of true amplitude interval. As in the previous analysis, estimated or true amplitude values below ten ADC counts were normalized to ten to avoid division by very small numbers.
Figure 12.
Mean phase estimation dispersion as a function of true amplitude interval for occupancies (a) 10%, (b) 50%, (c) 80%, and (d) 100%, comparing three reconstruction approaches: CNN-3, CNN-5, CNN-8 and Real Amplitude for each occupancy level.
From Figure 12, it can be observed that the CNN architectures compared for each occupancy level yield largely overlapping results across most true amplitude intervals, suggesting that the three models achieve equivalent phase reconstruction quality. Overall, these results indicate that although CNN-8 incorporates architectural improvements drawn from the best-performing models, its gains over CNN-3 and CNN-5 are marginal and inconsistent across occupancy levels and metrics. Given that a more complex architecture entails higher computational cost, the performance improvements observed in some scenarios do not appear to justify the additional overhead. Therefore, CNN-5 and CNN-3 remain the preferred architectures for low-to-medium and high occupancy levels, respectively.
6. Computational Cost
Based on the obtained results, it is evident that the use of convolutional neural networks provides substantial improvements in reconstruction quality compared to the Optimal Filter method. However, since reconstruction systems in high-energy physics experiments demand near-real-time operation, processing time becomes a critical factor in the design of any methodology. In this study, each CNN architecture was trained and subsequently applied to reconstruction, resulting in a high total execution time—around 6 h per architecture—whereas the Optimal Filter performs the same task in approximately 10 min. This computational cost of CNNs is almost entirely dominated by the training phase, especially due to the use of K-fold cross-validation, in which the network is fully retrained at each fold, producing multiple complete parameter-adjustment cycles.
Nonetheless, it is important to emphasize that this additional cost is confined exclusively to the training phase. Once trained, the neural network can have its weights stored and directly used in the inference stage, eliminating the need for retraining. In this phase, processing occurs significantly faster, enabling near-real-time amplitude reconstruction. Prior work has demonstrated that ANN inference on FPGAs can be executed with latencies of only a few clock cycles, representing a small fraction of the resources available on modern devices [21]. Given that the architectures evaluated here are lightweight, with at most two convolutional layers and two dense layers, their inference complexity is comparatively modest, reinforcing their suitability for hardware deployment. Thus, even if initial training requires several hours, this computational investment may be justified by the improvements in reconstruction accuracy and robustness observed in this study. Together with the relatively modest complexity of the evaluated architectures, these results support the feasibility of CNN-based approaches as competitive alternatives for continuous signal reconstruction in high-luminosity environments [39,40].
7. Conclusions
This work showed that the application of Convolutional Neural Networks to 1D grid-structured data (time series) proved to be highly effective for the signal amplitude and phase reconstruction tasks in high-energy calorimeter systems, considering the signal pile-up conditions. The CNNs were able to produce consistent estimates, outperforming the traditional linear Optimal Filter method. Furthermore, no single architecture was found to be universally ideal: different configurations respond differently to each occupancy regime, reinforcing the importance of carefully evaluating architectures before practical deployment.
Quantitatively, considering all evaluated occupancy levels (10%, 50%, 80%, and 100%), the CNN-based approaches achieved substantial average gains relative to the Optimal Filter method. For amplitude reconstruction, the CNNs provided average improvements of approximately 79% in RMS and 62% in standard deviation. These gains are expected to contribute to improved energy-resolution performance, an important requirement for particle identification and event reconstruction in high-luminosity environments [6,13]. Notably, while the OF degrades to below-baseline performance at full occupancy (), the CNNs consistently maintain high reconstruction quality (), indicating their potential applicability under severe pile-up conditions comparable to those foreseen in future high-luminosity collider operations.
For phase reconstruction, average improvements of nearly 26% were obtained for both RMS and standard deviation metrics, which translates into more accurate timing reconstruction, a critical factor for correct bunch-crossing assignment and trigger efficiency in high-luminosity experiments [13]. Furthermore, the CNN-estimated amplitude was found to consistently approach the performance of the true amplitude reference across all occupancy levels, demonstrating that improvements in amplitude reconstruction directly propagate into more reliable phase estimates.
Furthermore, the comparison between the best-performing CNN architectures for each occupancy level and their combination into a new architecture (CNN-8) demonstrated that such a combination can yield marginal gains in some scenarios; however, in the case studied, these gains do not fully justify the additional computational cost associated with training a more complex network. Among the evaluated architectures, CNN-5 and CNN-3 emerged as the most suitable choices for low-to-medium and high occupancy regimes, respectively. CNN-5, with its expanded dense stage, demonstrated superior performance at occupancy levels up to 50%, where pile-up distortions are moderate and finer amplitude discrimination is possible. CNN-3, with its larger convolutional kernel size, proved more effective at occupancy levels of 80% and above, where broader temporal correlations introduced by severe pile-up require a wider receptive field. These findings suggest that, in practical deployment scenarios, the choice of architecture should be guided primarily by the expected occupancy regime of the target experiment: CNN-5 is recommended for moderate pile-up conditions, while CNN-3 is preferred for high-luminosity environments where signal overlap is severe.
The results also show that, as occupancy increases, noise levels and signal pile-up intensify, degrading the performance of all evaluated methods. Despite this, the deterioration observed in the CNNs was significantly smaller compared to the Optimal Filter. Additionally, from a computational perspective, the cost of CNNs was substantially higher in the present study due to the use of K-Fold cross-validation, which requires a full training cycle of the network for each split of the data. However, this cost is concentrated exclusively in the training stage, which is typically performed offline.
Several directions are planned for future work. First, the training workflow will be refined to incorporate a model selection step within the cross-validation process: rather than averaging performance across all 100 folds, the fold that yields the best validation metrics will be identified and its corresponding weights preserved as the final model. This strategy reduces computational overhead in subsequent deployments while retaining the generalization benefits of the cross-validation framework.
Second, the selected model will be implemented and tested on hardware accelerators such as FPGA devices [21,36]. Since the CNN weights are fixed after training, the inference stage requires only a single forward pass through the network, which is well-suited for pipelined FPGA execution. This implementation is expected to drastically reduce processing latency, enabling near-real-time signal reconstruction compatible with the trigger requirements of high-luminosity experiments. This stage will also include an evaluation of the impact of fixed-point quantization (int8/int4) on reconstruction accuracy, as quantization is a necessary step for FPGA deployment and its effect on the metrics reported in this work has not yet been quantified. Simulated data will continue to be employed in this stage, as knowledge of the true amplitude values remains necessary for training and performance evaluation [31].
Third, the architectural search will be extended to deeper convolutional models, incorporating additional convolutional layers and exploring alternative regularization strategies, in order to assess whether the performance trends identified here generalize to models with greater representational capacity. Finally, validation on real detector data is envisioned as a longer-term objective, building upon the methodological foundations established in this controlled simulation study.
Fourth, future work will incorporate the Lorenzetti Showers simulator [32], which enables the evaluation of particle shower parameters and the generation of more realistic pulse shapes, allowing a more physically grounded assessment of the reconstruction methods under conditions that more closely approximate real calorimeter environments.
Author Contributions
Conceptualization, D.A.C., B.S.-M.P., G.B.L. and L.M.d.A.F.; methodology, D.A.C., B.S.-M.P., G.B.L. and L.M.d.A.F.; software, D.A.C.; validation, B.S.-M.P. and G.B.L.; formal analysis, D.A.C., B.S.-M.P., G.B.L. and L.M.d.A.F.; data curation, D.A.C.; writing—original draft preparation, D.A.C.; writing—B.S.-M.P. and G.B.L.; visualization, D.A.C.; supervision, B.S.-M.P., G.B.L. and L.M.d.A.F.; funding acquisition, B.S.-M.P. and G.B.L. All authors have read and agreed to the published version of the manuscript.
Funding
The authors are thankful to CAPES, CNPq, FAPERJ, FAPEMIG, and RENAFAE for the support. This study was financed in part by the Coordenação de Aperfeiçoamento de Pessoal de Nível Superior—Brasil (CAPES)—Finance Code 001. B.S-M.P and G.B.L are supported by the Carlos Chagas Filho Foundation for Supporting Research in the State of Rio de Janeiro (FAPERJ), grant nos. E-26/204.461/2025 and E-26/210.430/2024, respectively. G.B.L. is supported by the National Council for Scientific and Technological Development (CNPq), grant no. 309784/2025-5.
Institutional Review Board Statement
Not applicable.
Informed Consent Statement
Not applicable.
Data Availability Statement
The data presented in this study are available on request from the corresponding author. The data are not publicly available due to storage and size constraints associated with the simulation datasets generated during this work.
Conflicts of Interest
The authors declare no conflicts of interest.
Abbreviations
The following abbreviations are used in this manuscript:
| ADC | Analog-to-Digital Converter |
| CNN | Convolutional Neural Network |
| FPGA | Field-Programmable Gate Array |
| GPU | Graphics Processing Unit |
| HL-LHC | High-Luminosity Large Hadron Collider |
| LHC | Large Hadron Collider |
| MAE | Mean Absolute Error |
| MedAE | Median Absolute Error |
| MSE | Mean Squared Error |
| OF | Optimal Filter |
| RMS | Root Mean Square |
| Coefficient of Determination | |
| 1D-CNN | One-Dimensional Convolutional Neural Network |
References
- Griffiths, D. Introduction to Elementary Particles, 2nd ed.; Wiley: New York, NY, USA, 2008. [Google Scholar]
- Gray, H. Future colliders for the high-energy frontier. Rev. Phys. 2021, 6, 100053. [Google Scholar] [CrossRef] [Scilit]
- van Stroud, S.; Duckett, P.; Hart, M.; Pond, N.; Rettie, S.; Facini, G.; Scanlon, T. Transformers for Charged Particle Track Reconstruction in High-Energy Physics. Phys. Rev. X 2025, 15, 041046. [Google Scholar] [CrossRef] [Scilit]
- ATLAS Collaboration. Electron reconstruction and identification in the ATLAS experiment using the 2015 and 2016 LHC proton-proton collision data at = 13 TeV. Eur. Phys. J. C 2019, 79, 639. [Google Scholar] [CrossRef] [Scilit]
- Evans, L.; Bryant, P. LHC Machine. JINST 2008, 3, S08001. [Google Scholar] [CrossRef] [Scilit]
- Fabjan, C.; Gianotti, F. Calorimetry for particle physics. Rev. Mod. Phys. 2003, 75, 1243–1286. [Google Scholar] [CrossRef] [Scilit]
- Knoll, G. Radiation Detection and Measurement, 4th ed.; John Wiley & Sons: New York, NY, USA, 2010. [Google Scholar]
- Leo, W. Techniques for Nuclear and Particle Physics Experiments; Springer: Berlin/Heidelberg, Germany, 1994. [Google Scholar]
- Lindenstruth, V.; Kisel, I. Overview of trigger systems. Nucl. Instrum. Methods Phys. Res. Sect. A 2004, 535, 48–56. [Google Scholar] [CrossRef] [Scilit]
- Wigmans, R. Calorimetry: Energy Measurement in Particle Physics; Oxford University Press: Oxford, UK, 2017. [Google Scholar] [CrossRef] [Scilit]
- ATLAS Collaboration. Readiness of the ATLAS Tile Calorimeter for LHC collisions. Eur. Phys. J. C 2010, 70, 1193–1236. [Google Scholar] [CrossRef] [Scilit]
- Callier, S.; Dulucq, F.; de La Taille, C.; Martin-Chassard, G.; Seguin-Moreau, N. SKIROC2, front-end chip designed to readout the Electromagnetic CALorimeter at the ILC. In Proceedings of the IEEE Nuclear Science Symposium Conference Record, Orlando, FL, USA, 24 October–1 November 2009; pp. 1–6. [Google Scholar] [CrossRef] [Scilit]
- Apollinari, G.; Béjar Alonso, I.; Brüning, O.; Fessia, P.; Lamont, M.; Rossi, L.; Tavian, L. High-Luminosity Large Hadron Collider (HL-LHC): Technical Design Report v.0.1; Technical Report CERN-2017-007-M; CERN: Geneva, Switzerland, 2017. [Google Scholar] [CrossRef]
- Livan, M.; Wigmans, R. Calorimetry for Collider Physics, an Introduction; Springer: Cham, Switzerland, 2019. [Google Scholar] [CrossRef] [Scilit]
- Santos, M.; Simas Filho, E.; Farias, P.; Laforge, B.; Seixas, J. Crosstalk mitigation in an ATLAS-like high energy liquid argon calorimeter using artificial neural networks. Nucl. Instrum. Methods Phys. Res. Sect. A 2026, 1087, 171382. [Google Scholar] [CrossRef] [Scilit]
- ATLAS Collaboration. Performance of electron and photon triggers in ATLAS during LHC Run 2. Eur. Phys. J. C 2020, 80, 47. [Google Scholar] [CrossRef] [Scilit]
- Belayneh, D.; Carminati, F.; Farbin, A.; Hooberman, B.; Khattak, G.; Liu, M.; Long, J.; Olivito, D.; Pacela, V.; Pierini, M.; et al. Calorimetry with deep learning: Particle simulation and reconstruction for collider physics. Eur. Phys. J. C 2020, 80, 688. [Google Scholar] [CrossRef] [Scilit]
- Buhmann, E.; Diefenbacher, S.; Eren, E.; Gaede, F.; Kasieczka, G.; Korol, A.; Krüger, K. Getting high: High-fidelity simulation of high granularity calorimeters with high speed. Comput. Softw. Big Sci. 2021, 5, 13. [Google Scholar] [CrossRef] [Scilit]
- Gonçalves, G.I. Energy Reconstruction Techniques in TileCal Under High Pile-Up Conditions. In Proceedings of the Systems, Signals and Image Processing; Rozinaj, G., Vargic, R., Eds.; Springer: Cham, Switzerland, 2022; pp. 140–151. [Google Scholar] [CrossRef] [Scilit]
- Rimes, S.; Peralva, B.; Libotte, G.; Paschoalin, T.; de Andrade Filho, L.; De Seixas, J. A Maximum Likelihood Approach for Signal Estimation and Data Quality Assessment for High-Energy Calorimeter Systems. IEEE Trans. Nucl. Sci. 2025, 72, 3801–3808. [Google Scholar] [CrossRef] [Scilit]
- Aad, G.; Berthold, A.-S.; Calvet, T.P.; Chiedde, N.; Fortin, E.; Fritzsche, N.; Hentges, R.G.; Laatu, L.A.O.; Monnier, E.; Straessner, A.; et al. Artificial Neural Networks on FPGAs for Real-Time Energy Reconstruction of the ATLAS LAr Calorimeters. In Proceedings of the 20th International Workshop on Advanced Computing and Analysis Techniques in Physics Research (ACAT), Daejeon, Republic of Korea, 29 November–3 December 2021; CERN Document Server. Available online: https://cds.cern.ch/record/2775033 (accessed on 4 June 2026).
- Dimitrova, K.; Kozhuharov, V.; Petkov, P. Development and Explainability of Models for Machine-Learning-Based Reconstruction of Signals in Particle Detectors. Particles 2025, 8, 48. [Google Scholar] [CrossRef] [Scilit]
- Goodfellow, I.; Bengio, Y.; Courville, A. Deep Learning; MIT Press: Cambridge, MA, USA, 2016. [Google Scholar]
- Kiranyaz, S.; Ince, T.; Gabbouj, M. 1D Convolutional Neural Networks for Signal Processing Applications. IEEE Trans. Signal Process. 2019, 67, 540–554. [Google Scholar] [CrossRef] [Scilit]
- Bertuccio, G.; Gatti, E.; Sapietro, M. Sampling and optimum data processing of detector signals. Nucl. Instrum. Methods Phys. Res. Sect. A 1992, 322, 271–279. [Google Scholar] [CrossRef] [Scilit]
- Cleland, W.; Stern, E. Signal processing considerations for liquid ionization calorimeters in a high-rate environment. Nucl. Instrum. Methods Phys. Res. Sect. A 1994, 338, 467–497. [Google Scholar] [CrossRef] [Scilit]
- CMS Collaboration. Reconstruction of the signal amplitude of the CMS electromagnetic calorimeter. Eur. Phys. J. C 2006, 46, 23–35. [Google Scholar] [CrossRef] [Scilit]
- Fullana, E.; Castillo, V.; Fernández, R.; González, V.; Henriques, A.; Poveda, J.; Ruiz, J.; Sanchis, E.; Solans, C. Optimal Filtering in the ATLAS Hadronic Tile Calorimeter; Technical Report ATL-TILECAL-2005-001; CERN: Geneva, Switzerland, 2005. [Google Scholar]
- Quirino, T.; Paschoalin, T.; Gonçalves, G.; Lisboa, P.; de Andrade Filho, L.; Peralva, B.M. Online Pulse Compensation for Energy Spectrum Determination: A Pole-Zero Cancellation and Unfolding Approach. Electronics 2025, 14, 493. [Google Scholar] [CrossRef] [Scilit]
- Particle Data Group; Workman, R.; Burkert, V.; Crede, V.; Klempt, E.; Thoma, U.; Tiator, L.; Agashe, K.; Aielli, G.; Allanach, B.C.; et al. Review of Particle Physics. Prog. Theor. Exp. Phys. 2022, 2022, 083C01. [Google Scholar] [CrossRef] [Scilit]
- Gonçalves, G. PulseGenerator: Calorimetry Pulse Simulator. Available online: https://github.com/ingoncalves/calorimetry-pulse-simulator (accessed on 16 April 2026).
- Araújo, M.; Gonçalves, G.; Peralva, B.; de Andrade Filho, L.; Cerqueira, A.; Seixas, J. Lorenzetti Showers: A general-purpose framework for supporting signal reconstruction and triggering with calorimeters. Comput. Phys. Commun. 2023, 286, 108671. [Google Scholar] [CrossRef] [Scilit]
- Filho, E.F.S.; Farias, P.C.; Souza, E.E.; Marin, J.L.; Seixas, J.M.; Cerqueira, A.S.; Laforge, B. Ring-like calorimeter information for energy calibration in electron trigger at a highly segmented detector using gradient boosted decision trees. JINST 2025, 20, P06051. [Google Scholar] [CrossRef] [Scilit]
- CMS Collaboration. The CMS high-granularity calorimeter for operation at the High-Luminosity LHC. arXiv 2018, arXiv:1802.05987. [Google Scholar]
- Agostinelli, S.; Allison, J.; Amako, K.; Apostolakis, J.; Araujo, H.; Arce, P.; Asai, M.; Axen, D.; Banerjee, S.; Barrand, G.; et al. Geant4—A Simulation Toolkit. Nucl. Instrum. Methods Phys. Res. Sect. A 2003, 506, 250–303. [Google Scholar] [CrossRef] [Scilit]
- Meyer-Baese, U. Digital Signal Processing with Field Programmable Gate Arrays, 4th ed.; Springer: Berlin/Heidelberg, Germany, 2014. [Google Scholar] [CrossRef] [Scilit]
- Chapman, J. ATLAS Simulation Computing Performance and Pile-up Simulation in ATLAS. In Proceedings of the LPCC Detector Simulation Workshop; CERN: Meyrin, Switzerland, 2011. [Google Scholar]
- Banerjee, S. CMS simulation software. J. Phys. Conf. Ser. 2012, 396, 022003. [Google Scholar] [CrossRef] [Scilit]
- Gómez Delegido, A. Upgrade of ATLAS Hadronic Tile Calorimeter for the High Luminosity LHC. Nucl. Instrum. Methods Phys. Res. Sect. A 2023, 1047, 167860. [Google Scholar] [CrossRef] [Scilit]
- Anelli, C. Phase-II readout electronics upgrades of the ATLAS LAr calorimeter. Nucl. Instrum. Methods Phys. Res. Sect. A 2019, 936, 274–277. [Google Scholar] [CrossRef] [Scilit]

Disclaimer/Publisher’s Note: The statements, opinions and data contained in all publications are solely those of the individual author(s) and contributor(s) and not of MDPI and/or the editor(s). MDPI and/or the editor(s) disclaim responsibility for any injury to people or property resulting from any ideas, methods, instructions or products referred to in the content. |
© 2026 by the authors. Licensee MDPI, Basel, Switzerland. This article is an open access article distributed under the terms and conditions of the Creative Commons Attribution (CC BY) license.