


Abstract
Traditional reserve planning methods often suffer when balancing system economics and reliability due to the uncertainty and transmission constraints of renewable energy sources (RESs) being neglected, affecting the availability of reserves. To overcome these challenges, in this study, we propose a new reserve planning method tailored to a renewable-energy-dominated power system, with particular consideration of reserve availability. First, the method assesses reserve availability using a unified reliability economics model at the composite system assessment (CSA) level; it also employs a conditional cost–benefit analysis (CCBA) to optimize the reliability–cost trade-off. To solve the planning problem, a particle swarm optimization (PSO)-based hierarchical optimization method is employed to co-optimize the allocation of reserve capacity, thus maximizing the comprehensive benefit. Furthermore, the analysis quantifies the impact of the RES penetration level and risk preference on the reserve capacity and its allocation. The results of tests conducted on IEEE RTS-79 demonstrate that the proposed method can effectively assess reserve availability, as well as achieve an increase of up to 19.5% in comprehensive benefit and a 73.8% reduction in EENS. Furthermore, increasing RES penetration and ensuring stronger risk preference can lead to reserve capacity increases of 42.4% and 76.0%, respectively.
1. Introduction
Power systems require adequate reserve capacity to maintain supply–demand balance and ensure reliability amid uncertainties in generation, transmission, and distribution [1]. The rapid expansion of renewable energy sources (RESs) amplifies these uncertainties [2]. By the end of 2024, the installed capacity of solar power in China was approximately 890 GW, with a year-on-year increase of 45.2%, while the installed capacity of wind power was about 520 GW, with a year-on-year increase of 18.0%. The combined installed capacity of wind and solar power accounts for about 42.1% of the total national power generation capacity [3]. This rapid scaling amplifies the uncertainty of power systems, creating tough challenges for the traditional reserve methods, which are inadequate in maintaining reliability and economic viability under high-penetration RES scenarios [4]. The inherent, strong variability in RESs necessitates an advanced planning method to optimize the reserve and ensure the reliable integration of RESs.
Mid-to-long-term reserve planning methodologies in power systems can be classified as deterministic or probabilistic approaches. Deterministic approaches calculate reserve based on empirical data such as the largest unit capacity or peak load percentage [5]; however, they exhibit diminishing applicability in renewable-energy-dominated systems due to their limited ability to account for uncertainties. Probabilistic approaches focus on reliability assessment, adjusting the reserve capacity to satisfy the system reliability targets. Reference [6] proposes system welfare analysis (SWA), which defines three system states, namely as “healthy,” “marginal,” and “risk”, to integrate deterministic criteria into a probabilistic framework. The authors of [7] propose a universal generating function (UGF) to assess long-term reserve expansion in systems with high wind penetration. The authors of [8] apply a cost–benefit analysis to optimize a spinning reserve by including interruption costs in the unit commitment objective function. These approaches integrate the uncertainty factors affecting system reliability and enable more accurate risk quantification. Alongside this development, cost–benefit perspectives are progressively being integrated into reserve planning measures so that the trade-offs between the reliability and economics of systems can be evaluated more systematically.
Mid-to-long-term reserve planning can be broadly divided into two methodological frameworks: (1) generation adequacy assessment (GAA), which exclusively evaluates reserve capacities based on the generation system’s reliability criteria, thus excluding network contingencies; (2) composite system assessment (CSA), which incorporates the interdependencies between generation and transmission systems and utilizes optimization techniques to address both adequacy and deliverability criteria. Reference [9] adopts a conventional reserve planning approach at the GAA level that disregards the transmission constraints, resulting in both the underestimation of the required reserve capacity and failure to consider the inability to deliver reserve to the load buses. Although the short-term deliverability verification framework proposed in [10] confirms its operational effectiveness at the CSA level, its extension to mid-to-long-term reserve planning encounters two fundamental barriers: (1) the difficulty of adapting short-term high-resolution temporal details to long-term planning, and (2) the insufficient consideration of stochastic system failure scenarios. These challenges underscore the critical need to develop a planning framework at the CSA level that is tailored to the temporal resolution and scenario characteristics of mid-to-long-term reserve planning.
The selection of optimization algorithms significantly determines the computational efficiency and solution quality in power system reserve planning. Reference [11] employed mixed-integer linear programming (MILP) to optimize investment, operation, and demand response strategies in microgrids. Reference [12] employs traditional models such as linear programming (LP) and MILP in power system expansion planning, which is often improved with aggregation or decomposition techniques for scalability. Separately, [13] demonstrates the effectiveness of heuristic algorithms, including particle swarm optimization (PSO), for multi-objective optimization in power systems, such as minimizing fuel costs and wind curtailment. Reference [14] compares various heuristic algorithms, such as tabu search (TS), simulated annealing (SA), and genetic algorithms (GAs), for distribution network planning, highlighting the strong convergence and solution reliability of PSO and hybrid heuristic approaches. Significantly, [15], a comprehensive review of hybrid metaheuristics for complex scheduling problems, identifies a key trend: the integration of metaheuristics with classical optimization algorithms is recognized as an effective strategy that leverages the respective strengths of both approaches. Illustrating such combined strategies, [16] presents a hierarchical optimization approach for renewable energy system design. The study details an approach involving an initial optimization stage performed using HOMER software, followed by refinement with a multi-objective particle swarm optimization (MOPSO) algorithm. To further address challenges such as premature convergence in complex optimization, advanced variants such as multi-swarm PSO [17] and hybrid multi-swarm algorithms with genetic operators [18] have also been developed to improve global search capability. Therefore, these insights strongly suggest that for complex and uncertain systems, combining classical optimization algorithms with heuristic algorithms, particularly within a hierarchical optimization method, proves an effective strategy.
Optimal reserve planning for a renewable-energy-dominated power system is critically shaped by both subjective planner decisions regarding the risk preference and objective systemic changes such as the increasing integration of RESs. Subjective decisions made by planners, particularly those reflecting different attitudes toward high-impact, low-probability events, notably influence the trade-offs made between the reliability and economic viability of the system. Methodologies, such as the conditional cost–benefit analysis (CCBA) [5,19], provide a specialized framework to incorporate risk preference, thereby critically shaping planning outcomes. Concurrently, the growing dominance of RESs, an objective systemic factor acknowledged previously, introduces notable uncertainty and planning challenges [20]. Thus, understanding how optimal reserve strategies vary with both the risk preference of the planner and the degrees of RES dominance is essential for adaptable mid-to-long-term planning.
The main contributions of this study are introduced as follows:
- (1)
- While conventional methods operating at the GAA level fail to account for reserve availability, the proposed framework at the CSA level employs the non-sequential Monte Carlo simulation (NSMCS) and DC optimal power flow (DCOPF). This is the first study to explicitly incorporate reserve availability into mid-to-long-term planning. This comprehensive assessment considers both probabilistic unit status and network deliverability, enabling an effective reliability–economic viability evaluation of reserve planning.
- (2)
- To resolve the limitations of traditional single-variable models that neglect unit-level allocation, a PSO-based hierarchical optimization method is used to resolve the issue of complex reserve planning. By integrating swarm intelligence with the DCOPF for reaching an accurate solution, it achieves the unit-level co-optimization of reserve capacity allocation for the first time. This improves reserve availability and helps to bridge the gap between the strategic planning and operational implementation.
- (3)
- To address the lack of systematic quantitative examination in existing research, parameter sensitivity analysis is conducted by varying RES penetration levels and risk preference separately, while keeping the other variables fixed. This controlled-variable approach quantifies the individual influence of each parameter on reserve planning tailored for the renewable-energy-dominated power system.
The structure of this paper is as follows: Section 2 introduces the probabilistic models used for RES generation and component failure, along with the NSMCS. Section 3 incorporates the reserve availability problem and proposes a reserve planning method based on CCBA. Section 4 verifies the proposed model using IEEE RTS-79, discussing results and comparing performance across multiple scenarios. Section 5 concludes the research findings of this study.
2. Probabilistic Models for RES Generation and Reliability Assessment
2.1. Probabilistic Models for Wind and Solar Power Output
The probabilistic models for wind and solar power output are based on the modeling of the stochastic resources of wind speed and solar irradiance, which are then converted to power output using their respective conversion formulas. The wind speed v (m/s) is modeled using the Weibull distribution [21]:
where c represents the scale parameter, and k represents the shape parameter. The wind power output Pw is then calculated [22]:
where vci, vr, vco, and Pr represent the cut-in wind speed (m/s), the rated wind speed (m/s), the cut-out wind speed (m/s), and the rated power of the wind turbine, respectively. The coefficients U, V, and W are constants determined using vci, vr, and vco.
The solar irradiance E (W/m2), determining the solar array power output, can be modeled using the Beta distribution [23]:
where Emax (W/m2) represents the maximum solar irradiance, α and β denote the shape parameters, and Γ represents the Gamma function. The solar array power output Ps is defined as follows [23]:
where A is the array area (m2), and η is the conversion efficiency (%). Consequently, Ps also follows a Beta distribution:
where Pmax represents the maximum power output of the solar array.
Importance sampling [24] is used with NSMCS to improve computational efficiency under high uncertainty associated with RES by focusing on critical operating states.
2.2. NSMCS-Based Reliability Assessment Framework
In this study, we adopt the NSMCS [25], also referred to as state sampling. The NSMCS is a probabilistic simulation technique that estimates reliability indices by generating a large number of system operating states, where the occurrence of each system state is based on the independent failure probabilities of its constituent components. This approach assumes that the system state is a combination of the states of all components, each of which is sampled independently based on its own failure probability.
Each component i with failure probability has its state si determined by
where Ri is uniformly distributed in [0, 1]. Qi denotes the failure probability of component i. si = 0 and si = 1 represent the up state and down state of component i, respectively. The system state vector is
where N denotes the total number of components, including both generating units and transmission lines.
For the m-th sample sm, record its load shedding amount as . If , mark it as a failure state while recording its demand not supplied (DNS):
Define the load shedding indicator function as
The reliability indices are computed as follows:
Expected energy not supplied (EENS), which evaluates the expected total magnitude of unserved energy, is defined as follows:
where constant 8760 represents the total number of hours in a year, used to normalize the reliability indices to an annual basis.
Loss of load expectation (LOLE), which evaluates the expected duration of load curtailment, is defined as follows:
where Nsample represents the total number of samples.
3. Reserve Planning Method for Power Systems Considering Reserve Availability
3.1. Reserve Availability Problems in Power System Reserve Planning
Ensuring reserve availability is fundamental to maintaining system reliability. Reserve availability encompasses not only the deliverability of reserve through the transmission network but also the operating state of the reserve-providing units. System disturbances can render units unable to meet load demands, triggering reserve activation. However, the transmission network can impede reserve delivery to load deficit buses, thus creating deliverability-constrained scenarios, which contribute to “reserve unavailability”. This challenge requires a comprehensive system state analysis to ensure that reserve is truly available when needed. In this study, we use DCOPF to reschedule unit outputs, balancing generation and load, alleviating line overloads, and, therefore, enhancing the deliverable component of reserve availability. To achieve this, DCOPF is formulated with the objective of minimizing the total load shedding. The problem is modeled as follows [25]:
Objective function:
Constraints:
where represents the bus admittance matrix. represents the voltage phase angles vector. and represent the vectors of generation power and active load, respectively. represents the vector of load shedding. and represent the minimum and maximum active power outputs of the j-th unit, respectively. Pl represents the active power flow in branch l. and represent the minimum and maximum flow limits for the branch, respectively. , , and represent the sets of units, buses and branches, respectively. The notation |·| represents the number of elements in a set. Constraints (13)–(16) represent the bus active power balance, the active power output limits of generating units, the transmission line capacity limits, and the non-negativity of load shedding, respectively. The line capacity constraint in (15) is crucial for deliverability, as it guarantees that this generated power, once dispatched, does not lead to line overloads. Satisfying this transmission constraint is essential for the reserve to be effectively delivered to load deficit buses.
By solving this DCOPF model for each sampled state (as described in Section 2.2), the amount of load shedding for that state can be obtained. Any non-zero load shedding implies that, for that state, the full load could not be supplied. This outcome results from either insufficient generation capacity, caused by unit failures, or from reserves being undeliverable due to transmission constraints. Both causes contribute to “reserve unavailability,” and its extent is quantified based on the load shedding.
3.2. Conventional Cost–Benefit Analysis and Improvements with Conditional Reliability
The conventional cost–benefit analysis evaluates the trade-off between “costs associated with applying reserve” and the “economic losses from power outages due to insufficient reserve”. An optimal reserve capacity maximizes the comprehensive benefit or minimizes the comprehensive cost, calculated, respectively, as follows [19]:
or
where is the decision variable representing the reserve capacity, and is the feasible domain of r. is the reserve-related cost. is the system reliability cost. is the system reliability benefit. is the optimal reserve capacity.
To overcome the limitations of expectation-based valuation in (17) and (18), a CCBA framework using conditional expectation is adopted. For ∀r ∈ Ω, the reliability cost X is a random variable following a probability distribution associated with r. The probability density function is represented as , where x is a specific value of the reliability cost X.
A risk-sensitive conditional factor γ parameterizes the risk preference regarding the severity and rarity of losses. In this study, we quantify the conditional factor γ using the probability that the reliability cost exceeds a certain threshold βX:
where φX(·) is the function of the conditional factor γ, and it is assumed that an inverse function exists to determine the specific reliability cost threshold:
where represents the (1 − γ)-quantile of . The asymptotic behavior of the conditional factor γ demonstrates the risk preference: As γ ⟶ 0, the reliability cost threshold βX ⟶ +∞, reflecting an extreme risk preference. Conversely, as γ ⟶ 1, βX ⟶ 0, reflecting risk neutrality.
The conditional reliability cost is then defined as the expectation modified to reflect risk preference:
where represents the expected outage cost conditioned on the extreme failure events exceeding the threshold β, thereby emphasizing tail-risk behavior.
Specifically, when γ = 1, (21) reduces to
the conditional reliability cost degenerates into the traditional unconditional reliability cost.
The conditional reliability benefit is consequently derived as the conditional reliability cost reduction metric:
where and denote the conditional reliability cost before and after reserve capacity r is applied under the conditional factor γ, respectively.
3.3. Multi-Variable Optimization Model of Reserve Planning Based on CCBA
Conventional reserve planning methods are formulated as single-variable optimization problems where total reserve is treated as a unit, neglecting the critical perspective of inter-unit capacity allocation [7].
This oversimplification fails to capture the collective techno-economic impacts among the heterogeneous units.
A multi-variable optimization model is proposed that simultaneously determines the total reserve capacity and optimally allocates the reserve capacity , where Nunit represents the number of the units considered for reserve allocation.
In mid-to-long-term reserve planning, reserve planning is coordinated with generation expansion planning (GEP) outcomes. Given newly committed units from GEP, reserve capacity is allocated among them in an economically and technically rational manner. Consequently, with the objective of maximizing the comprehensive benefit by optimizing both the total capacity and its unit-level allocation, the improved reserve planning problem can be formulated as
where represents the feasible domain of r, defined as . , , and represent the conditional comprehensive benefit, reserve-related cost, and conditional reliability benefit of reserve scheme r, respectively.
The reserve-related cost is defined as
where Ccap(r) represents the capital cost for the construction of reserve scheme r. Cop(0) and Cop(r) represent the operational costs of all units in the system before and after applying the reserve scheme r, respectively.
Increasing reserve capacity can improve the system reliability, thus resulting in greater economic benefit. represents the reduction in the system conditional reliability cost achieved by applying the reserve scheme r compared to the original system, and it is given by
where and represent the conditional reliability cost before and after applying the reserve scheme r, respectively.
is the comprehensive benefit of the reserve scheme r, calculated by subtracting the reserve-related cost from the conditional reliability benefit . Accordingly, the optimal reserve scheme maximizes .
3.4. Solution to the Multi-Variable Optimization Problem in Reserve Planning
- (1)
- Reserve-Related Costs
The capital cost of the reserve scheme r is annualized over the planning year using the uniform annual value method:
where represents the total capital cost of the reserve scheme r. represents the life cycle of the equipment in years. α ∈ [0, 1] represents the discount rate. represents the unit-specific capital cost. rg represents the reserve capacity allocated to the g-th unit.
The operational cost Cop(r) of the power generation system during the planning year consists of the operation and maintenance costs Co&m and the fuel costs Cfuel:
where eg(r) represents the power generation of the g-th unit, and represents the unit fuel cost from the g-th unit. and represent the variable and fixed operation and maintenance costs for the g-th unit, respectively. represents the rated capacity of the g-th unit. The power outputs of the units are derived from DCOPF solutions based on NSMCS states.
- (2)
- Conditional Reliability Benefit
The conditional reliability cost is derived through two steps [26]. First, we used the conditional expected energy not supplied (CEENS), which refers to the expected value of load shedding caused by system failures that exceed the predefined risk preference threshold βx, and is defined as follows:
where CDNSm represents the conditional demand not supplied of the m-th sample sm.
Then, the outage loss cost of the system is calculated by
where closs represents the unit outage loss cost. The reliability benefit is given in (26).
- (3)
- PSO-based Hierarchical Optimization
The proposed reserve planning is a mixed-integer, multi-variable, non-convex optimization problem with significant computational complexity. To address this challenge, in this study, we employ a hierarchical optimization strategy. An outer-loop PSO algorithm optimizes reserve capacity and allocation. The fitness of each candidate scheme r, the conditional comprehensive benefit, is evaluated via an internal module. This module uses NSMCS to generate system states. For each state, an inner-loop DCOPF is solved to determine operational outcomes, which provide the foundational data for calculating reliability indices and economic costs, ultimately guiding the PSO search.
The PSO operates through a population of candidate solutions (particles) that iteratively explore the solution space. Each particle updates its velocity Δri and position ri by assimilating three critical components: inertial momentum, which preserves a fraction of the prior velocity through the inertia weight w; cognitive memory, which reflects the attraction toward the particle’s historical best position pbesti; and social influence, which represents the attraction toward the global best position gbest of the swarm.
The update equations for each particle’s velocity Δri and position ri are [27]
where λ1 and λ2 denote the cognitive and social acceleration coefficients, respectively. u1 and u2 represent random numbers uniformly distributed within the range [0, 1]. The subscript i represents the particle index, while the superscript iter and iter + 1 represent the iteration numbers.
To improve the exploration–exploitation balance present throughout the optimization procedure, a dynamic parameter adaptation mechanism is implemented for the cognitive λ1 and social λ2 acceleration coefficients. The mechanism follows a linear adjustment strategy, formulated as follows:
where itermax represents the maximum number of iterations. λ1,max and λ1,min represent the maximum and minimum values of the cognitive acceleration coefficient λ1, respectively; λ2,max and λ2,min represent the maximum and minimum values of the social acceleration coefficient λ2, respectively. This adaptation strategy improves the search for an optimal reserve scheme: early-phase exploration identifies the diverse reserve schemes, the mid-phase focuses on balancing exploration and exploitation, and the late phase accurately refines the final reserve solution.
The fitness function has been given by (24). To reduce the computational complexity, the reserve capacities are quantized during the particle updates:
where q represents the quantization granularity, which is set to 10 MW in this study.
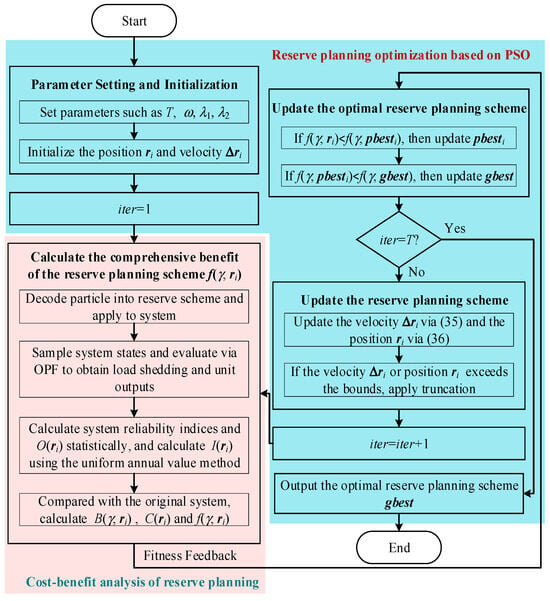
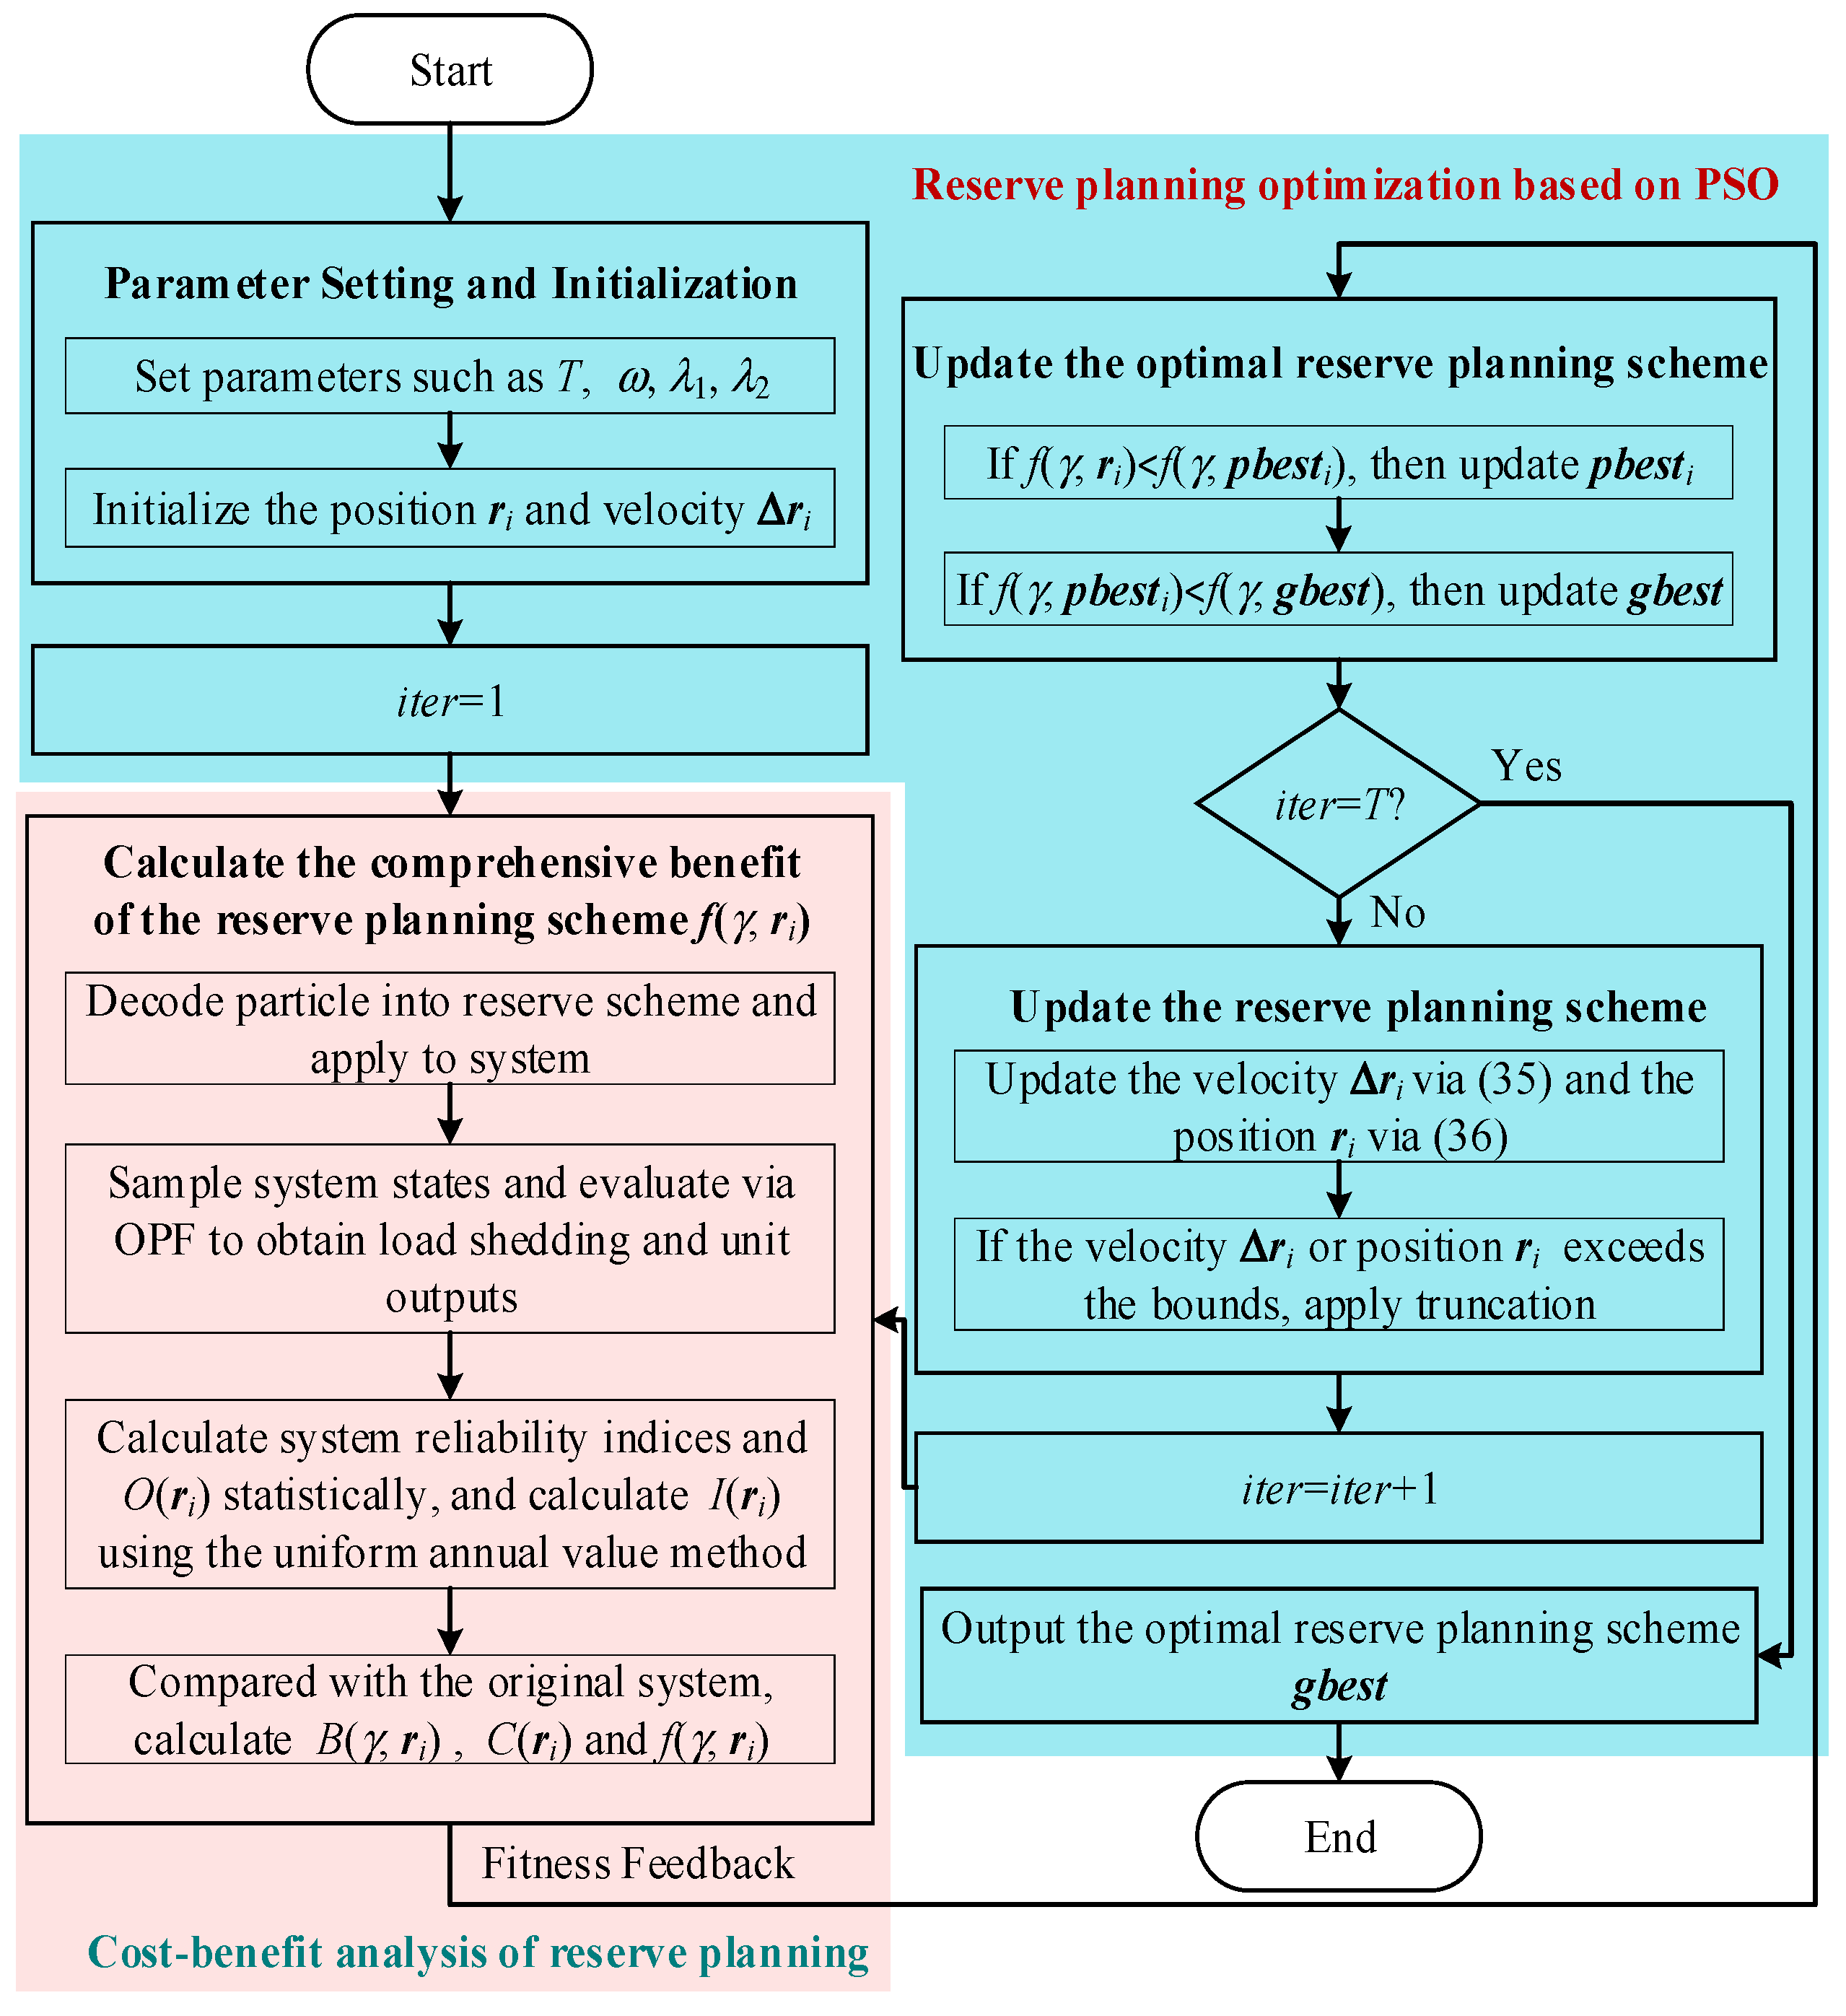
As illustrated in the flowchart depicted in Figure 1, the process for the proposed reserve planning method operates through the following steps:
Figure 1.
A flowchart of the reserve planning method.
Step 1: The outer-loop PSO algorithm initializes a swarm of particles representing candidate reserve capacity and allocation schemes.
Step 2: The internal module employs NSMCS and inner-loop DCOPF to assess each candidate scheme and calculate the conditional comprehensive benefit as the fitness.
Step 3: The fitness value is returned to guide updates to the particles’ positions and velocities.
Step 4: The process repeats until the maximum number of iterations is met.
4. Test Results
The experimental design consists of three stages, which are evaluated through 11 test cases. First, a reserve planning model at the CSA level incorporating the reserve availability is validated from Case 1 to Case 4. The details are as follows:
Case 1: Planning at the GAA level, which excludes all transmission constraints;
Case 2: Planning at the CSA level, which includes transmission line outage constraints;
Case 3: Planning at the CSA level, which includes transmission capacity constraints;
Case 4: Planning at the CSA level, which includes both transmission line outage and capacity constraints.
Second, the problem is reformulated as a multi-variable optimization problem, thus formulating a model that simultaneously optimizes reserve capacity and allocation from Case 5 to Case 8. The model is defined as follows:
Case 5: Reserve capacity is centrally allocated to Unit 1;
Case 6: Reserve capacity is centrally allocated to Unit 2;
Case 7: Reserve capacity is centrally allocated to Unit 4;
Case 8: Reserve capacity is allocated across Units 1–4.
Third, the impact of RES penetration and risk preference on reserve planning is quantitatively analyzed.
This study is conducted based on the IEEE-RTS79. The reliability parameters of system components and the load level model are referenced from [28]. The outage cost of electricity is 5.27 USD/kWh [19].
The case study adopts the GEP results from [29] as the baseline input, based on which the reserve is further optimized based on the newly added generating units. As shown in Table 1, after GEP, the total installed capacity is 4525 MW, with the peak load set equal to the total installed capacity. On this basis, the impact of RES integration is further considered. The capacity credit of wind power is 25%, while that of solar power is 30% [30]. To establish a baseline scenario representing RES penetration of 10%, two 620 MW wind farms and one 517 MW solar power plant, all of which are located at bus 7 [29], replace three 155 MW conventional units originally located at buses 15, 16, and 23, respectively. The wind speed follows a Weibull distribution with k = 7 and c = 2, while the solar power is subject to a Beta distribution with α = 2 and β = 4.
Table 1.
The newly added units in the GEP scheme.
4.1. Reserve Planning at the CSA Level Considering Reserve Availability
At this stage of this study, reserve is added via the newly committed units from GEP. When optimizing the total reserve capacity r as a single decision variable (i.e., all allocated to one pre-selected unit), this problem is formulated as single-variable optimization, which is unimodal, efficiently solved using the three-point search algorithm [11] with r ∈ [0, 1000] MW. This stage of the study has two parts: this section first analyzes CCBA characteristics at the GAA level and then compares reserve planning outcomes from the GAA to the CSA levels.
- (1)
- CCBA at the GAA level
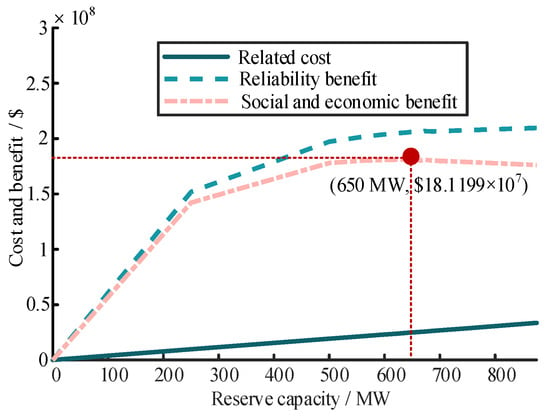
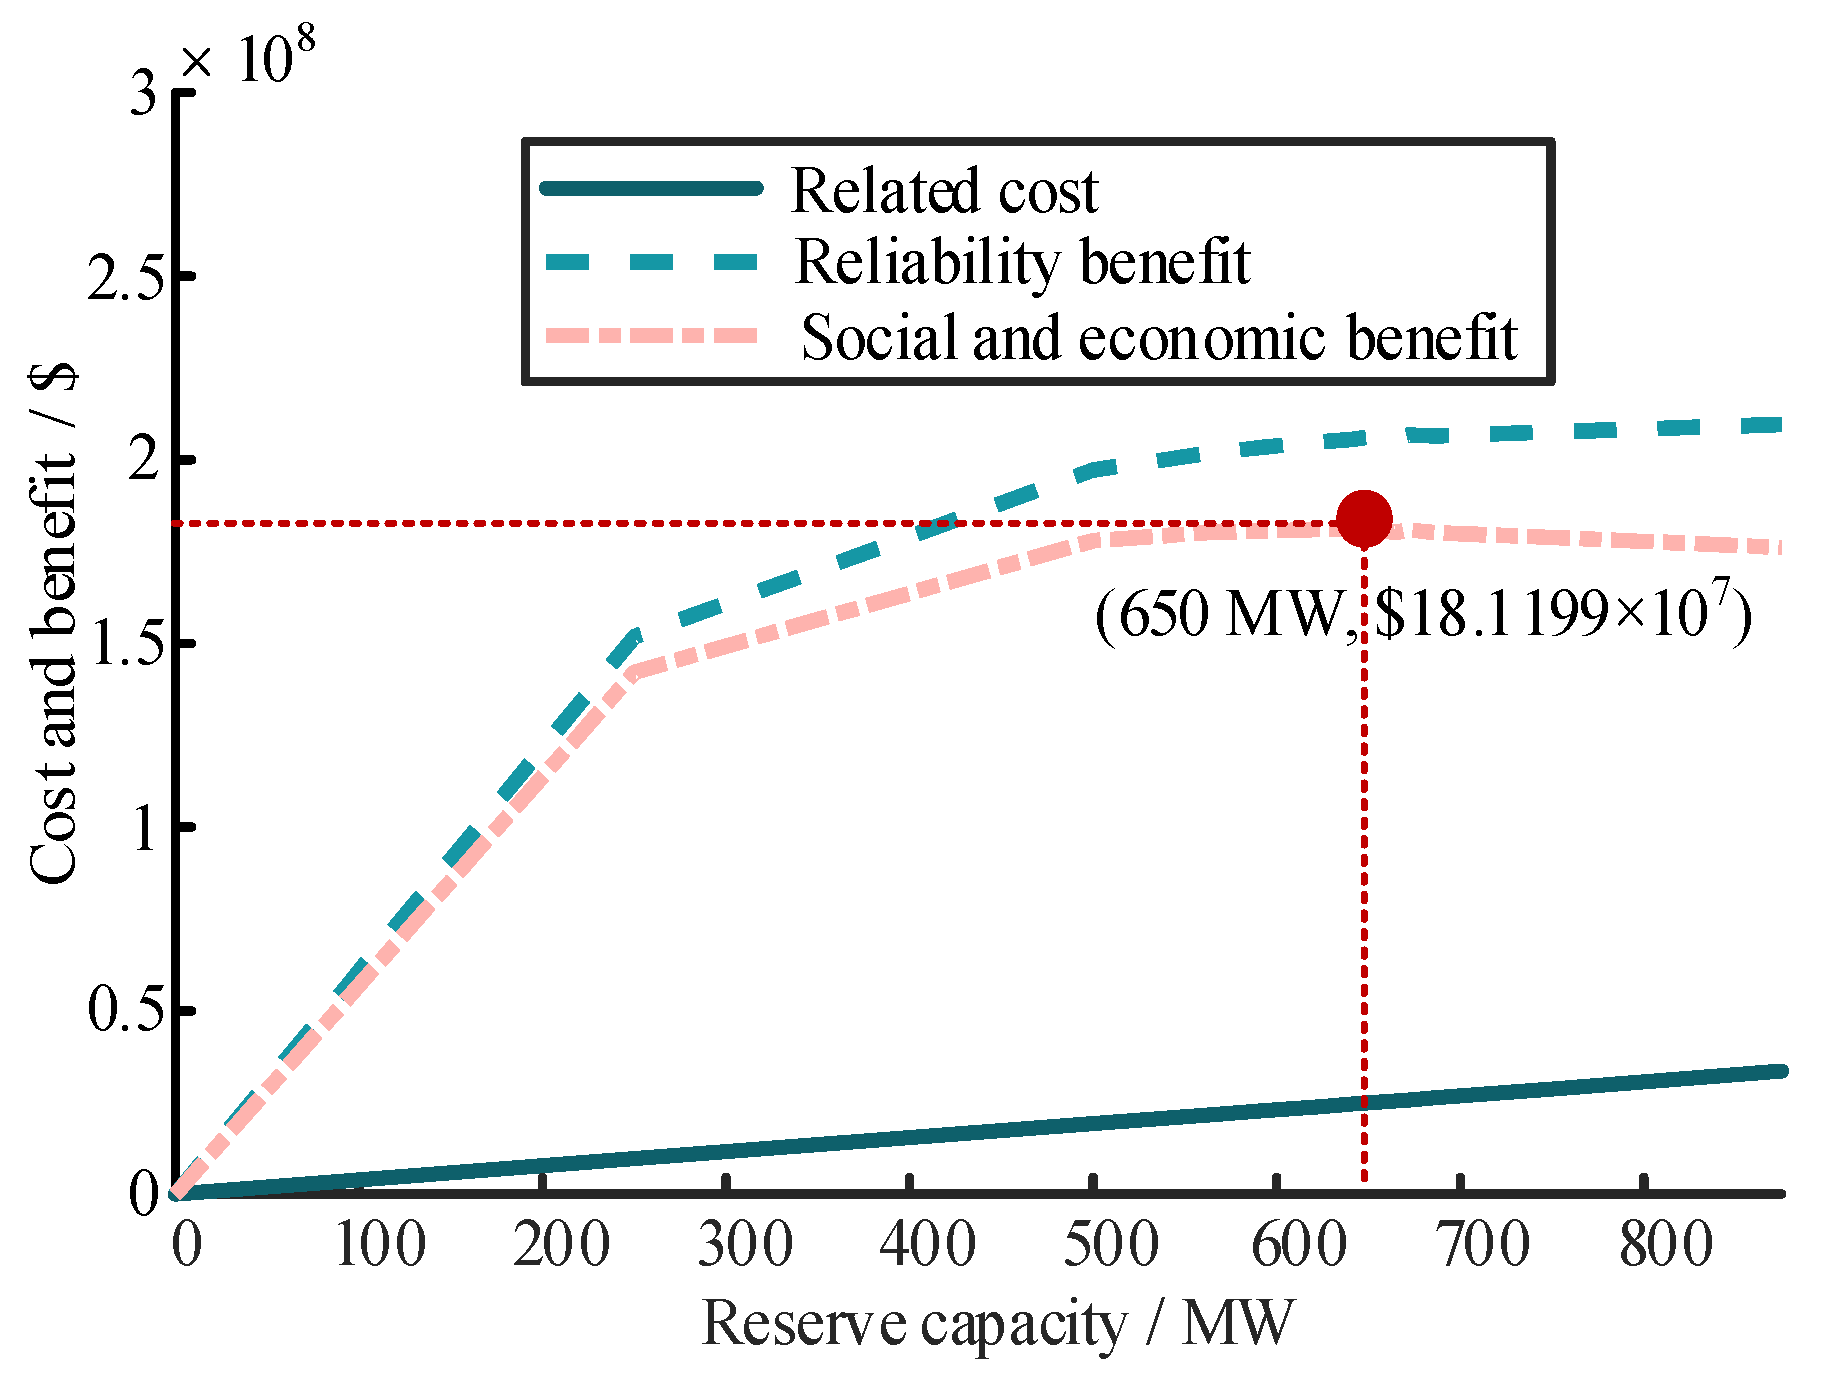
In this analysis, we examined the reserve capacity configured in Unit 2, with RES penetration of 10% with γ = 0.5 being used as an example. Figure 2 shows the CCBA curve for reserve planning at the GAA level. The reserve-related cost exhibits an approximately linear increase due to the simultaneous increases in capital and operational costs, while the reliability benefit initially increases but then begins to saturate, reflecting diminishing marginal benefits. The trade-off between the reliability benefit and the reserve-related cost gives the comprehensive benefit curve its unimodal characteristic. Initially, the reliability benefit increases more rapidly than the reserve-related cost, leading to an improvement in the comprehensive benefit. However, as the reserve capacity continues increasing, the reserve-related cost starts to increase more rapidly than the reliability benefit, resulting in the comprehensive benefit declining after reaching a peak. This peak is observed at a reserve capacity of 650 MW, which is, therefore, determined to be the optimal solution.
Figure 2.
A CCBA curve for reserve planning.
- (2)
- Reserve planning at the GAA level and the CSA level
As described at the beginning of Section 4, four cases are analyzed to assess reserve planning under diverse constraint considerations:
Using these cases enables a progressive analysis of reserve availability, varying from the GAA level (Case 1) to the full CSA level, that considers both transmission outage and capacity constraints (Case 4). A case that considers network topology but ignores transmission line outage and capacity constraints is intentionally excluded. In this case, because the DCOPF neglects transmission losses and the constraints are disregarded by definition, the key optimization outcomes (e.g., DNS) would be identical to those from the GAA level (Case 1). Therefore, this case was considered redundant.
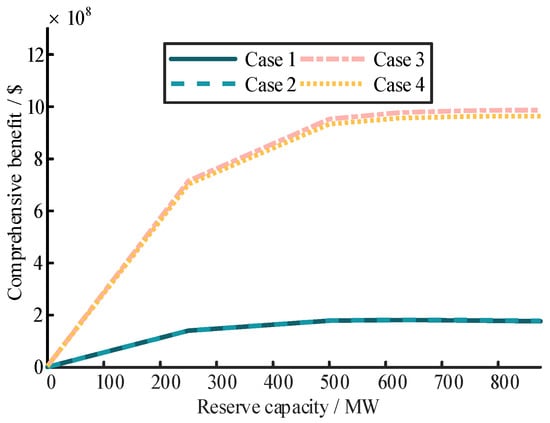
The analysis examined the reserve configured in Unit 2, with RES penetration of 10% with γ = 0.5 being used as an example. As shown in Figure 3 and Table 2, introducing progressively tighter transmission constraints leads to a notable increase in reserve capacity across the four cases: 650 MW in Case 1, 660 MW in Case 2, 830 MW in Case 3, and 860 MW in Case 4 (representing an increase of 32.3% compared to Case 1). This finding demonstrates the necessity of adaptive adjustments in reserve planning when including such constraints, ultimately leading to a result that more realistically reflects system needs.
Figure 3.
Comprehensive benefit curves at different levels.
Table 2.
The optimal reserve capacity scheme and cost–benefit balance under different constraint conditions.
From Case 1 to Case 2 and from Case 3 to Case 4, the reserve capacity increases by 10 MW and 30 MW, respectively. These increases are mainly due to transmission outages, which degrade system reliability, thereby enhancing the marginal reliability benefit of reserve. As a consequence, the optimization model requires some additional reserve to maximize the objective function f.
Another set of comparisons reveals that the reserve capacity in Case 3 increases by 180 MW compared to that in Case 1, and that in Case 4 increases by 200 MW compared to that in Case 2. These results indicate that the transmission capacity constraints have a notable impact on marginal reliability benefit, requiring the system to allocate more reserve capacity to achieve the maximum f.
To ensure a fair comparison, a reliability assessment was performed on the planning results derived from all four cases at the full CSA level. This standardized assessment reveals that as planning progresses from the GAA level (Case 1) to the tighter transmission constrained CSA levels (Cases 2–4), both EENS and LOLE consistently decrease.
As shown in Figure 3 and Table 2, conditional comprehensive benefit increases with such tighter transmission constraints generally, but it decreases by 2.3% from Case 3 to Case 4. This decline is attributed to the combined effects of transmission capacity and outage constraints, which directly limit reserve availability due to the congestion and contingency risks. The centralized reserve encounters bottlenecks when both constraints are under consideration.
4.2. Reserve Planning Based on a Multi-Variable Optimization Problem
At this stage of this study, reserve capacity and allocation during the reserve planning is divided into two types of optimization models: The first type uses a single-variable optimization method, thus concentrating the system-required reserve capacity on a single unit. The second type constructs a multi-variable optimization model and utilizes PSO to achieve the optimal allocation of reserve capacity across multiple units.
Key parameters for the PSO were set as follows: The population consisted of 10 particles, thus evolving over 10 iterations. w = 0.1, λ1,max = λ2,max = 0.5, and λ1,min = λ2,min = 0.1, and the velocity limit decreases from 50 to 30 MW. Particle positions are bounded within a range of [0, 400] MW.
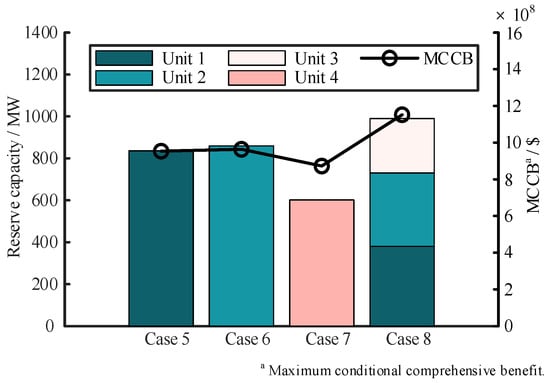
The analysis used RES penetration of 10% with γ = 0.5 as an example. As shown in Figure 4, the reserve planning strategies notably affect both the reserve capacity and comprehensive benefit. Among the centralized strategies (Cases 5–7), the reserve capacities follow the order Case 6 (860 MW) > Case 5 (840 MW) > Case 7 (600 MW). Case 5 and Case 6 share the same unit type but differ in location—Unit 2 at bus 23 (Case 6) exhibits better transmission connectivity than Unit 1 at bus 18 (Case 5), resulting in higher deliverability and marginal reliability benefit. In contrast, although units of Cases 6 and 7 are located at the same bus, Unit 4 in Case 7 incurs a higher marginal cost, limiting its reserve capacity to 600 MW under the cost–benefit trade-off.
Figure 4.
The maximum conditional comprehensive benefit of reserve capacity and allocation in different units.
Case 8, based on multi-variable optimization, achieves the best performance, with a total reserve capacity of 990 MW and a maximum conditional comprehensive benefit of 115.19 × 10⁷ USD/year. The decentralized allocation results in a 15.1% increase in reserve capacity compared to Case 6, and it yields a notable 19.5% improvement in maximum conditional comprehensive benefit. This improvement stems from the coordination of reserve allocation across multiple units, thus leveraging both technical and economic characteristics.
As shown in Table 3, in terms of reliability indices, Case 8 achieves the lowest EENS (3.23 × 10³ MWh/year) and LOLE (22 h/year). This observation discloses that such coordinated reserve allocation notably improves the reliability of the system.
Table 3.
Reserve planning results based on a multi-variable optimization problem.
4.3. Reserve Planning Considering Different RES Penetration Levels and Risk Preference
At this stage of the study, a sensitivity analysis is conducted to quantify the impact of the RES penetration level and risk preference on reserve capacity and its allocation. The design of these cases is based on the capacity credit specifications (e.g., 25% for wind power, 30% for solar power) detailed at the beginning of Section 4. Three test cases are designed as follows:
Case 9: RES penetration of 10%. Two 620 MW wind farms and one 517 MW solar plant, all located at bus 7, replace three 155 MW conventional units at buses 15, 16, and 23.
Case 10: RES penetration of 20%. Using the system in Case 9 as a baseline, one 1200 MW wind farm and one 517 MW solar plant, all located at bus 23, replace five conventional units: four 76 MW units at buses 1 and 2 and one 155 MW unit at bus 23.
Case 11: RES penetration of 40%. Using the system in Case 10 as a baseline, one 2364 MW wind farm and one 1167 MW solar plant, all located at bus 23, replace four conventional units: three 197 MW conventional units at bus 13 and one 350 MW conventional unit at bus 23.
We take γ = 0.5 as an example for analysis. As shown in Table 4, the reserve capacity exhibits a stepwise increase as RES penetration increases from 10% to 40%, increasing from 990 MW to 1410 MW (representing an increase of 42.4%), while the corresponding maximum conditional comprehensive benefit increases from 115.19 × 10⁷ to 345.23 × 10⁷ USD/year, respectively. This trend is primarily attributed to the growing uncertainty introduced by wind and solar power, which necessitates introducing some additional reserve capacity to guarantee system reliability.
Table 4.
The results of reserve planning considering different RES penetration levels.
To analyze the impact of risk preference on reserve planning, reserve planning was performed with γ set to 1, 0.5, 0.3, and 0.1, using RES penetration of 10% as an example. Table 5 summarizes the results for reserve planning conducted using different values of γ. As γ decreases from 1 to 0.1, the reserve capacity increases from 750 MW to 1320 MW (representing an increase of 76%), while the corresponding maximum conditional comprehensive benefit increases notably from 56.94 × 10⁷ USD/year to 325.48 × 10⁷ USD/year. This is due to the fact that lower γ values emphasize extreme events, increasing the weight of high-loss scenarios and driving the system toward more robust reserve planning results.
Table 5.
The results of reserve planning considering different risk preferences.
From the perspective of reliability indices, the decrease in γ leads to reductions in both EENS and LOLE, indicating improvement in the reliability of systems. However, the rate of improvement diminishes as γ becomes smaller in the later step.
5. Conclusions
In this study, we propose a new reserve planning method for a renewable-energy-dominated power system that incorporates reserve availability. A reserve planning framework is developed at the CSA level using CCBA. A PSO-based hierarchical optimization method is proposed to co-optimize reserve capacity and allocation. The impacts of RES penetration and risk preference are analyzed based on the IEEE-RTS79 system. Major findings include the following:
- (1)
- A reserve planning framework is developed at the CSA level, combining NSMCS with the DCOPF to evaluate reliability–economic viability indices. The proposed framework is more realistic than the traditional GAA, revealing that the reserve capacity determined at the CSA level can be 32.3% higher to meet system needs.
- (2)
- The decentralized reserve allocation strategy, based on the multi-variable optimization problem, is highly effective. While increasing total reserve capacity by 15.1% compared to the optimal centralized case, the strategy delivers a substantial improvement in system reliability by enhancing reserve availability. This is evidenced via the strategy reducing EENS by 73.8% and increasing the maximum conditional comprehensive benefit by 19.5%.
- (3)
- Both higher RES penetration and stronger risk preference notably increase the reserve requirements, i.e., the reserve capacity increases by 42.4% as penetration increases from 10% to 40%, and by 76.0% when the risk preference changes from γ = 1 to γ = 0.1.
Author Contributions
Conceptualization, S.P. and J.T.; methodology, S.P. and J.W.; software, H.C.; validation, M.Z. and Y.W.; formal analysis, H.C.; investigation, S.P. and J.W.; resources, Y.W.; data curation, M.Z. and Y.W.; writing—original draft preparation, S.P. and M.Z.; writing—review and editing, H.C. and J.T.; visualization, M.Z. and J.W.; supervision, J.T.; project administration, S.P.; funding acquisition, Y.W. All authors have read and agreed to the published version of the manuscript.
Funding
This research was funded by the Key Science and Technology Project of China Southern Power Grid (No. GDKJXM20240053).
Institutional Review Board Statement
Not applicable.
Informed Consent Statement
Not applicable.
Data Availability Statement
The datasets presented in this article are not readily available because the data are part of an ongoing research project.
Conflicts of Interest
Authors Sui Peng, Mengshu Zhu and Yanfeng Wang were employed by the company Guangdong Power Grid Corporation. The remaining authors declare that the research was conducted in the absence of any commercial or financial relationships that could be construed as a potential conflict of interest. The sponsors had no role in the design, execution, interpretation, or writing of the study.
References
- Tavakkoli, M.; Fattaheian-Dehkordi, S.; Pourakbari-Kasmaei, M.; Liski, M.; Lehtonen, M. An approach to divide wind power capacity between day-ahead energy and intraday reserve power markets. IEEE Syst. J. 2022, 16, 1123–1134. [Google Scholar] [CrossRef] [Scilit]
- Chen, Y.; Wei, W.; Wang, C.; Shafie-Khah, M.; Catalao, J.P.S. Storage and transmission capacity requirements of a remote solar power generation system. IEEE Syst. J. 2022, 16, 3175–3178. [Google Scholar] [CrossRef] [Scilit]
- National Energy Administration. National Energy Administration Releases 2024 National Power Industry Statistics; National Energy Administration: Beijing, China, 21 January 2025. Available online: https://www.nea.gov.cn/20250121/097bfd7c1cd3498897639857d86d5dac/c.html (accessed on 11 March 2025).
- da Silva, A.M.L.L.; Sales, W.S.; da Fonseca Manso, L.A.; Billinton, R. Long-term probabilistic evaluation of operating reserve requirements with renewable sources. IEEE Trans. Power Syst. 2010, 25, 106–116. [Google Scholar] [CrossRef] [Scilit]
- Li, Z.; Li, W.; Yu, S.S.; Guo, L.; Zheng, H.; Ma, J.; Zhao, L.; Dou, W.; Zhang, N. Fast frequency response reserve planning for power systems considering homogeneous extreme risks. IEEE Trans. Ind. Appl. 2023, 59, 2314–2325. [Google Scholar] [CrossRef] [Scilit]
- Billinton, R.; Karki, R. Application of Monte Carlo simulation to generating system well-being analysis. IEEE Trans. Power Syst. 1999, 14, 1172–1177. [Google Scholar] [CrossRef] [Scilit]
- Ding, Y.; Wang, P.; Goel, L.; Loh, P.C.; Wu, Q. Long-term reserve expansion of power systems with high wind power penetration using universal generating function methods. IEEE Trans. Power Syst. 2011, 26, 766–774. [Google Scholar] [CrossRef] [Scilit]
- Ortega-Vazquez, M.; Kirschen, D.; Pudjianto, D. Optimising the scheduling of spinning reserve considering the cost of interruptions. IEE Proc. Gener. Transm. Distrib. 2006, 153, 460–465. [Google Scholar] [CrossRef] [Scilit]
- Sun, J.B.; Liu, F.; Huang, G.D.; Jiang, J.; Kou, Y. Reserve Planning and evaluation method of power systems considering risk assessment. Guangdong Electr. Power 2018, 31, 57–61. [Google Scholar] [CrossRef]
- Liang, F.; Pan, Y.; Xu, D.; Zhou, J. Coordinated scheduling of active power and reserve in power systems based on extreme scenario analysis. Autom. Electr. Power Syst. 2019, 43, 101–109. [Google Scholar] [CrossRef]
- Kim, J. Iterated Grid Search Algorithm on Unimodal Criteria. Doctoral Dissertation, Virginia Polytechnic Institute and State University, Blacksburg, VA, USA, 1997. [Google Scholar]
- Cho, S.; Li, C.; Grossmann, I.E. Recent advances and challenges in optimization models for expansion planning of power systems and reliability optimization. Comput. Chem. Eng. 2022, 165, 107924. [Google Scholar] [CrossRef] [Scilit]
- Qin, C.; Yan, Q.; He, G. Integrated energy systems planning with electricity, heat and gas using particle swarm optimization. Energy 2025, 188, 116044. [Google Scholar] [CrossRef] [Scilit]
- Sedghi, M.; Ahmadian, A.; Aliakbar-Golkar, M. Assessment of optimization algorithms capability in distribution network planning: Review, comparison and modification techniques. Renew. Sustain. Energy Rev. 2016, 66, 415–434. [Google Scholar] [CrossRef] [Scilit]
- Pellerin, R.; Perrier, N.; Berthaut, F. A survey of hybrid metaheuristics for the resource-constrained project scheduling problem. Eur. J. Oper. Res. 2020, 280, 395–416. [Google Scholar] [CrossRef] [Scilit]
- Yang, X.; Liu, S.; Zhang, L.; He, Y.; Li, G. Design and analysis of a renewable energy power system for shale oil exploitation using hierarchical optimization. Energy 2020, 206, 118078. [Google Scholar] [CrossRef] [Scilit]
- Xia, X.; Gui, L.; Zhan, Z.-H. A multi-swarm particle swarm optimization algorithm based on dynamical topology and purposeful detecting. Appl. Soft Comput. 2018, 67, 126–140. [Google Scholar] [CrossRef] [Scilit]
- Akopov, A.S. A Hybrid Multi-Swarm Particle Swarm Optimization Algorithm for Solving Agent-Based Epidemiological Model. Cybern. Inf. Technol. 2025, 25, 59–77. [Google Scholar] [CrossRef] [Scilit]
- Qu, C.; Wang, X.; Zeng, P.; Xie, S. Long-term reserve planning and decision-making based on conditional cost-benefit analysis. Proc. Chin. Soc. Electr. Eng. 2014, 31, 5642–5650. [Google Scholar] [CrossRef]
- Mei, S.; Zhang, D.; Wang, Y.; Liu, F.; Wei, W. Robust optimization of static reserve planning with large-scale integration of wind power: A game theoretic approach. IEEE Trans. Sustain. Energy 2014, 5, 535–545. [Google Scholar] [CrossRef] [Scilit]
- Kantar, Y.M.; Usta, I. Analysis of the upper-truncated Weibull distribution for wind speed. Energy Convers. Manag. 2015, 96, 81–88. [Google Scholar] [CrossRef] [Scilit]
- Xie, K.; Jiang, Z.; Li, W. Effect of wind speed on wind turbine power converter reliability. IEEE Trans. Energy Convers. 2012, 27, 96–104. [Google Scholar] [CrossRef] [Scilit]
- Lv, Y.; Guan, L.; Tang, Z.; Zhao, Q. A probability model of pv for the middle-term to long-term power system analysis and its application. Energy Procedia 2016, 103, 28–33. [Google Scholar] [CrossRef] [Scilit]
- He, X.; Ding, T.; Sun, Y.; Shahidehpour, M.; Li, L.; Chi, F. Interval Reliability Evaluation of Hybrid AC/DC Grids with Integrated Renewable Energy. IEEE Trans. Power Syst. 2023, 38, 4501–4514. [Google Scholar] [CrossRef] [Scilit]
- Billinton, R.; Li, W. Reliability Assessment of Electric Power Systems Using Monte Carlo Methods; Springer Nature: Durham, NC, USA, 1994. [Google Scholar]
- Wang, X.; Xie, S.; Wang, X.; Qu, C. Decision-Making Model Based on Conditional Risks and Conditional Costs in Power System Probabilistic Planning. IEEE Trans. Power Syst. 2013, 28, 4080–4088. [Google Scholar] [CrossRef] [Scilit]
- Das, A.; Sasmal, B.; Dhal, K.G.; Hussien, A.G.; Naskar, P.K. Particle Swarm Optimizer Variants for Multi-Level Thresholding: Theory, Performance Enhancement and Evaluation. Arch. Comput. Methods Eng. 2024, 31, 3115–3150. [Google Scholar] [CrossRef] [Scilit]
- Probability Methods Subcommittee. IEEE reliability test system. IEEE Trans. Power Appar. Syst. 1979, 98, 2047–2054. [Google Scholar] [CrossRef] [Scilit]
- Moradi-Sepahvand, M.; Amraee, T. Integrated expansion planning of electric energy generation, transmission, and storage for handling high shares of wind and solar power generation. Appl. Energy 2021, 298, 117137. [Google Scholar] [CrossRef] [Scilit]
- Tapetado, P.; Usaola, J. Capacity credits of wind and solar generation: The Spanish case. Renew. Energy 2019, 143, 164–175. [Google Scholar] [CrossRef] [Scilit]

Disclaimer/Publisher’s Note: The statements, opinions and data contained in all publications are solely those of the individual author(s) and contributor(s) and not of MDPI and/or the editor(s). MDPI and/or the editor(s) disclaim responsibility for any injury to people or property resulting from any ideas, methods, instructions or products referred to in the content. |
© 2026 by the authors. Licensee MDPI, Basel, Switzerland. This article is an open access article distributed under the terms and conditions of the Creative Commons Attribution (CC BY) license.