


Abstract
Grain moisture content is a key variable for safe storage, drying control, and quality management. Microwave sensing is attractive because water strongly modulates the complex relative permittivity () of granular agricultural products, thereby shaping broadband scattering-parameter spectra. This study presents a meter-referenced feasibility evaluation of an interpretable S-parameter–permittivity–moisture chain using a vector network analyzer over 2–18 GHz. Wheat, maize, and mung bean were prepared at six moisture levels, and the moisture values were referenced to two commercial grain moisture meters (MC_ref) to represent rapid on-site benchmarking rather than absolute gravimetric moisture determination. Therefore, the reported errors should be interpreted as commercial-meter-referenced calibration indicators rather than absolute gravimetric moisture prediction accuracy. Two free-space configurations were compared on the same platform: a two-horn transmission setup under controlled packing and a metal-backed double-pass reflection setup intended to represent single-sided access under loose bulk packing. After SOLT calibration and empty-holder background normalization, and were retrieved via complex-domain nonlinear least-squares fitting of physics-based slab models to measured S21 spectra. The results show that moisture-dependent dielectric responses were grain- and configuration-dependent. In particular, generally provided a more robust moisture-sensitive feature in the free-space transmission configuration, whereas the optimal single-parameter predictor in the metal-backed configuration differed among grains. A mid-band frequency window of approximately 8–16 GHz provided more stable inversion by avoiding low-frequency coupling artefacts and high-frequency signal-to-noise degradation. The metal-backed configuration preserved moisture trends but yielded lower effective values, likely due to increased air fraction under loose packing. These results indicate that packing state, grain type, and frequency-window selection are critical factors for transferring microwave moisture calibration from laboratory measurements to practical grain-handling scenarios.
1. Introduction
Accurate and timely measurement of grain moisture content (MC) is foundational to safe storage and high-value utilization of cereals and legumes. Moisture levels above safe thresholds accelerate respiration and create favorable conditions for fungi and insects, which in turn increase heating, caking, mould growth and mycotoxin contamination. These processes are recognized as major contributors to post-harvest losses across grain supply chains [1,2]. In practice, MC also affects processing performance and trade fairness: excessive moisture reduces kernel hardness and milling yield, while contractual MC limits determine grading and pricing. Consequently, MC sensing is not only a quality-control task but also a decision variable for drying control, aeration scheduling and inventory management in smart storage systems.
From the perspective of grain quality and storage safety, moisture content should also be interpreted with reference to accepted commodity standards. Codex standards specify a maximum moisture content of 14.5% m/m for wheat and durum wheat and 15.5% m/m for maize, while standards for certain pulses provide different moisture limits depending on climate and storage practice. Therefore, samples exceeding these values should be regarded as high-moisture or stress-test cases for calibration rather than as acceptable long-term storage states. In addition, wheat, maize, and mung bean are not only major food materials but also important sources of dietary energy, plant protein, fibre, minerals, and bioactive compounds. Preserving appropriate moisture levels is therefore relevant not only to safe storage but also to maintaining nutritional quality and processing performance.
The oven-drying method remains the accepted reference for MC, yet its long turnaround time and destructive nature make it unsuitable for high-throughput or online scenarios. Electrical moisture meters (resistance or capacitance based) improve speed and convenience, but they require physical contact and their readings can drift with grain variety, bulk density and temperature, leading to frequent recalibration in the field [3,4,5,6,7,8].
Microwave sensing exploits the fact that water molecules have strong dipolar polarization and relaxation loss in the GHz range, so MC changes dominate the complex relative permittivity () of grain bulks. This physical contrast has been widely used to characterize dielectric properties of agricultural products and to develop moisture-related models over broad frequency and temperature ranges [9,10,11,12,13,14,15,16,17,18]. Compared with low-frequency electrical meters, microwave methods are potentially non-destructive, fast and compatible with non-contact measurements that interrogate a larger sensing volume.
Beyond moisture sensing, dielectric response has also been used for soil inorganic nitrogen detection [19], and machine-learning approaches such as random forests have been explored for dielectric-parameter estimation [20]. Vector network analyzers (VNAs) provide broadband measurements of scattering parameters with both magnitude and phase, enabling quantitative retrieval of and from S-parameter spectra and, ultimately, MC estimation [21]. Free-space approaches using horn antennas are particularly attractive for granular media because they avoid direct probe–particle contact and can be adapted to conveyor, silo or container geometries [22,23,24]. Related broadband transmission/reflection structures for liquids and resonator-assisted permittivity measurement systems further illustrate the flexibility of microwave material characterization [25,26]. In addition, baseline dielectric models for water and saline systems and Debye-type loss formulations provide useful physical references for interpreting moisture-driven dispersion in wet biomaterials [27,28]. However, two challenges limit practical deployment: (i) the mechanistic link between moisture-induced dielectric changes and the measured S-parameter features is often treated as a black-box calibration, and (ii) measurement configuration and packing state (bulk density) can bias permittivity inversion, which undermines model transfer from laboratory to loose bulk conditions [17,22]. In addition, dielectric data and mechanism-oriented studies for legumes such as mung bean are relatively scarce compared with major cereals, restricting multi-crop applicability.
Based on the above background, this study tests three working hypotheses: (1) moisture variation produces measurable and grain-specific changes in microwave attenuation, phase response, and retrieved complex permittivity; (2) an intermediate frequency window can improve inversion stability by avoiding low-frequency coupling artefacts and high-frequency signal-to-noise degradation; and (3) the difference between the transmission and metal-backed configurations is controlled by both measurement architecture and packing state. It should be noted that the present work is designed as a feasibility and mechanism-oriented study rather than a metrological replacement of the oven-drying reference method. Therefore, the moisture values used for calibration are denoted as MC_ref, representing commercial-meter-referenced moisture levels for rapid benchmarking. Accordingly, the specific objectives of this work are as follows:
- (i)
- a unified electromagnetic forward-modeling and inversion workflow that retrieves and from complex S21 spectra using background normalization and complex-domain nonlinear least-squares fitting for both transmission and metal-backed double-pass configurations;
- (ii)
- a reliability-oriented analysis of frequency band and sample thickness, identifying a robust mid-band window (~8–16 GHz) and a practical thickness range (2–3 cm) that balance sensitivity with inversion stability;
- (iii)
- a comparative evaluation across wheat, maize, and mung bean, revealing grain-specific differences in sensitivity to moisture reference values (MC_ref) and informing single-parameter calibration choices;
- (iv)
- an explicit discussion of packing-state effects (controlled vs. loose packing) on retrieved permittivity, clarifying limitations and implications for transferring laboratory calibrations to bulk handling scenarios.
2. Materials and Methods
2.1. Measurement Chain: S-Parameters → Permittivity → Moisture
The measurement workflow is summarized as follows: (i) the VNA acquires broadband complex S-parameters of the antenna–sample–antenna system; (ii) a physically based electromagnetic model is used to retrieve the complex relative permittivity ε* of the grain layer; and (iii) calibration relationships between ε* (or derived features) and MC_ref are established. The complex relative permittivity is defined as , where represents electric energy storage and represents dielectric loss due to dipolar relaxation and ionic conduction. The background-normalized transfer function was computed as follows:
so that antenna coupling and holder responses were largely cancelled prior to inversion.
2.2. Vector Network Analyzer and Calibration
A PNA-L N5234A vector network analyzer (made in Keysight Technologies, Beijing, China) was used as the measurement platform. The sweep range was 2–18 GHz. Prior to each measurement campaign, full two-port SOLT (Short–Open–Load–Thru) calibration was performed using a standard calibration kit (model 31121), moving the reference planes to the antenna connectors to reduce systematic errors. The detailed VNA settings, including sweep points, IF bandwidth, output power, and time-gating information, are summarized in Table S1.
2.3. Free-Space Transmission Configuration
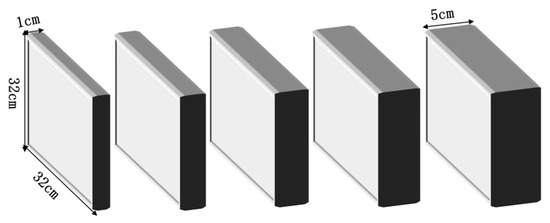
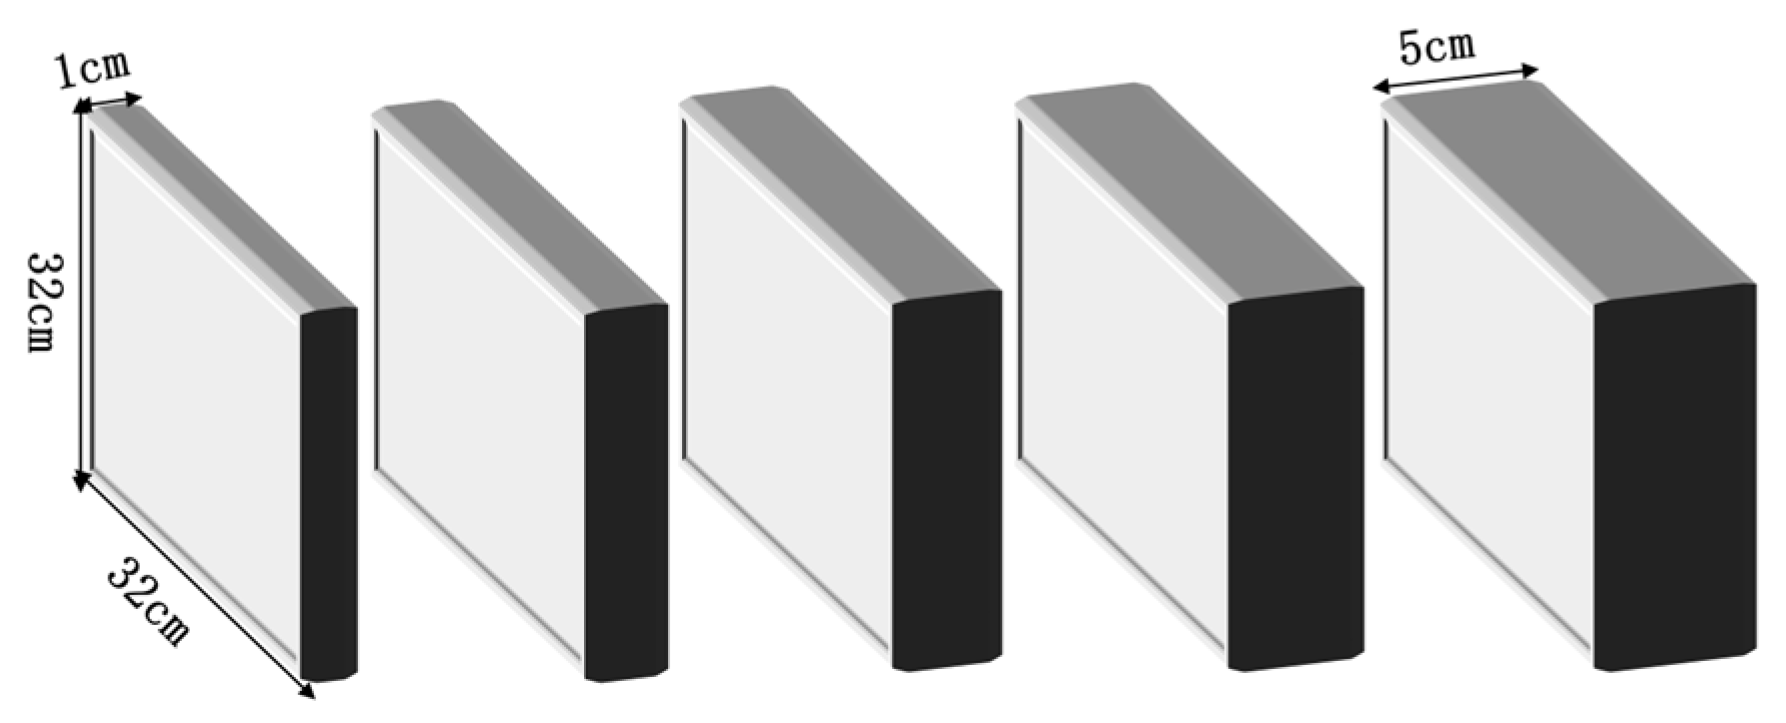
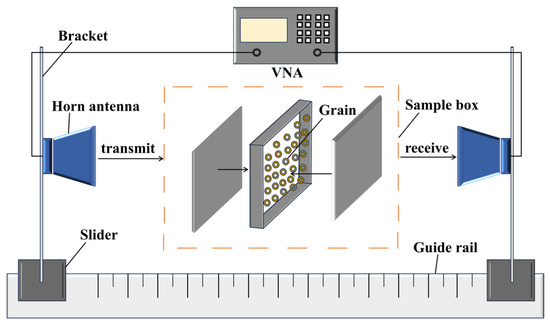
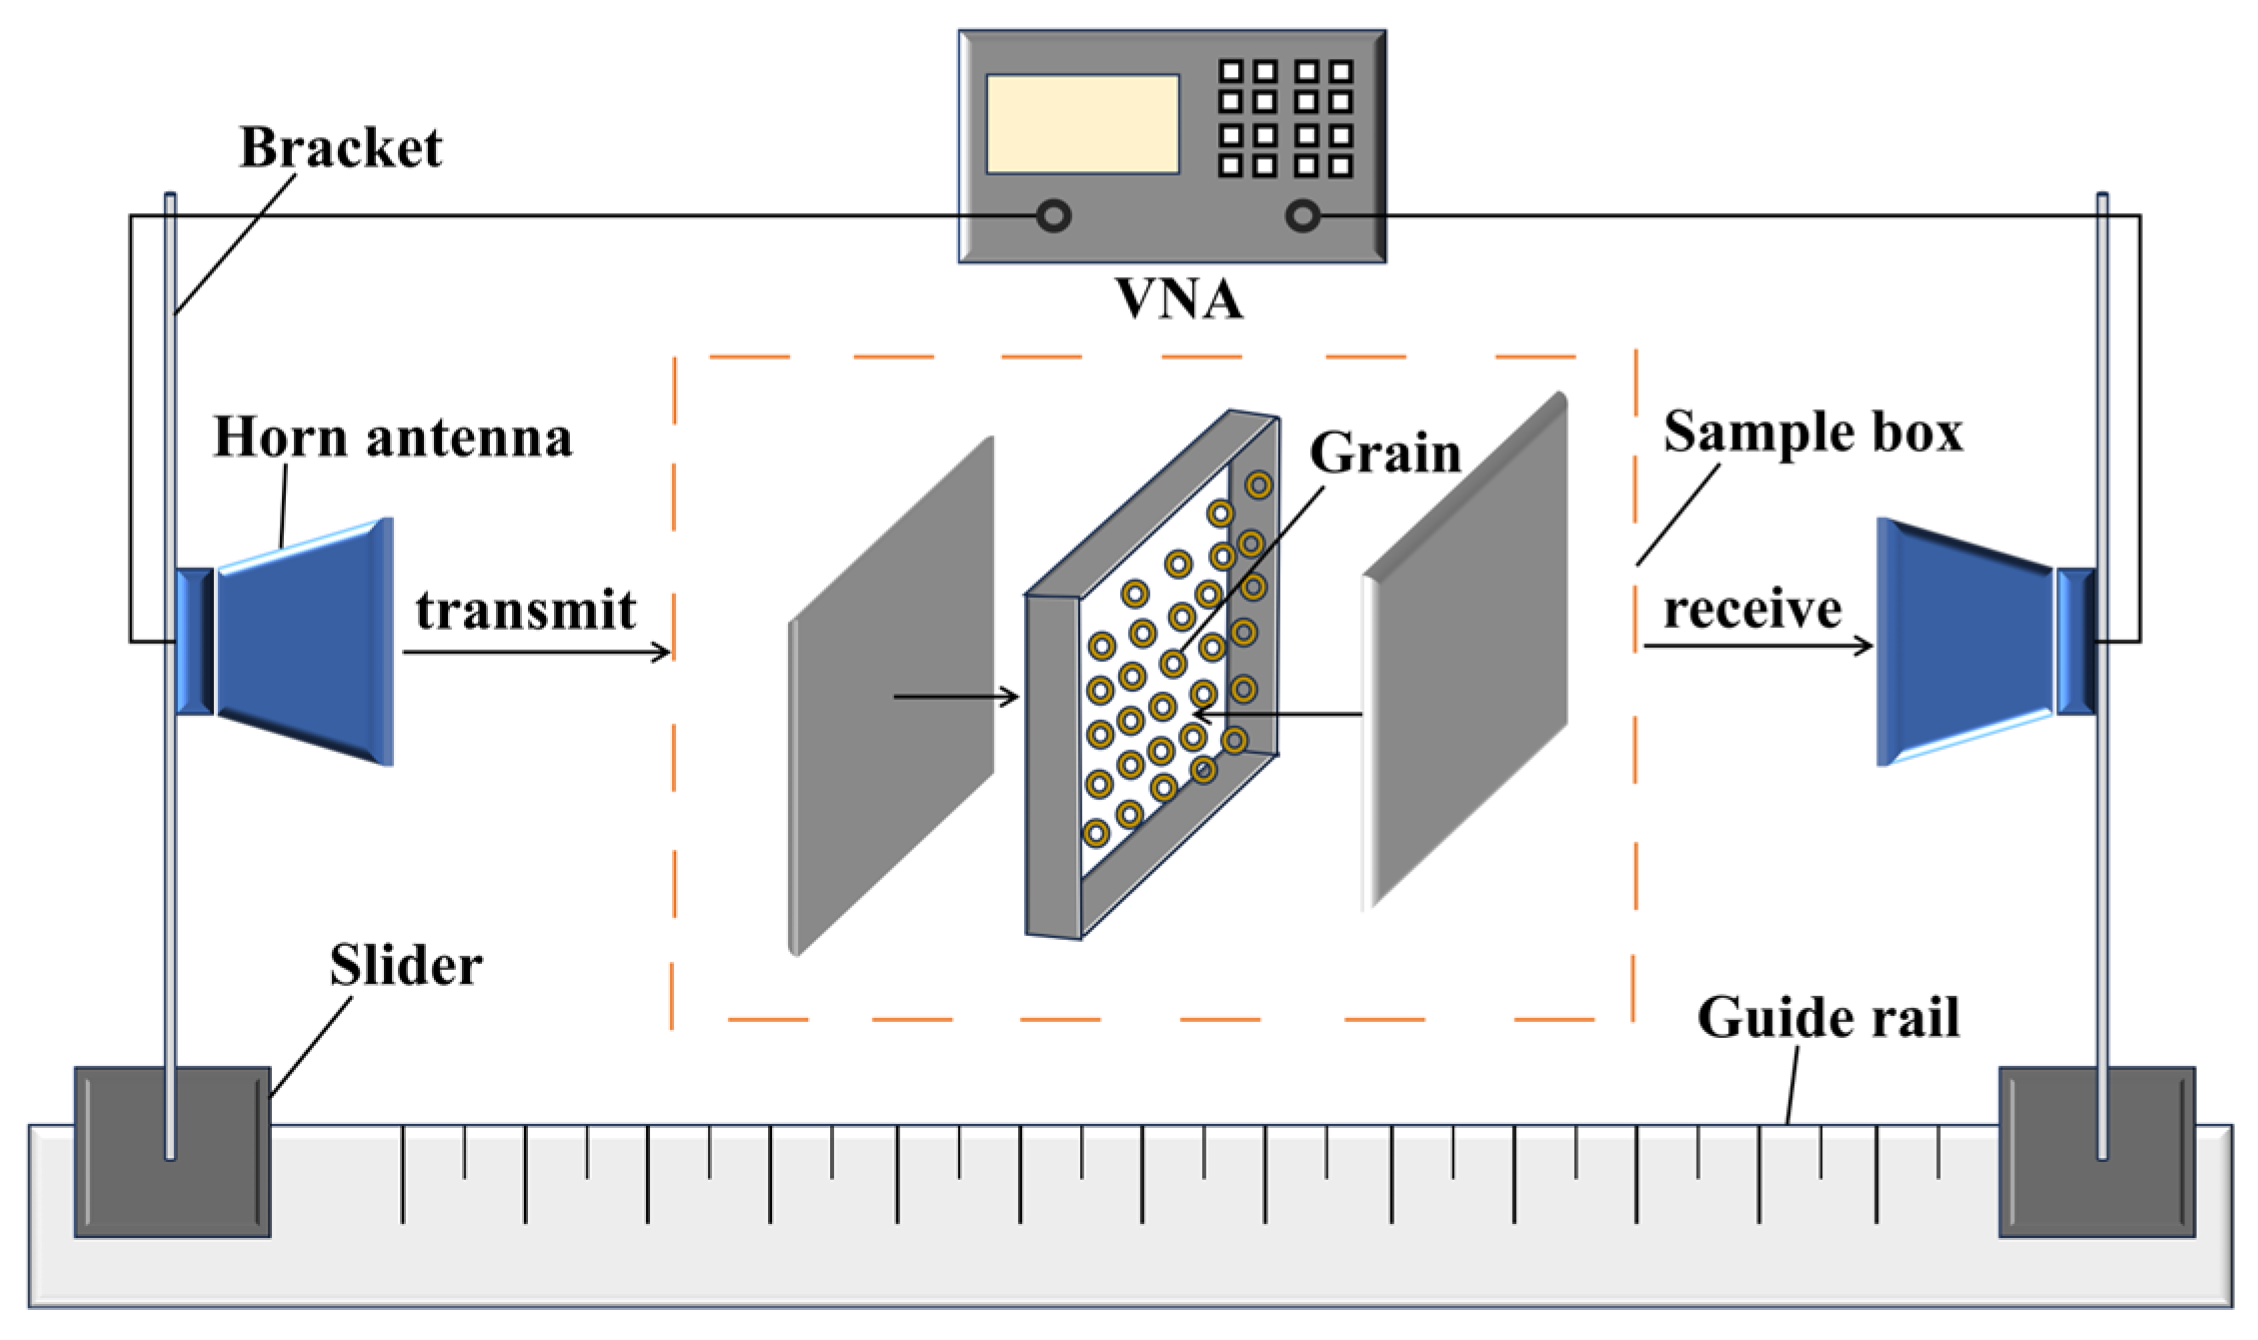
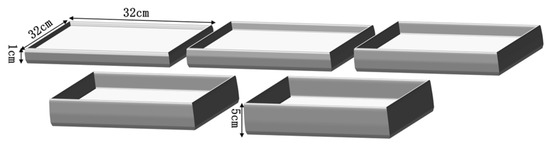
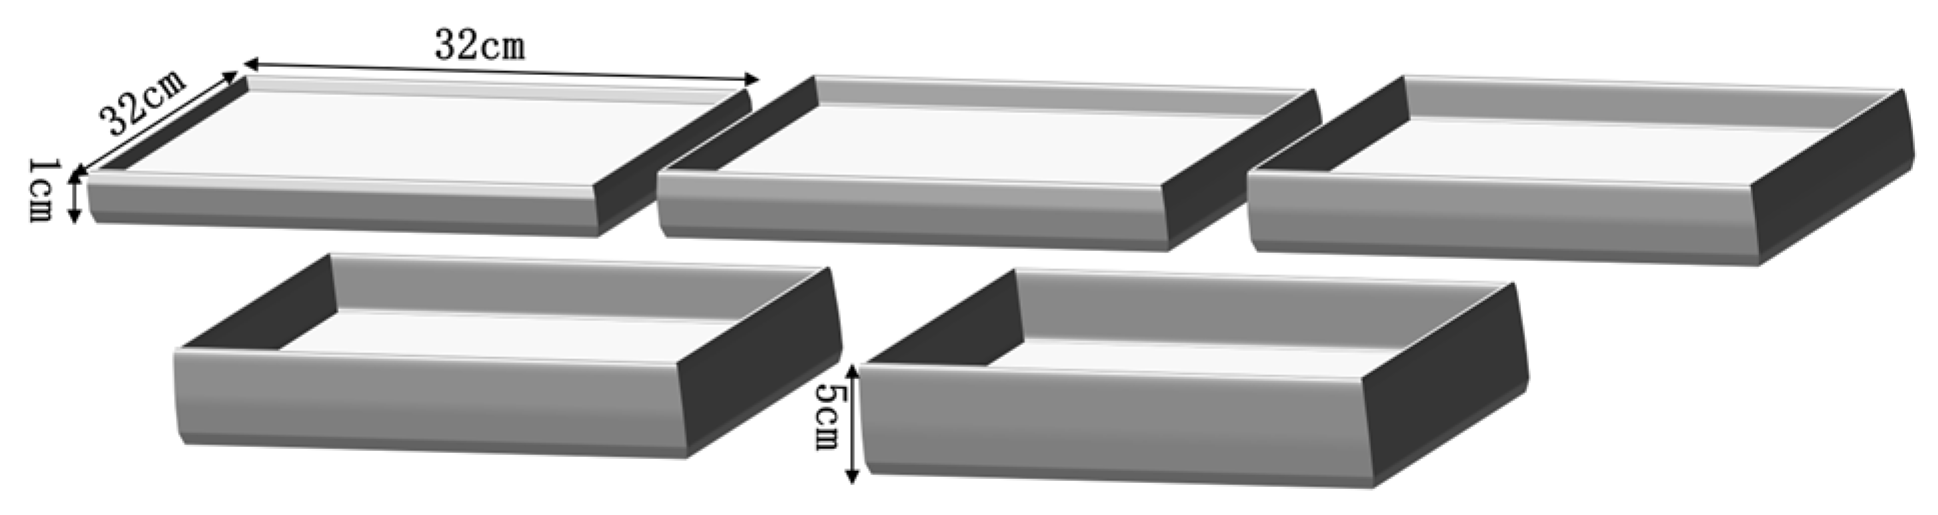
The free-space transmission configuration employed two broadband double-ridged horn antennas (XB-WDB-2-18S, each with a 10 cm aperture) connected to ports 1 and 2 of the VNA. The antennas were mounted coaxially on an optical rail with a separation distance of 120 cm. Grain samples were filled into an insulating sample holder placed between the antennas, positioned 60 cm from each antenna. To study thickness effects while maintaining adequate signal-to-noise ratio (SNR), ten holders were fabricated with five nominal heights (1, 2, 3, 4 and 5 cm; two holders per height). Figure 1 and Figure 2 show the sample box and experimental setup of the free-space transmission configuration.
Figure 1.
Sample box of the free-space transmission configuration.
Figure 2.
Experimental setup of the free-space transmission configuration.
Measurement steps were as follows: (1) SOLT calibration; (2) measurement of the empty holder as a background spectrum S21, empty(f); (3) filling the holder, leveling the surface, and measuring S21, sample(f); (4) repeating the fill–measure process three times for each condition to evaluate repeatability; and (5) exporting complex S-parameter data for permittivity inversion and moisture analysis.
2.4. Metal-Backed Reflection Configuration (Arch Frame)
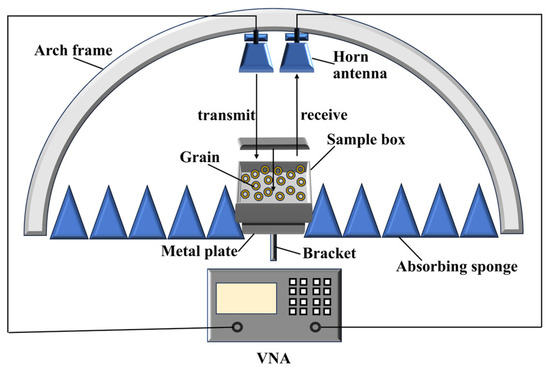
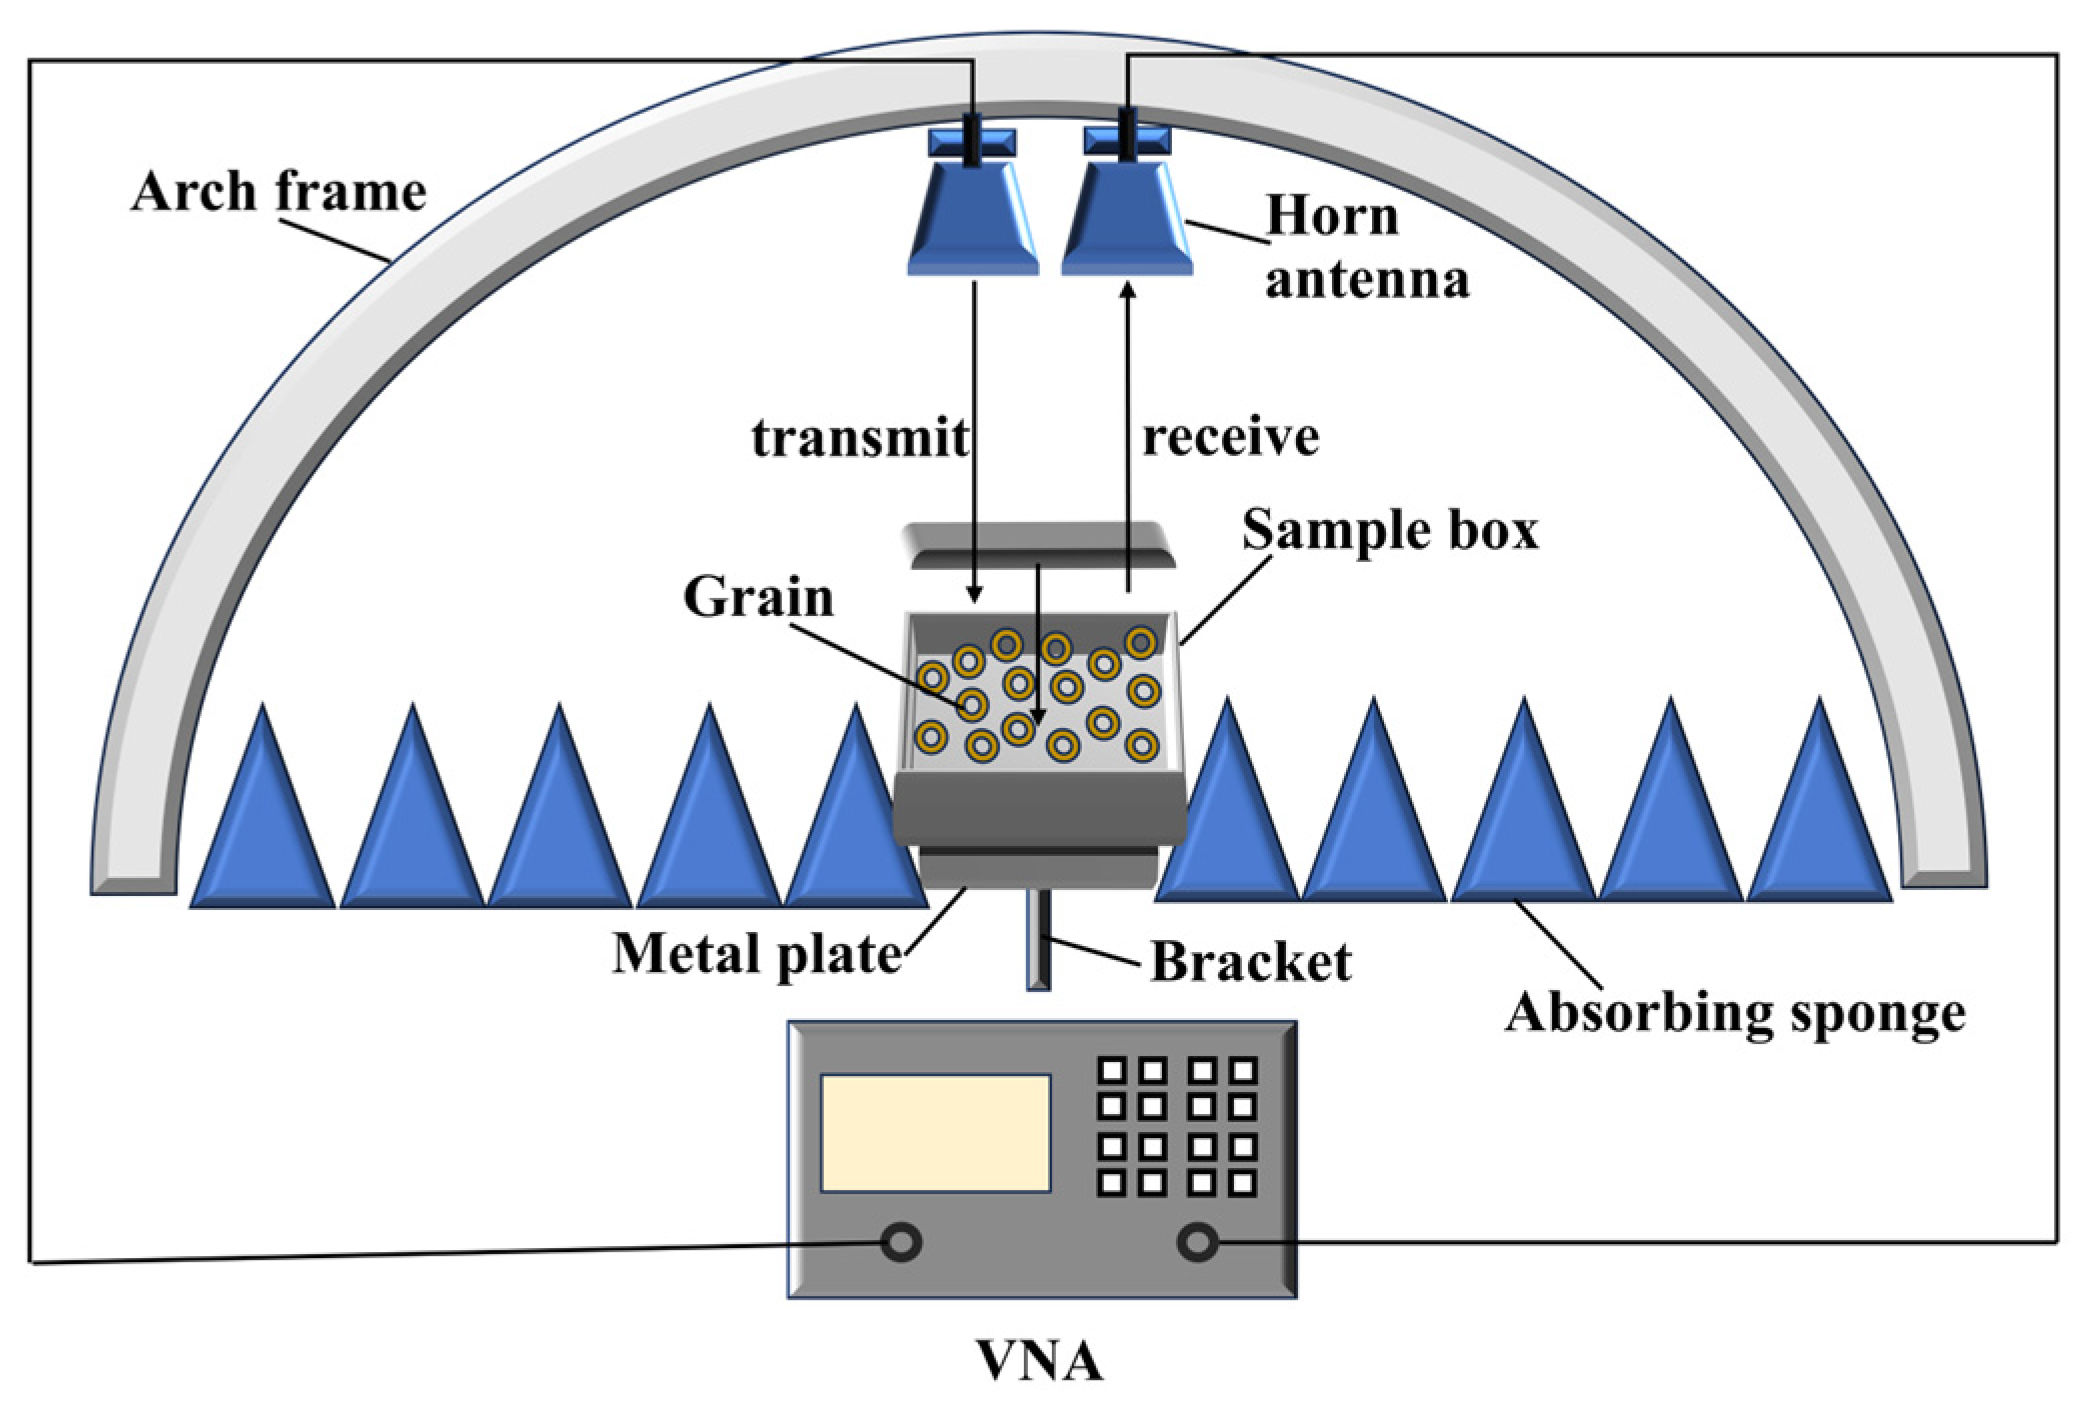
The metal-backed reflection configuration is a free-space variant intended to emulate loose bulk packing conditions. An aluminum plate served as the reflector. The sample holder was placed flush against the plate, with absorbing foam covering the surrounding area. Two horn antennas were mounted above the sample, facing downward on an arch frame. The measured S21 contained the double-pass propagation through the sample (air → sample → metal → sample → air), so its magnitude and phase were highly sensitive to ε*, sample thickness d, and packing state. Figure 3 and Figure 4 show the sample box and experimental setup of the metal-backed reflection configuration.
Figure 3.
Sample box of the metal-backed reflection configuration.
Figure 4.
Experimental setup of the metal-backed reflection configuration.
In this configuration, S21 should not be interpreted as a conventional through-transmission coefficient. Instead, it represents a bistatic metal-backed return signal collected by the receiving horn after double-pass propagation through the grain layer and reflection from the aluminum plate. The empty-holder metal-backed response was measured under the same geometry and used for background normalization. After this normalization, antenna coupling and the specular reflection from the bare metal plate were largely cancelled, and the remaining complex spectrum mainly reflected the moisture-dependent attenuation and phase delay introduced by the grain layer. Therefore, the normalized S21 was fitted using the metal-backed slab model in Appendix A. Because the two-horn metal-backed geometry is not a perfect monostatic reflection measurement, the retrieved permittivity should be regarded as an effective fitted permittivity under the present measurement geometry.
The measurement sequence mirrored the transmission case: SOLT calibration; empty-holder background acquisition on the metal plate; sample filling and leveling; three re-packing repeats; and data export. In this configuration, samples were filled by natural pouring with minimal compaction to mimic loose bulk packing.
2.5. Grain Samples and Moisture Reference
Wheat, maize and mung bean (≈5 kg per grain) were selected with no visible damage. Six representative moisture gradient levels were prepared for each grain type to establish the foundational dielectric response trends: (i) as-received (untreated); (ii–iv) drying at 40 °C, 50 °C and 60 °C for 1 h followed by cooling; and (v–vi) soaking in tap water for 1 h and 2 h at room temperature. After soaking, samples were air-dried for 48 h to remove surface free water before measurement. For transmission measurements, packing was standardized by free-fall filling from a fixed height followed by surface leveling to reduce density variation. For metal-backed measurements, natural packing was used to better represent field conditions.
Moisture levels were referenced to two commercial grain moisture meters (Table 1). The resulting values are denoted as MC_ref throughout the manuscript. Therefore, the reported calibration errors quantify the agreement between the microwave-derived dielectric predictors and commercial-meter-referenced moisture levels, rather than absolute gravimetric moisture accuracy. This distinction is important because commercial meter readings can be affected by grain type, temperature, bulk density, and moisture range. The oven-drying method was not included in the present feasibility experiment because the objective was to evaluate a rapid on-site microwave sensing chain against commonly available commercial meters, rather than to establish an absolute metrological moisture reference. Standard reference methods are available for different commodities, such as ISO-type oven-drying methods for cereals, maize, and pulses. Therefore, the present dataset is used primarily to evaluate dielectric response trends, configuration-dependent stability, and the feasibility of grain-specific calibration. Future work should include commodity-specific oven-drying reference measurements to validate the absolute accuracy of the microwave-derived models.
Table 1.
Reference moisture content of grain samples (wet basis, %) measured using two commercial meters.
2.6. Complex Permittivity Retrieval
Each grain bulk was approximated as an effective homogeneous dielectric slab of thickness (d) under normal incidence. The complex refractive index is and the propagation constant in the slab is , where . After background normalization, the measured was fitted with physics-based forward models.
For the transmission configuration, the normalized transfer function was modeled using a Fabry–Pérot slab transmission form:
where is the air–slab interface reflection coefficient.
For the metal-backed configuration, a perfect-conductor termination was assumed at the slab back surface, resulting in a double-pass response captured by the corresponding metal-backed slab model (Appendix A).
The complex permittivity was estimated by minimizing a complex-domain least-squares objective over a selected frequency band.
subject to and . Initial values were obtained from the phase slope and amplitude attenuation , followed by nonlinear least-squares refinement. The fitting simultaneously used magnitude and phase information, enabling stable retrieval within the recommended mid-band window. Based on the above complex-domain fitting strategy, the complete permittivity inversion procedure used in this study is summarized in Algorithm 1.
| Algorithm 1. Permittivity inversion from background-normalized S21 |
Input: complex , ; thickness (d); frequency window ; configuration flag (transmission/metal-backed).
|
2.7. Statistical Analysis
Moisture sensitivity was quantified using Pearson correlation coefficients (r) between MC_ref and the retrieved and values. Grain-specific linear calibration models were then constructed using ordinary least-squares (OLS) regression, with MC_ref (wet basis, %) as the response variable and or as the predictor. Model performance was evaluated using the coefficient of determination (R2), root mean squared error (RMSE, % w.b.), and leave-one-out cross-validation (LOOCV) RMSE. The statistical significance of the regression slope was assessed using two-sided t-tests. The normality of regression residuals was examined using the Shapiro–Wilk test, and the corresponding p-values are provided in Table S2. Because only six moisture levels were available for each grain, the Shapiro–Wilk test was used as a diagnostic check rather than as a strict model-selection criterion. Residual normality, LOOCV RMSE, and Cook’s distance were considered together to avoid over-interpreting high R2 values obtained from small datasets.
The Shapiro–Wilk results are summarized in Table S2. Most residual series did not show strong evidence of deviation from normality, whereas the free-space models for maize and wheat showed p < 0.05. Therefore, the regression p-values should be interpreted descriptively, and LOOCV RMSE was emphasized as an additional robustness indicator.
3. Results and Discussion
3.1. Moisture Range and Reference Consistency
Instrument-to-instrument consistency was evaluated using Pearson correlation and Bland–Altman analysis. The scatter plot and Bland–Altman plot for the two commercial moisture meters are provided in Figures S1 and S2, respectively. The two commercial meters agreed closely in most cases, with an overall correlation coefficient of r ≈ 0.996, a mean absolute difference of 0.38% w.b., a mean bias of −0.27% w.b. (LDS-1G − PM-8188-A), and 95% limits of agreement of −1.43 to 0.90% w.b. The largest discrepancy was observed for mung bean soaked for 2 h. These results support the use of the two-meter average as a practical MC_ref for feasibility analysis. However, because gravimetric oven-drying measurements were not performed, this comparison should be regarded as an instrument-to-instrument consistency check rather than validation against an absolute moisture reference.
Table 1 summarizes the MC_ref levels obtained after drying and soaking treatments. Based on the average of the two commercial meters, the MC_ref ranges were 9.20–31.40% for wheat, 9.55–22.95% for maize, and 9.85–17.75% for mung bean. For wheat, the untreated and dried samples were below the Codex maximum moisture level of 14.5% m/m, whereas the two soaked samples clearly exceeded this limit. For maize, the untreated and dried samples were below the Codex maximum level of 15.5% m/m, while the soaked samples exceeded it. For mung bean, no direct Codex limit specific to mung bean was used in this study; however, related pulse standards indicate that acceptable moisture limits depend on climate and storage duration. Therefore, the soaked mung bean samples should also be interpreted as high-moisture calibration points rather than as recommended storage conditions.
3.2. S-Parameter Response in Free-Space Transmission Measurements
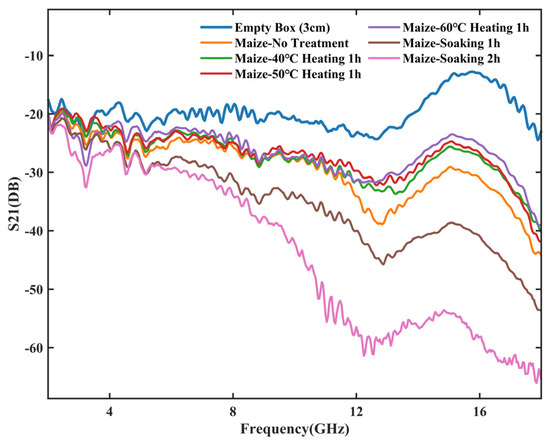
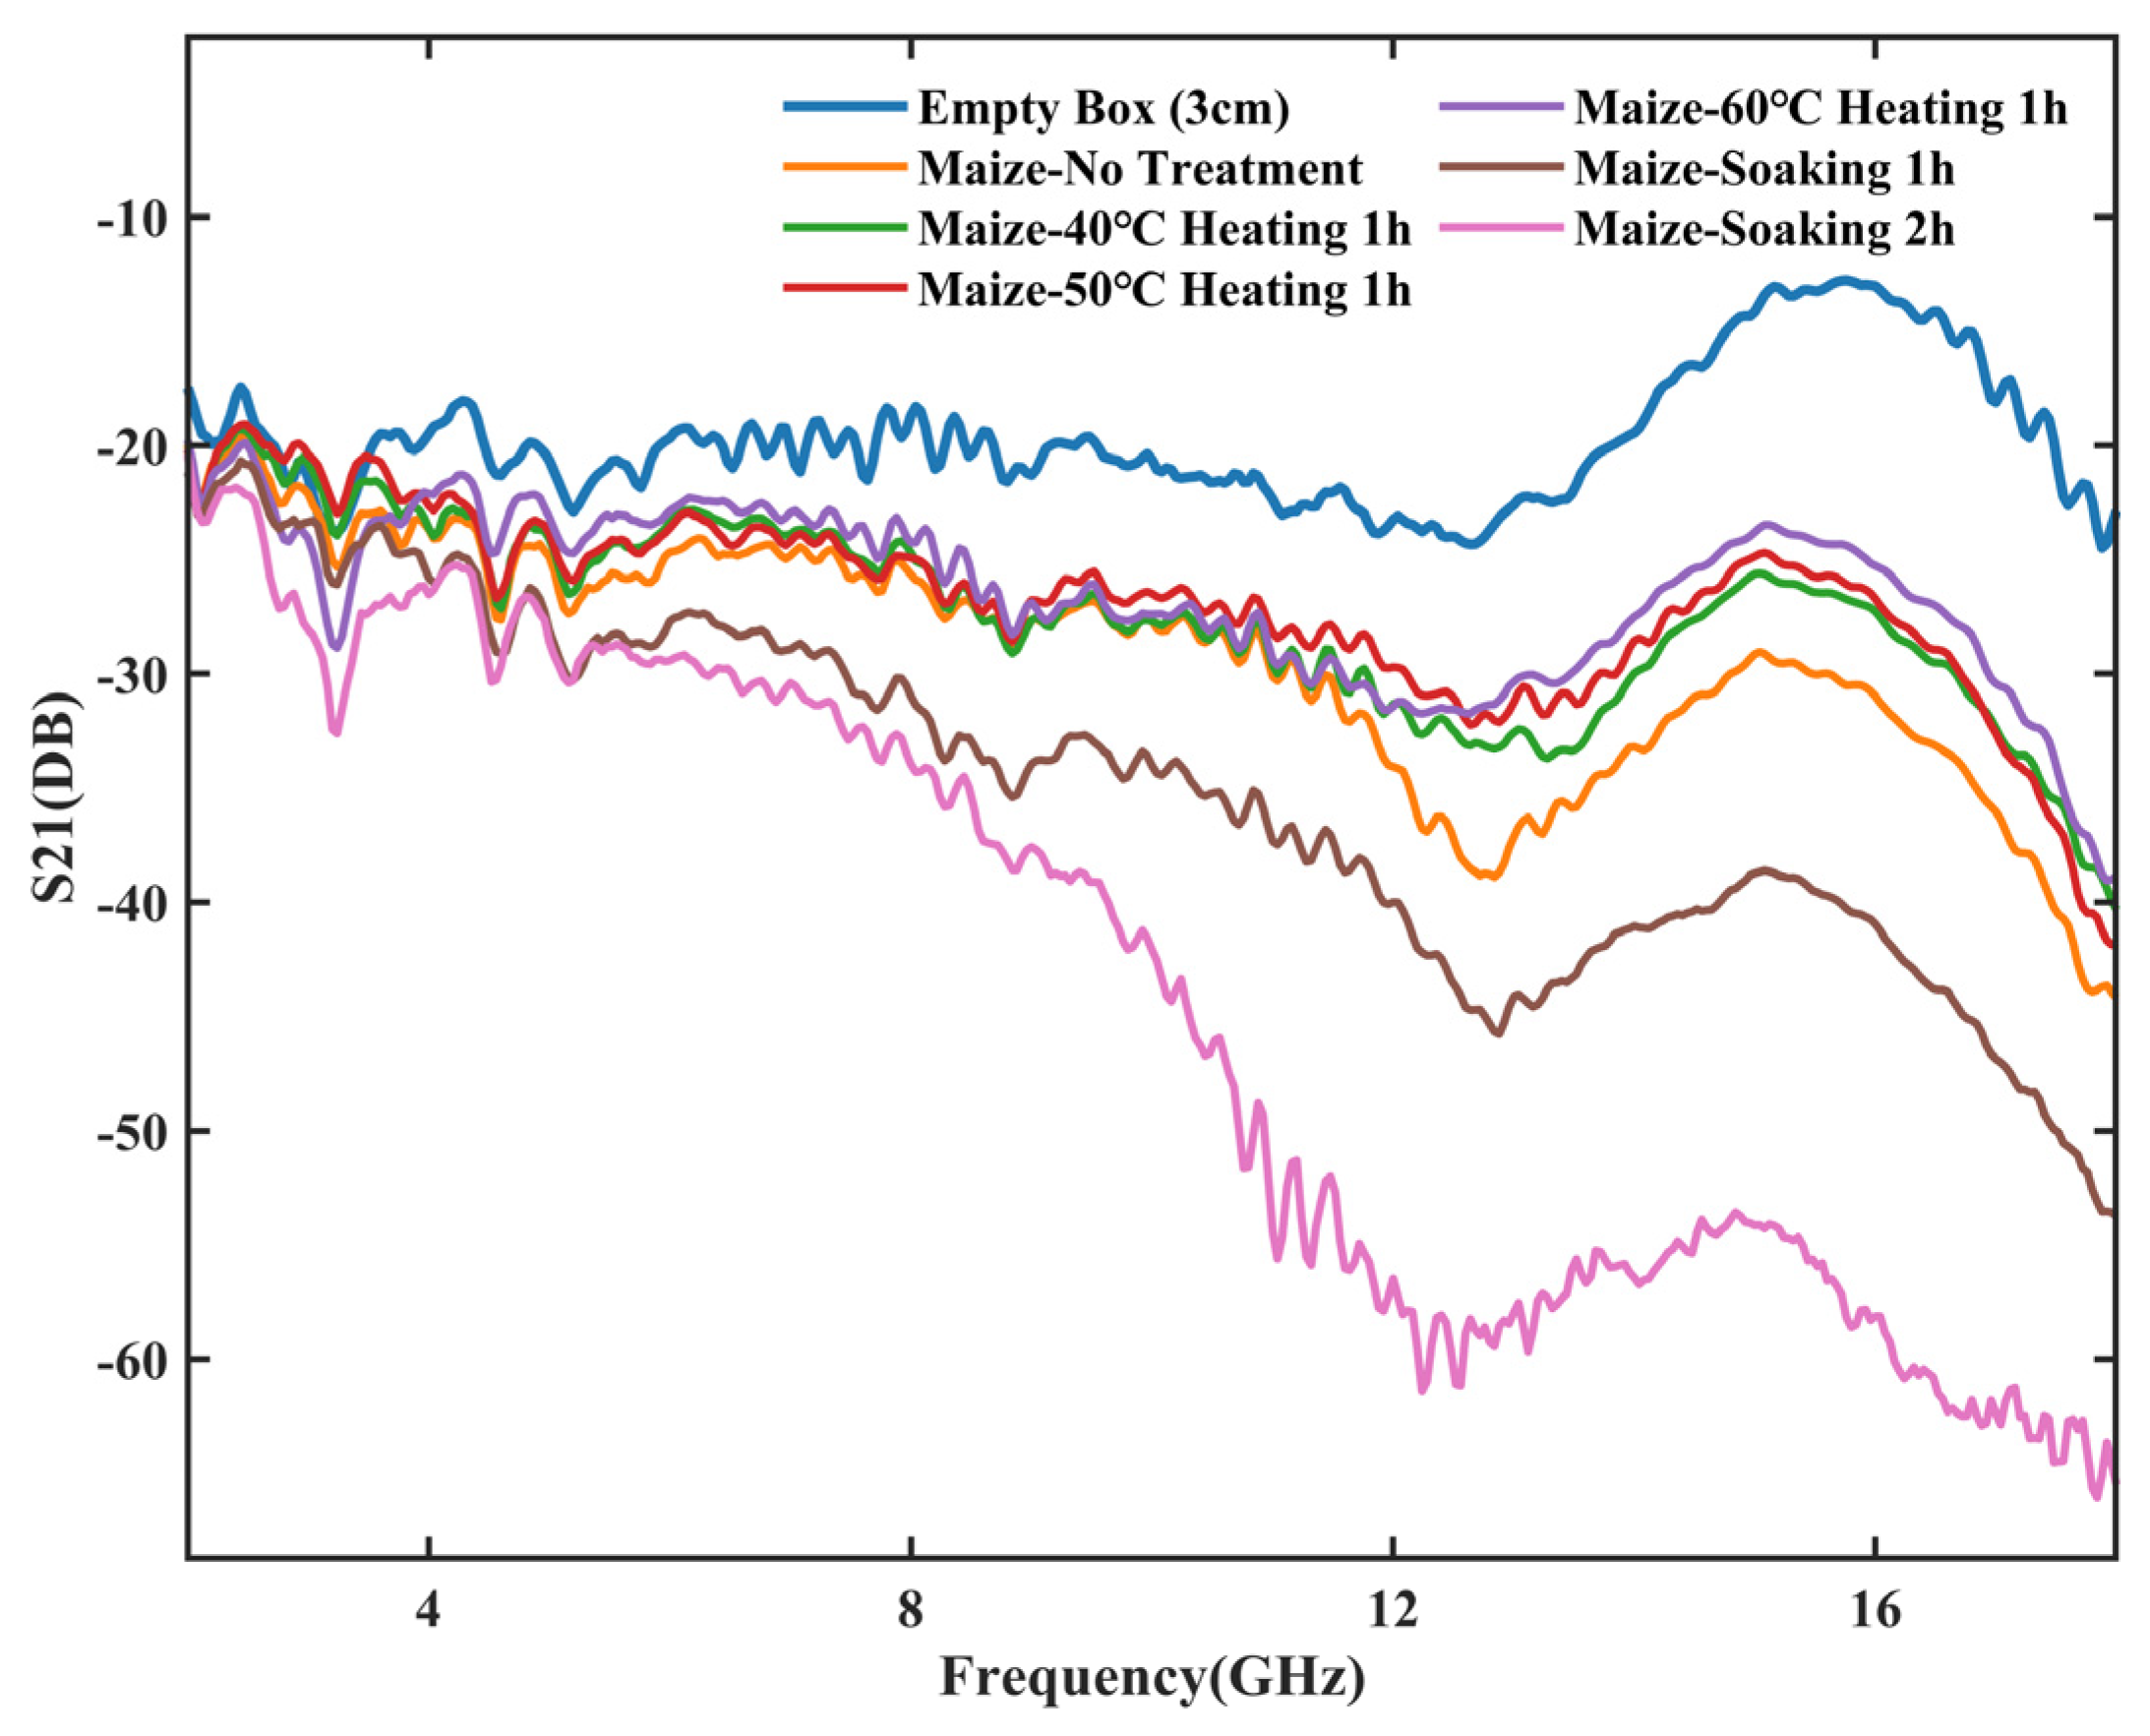
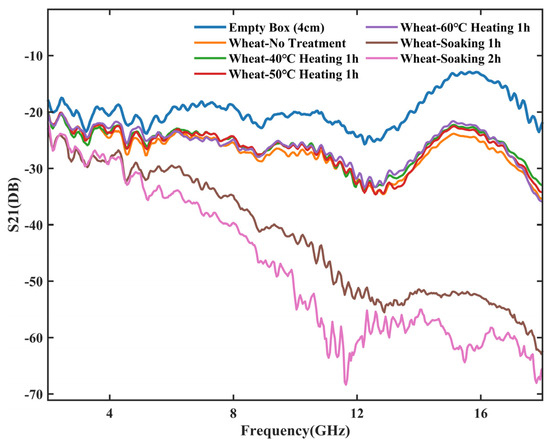
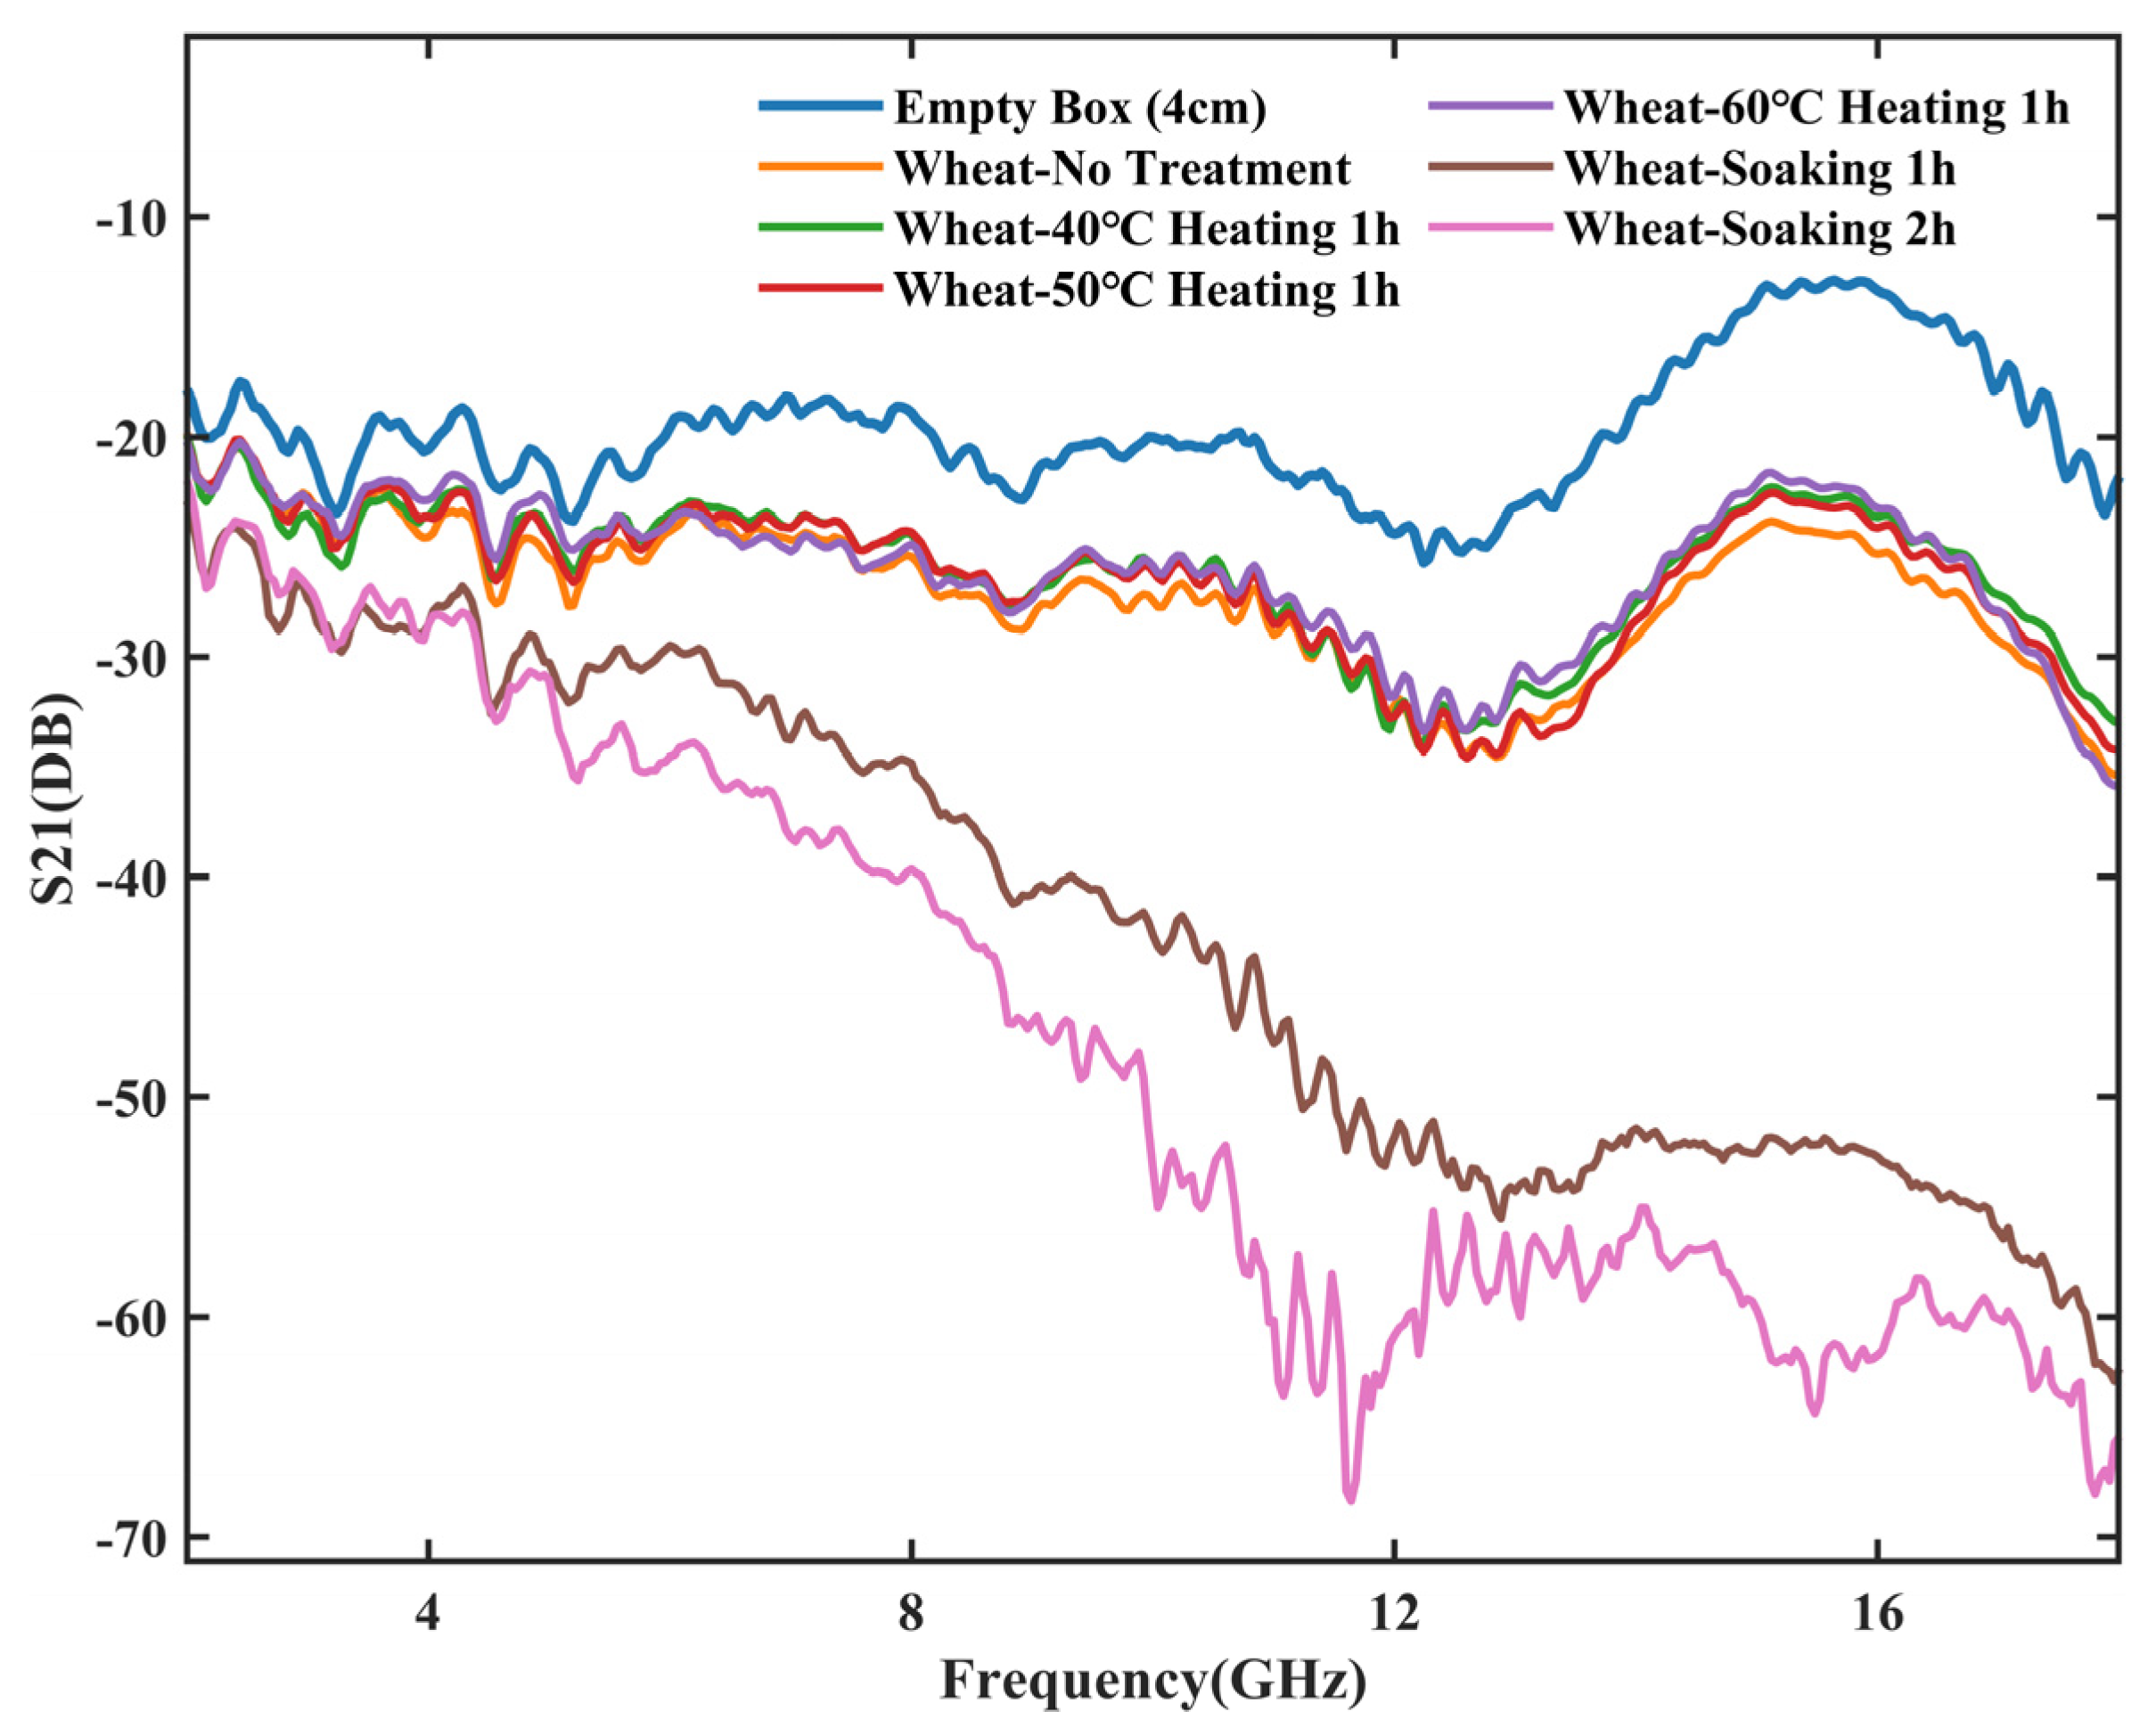
In the transmission configuration, the magnitude of S21 decreased monotonically with increasing sample thickness and MC_ref. This behavior follows wave propagation in lossy media: increasing MC_ref increases (dielectric loss), which increases attenuation and reduces transmitted power. Rising also increases impedance mismatch at the air–sample interface, enhancing reflection loss and further reducing S21.
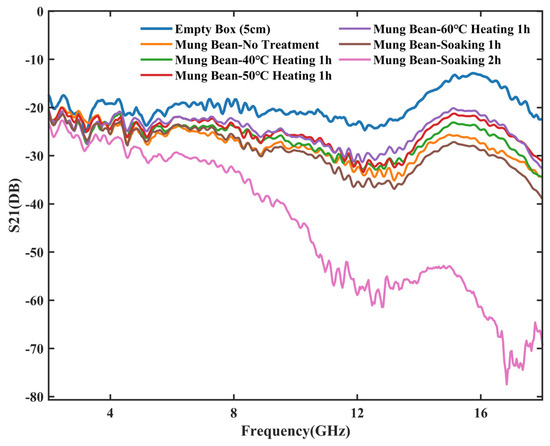
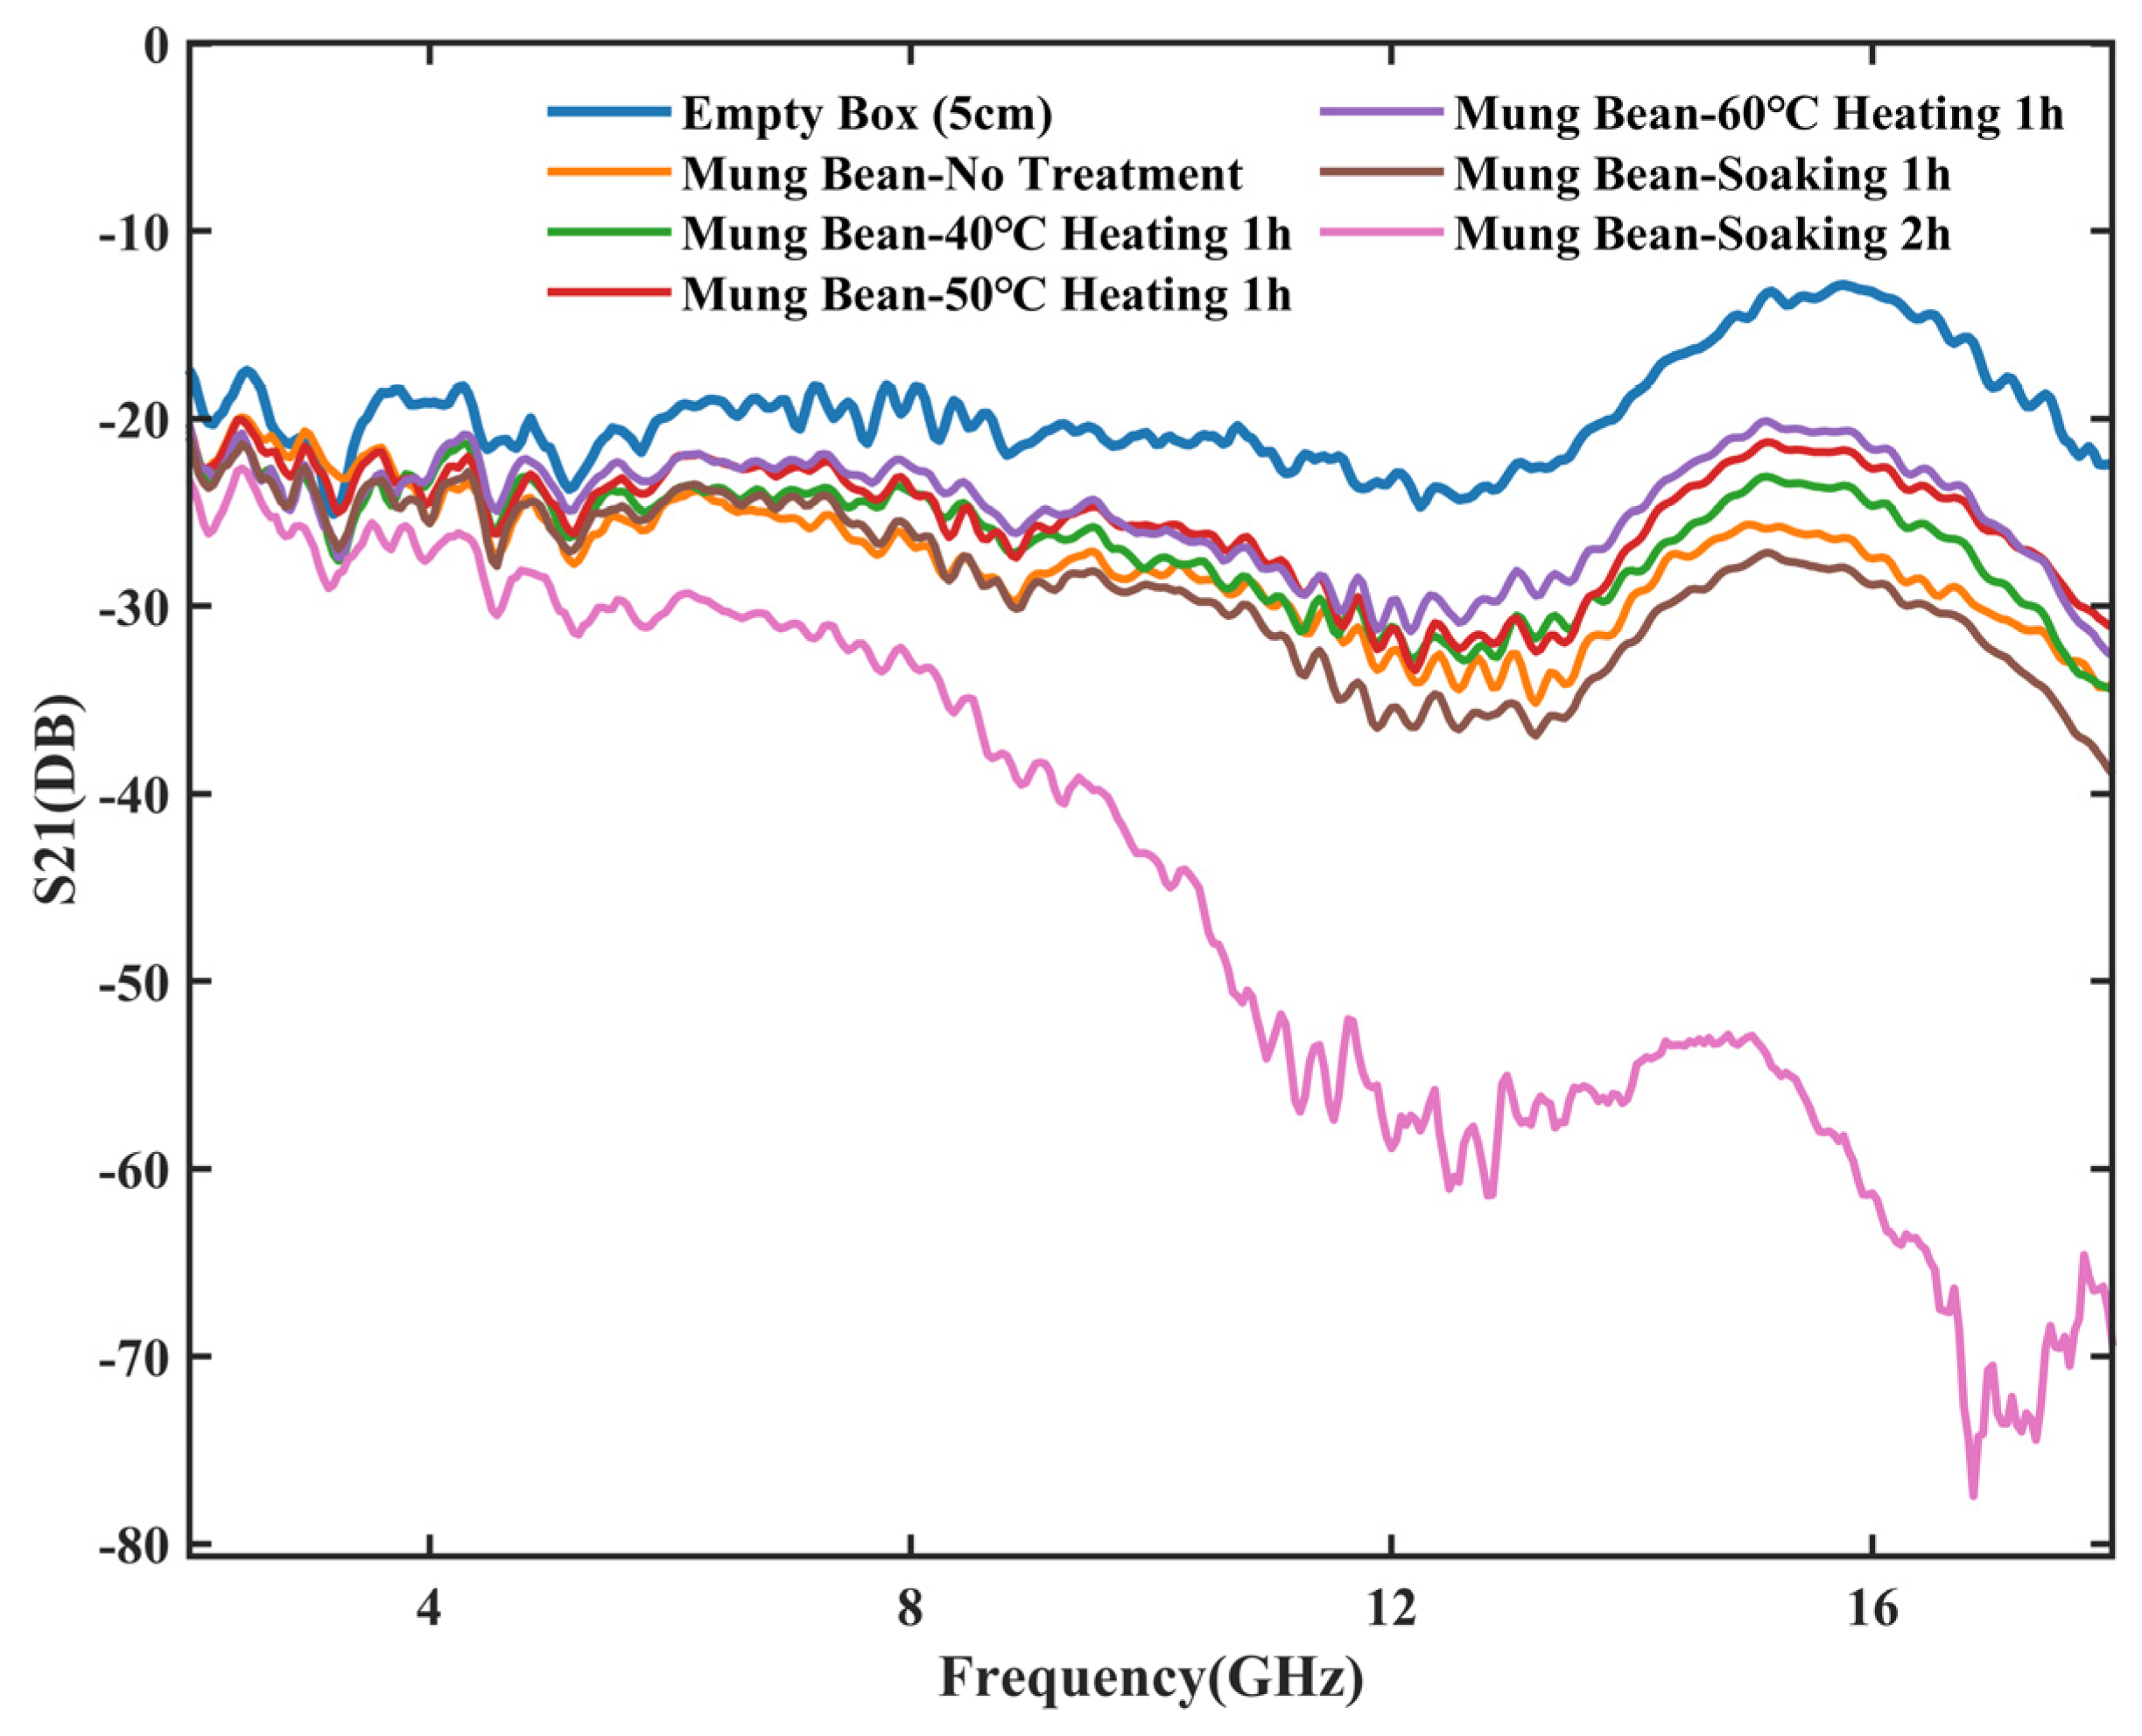
Frequency-dependent artefacts were observed at both ends of the sweep. In the low-frequency range (≈2–4 GHz), local oscillations occurred in S21, likely caused by antenna near-field coupling, edge diffraction at the holder, scattering from nearby metallic structures and an increased relative contribution of conduction loss. At the high-frequency end (>16 GHz), combinations of high MC_ref and large thickness led to severe attenuation and increased noise, making the effective signal approach the noise floor and destabilizing inversion. Overall, quantitative inversion requires a compromise between resolvable phase delay and sufficient transmitted amplitude; under the present setup, a mid-band window (approximately 8–16 GHz) provided the most stable spectra. Figure 5, Figure 6 and Figure 7 show the microwave power loss trends for maize, wheat, and mung bean, respectively. These figures are used to show attenuation trends under thickness or high loss conditions, while the recommended 2–3 cm is engineering recommendations after integrating SNR and inversion stability.
Figure 5.
Microwave power loss plots of the free−space transmission configuration for maize (3 cm).
Figure 6.
Microwave power loss plots of the free−space transmission configuration for wheat (4 cm).
Figure 7.
Microwave power loss plots of the free−space transmission configuration for mung bean (5 cm).
3.3. Retrieved Permittivity and Moisture Dependence
In the tested range, the transmission configuration showed the strongest linear correlation for maize (–MC_ref). For wheat, –MC_ref correlation was weaker, while remained strongly correlated, suggesting that loss-related features can provide more robust predictors when is affected by packing and structural factors. For mung bean, exhibited weaker linearity than wheat, reinforcing the need for grain-specific or multi-grain calibration strategies rather than assuming universal models.
The observed moisture-dependent trends are broadly consistent with previous microwave dielectric studies on cereal grains. For wheat and maize measured over approximately 5–15 GHz, both the dielectric constant and loss factor have been reported to increase nearly linearly with moisture content, while generally decreases with frequency and varies more weakly with frequency [29]. Related free-space studies on common beans in the ultra-wideband range also reported that permittivity and conductivity increase with moisture content, although the magnitude of the response can depend strongly on bean variety, frequency, and bulk density [30]. Therefore, the increasing trends observed in the present study are physically reasonable and consistent with the literature. Deviations in , especially for wheat at high moisture levels, require separate interpretation because retrieval is more sensitive to phase uncertainty, packing heterogeneity, and inverse-model conditioning.
The retrieved dielectric parameters showed clear moisture-dependent responses, but the response patterns were grain- and configuration-dependent. In most cases, increased with MC_ref, reflecting enhanced dielectric loss associated with water-related dipolar relaxation and ionic conduction. In contrast, was more sensitive to grain type, packing state, and inversion conditioning. For example, a notable exception was the decrease in wheat at the two soaked moisture levels in the free-space transmission configuration. This trend is opposite to the commonly expected increase of with moisture content and should therefore not be interpreted as an intrinsic dielectric response of wheat. Under high-moisture and high-loss conditions, the transmitted signal becomes strongly attenuated, which reduces phase reliability and worsens the conditioning of the slab-model inversion. In addition, soaking may alter kernel swelling, inter-particle void distribution, and effective bulk density. Because bulk density was not independently measured in the present dataset, the material effect and packing effect cannot be fully separated. For this reason, is considered a more reliable moisture-sensitive feature than for wheat under the present free-space transmission conditions.
3.4. Effect of Sample Thickness on Sensitivity and Inversion Stability
In principle, ε* is an intrinsic material property and should not depend on sample thickness. In practice, thickness affects the conditioning of the inverse problem through signal-to-noise ratio and multiple-reflection strength. When the thickness increased, S21 attenuation increased, which amplified measurement noise and increased variability in retrieved and , especially at the high-frequency end. When the thickness was ≥3 cm at high MC_ref, high-frequency spectra approached the noise floor, causing unstable inversion. Balancing moisture sensitivity (phase delay and attenuation must be measurable) against robustness (signal must remain above the noise floor), a thickness of 2–3 cm is recommended for calibration under the present setup.
3.5. Metal-Backed Reflection Results and Comparison with Transmission
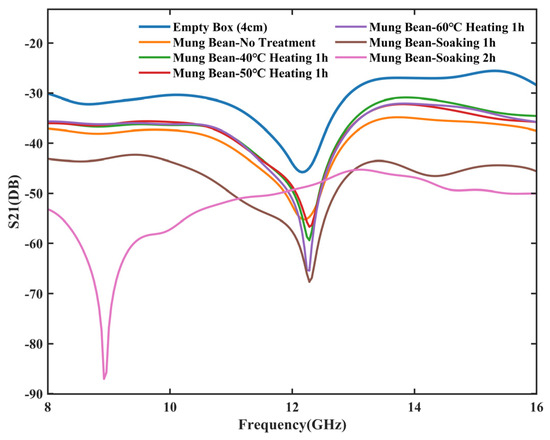
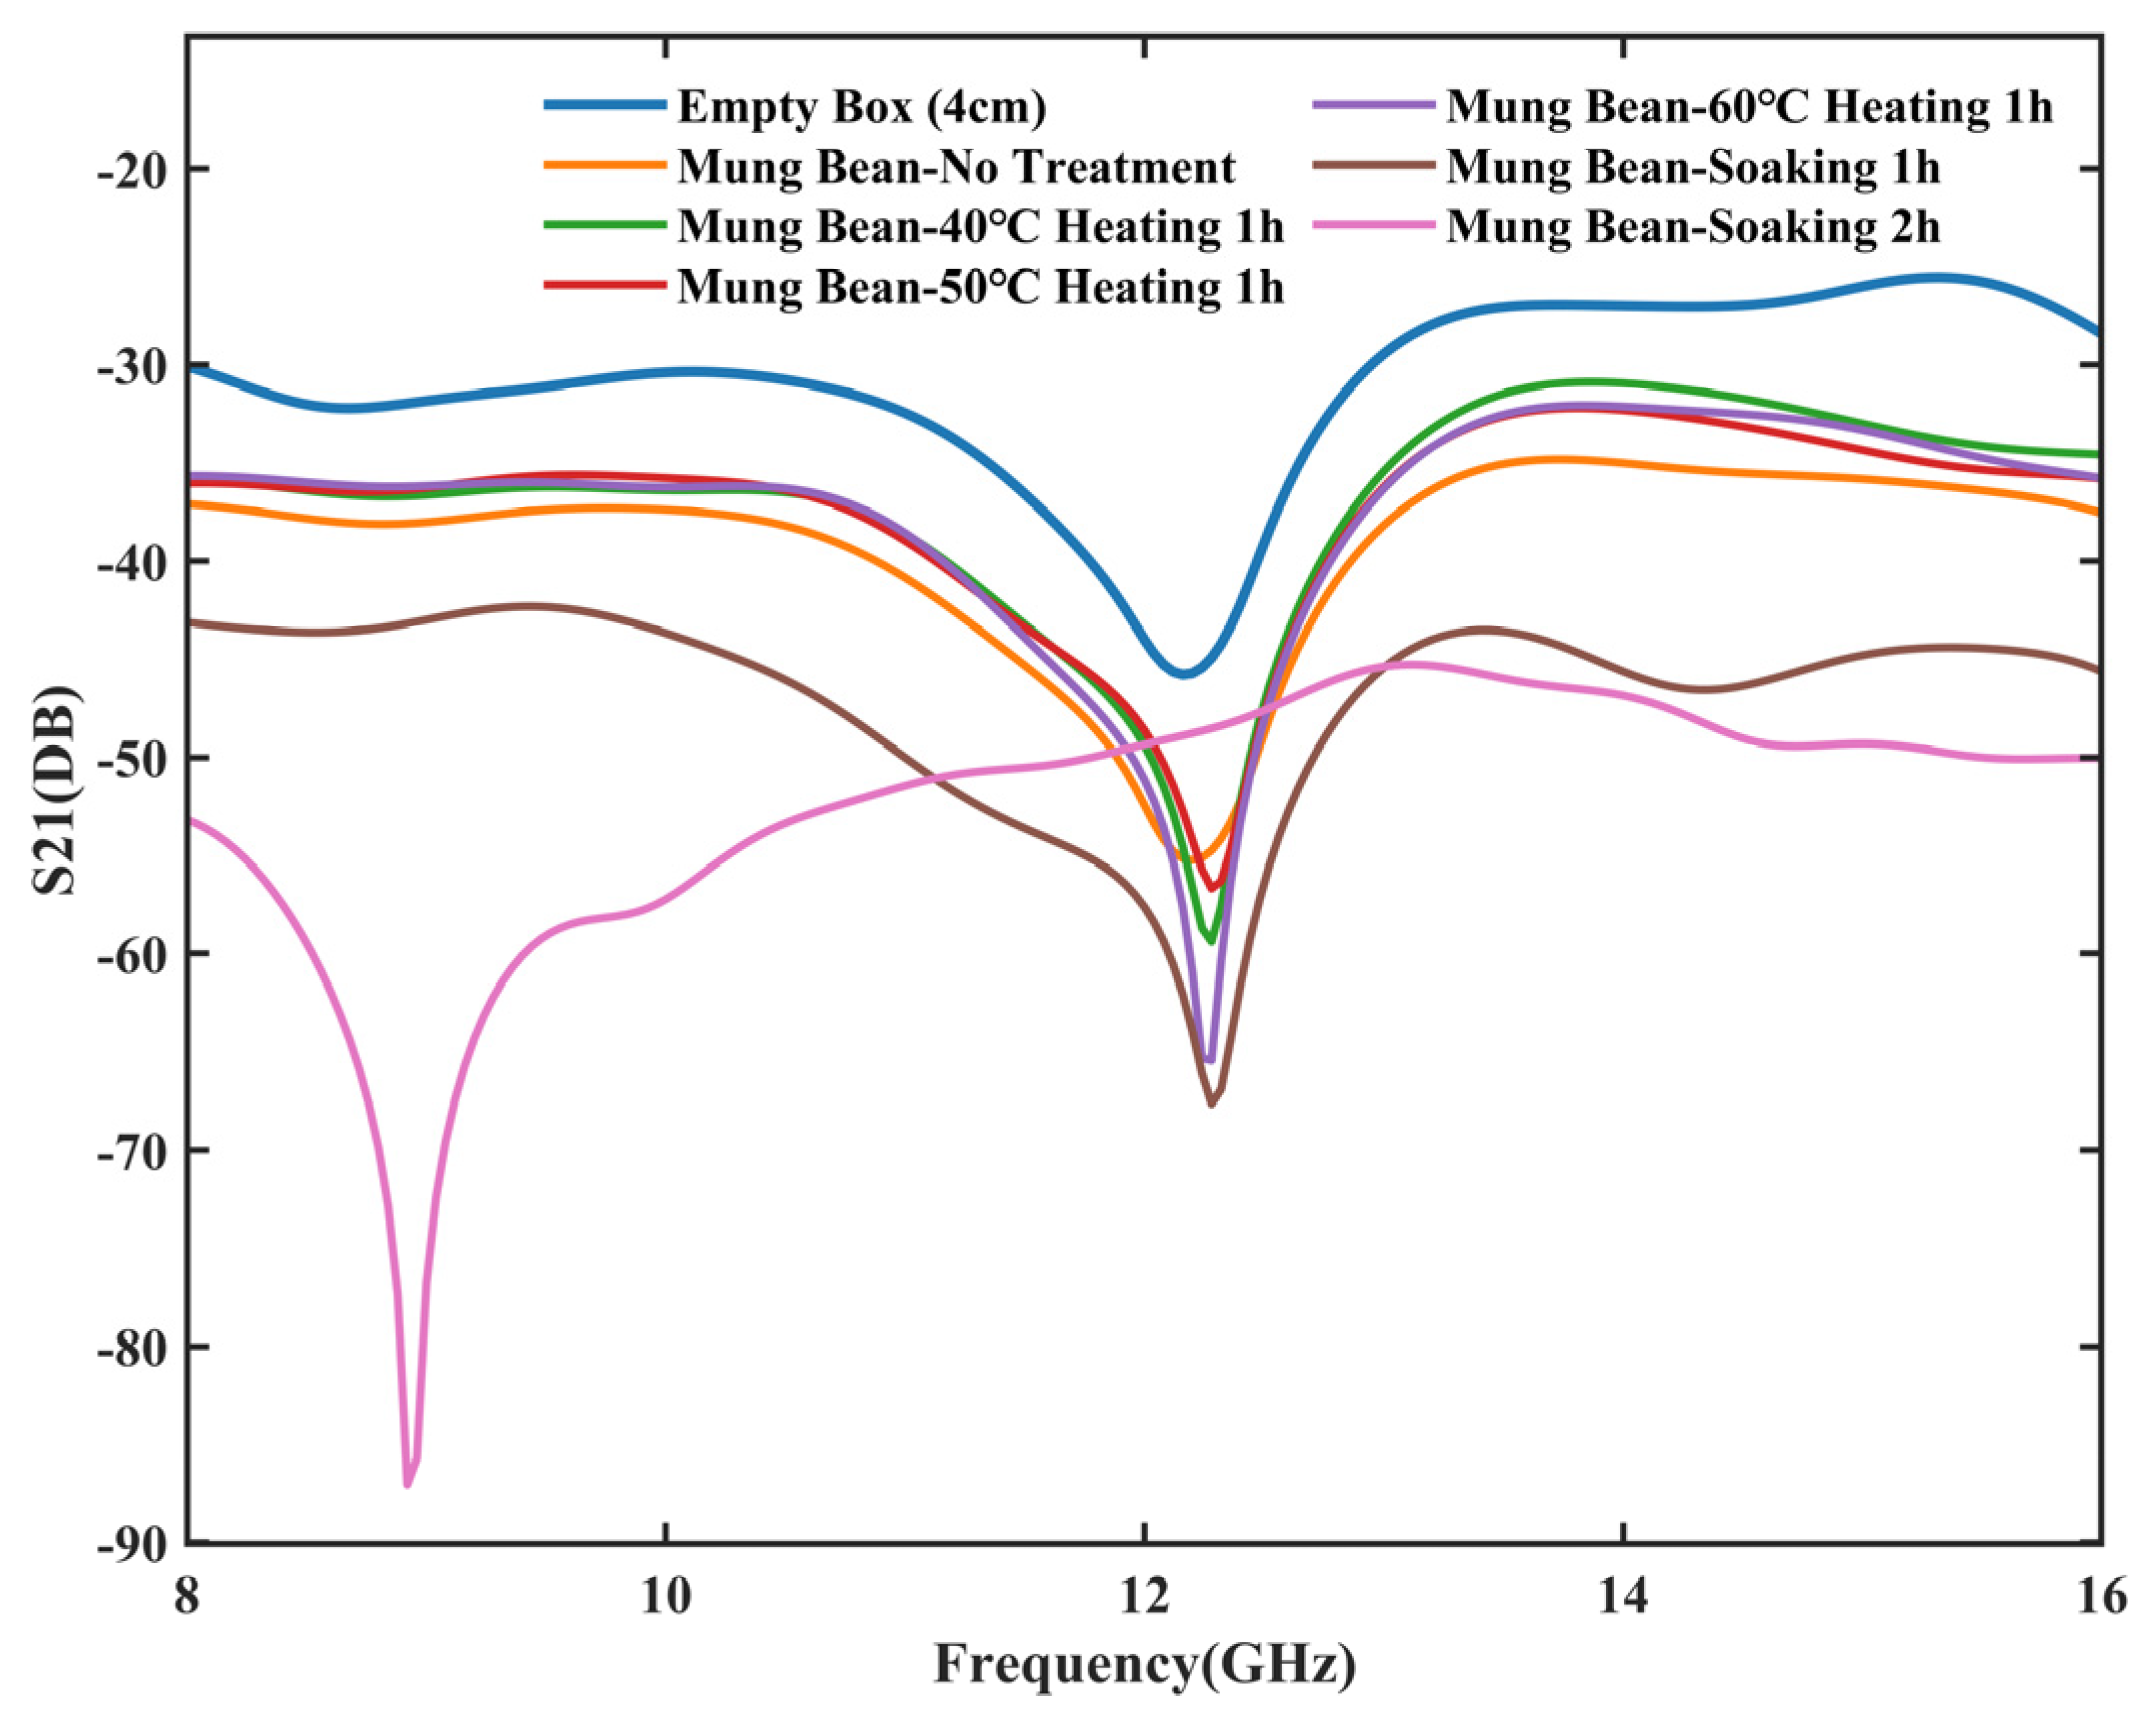
The metal-backed configuration exhibited S21 trends consistent with the transmission measurements: increasing MC_ref and thickness generally produced stronger amplitude decay and larger phase shifts (Figure 8). However, spectral ripples were more pronounced because the propagation path included metal reflection and was more susceptible to environmental scattering and surface flatness. The retrieved dielectric parameters also showed configuration-dependent behaviour. In the metal-backed configuration, both and increased with MC_ref for all three grains. In the free-space transmission configuration, increased clearly with MC_ref for all grains, whereas was less stable and even decreased for wheat at the two soaked moisture levels. Therefore, the most robust moisture trend in the present dataset is the increase in loss-related features rather than a universal increase in every retrieved dielectric parameter. Table 2 lists representative and values retrieved from the free-space transmission and metal-backed configurations.
Figure 8.
Microwave power loss plots of the metal−backed reflection configuration for mung bean (4 cm).
Table 2.
Representative complex relative permittivity ( and ) retrieved from free-space transmission measurements and metal-backed reflection measurements as equivalent fitted values in the 8–16 GHz frequency band.
In the free-space transmission measurements, wheat decreased at the two soaking levels, whereas increased markedly. This indicates that, under high-moisture and high-loss conditions, retrieval may be less stable than and more strongly affected by packing heterogeneity, multiple scattering, or inversion conditioning. Compared with controlled-packing transmission measurements, metal-backed retrieval produced systematically lower . The dominant explanation is the bulk-density effect: In the metal-backed reflection configuration, the grain is in a state of natural loose packing, leading to a significant increase in the air void fraction. Since the relative permittivity of air is approximately 1, which is much lower than that of grain (especially in the presence of moisture), this high porosity results in a systematic reduction in the effective permittivity of the mixture. Bulk density was not independently measured in the present study; therefore, the lower values observed in the metal-backed configuration should be interpreted as being likely associated with looser packing and increased air fraction, rather than as a directly quantified density effect. Because ε* and bulk density are coupled in granular media, density must be treated as a primary confounder when transferring laboratory calibrations to silo-scale monitoring [17,22]. Practical mitigation options include simultaneous density estimation, multi-frequency feature fusion, or physics-constrained machine learning models [17,20].
It should also be emphasized that the comparison between the transmission and metal-backed configurations does not isolate measurement architecture alone. The transmission measurements were performed under more controlled packing, whereas the metal-backed measurements used natural loose filling to emulate single-sided access in storage scenarios. Therefore, the lower effective values obtained from the metal-backed configuration may arise from both the double-pass metal-backed geometry and the increased air fraction associated with loose packing. Since the relative permittivity of air is close to unity, a higher void fraction reduces the effective permittivity of the grain–air mixture. Future experiments should measure bulk density directly and repeat both configurations under matched packing conditions to separate architecture effects from density effects. Metal-backed reflection is a viable alternative for single-sided access scenarios despite the density-induced permittivity reduction. Considering practical grain storage scenarios, conveyor belts are well-suited for bilateral through-transmission measurement, i.e., the transmission method, whereas grain bins or silos, due to environmental constraints, often only allow for sensors to be installed on one side against the wall, making the reflection method more appropriate. It should be noted that the present comparison reflects the combined effect of measurement architecture and packing protocol. The transmission configuration was evaluated under more controlled packing, whereas the metal-backed configuration was intentionally tested under loose packing to emulate practical single-sided storage scenarios. Therefore, the comparison should not be interpreted as a purely architecture-isolated comparison.
3.6. Error Sources and Engineering Implications
The main uncertainty sources include bulk-density variation caused by packing and void distribution, multipath propagation and edge diffraction in free-space measurements, temperature-induced changes in permittivity, and reduced SNR under high-moisture or large-thickness conditions. For engineering deployment, several improvements are recommended. First, absorbers and optimized antenna–sample geometry should be used to suppress parasitic reflections. Second, a fixed frequency window and fixed sample thickness, or an explicit thickness-compensation strategy, should be adopted during calibration. Third, bulk density should be measured or estimated simultaneously because ε* and density are strongly coupled in granular media. Fourth, grain temperature should be monitored and included as a compensation variable. Finally, calibration models should be developed separately for different grain types, and their transferability should be tested using independent batches and varieties.
3.7. Regression Models for Moisture Estimation
To make the retrieved dielectric parameters directly usable for moisture sensing, linear regression models were fitted between MC_ref (average of the two reference meters in Table 1) and the retrieved or values under metal-backed reflection measurements (Table 2). This provides grain-specific calibration equations that can be implemented in real-time firmware once are estimated from S-parameter inversion.
Table 3 reports the resulting equations, goodness-of-fit (R2), and prediction error (RMSE, % w.b.). In the tested range, all regression slopes were statistically significant (p < 0.01), indicating a robust monotonic relationship between moisture level and microwave permittivity under the present experimental conditions. Given the small sample size (n = 6 moisture levels per grain), LOOCV RMSE is also provided to indicate model robustness to individual influential points.
Table 3.
Grain-specific linear regression models for moisture estimation using retrieved or (metal-backed reflection).
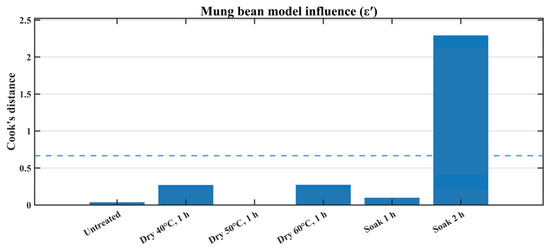
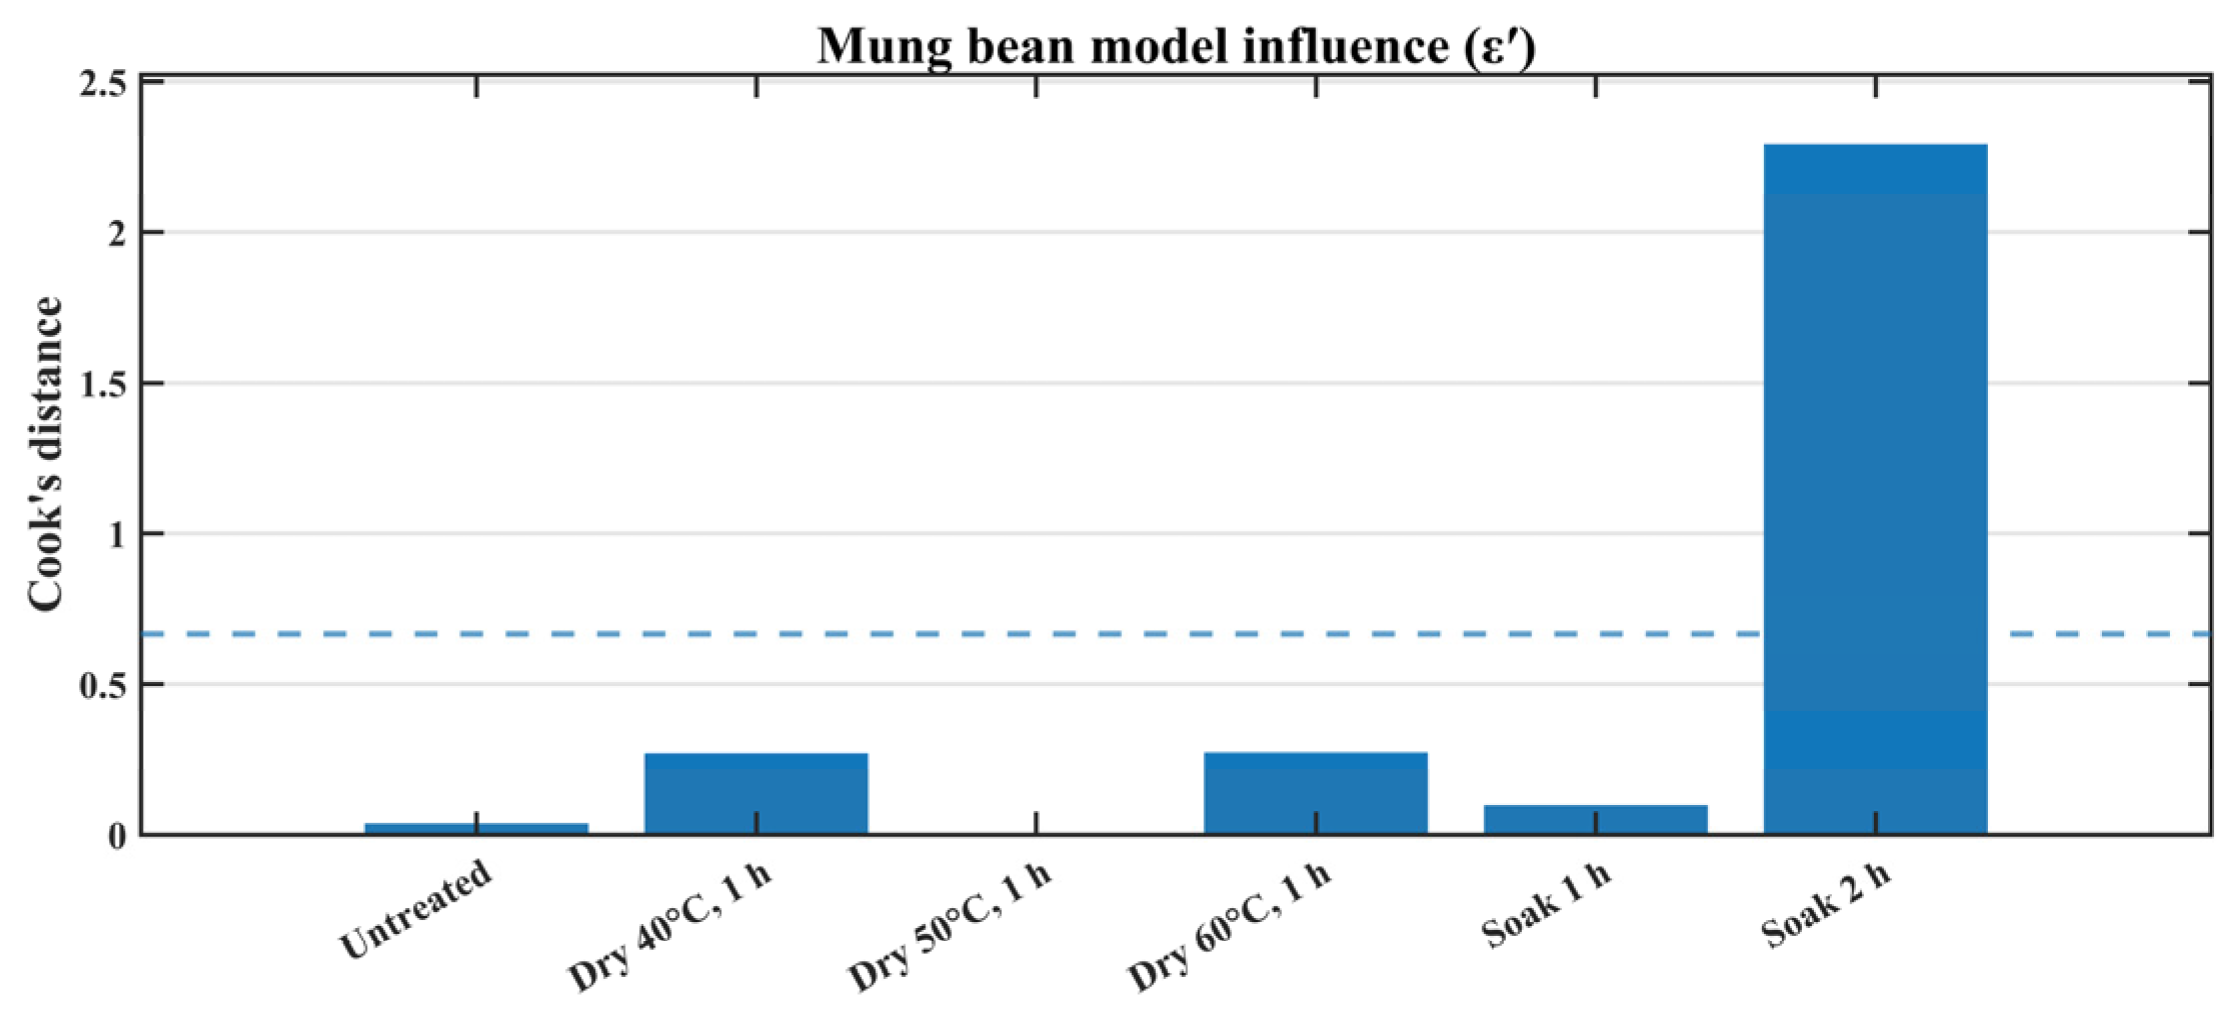
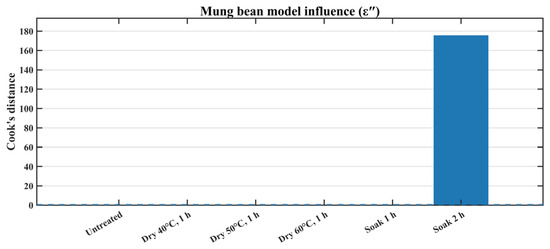
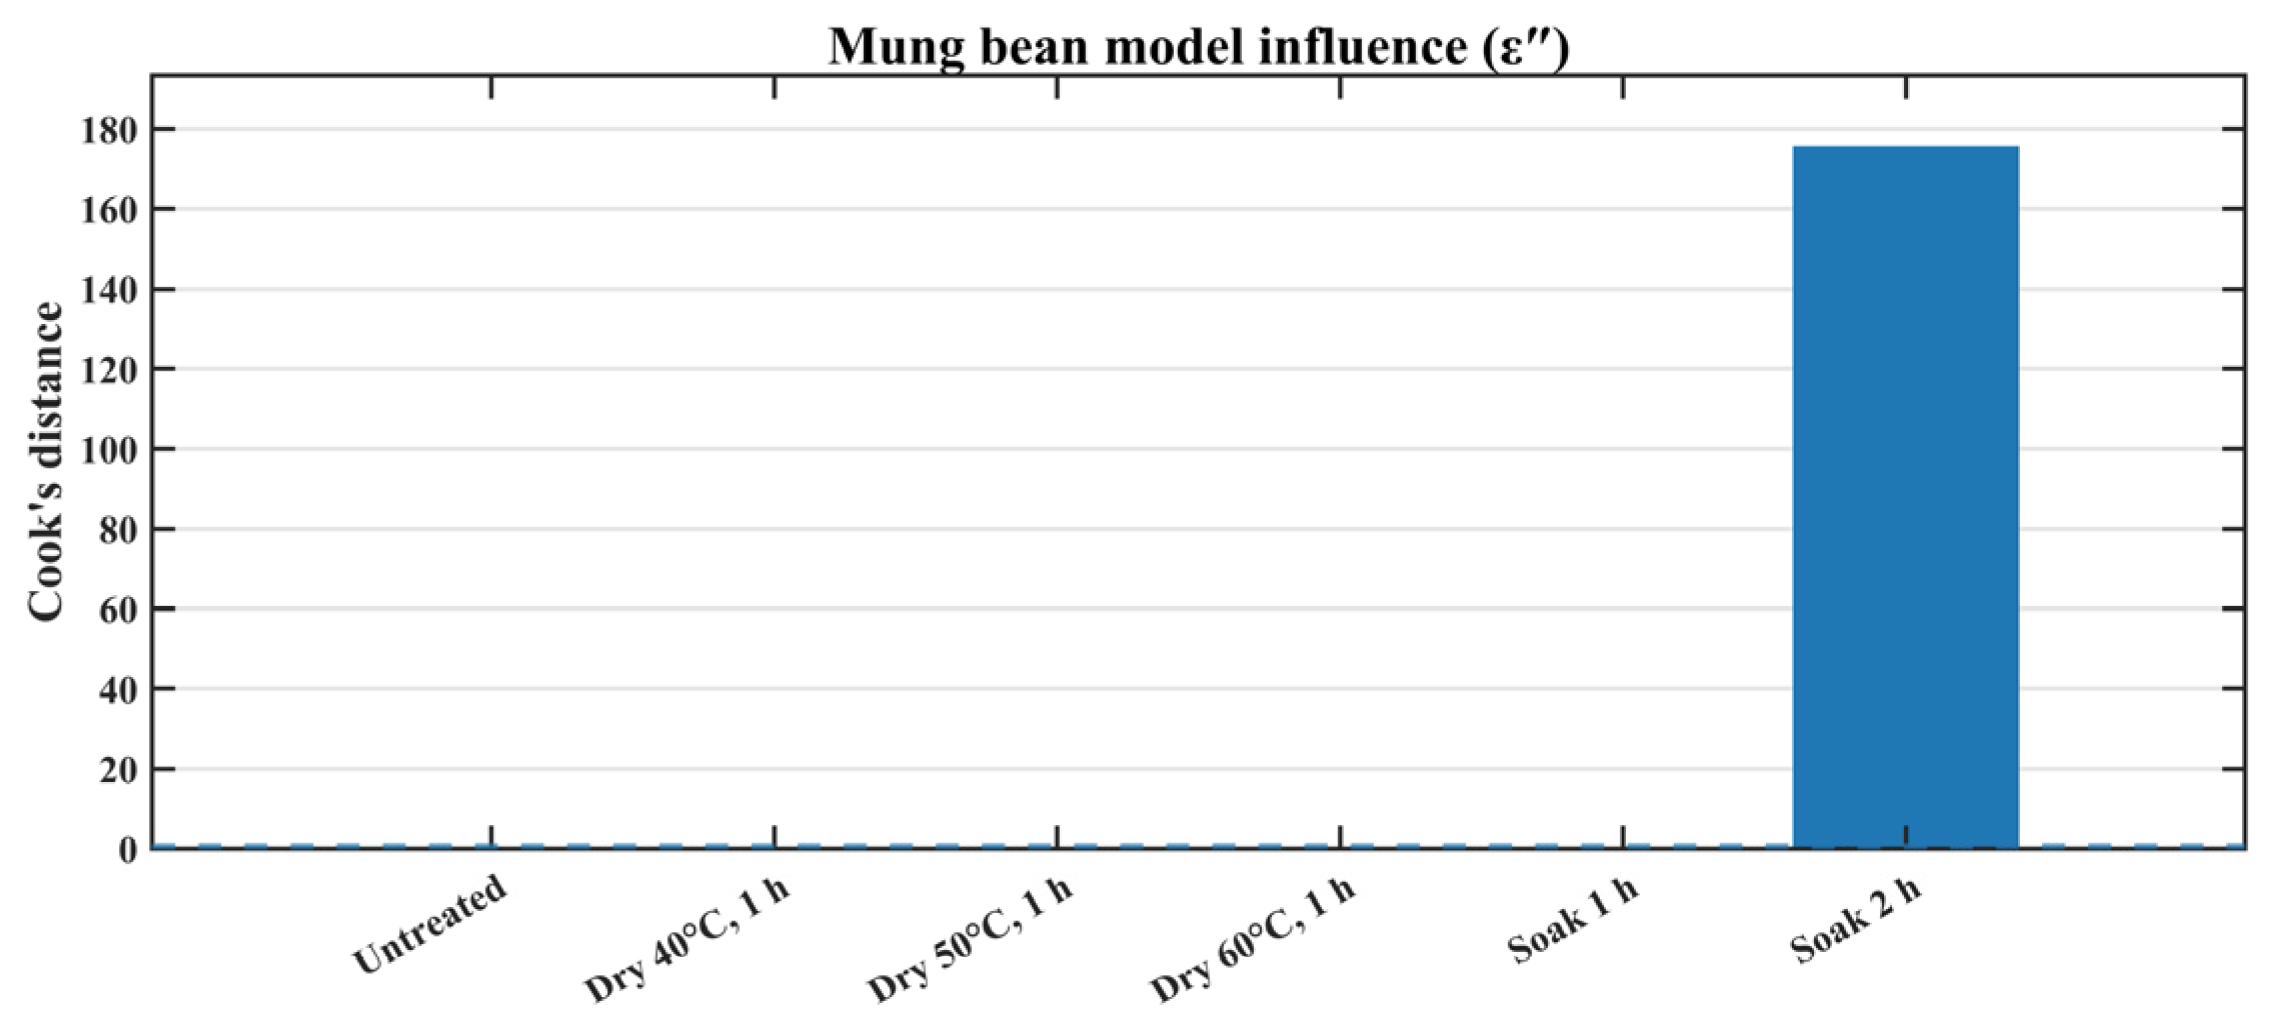
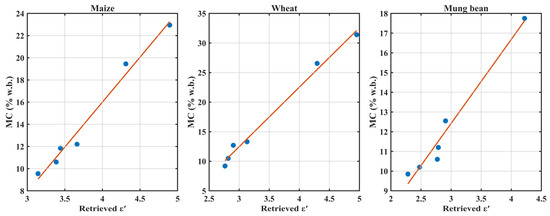
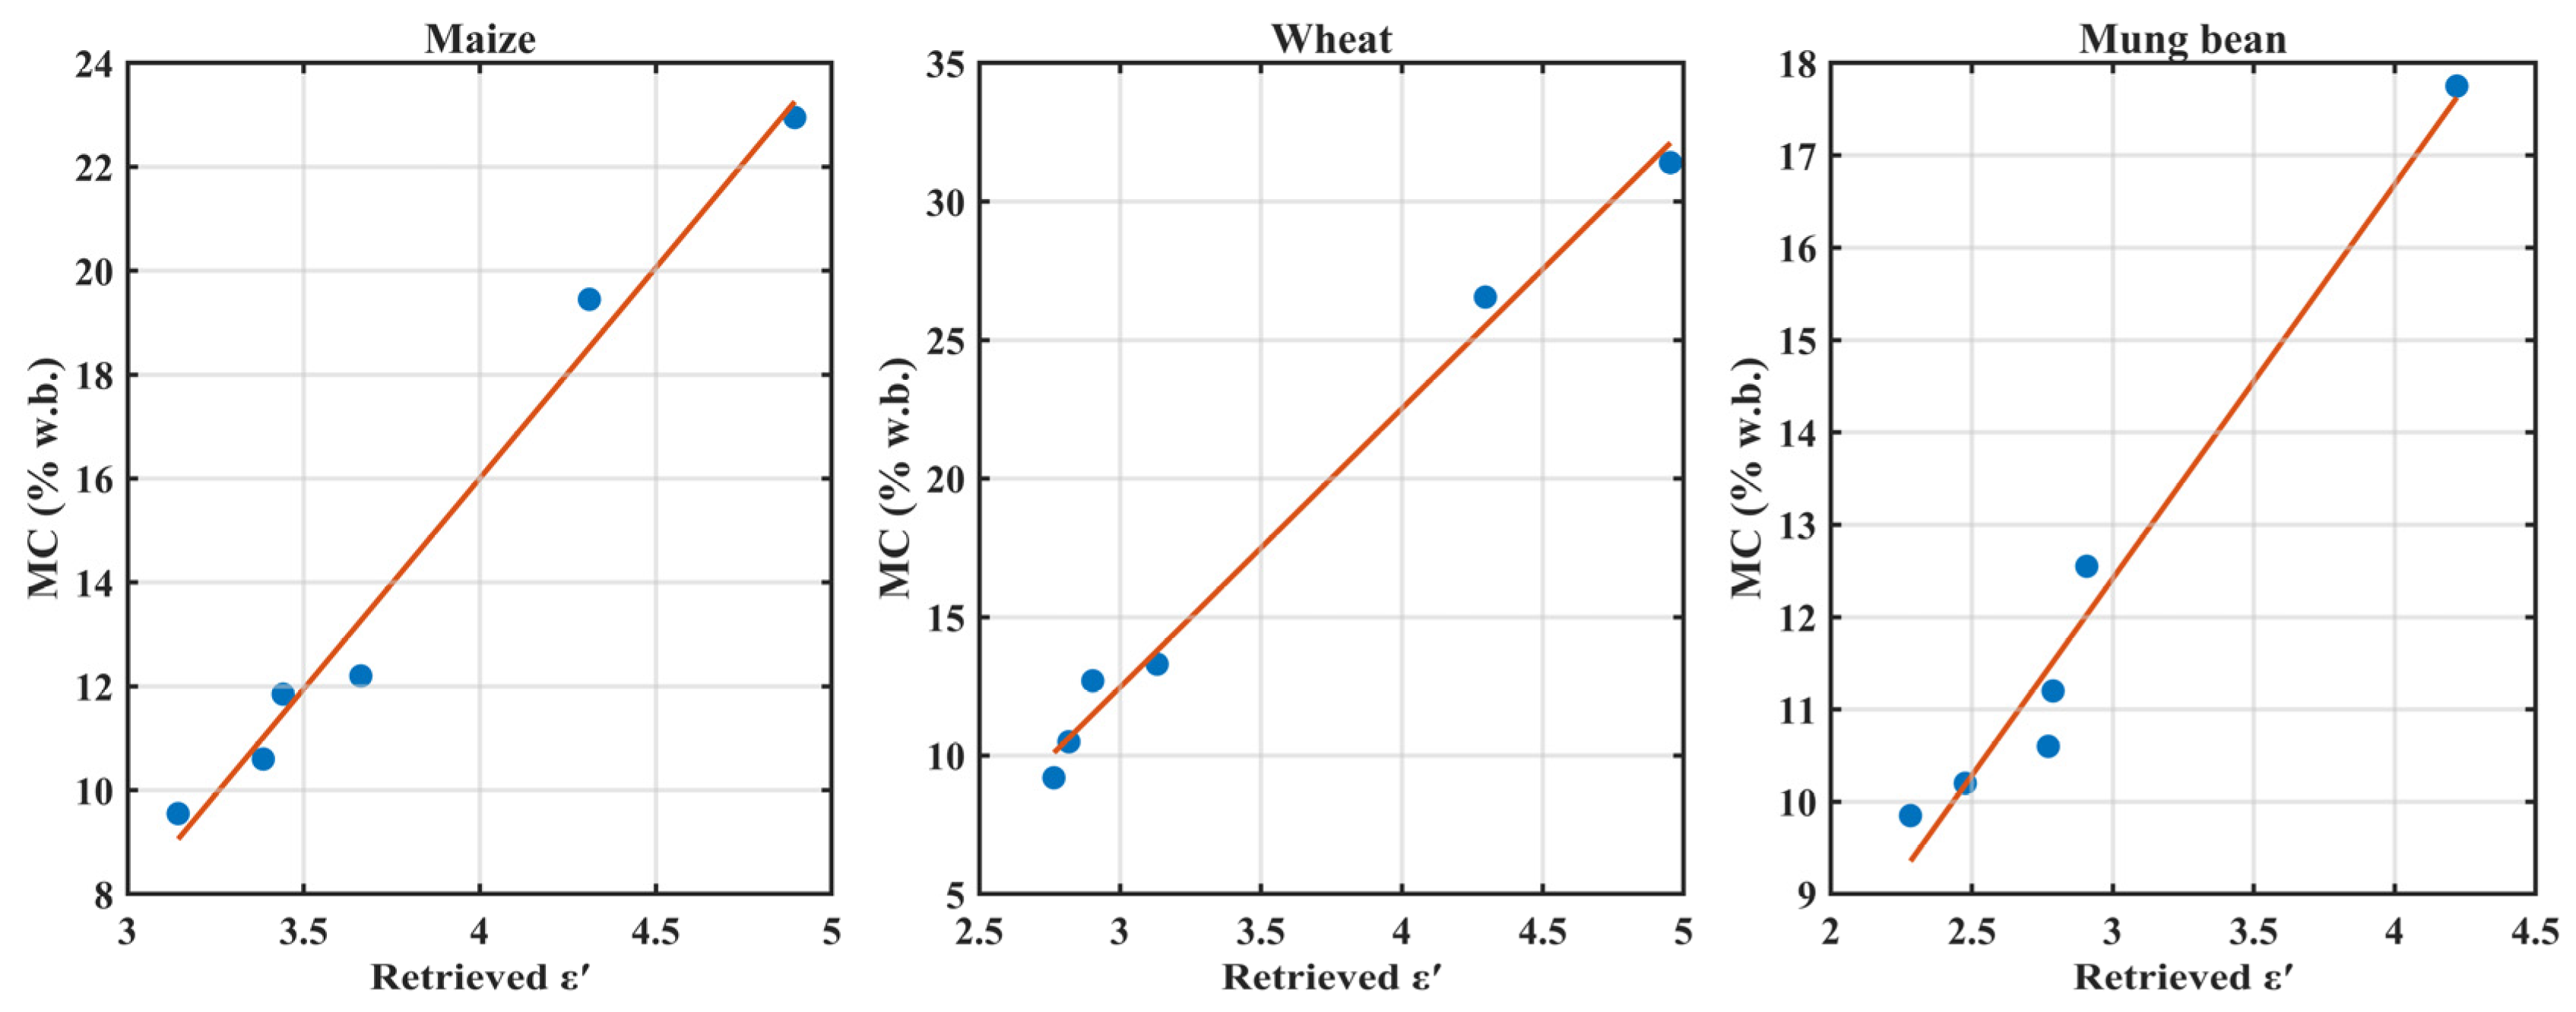
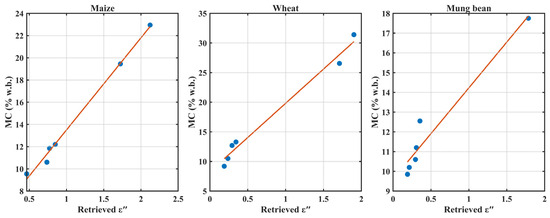
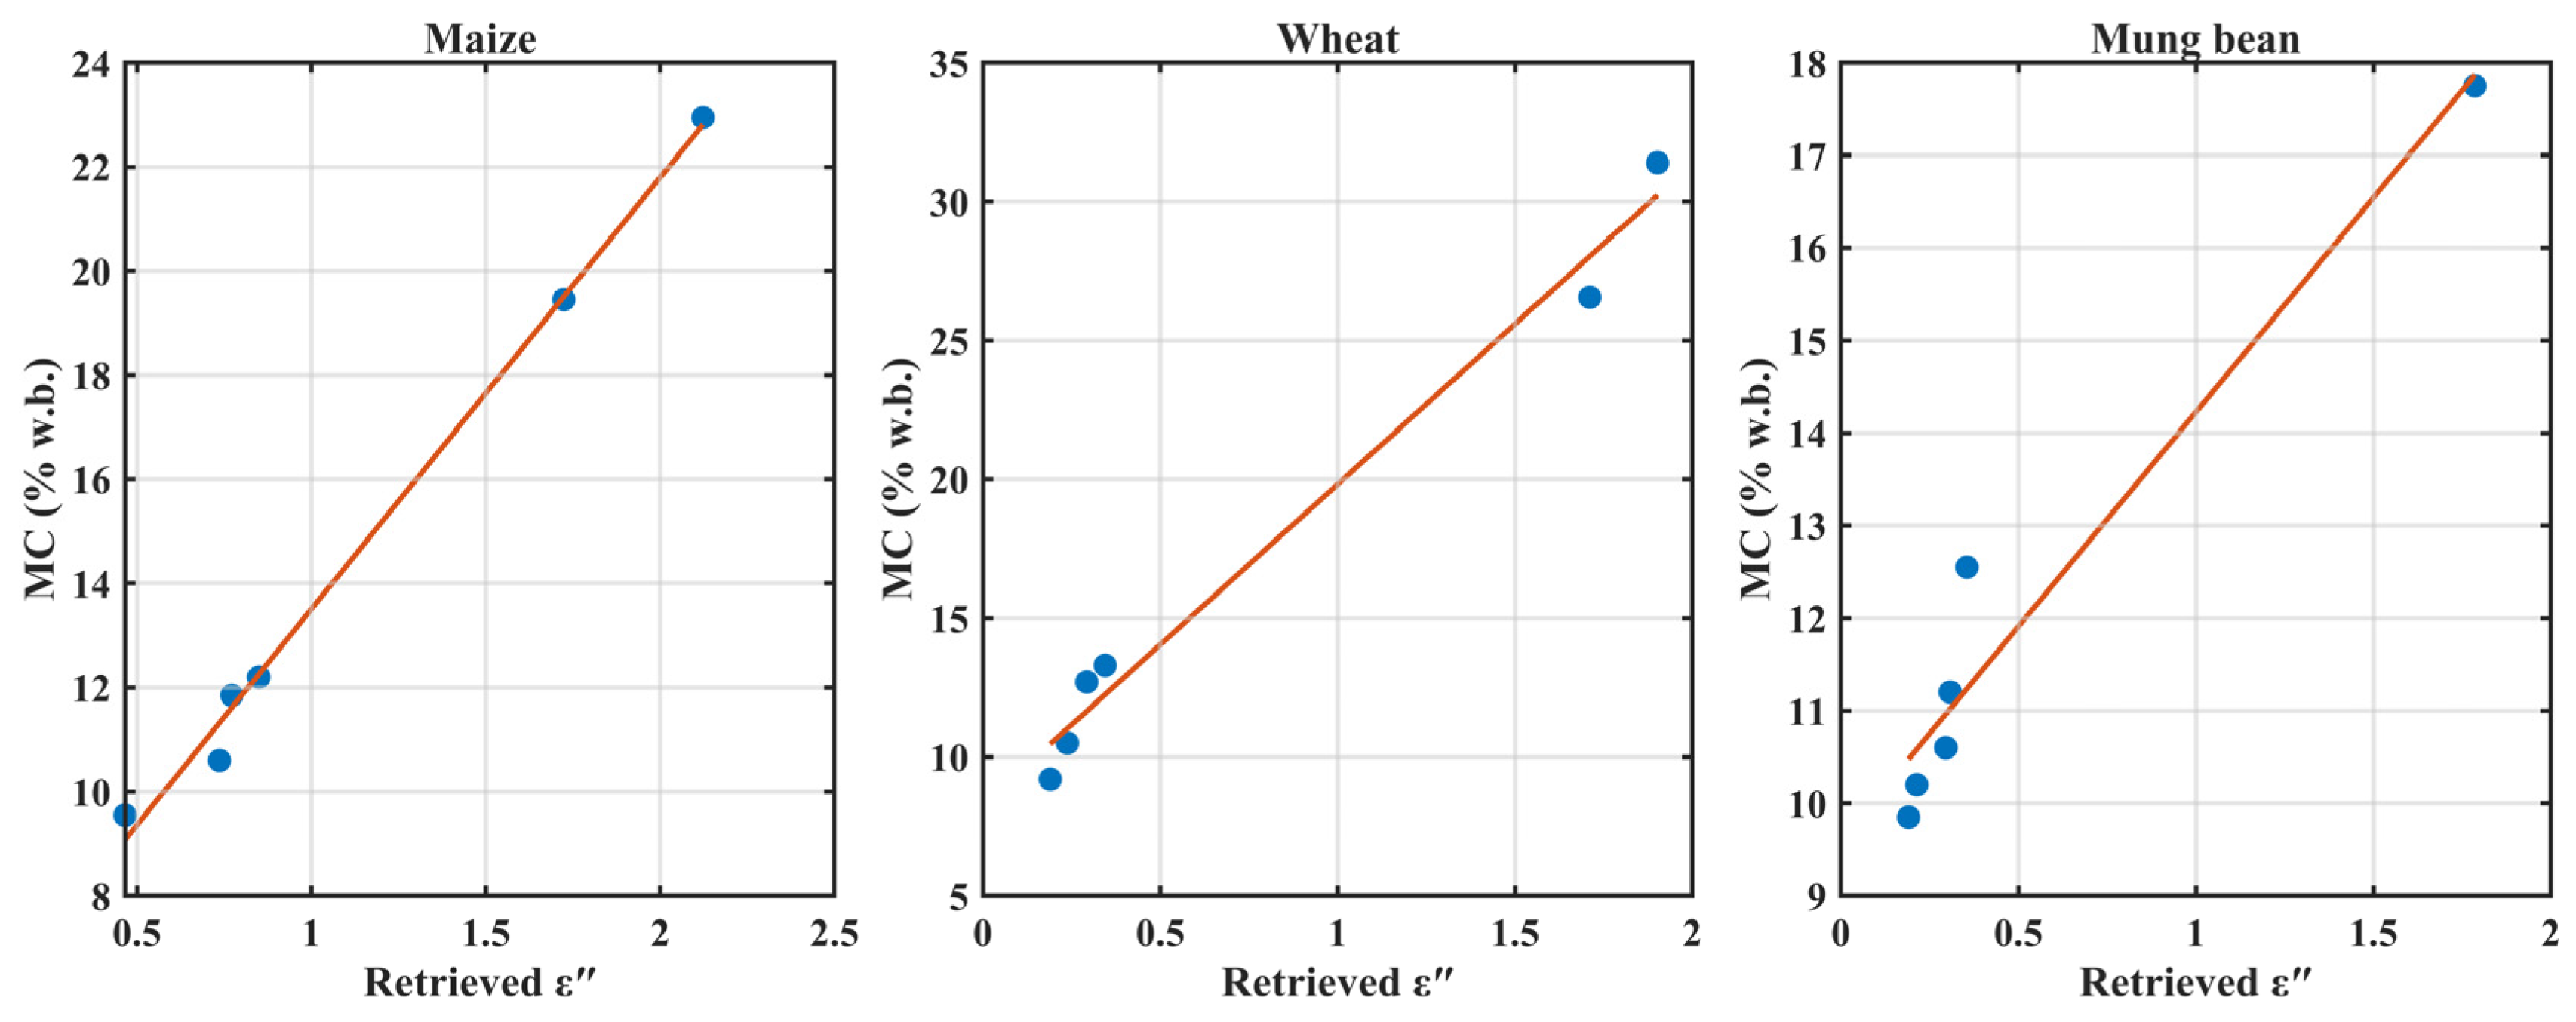
Among the tested predictors, maize moisture was more accurately explained by the loss factor (RMSE = 0.371% w.b.), consistent with the strong attenuation response to increasing water-related dielectric loss. In contrast, wheat and mung bean showed lower errors with -based models (RMSE = 0.831% and 0.473% w.b., respectively), suggesting that energy-storage related polarization captured by remains a stable predictor for these grains over the investigated moisture ranges. The LOOCV results further indicate that offers a more robust predictor for mung bean, whereas becomes less stable when the highest-moisture point dominates the fit. Cook’s distance indicates that “soaking 2h” is a strong point of influence (Figure 9 and Figure 10). The corresponding calibration relationships for the metal-backed reflection configuration are shown in Figure 11 and Figure 12. Figure 11 presents the relationships between MC_ref and for maize, wheat, and mung bean, whereas Figure 12 presents the relationships between MC_ref and . The solid lines indicate the OLS fitting results.
Figure 9.
Cook’s distance of mung bean ().
Figure 10.
Cook’s distance of mung bean ().
Figure 11.
Calibration relationship between MC_ref and dielectric constant for maize, wheat and mung bean (metal-backed reflection). Solid lines are OLS fits.
Figure 12.
Calibration relationship between MC_ref and loss factor for maize, wheat and mung bean (metal-backed reflection). Solid lines are OLS fits.
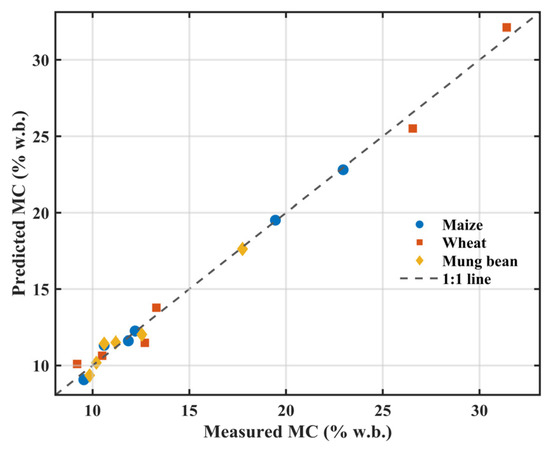
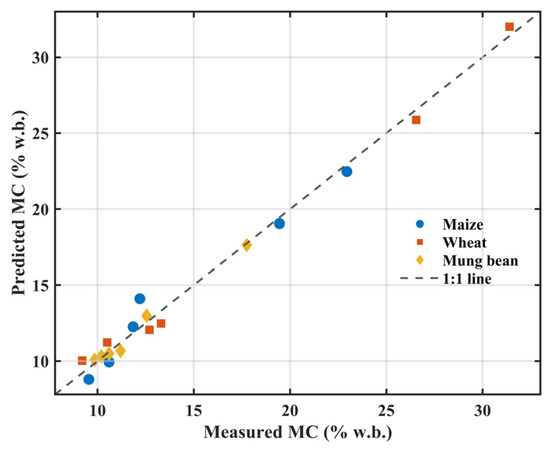
For the free-space transmission measurements, Table 4 reports the resulting equations, goodness-of-fit (R2), and prediction error (RMSE, % w.b.). In the LOOCV procedure, each moisture level was predicted using a model trained on the remaining five moisture levels (Figure 13 and Figure 14). It can be seen that, unlike the metal-backed reflection method, the moisture content of the three grain samples in the free-space transmission method is more accurately explained by , indicating that within the scope of this study, provides higher accuracy than in the free-space method. For the free-space transmission configuration, consistently produced lower RMSE and LOOCV RMSE than for all three grains, indicating that loss-related features were more robust moisture predictors under the present two-horn transmission setup. Although the regression results show clear monotonic dielectric–moisture relationships within the present dataset, the apparent differences in RMSE between the two configurations should not be overgeneralized. For example, the metal-backed configuration produced lower errors for maize, whereas the free-space transmission configuration gave lower errors for wheat and mung bean. These differences may be influenced by grain type, packing density, high-moisture leverage points, and the small number of calibration levels. Therefore, the metal-backed configuration should not be regarded as universally more accurate than the transmission configuration. Its main advantage is practical compatibility with single-sided access, such as silo-wall or container-wall monitoring, whereas the transmission configuration is more suitable for controlled two-sided or conveyor-based measurements.
Table 4.
Grain-specific linear regression models for moisture estimation using retrieved or (free-space transmission).
Figure 13.
Predicted versus measured moisture content using the recommended single-parameter models for the free-space transmission configuration. Based on LOOCV RMSE, was selected for maize, wheat, and mung bean. Dashed line indicates 1:1 agreement.
Figure 14.
Predicted versus measured moisture content using the recommended single-parameter models (metal-backed reflection, maize: ; wheat and mung bean: ). Predicted values are from LOOCV. Dashed line indicates 1:1 agreement.
Because only six moisture levels were available for each grain, the regression statistics should be interpreted as preliminary calibration indicators rather than definitive predictive performance. The LOOCV results were therefore included to reduce over-interpretation of apparent high R2 values. Broader multi-batch datasets and oven-drying reference measurements are required before the equations can be used as general-purpose moisture calibration models.
3.8. Limitations
This study has several limitations. First, the moisture levels were referenced to two commercial moisture meters rather than to gravimetric oven-drying measurements; therefore, the reported errors represent agreement with MC_ref and should not be interpreted as absolute gravimetric accuracy. Second, only six moisture levels and one batch per grain were tested, which limits the generality of the regression equations and makes the fitted models sensitive to influential points, particularly the highest soaking level. Third, different cultivars, growing regions, kernel sizes, and post-harvest histories may change the dielectric–moisture relationship, so the present models should not be directly transferred to other batches or varieties without recalibration. Fourth, bulk density and temperature were not independently controlled, although both factors are known to affect the effective permittivity of granular agricultural materials. Fifth, the comparison between transmission and metal-backed measurements includes both architecture and packing-state differences, so it should not be interpreted as a purely geometry-isolated comparison. Future work should include oven-drying reference measurements, explicit density and temperature compensation, multiple grain batches and varieties, matched-packing comparisons between measurement configurations, and independent validation datasets.
4. Conclusions
This study evaluated the feasibility of using broadband VNA-based free-space microwave measurements for meter-referenced grain moisture monitoring. Two architectures were compared: a two-horn transmission configuration under controlled packing and a metal-backed double-pass reflection configuration under loose packing.
The measured S-parameter spectra and retrieved dielectric parameters confirmed a physically interpretable chain from moisture variation to complex permittivity changes and then to microwave attenuation and phase response. However, the dielectric–moisture relationship was grain- and configuration-dependent. In the free-space transmission configuration, provided the most robust single-parameter predictor for maize, wheat, and mung bean, whereas the optimal predictor in the metal-backed configuration differed among grains. The reported errors should therefore be interpreted as commercial-meter-referenced calibration indicators rather than absolute gravimetric moisture prediction accuracy.
Frequency-window selection was critical for stable inversion. Low frequencies around 2–4 GHz were more susceptible to coupling, diffraction, and environmental scattering artefacts, whereas frequencies above 16 GHz suffered from signal-to-noise degradation under high-loss and large-thickness conditions. A mid-band window of approximately 8–16 GHz and a sample thickness of 2–3 cm are therefore recommended for the present setup.
Compared with the controlled-packing transmission configuration, the metal-backed configuration produced lower effective values, likely due to the increased air fraction under loose packing. This result highlights packing density as a key confounding factor when transferring laboratory microwave calibrations to grain-storage scenarios.
Overall, the transmission configuration is more suitable for controlled two-sided or conveyor-based measurements, while the metal-backed configuration provides a practical route for single-sided trend monitoring in storage containers or silos. However, the lower effective values observed in the metal-backed configuration likely reflect the combined effects of measurement geometry and loose packing. Future work should incorporate oven-drying reference measurements, bulk-density and temperature compensation, larger multi-batch datasets, matched-packing configuration comparisons, and independent validation before general-purpose moisture prediction models are established.
Supplementary Materials
The following supporting information can be downloaded at https://www.mdpi.com/article/10.3390/app16136348/s1. Figure S1. Scatter plot for consistency of two moisture meters; Figure S2. Bland–Altman plot for agreement analysis; Table S1. VNA settings and measurement geometry; Table S2. Shapiro–Wilk p-values of regression residuals.
Author Contributions
Formal analysis, Q.X., X.L., Y.M., G.L., C.Y., J.Y. and Z.Z.; data curation, Q.X.; writing—original draft preparation, Q.X.; writing—review and editing, X.L. and C.Y. All authors have read and agreed to the published version of the manuscript.
Funding
This work was supported by the National Key R&D Program of China (No. 2022YFE0204100), the Natural Science Foundation of Heilongjiang Province of China (YQ2024A008), and the National Natural Science Foundation of China (NSFC, Contracts Nos. 12205067, 12175050, 12375199 and U2541210).
Institutional Review Board Statement
Not applicable.
Informed Consent Statement
Not applicable.
Data Availability Statement
Data will be made available upon request.
Conflicts of Interest
The authors declare no conflicts of interest. The research was conducted in the absence of any commercial or financial relationships that could be construed as a potential conflict of interest. The funders had no role in the design of the study; in the collection, analysis, or interpretation of data; in the writing of the manuscript; or in the decision to publish the results.
Abbreviations
The following abbreviations are used in this manuscript:
| VNA | Vector Network Analyzer |
Appendix A. Metal-Backed Slab Model Used for Inversion
For a slab of thickness (d) with air–slab interface reflection coefficient and propagation factor , the overall reflection coefficient of an air–slab system terminated by a perfect electric conductor can be written in a multiple-reflection form:
In the metal-backed configuration, the measured normalized is proportional to the specular return field from the sample-metal system. After empty-holder normalization, the coupling factor is largely cancelled, and can be fitted using within the selected frequency window.
References
- Mesterházy, Á.; Oláh, J.; Popp, J. Losses in the Grain Supply Chain: Causes and Solutions. Sustainability 2020, 12, 2342. [Google Scholar] [CrossRef] [Scilit]
- Fleurat-Lessard, F. Integrated Management of the Risks of Stored Grain Spoilage by Seedborne Fungi and Contamination by Storage Mould Mycotoxins—An Update. J. Stored Prod. Res. 2017, 71, 22–40. [Google Scholar] [CrossRef] [Scilit]
- Sangha, J.S.; Meyer, B.; Ruan, Y.; Cuthbert, R.D.; Knox, R.; Xiao, G. A Pin-Based Probe for Electronic Moisture Meters to Determine Moisture Content in a Single Wheat Kernel. Plant Methods 2024, 20, 89. [Google Scholar] [CrossRef] [Scilit] [PubMed]
- Acun, Y.; Gürsoy, S. Evaluation of the Accuracy of a Capacitive Moisture Meter for Corn. Agric. Sci. Technol. 2025, 17, 110–119. [Google Scholar] [CrossRef] [Scilit]
- Thakur, R.; Chatterji, S.; Kumar, A.; Bansod, B.S. Development of Multi-Grain Capacitive Sensor for Determination of Moisture Content in Grains. Qual. Assur. Saf. Crops Foods 2015, 7, 201–206. [Google Scholar] [CrossRef] [Scilit]
- McIntosh, R.B.; Casada, M.E. Fringing Field Capacitance Sensor for Measuring the Moisture Content of Agricultural Commodities. IEEE Sens. J. 2008, 8, 240–247. [Google Scholar] [CrossRef] [Scilit]
- Wang, X.; Chen, Y.; Jiang, J.; Zheng, G.; Zhang, R.; Li, S.; Lv, W.; Song, Y.; Wang, L.; Li, W. Design and Simulation of Capacitive Sensor for Grain Moisture Detection. J. Phys. Conf. Ser. 2024, 2740, 012018. [Google Scholar] [CrossRef] [Scilit]
- Kaur, P.; Bansal, S. Manju Circular Patch Antenna as Grain Moisture Sensor for Smart Agriculture. J. Electr. Syst. Inf. Technol. 2025, 12, 66. [Google Scholar] [CrossRef] [Scilit]
- Nelson, S.O. Dielectric Properties of Agricultural Products and Some Applications. Res. Agric. Eng. 2008, 54, 104–112. [Google Scholar] [CrossRef] [Scilit]
- Nelson, S.O.; Trabelsi, S. Dielectric Properties of Grain and Seed and Their Usefulness in Sensing Physical Properties. In Proceedings of the 2013 ASABE Annual International Meeting, Kansas City, Missouri, 21–24 July 2013; American Society of Agricultural and Biological Engineers: St. Joseph, MI, USA, 2013. [Google Scholar]
- Wang, S.; Tang, J.; Johnson, J.A.; Mitcham, E.; Hansen, J.D.; Hallman, G.; Drake, S.R.; Wang, Y. Dielectric Properties of Fruits and Insect Pests as Related to Radio Frequency and Microwave Treatments. Biosyst. Eng. 2003, 85, 201–212. [Google Scholar] [CrossRef] [Scilit]
- Zhu, Z.; Guo, W. Frequency, Moisture Content, and Temperature Dependent Dielectric Properties of Potato Starch Related to Drying with Radio-Frequency/Microwave Energy. Sci. Rep. 2017, 7, 9311. [Google Scholar] [CrossRef] [Scilit] [PubMed]
- Pérez-Campos, R.; Fayos-Fernández, J.; Monzó-Cabrera, J. Permittivity Measurements for Raw and Boiled Quinoa Seeds versus Temperature, Bulk Density, and Moisture Content. Curr. Res. Food Sci. 2023, 6, 100528. [Google Scholar] [CrossRef] [Scilit] [PubMed]
- Chauhan, P.D.; Gadani, D.H.; Rana, V.A. Effect of Moisture Content Variation on Dielectric Properties of Various Plant Leaves at Microwave Frequencies. Sci. Rep. 2024, 14, 13204. [Google Scholar] [CrossRef] [Scilit] [PubMed]
- Liang, O.H.; Meng, C.E.; Mohamad, C.W.S.R.; Nasir, N.F.M.; Jian, T.X.; You, B.C.; Tarmizi, E.Z.M.; Yee, L.K.; Yeow, Y.K.; Fhan, K.S.; et al. Frequency-Dependent Dielectric Spectroscopic Analysis on Phytochemical and Antioxidant Activities in Radix Glycyrrhizae Extract. Heliyon 2024, 10, e37077. [Google Scholar] [CrossRef] [Scilit] [PubMed]
- El Khaled, D.; Castellano, N.; Gázquez, J.; Perea-Moreno, A.-J.; Manzano-Agugliaro, F. Dielectric Spectroscopy in Biomaterials: Agrophysics. Materials 2016, 9, 310. [Google Scholar] [CrossRef] [Scilit] [PubMed]
- Jones, S.B.; Sheng, W.; Or, D. Dielectric Measurement of Agricultural Grain Moisture-Theory and Applications. Sensors 2022, 22, 2083. [Google Scholar] [CrossRef] [Scilit] [PubMed]
- Wang, S.; Du, S.; Yin, Y.; Song, C.; Liu, C.; Qian, R.; Zhao, L. Establishing a Low-Temperature Maize Kernel Moisture Content Prediction Model Based on Dielectric Constant Measurement. Agriculture 2025, 15, 507. [Google Scholar] [CrossRef] [Scilit]
- Jia, Z.; Han, X.; Hu, R.; Yu, J.; Yan, X.; Xu, J. Research on Soil Inorganic Nitrogen Detection Technology Based on Dielectric Response. Sustainability 2025, 17, 2491. [Google Scholar] [CrossRef] [Scilit]
- Shingala, B.; Panchal, P.; Thakor, S.; Jain, P.; Joshi, A.; Vaja, C.R.; Siddharth, R.K.; Rana, V.A. Random Forest Regression Analysis for Estimating Dielectric Properties in Epoxy Composites Doped with Hybrid Nano Fillers. J. Macromol. Sci. Part B 2024, 63, 1297–1311. [Google Scholar] [CrossRef] [Scilit]
- Chang, K. (Ed.) Encyclopedia of RF and Microwave Engineering; John Wiley: Hoboken, NJ, USA, 2005. [Google Scholar]
- Zivkovic, I.; Murk, A. Free-Space Transmission Method for the Characterization of Dielectric and Magnetic Materials at Microwave Frequencies. In Microwave Materials Characterization; Costanzo, S., Ed.; InTech: London, UK, 2012. [Google Scholar]
- López-Rodríguez, P.; Escot-Bocanegra, D.; Poyatos-Martínez, D.; Weinmann, F. Comparison of Metal-Backed Free-Space and Open-Ended Coaxial Probe Techniques for the Dielectric Characterization of Aeronautical Composites. Sensors 2016, 16, 967. [Google Scholar] [CrossRef] [Scilit] [PubMed]
- Nguyen, L.C.; Ho, M.C.; Le, T.-H. A New Approach to Estimate the Complex Relative Permittivity of Materials Based on Free-Space Reflection Method. Adv. Electromagn. 2020, 9, 19–24. [Google Scholar] [CrossRef] [Scilit]
- Huang, Q.; Liu, D.; Cao, R.; Zhong, Y.; Xiao, K.; Wang, K.A.; Bao, T. A Novel Broadband Measurement Method for Electromagnetic Parameters of Liquids Based on Resonance and Transmission-Reflection of Striplines. IEEE Trans. Instrum. Meas. 2025, 74, 1–16. [Google Scholar] [CrossRef] [Scilit]
- Zhu, S.; Gao, L.; Cui, J.; Hu, Y.; Zhu, X.; Yuan, H.; Tan, Z.; Ke, R.; Qiu, B.; Li, B. A Material Characteristic Measurement System for HTWT Support Rods Based on SLSP Resonator and Simulation-Driven Calibration. IEEE Trans. Instrum. Meas. 2025, 74, 1–9. [Google Scholar] [CrossRef] [Scilit]
- Meissner, T.; Wentz, F.J. The Complex Dielectric Constant of Pure and Sea Water from Microwave Satellite Observations. IEEE Trans. Geosci. Remote Sens. 2004, 42, 1836–1849. [Google Scholar] [CrossRef] [Scilit]
- Liu, Y.; Tang, J.; Mao, Z. Analysis of Bread Loss Factor Using Modified Debye Equations. J. Food Eng. 2009, 93, 453–459. [Google Scholar] [CrossRef] [Scilit]
- Trabelsi, S.; Nelson, S.O. Microwave Dielectric Properties of Cereal Grains. Trans. ASABE 2012, 55, 1989–1996. [Google Scholar] [CrossRef] [Scilit]
- Torrealba-Meléndez, R.; Sosa-Morales, M.E.; Olvera-Cervantes, J.L.; Corona-Chávez, A. Dielectric Properties of Beans at Ultra-Wide Band Frequencies. J. Microw. Power Electromagn. Energy 2014, 48, 104–112. [Google Scholar] [CrossRef] [Scilit]

Disclaimer/Publisher’s Note: The statements, opinions and data contained in all publications are solely those of the individual author(s) and contributor(s) and not of MDPI and/or the editor(s). MDPI and/or the editor(s) disclaim responsibility for any injury to people or property resulting from any ideas, methods, instructions or products referred to in the content. |
© 2026 by the authors. Licensee MDPI, Basel, Switzerland. This article is an open access article distributed under the terms and conditions of the Creative Commons Attribution (CC BY) license.