


Abstract
The detection and quantification of reactive oxygen and nitrogen species (RONS) in plasma-treated water (PTW) are essential for advancing plasma applications in biomedical and agricultural fields. However, RONS characterization remains challenging, as conventional techniques often require chemical reagents that can alter the sample. Electrochemical impedance spectroscopy (EIS) offers a non-destructive alternative by probing the electrical response of aqueous systems and providing information on ionic concentration, charge transfer, and diffusion processes. This study investigates the feasibility of EIS as a diagnostic tool for characterizing physicochemical changes in PTW. Calibration experiments were performed using saline solutions with different ionic concentrations to evaluate the sensitivity of impedance measurements. Impedance spectra were recorded over a frequency range of 0.1 Hz to 10 kHz and analyzed using Nyquist and Bode plots with equivalent circuit modeling. Deionized water was treated with cold atmospheric plasma at different discharge powers (3.53–10.15 W) and treatment times (5–30 min) to generate RONS. The results show that EIS can monitor plasma-induced changes in conductivity and interfacial properties associated with variations in ionic content. In particular, systematic changes in solution resistance and admittance were observed and were correlated with plasma-induced changes in ionic composition. These findings demonstrate that EIS is a sensitive and non-invasive diagnostic method for PTW analysis.
1. Introduction
Cold atmospheric plasma (CAP) treatment of water generates complex mixtures of reactive oxygen and nitrogen species (RONS), which play important roles in emerging applications across biomedicine, cancer treatment [1], cell monitoring [2], tissue monitoring [3], the agriculture and food industry [4], and environmental remediation [5,6]. In plasma–liquid environments, a wide range of complex chemical reactions take place, yet only relatively long-lived reactive oxygen and nitrogen species such as H2O2, NO2−, and NO3− remain stable enough to accumulate in the liquid volume [7,8,9]. These species have been identified as the dominant species in plasma-treated water (PTW) in terms of their physicochemical activity [10]. The accurate characterization of these species presents a significant analytical challenge due to the transient nature of RONS in general [11]. However, most conventional analytical techniques used for the quantification of RONS, such as colorimetric assays, ion chromatography, and spectrophotometric methods, require the addition of chemical reagents, which may alter the physicochemical equilibrium of the sample and introduce perturbations in its native composition [12,13]; thus, there is a need for a simple, fast, non-destructive, and potentially real-time (online) method to determine the concentrations of dominant reactive species in PTW samples. A variety of alternative methods have been developed to detect both short- and long-lived species in PTW; however, these methods can be quite cumbersome and time-consuming and typically operate offline, while not being very sensitive to small changes in external conditions [14]. Both pH measurements and conductivity measurements are often available in published results on PTW [15], but they are rarely used to derive information on the concentration of reactive species.
Electrochemical impedance spectroscopy (EIS) is a powerful analytical technique for characterizing the electrical properties of solutions and interfaces [16,17] that is used in a wide range of applications in chemical sensing and biosensing [18,19], as well as non-invasive diagnostics [20,21]. EIS has emerged as a promising alternative for rapid and non-destructive characterization of ionic species in aqueous solutions [22]. Applying a sinusoidal voltage perturbation across a range of frequencies and measuring the current response (current or voltage) [23] provides information about ion concentrations, charge-transfer processes, diffusion phenomena, and interfacial properties [24]. EIS has an ability to provide a wealth of information for various electrical, electrochemical, and physical processes taking place in electrochemical systems [25]. The technique measures the frequency-dependent electrical response of the solution, which is directly related to the ionic composition through the solution’s conductivity and capacitance [26]. In dilute aqueous electrolytes, the electrical behavior of the system can be modeled by a simple equivalent circuit consisting of bulk resistance (Rb) associated with ionic transport, in series with double-layer capacitance (Cdl). This capacitance results from the series combination of the Helmholtz capacitance (CH), which represents the layer of ions adsorbed on the electrode surface (also called Stern layer), and of the diffuse layer capacitance (Cdiff), which accounts for the cloud of ions extending into the solution., The thickness of this diffuse layer is of the order of the Debye length. While CH is often treated as constant, Cdiff varies significantly with the electrolyte concentration; this framework is known as the Gouy–Chapman–Stern (GCS) model. The resulting impedance response therefore reflects both the bulk ionic conductivity and the interfacial polarization processes occurring at the electrode surface. This simple electrical model is used to understand how changes in ionic concentration and composition influence the measured impedance response. However, the response is also heavily influenced by the experimental setup and electrode configuration [27]. Factors such as electrode geometry and cell configuration can lead to non-uniform current distributions, significantly affecting the impedance spectra, particularly at low frequencies where double-layer effects dominate [28]. These factors should therefore be acknowledged when interpreting EIS data [29].
The aim of this work was to investigate the capability of electrochemical impedance spectroscopy to monitor changes in conductivity and interfacial electrical behavior occurring after plasma treatment. To achieve this goal, impedance measurements were first employed to study calibration experiments using reference electrolytes (NaCl, NaNO2, NaNO3, HNO3, and H2O2) to establish calibration relationships between ionic concentration and impedance parameters. The same EIS approach was then applied to plasma-treated water to determine whether its impedance response reflects the presence and evolution of plasma-generated reactive species. A linear scaling relationship between the maximum imaginary admittance (Im(Y)max) and its corresponding peak frequency (fmax) was identified, indicating systematic differences in the electrical response of different ionic systems. These results demonstrate that EIS can be used as a rapid, reagent-free method for monitoring physicochemical changes in plasma-treated water (PTW).
2. Materials and Methods
2.1. Plasma Sources and Experimental Setup
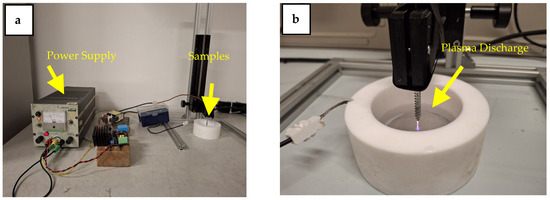
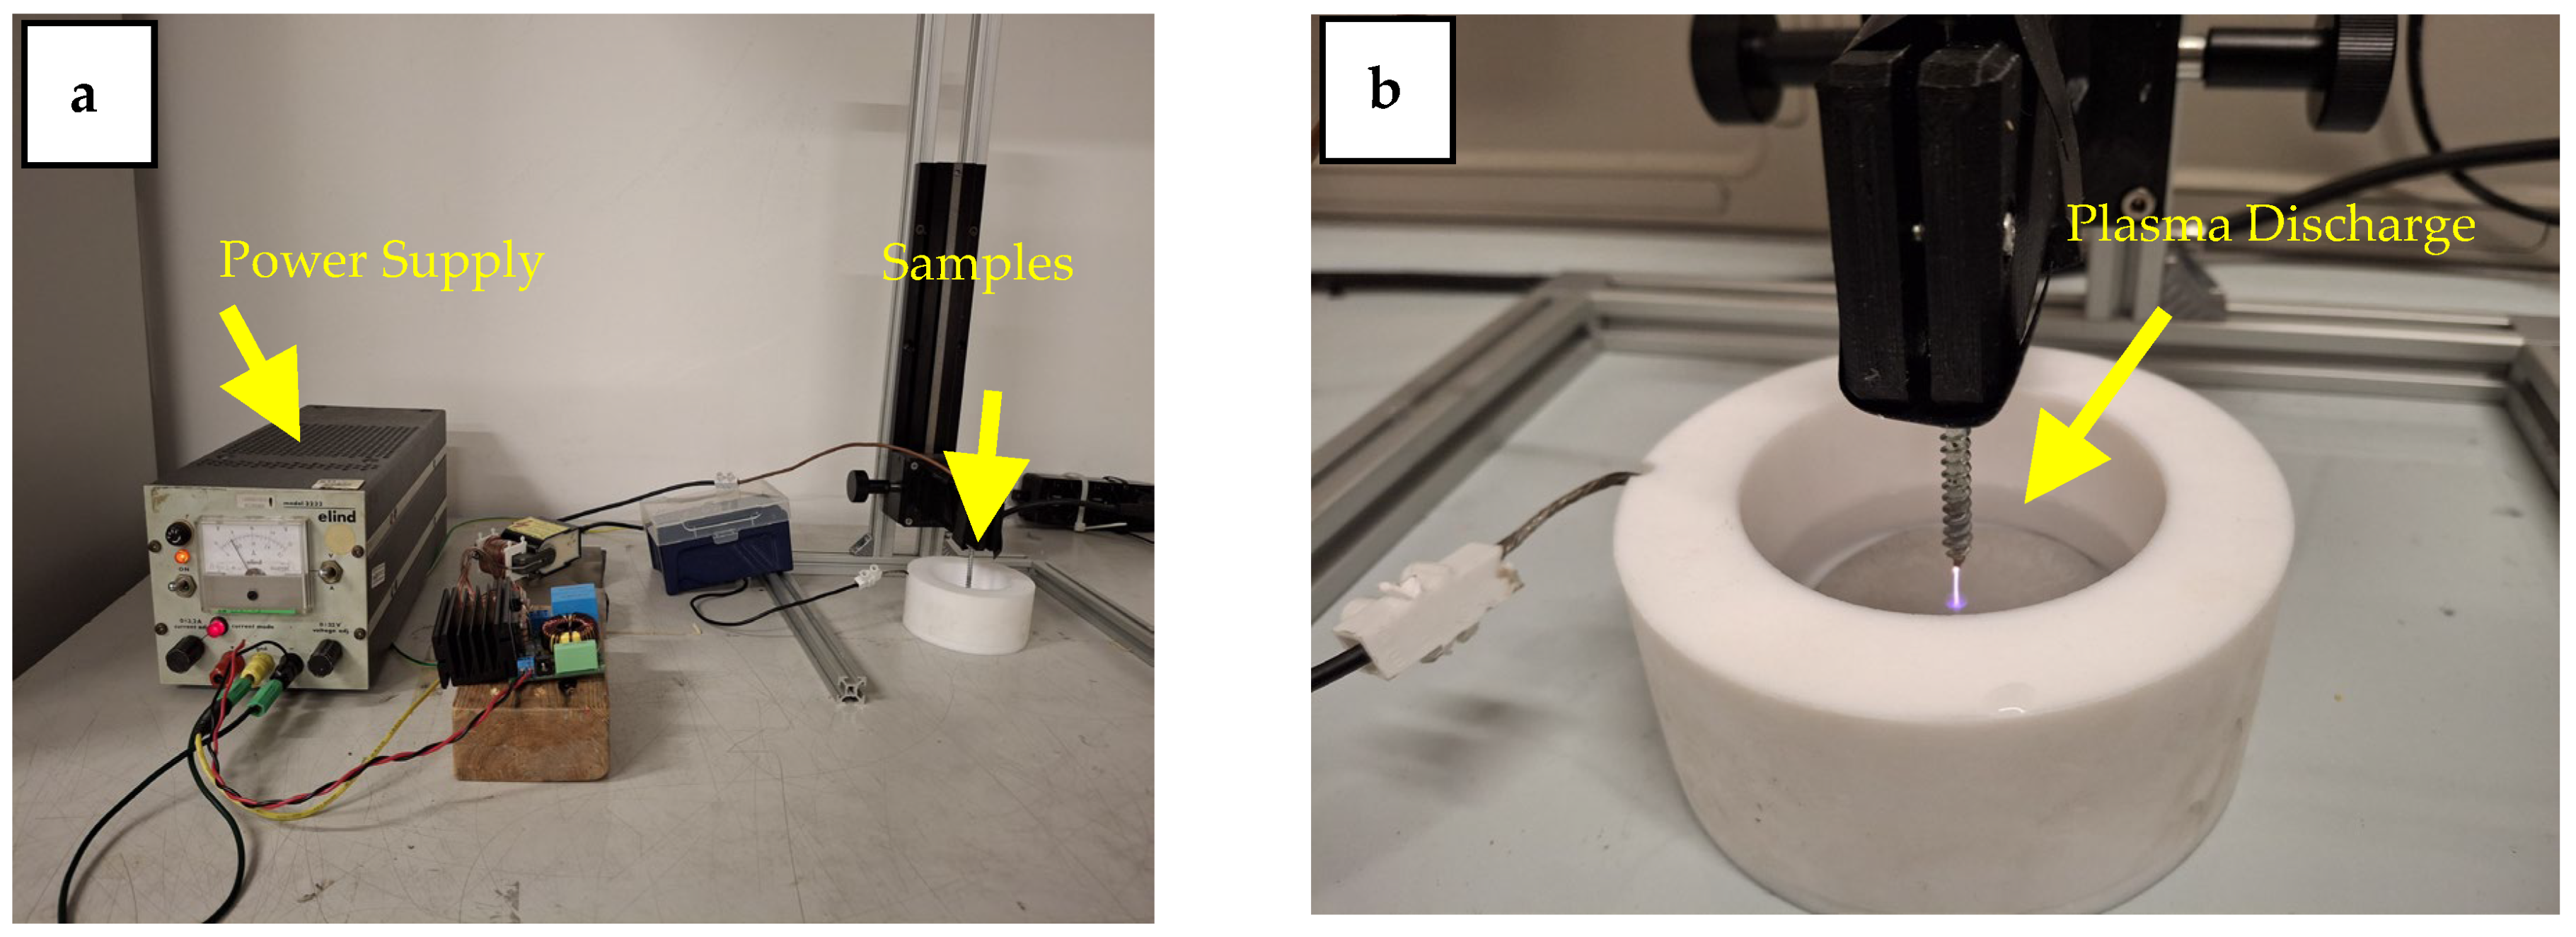
In this work, an AC high voltage spark discharge plasma was used. The plasma was formed in a pin-to-plate configuration made of two electrodes: a needle stainless steel electrode as a pin and a ground aluminum electrode. A picture of the experimental setup is shown in Figure 1. In the present work, the distance between the two electrodes was set at 3.5 cm. The high voltage electrode is connected to a high voltage AC power supply consisting of a ZVS driver connected to a high voltage transformer that was positioned 2.0 mm above the water surface, while the grounded electrode was placed inside at the bottom of the container in direct contact with the water sample. To ensure characterization of the plasma conditions at different currents, the actual electrical power delivered to the discharge was experimentally determined. In this work, three values of the current delivered by the DC power supply powering the whole setup (1.8, 2.4, and 2.8 A) were considered. In order to evaluate the actual electric power delivered to the plasma, voltage and current waveforms were measured using an oscilloscope. The voltage of the pin electrode was measured using a Tektronix P6015A high voltage probe. A resistor (27 Ω) was put in series with the ground plate, and the current was calculated from the voltage drop across this resistor. The values reported in Table 1 as voltage max of plasma and current max of plasma correspond to experimentally measured instantaneous peak (amplitude) values rather than RMS values. Because the plasma discharge waveform was not a purely sinusoidal AC signal and contained transient discharge features, the average plasma power was not estimated from the maximum voltage and current values. Instead, the instantaneous power was calculated point-by-point as P(t) = V(t) × I(t), and the average plasma power was obtained by averaging the instantaneous power over two representative AC cycles. The results show that the effective power delivered to the plasma varies with the operating conditions and does not scale linearly with the nominal power supply current. This highlights the importance of direct electrical measurements for accurate characterization of plasma–liquid systems.
Figure 1.
Plasma treatment setup: (a) power supply and plasma source, (b) plasma treatment of an aqueous solution in the sample holder.
Table 1.
Measured electrical parameters of the plasma discharge.
Water samples were exposed to plasma for 5, 10, 15, 20, and 30 min to evaluate the effects of treatment duration on the production of RONS. After the treatment was completed, the water was gently stirred to achieve a more homogeneous sample and a better distribution of reactive species in the water.
2.2. Impedance Spectroscopy Setup
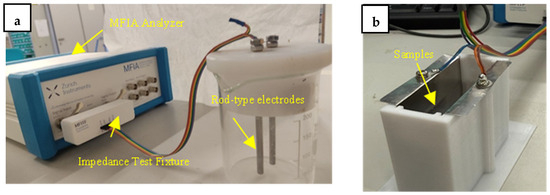
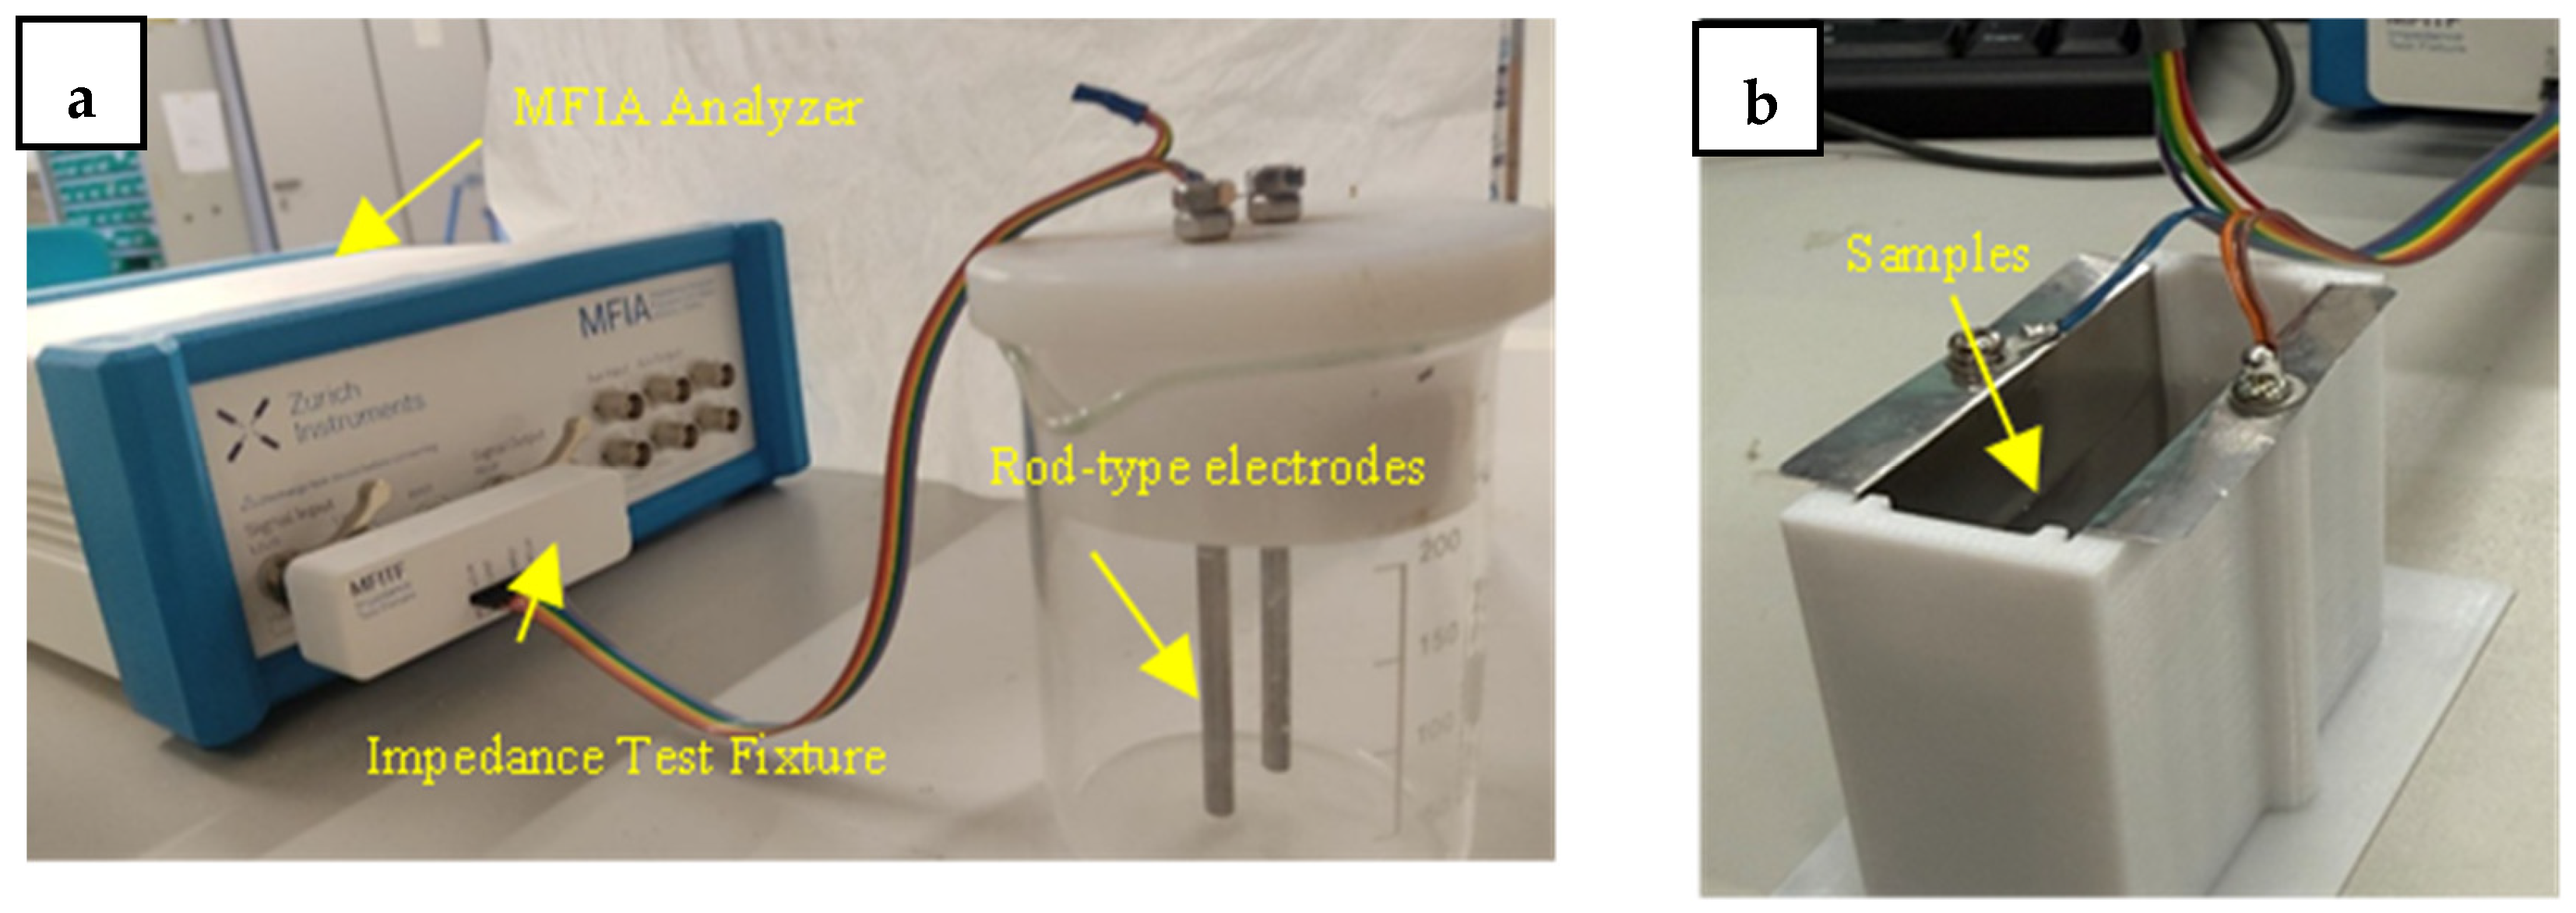
Impedance spectroscopy was performed with a MFIA impedance spectrometer (Precision LCR Meter 500 Hz/5 MHz, Zurich Instruments, Zurich, Switzerland), and data were collected with a connected PC. The MFIA is capable of measuring impedance across a milli-Ohm to giga-ohm range. This capability makes it ideal for studying materials with a wide range of electrical properties. Two types of measurement cells were designed and manufactured. The first measurement cell was a non-conductive container holding the liquid samples, shown in Figure 2a, with a pair of stainless-steel cylindrical rod electrodes. A pair of rod electrodes with diameters of 4 mm were positioned at a distance of 19 mm from each other and were connected to the signal input/output ports of the MFIA. An AC signal was applied via electrodes in direct contact with the 50 mL aqueous sample. Both electrodes were rinsed, cleaned with deionized water, and completely dried after each measurement. The second measurement setup (Figure 2b) was implemented to investigate the influence of electrode geometry and interfacial surface area (active area) on the impedance response. In this configuration, the setup consisted of two parallel, flat, stainless-steel electrodes 5.7 cm wide and 6 cm high. The electrodes were placed 2 cm apart. This setup enabled working with 50 mL volumes of solutions. The active area was experimentally controlled by designing electrodes with different geometries while maintaining the same electrode material and inter-electrode distance as with the rod electrode in order to enable comparative impedance measurements to be taken under similar electrical conditions. The geometrical interfacial area was estimated using A = W × H, where A is active area for each electrode, and W and H represent the width and immersed height of the electrode, respectively. To monitor the impedance of the sample, a frequency range of 0.1 Hz to 10 kHz with a voltage amplitude of 300 mV was used. A complete picture of the impedance measurements can be obtained over a wide frequency range, where, for each frequency, the active and reactive components of the impedance are calculated. The measurements allowed us to obtain the dependence of the impedance on the frequency of the voltage applied to the sample. The impedance spectra were analyzed using a simplified equivalent circuit model consisting of bulk conductance (Gm) in parallel with a constant phase element (CPE), implemented in Python (version 3.14) using nonlinear least-squares fitting. The fit quality was checked using RMSE and reduced χ2-like residual analysis, which showed good agreement between the experimental data and the fitted model. From the fitted admittance spectra, the characteristic peak frequency (fmax) and the maximum imaginary admittance value (Im(Y)max) were extracted to describe the dominant interfacial electrical behavior at the electrode–electrolyte interface. An effective capacitance (Cdl) was estimated using Cdl = Im(Y)max/(π fmax). This parameter was used for comparative analysis between different electrode configurations and plasma treatment conditions as an indicator of changes in interfacial electrical behavior. In this work, EIS was applied to investigate frequency-dependent electrical changes related to ionic transport and interfacial processes in plasma-treated water.
Figure 2.
(a) Impedance spectroscopy setup with rod-type configuration; (b) parallel plate configuration.
2.3. pH, Conductivity, and Griess Assay Measurements of Ion Concentrations
The physicochemical properties of PTW, including pH, electrical conductivity, and the concentrations of long-lived reactive species such as nitrite (NO2−), nitrate (NO3−), and hydrogen peroxide (H2O2), were measured after plasma treatment for different exposure times using pH and conductivity probes together with ion-selective measurements, colorimetric analysis, and impedance spectroscopy. During plasma exposure, reactive chemical species generated in the discharge interact with the liquid phase, leading to acidification of the water due to the formation of nitric and nitrous acids. As a result, the pH of PTW decreases with increasing plasma treatment time. The pH measurements in this study were performed using a calibrated multimeter (Monokrystaly, s.r.o, Model MPH472, Přepeře, Czech Republic) operating within a pH working range of 0–14. The instrument was calibrated using four standard buffer solutions with pH values of 2, 4, 7, and 9. Prior to measurement, the pH probe was primed by immersion in a pH 7 buffer solution for at least 24 h. The multimeter was equipped with ion-selective and pH probes, a conductivity probe, a temperature probe, and a reference electrode. Using the ion-selective probe, nitrate ion (NO3−) concentrations in the PTW samples were directly measured. As per the manufacturer, the nitrate ion-selective electrode exhibits limited cross-sensitivity to nitrite ions, with a selectivity coefficient of 3.6 × 10⁻² for NO2−. Electrical conductivity measurements were conducted using a conductivity probe calibrated with a 10−4 mol·L−1 KCl standard solution.
The concentration of nitrite ions (NO2−) generated in plasma-treated water was measured using the Griess colorimetric assay (Sigma-Aldrich, 1465-25-4, St. Louis, MO, USA). PTW samples with a volume of 25 mL were collected for different plasma treatment conditions. For each measurement, 2.5 mL of Griess reagent was added directly to the PTW sample and mixed thoroughly to allow the colorimetric reaction to proceed. Control reference samples of different concentrations were prepared by dissolving 1 mg, 0.1 mg, 0.01 mg, or 0.001 mg of sodium nitrite (NaNO2) in 25 mL of distilled water, followed by the addition of 2.5 mL of Griess reagent. The reacted samples were transferred to sample vials and analyzed using a microplate reader to quantify the absorbance. The transmitted light intensity of the Griess-reacted samples was extracted from photographic images using digital image analysis. Absorbance values were calculated, and nitrite concentrations were determined based on a linear calibration curve obtained from reference solutions.
2.4. Calibration Solutions for Impedance Measurements
A series of aqueous reference solutions with different concentrations of nitric acid (HNO3), sodium nitrite (NaNO2), and sodium nitrate (NaNO3) was prepared to calibrate the impedance response and evaluate the sensitivity of impedance spectroscopy to variations in ionic composition and concentration. In addition, NaCl and NaHCO3 solutions were investigated during preliminary impedance measurements of reference electrolytes for evaluating the electrical response of different ionic systems. Hydrogen peroxide (H2O2) solutions at various concentrations were independently prepared and quantified to provide complementary information on the chemical composition of PTW. A stock solution with a concentration of 150 mg/L of HNO3 and H2O2 was used as a high-concentration source for each compound and subsequently diluted with distilled water according to the proportions listed in Table 2. Following the preparation of each solution, impedance measurements were performed using a two-electrode impedance spectroscopy setup. After each measurement, the electrode surfaces and the measurement cell were thoroughly rinsed with deionized water and dried at room temperature prior to subsequent tests. All measurements were conducted in triplicate to ensure the repeatability and reliability of the results.
Table 2.
Composition of HNO3/H2O2 mixtures prepared at different volumetric ratios.
3. Results and Discussion
Before starting to analyze the plasma-treated water, it is first necessary to understand how impedance spectroscopy responds to simple electrolyte systems. Therefore, a series of calibration experiments was performed using simple aqueous solutions with known ionic compositions to establish the relationship between impedance parameters and ionic concentration, providing a baseline for interpreting the electrical response of plasma-treated water.
3.1. Impedance Response of NaCl Solutions
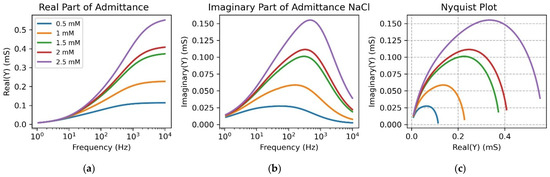
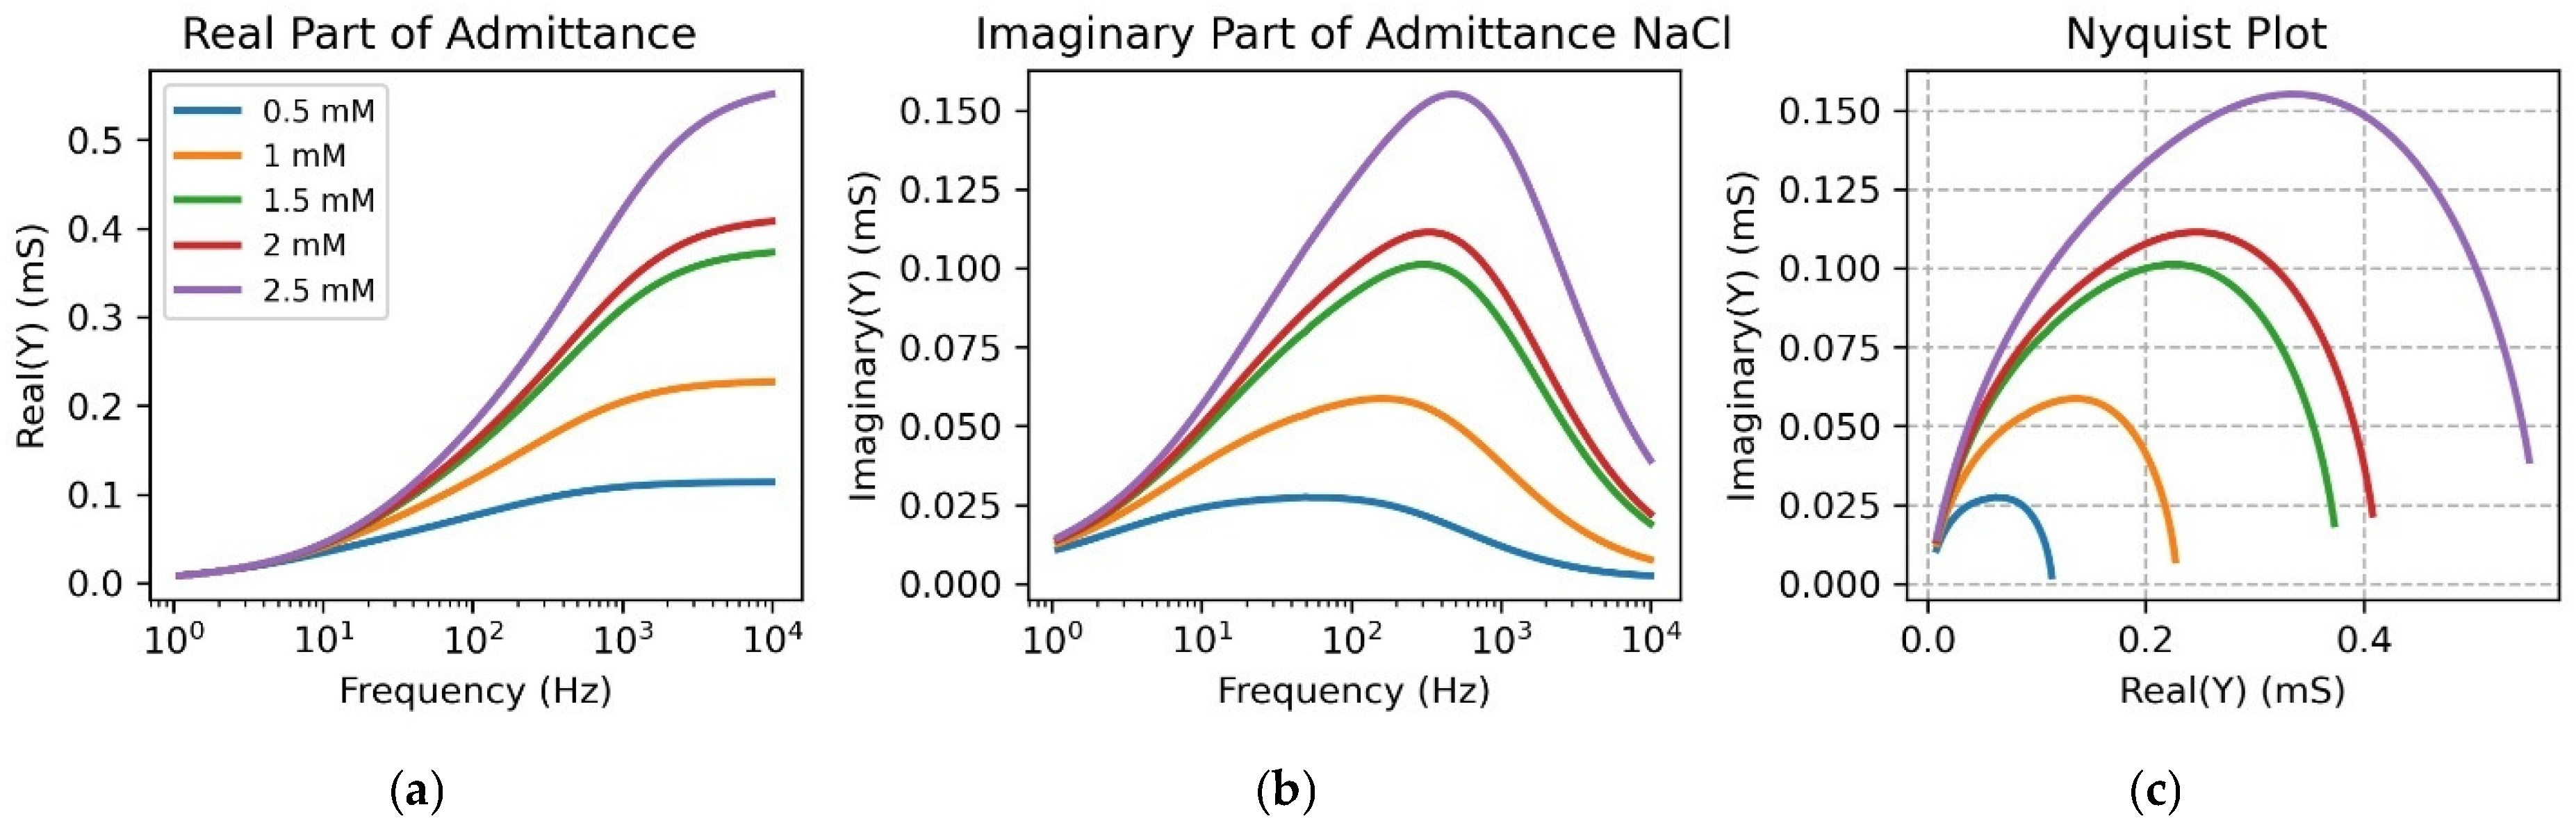
NaCl was measured first as a model electrolyte, because it represents a simple fully dissociated ionic system with certain conductivity behavior to validate the sensitivity of the impedance measurements to changes in ionic concentration. In Figure 3, the Bode and Nyquist plots of admittance for different concentrations of NaCl solution (0.5, 1, 1.5, 2, 2.5 mM) with a cylindrical rod setup are presented. A clear decrease in solution resistance (Rs) was observed from the real part of the admittance as the ionic concentration increased, indicating enhanced electrical conductivity of the solution, as expected. In the frequency range between 1 Hz and 10 kHz, the Nyquist plots of the measured admittance for the tested saline solutions exhibited a typical semicircular shape, which indicates a combination of resistive and capacitive behaviors in the electrolyte. For the rod electrode configuration, the characteristic frequency associated with the maximum of the imaginary admittance component systematically shifts with increasing salt concentration, reflecting changes in the dominant relaxation processes of the electrolyte.
Figure 3.
Bode plots (a,b) and Nyquist plot (c) in the case of NaCl solutions of different molar concentrations.
Electrochemical impedance data were analyzed using the simplified equivalent circuit model described in the Section 2, consisting of a Gm in parallel with a CPE. The extracted fitting parameters, including Gm, Q, and α, showed systematic dependence on electrolyte concentration, reflecting changes in ionic transport and interfacial electrical behavior [30]. The extracted conductance exhibited a strong correlation with electrolyte concentration, confirming the suitability of conductance as a reliable calibration parameter for concentration determination [31]. The fitting parameters obtained from the Gm; (1/R), the constant phase element parameter (Q) that increased with concentration, reflecting enhanced interfacial polarization effects [32], and the phase element (α) provided a good description of the experimental spectra across the full frequency range [33].
To quantitatively describe the experimental spectra, the impedance data were fitted using an equivalent electrical circuit consisting of a Gm in series with a CPE:
represents the bulk resistance (the inverse of the electrical conductance Gm), and
Z = Gm + ZCPE
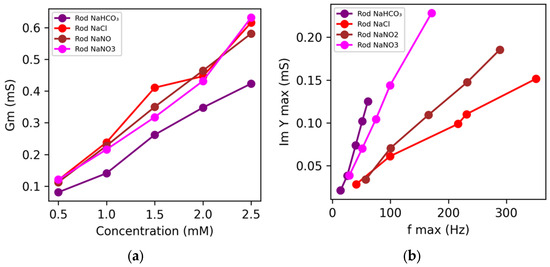
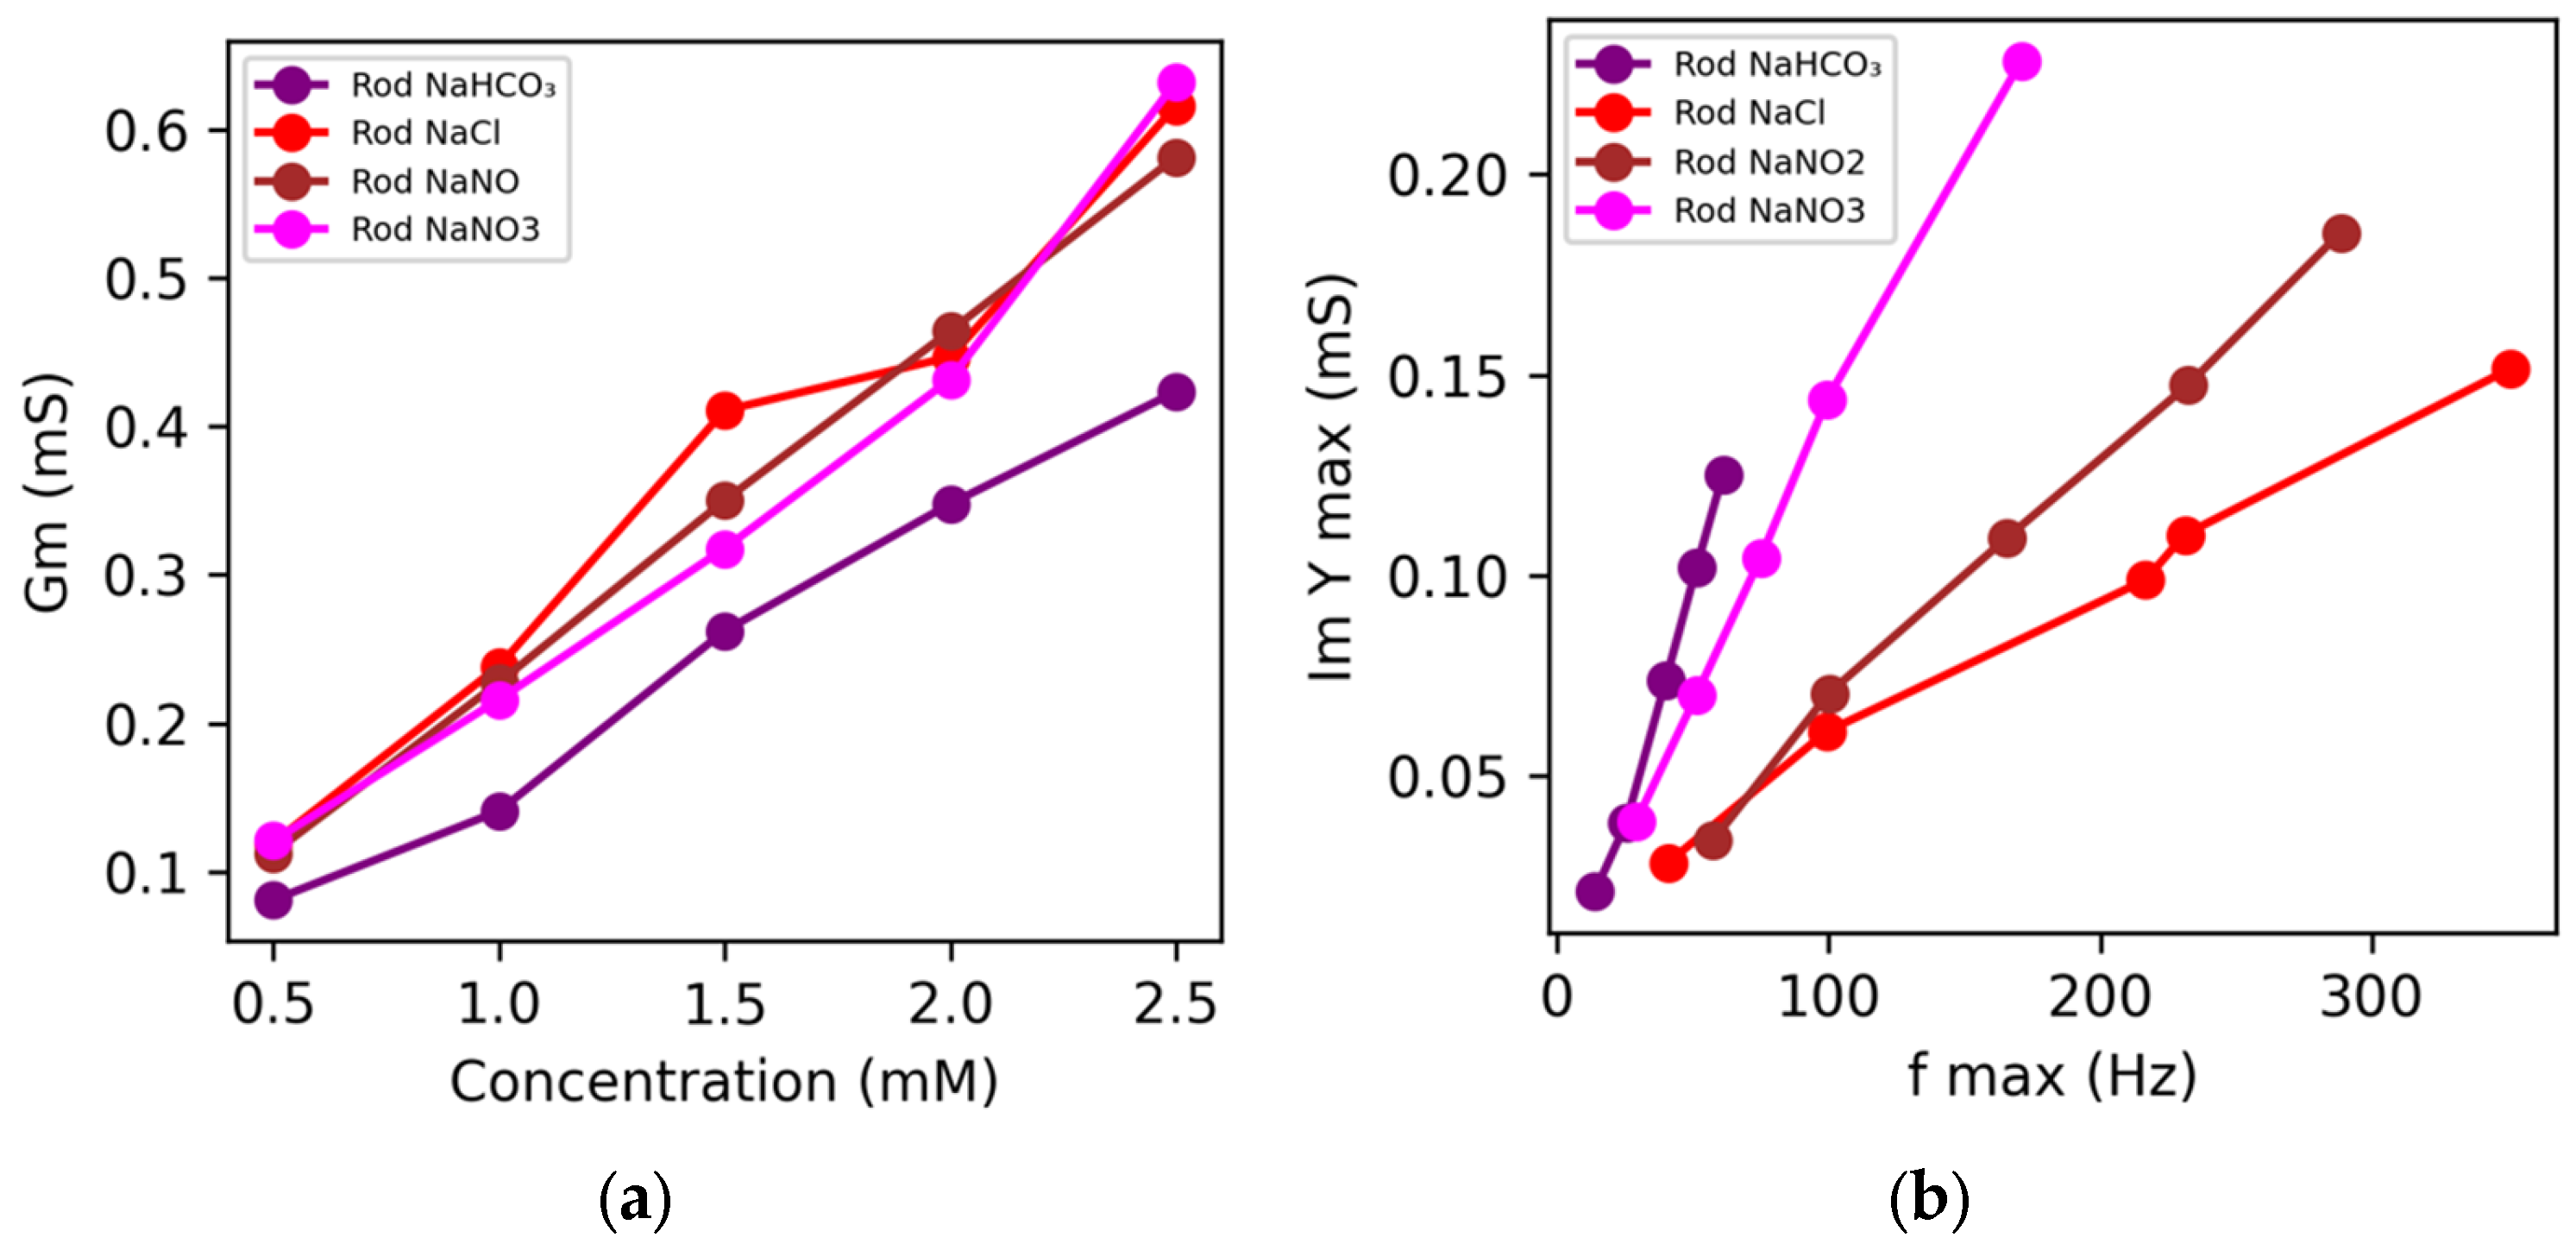
Among the extracted equivalent circuit parameters, Gm exhibited the highest sensitivity to variations in ionic concentration [34]. A strong linear correlation (R2 > 0.99) was observed between Gm and electrolyte concentration for all calibration solutions (Figure 4a), confirming that Gm can be reliably employed as a quantitative calibration parameter for dilute aqueous systems. Beyond conductance, further insight was obtained from the frequency-dependent behavior of the imaginary admittance component, Im(Y). The Im(Y) spectra displayed salt-specific characteristics, indicating that the full impedance response contains sufficient information to distinguish between different ionic species. Figure 4b illustrates the relationship between Im(Y)max and fmax for the all four saline solutions. To investigate this behavior quantitatively, Im(Y)max was plotted as a function of the corresponding fmax values for each electrolyte. All datasets demonstrated a clear linear dependence with negligible intercepts, indicating that Im(Y)max scales proportionally with fmax. The high coefficients of determination (R2 > 0.98) confirm the robustness of this proportional relationship. The calculated slopes (k) were 0.00038 mS/Hz for NaCl, 0.00138 mS/Hz for NaNO2, 0.00134 mS/Hz for NaNO3, and 0.0022 mS/Hz for NaHCO3, suggesting an increasing frequency-dependent polarization effect in the order NaCl < NaNO2 ≈ NaNO3 < NaHCO3. The observed trend reflects differences in ionic mobility, hydration structure, and interfacial polarization dynamics. Consequently, the slope parameter k can be interpreted as an electrical signature that is characteristic of each electrolyte. Using this slope-based classification, all investigated solutions were successfully discriminated within distinct regions of the Im(Y)max − fmax plane, demonstrating that this approach provides a reliable and physically meaningful method for identifying ionic composition from impedance spectroscopy data.
Figure 4.
Concentration-dependent evolution of impedance-derived parameters obtained from EIS measurements in rod-type electrodes (a) and (b) scatter plot of Im(Y) vs. frequency of maximum value.
After studying how the impedance parameters change with concentration in simple saline solutions, the analysis was extended to additional calibration systems. Nitric acid (HNO3) and hydrogen peroxide (H2O2) were selected because they represent chemical species that are commonly produced in plasma-treated water.
3.2. Calibration of Impedance Response for Ionic and Molecular Species
3.2.1. Impedance Response of HNO3 Solutions
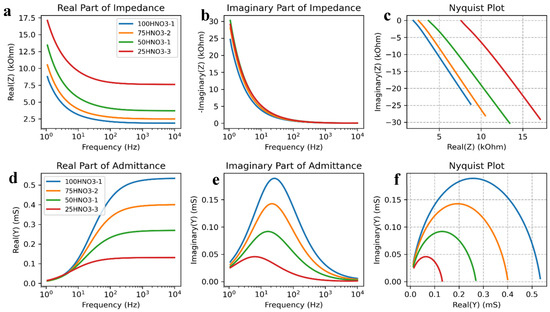
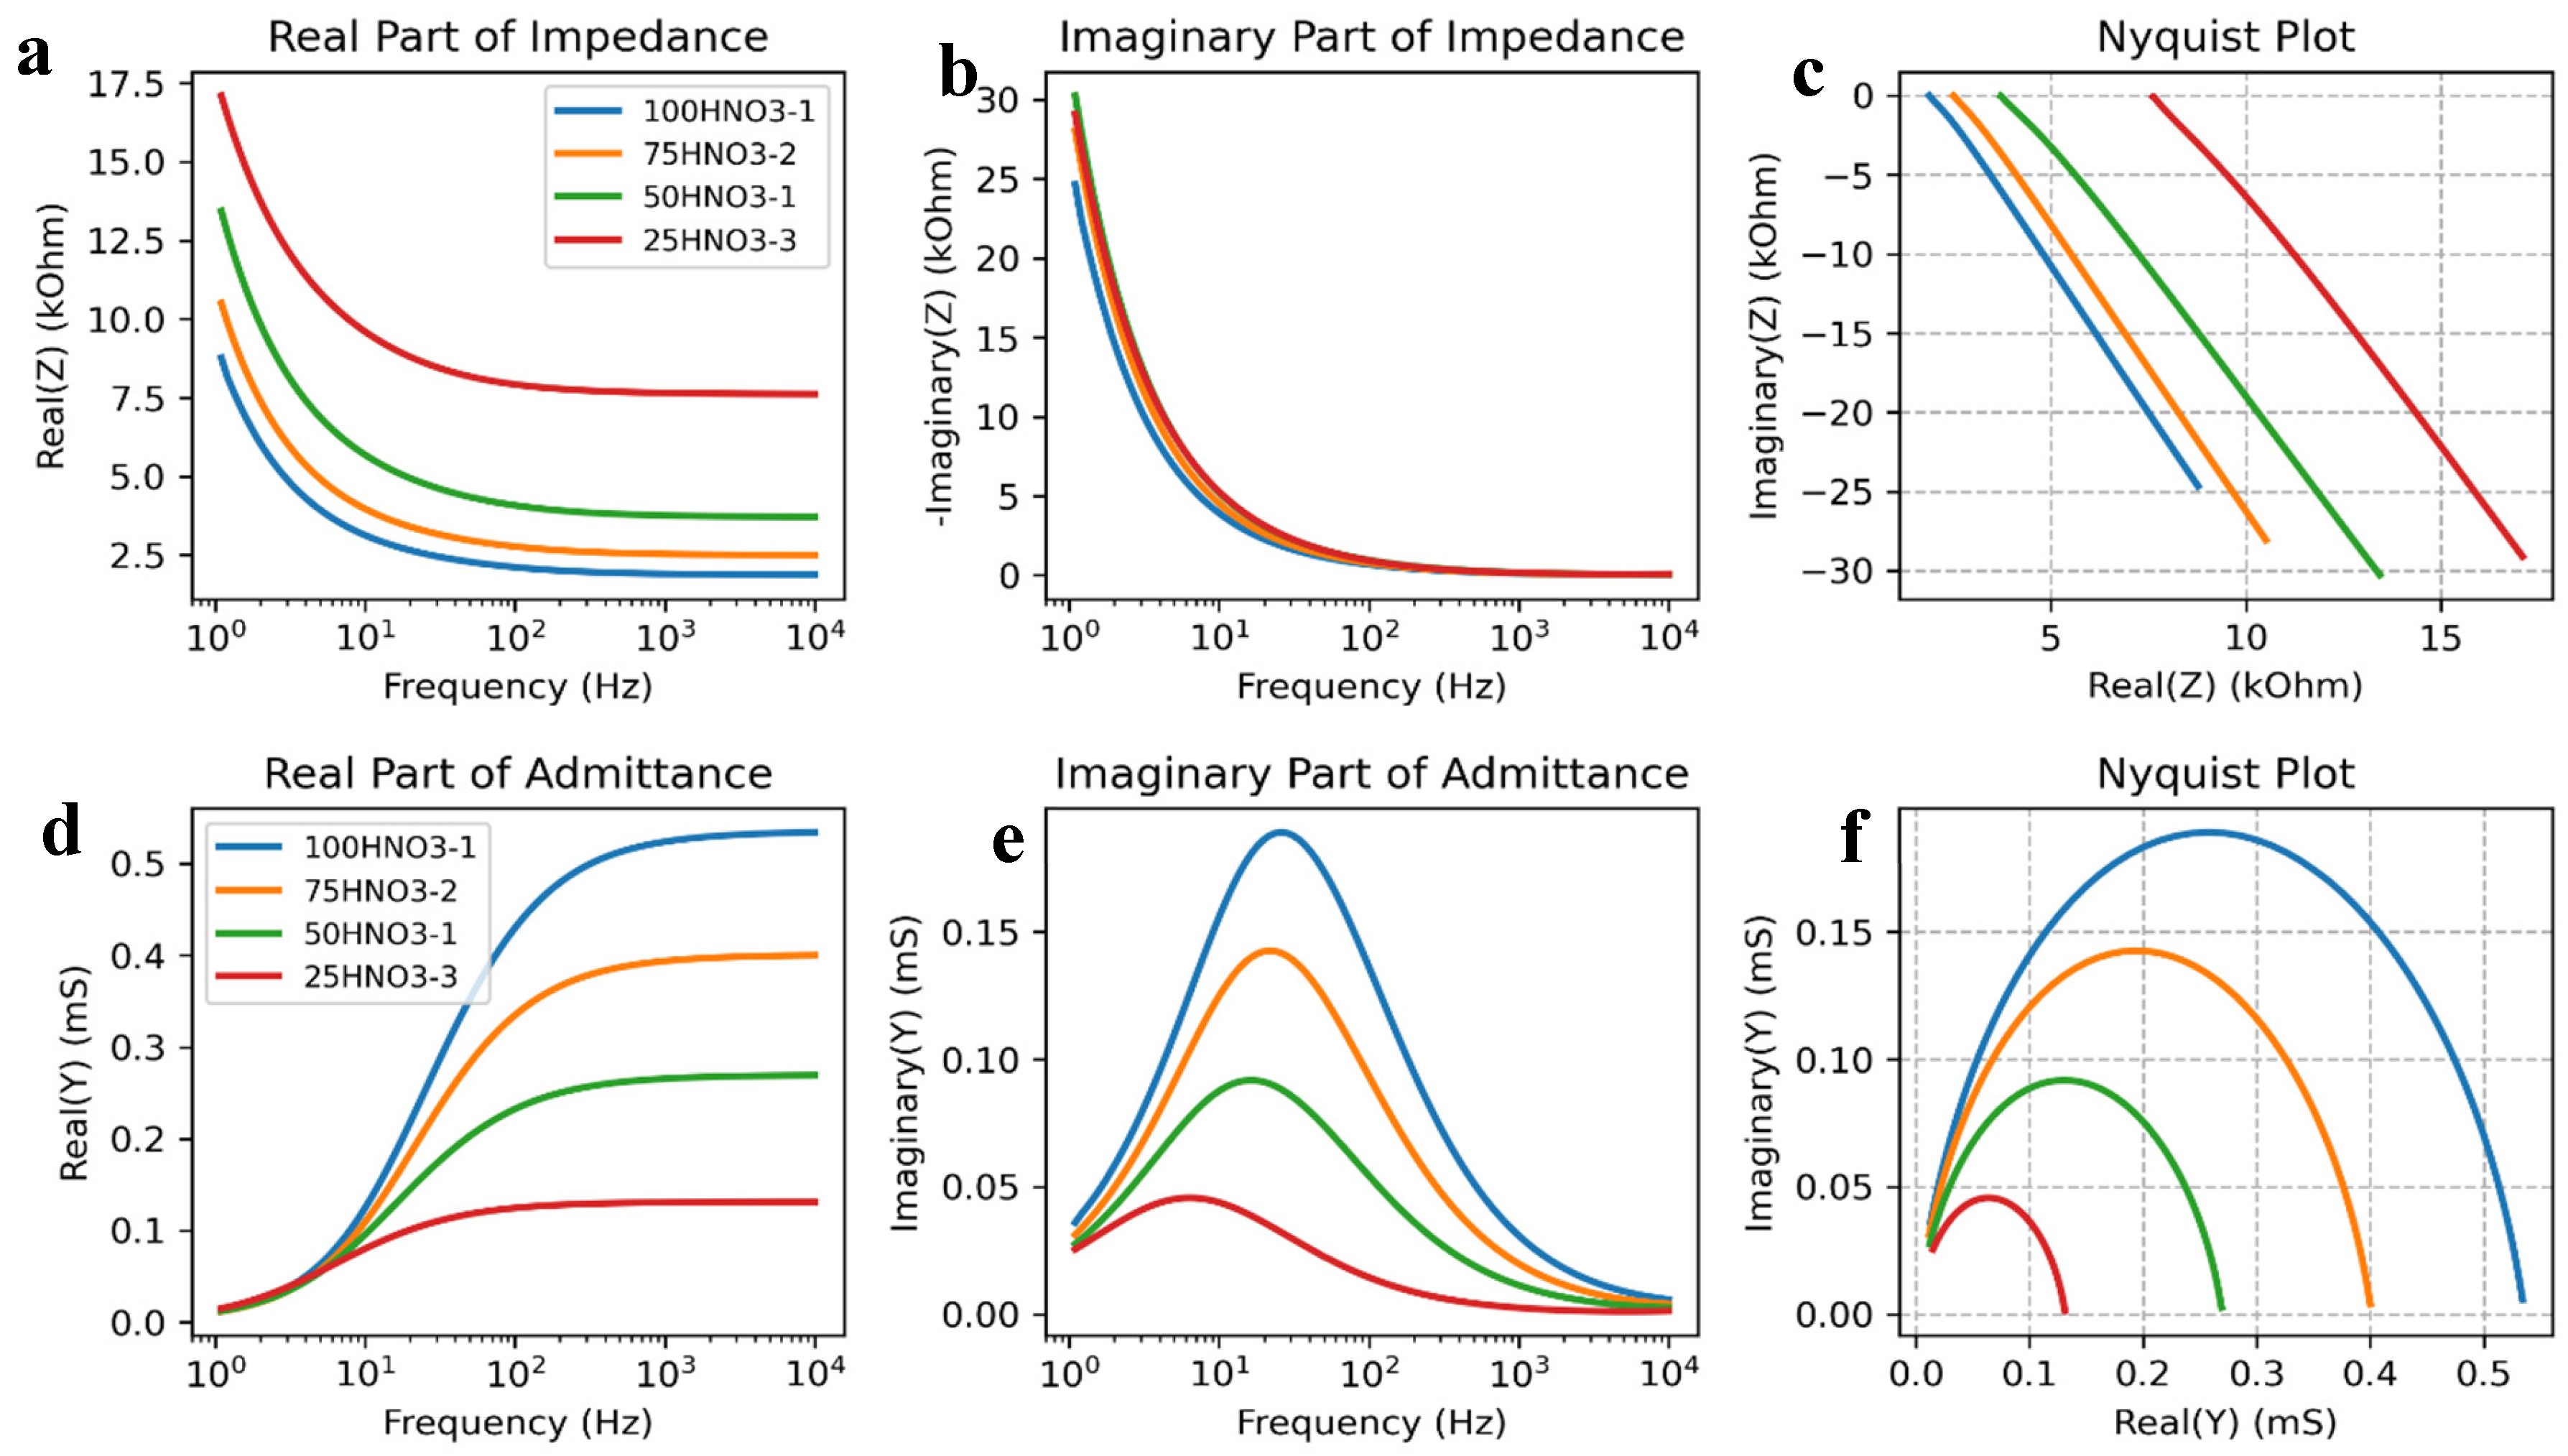
Figure 5a–f present the impedance spectra obtained for HNO3 solutions at various concentrations. EIS was able to clearly distinguish the electrical behavior of the tested solutions. As the ion concentration increased, the solution resistance decreased while the conductance increased. This behavior reflects the higher availability of charge carriers at higher acid concentrations, although the effective carrier density is also governed by the acid dissociation equilibrium (pKa relative to pH), which determines the degree of ionization. This behavior confirms the sensitivity of electrochemical impedance spectroscopy to variations in ionic strength and validates its applicability for probing ion-mediated transport in aqueous electrolytes. By quantifying these changes with EIS, it is possible to directly correlate the plasma-induced increase in ionic species with measurable electrical properties of the solution.
Figure 5.
(a–f) Bode plot and Nyquist plot of impedance (a–c) and admittance (d–f) of HNO3 concentrations (25, 50, 75, and 100%).
The concentration of HNO3 strongly influenced both the impedance magnitude and the phase response measured by EIS. As the HNO3 concentration increased, the impedance magnitude decreased. The relationship between impedance and concentration is not strictly linear, approaching a lower asymptotic limit at higher concentrations, which suggests a sigmoidal calibration behavior. Sigmoidal responses are a common feature in concentration-dependent impedance measurements and typically define an optimal operating region where sensitivity to concentration changes is maximized [35].
3.2.2. Impedance Behavior of H2O2 Solutions
In addition, impedance measurements were also performed for H2O2 solutions. The obtained spectra indicated that hydrogen peroxide exhibited behavior similar to that of deionized water [36], showing very low conductivity and high resistance due to the weak dissociation behavior of hydrogen peroxide. These observations indicate that H2O2 contributes only weakly to the ionic conductivity of the solution compared with strongly dissociated electrolytes.
3.2.3. Comparative Impedance Behavior
Furthermore, the Nyquist plots exhibited a single semicircle-like behavior, indicating a dominant relaxation process governed by bulk ionic transport and interfacial polarization effects. This behavior is consistent with increased ionic mobility and improved charge transport across the electrolyte. The reduction in the semicircle diameter also reflects an increase in the effective interfacial capacitance, likely due to the thinning of the electrical double layer at higher ionic strengths. Such behavior enables clear differentiation between conductive (ionic) and non-conductive (molecular) solutions, providing a strong reference for interpreting the impedance response of plasma-treated water.
3.3. Impedance Characterization of Plasma-Treated Water in the Rod Configuration
After analyzing the calibration electrolytes, the same method was applied to plasma-treated water to understand whether the electrical response of PTW is consistent with the ionic species identified in the calibrations systems.
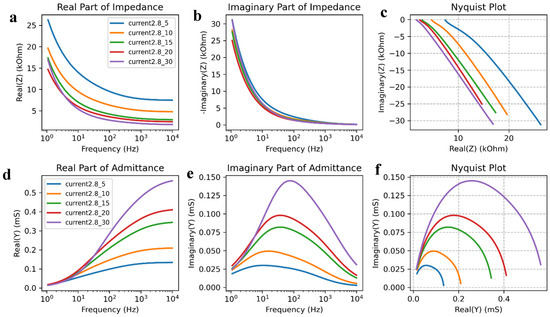
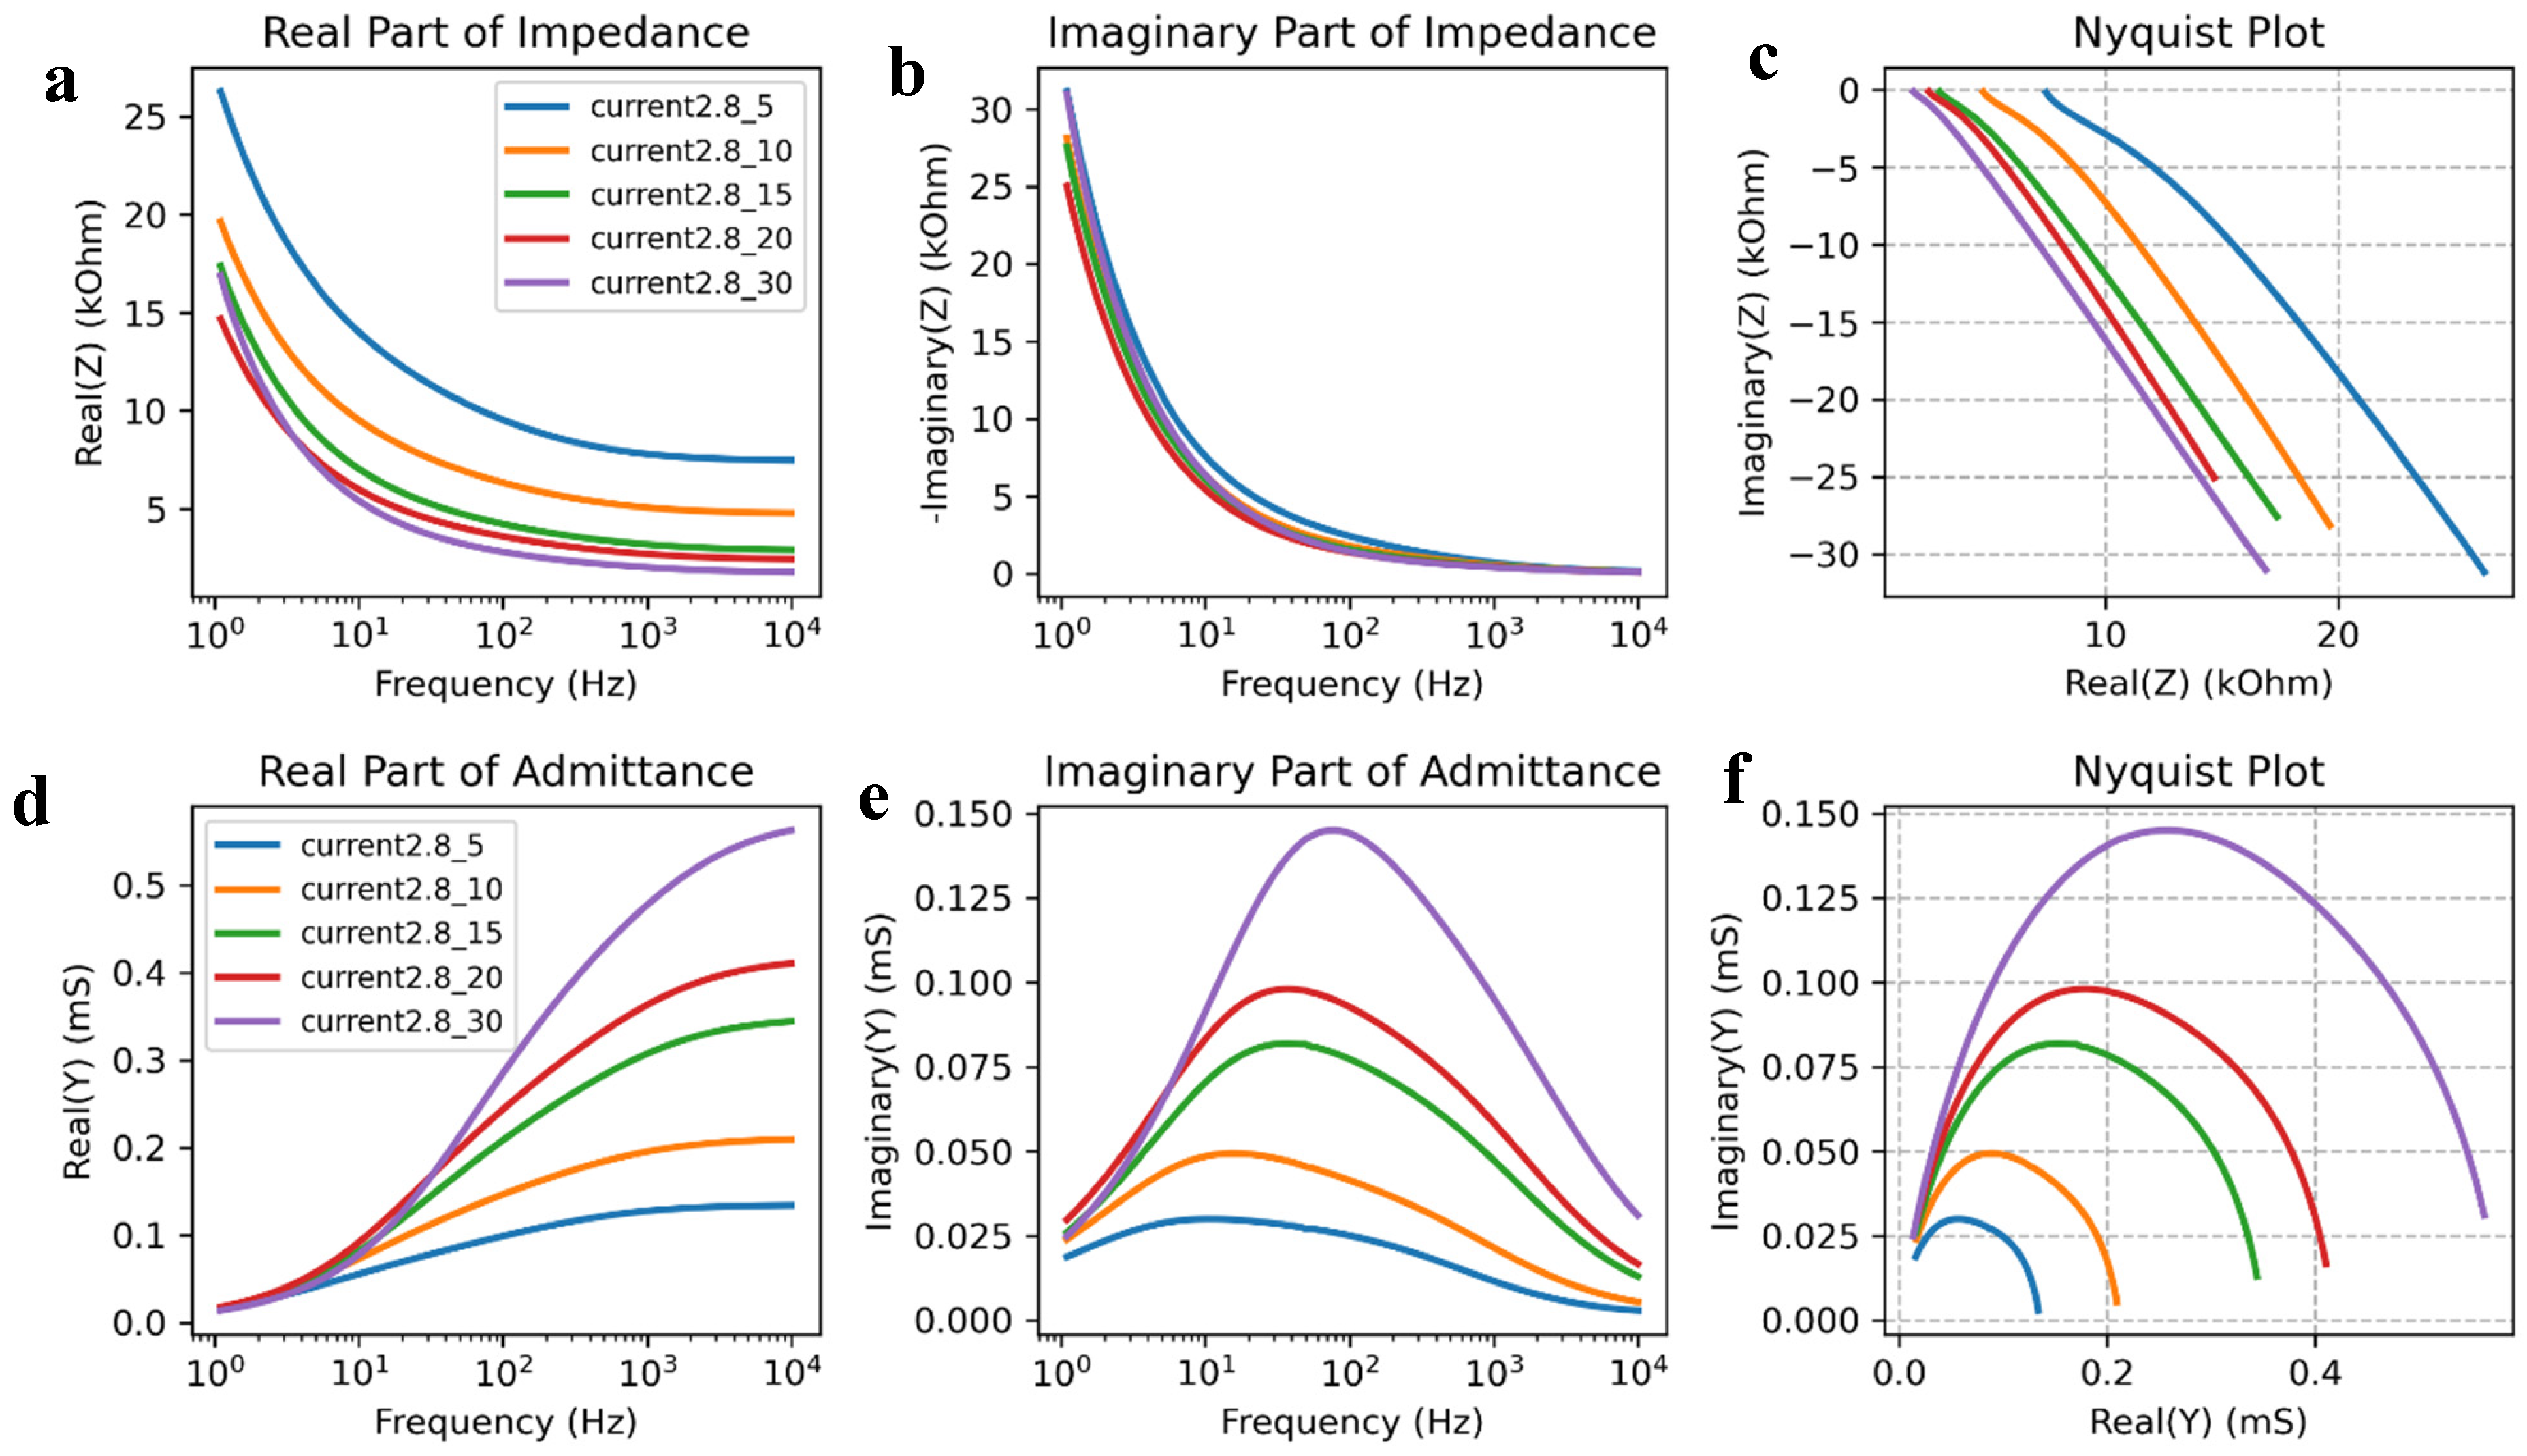
Physicochemical properties of the plasma-treated water were determined immediately after plasma exposure by electrochemical impedance measurements, followed by pH and conductivity analyses to quantify nitrite and nitrate concentrations in water. A deeper understanding of plasma–liquid interactions can be achieved by monitoring frequency-dependent electrochemical observables derived from impedance spectroscopy. In particular, characteristic frequencies and admittance features provide sensitive indicators of ionic migration and interfacial polarization processes induced by plasma-generated reactive species. As expected, at high frequencies the impedance response is primarily governed by the electrolyte resistance. Therefore, the impedance response becomes sensitive to interfacial polarization effects when the electrical contribution of the electrode–electrolyte interface becomes comparable to that of the bulk electrolyte. The following plots provide insights into how plasma exposure time influences both the dielectric behavior and the ionic conductivity of water. As the treatment duration increases, notable changes in both the resistive and capacitive components of the impedance are observed, reflecting the accumulation of reactive species and the modification of interfacial polarization dynamics. The real part of the admittance exhibits an increasing trend with frequency for all PTW samples (Figure 6d). Longer plasma treatment times (30 min) result in consistently higher real admittance values, indicating enhanced conductivity due to increased ionic content, especially at 2.8 A current of power supply. At lower frequencies, real (Y) values are smaller, as ionic movement is limited, and polarization effects dominate. This behavior confirms that plasma treatment increases the concentration of ionic charge carriers, predominantly nitrate (NO3−) and nitrite (NO2−), rendering the solution more conductive over the entire frequency range. According to Figure 6e, the imaginary part of admittance indicates the capacitive behavior of the system. From the Bode plots, the imaginary part of the admittance increases with frequency for all PTW samples, reflecting the growing contribution of capacitive currents. Samples treated for longer durations exhibit slightly higher Im(Y) values, indicating the development of a moderate dielectric response associated with plasma-induced polarization effects. The Nyquist plots (Figure 6f) of admittance exhibit a semicircular arc characteristic of a parallel RC-type response. With increasing plasma treatment time, the arc shifts toward higher real admittance values, indicating enhanced conductivity and reduced resistive losses. Although the imaginary admittance remains smaller than the real component, its gradual increase with treatment time indicates a growing influence of dielectric relaxation effects superimposed on a predominantly resistive response. The curvature becomes slightly broader with time, suggesting a small increase in dielectric relaxation effects. This pattern supports the idea that PTW is primarily resistive, with moderate capacitive behavior influenced by ion types, mobility, and total concentration. Consistently, a progressive decrease in impedance magnitude with increasing plasma treatment time is observed, in agreement with independently measured concentrations of H2O2, NO2−, and NO3−.
Figure 6.
Influence of plasma discharge current on the EIS response of PTW at 2.8 A for different treatment times: (a) real part of impedance; (b) imaginary part of impedance; (c) Nyquist plot of impedance, (d) real part of admittance; (e) imaginary part of admittance; (f) Nyquist plot of admittance.
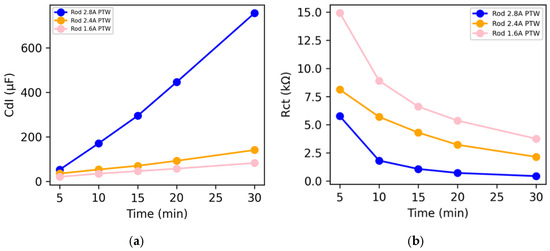
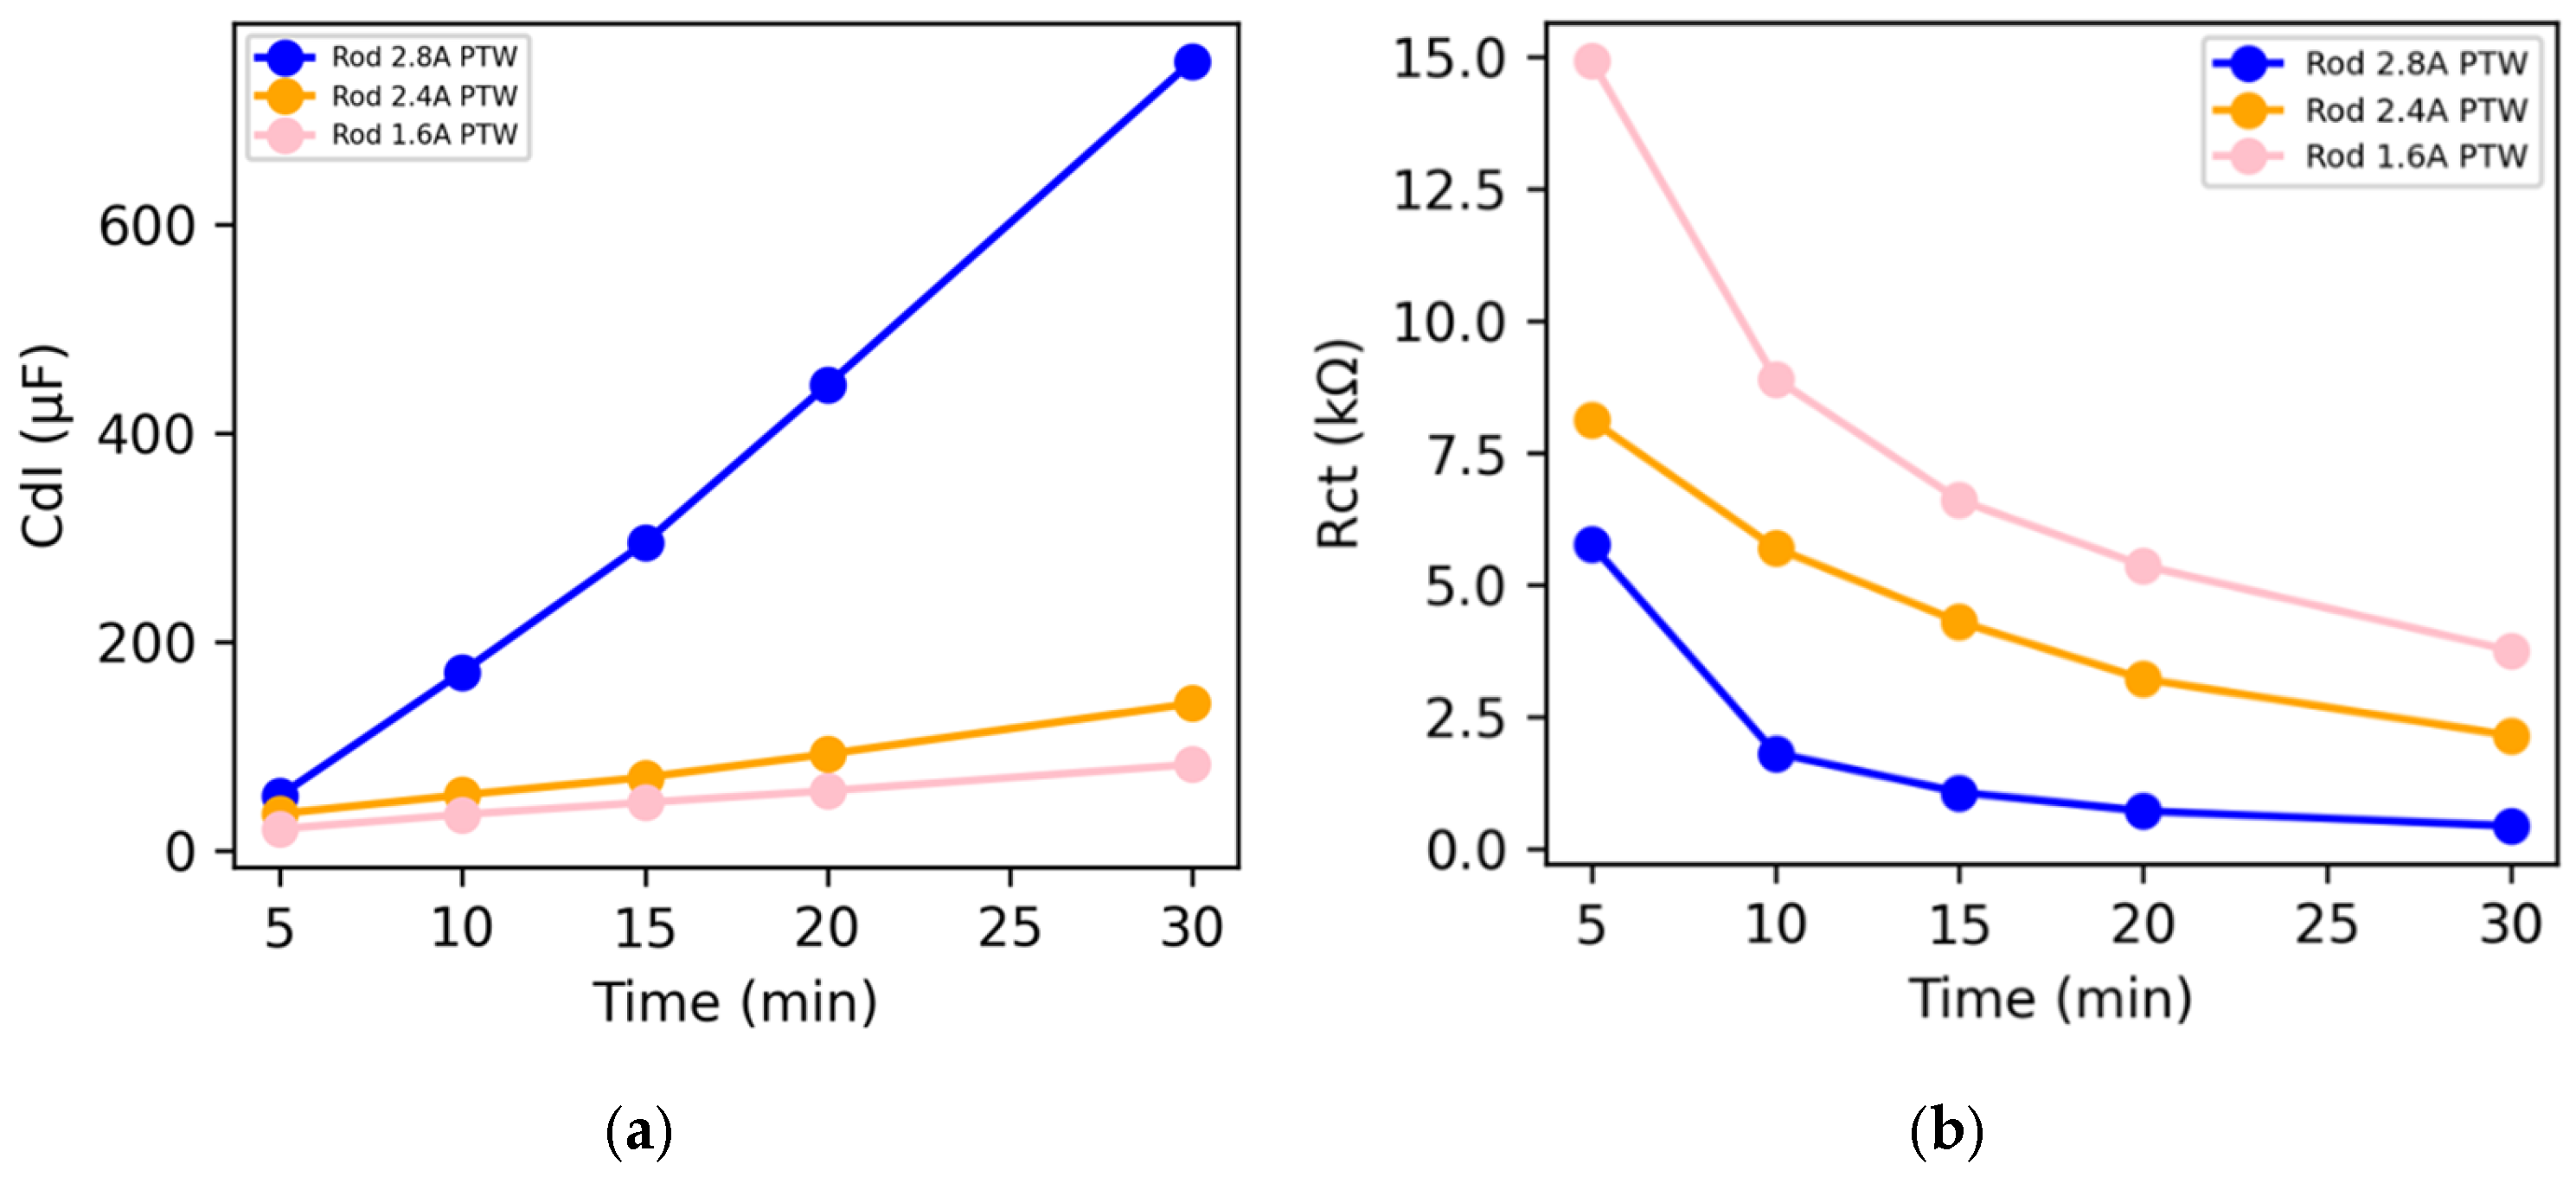
Figure 7a illustrates the evolution of the interfacial parameters extracted from the impedance spectra of plasma-activated water as a function of treatment time for different discharge currents. As shown in Figure 7a, the effective double-layer capacitance (Cdl) increases systematically with plasma exposure time for all investigated currents. This behavior indicates progressive modification of the electrode–electrolyte interfacial region during plasma activation. Plasma treatment generates increasing amounts of ionic and reactive species in deionized water, including long-lived nitrogen and oxygen ions, which increase the ionic strength of the solution. Higher ionic strength can reduce the effective Debye screening length and enhance interfacial charge accumulation, contributing to the observed increase in the effective capacitance-related electrical response. Plasma-generated species influence not only bulk ionic conductivity, but also interfacial polarization processes and electrical double-layer behavior at the interface between electrode and electrolyte. The stronger increase observed at the higher discharge current of 2.8 A, reaching approximately 700 µF, indicates faster interfacial modification due to more intense reactive species production and transport into the liquid phase.
Figure 7.
Evolution of (a) Cdl and (b) Rct with treatment time for PTW at different applied currents.
The corresponding evolution of the charge transfer resistance (Rct), shown in Figure 7b, exhibits a pronounced decrease with increasing treatment time. The reduction in Rct suggests that plasma-generated ions enhance ionic conductivity and facilitate electrochemical charge transfer processes. These interfacial changes are consistent with the accumulation of long-lived reactive oxygen and nitrogen species and are in agreement with independent conductivity and chemical measurements.
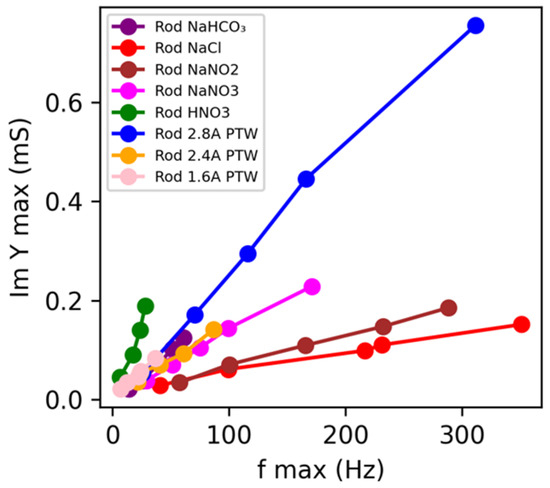
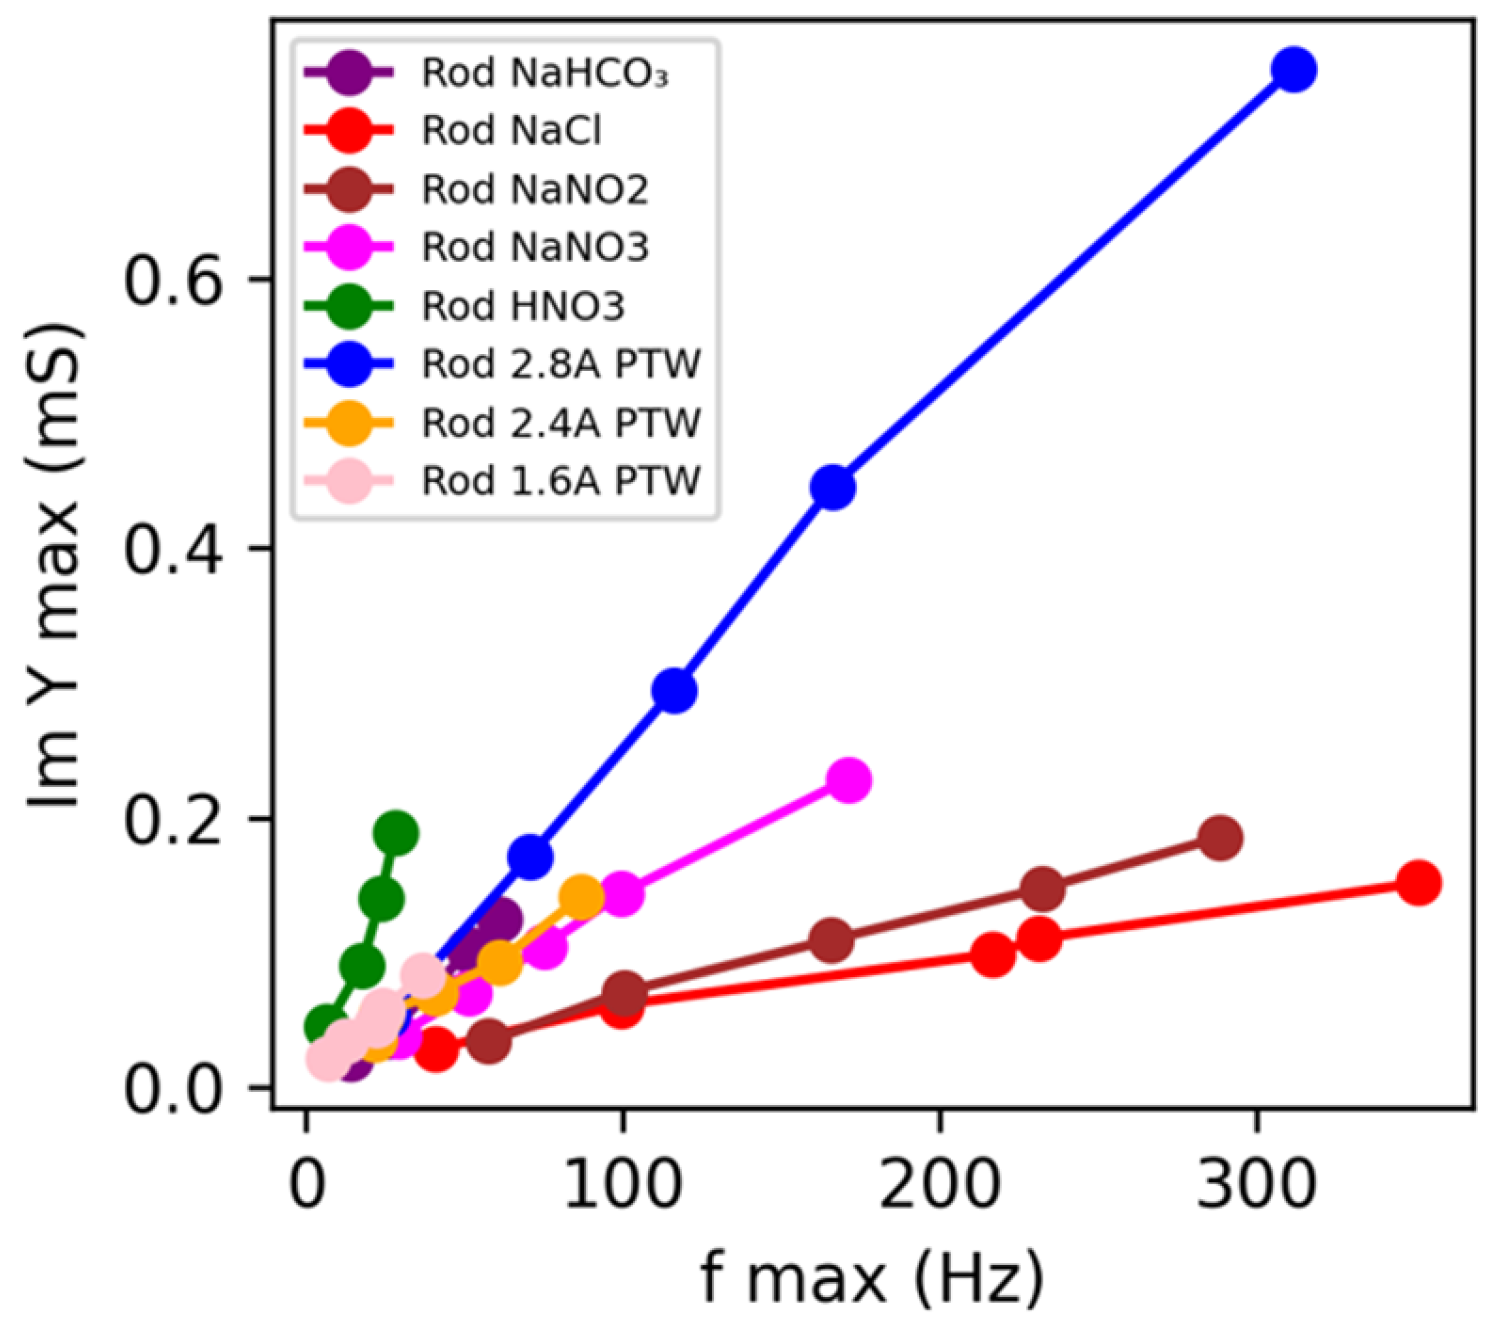
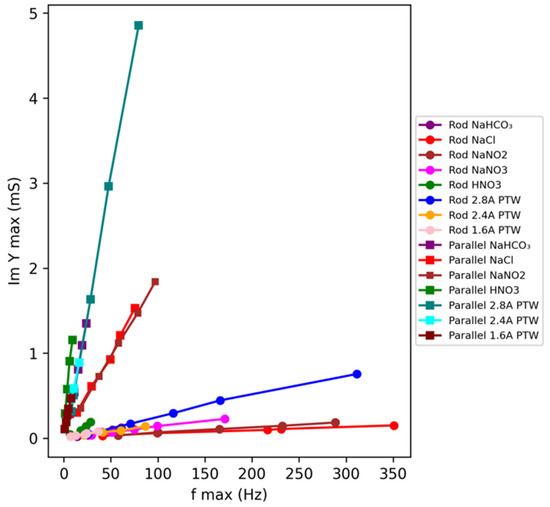
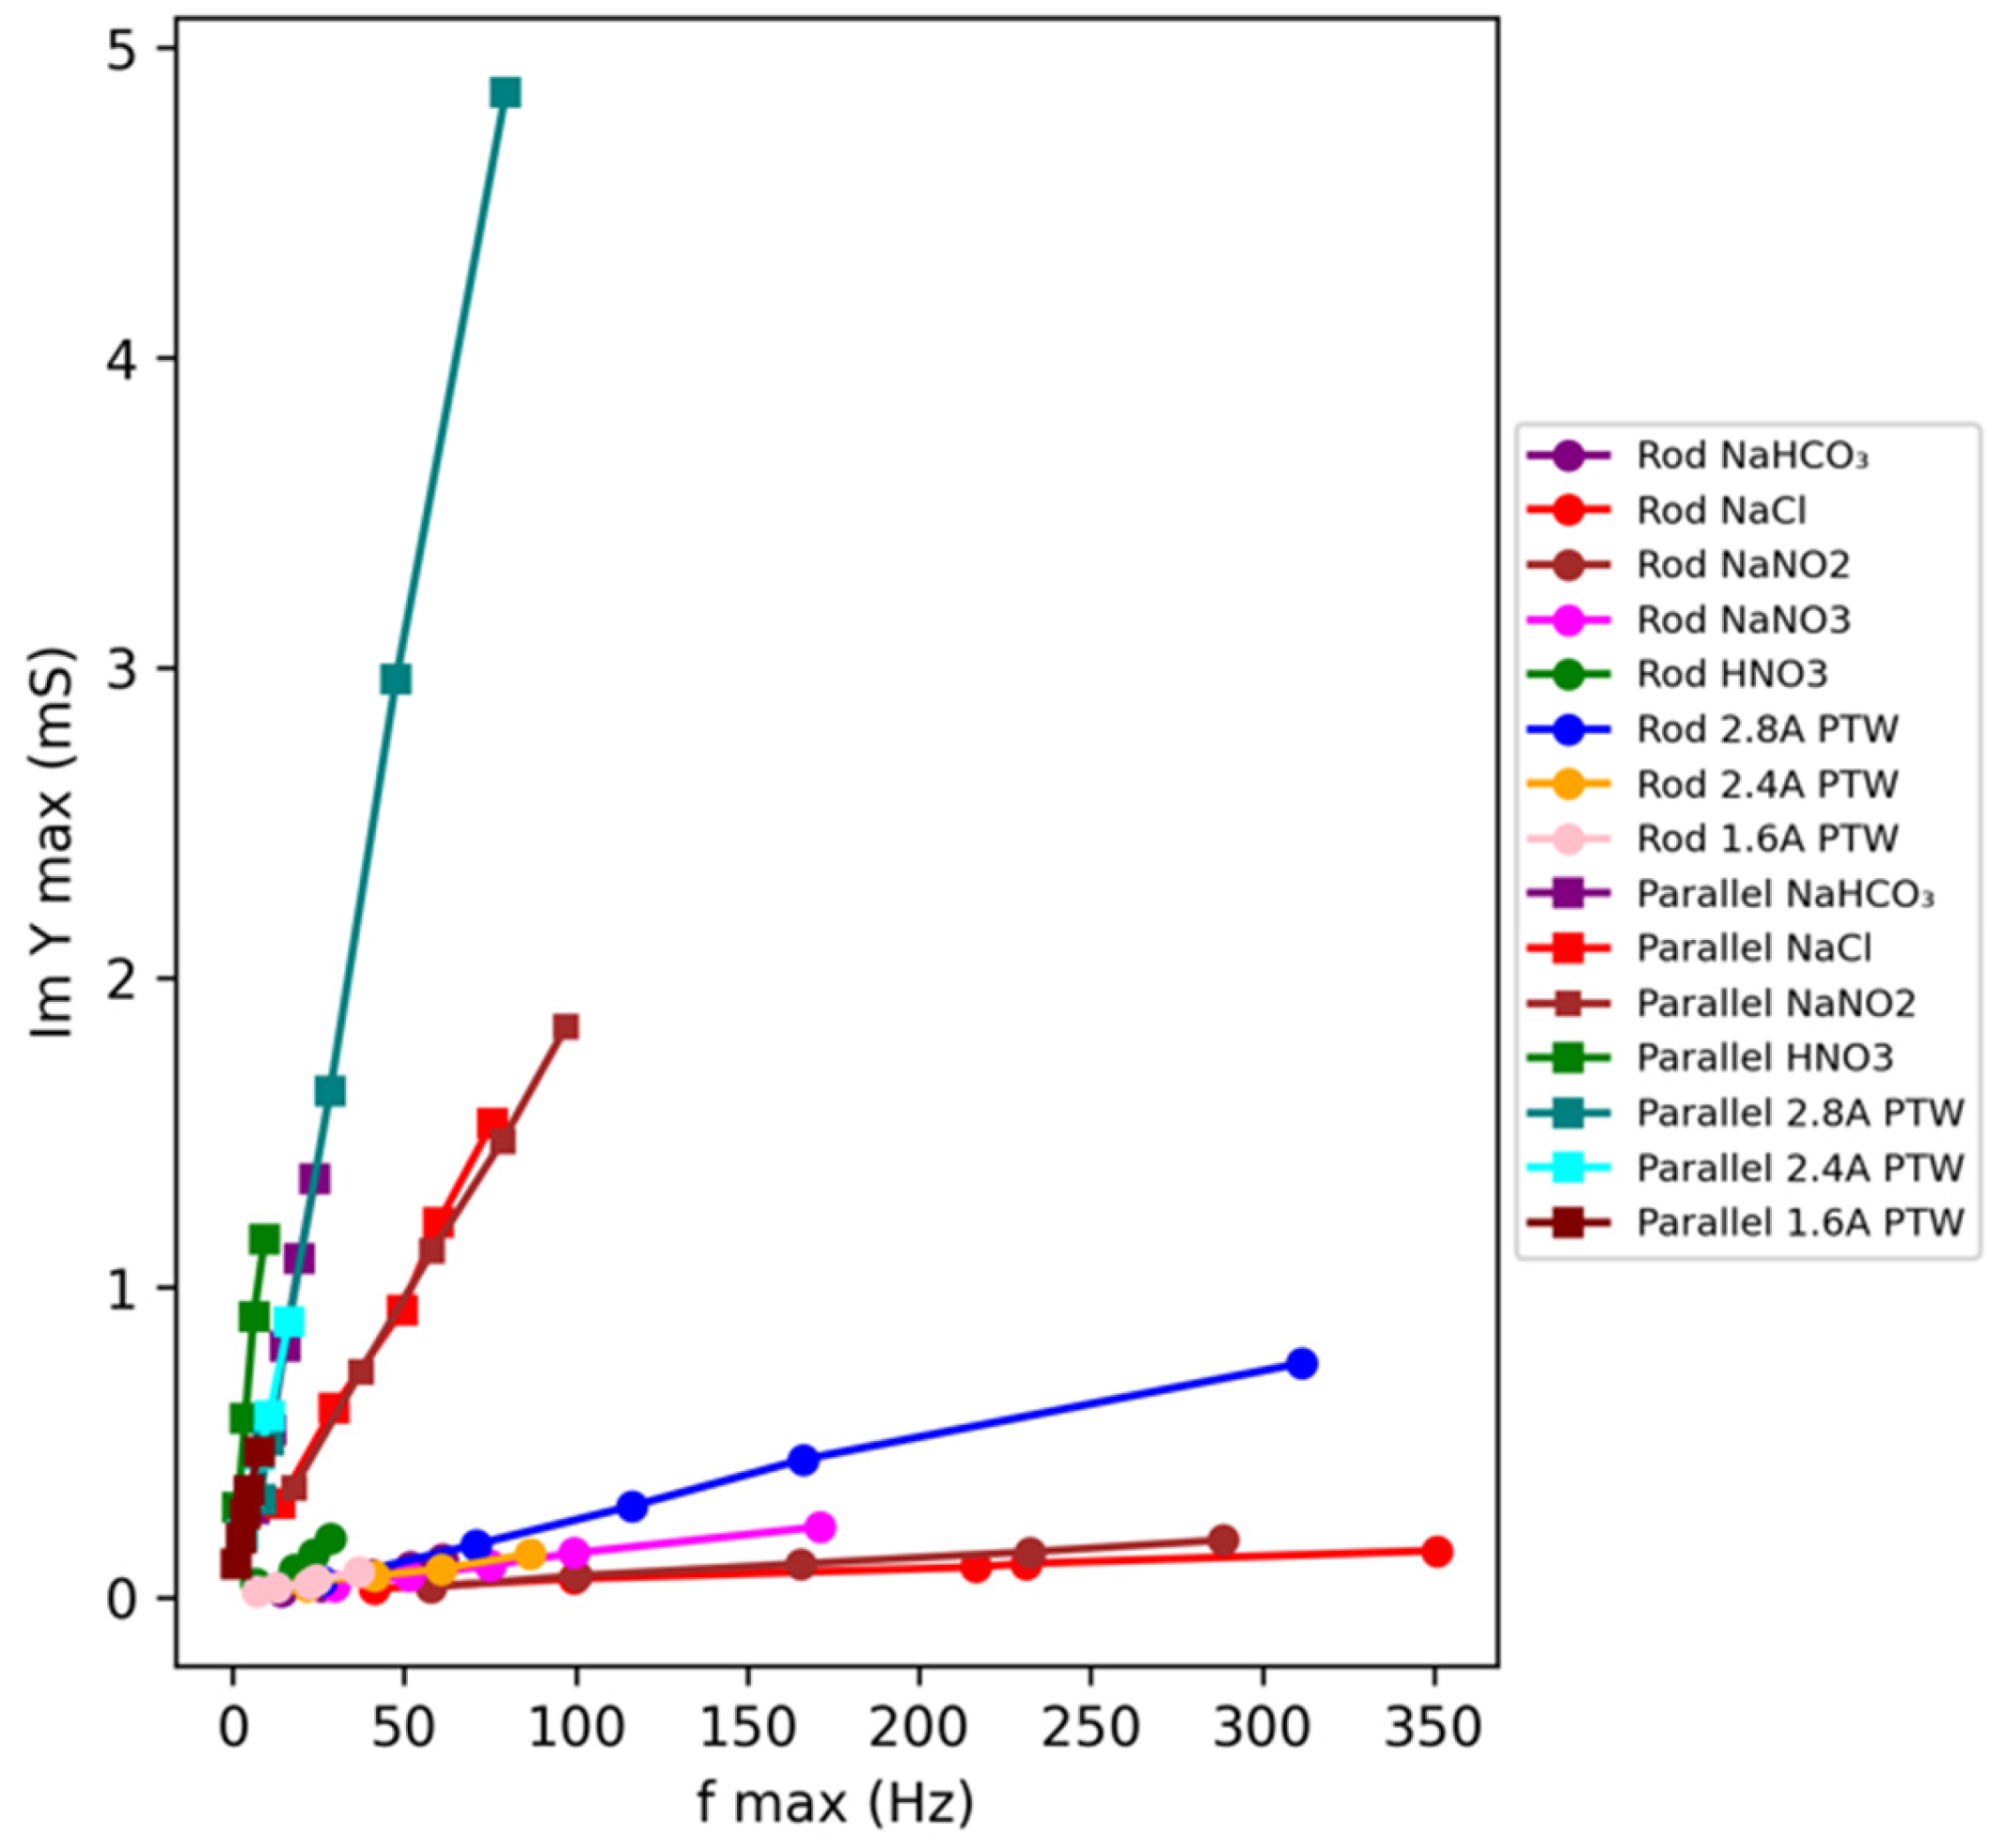
Figure 8 compares the characteristic impedance features of plasma-treated water with saline solutions and HNO3 measured using a linear rod electrode configuration. In the Im(Y)max − fmax representation, PTW data points lie between neutral saline solutions and nitric acid, exhibiting a trend closer to acidic electrolytes. This behavior indicates that plasma-induced acidification and nitrate/nitrite formation play a dominant role in defining the electrical signature of PTW.
Figure 8.
Linear plot of Im(Y)max as a function of fmax for rod configuration with different electrolytes and PTW treatment currents.
3.4. Impedance Characterization of Plasma-Treated Water with Parallel Electrodes
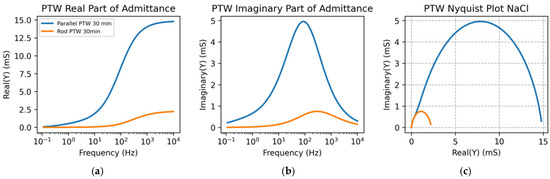
To investigate the influence of electrode geometry and effective surface area on the electrochemical response of PTW, impedance measurements were performed using both parallel plate and rod electrode configurations. The measured impedance response for parallel and rod stainless steel electrodes is shown in Figure 9. The real part and imaginary part of admittance illustrate that impedance decreased with an increase in plasma exposure and active surface area of the electrode in rod and parallel electrode configurations in the electrolyte for PTW at 2.8 A for 30 min of exposure time. Significant differences are observed in both the magnitude and frequency dependence of the impedance response. The reduction in the semicircle diameter observed in the Nyquist representation indicates a decrease in Rct when the effective electrode surface area increases [37]. The Bode representation of the imaginary admittance further supports this interpretation. The peak of the imaginary component shifts toward higher frequencies and increases in magnitude for geometries with larger surface area. Let us consider a simplified RC relaxation model describing the dominant interfacial process:
where R represents the effective resistance, and C represents the interfacial capacitance. The increase in peak frequency indicates a reduction in the characteristic relaxation time = τRC, primarily driven by a decrease in resistance. Increasing the interfacial surface area between working electrode and electrolyte reduces the electrode’s overall impedance, allowing a current source to deliver the same current with a lower applied voltage. In EIS measurements, this change is reflected as an increase in the peak frequency of the imaginary component, along with a higher maximum value. These observations indicate enhanced double-layer capacitance and faster charge-transfer dynamics at the electrode–electrolyte interface [38]. The differences between the two configurations are particularly pronounced in the low-frequency regime, where interfacial polarization effects dominate the response [39]. Electrodes with a higher interfacial surface area display distinct Nyquist impedance spectra compared to less active surfaces, typically with smaller semicircle features and modified low frequency behavior, reflecting improved charge transfer and capacitive processes at the interface [40].
ωmax = 1/RC
Figure 9.
(a) real plot of admittance, (b) imaginary plot of admittance, and (c) Nyquist plot of admittance in parallel and rod electrodes with increased active area for PTW at 2.8 A for 30 min.
To decouple the respective contributions of resistance and capacitance to the observed impedance changes, the peak value of the imaginary admittance (Ymax) and its corresponding peak frequency (fmax) were extracted and analyzed. In the RC circuit, the peak quantities satisfy YImax = 1/(2R) and ωmax = 1/(RC). Eliminating R leads to YImax = (C/2) ωmax, or equivalently YImax = π C fmax. Therefore, a linear relationship between YImax and fmax indicates an approximately constant effective interfacial capacitance. The resulting plot of YImax over fmax, obtained from the peak quantities of the admittance spectra is referred to here as the master plot. The experimental master plots (Figure 10) display linear trends for each electrolyte system and electrode configuration. The approximately linear behavior indicates that the dominant variation induced by plasma treatment arises from resistance changes associated with increased ionic content. However, differences in slope between electrode geometries and electrolyte compositions reveal variations in effective interfacial capacitance. Since the slope of the master plot is proportional to C, these differences indicate modifications in the double-layer structure effective interfacial area. It should be noted that the RC-based interpretation used in this work is intended as a simplified description of the main relaxation behavior observed in the system. In practice, the electrode–electrolyte interface in plasma-treated water is chemically complex and may deviate from ideal capacitive behavior due to surface heterogeneity, electrode roughness, and distributed interfacial relaxation processes. For this reason, a CPE was included in the equivalent circuit model instead of an ideal capacitor to account for non-ideal interfacial behavior. Accordingly, the extracted resistance- and capacitance-related parameters should be regarded as effective electrical descriptors useful for comparing different treatment conditions and electrode configurations, rather than exact physical quantities.
Figure 10.
Ymax vs. fmax with linear fits for different electrode geometries (parallel and rod).
These findings demonstrate that electrode geometry plays a critical role not only in modulating resistance, but also in shaping the capacitive response of plasma-treated aqueous systems. The master plot analysis provides a quantitative framework to distinguish between resistance-dominated and capacitance-dominated variations in the impedance response. The reduction is more significant for the parallel setup, confirming the dominant role of interfacial surface area in facilitating interfacial charge transfer. The linear relationship observed between Im(Y)max and fmax for all investigated electrolytes indicates that the dominant relaxation process can be described by an interfacial RC circuit, in which the bulk resistance is mainly governed by ionic concentration, while the effective interfacial capacitance remains nearly constant within concentration range. A CPE was used instead of an ideal capacitor to account for non-ideal interfacial behavior associated with surface inhomogeneity and distributed relaxation processes. Small departures from strict linearity are therefore attributed to distributed interfacial time constants captured by the CPE formulation.
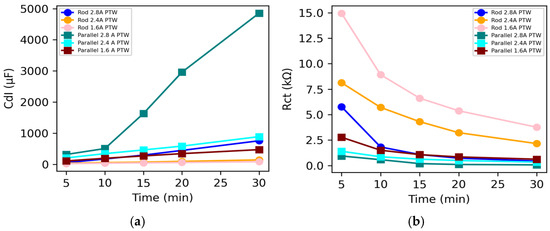
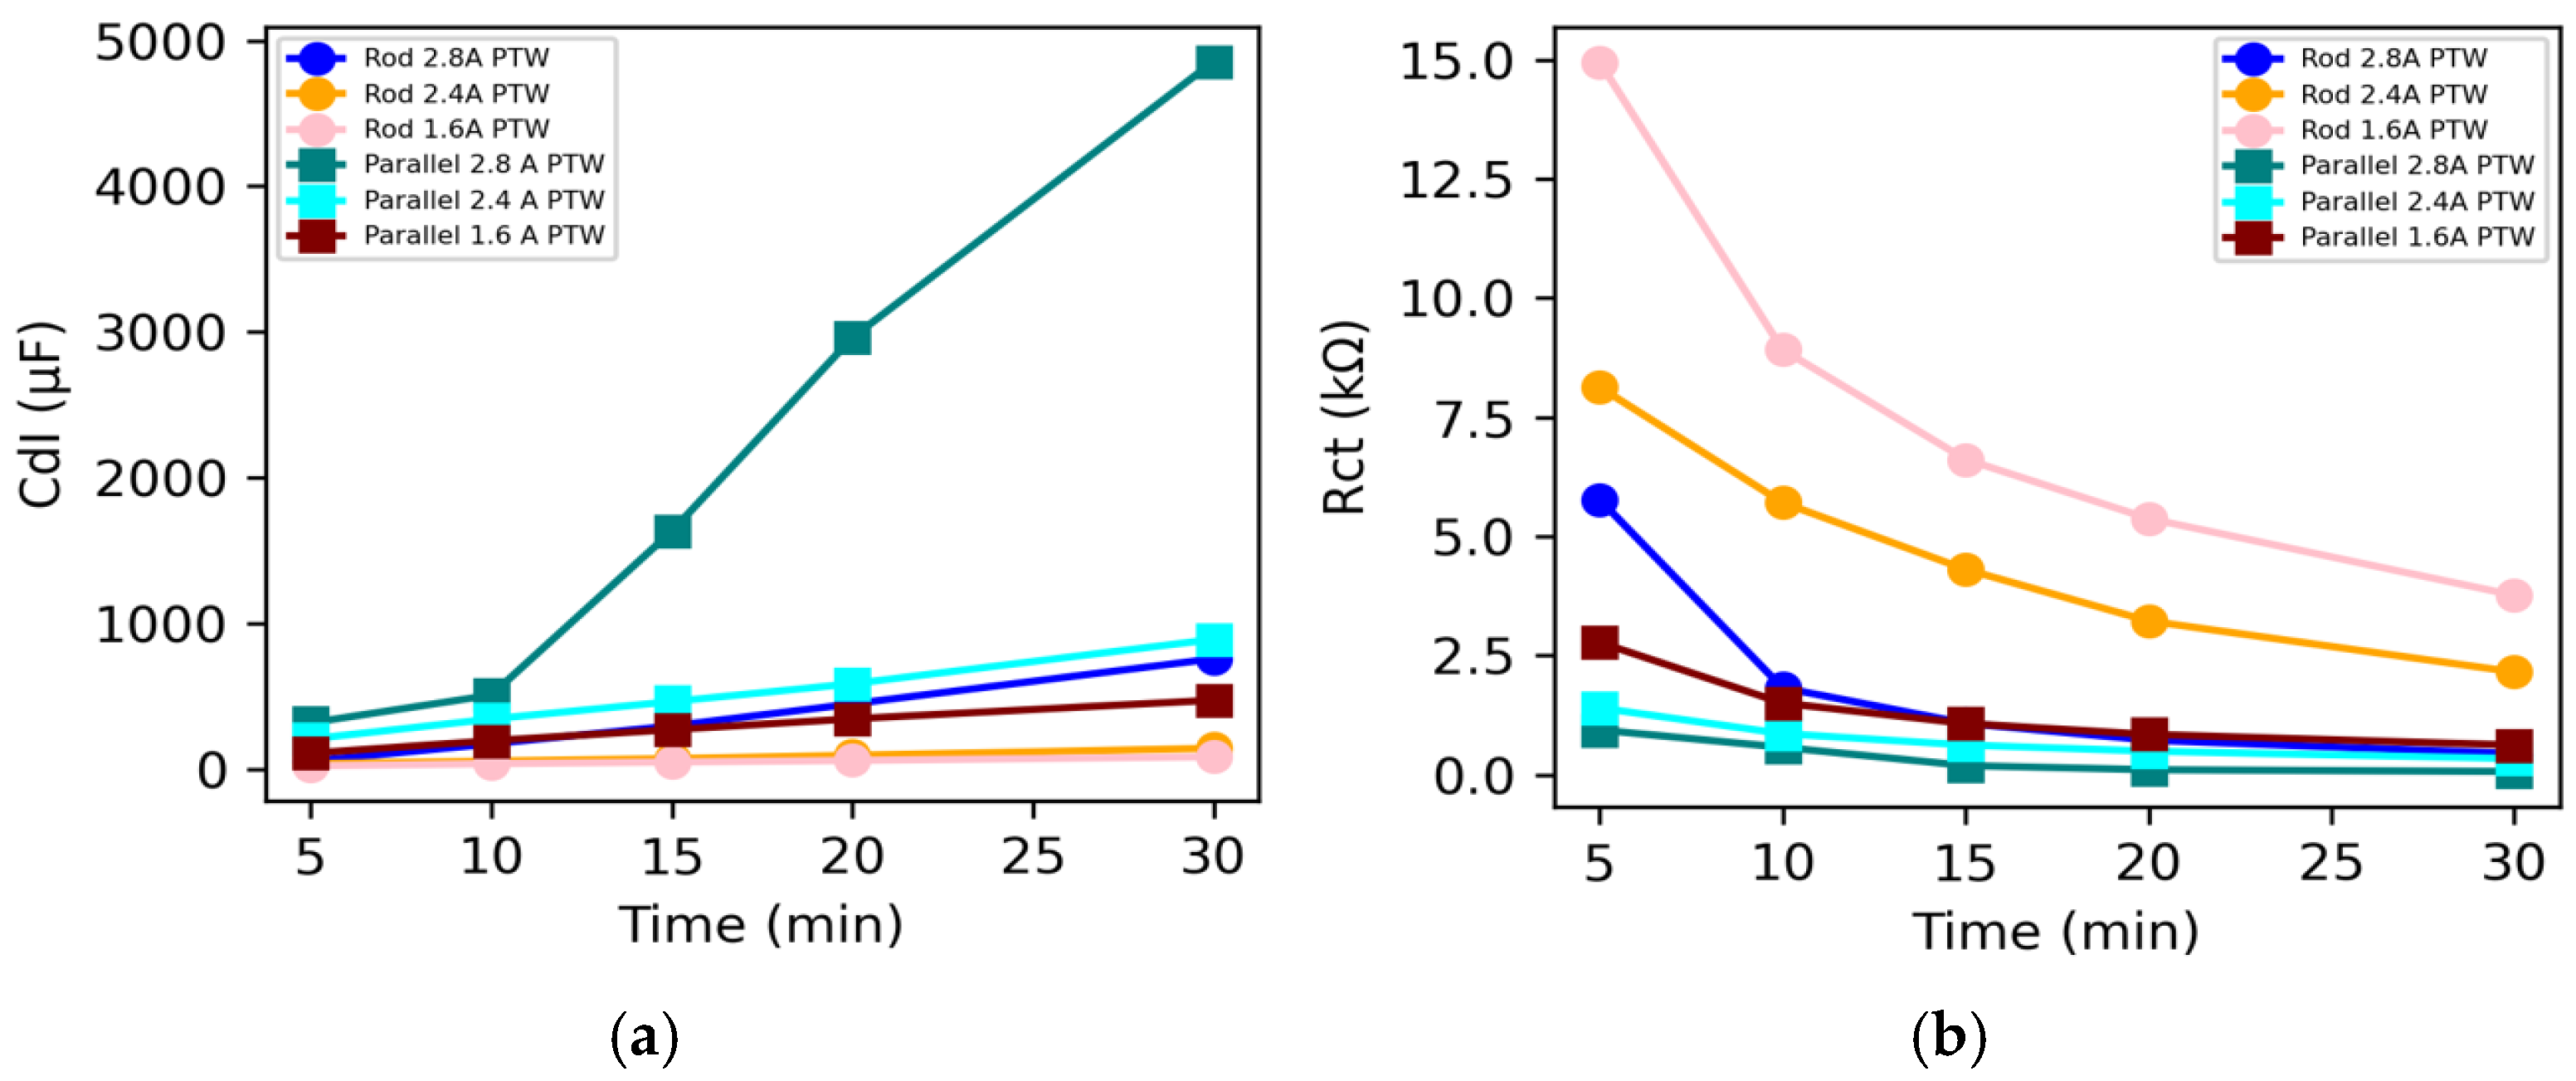
Figure 11a shows the evolution of the extracted Cdl as a function of plasma treatment time for both rod and parallel electrode configurations. The parameter labeled as Cdl was estimated from the fitted Im(Y)max and fmax and should be interpreted as an effective capacitance-related descriptor of the dominant interfacial electrical response rather than an exact physical double-layer capacitance.
Figure 11.
Evolution of (a) double-layer capacitance (Cdl) and (b) charge transfer resistance (Rct) as a function of plasma treatment time for rod and parallel electrode configurations at different applied currents.
A systematic increase in Cdl is observed with increasing exposure time, particularly at a higher discharge current of 2.8 A. This trend reflects the progressive enrichment of ionic species in the solution and the enhancement of interfacial charge storage capability. For a given treatment current, the parallel configuration exhibits significantly higher capacitance values compared to the rod geometry, consistent with its larger effective interfacial area. Figure 11b presents the corresponding variation of Rct. A pronounced decrease in Rct with increasing treatment time is observed for all configurations, indicating improved charge transport and enhanced ionic conductivity in plasma-treated water.
The simultaneous increase in Cdl and decrease in Rct confirms that plasma exposure enhances both the capacitive and the conductive properties of the system. The lower Rct and higher Cdl observed for the parallel configuration indicate that the larger exposed surface area enhances interfacial charge storage and facilitates charge transfer. These results indicate that the electrode geometry does not only change the impedance magnitude, but also modifies the interfacial contribution to the measured electrochemical response.
3.5. Evolution of pH and Electrical Conductivity in Plasma-Treated Water
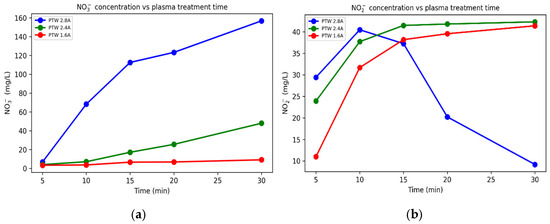
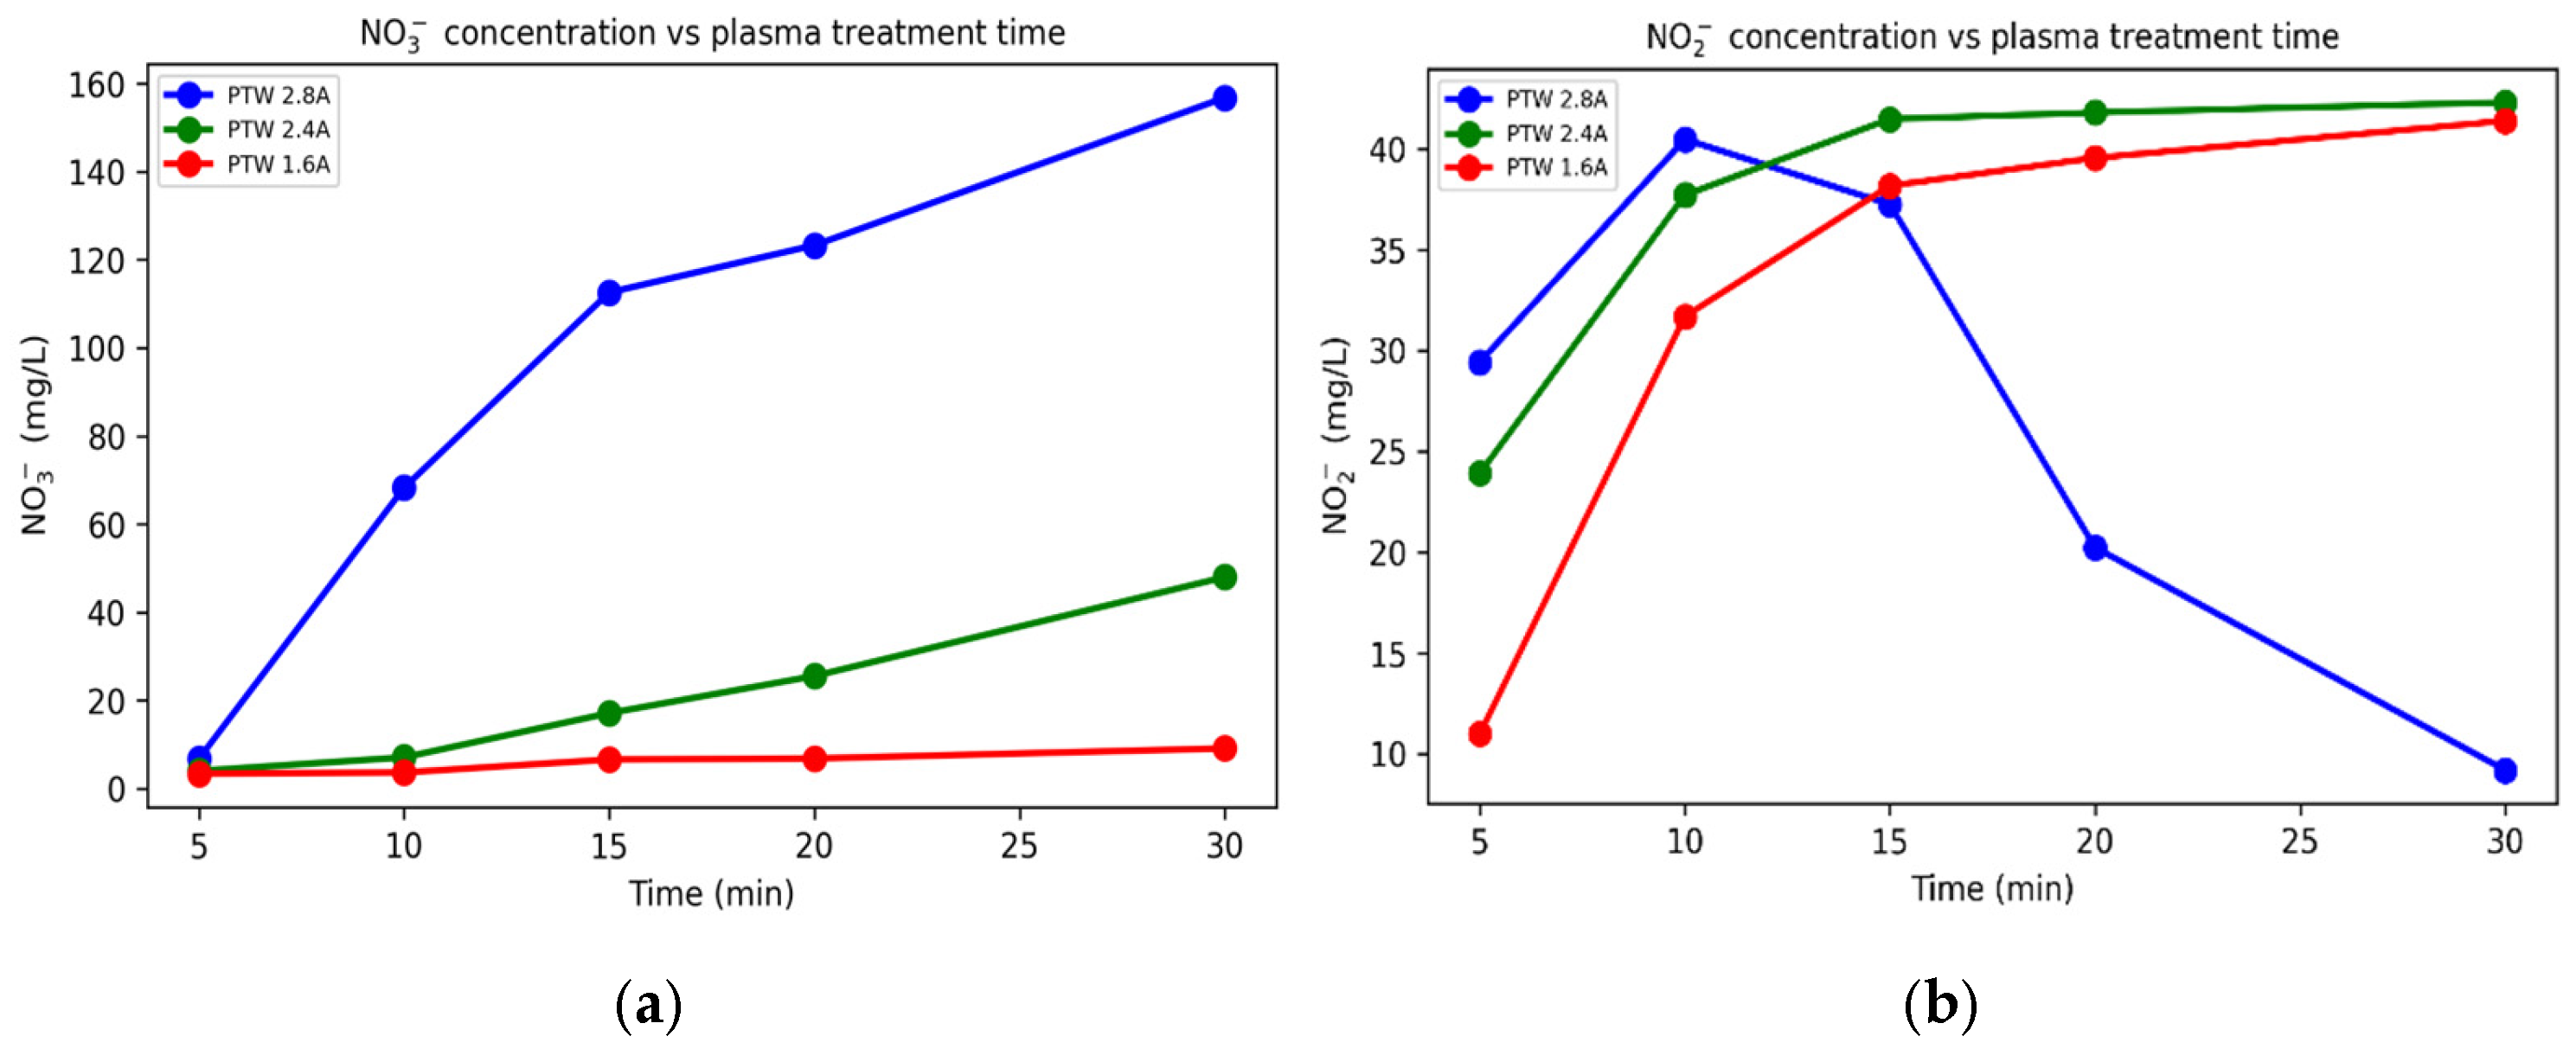
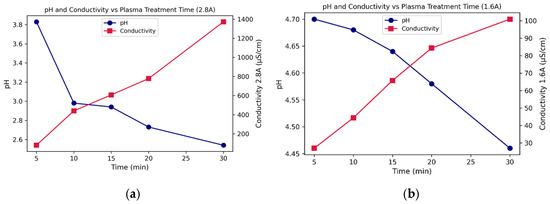
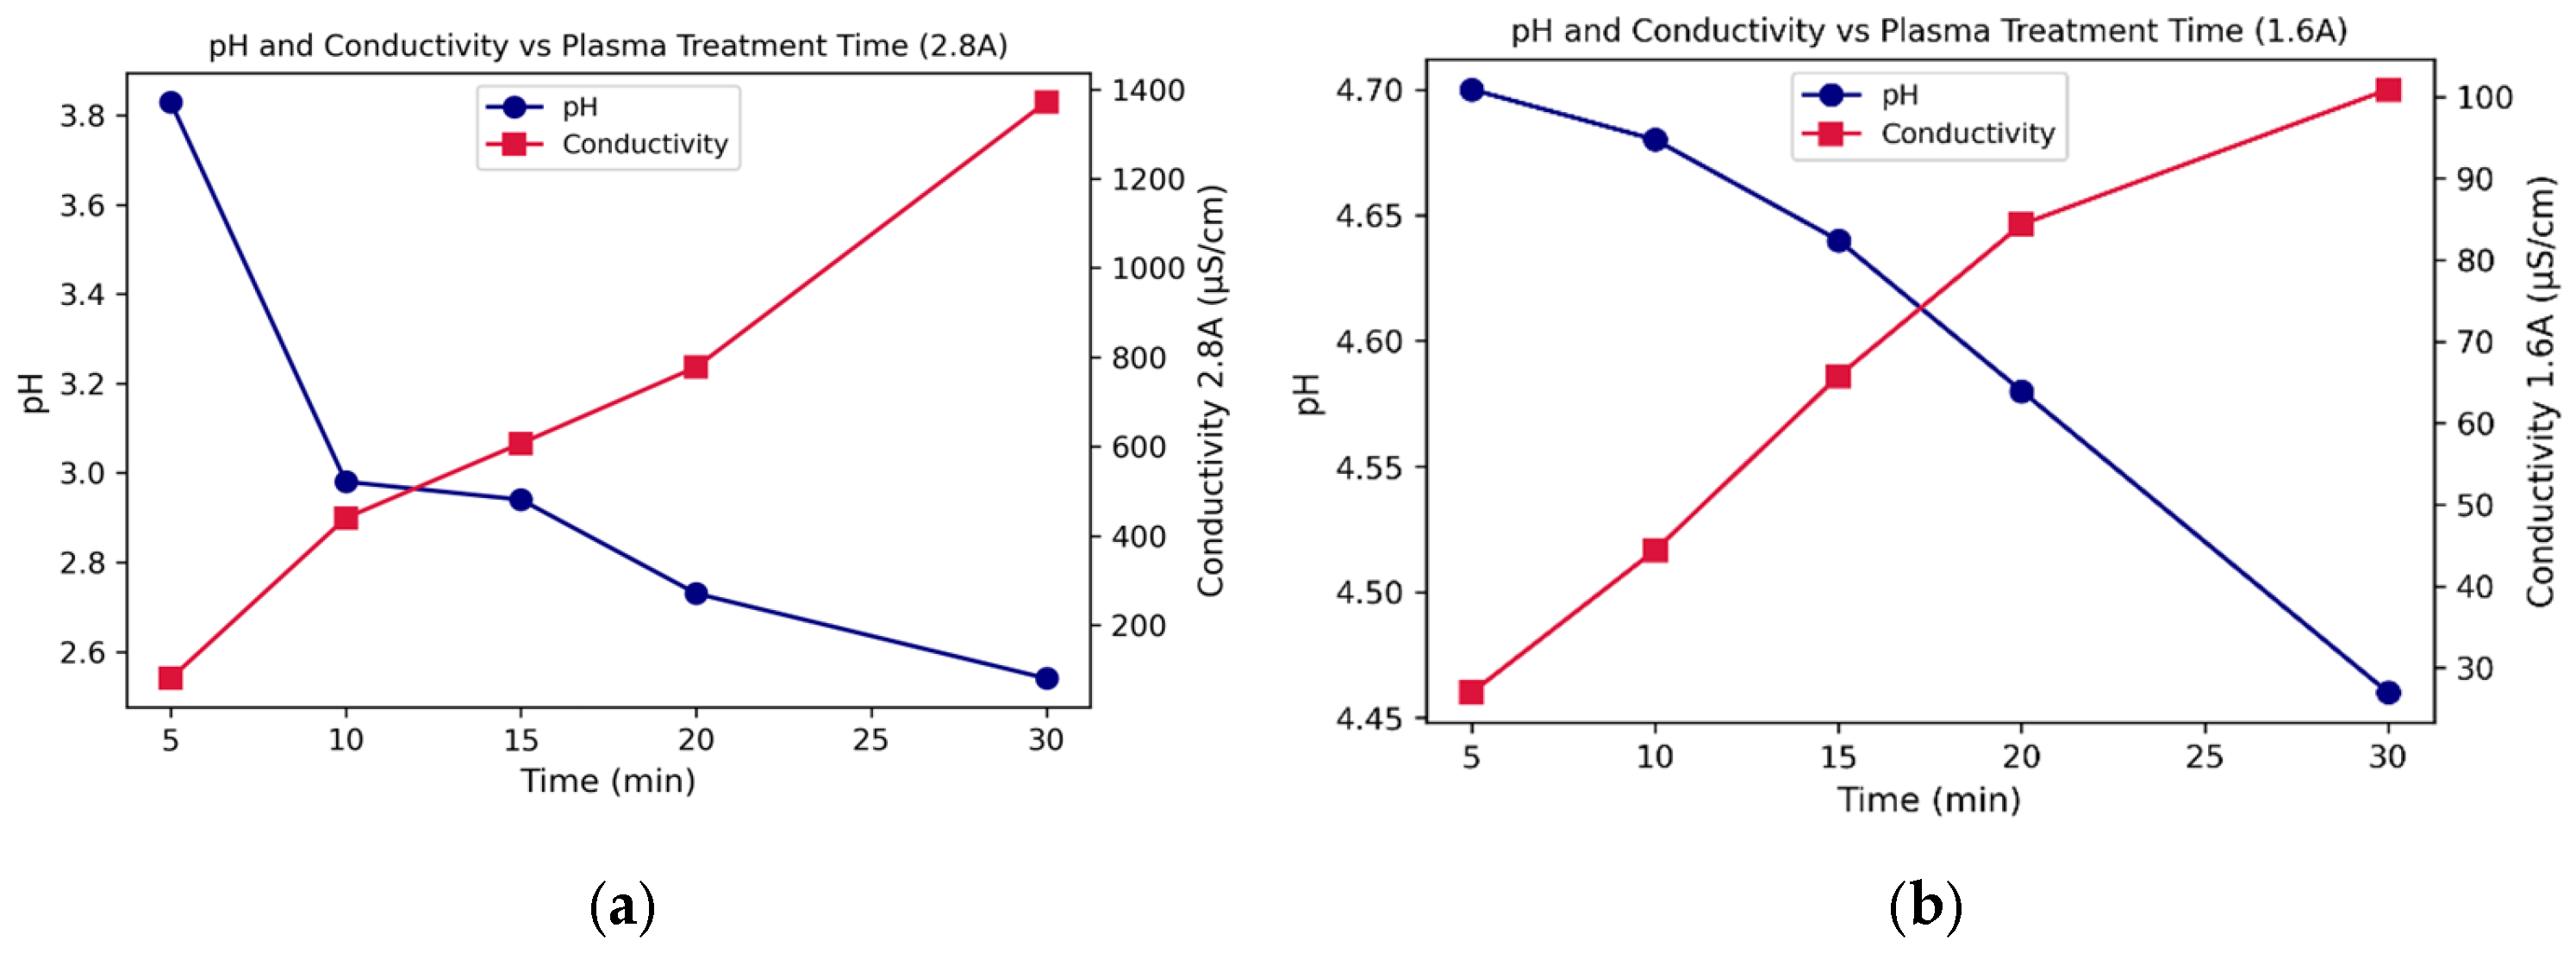
In the case of plasma-treated water (Figure 12 and Figure 13), the conductivity and pH are approximately monotonic, dependent on the treatment time. For all three different currents, the conductivity is increasing with time, while the pH is decreasing. This is directly connected to the production of RONS in PTW. The air plasma discharge generates short-lived RONS such as nitric oxide radical (NO∙), hydroxyl radical (∙OH), superoxide anion radical (∙O2−), atomic oxygen (O), and nitrogen ion (N2+). These short-lived RONS are transported into the liquid and produce more stable molecules, mainly hydrogen peroxide, nitrites, and nitrates. The concentrations of these stable RONS are dependent on the type of discharge, as well as treatment time. Generally, the concentrations of RONS increase with longer treatment time. The increased concentration of RONS is directly connected to the increase of conductivity and decrease of water pH. The concentrations of NO2− and NO3− ions change over time in a linear relationship with increasing plasma exposure time: especially, the concentration of NO3− increases sharply to reach 156.8 mgL−1 in PTW at 2.8 A (Figure 12a). The production of NO2− is also increasing linearly with the time of the treatment at 2.4 and 1.6 A of plasma, but it started to decrease to generate NO3− at higher plasma powers [41].
Figure 12.
Evolution of (a) nitrate (NO3−) concentration and (b) nitrite (NO2−) concentration as a function of plasma treatment time for different discharge currents (1.6, 2.4, and 2.8 A).
Figure 13.
Time-dependent variation in the pH and conductivity of plasma-treated water at discharge currents of (a) 2.8 A and (b) 1.6 A.
The concentrations of nitrate and nitrite ions shown in Figure 12 were independently determined using colorimetric measurements, while the pH and conductivity values shown in Figure 13 were measured using multimeter. The observed decrease in pH is primarily attributed to the formation of nitric and nitrous acids associated with nitrate and nitrite production (Figure 13). At longer treatment times, partial conversion of nitrite into nitrate may occur, particularly under acidic conditions, resulting in a relative stabilization or reduction of NO2− concentration. The simultaneous increase in electrical conductivity reflects the accumulation of ionic species in solution and provides a direct macroscopic indicator of plasma-induced chemical modification of water.
The interpretation of impedance behavior related to plasma-generated ionic species was supported by pH and conductivity measurements rather than impedance spectroscopy alone. Overall, the combined pH and conductivity measurements confirm the progressive acidification and ion enrichment of plasma-activated water with increasing plasma exposure. These chemical changes were consistent with the impedance spectroscopy results, which showed reduced solution resistance and enhanced conductance after plasma treatment. These measurements provide a chemical baseline for interpreting the frequency-dependent electrical response of plasma-treated water obtained by electrochemical impedance spectroscopy.
4. Conclusions
This work investigated whether electrochemical impedance spectroscopy can be used as a rapid and non-destructive tool to characterize plasma-induced ionic and interfacial electrical changes in water. Impedance measurements performed on simple electrolyte solutions at various concentrations and complex PTW demonstrated that impedance spectroscopy provides multidimensional electrical signatures governed by both bulk ionic transport and interfacial polarization processes. Comparative analysis among nitric acid, hydrogen peroxide, sodium nitrite, and sodium nitrate further demonstrates the sensitivity of the method to different ionic environments, demonstrating that EIS responds predominantly to ionic species rather than neutral molecular components. In plasma-treated water, the impedance response evolves toward an acidic-like regime, consistent with the formation of nitrate- and nitrite-containing ionic species, while deviations from pure acid behavior indicate the presence of a multi-ionic mixture. Plasma activation of water resulted in a substantial decrease in impedance and a corresponding increase in conductivity compared to untreated deionized water. The evolution of impedance spectra, together with extracted parameters such as bulk conductance, characteristic frequency, and interfacial capacitance, revealed progressive ion enrichment and enhanced interfacial polarization induced by plasma-generated reactive oxygen and nitrogen species. The electrical response of PTW showed closer similarity to acidic reference solutions than to neutral saline electrolytes, indicating that plasma-induced acidification and nitrate/nitrite formation play a dominant role in defining its impedance signature. In addition, the use of different electrode configurations demonstrated that electrode geometry and effective surface area significantly influence the sensitivity and characteristic time constants of impedance measurements, particularly in the low frequency range. Overall, these results confirm that the integration of EIS with conventional pH and conductivity measurements provides a sensitive, non-destructive approach for monitoring plasma-induced physicochemical modifications in water and for probing ion transport and interfacial dynamics in plasma–liquid systems, with potential applicability to real-time monitoring. In addition, the chemical environment of PTW is more complex than anticipated, with unidentified species potentially playing a significant role in its physicochemical characteristics. The deviation of PTW data from the calibration behavior of pure nitric acid suggests the presence of additional ionic species generated during plasma–liquid interactions. Although impedance spectroscopy does not directly identify specific ionic species, the calibration-based approach presented here allows correlation between impedance parameters and overall ionic activity through the overall electrical response. By establishing proper calibration curves, the plasma-induced changes in ionic content can be systematically correlated with impedance parameters, providing a practical and non-destructive method for assessing the overall ionic activity in plasma-treated water.
Author Contributions
Conceptualization, E.M.; methodology, S.K., H.A. and E.M.; software, S.K.; validation, S.K., H.A. and E.M.; formal analysis, S.K.; investigation, S.K., G.Z.S., L.Z. and M.J.; resources, C.R. and E.M.; data curation, S.K.; writing—original draft preparation, S.K.; writing—review and editing, S.K., H.A. and E.M.; visualization, S.K.; supervision, E.M. and H.A.; funding acquisition, C.R. All authors have read and agreed to the published version of the manuscript.
Funding
This work was supported by the National Plan for NRRP Complementary Investments (PNC, established with the decree-law 6 May 2021, n. 59, converted by law n. 101 of 2021) as part of the call for funding of research initiatives for technologies and innovative trajectories in the health and care sectors (Directorial Decree n. 931 of 6 June 2022, project n. PNC0000003-AdvaNced Technologies for Human-centrEd Medicine (project acronym: ANTHEM)). This work reflects only the authors’ views and opinions; neither the Ministry for University and Research nor the European Commission can be considered responsible for them.
Institutional Review Board Statement
Not applicable.
Informed Consent Statement
Not applicable.
Data Availability Statement
The data supporting the findings of this study are available from the corresponding author upon request.
Acknowledgments
The authors acknowledge the valuable technical support of Alessandro Baù and Alessandro Mietner.
Conflicts of Interest
The authors declare no conflicts of interest.
Abbreviations
The following abbreviations are used in this manuscript:
| RONS | Reactive oxygen and nitrogen species |
| PTW | Plasma-treated water |
| EIS | Electrochemical impedance spectroscopy |
| CAP | Cold atmospheric plasma |
| Rb | Bulk resistance |
| CH | Helmholtz capacitance |
| CdI | Double-layer capacitance |
| Im(Y)max | Maximum of the imaginary part of the admittance |
| fmax | Frequency at which the maximum of the imaginary part of the admittance occurs |
| Gm | Bulk conductance element |
| CPE | Constant phase element |
| Rct | Charge transfer resistance |
| Cdiff | Diffuse layer capacitance |
References
- Hou, Z.; Lin, L.; Lee, T.; Keidar, M. Adaptive Cold Atmospheric Plasma: Demonstration with In Vitro Cancer Treatment Experiments. ACS Omega 2025, 10, 46569−46592. [Google Scholar] [CrossRef] [Scilit]
- Benson, K.; Cramer, S.; Galla, H.J. Impedance-based cell monitoring: Barrier properties and beyond. Fluids Barriers CNS 2013, 10, 5. [Google Scholar] [CrossRef] [Scilit] [PubMed]
- Gerasimenko, T.; Nikulin, S.; Zakharova, G.; Poloznikov, A.; Petrov, V.; Baranova, A.; Tonevitsky, A. Impedance Spectroscopy as a Tool for Monitoring Performance in 3D Models of Epithelial Tissues. Front. Bioeng. Biotechnol. 2020, 7, 474. [Google Scholar] [CrossRef] [Scilit] [PubMed]
- Zhang, B.; Feng, L.; Yun, F.; Sui, X.; Gao, J. Electrical Impedance Spectroscopy in Agricultural Food Quality Detection. J. Food Process Eng. 2025, 48, 70085. [Google Scholar]
- Soumia, Z.; Dalal, H.; Mohamed, M.; Reddad, E.M. Impedance spectroscopy analysis of wastewater dewatering dynamics using super absorbent polymer: Sodium polyacrylate hydrogel. J. Mol. Liq. 2025, 422, 126874. [Google Scholar] [CrossRef] [Scilit]
- Miele, G.; Bellucci, S.; Cataldo, A.; Tinno, A.D.; Ferrigno, L.; Maffucci, A. Electrical Impedance Spectroscopy for Real-Time Monitoring of the Life Cycle of Graphene Nanoplatelets Filters for Some Organic Industrial Pollutants. IEEE Trans. Instrum. Meas. 2021, 70, 1503912. [Google Scholar] [CrossRef] [Scilit]
- Karnopp, J.; de Souza Barros, H.C.; Vieira, T.M.; Hasan, M.I.; Sagas, J.C.; Pessoa, R.S. Long-lived RONS effects on plasma-activated water physicochemical properties. J. Phys. D Appl. Phys. 2025, 58, 27. [Google Scholar] [CrossRef] [Scilit]
- Girard, P.M.; Arbabian, A.; Fleury, M.; Bauville, G.; Puech, V.; Dutreix, M.; Sousa, J.S. Synergistic Effect of H2O2 and NO2 in Cell Death Induced by Cold Atmospheric He Plasma. Sci. Rep. 2016, 6, 29098. [Google Scholar] [CrossRef] [Scilit]
- Yusupov, M.; Neyts, E.C.; Simon, P.; Bogaerts, A.; Berdiyorov, G.; Snoeckx, R.; van Duin, A.C.T. Reactive molecular dynamics simulations of oxygen species in a liquid water layer of interest for plasma medicine. J. Phys. D Appl. Phys. 2013, 47, 025205. [Google Scholar] [CrossRef] [Scilit]
- Ikawa, S.; Tani, A.; Nakashima, Y.; Kitano, K. Physicochemical properties of bactericidal plasma-treated water. J. Phys. D Appl. Phys. 2016, 49, 42. [Google Scholar] [CrossRef] [Scilit]
- Petkovic, J.; van de Wege, R.; Wubs, J.R.; van Rooij, O.J.A.P.; van Oorschot, J.J.; Huiskamp, T.; Sobota, A. Assessment of reactive species concentrations in plasma-treated water: A pH and conductivity-based method validated by absorption spectroscopy. J. Phys. D Appl. Phys. 2024, 57, 23. [Google Scholar] [CrossRef] [Scilit]
- Lukes, P.; Dolezalova, E.; Sisrova, I.; Clupek, M. Aqueous-phase chemistry and bactericidal effects from an air discharge plasma in contact with water: Evidence for the formation of peroxynitrite through a pseudo-second-order post-discharge reaction of H2O2 and HNO2. Plasma Sources Sci. Technol. 2014, 23, 015019. [Google Scholar] [CrossRef] [Scilit]
- Bruggeman, P.J.; Kushner, M.J.; Locke, B.R.; Gardeniers, J.G.E.; Graham, W.G.; Graves, D.B.; Hofman-Caris, R.C.H.M. Plasma–liquid interactions: A review and roadmap. Plasma Sources Sci. Technol. 2016, 25, 053002. [Google Scholar] [CrossRef] [Scilit]
- Oh, J.S.; Szili, E.J.; Ogawa, K.; Short, R.D.; Ito, M.; Furuta, H.; Hatta, A. UV–vis spectroscopy study of plasma-activated water: Dependence of the chemical composition on plasma exposure time and treatment distance. Jpn. J. Appl. Phys. 2018, 57, 0102B9. [Google Scholar] [CrossRef] [Scilit]
- Machala, Z.; Tarabova, B.; Hensel, K.; Spetlikova, E.; Sikurova, L.; Lukes, P. Formation of ROS and RNS in Water Electro-Sprayed through Transient Spark Discharge in Air and their Bactericidal Effects. Plasma Process. Polym. 2013, 10, 649–659. [Google Scholar] [CrossRef] [Scilit]
- Lazanas, A.C.; Prodromidis, M.I. Electrochemical Impedance Spectroscopy-A Tutorial. ACS Meas. Sci. Au 2023, 3, 162−193. [Google Scholar] [CrossRef] [Scilit] [PubMed]
- Chang, B.Y.; Park, S.M. Electrochemical impedance spectroscopy. Annu. Rev. Anal. Chem. 2010, 3, 207–229. [Google Scholar] [CrossRef] [Scilit] [PubMed]
- Magar, H.S.; Hassan, R.Y.A.; Mulchandani, A. Electrochemical impedance spectroscopy (EIS): Principles, construction, and biosensing applications. Sensors 2021, 21, 6578. [Google Scholar] [CrossRef] [Scilit]
- Randviir, E.P.; Banks, C.E. A review of electrochemical, impedance spectroscopy for bioanalytical sensors. Anal. Methods 2022, 14, 4602−4624. [Google Scholar] [CrossRef] [Scilit]
- Meddings, N.; Heinrich, M.; Overney, F.; Lee, J.S.; Ruiz, V.; Napolitano, E.; Seitz, S. Application of electrochemical impedance spectroscopy to commercial Li-ion cells: A review. J. Power Sources 2020, 480, 228742. [Google Scholar] [CrossRef] [Scilit]
- Iurilli, P.; Brivio, C.; Wood, V. On the use of electrochemical impedance spectroscopy to characterize and model the aging phenomena of lithium-ion batteries: A critical review. J. Power Sources 2021, 505, 229860. [Google Scholar] [CrossRef] [Scilit]
- Scott, D.W.; Alseiha, Y. Determining detection limits of aqueous anions using electrochemical impedance spectroscopy. J. Anal. Sci. Technol. 2017, 8, 17. [Google Scholar] [CrossRef] [Scilit]
- Boukamp, B.A. Guidance to solid state electrochemical impedance spectroscopy. Electrochem. Acta 2025, 537, 146892. [Google Scholar] [CrossRef] [Scilit]
- Brett, C.M.A. Electrochemical Impedance Spectroscopy in the Characterization and Application of Modified Electrodes for Electrochemical Sensors and Biosensors. Molecules 2022, 27, 1497. [Google Scholar] [CrossRef] [Scilit]
- Wang, S.; Zhang, J.; Gharbi, O.; Vivier, V.; Gao, M.; Orazem, M.E. Electrochemical impedance spectroscopy. Nat. Rev. Methods Prim. 2021, 1, 41. [Google Scholar] [CrossRef] [Scilit]
- da Silva, G.M.G.; Faia, P.M.; Mendes, S.R.; Araújo, E.S. A Review of Impedance Spectroscopy Technique: Applications, Modelling, and Case Study of Relative Humidity Sensors Development. Appl. Sci. 2024, 14, 5754. [Google Scholar] [CrossRef] [Scilit]
- Morozovska, A.N.; Eliseev, E.A.; Bravina, S.L.; Ciucci, F.; Svechnikov, G.S.; Chen, L.-Q.; Kalinin, S.V. Frequency dependent dynamical electromechanical response of mixed ionic-electronic conductors. Curr. Opin. Electrochem. 2026, 56, 101807. [Google Scholar] [CrossRef] [Scilit]
- Ahmed, R.; Reifsnider, K. Study of Influence of Electrode Geometry on Impedance Spectroscopy. Int. J. Electrochem. Sci. 2011, 6, 1159–1174. [Google Scholar] [CrossRef] [Scilit]
- Davis, K.; Dizon, A.; Alexander, C.L.; Orazem, M.E. Influence of geometry-induced frequency dispersion on the impedance of rectangular electrodes. Electrochem. Acta 2018, 283, 1820–1828. [Google Scholar] [CrossRef] [Scilit]
- Schalenbach, M.; Durmus, Y.E.; Tempel, H.; Kungl, H.; Eichel, R.A. Double layer capacitances analysed with impedance spectroscopy and cyclic voltammetry: Validity and limits of the constant phase element parameterization. Phys. Chem. Chem. Phys. 2021, 23, 21097. [Google Scholar] [CrossRef] [Scilit] [PubMed]
- Wade, T.; Malik, S.; Ives, L.; Catic, N.; Narayan, S.K. Purely electrical detection of electrolyte concentration through microfluidic impedance spectroscopy. Cell Rep. Phys. Sci. 2024, 5, 102133. [Google Scholar] [CrossRef] [Scilit]
- Hirschorn, B.; Orazem, M.E.; Tribollet, B.; Vivier, V.; Frateur, I.; Musiani, M. Determination of effective capacitance and film thickness from constant-phase-element parameters. Electrochem. Acta 2010, 55, 6218–6227. [Google Scholar] [CrossRef] [Scilit]
- Grossi, M.; Parolin, C.; Vitali, B.; Ricco, B. Electrical Impedance Spectroscopy (EIS) characterization of saline solutions with a low-cost portable measurement system. Eng. Sci. Technol. Int. J. 2019, 22, 102–108. [Google Scholar] [CrossRef] [Scilit]
- Zhang, L.; Dai, Y.; Li, C.; Dang, Y.; Zheng, R.; Wang, Z.; Wang, Y. Recent advances in electrochemical impedance spectroscopy for solid-state batteries. Energy Storage Mater. 2024, 69, 103378. [Google Scholar] [CrossRef] [Scilit]
- Bard, A.J.; Faulkner, L.R.; White, H.S. Electrochemical Methods: Fundamentals and Applications, 3rd ed.; John Wiley & Sons Ltd.: Hoboken, NJ, USA, 2022. [Google Scholar]
- Kumar, A.; Saini, V.K.; Aguilar, Y.H.; Reinecke, S.F.; Hampel, U. Characterization of reactive species in water induced by cold atmospheric air plasma: Experimental applications for industrial micropollutant removal from wastewater and seed germination. J. Environ. Chem. Eng. 2025, 13, 117263. [Google Scholar] [CrossRef] [Scilit]
- Rocha, P.R.F.; Schlett, P.; Kintzel, U.; Mailänder, V.; Vandamme, L.K.J.; Zeck, G.; Gomes, H.L.; Biscarini, F.; de Leeuw, D.M. Electrochemical noise and impedance of Au electrode/electrolyte interfaces enabling extracellular detection of glioma cell populations. Sci. Rep. 2016, 6, 34843. [Google Scholar] [CrossRef] [Scilit]
- Huang, J. Diffusion impedance of electroactive materials, electrolytic solutions and porous electrodes: Warburg impedance and beyond. Electrochem. Acta 2018, 281, 170–188. [Google Scholar] [CrossRef] [Scilit]
- Kim, S.; Polycarpou, A.A.; Liang, H. Enhanced-Ion Transfer via Metallic-Nanopore Electrodes. J. Electrochem. Soc. 2014, 161, 1475–1479. [Google Scholar] [CrossRef] [Scilit]
- Hoeben, W.F.L.M.; van Ooij, P.P.; Schram, D.C.; Huiskamp, T.; Pemen, A.J.M.; Luke, P.J.P.C. On the possibilities of straightforward characterization of plasma activated water. Plasma Chem. Plasma Process. 2019, 39, 597–626. [Google Scholar] [CrossRef] [Scilit]
- Li, Y.; Song, Z.; Zhang, T.; Xu, W.; Ding, C.; Chen, H. Spectral characteristics of needle array-plate dielectric barrier discharge plasma and its activated water. J. Spectrosc. 2021, 2021, 9771245. [Google Scholar] [CrossRef] [Scilit]

Disclaimer/Publisher’s Note: The statements, opinions and data contained in all publications are solely those of the individual author(s) and contributor(s) and not of MDPI and/or the editor(s). MDPI and/or the editor(s) disclaim responsibility for any injury to people or property resulting from any ideas, methods, instructions or products referred to in the content. |
© 2026 by the authors. Licensee MDPI, Basel, Switzerland. This article is an open access article distributed under the terms and conditions of the Creative Commons Attribution (CC BY) license.