1. Introduction
The release of various content on the web has become increasingly common due to the many projects undertaken in the past. The idea of open data, which allows for public access to data for various uses, is the key motivation behind these initiatives. It is believed that open data will benefit the public, businesses, and individuals, as it is seen as a driver of economic development, knowledge enhancement, and innovation [
1]. In a proposal for a directive of the European Parliament and of the Council on the reuse of public sector information (recast), estimated total value of public sector information could rise to 194 billion by 2030 [
2].
Government agencies are disseminating information from various domains, such as statistics, transportation, the environment, permits, licenses, budgets, geography, and the economy, to enhance transparency and engage civil societies [
3]. This initiative is referred to as Open Government Data (OGD). Data is made available through Open Data Portals (ODPs) to maximize its potential benefits. These portals are similar to digital libraries that offer catalogs and databases for organizing files. Each dataset published on the ODP is supported by metadata, which is structured descriptive information containing various details about the respective resource. The keys signify property names, while the values denote the information linked to those properties. Metadata is organized in the form of key value pairs.
Open data portals provide metadata-based search tools to facilitate data discoverability. Some of the most straightforward and user-friendly search options are based on the category and tags. Category-based search selects datasets that are linked to the same topic, whereas tag-based search provides more concentrated browsing based on the phrases used for the dataset’s description. However, incomplete or erroneous information hinders the effectiveness of the search process, yields only partial results, and makes it more difficult to locate facts. This problem is becoming increasingly apparent due to the amount of publicly available datasets and the growth of the ODP.
The quality of search results on open data portals depends on how complete the metadata entries are. Due to the increasing number of datasets on open data portals, inadequate metadata has a substantial impact on the discoverability, use, and reuse of datasets, particularly in cases when no classification is provided. Numerous studies indicate the importance of metadata for proper dataset discovery [
4,
5] and interpretation [
6]. Since then, improving metadata quality has received a lot of attention from the scientific community. However, several studies have shown that information is often missing [
7], which has led to the creation of techniques for filling in the missing metadata.
One approach to addressing the gaps in category information is to utilize the existing metadata, specifically the tags that can be used to categorize datasets. The Formal Concept Analysis (FCA) technique has proven its open data categorization capabilities by constructing concept lattices for each available category on an open data portal [
8]. These concept lattices act as a knowledge base for categorizing datasets based on the relevant tags that define them and outline a hierarchy of tag usage within an individual category. However, as the number of datasets on a portal increases, the variety of tags and their combinations used to describe the datasets also expands. Consequently, it is essential to update the knowledge base or parts of it, specifically the concept lattices for categories that have experienced significant changes, by incorporating new datasets with varying tags to maintain the accuracy of the categorization process over time. In such cases, the high computational cost of knowledge processing is a significant obstacle in practical FCA implementations. The task of creating concept lattices that are appropriately sized and structured to represent crucial contextual features continues to be a major objective in FCA [
9,
10]. Numerous methods for reducing concept lattices have been discussed in existing literature [
11] and their usage has facilitated FCA application in various fields of data science. Nevertheless, the question of durability, usability, and efficiency of the reduced concept lattices for the task of the categorization remains open for evolving metadata environments such as open data portals.
In this research, we analyze the usability and efficiency of the semantically reduced concept lattices for the task of open data categorization in open data portals with evolving metadata. Since, in this case, concept lattice acts as a knowledge base for categorizing datasets, our analysis is focused on measuring the usability and efficiency of knowledge bases generated from data originating from different periods of time. The measurements are performed by evaluating the precision of the FCA-based categorization algorithm [
12], resulting in a twofold contribution:
Determining the influence of a reduction threshold on the knowledge base durability and usability.
Discovering a set of metadata volume and structure change indicators that impose knowledge base recreation.
In order to perform an in-depth analysis of the long-term usability of the reduced concept lattices, it is essential to evaluate their behavior across portals with different dataset categorization approaches, particularly regarding the number of categories that may be assigned to a single dataset. Accordingly, this study utilizes two national open data portals with contrasting categorization approaches: Ireland’s open data portal that assigns only one category per dataset, and Canada’s open data portal that assigns multiple categories per dataset. Datasets from Ireland and Canada ODPs across 2020, 2021, and 2023 are used to construct knowledge bases with different reduction thresholds, while six derived test datasets per portal, capturing newly available data across different year intervals (from 2020 to 2025), are used for categorization purposes.
2. Related Work
2.1. Open Data—Metadata Usage
The goal of the open data movement is to encourage the reuse of public sector data by making it publicly accessible online [
13]. The ultimate benefit might be enormous, despite the initial objective being rather modest. The quantity of publicly available data has grown dramatically in the past 20 years. The market potential for strategic planning, cost reduction, and productivity would reach billions of dollars if this data could be utilized properly [
14].
Open data is typically made accessible for consumption through so-called “one-stop-shop” ODPs, which centralize data from heterogeneous sources. Users may visually identify and use data through the ODP’s user interface, or developers can utilize it to create specialized applications for open data analysis and reuse. In most cases, ODPs are based on open-source platforms like Drupal Knowledge Archive Network (DKAN) or Comprehensive Knowledge Archive Network (CKAN), while some utilize proprietary software like Opendatasoft or Socrata [
15]. When it comes to developers’ use of open data, the dataset format that is accessible through APIs is more important than the platform itself. The structure of the dataset is not intended for human reading but rather for machine processing. It depends on metadata, which is similar to DNA for data—basic, useful components that define the purpose and content. Open data portals mostly rely on the Data Catalog vocabulary (DCAT) [
16,
17]. Consequently, datasets accessible through APIs share a consistent structure across several metadata keys, such as title, description, groups, publisher, tags, resources, and so on. These keys may be used for several purposes, including programmatically exploiting datasets, analyzing and comprehending datasets to uncover hidden information.
Maintaining high-quality data and related metadata is crucial as the quantity and diversity of data sources grow [
5]. End consumers are not interested in poorly explained data, as it is unable to provide new value for them. Poorly described data impacts both the integration with other datasets across portals as well as the discovery and consumption of a dataset inside a single portal [
18]. Thus, we may designate data harmonization—which entails conforming data to open data publishing standards—as the most crucial stage prior to releasing open data. The eight open government data principles outline the fundamental characteristics of data that must exist for it to be classified as “open” [
19]. The openness qualities of datasets cannot be automatically determined without values for metadata keys like organization, group, or tags.
For data segmentation and quality assessment, a number of meta-keys are employed, but groups and tags are among the most crucial. Groups combine data under a certain subject or category, whereas tags are mostly used to quickly search and retrieve related datasets. Thus, both are meant for dataset consumers. The process of tagging datasets is fraught with issues including synonyms, incoherence, misspellings, and ambiguity [
20], which impede the datasets’ findability.
The manual tag creation process is laborious and prone to human mistakes, as tags may not always be correct or pertinent to the dataset in question [
21,
22]. Furthermore, because tagging is time-consuming and one of the obstacles to data openness, publishers may completely ignore it [
19]. Although tags can appear to be a trivial aspect, the present practice demonstrates that OGD portals, especially “trend-setters” like the Estonian open data portal, sometimes struggle with both their presence and relevance to the actual dataset [
23]. Search engines are unable to use semantic relations across datasets because values for metadata keys frequently indicate provenance information rather than concepts from the reported dataset’s domain [
24].
Since metadata keys and values impact how datasets are understood and used, it is crucial to maintain them continuously. Cleaning and reconciling metadata, then using common metadata values across ODPs, would be the solution to this issue. Formal Concept Analysis (FCA) has proven its value for determining the similarity of metadata usage and open data portal metadata alignment [
25]. In the context of open data portals, FCA generates knowledge structures that have been successfully used for metadata alignment by taking advantage of semantic similarity among existing metadata values. Still, FCA results, e.g., knowledge structures, depend on the actual metadata values (groups, categories, tags), which raises the question regarding their durability. Open data portals are evolving metadata ecosystems and the usability of knowledge structures generated at a particular point of time in such a system should be investigated.
2.2. Formal Concept Analysis in a Nutshell
Rudolf Wille formalized Formal Concept Analysis (FCA) in 1982 [
26], presenting it as a lattice theoretic method (sometimes nicknamed “applied lattice theory”) for building concept hierarchies and extracting key relationships. Its information-preserving property led to rapid popularity in data analysis, albeit at the expense of potentially significant computational resources. A core step in the Formal Concept Analysis (FCA) process is examining the relationships between objects and their attributes within a specific domain. These relationships are captured in a binary table known as a formal context—essentially an object-by-attribute matrix where rows represent objects, columns represent attributes, and a cross (or 1) in a cell indicates that the object possesses that attribute. When FCA is applied to this formal context, it generates sets of objects and attributes that embody the domain’s knowledge. These sets are then organized into a concept lattice, which visually reveals various rules, implications, and connections.
The following definitions constitute the foundation of FCA formal description:
Definition 1 ([
26])
. A formal context is a triple which consists of a set G of objects, a set M of attributes, and a binary relation .
is read as “object g has attribute m”. Definition 2 ([
26])
. For A G, let
, and dually, for B
M, let .
If the following conditions are met: , then a pair (A, B) is a formal concept. Set A is named concept extent while set B is named concept intent.
Definition 3 ([
26])
. The set of all concepts of a formal context C together with a partial order (which is equivalent to ) is a complete lattice of C. FCA is considered as a data analysis method based on the usage of the relationship between a particular set of objects and a particular set of attributes. In most cases, an incidence matrix is used to visualize the relationship between these two distinct sets. Thus, an incidence matrix visualizes a formal context. An example of formal context visualization is given in
Table 1 where airlines of the Star Alliance group represent the set of objects, while the attribute set contains their destinations [
27]. Each row within the incidence matrix represents an object, each column represents an attribute while matrix field values (usually bool or yes/no values) denote the relationship between object and attribute. In the case of formal context presented in
Table 1 incidence matrix describes which destinations are served by which Star Alliance member.
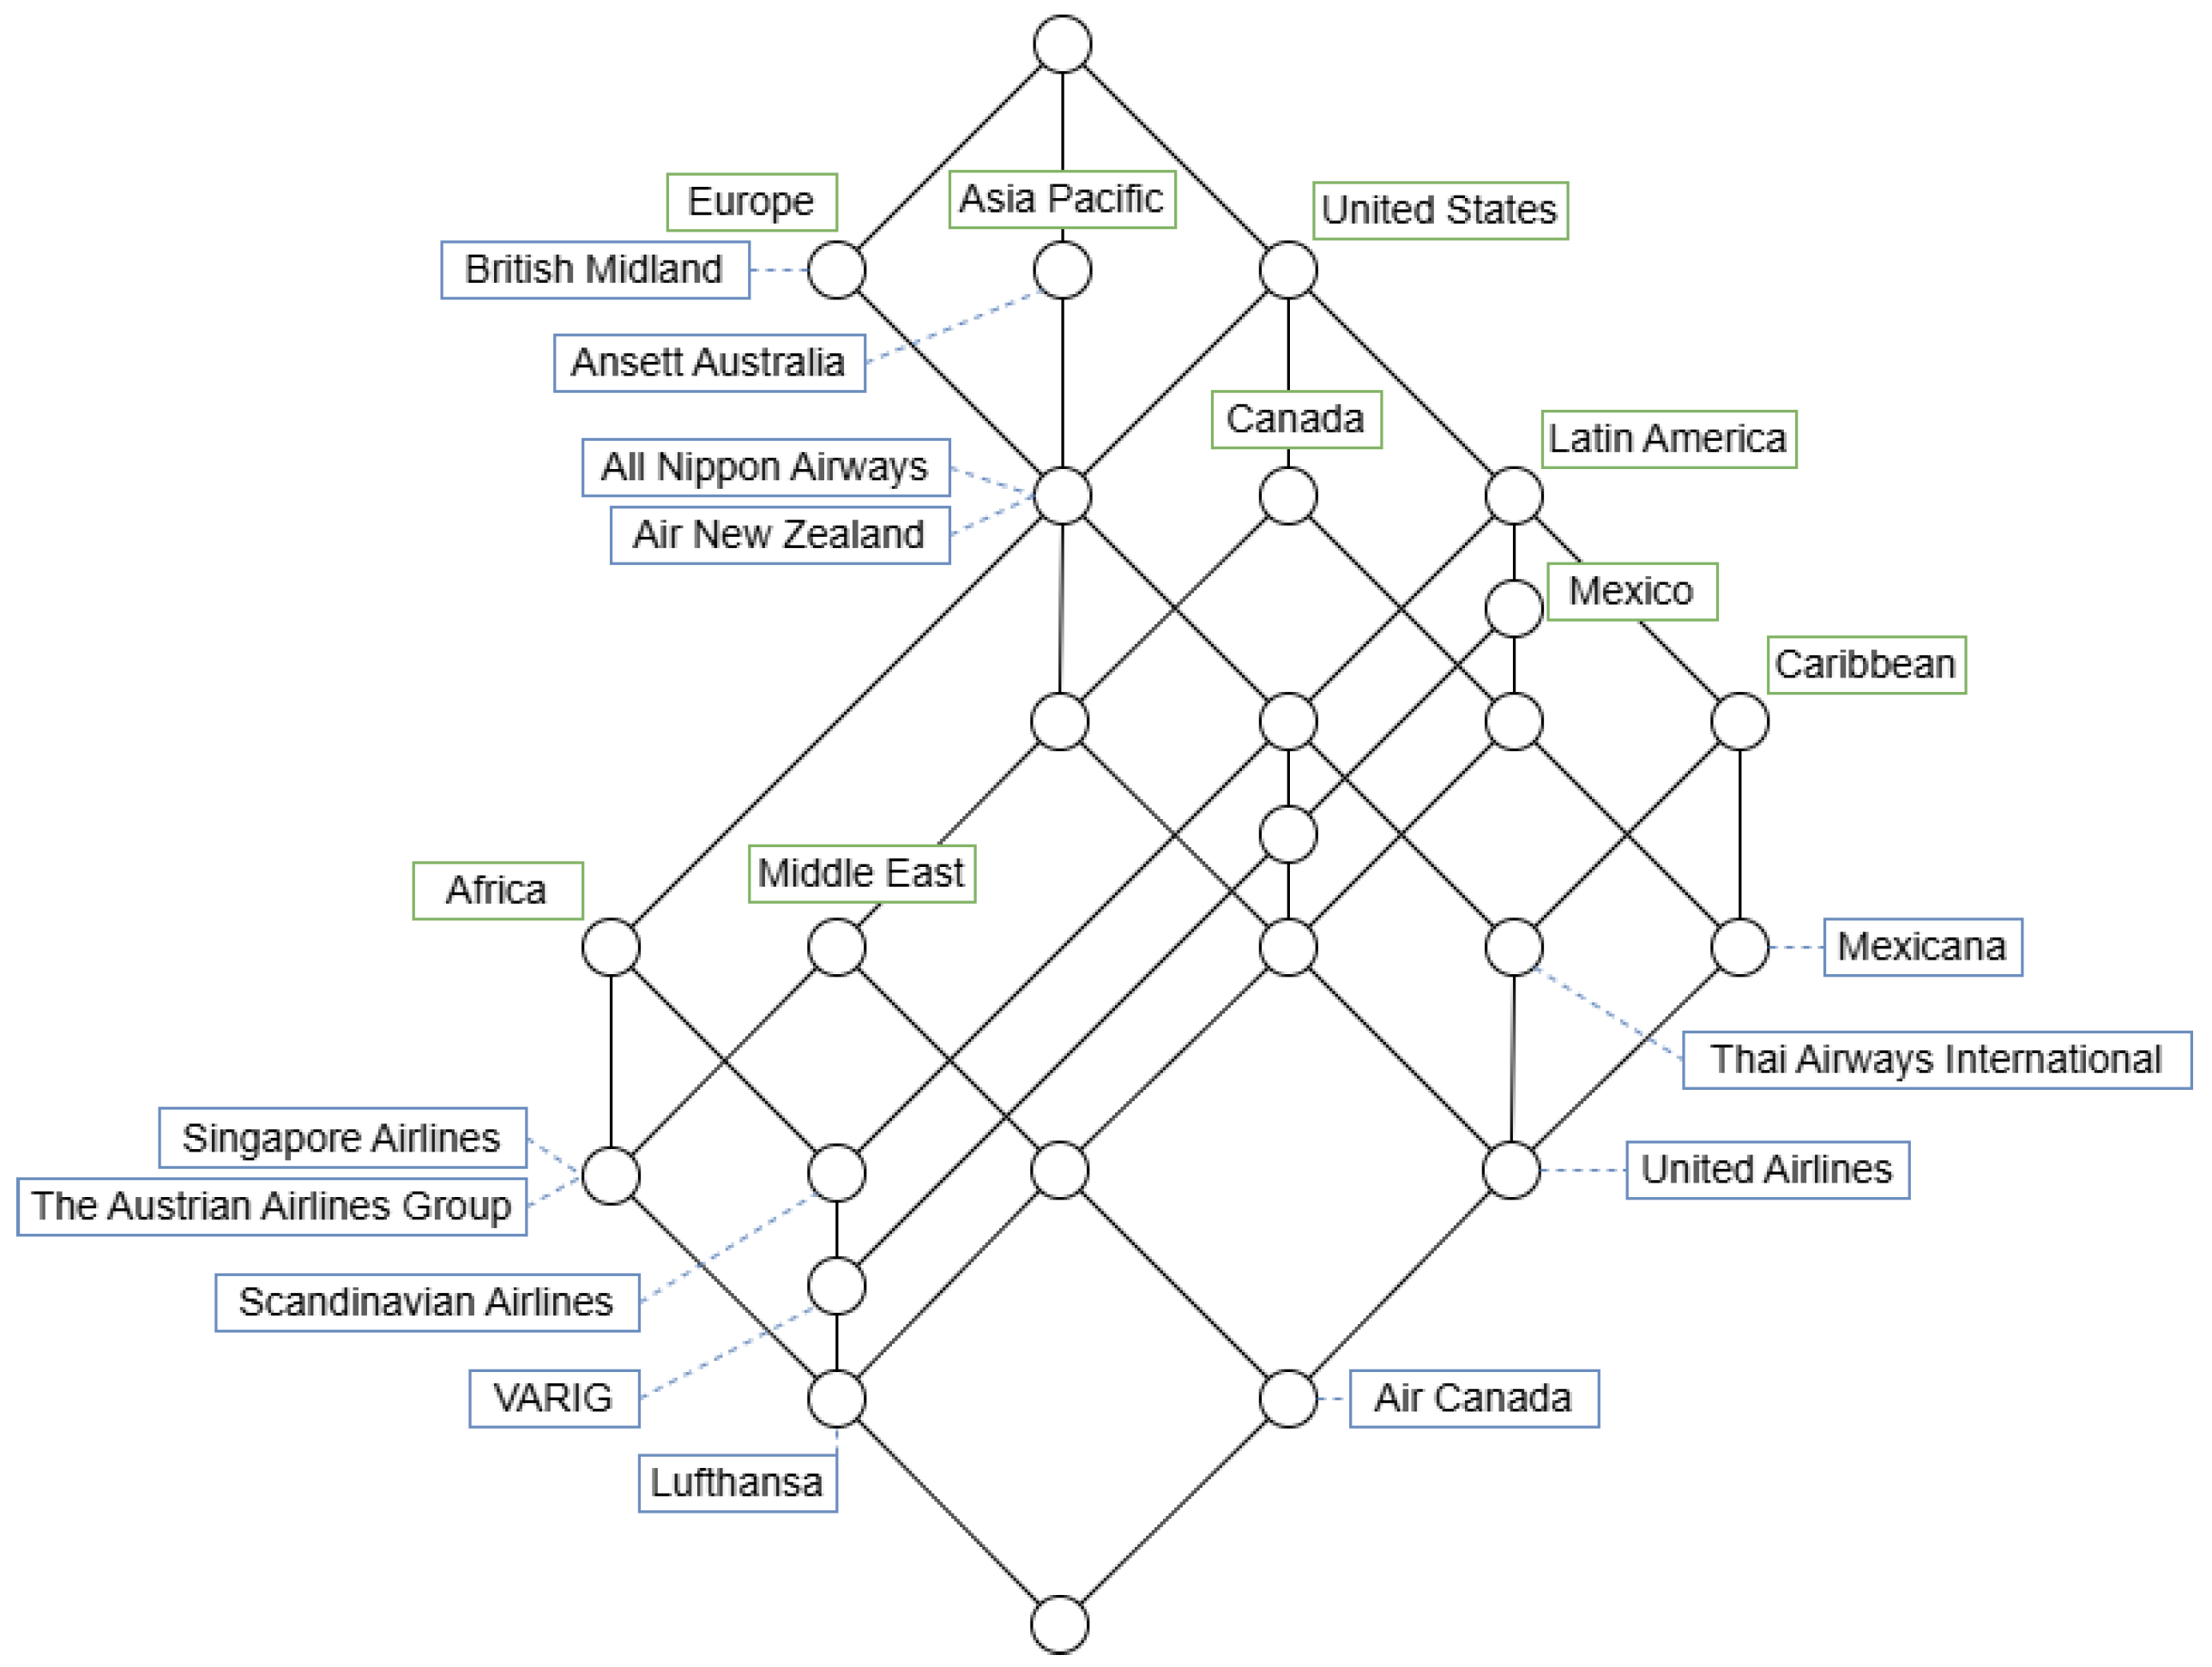
The most significant output of FCA is the concept lattice. FCA derives concepts from the incidence matrix and generates a collection of formal concepts. This collection is logically organized into a hierarchy of concepts interconnected using subconcept–superconcept relations—a concept lattice [
27]. In
Figure 1 we can see a concept lattice generated for a formal context depicted in
Table 1. It is easy to notice that the concept lattice reflects the generalization and specialization between formal concepts within a single formal context [
27]. If formal concepts are considered the basic units of thought, then it is no surprise FCA has found its various applications.
The value of FCA largely stems from the fact that experts can visually inspect the concept lattice to reveal meaningful patterns and dependencies. Therefore, generating all formal concepts and their lattice is essential for FCA applications. Over the years, FCA has been successfully applied to knowledge discovery [
28,
29,
30,
31,
32], knowledge representation [
33], pattern recognition tasks [
34,
35], web usage mining [
36,
37], and many other data science fields. To elaborate on the literature on FCA, Poelmans et al. presented a survey [
28]. Their study examined 702 articles published between 2003 and 2009 that referenced formal concept analysis in their abstracts, with particular emphasis placed on a subset of 140 publications centered solely on data mining and knowledge discovery. A comprehensive 2013 survey [
29] re-examined and visualized the key research areas in formal concept analysis. From 2011 to 2016, Singh et al. [
38] analyzed over 350 publications and highlighted the following major directions: FCA combined with granular computing, fuzzy FCA, interval-valued fuzzy approaches, possibility theory, rough sets, triadic concepts, factor concepts, and incomplete formal contexts. The study reaffirmed FCA’s prominent role in knowledge discovery, logical reasoning, decision contexts, and ontology engineering. Azibi et al. [
39] reviewed various FCA-based classification approaches and grouped them into three main categories—distributed classifiers, ensemble classifiers, and mono-classifiers, thereby highlighting the effectiveness of Formal Concept Analysis in machine learning.
With the rise of big data, FCA has emerged as a valuable technique for handling large-scale datasets. This makes efficient and reliable FCA methods critical for knowledge extraction and representation. In response, researchers have proposed a variety of parallel and distributed algorithms to accelerate the computation of all relevant formal concepts. The researchers proposed parallel implementations based on the Close-by-One algorithm [
40] and, in 2009, presented the earliest distributed FCA algorithm [
41] using the MapReduce paradigm [
42]. Separately, Chunduri et al. [
43] proposed a distributed approach called UNConceptGeneration to derive novel insights from binary object-attribute relational data.
Numerous techniques have been proposed to build reasonably sized concept lattices that highlight the most important features of the data. These falls into two main groups: (a) methods that reduce complexity with a context-level representation, and (b) lattice-level pruning techniques, such as iceberg reduction. In general, the goal is often to remove as many objects or attributes as possible without altering the core lattice structure. Commonly used approaches, as reviewed in [
11], include context preprocessing [
44,
45,
46,
47], non-essential distinction elimination [
48,
49,
50], and selective concept filtering [
51,
52]. The method applied in this research for reducing concept lattices falls within the context of preprocessing techniques. This method employs an attribute reduction process by replacing redundant attributes with its semantically similar attribute, thereby reducing the total number of used attributes.
Current state-of-the-art approaches, such as machine learning or embedding-based approaches, confirm FCA to be complementary rather than comparable to them. FCA has successfully combined decision trees to create ML models generating modern classifiers and regressors [
53]. The authors of [
54] induce a decision tree from the concept lattice, while [
55] compares the ways the concept lattice and the decision tree can be used for supervised learning. Moreover, FCA has been successfully combined with artificial neural networks in neuro-symbolic approaches. Integration of these approaches is bidirectional. FCA has been used for modernization of the neural network architecture based on concept lattices [
56], as well as improving low dimensional node embeddings without parameter tuning [
57]. On the other hand, the formal lattice graph of FCA has been reproduced using generative neural models for graphs [
58].
3. Research Problem Definition
Open data metadata completeness, such as metadata for category information, is one of the key prerequisites for open data discoverability and its ability to reach its full potential on open data portals. Therefore, filling out missing metadata values such as category information, in order to improve metadata quality and consequentially open data findability, has been recognized as an important process for improving the quality of open data. Methods relying on Formal Concept Analysis have proven effective for determining appropriate categories for datasets based on their tags [
12]. One of the core parts of these methods is the knowledge base that consists of concept lattices generated based on the combinations of tags used for describing already categorized datasets. Therefore, in order to maintain the quality of FCA-based categorization methods, it is essential to periodically update the concept lattices. Furthermore, concept lattice generation algorithms commonly face exponential complexity as the number of attributes and/or objects increases, resulting in the generation of extremely large concept lattices with potentially a significant number of concepts with arguable usability. Therefore, the algorithm for the reduction of set of attributes, in this case set of tags, has shown great potential [
25].
For that reason, within this research, we have decided to address two important aspects of FCA application for open data categorization bringing usability and durability conclusions and recommendations:
The impact of the semantic reduction measure on the usability of created concept lattices over time—a lower reduction threshold retains more general concepts, but can also reduce the expressiveness of the used terms which can lead to losing specific terms in the particular field. Alternatively, a higher reduction threshold will keep the expressiveness of the terms but will result in a more complex concept lattices. Therefore, within this part of the analysis, we will examine how the reduction threshold influences the long-term usability of the generated concept lattices.
Metadata change indicators, due to which it is necessary to recreate the knowledge base for the selected reduction measure.
3.1. Formal Context Reduction
The main idea behind formal context reduction is to reduce the number of attributes describing objects in the formal context. For FCA-based open data categorization, for each category on an open data portal, a formal context is defined with a set of datasets that belong to a particular category and a set of tags used for describing those datasets. Therefore, the reduction of such formal context represents a reduction in the number of distinct tags appearing in the context by comparing their meanings. For example, if in the “Arts” category there are tags “paint”, “pigment”, and “rouge”, the formal context reduction algorithm could mark these tags as synonyms and reduce the tags space by replacing those three tags with only one.
For that reason, in this research, we employ [
25] algorithm that relies on the semantic similarity for reducing the number of distinct tag values, which results in the reduction of the formal context. At the beginning, all tags are converted into 300 dimensional vectors using GloVe (Global Vectors for Word Representation) [
59] model which allows similarity comparison on the word level. The GloVe model used within this algorithm is trained on Common Crawl data, with 840 billion generated tokens and vocabulary containing 2.2 million entries. This model has a broad vocabulary and heterogeneous linguistic coverage, and allows similarity comparison on the word level.
Within this algorithm, tags are processed as they appear in the formal context. For each pair of tags within one formal context a cosine similarity is calculated using the following definition:
Definition 4 ([
25])
. Similarity ST between two tags, TX and TY, is defined as the largest similarity between any two words WX and WY, whereas WX and WY represent parts of TX and TY, respectively. After computing tag similarity results for all tag pairs, tags whose similarity values exceed a predefined threshold are considered highly similar. Consequently, for each tag in the formal context C, a corresponding group of similar tags LST = [s1, s2, …,sk] is defined. If the list of similar tags contains more than two tag values, the tag is identified as a reduction candidate tag.
For each formal context C, reduced formal context C
R is computed using the following algorithm [
25]:
For each pair (TI, LSTI) from C:
Find all intersection tag sets LINT = [u1, u2, …, uj] between LSTI and all other LST sets in category C;
Among all LINT tag sets, find tag set LSUB which has the maximal number of elements and is equal to LSTJ coupled with tag TJ from C;
if LSUB cannot be found, iteration ends;
if more than one tag has an equal maximal number of elements, the first one is taken;
Since LSUB is a subset of LSTI, within LSTI replace LSUB with single tag—TJ;
Repeat steps from a to c until iteration ends.
The proposed algorithm operates through an iterative process of tag list comparison and substitution, designed to optimize the representation of data within a formal context for concept lattice construction. Specifically, the algorithm begins by generating lists of similar tags based on predefined similarity criteria. These lists are then compared against existing tag lists within the formal context to determine the largest common subset (i.e., the maximal matching subset) that fully corresponds to the tags associated with an existing tag. The identified largest subset of tags is replaced by its corresponding tag, and this step is repeated until all subsets are found and replaced by the appropriate tags. In cases where multiple tags correspond to subsets of equal maximum size, the first identified tag is selected. As the result of the performed algorithm the size of the formal context used for generating concept lattice is reduced.
3.2. Methodology
From the formal context reduction algorithm it can be concluded that the threshold value depends on the embedding model used for generating word vectors, as the semantic similarity assigned to the same word pair may vary across different models. Furthermore, it can be concluded that the choice of threshold value directly influences the extent of the reduction. A lower threshold value increases the number of replacement candidates, thereby enhancing the reduction potential. Accordingly, it will result with a larger number of replaced tags and smaller number of attributes in the formal context, and thereby simpler concept lattice. Consequently, higher threshold results in the replacement of only highly similar tags, thereby limiting the overall reduction. Finding an appropriate reduction threshold can be challenging. The authors of [
60] reported the effects of the word embedding model dimensionality on similarity threshold value by conducting the experiments in different vector dimensions. They suggested that a threshold value of 0.7 would be appropriate for the 300-dimension model. Furthermore, the authors of [
61] analyzed open government metadata and manually checked tag pairs with semantic similarity between 0.7 and 0.8. They concluded that threshold value set to 0.7 may harm the expressivity of formal context. The authors gave example for tags “water transport”, “pipeline transportation occurrences”, where setting reduction threshold to 0.7 would result in substitution of these tags with more general one, e.g., water transport tag. Therefore, within this research among 0.7, we will analyze and more restricted threshold values 0.8 and 0.9. Our goal is to investigate the number of reduced tags depending on the reduction threshold, as well as its influence on the usability of the knowledge base over time.
For the purpose of the long-term usability analysis, we will combine the formal context reduction algorithm with a FCA-based dataset categorization algorithm presented in [
12]. Since different open data portals have different dataset categorization approaches in terms of the number of categories that can be assigned to a single dataset, within this research, Ireland’s and Canada’s open data portals will be investigated. Ireland’s open data portal was chosen as a representative of the portals where datasets are assigned only one category, and Canada’s open data portal was chosen as a representative of the portals where datasets are assigned multiple categories. Since the number of assigned categories can have a direct impact on the knowledge base usability and categorization algorithm performance, this portal selection ensures that in the evolving metadata environment both categorization approaches are analyzed.
The long-term usability analysis of the reduced concept lattices will be performed on the 5-year period. To enable an over time analysis, six distinct datasets were utilized for the construction of reduced concept lattices corresponding to the open data portals (ODPs) of Ireland and Canada:
IrelandDS 2020 and CanadaDS 2020—sets containing all datasets that were available on the Ireland’s ODP and Canada’s ODP in 2020 respectively;
IrelandDS 2021 and CanadaDS 2021—sets containing all datasets that were available on the Ireland’s ODP and Canada’s ODP in 2021 respectively;
IrelandDS 2023 and CanadaDS 2023—sets containing all datasets that were available on the Ireland’s ODP and Canada’s ODP in 2023 respectively.
For each of these six datasets, reduced concept lattices were generated using Formal Concept Analysis with reduction thresholds set to 0.7, 0.8, and 0.9. Each threshold value yields a distinct set of reduced lattices, e.g., a corresponding knowledge base, resulting in a total of 18 knowledge bases across the six input datasets. For testing the usability of these knowledge bases, we will perform categorization using six test datasets for each open data portal, where test datasets contain all new data that became available in the following time periods: 2021–2020, 2023–2020, 2025–2020, 2023–2021, 2025–2021, and 2023–2025. To ensure that this analysis reflects the real-world growth of new datasets, no duplicate removal or category balancing was performed on the test data.
4. Dataset and Formal Context Reduction
For the purpose of this research we have chosen two open data portals with different dataset categorization approaches—Ireland ODP and Canada ODP. Ireland open data portal organizes its data into 14 categories and in the period from 2020 to 2023 the upward trend in the number of datasets and tags used for their description was noted. In 2020, the total number of datasets on Ireland ODP was 10,151; in 2021 this number increased to 12,949, in 2023 it was 17,844; and in 2025 there were 20,325 datasets on the portal. The total number of tags more than tripled in this period; in 2020, there were 5070 tags; in 2021, there were 11,778 tags; in 2023, there were 15,593 tags; and the number of tags in 2025 was 17,231. Furthermore, it was noticed that in the period from 2020 to 2021 there were 7984 datasets with new identification numbers, resulting in significant changes in the distribution of datasets by category and usage of tags. For example, the number of datasets was substantially reduced in the
Economy and
Society categories, and notably increased in the
Government category. The detailed distribution of the number of available datasets by category for 2020, 2021, and 2023 is presented in
Table 2 (ND column).
On the datasets from 2020, 2021, and 2023 reduction was performed using reduction thresholds 0.7, 0.8, and 0.9, resulting in three reduced formal contexts per year. The percentage of reduced tags per category for each threshold and each dataset is presented in
Table 2 (RT [%] 0.7, RT [%] 0.8, and RT [%] 0.9). Based on generated reduced contexts, concept lattices were produces for each category on the portal. The structure of the generated concept lattices, e.g., the number of generated nodes per lattice for each reduction threshold is presented in
Table 2 (NN 0.7, NN 0.8, and NN 0.9).
From the presented results it can be noted that the Crime category did not have any reduction in the number of tags for any of the years and threshold values, due to the specifics of the used tag values for describing datasets. Furthermore, the Towns category did not have any reductions in 2021, while in 2020 within this category there was reduction only for 0.7 threshold. Moreover, it can be noted that for the 0.9 threshold, there were multiple categories, like Agriculture, Economy, Housing, etc., whereas for multiple datasets the reduction was equal to 0. It can be concluded that, overall, reduction percentage was below 1% for most of the datasets in most of the categories, and only in two cases the reduction percentage was between 3% and 4%. As expected, the reduction percentages for threshold set to 0.8 were higher, and besides the Crime category, only the Towns category had reduction equal to 0 in 2020 and 2021. The highest reduction percentages were obtained for threshold 0.7, where in 16 cases reduction was higher than 10%, and in 2023 for the Society category it was higher than 20%.
Furthermore, from the presented number of nodes in concept lattices, it can be noticed that some of the concept lattices have had significantly different structures between the years. The differences are due to the sizable changes that occurred in this period of time, in terms of available datasets within categories and tags and combination of tags used within them.
The Canada open data portal organizes its data into 19 categories, where one dataset may belong to multiple categories. Furthermore, within this portal in the period from 2020 to 2025 there were significant changes made, which is particularly important for the analysis in this research. In 2020, there were 85,546 available datasets on the portal. However, in 2021, due to the data consolidation, the number of available datasets was 31,270. From that point, an upward trend in the number of datasets was detected, and in 2023 there were 38,956 datasets, and in 2025 the number of dataset was equal to 42,051. The analyses of used tags showed that the number of tags increased constantly throughout the analyzed period; in 2020 the number of tags was 17,225, in 2021 it was equal to 27,551, in 2023 it was equal to 38,943, and in 2025 there were 43,053 used tags. The detailed distribution of the number of available datasets by category for 2020, 2021, and 2023 is presented in
Table 3 (ND column).
On the datasets from 2020, 2021, and 2023 reduction was performed using reduction thresholds of 0.7, 0.8, and 0.9, resulting in three reduced formal contexts per year. The percentage of reduced tags per category for each threshold and each dataset is presented in
Table 3 (RT [%] 0.7, RT [%] 0.8, and RT [%] 0.9). Based on generated reduced contexts concept lattices were produced for each category on the portal. The structure of the generated concept lattices, e.g., the number of generated nodes per lattice for each reduction threshold, is presented in
Table 3 (NN 0.7, NN 0.8, and NN 0.9).
From the presented reduction information it can be noted that for the threshold set to 0.9, categories arts_music_literature and history_and_archaeology did not have any reduction in the number of tags for any of the datasets. Furthermore, categories language_and_linguistics and military did not have any reduction in the number of tags in 2020 and 2021 formal contexts. Moreover in 2023 dataset, for category language_and_linguistics category reduction percentage was equal to 0.56%, and for the military category, the reduction percentage was 1.01%. Furthermore, for the threshold set to 0.9, the highest reduction percentages were 2.49% in 2020 for the science_and_technology category, and 2.48% in 2020 for the nature_and_environment category, and for all other formal context reductions, the tag reduction percentage was below 2%. The analysis of reductions with the threshold set to 0.8 showed that the tag reduction percentage was below 12% for all formal contexts, and the lowest reduction percentage was for the health_and_safety and military categories. As expected, the highest reduction percentages were recorded for the threshold set to 0.7, where, except for the military category in 2020, when reduction was equal to 5.94%, for all other formal context reductions, the tag reduction percentage was between 10% and 28%.
Furthermore, from the presented number of nodes in concept lattices, it can be noticed that some of the concept lattices have had significantly different structures between the years. The observed differences can be attributed to the dataset consolidation that was made on the portal after the 2020 dataset was retrieved and a subsequent increase in the number of datasets within categories, as well as tags, and the combination of tags applied across them.
5. Concept Lattice Usability Analysis—A Categorization Perspective
The sets of concept lattices, e.g., knowledge bases, presented in the previous section of this paper were used for over time reduced concept lattice usability analyses within six test cases. For both portals, knowledge bases created on 2020 datasets were used for the categorization of all new datasets that were available in 2021 (2020–2021 test datasets), that is, datasets from 2021 whose identifiers were not in the 2020 dataset. Furthermore, this knowledge bases were used for the categorization of all new datasets that were available in 2023 (2020–2023 test datasets), that is, datasets from 2023 whose identifiers were not in the 2020 dataset. Lastly, this knowledge bases were used for the categorization of all new datasets that were available in 2025 (2020–2025 test datasets), that is, datasets from 2025 whose identifiers were not in the 2020 dataset. Furthermore, for both portals knowledge bases created on 2021 datasets were used for the categorization of all new datasets that were available in 2023 (2021–2023 test datasets) and 2025 (2021–2025 test datasets). Finally, for both portals, knowledge bases created on 2023 datasets were used for categorization of all new datasets that were available in 2025 (2020–2025 test datasets). Due to the way these datasets were made, both the distribution of the number of instances across the test cases and distribution of test datasets across categories differ.
Since open data portals may have different approaches to dataset categorization in terms of the number of assigned categories, the durability analysis was performed on Ireland OPD as a representative of portals that use one category per dataset approach, and Canada ODP as a representative of portals that assign multiple categories per dataset. Therefore, the analysis is performed per categorization approach and results of the durability analysis are presented in the following part of this research.
5.1. Single-Category Categorization Results
Since datasets available on the Ireland open data portal are assigned to at most one category, whereas the applied categorization algorithm is designed to recommend multiple categories when the relevant criteria are met, the categorization results are divided into three distinct groups:
FM group—corresponding to fully categorized datasets, meaning that each dataset was assigned the correct category and no additional categories were suggested by the algorithm;
FME group—corresponding to datasets that were assigned the correct category and at least one additional category;
MM group—mismatched datasets—datasets that were assigned incorrect category.
However, since both FM and FME groups assign correct category to a dataset, for the purpose of this analysis datasets belonging to these groups will be considered correctly categorized. The total number of instances within test datasets for this analysis and overall categorization results for all reduction thresholds are presented in
Table 4.
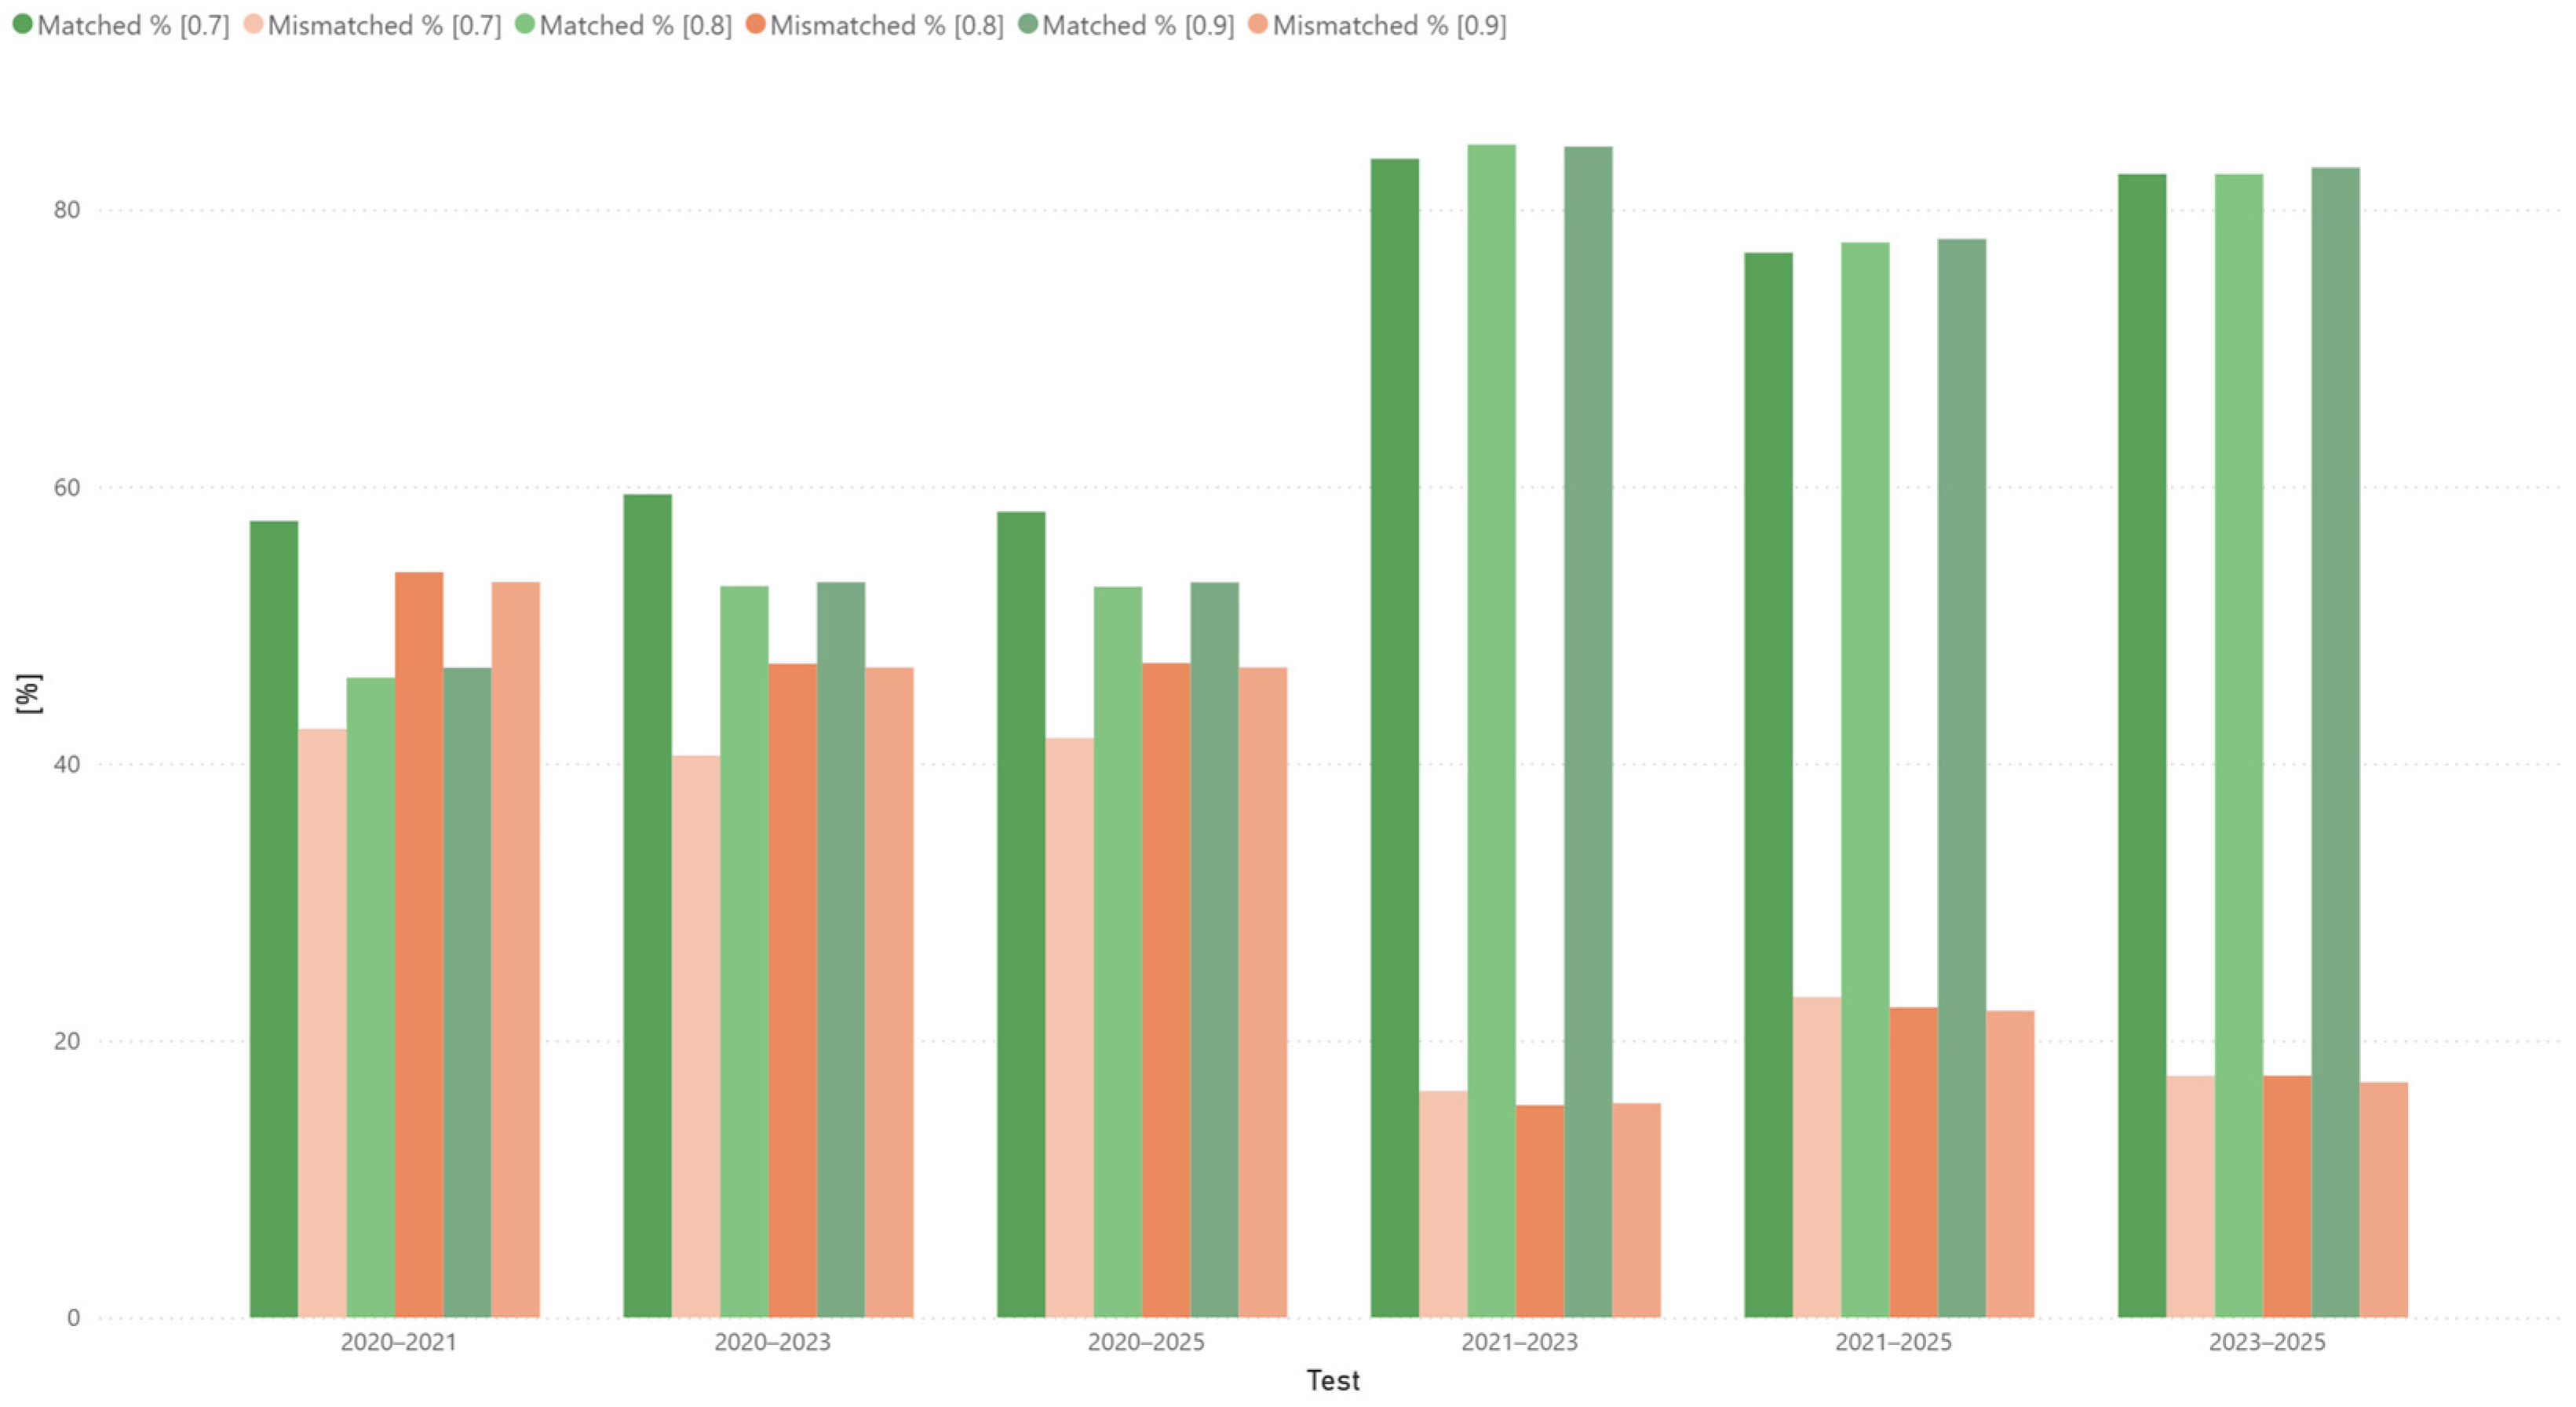
From the presented results it can be noticed that for 2023–2025 test the percentage of successfully categorized datasets was between 82.55% and 83.02% depending on the reduction threshold. Furthermore in the 2021–2025 test the success rate depending on the reduction threshold was between 76.87% and 77.86%, while in the 2021–2023 test the overall successes depending on the reduction threshold was between 83.65% and 84.68%. In tests performed on the 2020 dataset, e.g., tests 2020–2021, 2020–2023 and 2020–2025, the success rates were lower comparing to other datasets, and were between 46.19% and 59.43%. This is due to the dataset consolidation that was performed on the portal in that period of time. The chart with summarized categorization results is presented in
Figure 2.
If observed category-wise across all reduction thresholds, categorization results range from exceptional to acceptable. For example, for the Transport category exceptional categorization results were obtained, with 99.61% of correctly categorized datasets for all reduction thresholds in the 2020–2021 test, 98.01% of correctly categorized datasets for all reduction thresholds in the 2020–2023 test, and 97.39% of correctly categorized datasets for all reduction thresholds in the 2020–2025 test. Furthermore, for the Crime category the success rate was 99.69% for all reduction thresholds in the 2021–2023 test. Moreover, in the 2021–2023 test, there were five categories with over 90% of successfully categorized datasets for all reduction thresholds, while in the 2023–2025 test there were six categories with success rate over 90%.
To uncover the reduced concept lattices usability to their full extent, in the remaining part of this section we will present the results of a deep analysis of categorization results for each pair of time period and category. The deeper analysis showed that the performance of knowledge bases created on the same dataset but with different thresholds had similar results in tests. The greatest difference in the results depending on the reduction threshold was recorded for the test performed on knowledge bases created on the 2020 dataset. For the 2020–2021 test, the best performance was achieved with a reduction threshold set to 0.7, yielding a success rate of 57.5%. When the threshold was increased to 0.8 and 0.9, the percentage of correctly categorized datasets was similar for both thresholds and more than 10% lower than the result obtained with the 0.7 threshold. For the 2020–2023 test, the knowledge base created with a threshold of 0.7 yielded a success rate of 59.43%. For the thresholds of 0.8 and 0.9, the success rate was worse compared to the 0.7 threshold, by 6.63 and 6.35 percentage points, respectively. For the 2020–2025 test, a threshold of 0.7 with 58.16% of correctly categorized datasets had better results—5.09 and 5.41 percentage points higher compared to thresholds set at 0.9 and 0.8, respectively. However, for tests performed on the 2021 and 2023 datasets, the test results were within 1% for all reduction thresholds.
Furthermore, the category-level analysis of the obtained results showed that for most of the categories, the success rates for different reduction thresholds had a marginal difference. For tests conducted on the 2020 knowledge bases, the Health category was the only category in which knowledge bases generated after applying the 0.7 reduction threshold achieved a significantly higher percentage of successful categorizations compared to those generated after applying the 0.8 and 0.9 reduction thresholds. For the knowledge base generated after applying the 0.7 reduction threshold, more that 97% of datasets belonging to the Health category were correctly categorized. In contrast, for the 2020–2021 test, for the thresholds of 0.8 and 0.9, these percentages were below 50%, while for the 2021–2023 and 2021–2025 tests these percentages were below 65%. Furthermore, for tests conducted on the 2020 knowledge bases, the Energy category was the only category in which knowledge bases generated after applying the 0.7 reduction threshold achieved a lower percentage of successful categorizations, compared to those generated after applying the 0.8 and 0.9 reduction thresholds. For the 2020–2021 test this difference was 22 percentage points, while for the 2020–2021 and 2020–2025 tests this difference was below 14 percentage points. A deeper analysis showed that the success rates of these two categories were largely responsible for the overall difference in the success rates of these reduced knowledge base categorizations.
Next, it was observed that within the 2021–2023 test, only within the Economy and Science categories the difference between success rates for different thresholds was 10 and 15 percentage points, respectively. For other categories the results were the same for all thresholds, or were within a few percentage points. It was further observed that within the 2021–2025 test, the Science and Transport categories had success rate differences of up to 13 percentage points for different thresholds, while for other categories, the results were the same or comparable. Lastly, it was noticed that within the 2023–2025 test, the Economy category was the only category of up to 10 percentage points’ differences in success rate, while for other categories success rates were comparable or the same for different reduction thresholds.
Additionally, it was concluded that in the 2020–2021 test, the Transport category had 99.61% of correctly categorized datasets for all reduction thresholds, the Arts category had more than 88.24% of correctly categorized datasets for all reduction thresholds, while the Energy category had 94.92% of correctly categorized datasets for the thresholds set to 0.8 and 0.9. Within this test, the lowest percentage of successfully categorized datasets was obtained for the Crime category where the percentage was 1.1% for all reduction thresholds. Furthermore, for the 2020–2023 test, it was concluded that the Transport and Arts categories obtained the best categorization results. The Transport category had 98.01% of all datasets successfully categorized for all reduction thresholds, while for the Arts category this percentage was above 88%. Also in this test, the Crime category obtained the worst categorization results, with 0.49% of the test being successfully categorized for all reduction thresholds. In the 2020–2025 test, the Transport category had 97.39% of datasets successfully categorized for all reduction thresholds, while the Arts and Environment categories had more than 82% of datasets successfully categorized for all reduction thresholds. Next, in the 2021–2023 test, five categories had all datasets successfully categorized in more than 90% for all reduction thresholds, with one of them being the Crime category. Furthermore, in the 2021–2025 test, this number of categories was equal to two for all thresholds, while in the 2023–2025 test there were five such categories and one category with more than 88% of success rate for all thresholds. It is important to emphasize that in the 2020–2025, 2021–2025, and 2023–2025 test datasets there where datasets assigned the Justice category. This category was defined on the portal after 2023, and therefore knowledge bases that are being analyzed within this research do not contain the concept lattice corresponding to this category. For that reason, all datasets assigned the Justice category were wrongly categorized. Finally, it can be concluded that knowledge bases created using a reduction threshold of 0.9 achieved similar or even better results for some categories comparing to other thresholds, which results in overall very similar results for the complete test.
5.2. Multiple-Category Categorization Results
Since datasets available on the Canada open data portal can be assigned multiple categories, the categorization results are divided into five distinct groups:
FM group—corresponding to fully categorized datasets, meaning that each dataset was assigned the correct category and no additional categories were suggested by the algorithm;
FME group—corresponding to datasets that were assigned the correct category and at least one additional category;
PM group—corresponding to datasets that were not assigned all correct categories and no additional categories were suggested by the algorithm;
PME group—corresponding to datasets that were not assigned all correct categories and were suggested at least one additional category;
MM group—mismatched datasets—datasets that were assigned an incorrect category.
However, since both FM and FME groups assign all correct categories to a dataset, and PM and PME assign at least part of the correct categories, for the purpose of this analyses datasets belonging to these groups will be considered successfully categorized. The total number of instances within test datasets for this analyses and overall categorization results for all reduction thresholds are presented in
Table 5.
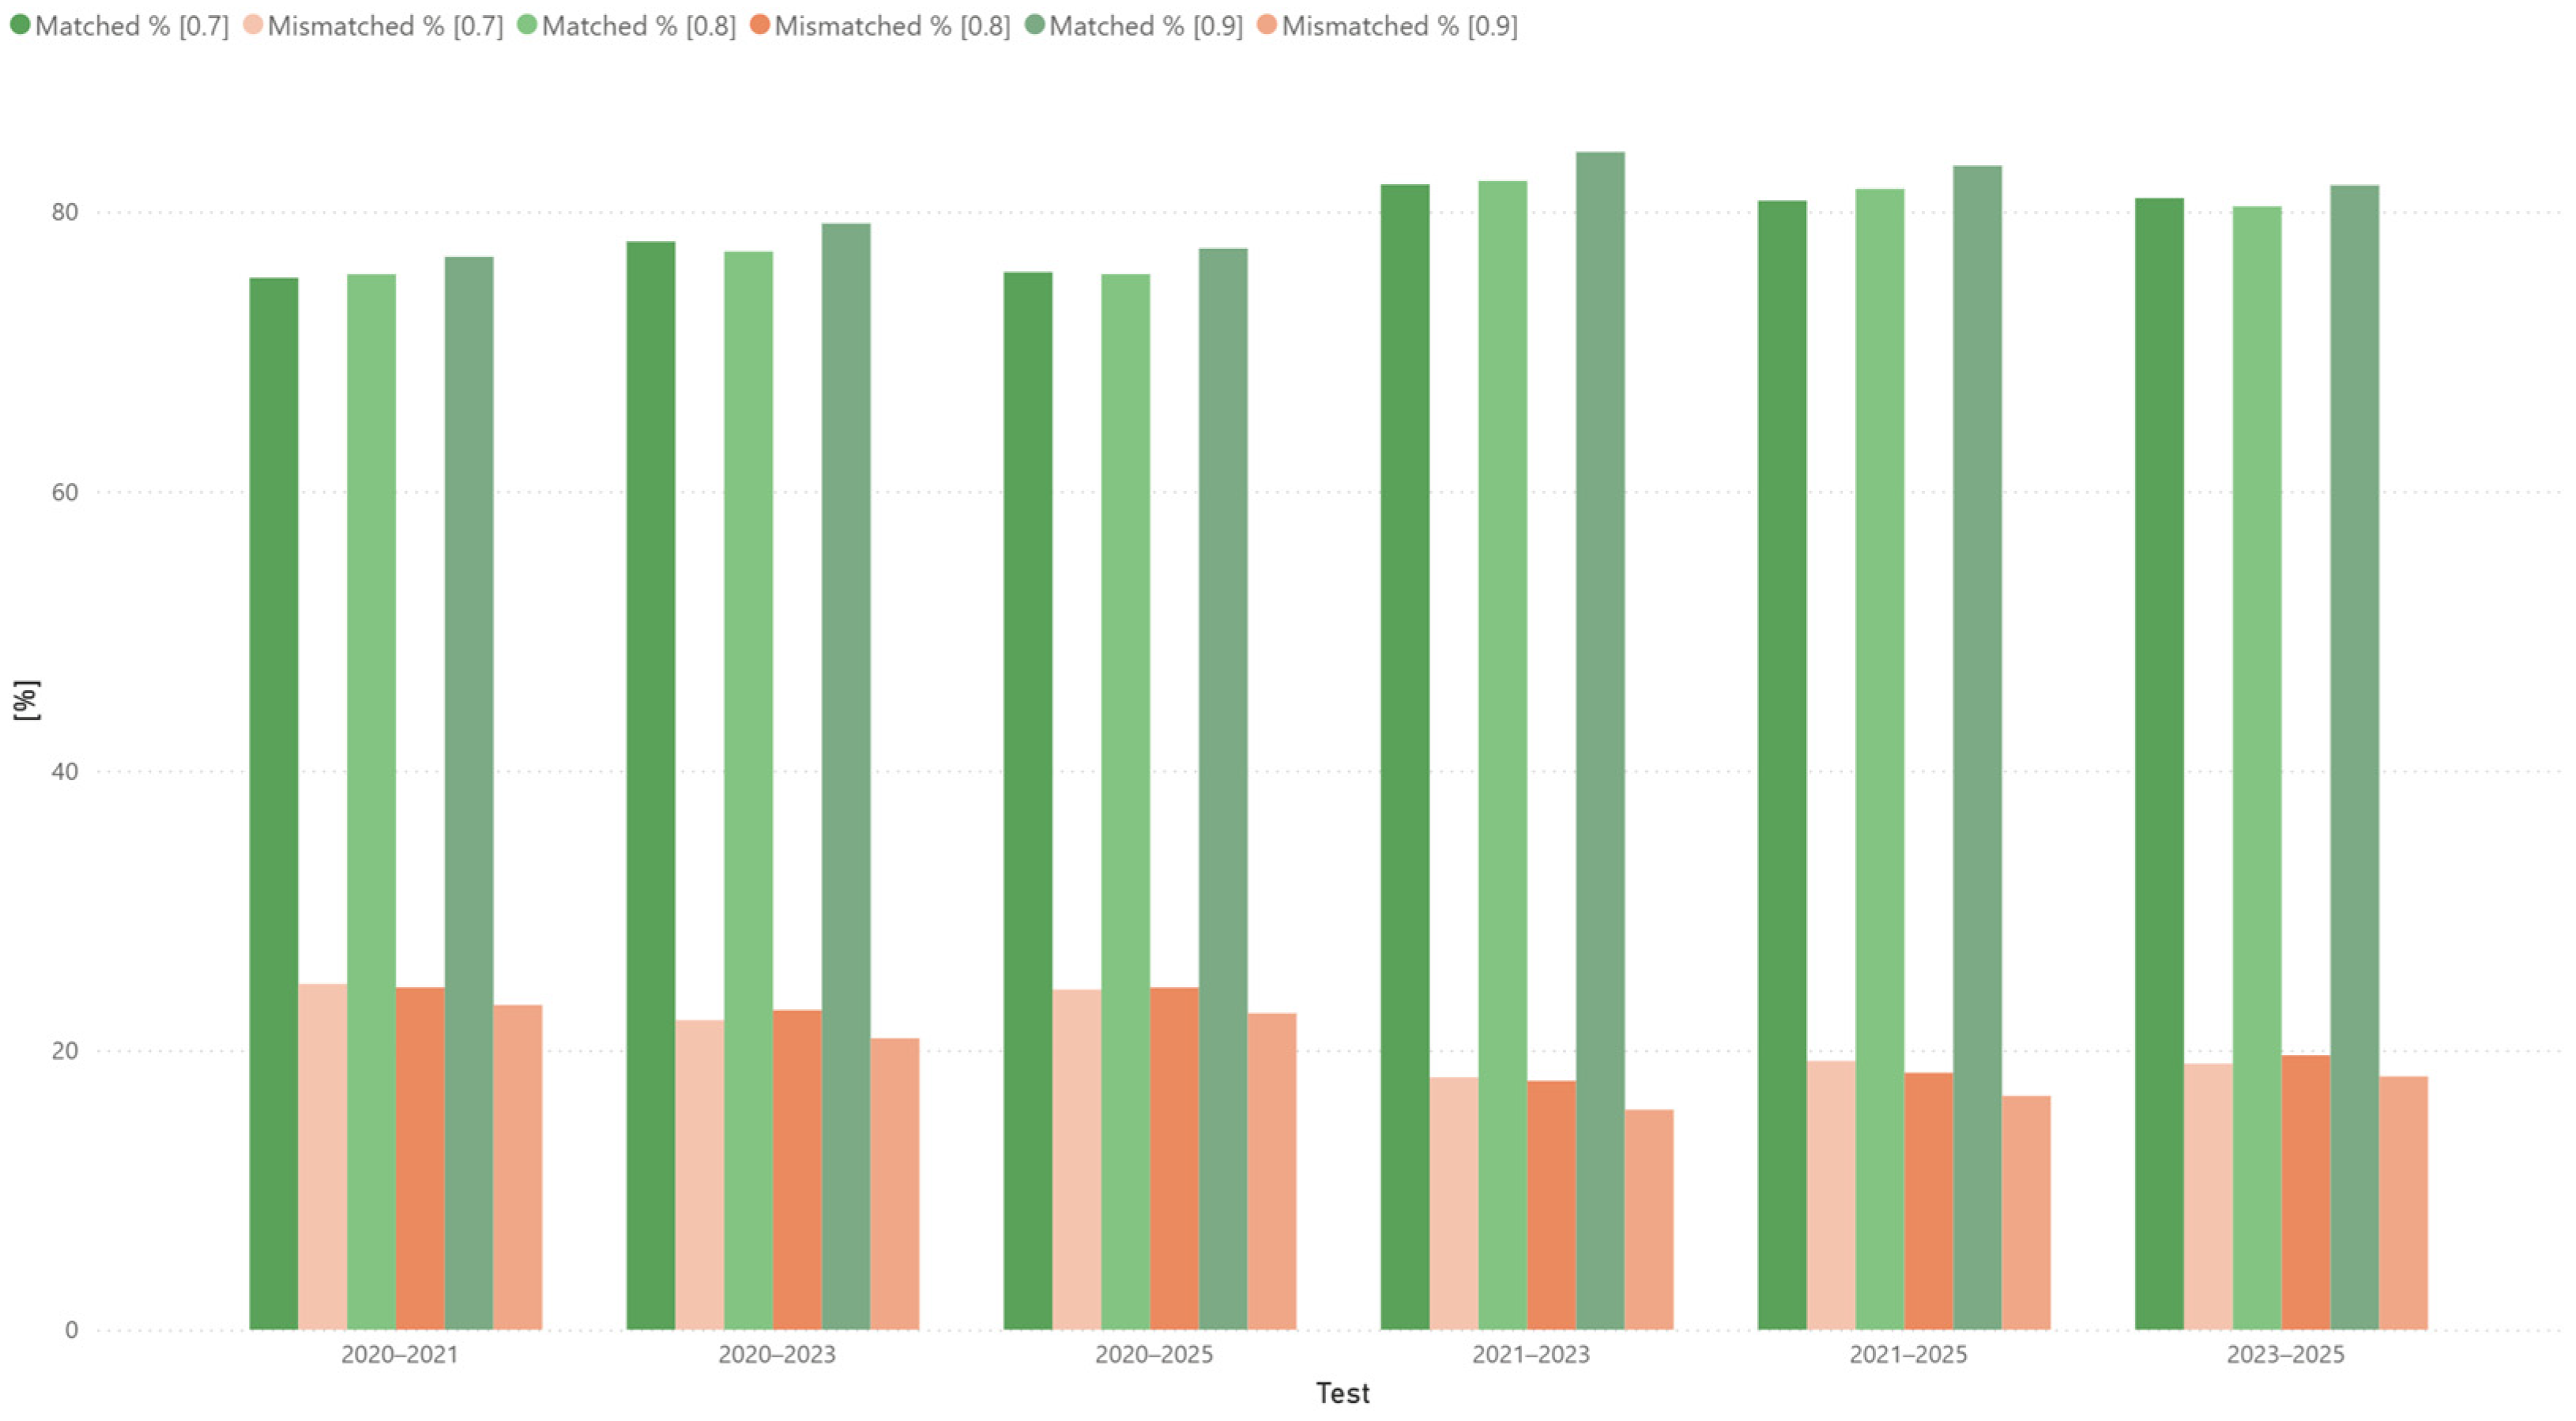
From the presented categorization results it can be noticed that success rate for 2023–2025 tests was from 80.37% to 81.88%. The success rate for tests conducted using the 2021 dataset was above 80% for all tests. More specifically, the success rate ranged from 81.95% to 84.26% for the 2021–2023 tests, and from 80.78% to 83.28% for the 2021–2025 tests. The tests conducted using the 2020 dataset produced the lowest success rates overall. Specifically, the success rate ranged from 75.26% to 76.77% for the 2020–2021 tests, from 77.86% to 79.15% for the 2020–2023 tests, and from 75.52% to 77.36% for the 2020–2025 tests. However, it should be noted that Canada ODP also had the dataset consolidation after 2020, which had a direct impact on the lower categorization success. Furthermore, from the presented results it can be noticed that on the test level success rate differed by 2.5 percentage points for the corresponding reduced knowledge bases with different reduction thresholds. The category-wise analysis showed that some of the categories, like
nature_and_environment, had exceptional categorization results for all tests with success rate up to 94.67%. The chart with summarized categorization results is presented in
Figure 3.
To uncover the influence of the reduction threshold on category-wise categorization results, in the remaining part of this section we present the results of a deeper category-level analysis for all tests. Category-level analysis was performed by evaluating all group results together and considering correct categories that were not proposed by the algorithm. This analysis showed that, for most categories within the same test, the categorization results across different reduction thresholds differed by only a few percentage points. In the 2020–2021 test, only the agriculture, education_and_training and law categories had higher differences in percentage points, whereas knowledge base created with the 0.9 reduction threshold had the highest success rate. In this test, the success rate for the agriculture category was 73.96% at the 0.9 reduction threshold, 64.06% at the 0.8 reduction threshold, and 53.13% at the 0.7 reduction threshold. For the education_and_training category, success rates were 57.14%, 70.09%, and 72.88% for the reduction thresholds of 0.7, 0.8, and 0.9, respectively, while for the law category, success rates were 65.55%, 70.09%, and 77.26% for the reduction thresholds of 0.7, 0.8, and 0.9, respectively. In the 2020–2023 test, the language_and_linguistics and law categories were the only categories with higher differences in success rates depending on the reduction threshold, with the language_and_linguistics category having success rates of 44.57%, 32.61%, and 60.87% for the reduction thresholds of 0.7, 0.8, and 0.9 respectively, and the law category having success rates equal to 46.85%, 50.43%, and 60.17% for the reduction thresholds of 0.7, 0.8, and 0.9 respectively. These categories were also the only categories with higher differences in success rates in the 2020–2025 test. Within this test, the language_and_linguistics category had success rates of 42.72%, 31.07%, and 60.68% for the reduction thresholds of 0.7, 0.8, and 0.9, respectively, while the law category had success rates equal to 36.99%, 40.53%, and 51.01% for the reduction thresholds of 0.7, 0.8, and 0.9, respectively.
Furthermore, in the 2021–2023 test, the labour and persons categories were the only categories with greater differences in success rate percentage points, with success rates equal to 46.09%, 65.51%, and 64.93% for the labour category, and 60.14%, 67.12%, and 75.23% for the persons category for the reduction thresholds of 0.7, 0.8, and 0.9 respectively. These categories were also the only categories with higher differences in success rates in the 2021–2025 test, with success rates equal to 50.62%, 67.04%, and 67.41% for the labour category, and 53.62%, 61.67%, and 66.99% for the persons category, for the reduction thresholds of 0.7, 0.8, and 0.9 respectively. Across the 2023–2025 tests, four categories stood out with success rate differences exceeding 14 percentage points for different reduction thresholds: arts_music_literature, labour, military, and society_and_culture. Within the arts_music_literature category the success rates were 28.57%, 42.86%, and 42.86%, while for the labour category success rates were 56.85%, 66.50%, and 72.08% for the reduction thresholds of 0.7, 0.8, and 0.9 respectively. Moreover, for the military category the success rates were 50%, 41.67%, and 58.33%, while for the society_and_culture category the success rates were 38.70%, 53.95%, and 51.69% for the reduction thresholds of 0.7, 0.8, and 0.9 respectively. Finally, it was observed that across all conducted tests, the knowledge base created using a reduction threshold of 0.9 achieved the highest success rate, or was tied for the highest, in at least 12 categories per test compared to knowledge bases created using other reduction thresholds. In the 2021–2023 test this was the case for all categories within the knowledge base.
Additionally, the results showed that the nature_and_environment category consistently achieved the highest success rate across all reduction thresholds in tests conducted on the 2020 datasets, exceeding 80% in the 2020–2021 test, 87% in the 2020–2023 test, and 86% in the 2020–2025 test. Moreover, in the 2021–2023 test, the health_and_safety and nature_and_environment categories were the categories with the highest success rates, with success rates exceeding 87.95% for the health_and_safety category and 91% for the nature_and_environment category for all reduction thresholds. These categories achieved the greatest success rates in the 2021–2025 test, with success rates exceeding 88% for the health_and_safety category and 87% for the nature_and_environment category for all reduction thresholds. In the 2023–2025 test, the language_and_linguistics and nature_and_environment categories were the ones with the highest success rates, with success rates exceeding 82% for the language_and_linguistics category and 81% for the nature_and_environment category for all reduction thresholds.
6. Discussion
The analysis performed in this research was focused on the strength of conceptualization and durability of reduced concept lattices in an evolving metadata environment. The concept of lattice durability was analyzed for the purpose of data categorization on open data portals. Due to different types of categorization approaches that can be applied on one portal, the analysis had two parts: analysis of lattice usability for single-category categorization and analysis of lattice usability for multiple-category categorization.
Based on the presented analysis results, it can be concluded that in the case of regular dataset growth on the portal, concept lattices have shown good long-term usability. This is supported by the results from both performed analyses, where the 2-year-old concept lattices showed a great categorization potential with only 15% to 19% of miscategorized datasets, depending on the test and threshold value. Furthermore, the 4-year-old concept lattices had fewer than 20% of miscategorized datasets in the multiple-category categorization test and fewer than 24% in the single-category categorization test. Lastly, the category-level analysis results, where multiple categories had more than 90% of correctly categorized datasets, support that concept lattices have a good long-term usability in case of regular dataset growth.
From the presented results, it can be concluded that the higher semantic reduction threshold did not lead to better long-term knowledge base usability in the single-category categorization analysis. Moreover, the results indicate that a threshold value of 0.7 achieved better performance than more restrictive thresholds for the 2020 knowledge bases. This suggests that the knowledge base that preserves a broader range of general concepts, due to the lower reduction threshold, demonstrated better categorization performance after data consolidation. Furthermore, the most general knowledge bases had very similar categorization results for knowledge bases created using 2021 and 2023 datasets. Therefore, it can be inferred that the 0.7 threshold provided better long-term knowledge base usability overall. However, in the case of multiple-category categorization analysis, the most restricted analyzed threshold, 0.9, showed the best results in all tests. Furthermore, at the category level, a threshold of 0.9 achieved better performance in most categories, with several exhibiting notably higher results compared to lower thresholds. This indicates that maintaining more specific terms in concept lattices can be valuable for multiple-category categorizations.
In terms of long-term usability, it can be concluded that in both cases, single- and multiple-category categorizations, data consolidations reduce the usability of concept lattices for the categorization task. Therefore, in the case of data consolidation on the portal, the recreation of concept lattices should be performed. Furthermore, based on the results obtained for the case of data consolidation, it can be established that even in the case of a large increase in new data from new sources, an update of a part of the knowledge base affected by data growth should be recreated. Moreover, it can be concluded that category name changes, as well as adding or removing categories, require knowledge base recreation.
If a knowledge base is to be recreated, the performance of reconstruction process is governed by a large number of mutually interdependent parameters, whereas the choice of FCA algorithm should be devoted additional attention. FCA algorithms can be broadly classified into four main categories, each exhibiting distinct characteristics that significantly influence reconstruction efficiency: batch algorithms (NextClosure, Close-by-One (CbO, FCbO), In-Close), incremental algorithms (AddIntent), parallel algorithms (PCbO, PFCbO, FPCbO), distributed algorithms (MRCbO, MRGanter, HyPar-FCA+). The implementations of these algorithms are available across various libraries and tools, including FCALGS, conexp-clj, FcaKit, concepts, FCA4J, and MRGanter+, primarily developed in Java and Python. Consequently, the selection of programming language and technology stack determines platform compatibility and operating system support, thereby adding further complexity to performance evaluations. Moreover, parallel and distributed implementations require specific hardware resources or system components, where communication latency can substantially affect overall efficiency.
Since computational efficiency is infrastructure-dependent, knowledge base creation practitioners should rely on computational complexity of the algorithm they select but should also be aware of the context characteristics [
62]. In terms of worst-case complexity, an algorithm for generating all formal concepts (or the full concept lattice) is considered optimal if it achieves polynomial time delay (between outputting successive concepts) and uses space linear in the total number of concepts (up to a polynomial factor of the input size) [
63]. However, contexts that produce an exponentially large number of concepts (the theoretical worst case) are relatively rare in practice. Furthermore, real-world performance is heavily influenced by practical factors such as the typical dimensionality of the context, implementation details, and the operating system, which can prove more important than pure theoretical complexity for evaluating algorithms [
62,
63].
7. Conclusions
This study demonstrates that FCA-based concept lattices offer a viable and relatively stable approach for open data categorization, even across several years of metadata evolution. The results provide valuable insights for selecting appropriate reduction thresholds and determining when knowledge base reconstruction becomes necessary. The study examines the long-term usability and efficiency of semantically reduced concept lattices for the automatic categorization of datasets in evolving open data portals. Treating concept lattices as knowledge bases constructed via Formal Concept Analysis (FCA), the research evaluated their durability when confronted with temporal changes in metadata.
Two main aspects were addressed: (1) the impact of the semantic reduction threshold on the long-term usability and expressiveness of the generated concept lattices, and (2) the identification of metadata change indicators that necessitate knowledge base reconstruction. The results indicate that semantically reduced concept lattices maintain good long-term usability under regular dataset growth. Four-year-old knowledge bases achieved miscategorization rates below 24% in single-category classification and below 20% in multiple-category classification. At the category level, in multiple cases over 90% of datasets were correctly categorized in both single- and multiple-category scenarios. Furthermore, findings regarding the optimal reduction threshold differed by categorization type. In single-category tests, a moderate threshold of 0.7, which retains a wider range of general concepts, yielded superior long-term performance. In contrast, the highest threshold (0.9), preserving more specific terms, performed best in multiple-category classification. These outcomes suggest that the ideal level of semantic reduction depends on whether the portal employs single or multiple-category assignment.
Overall assessment of the experimental results demonstrate that semantically reduced concept lattices constructed using FCA exhibit significant long-term stability and generalization capability for the categorization of open datasets over time. Semantically reduced concept lattices maintain strong performance when classifying new datasets even across periods spanning three to five years, achieving success rates that generally exceed 80%. These results indicate good temporal robustness of the FCA-based approach. Importantly, the performance remained consistently high for both single-category classification and multiple-category classification, suggesting that the method scales well across different categorization approaches.
The analysis further revealed that the choice of semantic reduction threshold has only a minor impact on overall categorization success, with performance differences typically not exceeding 2.5%. This indicates the robustness of the method and the possibility of using more reduced lattices without substantial loss in accuracy in most cases, while only in a few categories was this difference noticeable. Category-level evaluation showed particularly strong results in specific domains. The “nature_and_environment” category achieved up to 94.67% correctly categorized datasets across all test periods, demonstrating that FCA-based lattices perform exceptionally well in more structurally stable and less volatile domains.
A notable performance drop occurred when using the 2020 knowledge base. This decline is directly attributed to the major dataset consolidation and structural changes in metadata and category distribution that took place on both portals. These findings highlight that significant structural changes in metadata represent the primary challenge to the long-term usability of concept lattices.
In a subtle manner, this research demonstrates that the optimal timing for knowledge base recreation is not simple to determine as it depends on multiple factors that should be monitored independently, with their relative importance varying according to specific contexts, policies, and open data portal strategies. Our findings provide insights into the following parameters we consider crucial for this decision: structural changes in the data model; category count; data categorization approach (single- vs. multi-label), requiring distinct policies for FM, FME, PM, PME, and MM outcomes (beyond just MM, as new categories may render existing structures inadequate); dataset size and computational costs, influenced by hardware, concept lattice algorithms, and embedding models; estimated data growth, potentially altered by new thematic domains or consolidation; and labeling policy changes, which must be evaluated from both structural and semantic perspectives.
Overall, the findings indicate robust long-term usability of the reduced concept lattices, particularly when metadata evolves gradually, while confirming that major dataset consolidations represent a critical factor necessitating knowledge base reconstruction.