


Abstract
This article presents an analysis of the consequences of a road accident caused by a failure to notice an oncoming vehicle, caused by the left headlamp malfunction. Research was conducted using computer simulation enabling the reproduction of vehicle dynamics under night-time conditions, heavy snowfall and reduced pavement adhesion (αp = 0.20; αs = 0.15). An overtaking manoeuvre was performed in three speed scenarios of the overtaking vehicle: 60, 70 and 80 km/h. In the first phase of the collision (the overtaking vehicle–the oncoming vehicle), a consistent increase in deformation depth was observed with increasing speed, from 342 mm and 469 mm (60 km/h) to 400 mm and 518 mm (80 km/h). The corresponding equivalent energy speed (EES) reached maximum values of 57.4 km/h and 70.5 km/h, respectively. Contact was strongly inelastic in nature (the coefficient of restitution 0.06–0.07), and the transferred impulse initiated intensive rotational motion. The second phase of the collision involved secondary contact between the overtaken vehicle and the overtaking vehicle. Collision severity was directly dependent on residual energy after the first impact. In the 80 km/h scenario, the deformation depth in this phase reached 146 mm, with EES of approximately 10–11 km/h. The analysis demonstrated that the energy not dissipated during the first stage determined the course of the subsequent contact and resulted in a complete loss of directional stability of all vehicles, ultimately leading to a departure from the roadway.
1. Introduction
The vehicle’s exterior lighting system constitutes one of the most fundamental, yet simultaneously critical, components of a vehicle’s technical equipment [1], which must comply with safety standards [2]. The system serves not only as a source of light enabling the driver to watch the roadway, but above all as an instrument of visual communication within the road traffic system. Headlamps, position lights, brake lights and traffic indicators form an integrated signalling system through which a vehicle becomes visible, recognisable and predictable to other road users. Lighting is therefore an element of safety infrastructure, conditioning the proper flow of information within the road environment [3]. Statistical analyses indicate that a substantial proportion of road accidents occur due to reduced visibility, underlining the need for an in-depth study of automotive lighting technologies [4] and for assessment of their influence on driving safety. A driver must not only be able to see, but also to be seen.
The significance of lighting becomes particularly important under reduced visibility conditions, i.e., at night-time, during precipitation, fog, and in environments distinguished by low contrast [5,6]. Under such conditions, the driver’s visual perception is highly dependent on light quality, intensity and beam geometry. It is precisely lighting which determines the visible range, the ability to detect an obstacle, and the correct assessment of the distance and speed of other vehicles. Vehicle lights also constitute a primary source of information for other drivers, as those lights enable identification of the vehicle type, its position on the roadway and the direction of motion. Wood [7] stated that although several factors are favourable to night-time driving, the low level of lighting during this period is a principal cause of collisions, including those involving pedestrians and cyclists, primarily due to their reduced visibility. Wanvik [8], in turn, demonstrated that deterioration in nighttime visibility conditions significantly increases the risk of road traffic incidents, particularly on rural roads lacking additional infrastructural lighting. Under nighttime conditions, drivers very frequently identify approaching vehicles primarily on the basis of the configuration of the emitted light. Consequently, damage to a single headlamp may lead to the incorrect interpretation of the vehicle as a motorcycle or as an object located at a greater distance than it actually is.
Research by Brumbelow indicates that the risk of accidents at night-time is significantly higher than during daytime hours, despite lower traffic volumes. A key determinant in this context is object detection time. The later an oncoming vehicle is noticed, the smaller the available safety margin and the shorter the time for undertaking an evasive manoeuvre [8]. The quality and symmetry of light emission exert a direct influence on object recognition and on the estimation of its distance [9,10]. This means that the operational condition of the lighting system is a determining factor not only for seeing the road, but also for being seen.
The impact of the operational condition of the lighting system on driving safety is therefore direct and multidimensional. Adequate lighting reduces reaction time, improves spatial orientation, and decreases the risk of misinterpreting the situation on the road. Under dynamic conditions, such as an overtaking manoeuvre, lane change, or approaching a junction, even a slight reduction in visibility may lead to the disruption of the decision-making process. From the perspective of road traffic mechanics, a reaction delay of fractions of a second translates into significant differences in the distance travelled and in the level of kinetic energy at the moment of a potential collision.
A particularly hazardous situation arises when drivers operate vehicles with a malfunctioning lighting system, especially when lamps do not emit light. Lighting asymmetry may lead to visual misinterpretation, for example, perceiving a vehicle as a single-track vehicle, underestimating its width, or incorrectly assessing its distance. Studies on driver perception under night-time conditions indicate that ambiguous light signals increase the probability of a decision-making error [11]. As a result, a manoeuvre may be undertaken under conditions of apparent safety, while the actual distance or time to a potential collision is insufficient.
Leslie at al. investigated the effectiveness of driver-assistance systems and General Motors headlamps in field studies. The results showed that automatic high-beam systems, high-intensity discharge headlamps, and the combination of these two systems allowed for reductions of 26%, 11%, and 32%, respectively, in the total number of night-time accidents, including those involving animals, pedestrians, and cyclists [12].
Despite the increasing engineering advancement level of modern vehicles, instances of driving with malfunctioning lamps are still seen in operational practice. This phenomenon raises a question not only about the technical causes of such defects but, more importantly, about their potential consequences for the development of traffic situations. In particular, it is essential to determine whether, and to what extent, a lighting system malfunction can influence the course of an incident, increase the hazard level, and affect the dynamic parameters of a potential collision.
While the literature contains numerous studies on the general mechanisms of road accidents, significantly less attention has been paid to the direct impact of vehicle lighting system malfunctions on driver perception and the subsequent development of a collision situation. Previous studies have focused primarily on analysing accident statistics, vehicle traffic dynamics, or driver behaviour in low visibility conditions, while the relationship between light emission asymmetry and the manoeuvring decision-making process remains insufficiently quantitatively described. In particular, there is a lack of research linking perception distortions resulting from headlight damage with the dynamic analysis of overtaking manoeuvres performed at night and in adverse weather conditions.
A particularly important role is played by the perception of the headlights of an oncoming vehicle, since under limited visibility conditions drivers frequently make manoeuvring decisions primarily based on the observation of light sources. Castro et al. demonstrated that the configuration of vehicle headlights affects the estimation of both the distance to the vehicle and its closing speed, which may lead to perceptual errors during night-time driving [13]. Similar conclusions were presented by Weaver et al., who indicated that changes in lighting configuration may influence the perceptual assessment of the time-to-arrival of an approaching vehicle as well as its identification by other road users [14].
The literature also emphasises the influence of glare and lighting asymmetry on the deterioration of the driver’s ability to correctly assess the traffic situation under night-time conditions. Studies conducted by Hu et al. demonstrated that the headlights of oncoming vehicles may significantly reduce the driver’s perceptual capability and increase the hazard recognition time [15].
This article examines the consequences of a road accident caused by a failure to notice an oncoming vehicle due to damaged headlamp. The simulation aims to assess how reduced visibility affects the course of the incident, as well as the dynamic and energetic parameters of the collision. The motivation for this topic lies in the need to quantitatively evaluate the consequences of a perceptual error resulting from a lighting malfunction –not only in the statistical aspect but, more importantly, in terms of collision mechanics.
The analysed headlamp malfunction was treated as a factor potentially disturbing the driver’s perception of the approaching vehicle under reduced visibility conditions. The study focused on the mechanism linking asymmetric light emission with the assessment of the available safety margin during the overtaking manoeuvre and with the subsequent dynamic consequences resulting from initiating the manoeuvre under insufficient spatial and temporal conditions.
This approach enables the perception of a lighting system malfunction not as a minor operational defect, but as a potential trigger for a chain of incidents that can lead to significant infrastructural, energy-related, structural, and human health consequences.
2. Factors Contributing to Lighting System Malfunctions in Vehicles
Vehicles operating without operational lighting systems can be observed on roads more and more frequently. Examples of such situations are shown in Figure 1.
Figure 1.
Examples of vehicles driven without a fully operational lighting system.
Lighting system malfunctions in motor vehicles constitute a complex technical problem with a multifactorial nature. Failures rarely result from a single cause; much more often, they are the consequence of several factors acting simultaneously. Modern systems are integrated electro-optical-thermal assemblies, in which thermal, electrical, and mechanical interactions mutually determine the overall system reliability [16,17,18,19,20]. Lighting system failures rarely have a single-factor origin, and their genesis stems from the accumulation of degradation processes over time. Factors contributing to vehicle lighting system malfunctions can be classified into four groups, as shown in Figure 2.
Figure 2.
Factors contributing to lighting system malfunctions in vehicles.
The first group comprises causes directly related to the construction and durability of the lighting system components. For traditional halogen light sources, the dominant failure mechanism is thermal fatigue of the tungsten filament, resulting from repeated heating and cooling cycles. This process leads to a gradual reduction in the filament’s effective cross-section, ultimately causing the filament to break. In high-intensity discharge (HID) lamps, electrode degradation and changes in the electrical arc parameters are observed, whereas in LED systems, significant factors include ageing of the semiconductor structure and failures in the control systems [21,22]. In that case, malfunction often manifests as a gradual reduction in the luminous flux rather than a sudden loss of emission [23,24]. Electrical installation components are equally important in system reliability [25]. Corrosion of contacts, increased contact resistance, microcracks in solder joints, and the degradation of wire insulation lead to supply voltage drops.
Optical components such as reflectors, lenses, and seals are also of significant importance. Degradation of polymer materials under UV radiation and temperature fluctuations result in surface hazing and reduced light transmission [26]. Housing leaks allow moisture ingress, initiating secondary corrosion processes [27].
The second group comprises environmental influences. These factors are a key element initiating and accelerating the degradation process [28]. Moisture and road salt accelerate galvanic corrosion of metal components [29]. A corroded headlamp nut can result in headlamp misalignment [30]. Temperature fluctuations promote condensation of water vapour inside lamp housings, leading to short circuits and contact degradation. Vibrations generated during driving on uneven surfaces accelerate mechanical fatigue of soldered joints and mounting components. These factors do not directly cause failures but increase the likelihood of their occurrence by accelerating wear and ageing processes.
The next group of factors is related to vehicle operation. The intensity of vehicle use significantly affects the durability of the lighting system. A high number of on-off cycles increases thermal stress on halogen light sources. Driving under adverse weather conditions (precipitation, fog, low temperatures) leads to more frequent use of the lighting system, thereby reducing its service life [31].
Vehicle ageing leads to the accumulation of micro-damages and gradual degradation of insulation and electrical connections [32], ultimately resulting in failures that may occur even after hundreds of hours of driving [33].
The final group comprises causes arising from improper maintenance practices and operational neglect. Installation of low-quality replacement parts, use of non-approved light sources, or incorrect wiring connections after bodywork repairs can result in circuit overloads and damage to control modules. The absence of periodic technical inspections allows defects to persist for extended periods, thereby increasing the risk of road incidents.
3. Statistics on the Instances of Lighting System Damage
Table 1 presents the monthly number of diagnosed lighting system failures in passenger cars in 2021–2025. The data were collected from several regional vehicle inspection stations and authorised repair workshops located in the Małopolskie Region (Poland).
Table 1.
Number of instances of diagnosed lighting system damage in passenger cars.
The analysed instances of lighting system damage primarily involved failures resulting in the absence of light emission from the respective lamp, both at the front and rear of the vehicle. In practice, this included inoperative headlamps (the dipped beam, high beam and position lights) as well as rear lamps (position and brake lights, traffic indicators and the rear fog light). The most frequently identified causes included the burnout of the light source (in the case of halogen bulbs), damage to LED modules, failures of converters in xenon systems, gaps in the electrical circuit, corrosion of contacts, and mechanical damage to the lamp housing leading to leaks and degradation of electronic components.
A common feature of the analysed defects was their functional effect, manifesting as a complete lack of shining of the given light point, which directly impairs the vehicle’s visibility and its perception by other road users. Accordingly, the “lighting system damage” category adopted in the analysis refers to failures that prevent a lamp from fulfilling its primary signalling or lighting function, regardless of lamp location in the front or rear part of the vehicle body.
Based on the presented data, a seasonality analysis was conducted using Formula (1). In the case of the analysed instances of lighting system damage in passenger vehicles, the determination of seasonal indices enables the quantitative identification of months in which the number of failures significantly deviates from the mean level.
where
- —the mean number of failures in a given month
- —the overall monthly mean across the entire period
Using the above formula, the seasonal index for the various months was determined, and the results are presented in Figure 3.
Figure 3.
Seasonal index by month.
The obtained results confirm that the lowest level of diagnosed damage was recorded in January, indicating that the number of defects in that month was approximately one third lower than the average. A consistent increase is noted in the following months, with values close to the average occurring in spring (April–June).
A clear peak occurs in the summer months, particularly in August. This indicates that the number of diagnosed defects in that month was on average 31% higher than the annual average. Increased values are also observed in July, September, and November. The high number of defects in the summer holiday period may be associated with increased traffic intensity, greater vehicle mileage, and more frequent minor collisions, particularly in parking areas. The rise in November, on the other hand, may be related to deteriorating lighting conditions (an earlier onset of darkness) and seasonal inspections of the lighting system before winter.
To assess the direction of changes in the annual number of instances of diagnosed lighting system damage in passenger cars in 2021–2025, a classical linear regression model estimated by the least squares method was applied. The analysis considered the annual totals, determined on the basis of monthly data obtained from vehicle inspection stations and authorised repair workshops.
For modelling the number of instances of diagnosed lighting system damage in passenger vehicles for the years 2026–2028, a continuous Poisson process model with time-dependent intensity was employed. This approach is appropriate for count data describing the number of incidents per unit of time, while simultaneously allowing the incorporation of both long-term trends and annual seasonality [34,35,36]. This model represents an extension of the previously conducted seasonal index analysis.
The model assumes that the number of incidents over time follows a non-homogeneous Poisson process with intensity function [37,38], such that:
The cumulative intensity function is determined from Formula (2):
The process intensity was assumed in the form of (3):
where:
- —time in months
- —annual frequency
- —intercept, amounting to: 4.032 (determined for the analysed data)
- —trend parameter, equal to: −0.0027 (determined for the analysed data)
- —seasonality parameter, equal to: −0.109 (determined for the analysed data)
- —seasonality parameter, equal to: −0.167 (determined for the analysed data)
The use of the exponential function ensures the positivity of the intensity. The model was estimated using the maximum likelihood estimation method within a Poisson regression framework with a log link function.
All parameters, except for the intercept, are statistically significant (p < 0.05).
The pseudo-coefficient of determination is , indicating a good adjustment of the model to the data.
The interpretation of the trend parameter indicates a very gentle downward trend. In exponential terms:
which means a decrease in the expected number of defects by approximately 0.27% per month. On an annual scale, this corresponds to a reduction of approximately 3%. This indicates that during the analysed period there is no emerging technical problem regarding the operational condition of the lighting system; rather, the situation is stable with a slight downward trend.
The parameters associated with the harmonic components (sine and cosine) confirm a significant seasonality of the phenomenon. The seasonal amplitude determined by relation (4)
indicates clear annual fluctuations. The maxima of intensity occur during the summer months, which is consistent with the previously determined seasonal index, whereas minima are noted at the beginning of the calendar year. This means that the number of identified lighting system defects, including both headlamps and rear lamps failing to perform their lighting function, follows a regular annual cycle.
The forecast prepared for the years 2026–2028 indicates the continuation of the seasonal pattern, without any abrupt increase in the number of defects. The expected number of cases will continue to oscillate around the current level, with cyclic increases during the summer periods and decreases in the winter months. There are no reasons to anticipate a dynamic escalation of the problem, provided that no significant changes occur in vehicle user behaviour or operational conditions.
Figure 4 presents the monthly pattern of the number of instances of diagnosed lighting system damage in passenger vehicles in 2021–2025, together with the forecast for 2026–2028 obtained on the basis of a Poisson process model with seasonally varying intensity.
Figure 4.
Actual and forecast number of vehicles with a non-operational lighting system.
In some of the actual results, a clear short-term irregularity is evident. In various years, abrupt changes in values between consecutive months can be noted, indicating considerable process variance. There are both episodes of increased numbers of reports exceeding 70–80 cases per month and periods of decline to approximately 20–30 incidents. This variability is non-monotonic in nature and does not indicate a clear upward or downward trend within the analysed historical horizon. From a long-term perspective, the values oscillate around a relatively stable mean level, suggesting the absence of a structural change in the frequency of failure occurrence.
The forecast part of the diagram is distinctly smoothed in nature. This stems from the fact that the model describes the estimated intensity function , while the presented curve represents the expected value of the number of incidents in successive months. In contrast to the empirical data, the forecast does not include random extreme deviations but instead reflects the consistent component of the process. The expected monthly values for 2026–2028 remain within a moderate range and do not exhibit a tendency towards exponential growth or abrupt decline. The forecast maxima are lower than the highest empirical observations, indicating that the extreme values recorded in previous years were incidental and do not constitute a persistent structural trend. The forecast minima do not reach the low levels noted in certain individual historical months, either, which confirms the symmetric nature of the estimated intensity function.
The analysis of the entire time horizon leads to the conclusion that the number of diagnosed instances of lighting system damage does not exhibit strong upward dynamics in the long-term perspective. The process is distinguished by relative stability of the mean level, accompanied by significant short-term variability. The forecast for 2026–2028 indicates the continuation of the current scale of the phenomenon, with no signals suggesting a progressive deterioration in the technical condition of passenger vehicle lighting systems.
4. Analysis of the Influence of Perceptual Error on the Overtaking Manoeuvre
Studies concerning road traffic safety indicate that night-time conditions and limited visibility significantly affect drivers’ ability to correctly assess the traffic situation. Kang et al. [39] demonstrated that adverse weather conditions, such as snowfall or rainfall, substantially reduce the ability to identify approaching vehicles properly, particularly under conditions of asymmetric light emission.
The literature also emphasises that headlamp asymmetry and reduced object contrast may lead to incorrect estimation of both distance and the time required to safely complete an overtaking manoeuvre. Mandal et al. [40] showed that during night-time driving, drivers make overtaking decisions primarily on the basis of the perceived light signals emitted by approaching vehicles, which under limited visibility conditions may result in incorrect assessment of the available safety margin.
Numerous studies related to night-time driving safety also highlight the phenomenon of “overdriving headlights”, in which a vehicle is operated at a speed exceeding the effective visible stopping distance [41]. Under such conditions, the driver initiates a manoeuvre while the actual safety distance remains shorter than the distance required to avoid a collision.
To quantitatively describe the transition from the driver’s perceptual error to an operational error, a simplified analytical safety model of the overtaking manoeuvre under limited visibility conditions was developed. The proposed model complements the performed dynamic simulations and enables explanation of the mechanism by which asymmetric light emission could lead to incorrect assessment of the traffic situation and initiation of the overtaking manoeuvre with an insufficient safety margin.
In the proposed model, it was assumed that the minimum distance required for safe completion of the overtaking manoeuvre, may be determined using Equation (5).
where
- —approaching speed of vehicles
- —time needed to perform an overtaking manoeuvre, determined on the basis of the relationship (6)
- —effective length of the overtaking manoeuvre
- —speed of the overtaking vehicle
- —speed of the vehicle being overtaken
The approach speed of the vehicles was determined from the relationship (7):
where
- —speed of the vehicle approaching from the opposite direction
Under the analysed environmental conditions, the actual visibility distance was assumed as , corresponding to night-time conditions, heavy snowfall, and the absence of roadway infrastructure lighting.
In order to quantitatively describe the perceptual disturbance, a perception error coefficient was introduced according to Equation (8).
The coefficient defines the degree of overestimation of the available safety distance by the driver of the overtaking vehicle.
Figure 5a presents the calculation results for the required safety distance as a function of the assumed speed of the overtaking vehicle. In each analysed case, the required safety distance significantly exceeded the actual visibility distance of approximately 20 m. Therefore, the safe completion of the overtaking manoeuvre was physically impossible under the analysed road conditions. Consequently, the initiation of the manoeuvre could only result from an incorrect interpretation of the approaching vehicle caused by the asymmetry of light emission.
Figure 5.
(a) Required safety distance depending on the speed of the overtaking car; (b) perception error coefficient depending on the speed of the overtaking car.
Figure 5b shows the change in the perception error coefficient as a function of the speed of the overtaking vehicle. The calculated coefficient values indicate that the driver of the overtaking vehicle must have perceived the available distance as approximately two to more than three times greater than the actual distance to consider the manoeuvre subjectively feasible.
To further assess the criticality of the situation, the time-to-collision parameter () was determined using Formula (9).
For the analysed speed variants, the following values were obtained, which are presented in Figure 6.
Figure 6.
The value of the time-to-collision parameter depending on the speed of the overtaking car.
The calculated values remain significantly lower than the typical driver reaction time reported in the literature, amounting to approximately 1.0–1.5 s [42]. This indicates that after recognising the actual nature of the object, the driver no longer had sufficient time to avoid the collision effectively.
The obtained results therefore confirm the direct transition from perceptual disturbance to an operational error. It should be concluded that the asymmetry of the lighting system did not physically force the collision itself, but rather affected the driver’s incorrect interpretation of the traffic situation, leading to the initiation of the overtaking manoeuvre with an insufficient safety margin. The subsequent development of the incident resulted from the dynamic limitations of the vehicle–road system under conditions of reduced adhesion and limited visibility.
The results obtained from the perceptual analysis presented in this section will serve as the basis for defining the conditions adopted in the subsequent simulation experiments.
5. Simulation Conditions
The values of the perception error coefficient and the Time-to-Collision (TTC) parameter determined in the previous section demonstrated that asymmetry of light emission could have led to an incorrect assessment of the traffic situation by the driver of the overtaking vehicle. This means that the driver may have subjectively perceived the overtaking manoeuvre as safe despite the actually limited safety margin resulting from nighttime conditions and restricted visibility.
Consequently, the simulation scenarios presented in this section were developed in order to reproduce the dynamic consequences of the previously identified perceptual disturbance. The adopted vehicle speeds, road conditions, visibility limitations, and vehicle trajectories were selected in such a way as to enable analysis of the influence of an incorrect manoeuvring decision on the subsequent development of the collision situation.
The simulation analysis considered three vehicles representing typical passenger cars, differing in their role in the analysed traffic incident and in their operational characteristics. The first model was adopted as the overtaken vehicle, the second as the vehicle performing the overtaking manoeuvre, while the third represented a car with a malfunctioning left headlamp.
The conducted analyses assumed different motion conditions for the various simulation participants, corresponding to typical situations encountered during the overtaking manoeuvre. The overtaken vehicle travelled at a constant speed of 45 km/h, maintaining an unchanged trajectory throughout the entire duration of the experiment. An analogous assumption of constant speed was adopted for the third vehicle, which moved at 50 km/h. In its case, an additional malfunction was introduced consisting of the absence of light emission from the left headlamp, resulting in deteriorated perception conditions for the remaining road users.
A different approach was adopted for the vehicle performing the overtaking manoeuvre. To assess the effect of increased speed on the course of the incident and the safety margin, a series of simulations was conducted for several scenarios. In successive experiments, immediately prior to the collision this vehicle was travelling at 60 km/h, 70 km/h, and 80 km/h, respectively. The proposed speed variants correspond to situations in which the driver initiates the overtaking manoeuvre under the assumption that sufficient distance is available to complete the manoeuvre safely. Such an approach enabled the transition from the analysis of perceptual error to the numerical reconstruction of the subsequent development of the road incident under conditions of reduced adhesion and limited visibility.
5.1. Vehicle Characteristics
The adopted vehicle models reflect the diversity encountered in real road traffic in terms of body dimensions, mass, dynamic parameters, and tyres. The overtaking vehicle is distinguished by more favourable traction properties and greater acceleration potential, which determines a shorter time required to complete the manoeuvre. In turn, the overtaken vehicle represents a class with moderate performance, typical of popular cars used in everyday traffic. The lightest of the analysed models, equipped with a less powerful power unit, constitutes an example of a vehicle with lower driving dynamics, in which an additional malfunction of an exterior lighting system component was introduced. The detailed technical data are summarised in Table 2.
Table 2.
Characteristics of vehicles used in the simulation.
In all cases, an identical, nominal technical condition of the remaining components was assumed in order to eliminate the influence of additional factors that could distort the simulation results. In particular, the presence of active safety systems, such as ABS and ESP, was assumed. Standardising this equipment enabled the analysis to focus on the effect of vehicle visibility resulting from the lighting system defect, without altering the ability to maintain stability or braking efficiency. This methodological approach enables the comparison of the course of the manoeuvre under conditions that are as similar as possible. Differences in vehicle motion dynamics arise primarily from the structural characteristics of the models. Reduced visual perception caused by the vehicle with a damaged headlamp remains the element of the experiment.
In the conducted analyses, no differentiation was made in the number of occupants in the various vehicles. It was assumed that this variable does not significantly affect the course of the simulated traffic incidents or the kinematic relationships between the participants in the manoeuvre. Accordingly, the number of passengers was not a parameter influencing the results and was therefore omitted in the modelling process.
5.2. Road and Environmental Conditions
The simulated incident was located on a section of a single carriageway road outside a built-up area, where a speed limit of 90 km/h applies. The choice of such a traffic environment was dictated by its representativeness for situations in which overtaking manoeuvres are performed at relatively high velocities, while no additional infrastructural light sources are present to aid driver visibility.
The cross section geometry was adopted in accordance with the layout presented in Figure 7. The model included a two-way roadway of constant width, bordered on both sides by soft shoulders and subsequently by earth structures in the form of embankments and ditches. The road axis was defined centrally within the roadway. Such representation allows for the preservation of realistic vehicle driving conditions and enables the analysis of potential consequences in the event of a vehicle departing from the hard pavement.
Figure 7.
Road cross section [in metres].
The research scenario accounted for the occurrence of heavy snowfall. Such weather conditions lead to a reduction in the visibility range, decreased contrast of observed objects, and impaired ability to accurately assess the distance and speed of other road users. The presence of snow and moisture on the road surface also results in a significant reduction in tyre/pavement adhesion, which directly translates into longer braking distances and an increased risk of directional stability loss.
The wheel-surface contact model parameters were selected to correspond to a roadway covered with wet snow. It was therefore assumed that:
- The adhesive coefficient of adhesion was αp = 0.20
- The sliding coefficient of adhesion was αp = 0.15
- The rolling resistance coefficient was 0.020
- The ground stiffness coefficient was 10,000 kN/m3
The values of the coefficients of adhesion limited the generation of longitudinal and lateral forces, enforcing more cautious driving conditions and increasing the system’s sensitivity to disturbances resulting from misperception of the situation on the road. The shoulders and embankments also exhibited poorer traction characteristics, which exacerbated the negative consequences of a potential departure from the roadway.
5.3. Simulation Assumptions
At the beginning of the chapter, it was noted that vehicle 1 and vehicle 3 travelled at constant speed, whereas vehicle 2 had a different speed in each simulation (ranging from 60 to 80 km/h).
The vehicle velocities were deliberately selected to reflect realistic relationships between road users during the overtaking manoeuvre on a rural road. The velocities of the vehicles travelling at a constant rate were set at levels typical for drivers who, due to prevailing road conditions, do not take advantage of the full permitted speed. It is appropriate to recall that the traffic occurred during heavy snowfall and in the afternoon hours, when it was already dark. It is important to note at this point that in winter, evening falls earlier, with darkness setting in as early as after 3.30 pm. No street lighting was present along the road, and visibility was reduced to 20 m. Figure 8 presents the road visibility from the perspective of each driver.
Figure 8.
Road visibility from the driver’s perspective: (a) vehicle 1; (b) vehicle 2; (c) vehicle 3.
The inclusion in the model of a scenario in which the driver of the overtaking vehicle decides to perform the manoeuvre despite night-time and during heavy snowfall was intentional and aimed at replicating road users’ realistic behaviours. Accident analyses indicate that decisions to overtake are often made not only on the basis of objective environmental conditions but also under the influence of a subjective assessment of the situation, time pressure, confidence in one’s driving skills, or the belief in the vehicle’s sufficient dynamic capabilities.
The fact that the overtaken vehicle was moving at a speed considerably lower than the permitted limit could have acted as a stimulus prompting the driver of vehicle 2 to attempt to overtake the former vehicle. In road traffic practice, such speed differences are among the most common reasons for initiating the overtaking manoeuvre, even in situations where visibility conditions are unfavourable. Moreover, the driver may wrongly assume that increasing the speed of their own vehicle will shorten the time spent in the lane designated for oncoming traffic, thereby reducing exposure to a potential hazard.
In the case under analysis, a significant factor influencing the decision-making process was the malfunction of the left headlamp on the oncoming vehicle. The asymmetry of the emitted light could lead to a distorted assessment of the type of object located in front of the overtaking vehicle. Under night-time conditions and during heavy snowfall, a single point of light may be interpreted as the headlight of a single-track vehicle, whose lane occupancy is considerably narrower than that of a passenger car. Such perception is conducive to the belief that it is possible to safely fit within the available road width and complete the manoeuvre before reaching the scene of a potential road incident.
In the simulation model, the vehicle trajectories were adopted in accordance with the pattern presented in Figure 9. This scenario corresponds to situations observed in real-world winter driving, where the central part of the roadway remains passable while the shoulders are not fully cleared of snow. As a result, drivers tend to keep their vehicles within the portion of the pavement that provides relatively the best adhesion conditions and the lowest risk of the loss of stability. Indeed, the presence of unploughed areas at roadway edges creates both a psychological and physical barrier, limiting drivers’ willingness to drive closer to the shoulder. Even minor encroachment onto a layer of snow can lead to abrupt changes in the coefficient of friction, steering disturbances, and the generation of destabilising moments on the vehicle.
Figure 9.
Vehicle trajectory.
For this reason, the simulation assumed that vehicles maintain a lateral offset from the roadway edge, remaining within the part of the lane considered by drivers to be the safest. Such behaviour is consistent with observations of traffic in winter conditions, where drivers intuitively concentrate their trajectory within areas cleared by previous passages of other vehicles. This results in the narrowing of the effectively used roadway width, even though the geometric width remains unchanged.
5.4. Software Used for Road Traffic Incident Simulation
For the purpose of conducting simulation analyses, the specialised V-SIM Crash 7.0 offered by CYBID was employed. This programme constitutes an advanced simulation environment designed for vehicle traffic modelling and road incident reconstruction in a three-dimensional space, incorporating the principles of dynamics and interactions between the elements of the Environment–Human–Vehicle system.
V-SIM Crash 7.0 enables the analysis of manoeuvres and collisions involving various road users, including motor vehicles, pedestrians, cyclists, and operators of other transport equipment. The solution integrates motion dynamics models, a multibody modelling framework, and a comprehensive vehicle technical database, allowing for the creation of high-fidelity simulation scenarios.
The software provides a fully featured 3D visualisation environment, capable of accurately reproducing road geometry, terrain topography, and surrounding infrastructure. This functionality enables not only the analysis of traffic behaviour itself but also the assessment of the impact of environmental factors on the course of the incident. The system incorporates physical models of forces acting on vehicles as well as tyre-road interaction models, enabling reliable reproduction of phenomena such as braking, acceleration, and wheel slip under conditions of reduced adhesion.
V-SIM Crash 7.0 is applied both in scientific research and in forensic expert analyses, as well as in investigations conducted by technical services and insurance companies. Owing to the integration of reconstruction and modelling functionalities, the software enables the generation of detailed simulation results that a basis for assessing the causes and mechanisms of road incidents.
6. Simulation Results
This chapter presents the results of the computer simulations performed for the adopted speed scenarios and the defined environmental conditions. The presented data include vehicle kinematic parameters, the course of the manoeuvres, and changes in safety levels resulting from lighting system malfunctions. The obtained results constitute the basis for further analysis and interpretation of the mechanisms leading to the emergence of hazardous situations.
6.1. Vehicle Trajectories After the Road Incident and the Extent of Vehicle Damage
6.1.1. The Speed of Vehicle 2 Equal to 60 km/h
The interpretation of the course of the road incident for the case in which the speed of vehicle 2 was 60 km/h was conducted on the basis of the vehicle trajectories and orientation changes presented in Figure 10.
Figure 10.
Post-accident vehicle trajectories in the simulation scenario where the speed of the overtaking vehicle was 60 km/h.
As a result of a side-swipe, vehicle 1 (red) was subjected to an impulse, which caused a rapid increase in sideway drift and the initiation of rotation about the vertical axis. In the initial phase, the vehicle continued to move on a wet but hard pavement, which provided limited capability to counteract the skid. As the vehicle body yaw angle increased, the effectiveness of lateral tyre-generated forces gradually decreased, and the vehicle began to move toward the right edge of the roadway.
According to the trajectory illustrated in the figure, a reversal of vehicle orientation occurred, after which the vehicle proceeded in reverse motion towards the right road edge. In this phase, the vehicle was in a developed skid, and the driver’s ability to influence the trajectory was practically eliminated. Crossing the roadway boundary and entering the snow-covered shoulder resulted in a further reduction in adhesion, thereby reinforcing the uncontrolled nature of the motion.
Continuing to move in reverse, the vehicle slid into the roadside ditch. The elevation difference and the resistance generated by the soft ground led to a rapid dissipation of kinetic energy and attenuation of rotational motion. The vehicle’s final position was within the ditch, with the vehicle body oriented opposite to the original driving direction.
Vehicle 2 (green), travelling at 60 km/h, experienced a deviation from its initial trajectory and partial rotation following the collision; however, that vehicle was initially moving within the roadway boundaries. Over time, an increasing sideway drift is observed, accompanied by a gradual shift toward the right lane edge. A critical moment occurred when the boundary of the cleared pavement was crossed. When the vehicle moved onto the snow-covered shoulder, a clear increase in skid severity was observed, accompanied by a further reduction in stabilisation capability and uncontrolled sliding down toward the ditch. Ultimately, the vehicle departed from the road crown and stopped within the roadside ditch. The magnitude of rotation was lower than that observed for vehicle 1; however, the difference in adhesion proved sufficient to prevent a return to the roadway.
The trajectory of vehicle 3 (yellow) indicates motion along a curve with increasing sideway drift. After the initial phase of movement on wet asphalt, the vehicle gradually lost its directional stability and approached the shoulder zone. At the moment of contact with the snow-covered surface, a further reduction in adhesion occurred, leading to the consolidation of the lateral skid. Despite exhibiting lower dynamic intensity than the red vehicle, this vehicle was likewise unable to stop on the hard pavement and ultimately fell into the ditch, where deceleration and final rest occurred.
The course of the road traffic incident comprised two principal phases of contact between the road users, as illustrated in Figure 11.
Figure 11.
(a) stage 1; (b) stage of the road collision at an overtaking vehicle speed of 60 km/h.
In the first phase, recorded at t = 0.210 s from the start of the simulation, vehicle 2 impacted the left-front corner of vehicle 3. The incident was distinguished by high energy transfer and involved the frontal crumple zones of both vehicles. In vehicle 2, deformation primarily affected the front body structure in the bumper corner area, the headlamp area, and the front-end module responsible for collision energy absorption.
The second phase of the incident occurred at 0.325 s and had a nature of a secondary contact between vehicle 1 and vehicle 2. At this moment, relative velocities had already been significantly reduced, which was reflected in a substantially lower extent of deformation. Damage to vehicle 1 was concentrated in the lateral body zone, particularly in the area of the front wheel and the lower sections of the doors and sill.
6.1.2. The Speed of Vehicle 2 Equal to 70 km/h
The interpretation of the course of the road incident for the case in which the speed of vehicle 2 was 70 km/h was conducted on the basis of the vehicle trajectories and orientation changes presented in Figure 12.
Figure 12.
Post-accident vehicle trajectories in the simulation scenario where the speed of the overtaking vehicle was 70 km/h.
The post-accident vehicle trajectories obtained in the scenario where the overtaking vehicle was travelling at 70 km/h indicate a very high degree of consistency with the course of the incident for 60 km/h. The same pattern of incident development was preserved, including impulse transfer during the contact phase, the initiation of rotational motion, the progressive increase in sideway drift, and the loss of effective trajectory stabilisation after crossing the boundary between the cleared, yet wet roadway and the snow-covered shoulder. In both cases, the consequence was departure from the lane and final stop of the vehicles in roadside ditches.
The differences between the analysed scenarios are quantitative rather than qualitative. A higher initial speed of the overtaking vehicle increases the kinetic energy available at the moment of contact, which translates into more intense interactions between the vehicles. As a result, higher values of impulses exchanged during the collision are observed, along with a more dynamic development of rotation and an extended distance covered in a skid before the complete stop. The time required for motion attenuation also increases, particularly after entering the areas of reduced adhesion.
The increase in kinetic energy is directly reflected in the extent of structural damage. At a higher speed, deeper penetration into the crumple zones, larger displacements of body panels, and more intensive loading of the load-bearing structures will occur. Consequently, both the deformation depths and the corresponding equivalent energy speed will increase. Despite these differences, the geometric picture of the incident remains analogous to the 60 km/h scenario—the sequence of phases, directions of vehicle movements, and places where the vehicles have departed from the roadway are practically identical.
The course of the road traffic incident comprised two principal phases of contact between the road users, as illustrated in Figure 13.
Figure 13.
(a) stage 1; (b) stage 2 of the road collision at an overtaking vehicle speed of 70 km/h.
In the first phase, recorded at t = 0.196 s, a collision occurred between vehicle 2 and vehicle 3. Vehicle 1 did not participate in this contact phase. According to the geometry illustrated in the figure, the impact occurred at the left-front corner of vehicle 3, with the point of force application slightly differently located compared to the 60 km/h scenario, which influenced the subsequent rotation dynamics. In vehicle 2, deformation affected the front-end body components, particularly the bumper corner, the headlamp area, and the front-end module structure. In vehicle 3, the damage encompassed the left-front corner, the wheel arch area, and the initial sections of the longitudinal structural components.
The second phase of the incident occurred at t = 0.307 s at which point the secondary contact between vehicle 1 and vehicle 2 occurred. At this stage, the system’s kinetic energy had already been substantially reduced. The damage zone in vehicle 1 comprised the lateral body section in the area of the front wheel and the lower portions of the doors and sill.
6.1.3. The Speed of Vehicle 2 Equal to 80 km/h
The interpretation of the course of the road incident with the speed of vehicle 2 being 80 km/h was conducted on the basis of the vehicle trajectories and orientation changes presented in Figure 14.
Figure 14.
Post-accident vehicle trajectories in the simulation scenario where the speed of the overtaking vehicle was 80 km/h.
In the conducted simulation, the course of the incident was sequentially consistent with the scenarios analysed at lower velocities, yet that course was distinguished by significantly higher dynamics of displacements and a different final configuration of some collision participants. The increased kinetic energy resulting from the vehicle collision affected both the lengths of the post-accident trajectories and the intensity of rotational motion developed after the first contact phase.
Immediately following the impact, rapid growth of rotational movements occurred due to the eccentric application of forces. The vehicles lost directional stability while still on the roadway, and further motion took place as a skid with rotation around the vertical axis at the same time. Upon entering the snow-covered shoulders, the conditions of tyre-road interaction deteriorated further, practically preventing the drivers from performing effective corrective actions. As a result, the vehicles departed from the roadway and moved toward the roadside ditches, where the energy was ultimately dissipated.
Compared to the previous simulations, the final position of vehicle 3 changed. Although the initiating mechanism of the incident remained analogous, the higher magnitude of the transferred impulse and the modified interaction conditions during rotation resulted in a different orientation of the vehicle when it came to a stop. This indicates a high sensitivity of the final configuration to minor variations in the collision phase as the system’s energy increases.
The trajectories of the remaining participants preserved the general trend observed previously; however, the displacement distances were greater and the rotation angles were bigger. In particular, vehicle 1, following incidental contact, was subjected to a strong lateral impulse that led to a rapid development of rotation and significant displacement toward the roadside zone.
The course of the road traffic incident comprised two principal phases of contact between the road users, as illustrated in Figure 15.
Figure 15.
(a) stage 1; (b) stage 2 of the road collision at an overtaking vehicle speed of 80 km/h.
The first contact was recorded after t = 0.183 s from the start of the simulation and involved vehicle 2 and vehicle 3. Vehicle 1 did not participate in this phase of the incident. According to the area indicated in the figure, the impact occurred between the front section of vehicle 2 and the left-front corner of vehicle 3. Deformation affected the bumper components, front-end module, and energy-absorbing structures in both vehicles; however, in vehicle 3, the damage penetrated deeper into the longitudinal members and the wheel arch zone.
The eccentric application of the force resulted in a distinct reduction in translational motion accompanied by the generation of significant torques. Consequently, both vehicles initiated intensive rotation, which determined the subsequent development of the incident and led to trajectory alterations observed in the following phases.
The subsequent collision phase occurred after t = 0.292 s and was a consequence of the preceding rotational displacements. Only at this stage did vehicle 1 become involved in the incident. Contact occurred between the lateral section of vehicle 1, including the front door area, and the rear lateral zone of vehicle 2, primarily in the rear door area. The significant vehicle body position angles resulted in the transfer of an impulse with a substantial lateral component, promoting a further increase in angular velocities and reinforcing the state of instability.
6.1.4. Car Collision Parameters
In order to evaluate the intensity of the dynamic interactions occurring during the analysed collisions, an analysis of the parameters describing the contact characteristics and the extent of structural damage to the vehicles was carried out. The analysis included deformation depth, Equivalent Energy Speed (EES), and the coefficient of restitution. These parameters make it possible to determine the level of energy absorption by the vehicle bodies, assess the nature of the collision, and identify the dominant mechanisms of energy dissipation during subsequent phases of contact. The obtained parameter values are presented in Table 3, Table 4 and Table 5.
Table 3.
Speed of the overtaking vehicle—60 km/h.
Table 4.
Speed of the overtaking vehicle—70 km/h.
Table 5.
Speed of the overtaking vehicle—80 km/h.
The obtained results indicate that the speed of the overtaking vehicle had a crucial influence on the course of the entire event and the level of generated damage. As the speed increased from 60 to 80 km/h, a clear increase in both deformation depth and EES values was observed during the first phase of contact. This phenomenon results directly of kinetic energy, whose value increases proportionally to the square of velocity. Consequently, even a relatively small increase in speed before the collision led to a significant rise in the amount of energy transferred between the vehicles.
At lower speeds, the contact still exhibited a high-energy character; however, the deformations were mainly concentrated within the front crumple zones. As the vehicle speed increased, the amount of energy transferred during the impact became significantly greater, leading to deeper penetration of the load-bearing structures and more extensive damage development in the longitudinal members, wheel arch regions, and front body section. At the same time, the influence of the transverse components of the impact force increased, contributing to the development of rotational motion of the vehicles after the collision.
The eccentric nature of the impact also played a significant role. The contact did not occur centrally with respect to the longitudinal axes of the vehicles; therefore, in addition to rapid deceleration, impact moments were generated, inducing vehicle rotation. At higher speeds, the rotational motion developed much more intensively, leading to a faster loss of directional stability and an increase in the length of the post-impact trajectories.
The low values of the coefficient of restitution obtained during the first phase of the collision indicate that the contact was predominantly inelastic in nature. Most of the energy was absorbed through permanent structural deformations of the vehicles, while only a small portion was recovered after impact. This means that the kinetic energy was almost entirely dissipated within the crumple zones. Such a collision response resulted not only from the high relative velocity of the vehicles, but also from the prevailing road conditions. The reduced tire–road adhesion caused the vehicles to enter a state of sliding immediately after impact, limiting the possibility of motion stabilisation and increasing the extent of uncontrolled post-impact displacement.
The second phase of the event was distinctly less severe, since the secondary contact occurred after part of the energy had already been dissipated during the first stage of the collision. Nevertheless, the influence of the initial speed of the overtaking vehicle was also evident in this phase. As the speed increased, a greater amount of residual energy remained after the primary impact, resulting in a larger extent of deformation during the secondary collision. This indicates that the energy not dissipated during the first phase was directly transferred to the subsequent stage of the event.
The higher values of the coefficient of restitution obtained during the second stage indicate that the contact had a more elastic character compared to the first phase. This was primarily due to the lower amount of energy available during the collision, as well as the more lateral and partially tangential nature of the impact. At the same time, a gradual decrease in the coefficient of restitution was observed with increasing initial speed, indicating an increasing contribution of permanent deformations also during this phase of the event.
6.2. Kinetic Energy Generated as a Result of the Vehicle Collision
Kinetic energy plays a fundamental role in collision analysis and traffic accident reconstruction, as it constitutes the primary carrier of information regarding pre-impact conditions and the course of dynamic interactions. In accordance with classical laws of mechanics, a vehicle’s kinetic energy is associated with both its linear and rotational motion. Variations in this energy during the collision reflect the extent of deformation, the work performed by contact interactions, and the overall severity of the incident.
In expert practice, kinetic energy analysis is extended to include rotational motion and the vectors of the forces acting during the contact phase. The total kinetic energy of a vehicle may be expressed as the total of energy in translational and rotational motion (Formula (10)):
where
- —moment of inertia
- —angular speed
- —vehicle speed
In the context of energy-based methods, it is also essential to determine the work performed by the forces acting within the vehicle body deformation zone. In the energy–work model, the vehicle’s kinetic energy prior to contact is balanced by the work of deformation and may be calculated on the basis of Formula (11).
where
- —instantaneous impact force
- —deformation depth
A key characteristic of kinetic energy is its quadratic dependence on speed. The results obtained from the simulations (Figure 16):
Figure 16.
Change in kinetic energy as a function of driving speed: (a) first stage, (b) second stage.
In the first stage, vehicle 2 remains the primary carrier of energy, as –while performing the overtaking manoeuvre—it introduces the largest share of kinetic energy into the system. With the increasing initial speed, a consistent growth in the energy generated during this phase is observed, resulting in intensified interaction with vehicle 3 and a greater range of disturbance of its motion.
In the first stage, vehicle 3 absorbs the energy transmitted from vehicle 2 through the left front corner zone. For subsequent speed scenarios, the proportion of energy absorbed by the structure of vehicle 3 increases; however, the magnitude of this increase is lower than that observed for the initiating vehicle. This indicates that a significant portion of the energy remains within the system and is transferred in the form of translational and rotational kinetic energy, which directly affects the likelihood of subsequent impacts.
In the second phase of the incident, a substantial change in the structure of the energy balance occurs. Vehicle 1 becomes involved in the collision and begins to absorb energy resulting from the preceding displacements and rotation. It is also evident that the energy level associated with vehicle 2 continues to increase with the rising initial speed, despite the fact that a portion of the energy has already been dissipated during the first impact. This means that the energy introduced into the system by the overtaking vehicle is not fully expended in the primary phase but, to a significant extent, governs the course and severity of the secondary collision.
In the case of vehicle 1, a different trend can be noted. That vehicle’s energy contribution in the second stage does not increase proportionally with the increase in the initial speed of vehicle 2. This may be attributed to the altered geometric configuration at the moment of contact, as well as to the fact that at higher velocities a larger portion of the total energy is absorbed earlier through deformation of vehicles 2 and 3. Thus, vehicle 1 responds to a greater extent to the effects of prior energy redistribution than to the value of the initial speed itself.
The comparative analysis further indicates that, with increasing speed, the contribution of the transverse components of kinetic energy becomes more significant. This leads to higher torques and, consequently, to greater variability in vehicle orientation at the moment of the secondary impact. As a result, the distribution of energy among the involved vehicles is more complex, and the results exhibit increased sensitivity to variations in the course of the primary collision phase.
6.3. Resultant Force
In road accident reconstruction, the analysis of forces acting during a collision is based on the principle of conservation of momentum and on the impulse form of Newton’s second law of motion. During the contact phase, whose duration is measured in milliseconds, of key importance is the force impulse, which is calculated on the basis of Formula (12):
where:
- —impulse vector
- —instantaneous impact force
- —beginning and the end of the interaction phase, respectively
The variation in the collision force as a function of the travelling speed of the overtaking vehicle is presented in Figure 17, whereas the variation in the moment of force is shown in Figure 18.
Figure 17.
Change in the impact force as a function of driving speed: (a) first stage, (b) second stage.
Figure 18.
Change in the impact force moment as a function of driving speed: (a) first stage, (b) second stage.
In the first stage of the collision, a distinct and monotonic increase trend in the collision force is observed with increasing velocity of vehicle 2. The nature of this relationship is nearly linear within the analysed velocity range, indicating that the increment in momentum change increases proportionally with the initial speed.
It is noteworthy that the forces acting on vehicles 2 and 3 are very similar in magnitude, confirming the reciprocal nature of the dynamic interaction within the contact zone. The differences observed between those vehicles result from:
- different location of the centre of mass,
- differences in the stiffness of the front load-bearing structures,
- slight asymmetry of contact geometry.
The moment of force at this stage exhibits a more complex pattern. For vehicle 2, the change in the character of the moment with increasing velocity indicates a significant shift in the point of application of force relative to the centre of mass. This implies that at higher velocities, the rotational component of the interaction increases, resulting in a stronger tendency of the vehicle to rotate. For vehicle 3, the three instances of torque exhibit smaller amplitudes, suggesting a more centralised impact relative to its longitudinal axis.
In the second stage, the dynamics of the interactions undergoes a fundamental change. Contact forces increase with speed; however, their rate of growth varies markedly between vehicles.
Vehicle 1 demonstrates a consistent increase in the dynamic load with the increase in the initial speed of vehicle 2, which is a consequence of higher residual energy transmitted during the previous collision. As the velocity increases, the asymmetry of the interaction also grows, indicating that the contact becomes more oblique and less axial.
For vehicle 2, a clear dominance of force is observed at this stage at the highest analysed velocity. This stems from the fact that after the first collision, vehicle 2 retains a substantial component of kinetic energy and generates a significant force impulse during the secondary contact.
In the case of vehicle 3, the force values in the second stage remain relatively low compared to the other vehicles. This means that vehicle 3 participation in the secondary collision is marginal and does not generate a significant increase in the momentum change.
The moment of force in the second stage exhibits significant variability in both sign and amplitude among the vehicles. This indicates a change in the direction of vehicle rotation as well as a different nature of contact (lateral, oblique, or partially tangential).
For vehicle 1, the moment indicates a pronounced tendency to rotate around the vertical axis in a single dominant direction, with an increase in the initial speed resulting in enhanced rotation dynamics. This means that, as the system energy increases, both the linear and rotational dynamic responses become intensified.
Vehicle 2 shows strong variability in the moment with changes in velocity, reflecting a substantial shift in the point of application of force across the different scenarios. In contrast, vehicle 3 exhibits minimal moment values during the second stage, confirming that vehicle’s limited dynamic participation in that phase.
Figure 19 presents the analysis of post-accident velocity evolution for vehicles taking part in the road incident as a function of simulation time for all three scenarios, corresponding to the initial speed conditions (60, 70, and 80 km/h).
Figure 19.
Change in post-accident vehicle speed as a function of simulation time for the overtaking vehicle travelling at (a) 60 km/h, (b) 70 km/h, (c) 80 km/h.
In each scenario, the following phases can be distinguished: an impulse phase immediately following contact (up to approximately 0.3 s), a transitional phase with prevailing energy redistribution (up to approximately 2 s), and a motion-damping phase resulting from resistive interactions and energy losses in structural deformation and rotational motion.
During the first collision stage, velocity changes pertain to vehicles 2 and 3. Vehicle 2 undergoes a rapid deceleration, which is a consequence of the transfer of part of its momentum to vehicle 3 and the energy dissipated in the deformation of the front structures. Vehicle 1 moves at its initial speed, as that vehicle is not involved in the collision at this stage.
Vehicle 3 attains a post-accident speed resulting from the contact impulse; however, that speed is significantly lower than the initial speed of vehicle 2. The nature of the speed changes is typical for an oblique inelastic collision, in which, in addition to the translational component, a rotational component is also generated.
The second stage of the collision is primarily determined by the speed profile of vehicle 1. As a result of the secondary contact, vehicle 1 acquires a significant post-accident speed, followed by a rapid reduction associated with the onset of rotational motion. In all analysed scenarios, vehicle 1 rotates by 180°, with the moment of reaching this phase occurring after approximately 2 s from the start of the simulation (with minor variations depending on the speed scenario). Following completion of its rotation, vehicle 1 continues to move in the opposite direction to its initial trajectory, moving in reverse. The change in vehicle body orientation significantly alters the interaction with the surface. The contributions of rolling resistance and lateral friction increase, and this results in gradual speed reduction.
For an overtaking vehicle speed of 60 km/h, the reduction in speed of vehicle 1 after completing the rotation is relatively gentle, indicating a moderate level of residual energy. At 70 km/h, a noticeably higher dynamics of changes is noted during the first seconds of motion, and the linear stabilisation phase is shorter. In the 80 km/h scenario, the changes are the most abrupt; the initial post-accident speed is the highest, while the speed reduction process occurs more rapidly, indicating a larger contribution of dissipated energy to deformations and rotational motion.
Vehicle 2, participating in both stages of the collision, exhibits a two-stage speed reduction. The first decrease is associated with contact with vehicle 3, and the second results from secondary interaction within the three-vehicle system. After the second impulse, the speed decreases in a quasi-linear manner over time, indicating motion resistances domination over further contact interactions. As the initial speed increases, greater system inertia is observed, since vehicle 2 maintains a higher speed for a longer time despite larger energy losses in deformations.
Vehicle 3 exhibits a different kinematic behaviour. After the first stage, that vehicle attains a limited post-accident speed, which is then rapidly reduced. The lack of a significant speed increase during the second stage indicates that the vehicle’s dynamic participation in the subsequent phase of the incident is marginal. At higher initial velocities, a more abrupt speed reduction is observed, which can be linked to a greater amount of energy absorbed in deformations and more intense influence of friction.
7. Conclusions
The conducted simulation analysis enabled a quantitative assessment of the consequences of a road accident whose direct cause was a failure to notice an oncoming vehicle due to a malfunctioning headlamp. The obtained results indicate that reduced visibility is not merely a perceptual factor, but may initiate a sequence of incidents leading to significant dynamic and energy-related consequences.
The use of numerical modelling made it possible to analyse the overtaking manoeuvre under conditions of reduced adhesion and reduced visibility, and subsequently to evaluate the post-accident trajectories, changes in kinetic energy, and contact forces in the subsequent phases of the collision. The results confirmed that delayed detection of the vehicle leads to a reduced safety margin, an increase in relative velocity at the moment of contact, and intensified dynamic interactions.
The analysis of overtaking vehicle speed scenarios (60, 70, and 80 km/h) demonstrated a clear relationship between the increase in initial speed and the extent of deformation, the level of kinetic energy, and the magnitude of force impulses during the collision phase. Particular significance was attributed to the growth of rotational motion components, which, under conditions of reduced adhesion, led to the loss of stability and to the departure from the roadway by all the vehicles involved in the incident.
The conducted analyses demonstrated that in the case of an overtaking manoeuvre performed on a two-way road under night-time conditions and heavy snowfall, the malfunction of a single headlamp may constitute a significant factor influencing both the development of the traffic situation and the mechanism of collision occurrence. In the analysed case, the asymmetry of light emission disturbed the perception of the approaching vehicle from the opposite direction, making it difficult to assess its width, distance, and actual position on the roadway correctly. Under limited visibility conditions, a single light source could be incorrectly interpreted as the headlamp of a single-track vehicle or as a vehicle located at a greater distance than in reality. Consequently, the driver performing the overtaking manoeuvre made the manoeuvring decision based on an incorrectly estimated safety margin. The TTC analysis demonstrated that after recognising the actual hazard, the driver no longer had sufficient time to effectively withdraw from the overtaking manoeuvre.
The obtained results indicate that the malfunction of a single lighting system component may entail consequences extending beyond the purely operational aspect. Under specific road and environmental conditions, such malfunction may become a factor initiating a high-energy incident, the effects of which include extensive structural damage and substantial energy redistribution within a multi-vehicle system.
Based on the conducted research, the following conclusions may be formulated:
- The malfunction of the left headlamp of the oncoming vehicle led to an erroneous assessment of the situation on the road by the driver of the overtaking vehicle. This resulted in the initiation of the overtaking manoeuvre with insufficient time and distance to complete the manoeuvre safely.
- Under conditions of reduced visibility (night-time, heavy snowfall, absence of infrastructural lighting, visibility of approximately 20 m), the asymmetry of light emission significantly restricted the proper identification of the approaching vehicle, thereby increasing the risk of a head-on collision in the initiating phase of the incident.
- In each of the analysed speed scenarios of the overtaking vehicle (60, 70, and 80 km/h), the first stage of the collision between vehicles 2 and 3 was energy-dominant in nature, determining the subsequent course of the incident and the configuration of secondary collisions.
- The low value of the coefficient of restitution in the first phase of the collision (0.06–0.07) indicates the predominance of permanent deformations and a high level of energy absorption by the front structures of the vehicles, confirming the high-energy nature of the impact.
- The second stage of the incident (secondary contact between vehicle 1 and vehicle 2) was a direct consequence of energy redistribution after the first impact, and intensity of that stage increased with the rising speed of the overtaking vehicle.
- An increase in speed from 60 to 80 km/h resulted not only in greater deformation but also in a change in the final spatial configuration of the vehicles, confirming the high sensitivity of the dynamic system to relatively small changes in initial conditions.
- The applied Poisson process model, indicating the seasonality of lighting system failures, suggests that the problem is recurrent in nature. When combined with the dynamic analysis, this finding underlines the importance of the regular inspection and maintenance of vehicle lighting systems.
The obtained results also indicate that regular inspection and maintenance of vehicle lighting systems should be treated as an important component of preventive road safety management, particularly in regions characterised by adverse weather conditions and prolonged night-time driving periods. Even a partial lighting system malfunction may significantly disturb the perception of other road users and initiate hazardous manoeuvring decisions under limited visibility conditions.
From a practical perspective, the conducted analyses highlight the importance of periodic verification of headlamp operational condition, light emission symmetry, and proper alignment during technical inspections and routine vehicle maintenance procedures. Particular attention should be paid to vehicles operated under severe winter conditions, where moisture, road salt, and temperature fluctuations accelerate the degradation of lighting system components.
The presented results also indicate that road safety guidelines concerning night-time driving should account not only for reduced visibility itself, but also for the possibility of perceptual disturbances caused by asymmetric light emission. In conditions of snowfall, rainfall, fog, or the absence of infrastructural lighting, even a single malfunctioning headlamp may considerably alter the driver’s assessment of the traffic situation and reduce the available reaction time.
The conducted research therefore demonstrates that vehicle lighting system reliability should be considered not only from the perspective of vehicle operation and maintenance, but also as an important element of active road safety management and accident prevention strategies.
Funding
This research received no external funding.
Institutional Review Board Statement
Not applicable.
Informed Consent Statement
Not applicable.
Data Availability Statement
The data presented in this study are available on request from the corresponding author.
Conflicts of Interest
The author declares no conflicts of interest.
References
- Gökova, S. Driving Safety and Comfort: A Bibliometric Analysis of the Role of Automobile Headlights. Bilge Int. J. Sci. Technol. Res. 2025, 9, 36–52. [Google Scholar] [CrossRef] [Scilit]
- Wibowo, H.; Tunggadewi, N.R.; Sugiyarto; Marwanto, R.P.; Shofiah, S. Design and development of portable microcontroller based headlight tester for motor vehicle inspection. J. Energy Electr. Eng. 2026, 7, 71–76. [Google Scholar]
- Benea, B.C.; Trusca, D.D.; Toganel, G.R.; Radu, A.I. Pedestrian visibility at night: The influence of the pedestrian clothing and the defective headlamp of the car. IOP Conf. Ser. Mater. Sci. Eng. 2019, 568, 012003. [Google Scholar] [CrossRef] [Scilit]
- Vrabel, J.; Stopka, O.; Palo, J.; Stopkova, M.; Droździel, P.; Michalsky, M. Research Regarding Different Types of Headlights on Selected Passenger Vehicles when Using Sensor-Related Equipment. Sensors 2023, 23, 1978. [Google Scholar] [CrossRef] [Scilit]
- Kennon, C.; Wood, J.M.; Lacherez, P.F.; Black, A.A.; Cuda, D.; Henry, E.; McKendrick, A.M. Visual motion perception and driving hazard visibility at night-time. Sci. Rep. 2025, 15, 42826. [Google Scholar] [CrossRef] [Scilit]
- Brumbelow, M.L. Light where it matters: IIHS headlight ratings are correlated with nighttime crash rates. J. Saf. Res. 2022, 83, 379–387. [Google Scholar] [CrossRef] [Scilit] [PubMed]
- Wood, J.M. Nighttime driving: Visual, lighting and visibility challenges. Ophthalmic Physiol. Opt. 2020, 40, 187–201. [Google Scholar] [CrossRef] [Scilit]
- Wanvik, P.O. Effects of road lighting: An analysis based on Dutch accident statistics 1987–2006. Accid. Anal. Prev. 2009, 41, 123–128. [Google Scholar] [CrossRef] [Scilit]
- Kersavage, K.; Skinner, N.P.; Bullough, J.D.; Garvey, P.M.; Donnell, E.T.; Rea, M.S. Investigation of flashing and intensity characteristics for vehicle-mounted warning beacons. Accid. Anal. Prev. 2018, 119, 23–28. [Google Scholar] [CrossRef] [Scilit]
- Boadi-Kusi, S.B.; Austin, E.; Abu, S.L.; Holdbrook, S.; Morny, E.K.A. Disability glare and nighttime driving performance among commercial drivers in Ghana. J. Occup. Health 2021, 63, e12279. [Google Scholar] [CrossRef] [Scilit]
- Portera, A.; Angioi, F.; Muzzioli, L.; Di Stasi, L.L.; Bassani, M. The influence of LED road stud color on driver behavior and perception along horizontal curves at nighttime. Transp. Res. Part F Psychol. Behav. 2023, 96, 66–75. [Google Scholar] [CrossRef] [Scilit]
- Syafiq, M.U.; Ibrahim, N.Z.; Sani, M.A.; Sadiah, S. Effect of headlights during daytime, dusk, and night-time on drivers’ visual perception. AIP Conf. Proc. 2023, 2562, 030002. [Google Scholar] [CrossRef] [Scilit]
- Leslie, A.J.; Kiefer, R.J.; Meitzner, M.R.; Flannagan, C.A. Field effectiveness of general motors advanced driver assistance and headlighting systems. Accid. Anal. Prev. 2021, 159, 106275. [Google Scholar] [CrossRef] [Scilit]
- Castro, C.; Martínez, C.; Tornay, F.J.; Fernández, P.G.; Martos, F.J. Vehicle distance estimations in nighttime driving: A real-setting study. Transp. Res. Part F Traffic Psychol. Behav. 2005, 8, 31–45. [Google Scholar] [CrossRef] [Scilit]
- Weaver, B.W.; DeLucia, P.R. Effect of motorcycle lighting configurations on drivers’ perceptions of closing during nighttime driving. Transp. Res. Part F Traffic Psychol. Behav. 2022, 90, 333–346. [Google Scholar] [CrossRef] [Scilit]
- Hu, J.; Guo, Y.; Wang, R.; Ma, S.; Yu, A. Study on the Influence of Opposing Glare from Vehicle High-Beam Headlights Based on Drivers’ Visual Requirements. Int. J. Environ. Res. Public Health 2022, 19, 2766. [Google Scholar] [CrossRef] [Scilit] [PubMed]
- Maarouf, K.; Roucoules, C.; Akrou, K.J.; Sao-Joao, S.; Klöcker, H. Fatigue damage of automotive LEDs: Experimental approach and thermomechanical model. Microelectron. Reliab. 2025, 171, 115799. [Google Scholar] [CrossRef] [Scilit]
- Martínez-Pérez, J.R.; Carvajal, M.A.; Santaella, J.J.; López-Ruiz, N.; Escobedo, P.; Martínez-Olmos, A. Advanced Detection of Failed LEDs in a Short Circuit for Automotive Lighting Applications. Sensors 2024, 24, 2802. [Google Scholar] [CrossRef] [Scilit]
- Long, X.; He, J.; Zhou, J.; Fang, L.; Zhou, X.; Ren, F.; Xu, T. A review on light-emitting diode based automotive headlamps. Renew. Sustain. Energy Rev. 2015, 41, 29–41. [Google Scholar] [CrossRef] [Scilit]
- Chang, M.-H.; Das, D.; Varde, P.V.; Pecht, M. Light emitting diodes reliability review. Microelectron. Reliab. 2012, 52, 762–782. [Google Scholar] [CrossRef] [Scilit]
- Schmid, M.; Zippelius, A.; Hanß, A.; Böckhorst, S.; Elger, G. Investigations on High-Power LEDs and Solder Interconnects in Automotive Application: Part II—Reliability. IEEE Trans. Device Mater. Reliab. 2023, 23, 419–429. [Google Scholar] [CrossRef] [Scilit]
- Seriţan, G.-C.; Raicu, C.-C.; Enache, B.-A. Single-Wire Control and Fault Detection for Automotive Exterior Lighting Systems. Sensors 2023, 23, 6521. [Google Scholar] [CrossRef] [Scilit] [PubMed]
- Yang, S.-C.; Lin, P.; Wang, C.-P.; Huang, S.B.; Chen, C.-L.; Chiang, P.-F.; Lee, A.-T.; Chu, M.-T. Failure and degradation mechanisms of high-power white light emitting diodes. Microelectron. Reliab. 2010, 50, 959–964. [Google Scholar] [CrossRef] [Scilit]
- Fu, J.; Zhao, L.; Cao, H.; Sun, X.; Sun, B.; Wang, J.; Li, J. Degradation and corresponding failure mechanism for GaN-based LEDs. AIP Adv. 2016, 6, 055219. [Google Scholar] [CrossRef] [Scilit]
- Ferreira, M.M.; Lins, V.F.C. Failure in automobile headlight lenses. Eng. Fail. Anal. 2019, 104, 844–855. [Google Scholar] [CrossRef] [Scilit]
- Nkrumah, J.K.; Cai, Y.; Jafaripournimchahi, A. A review of automotive intelligent and adaptive headlight beams intensity control approaches. Adv. Mech. Eng. 2024, 16. [Google Scholar] [CrossRef] [Scilit]
- Xiao, Y.; Zhu, X. Analysis and Prevention of the Influence and Common Failure Modes of the Unqualified Air Tightness of the Automobile Headlamp. In Proceedings of the 2023 3rd Asian Conference on Innovation in Technology (ASIANCON), Ravet IN, India, 25–27 August 2023; pp. 1–6. [Google Scholar] [CrossRef] [Scilit]
- Kochanek, A.; Zacłona, T.; Cembruch-Nowakowski, M.; Janczura, J.; Pietrucha, I.; Herbut, P.; Kotowski, T.; Oleksy-Gębczyk, A.; Guzdek, S.; Majkrzak, A. Pro-Environmental Attitudes and Behaviors Toward Energy Saving and Transportation. Energies 2025, 18, 6137. [Google Scholar] [CrossRef] [Scilit]
- Pustode, M.D.; Singh, C.S.; Verma, R.; Kochi, T.; Barge, H.; Gouda, S.; Dutta, A. Root Cause Analysis and Mitigation of White Patch Formation in Automotive Headlamp. J. Fail. Anal. Prev. 2021, 21, 387–397. [Google Scholar] [CrossRef] [Scilit]
- Feier, A.; Banciu, F.; Becheru, A.; Chivu, O.R.; Klobčar, D. Corrosion validation of a nut used in automotive headlights. J. Res. Innov. Sustain. Soc. 2025, 7, 20–29. [Google Scholar] [CrossRef]
- Saidakhmedova, G.R.; Inoyatkhodjaev, J.S.; Saydakhmedov, R.K.; Parpiev, M.M. Quality control of reflective coatings on the reflector of car headlights. Sci. Innov.-Int. Sci. J. 2025, 4, 4–9. [Google Scholar] [CrossRef]
- Liu, W. Analysis of Degradation Effect on Deep-Ultraviolet Leds. Highlights Sci. Eng. Technol. 2024, 121, 7–15. [Google Scholar] [CrossRef] [Scilit]
- Wang, N.; Liu, J.; Tang, M. Fatigue life evaluation and failure analysis of light beam direction adjusting mechanism of an automobile headlight exposed to random loading. Proc. Inst. Mech. Eng. Part D. J. Automob. Eng. 2017, 233, 224–231. [Google Scholar] [CrossRef] [Scilit]
- Kaçorri, D.; Basholli, A.; Prifti, L. Non-homogeneous Poisson Process with polynomial function rate to predict road accidents: A case study in Albania. In Proceedings of the 2nd International Conference on Contemporary Academic Research, Konya, Turkey, 4–5 November 2023. [Google Scholar]
- Ramírez, A.F.; Valencia, C. Spatiotemporal correlation study of traffic accidents with fatalities and injuries in Bogota (Colombia). Accid. Anal. Prev. 2021, 149, 105848. [Google Scholar] [CrossRef] [Scilit] [PubMed]
- Xiao, S.; Kottas, A.; Sansó, B. Modeling for seasonal marked point processes: An analysis of evolving hurricane occurrences. Ann. Appl. Stat. 2015, 9, 353–382. [Google Scholar] [CrossRef] [Scilit]
- Yarmohammadi, M.; Afshar, A.; Mahmoudvand, R.; Nasiri, P. Predicting intensity function of nonhomogeneous Poisson process. J. Stat. Model. Theory Appl. 2022, 3, 39–50. [Google Scholar]
- Trikalinos, T.A.; Sereda, Y. The nhppp package for simulating non-homogeneous Poisson point processes in R. PLoS ONE 2024, 19, e0311311. [Google Scholar] [CrossRef] [Scilit] [PubMed]
- Kang, H.-J.; Kwon, S.-J. A Study on the Night Visibility Evaluation Method of Color Temperature Convertible Automotive Headlamps Considering Weather Conditions. Appl. Sci. 2021, 11, 8661. [Google Scholar] [CrossRef] [Scilit]
- Mandal, G.; Bhattacharya, D.; De, P. Real Time Vision Based Overtaking Assistance System for Drivers at Night on Two-Lane Single Carriageway. Comput. Sist. 2021, 25, 403–416. [Google Scholar] [CrossRef] [Scilit]
- Sullivan, J.M.; Flannagan, M.J. The role of ambient light level in fatal crashes: Inferences from daylight saving time transitions. Accid. Anal. Prev. 2002, 34, 487–498. [Google Scholar] [CrossRef] [Scilit]
- Plainis, S.; Murray, I.J.; Pallikaris, I.G. Road traffic casualties: Understanding the night-time death toll. Inj. Prev. 2006, 12, 125–138. [Google Scholar] [CrossRef] [Scilit]
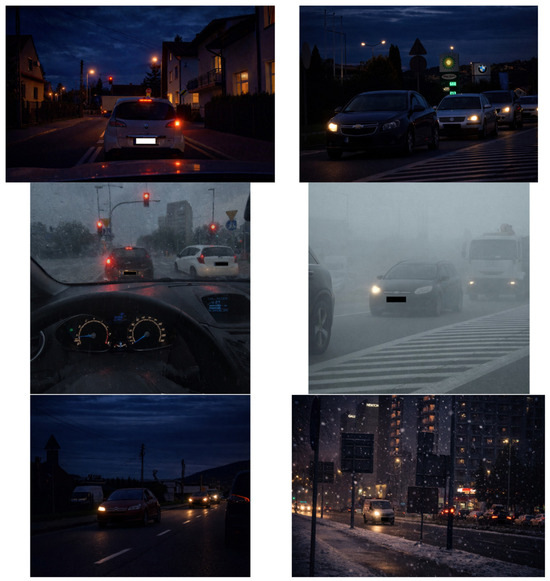
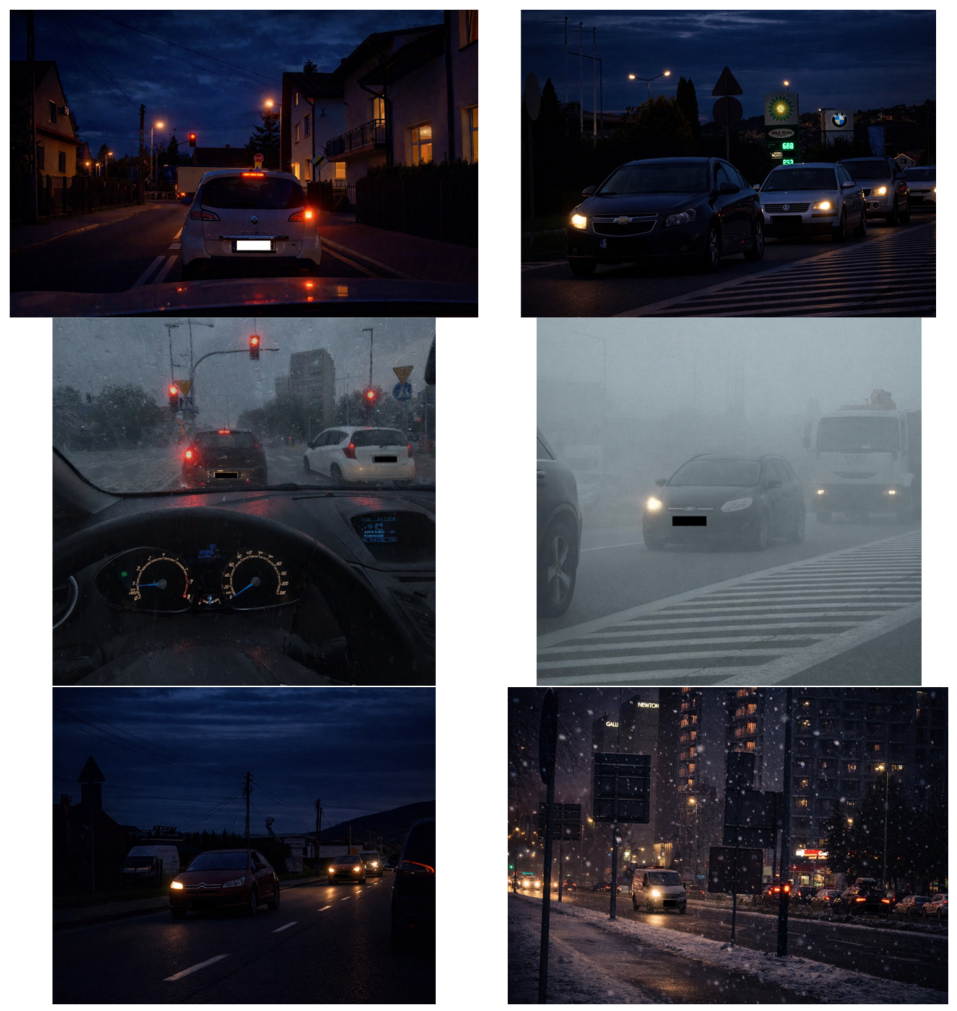
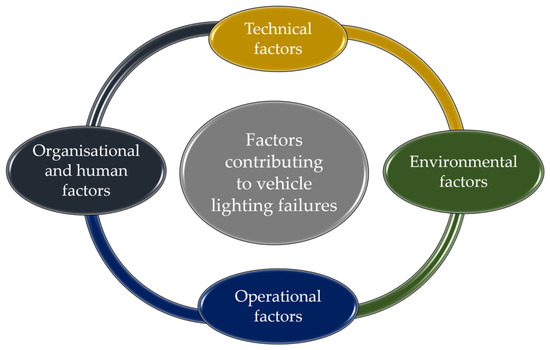
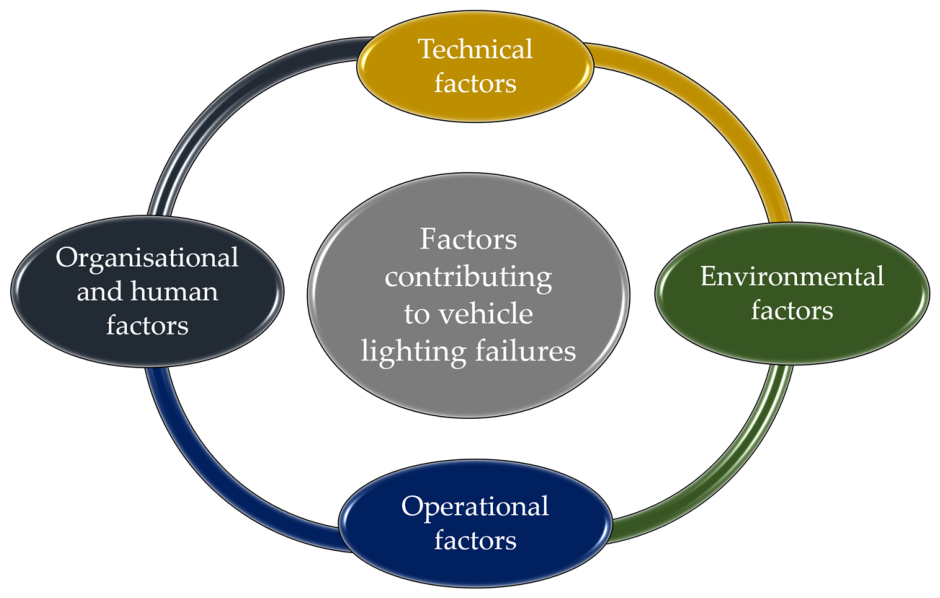
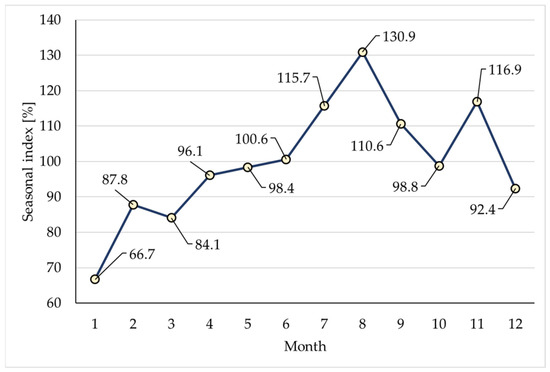
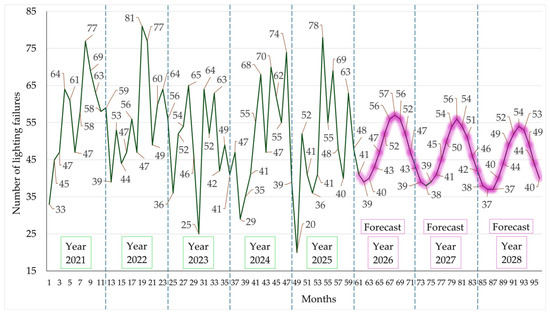
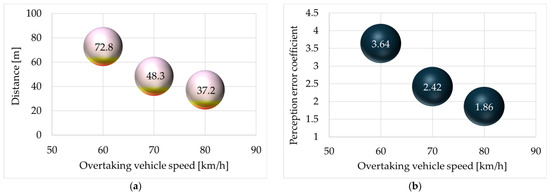
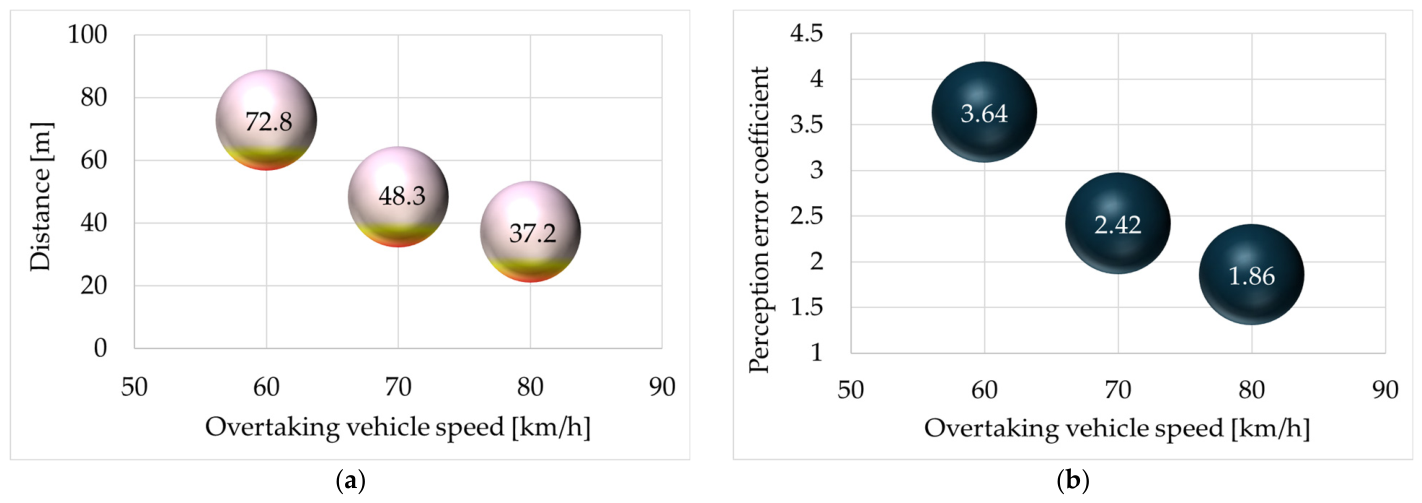
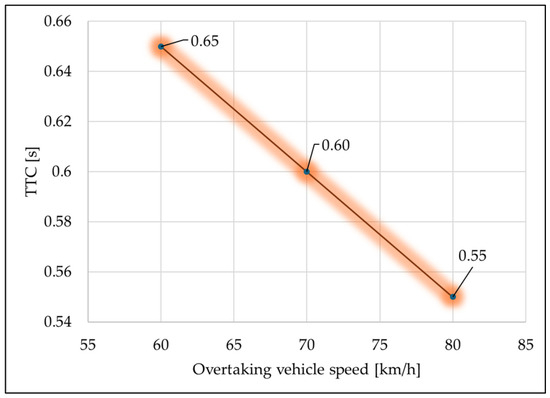
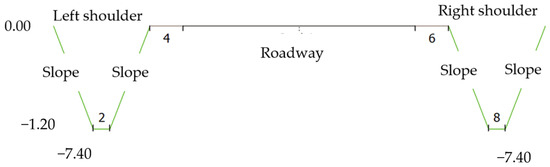
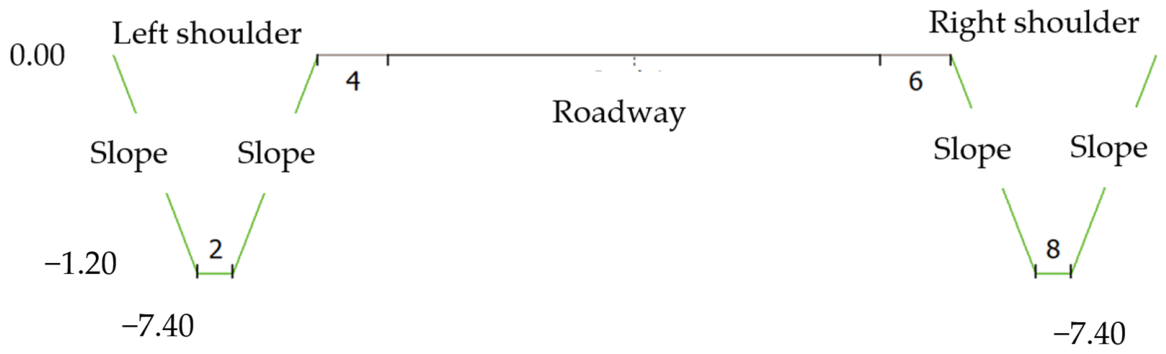
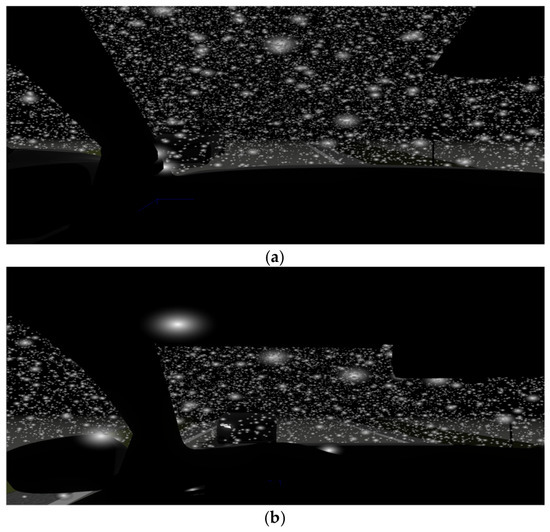
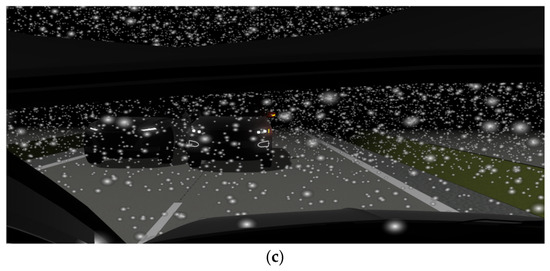
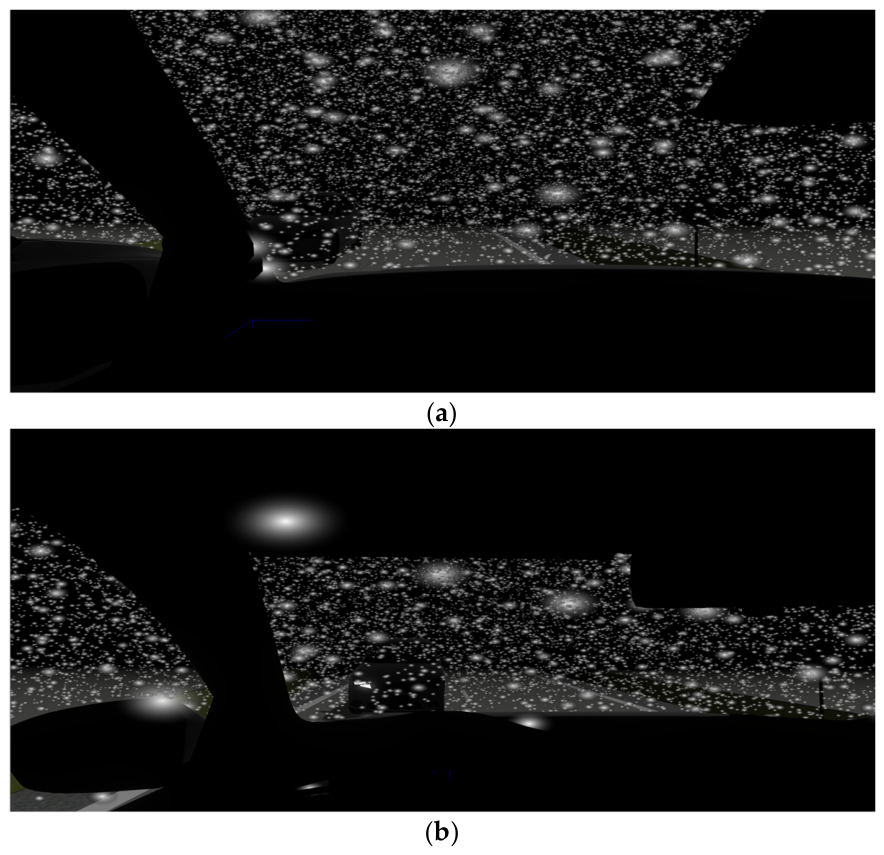
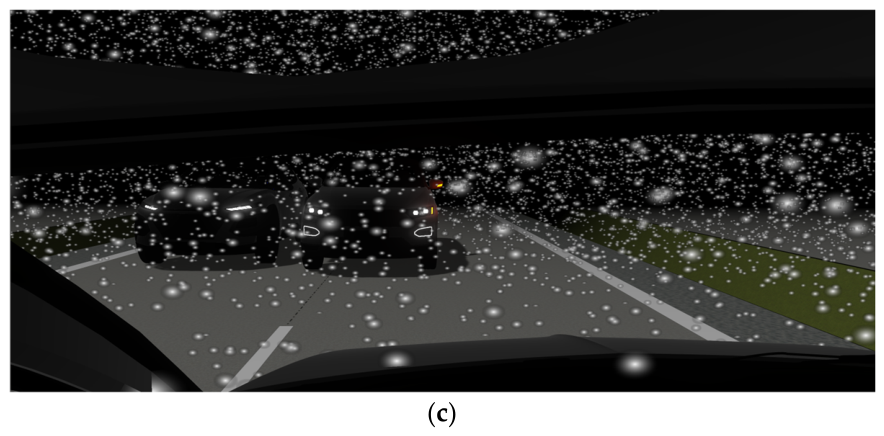
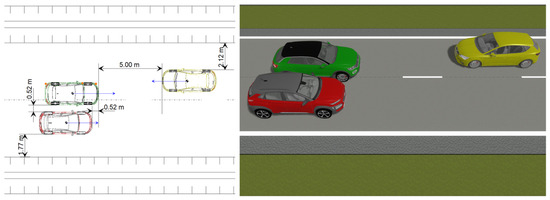
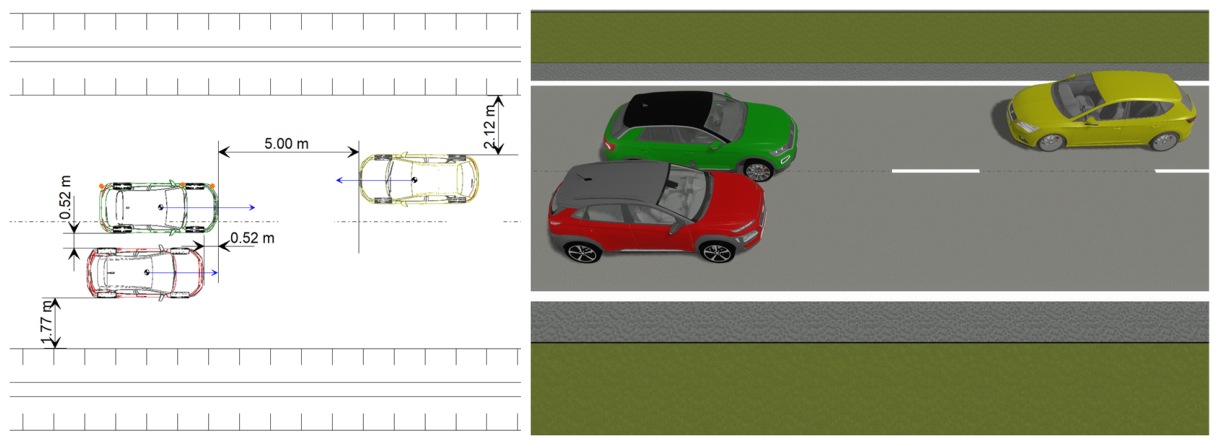
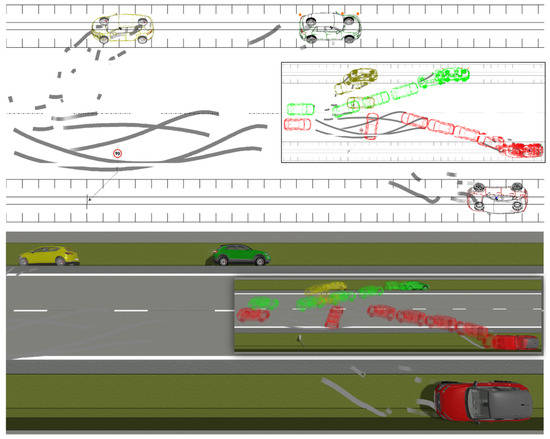
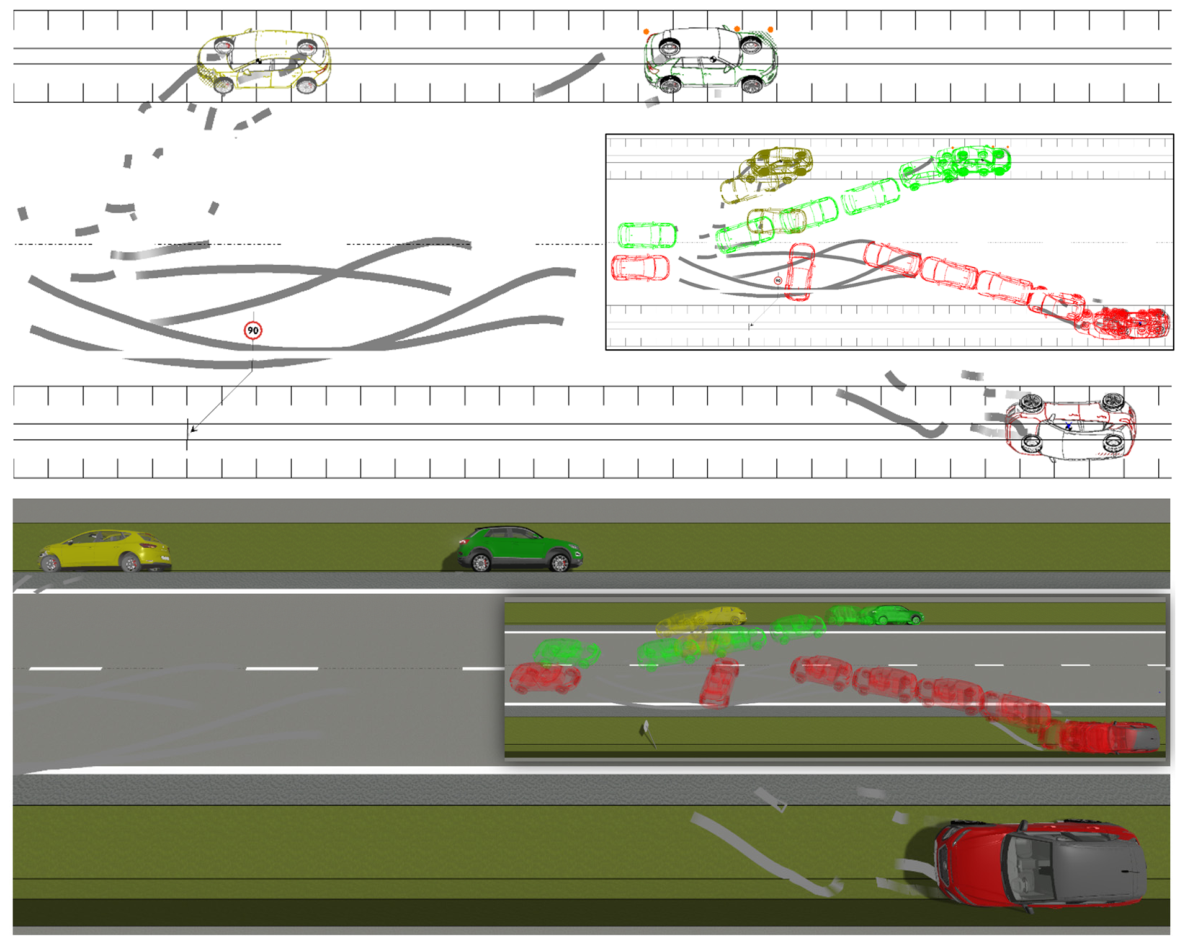
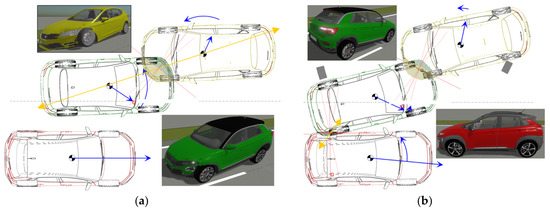
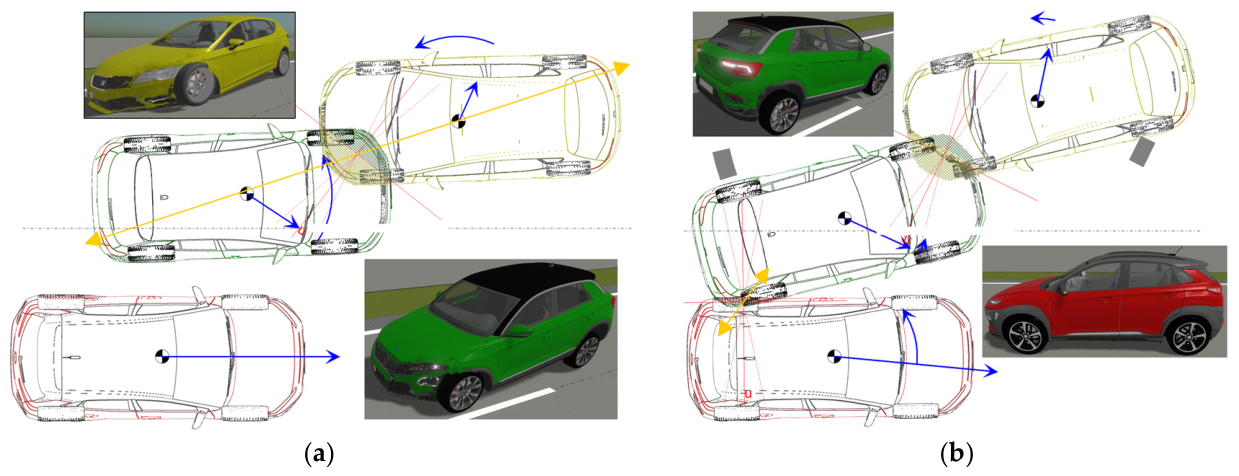
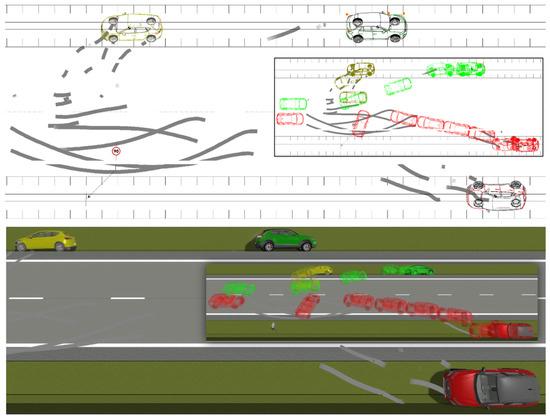
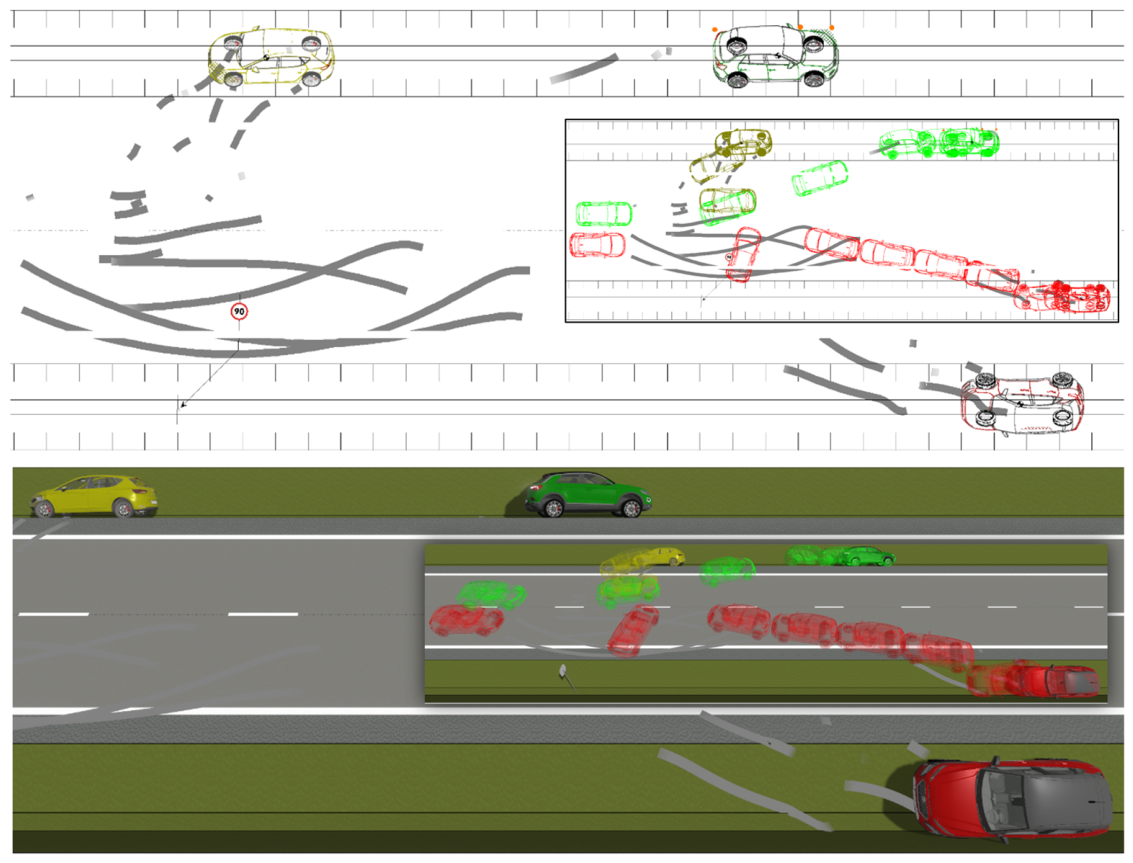
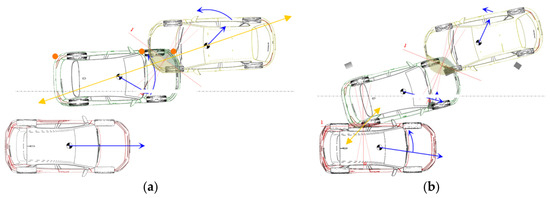
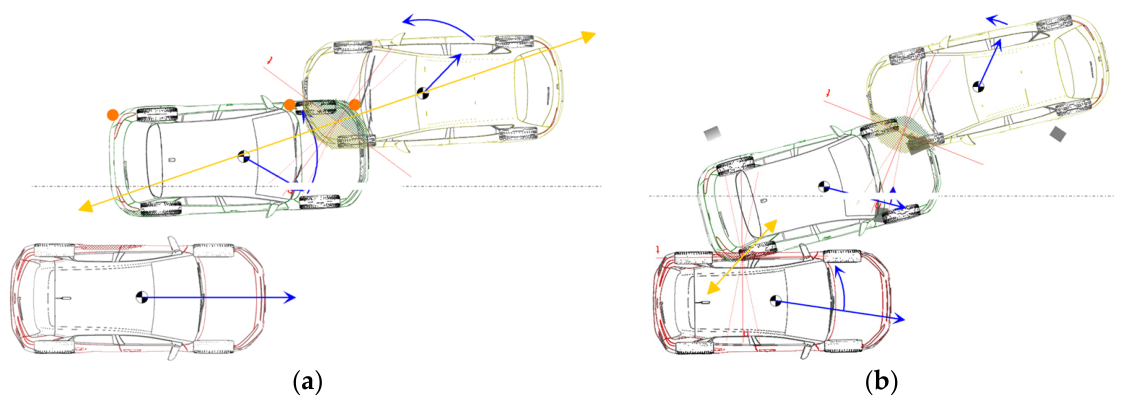
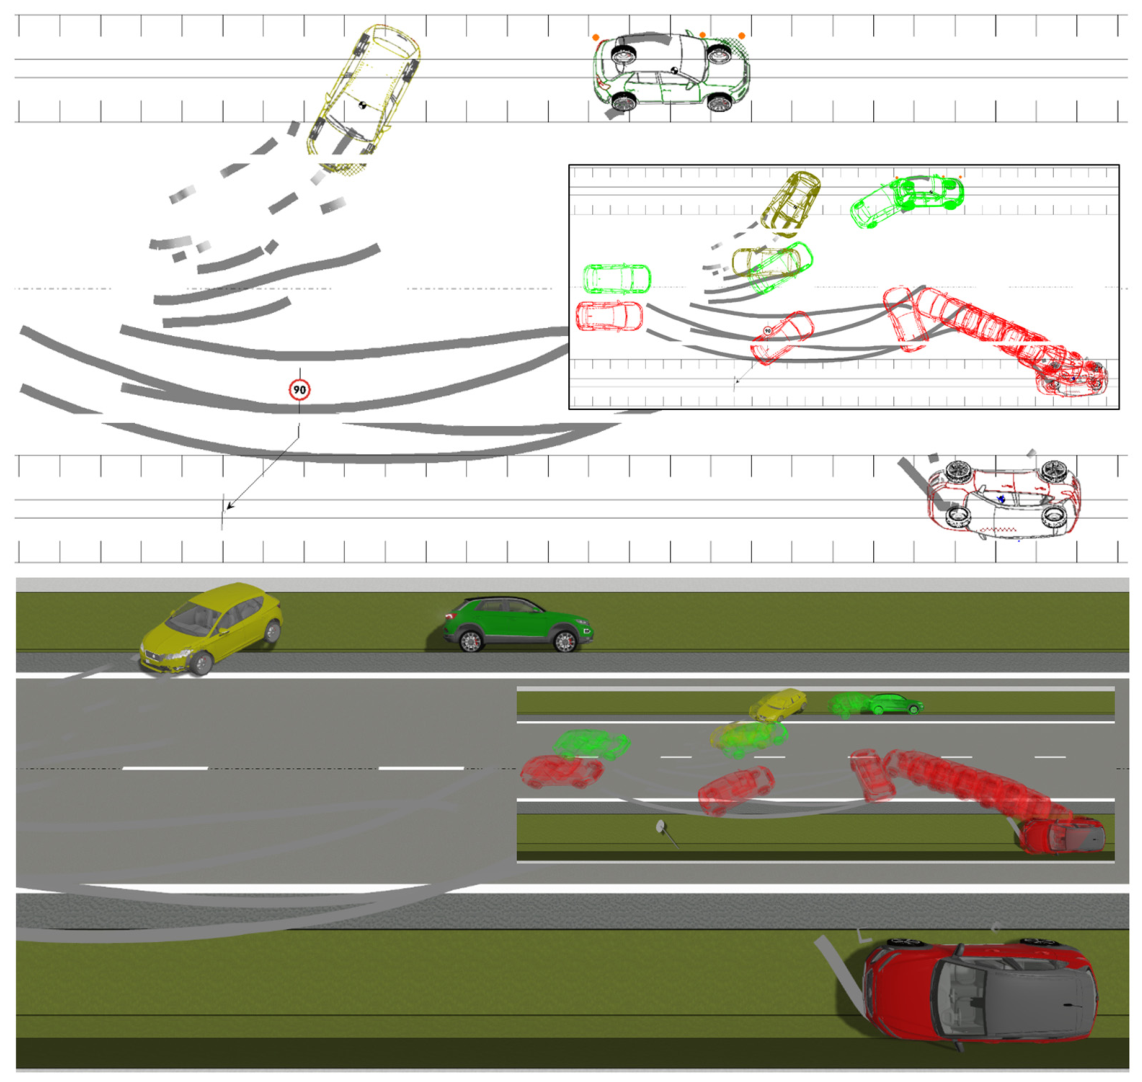
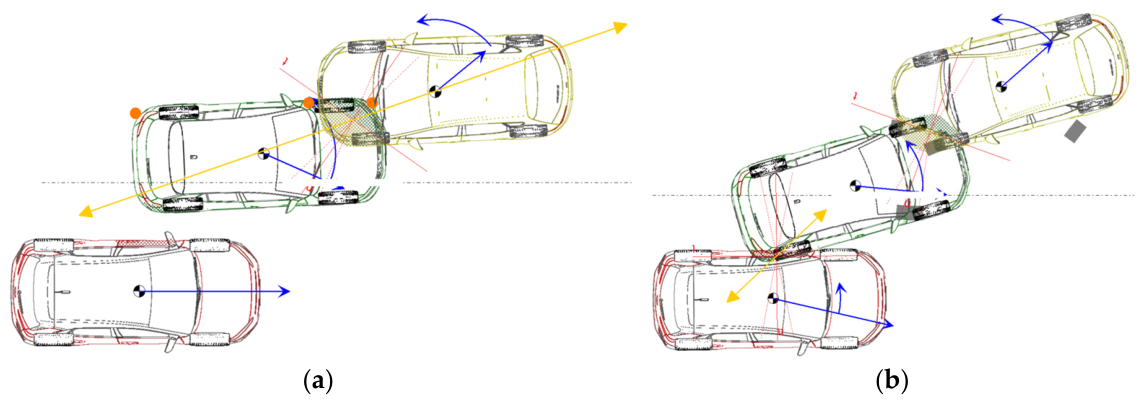
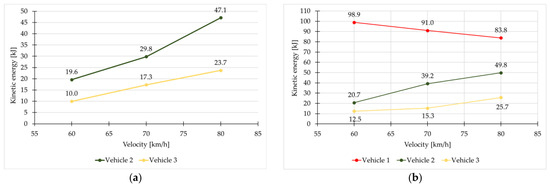
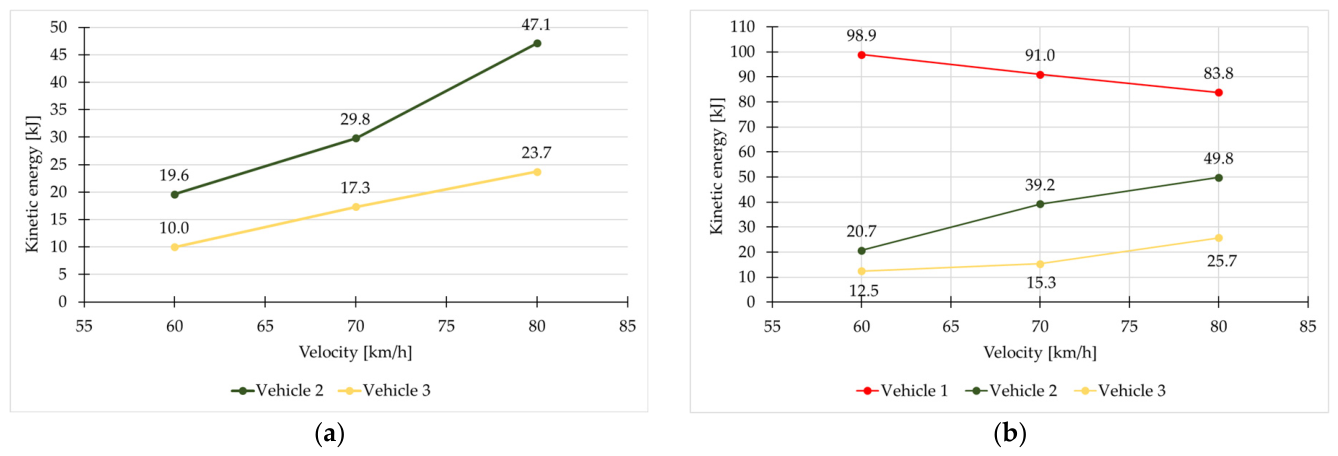
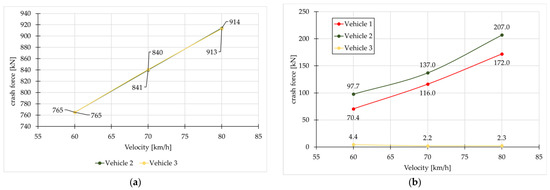
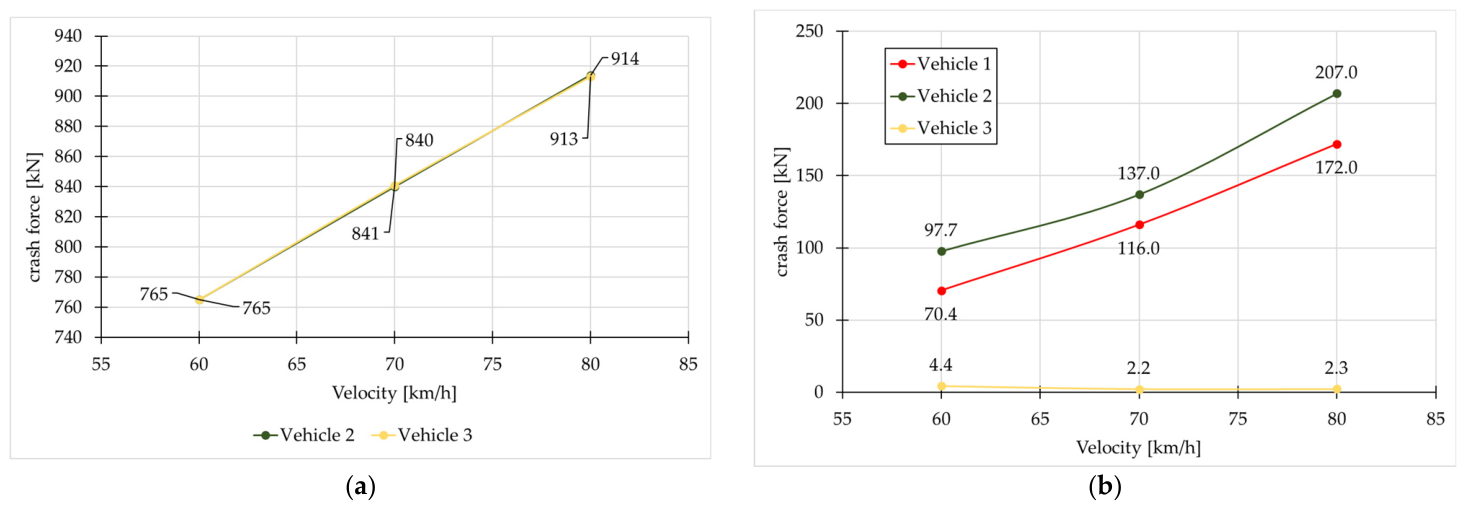
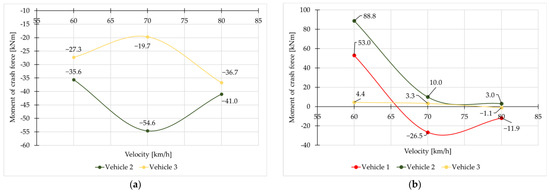
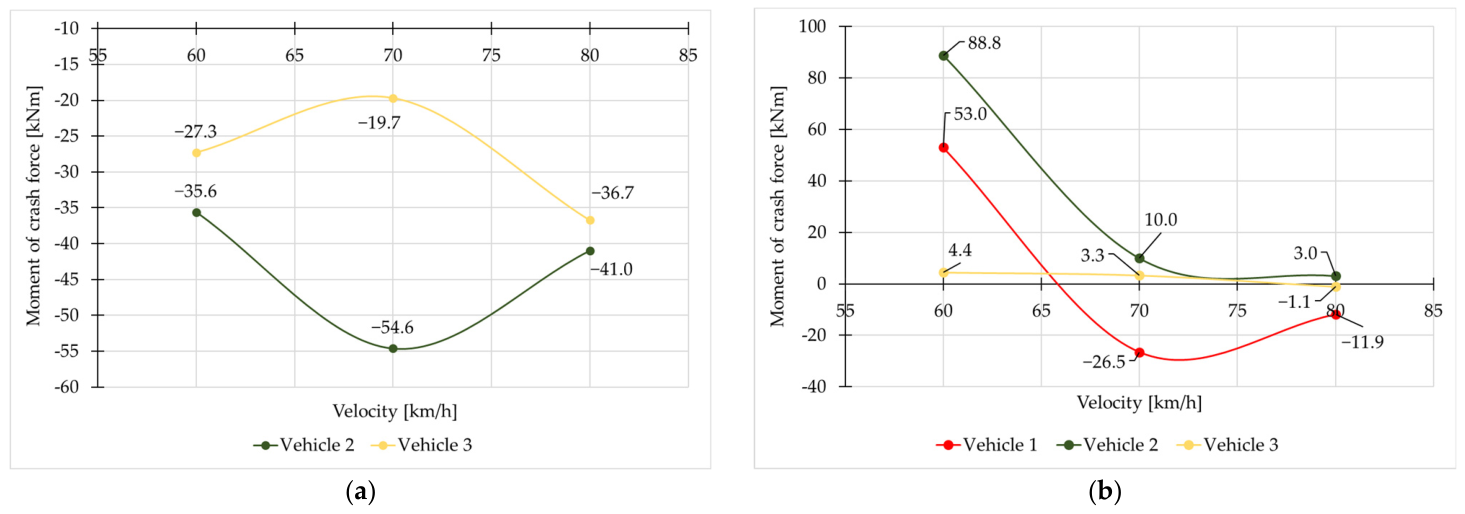
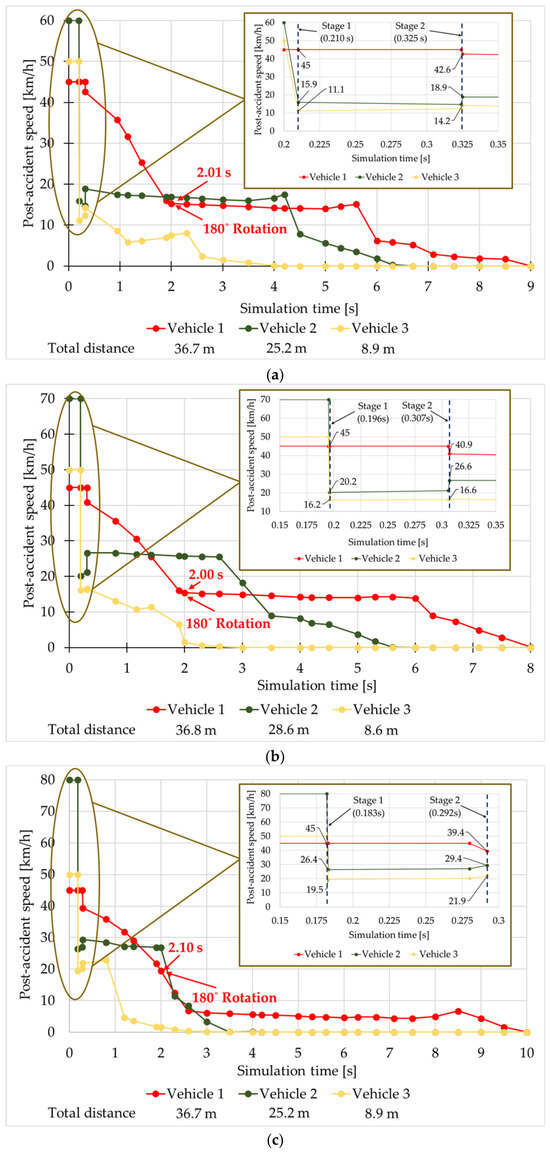
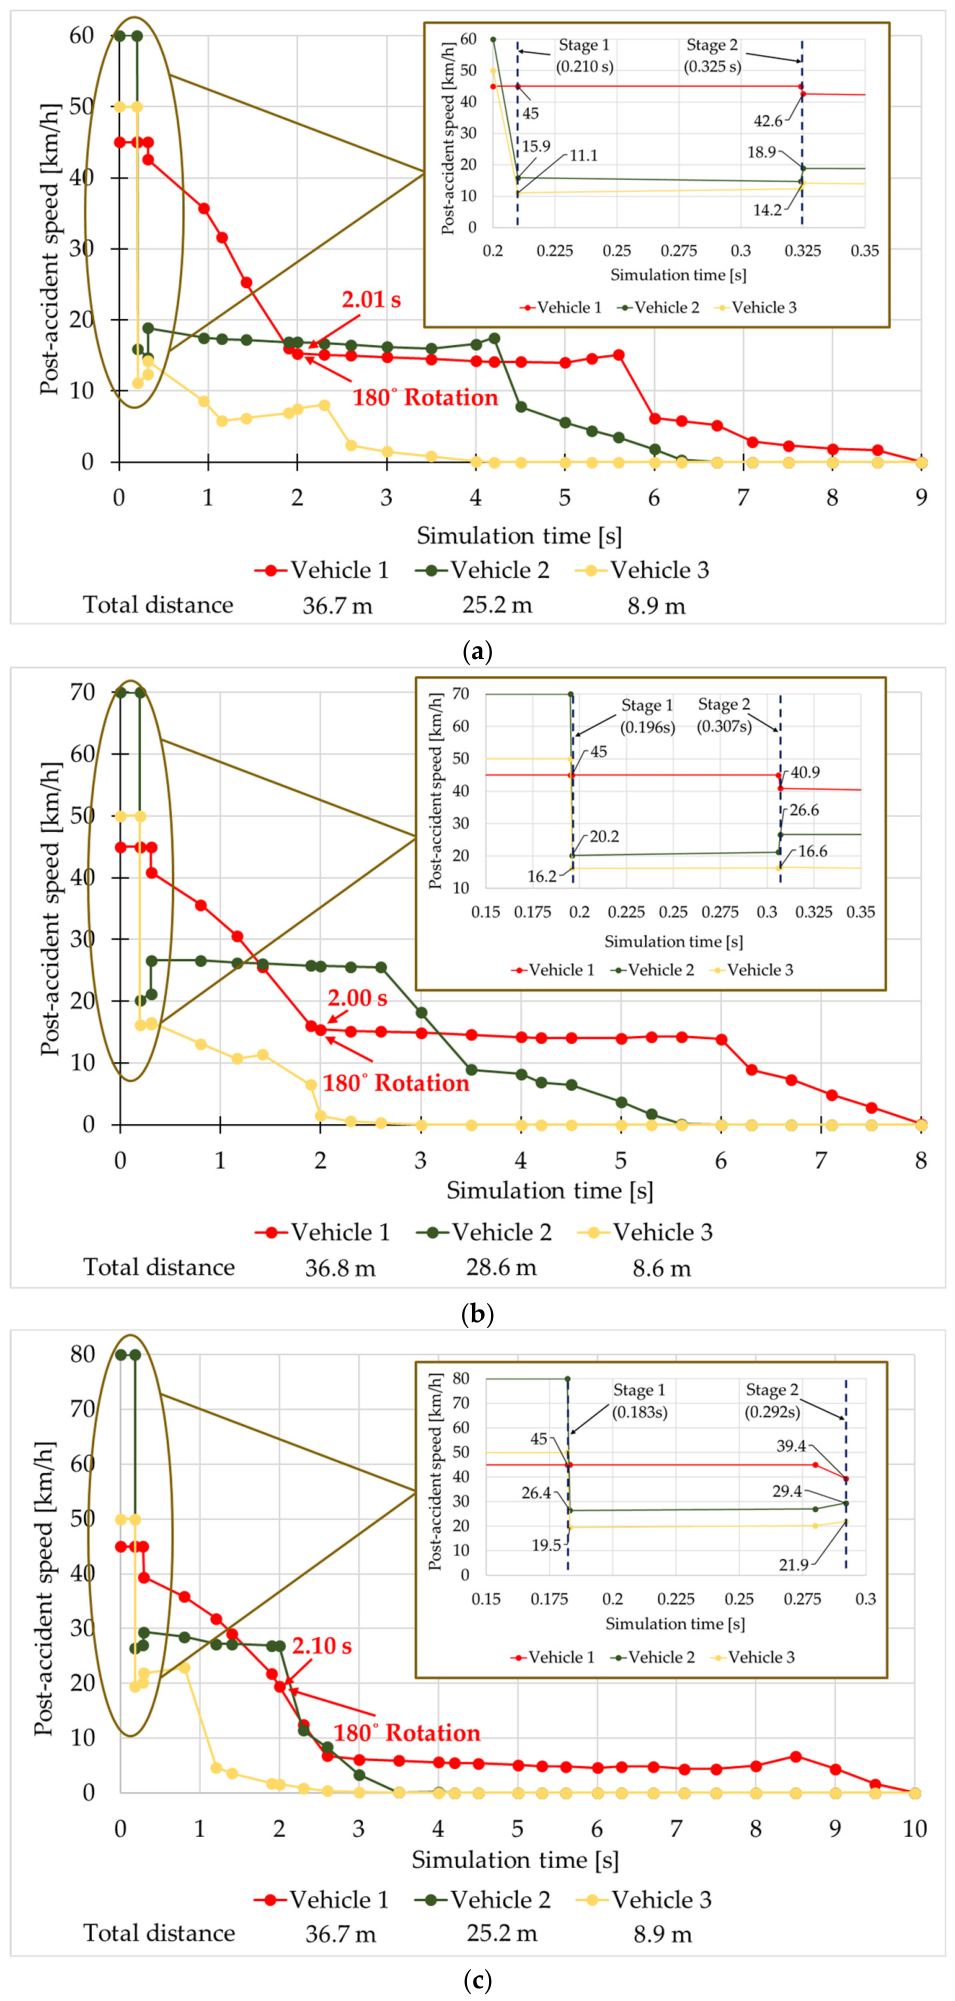

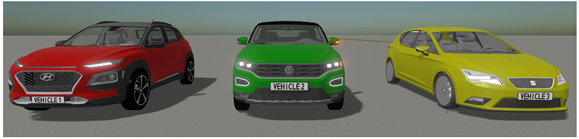
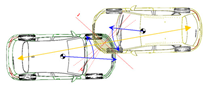
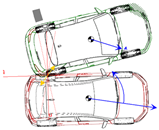
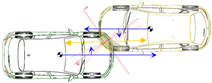
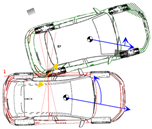
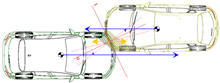
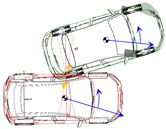
Disclaimer/Publisher’s Note: The statements, opinions and data contained in all publications are solely those of the individual author(s) and contributor(s) and not of MDPI and/or the editor(s). MDPI and/or the editor(s) disclaim responsibility for any injury to people or property resulting from any ideas, methods, instructions or products referred to in the content. |
© 2026 by the author. Licensee MDPI, Basel, Switzerland. This article is an open access article distributed under the terms and conditions of the Creative Commons Attribution (CC BY) license.