


Abstract
With the increasing frequency of traffic safety issues and the rapid development of autonomous driving technology, traffic sign detection is highly susceptible to adverse weather conditions such as changes in light intensity, fog, rain, snow, and partial occlusion, which places higher demands on the accurate recognition of traffic signs. This paper proposes an improved DAYOLO model based on YOLOv8n, aiming to balance detection accuracy and model complexity. First, the Bottleneck in the C2f module of the YOLOv8n backbone network is replaced with Bottleneck DAttention. Introducing DAttention allows for more effective feature extraction, thereby improving model performance. Second, an ultra-lightweight and efficient upsampler, Dysample, is introduced into the neck network to further improve performance and reduce computational overhead. Finally, a Task-Aligned Dynamic Detection Head (TADDH) is introduced. TADDH enhances task interaction through a dynamic mechanism and utilizes shared convolutional modules to reduce parameters and improve efficiency. Simultaneously, an additional Layer2 detection head is added to the model to strengthen the extraction and fusion of features at different scales, thereby improving the detection accuracy of small traffic signs. Furthermore, replacing SlideLoss with NWDLoss can better handle prediction results with more complex distributions and more accurately measure the distance between predicted and ground truth boxes in the feature space during object detection. Experimental results show that DAYOLO achieves 97.2% mAP on the SDCCVP dataset, which is 5.3 higher than the baseline model YOLOv8n; the frame rate reaches 120, which is 37.8% higher than YOLOv8; and the number of parameters is reduced by 6.2%, outperforming models such as YOLOv3, YOLOv5, YOLOv6, and YOLOv7. In addition, DAYOLO achieves 80.8 mAP on the TT100K dataset, which is 9.2% higher than the baseline model YOLOv8n. The proposed method achieves a balance between model size and detection accuracy, meets the needs of traffic sign detection, and provides new ideas and methods for future research in the field of traffic sign detection.
1. Introduction
Traffic sign detection is a crucial component of intelligent transportation systems. It not only provides drivers with real-time traffic information but also plays a key role in ensuring the safe operation of autonomous driving systems. In recent years, with the increasing prominence of traffic safety needs, this field has received widespread attention and in-depth exploration from researchers.
Traditional traffic sign detection methods rely on color and shape features [1,2,3,4,5] and machine learning algorithms [6], including support vector machines, random forests, genetic algorithms, AdaBoost, and artificial neural networks, but they show obvious limitations in complex scenarios. Although these methods perform well in specific environments, the detection accuracy and efficiency drop significantly when faced with changing lighting conditions and complex road conditions. It is precisely because of these limitations that deep learning methods have gradually become the mainstream of traffic sign detection.
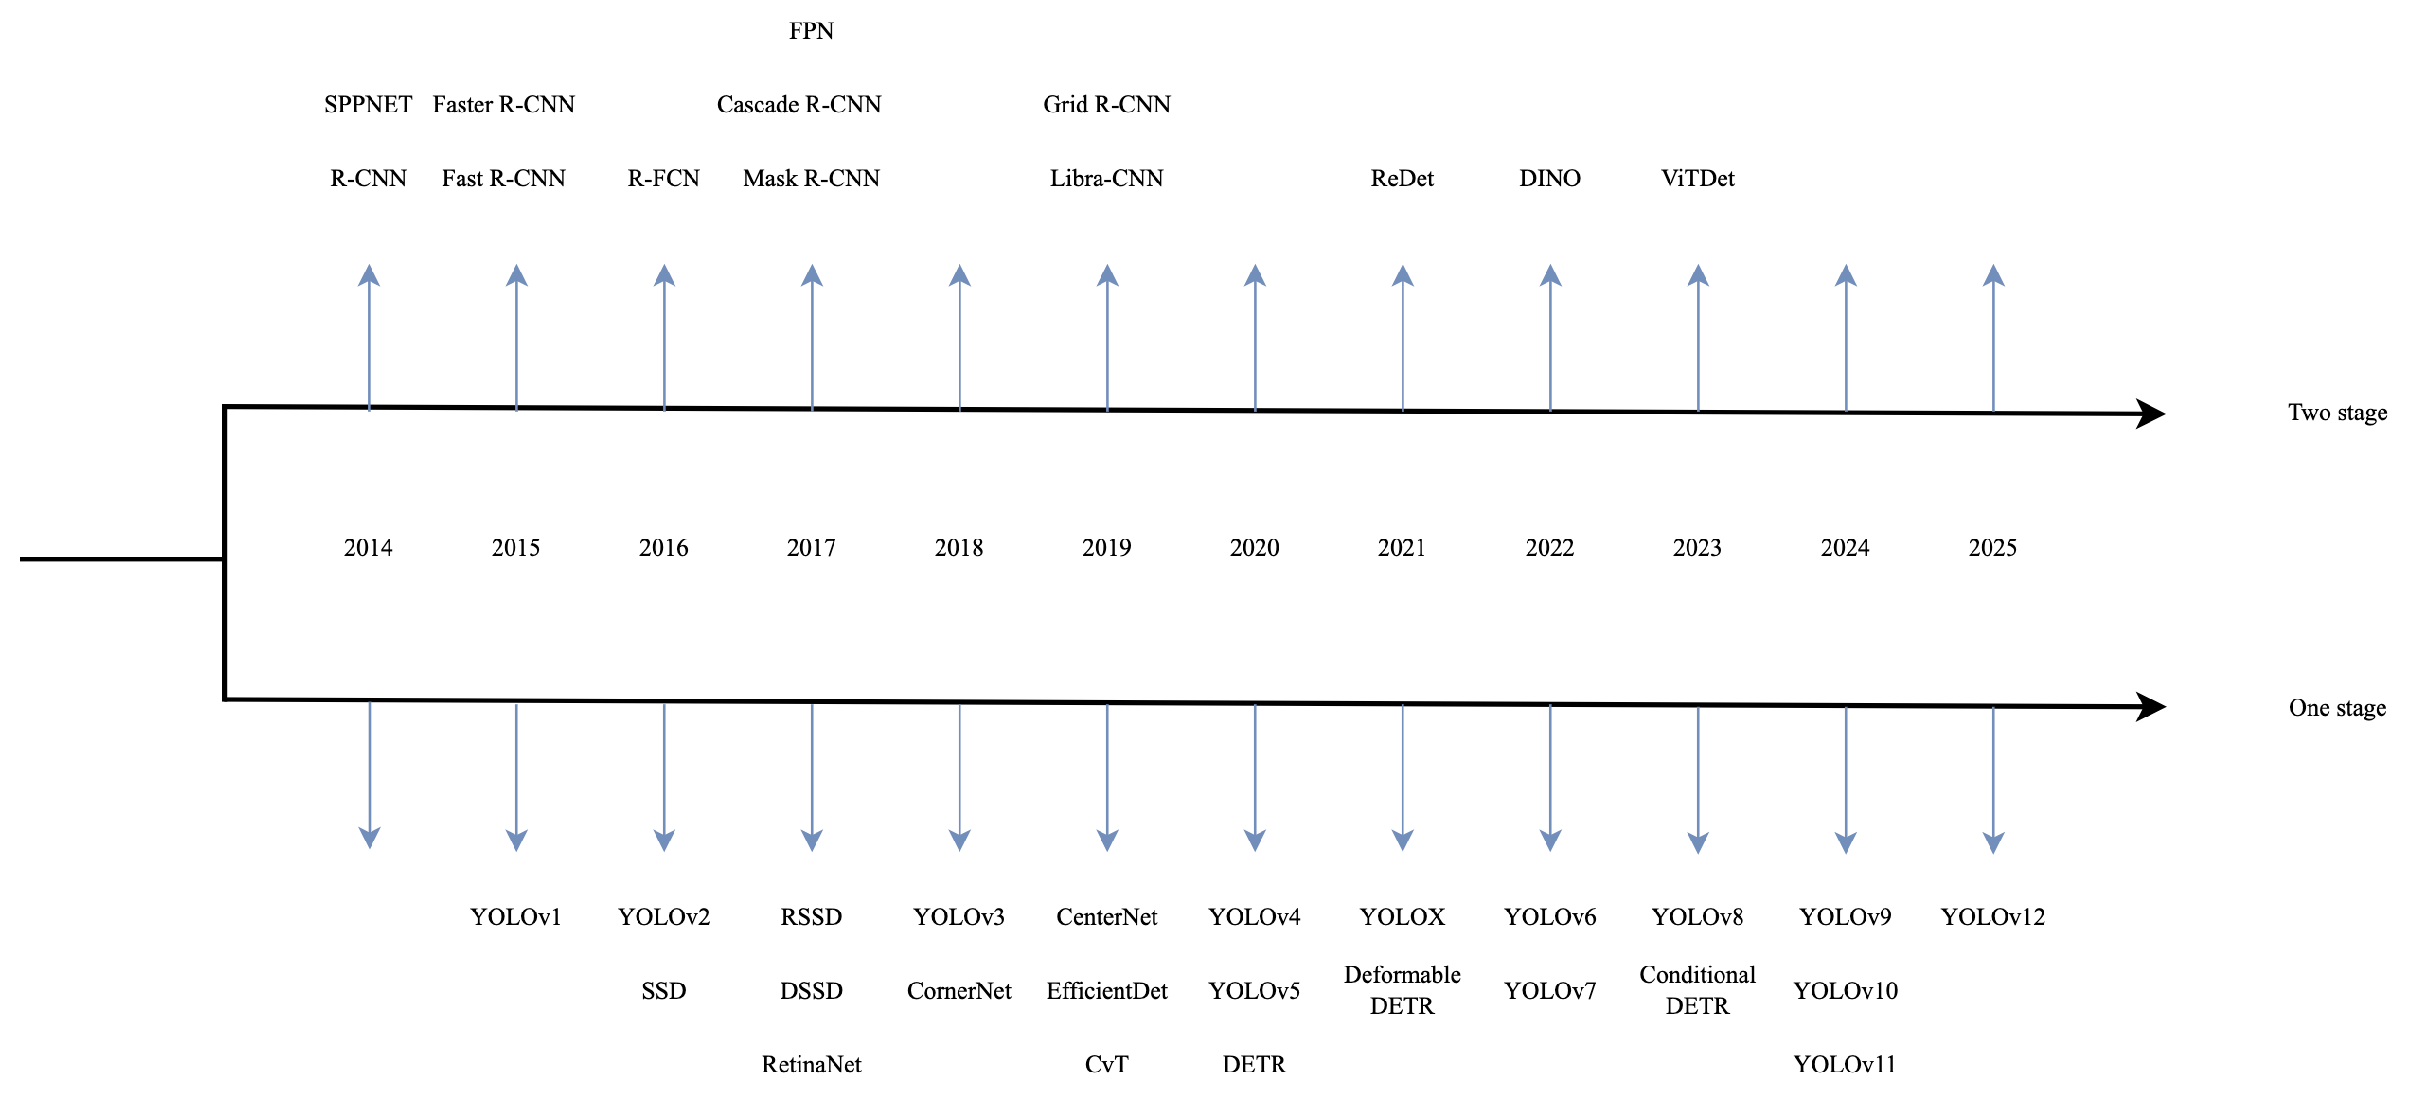
In recent years, the rapid development of computer vision technology has made deep learning methods popular in traffic sign detection. As early as the mid-20th century, the application of deep learning in computer vision gradually emerged. In 2012, the convolutional neural network AlexNet achieved amazing results in the ImageNet competition, marking the advent of the deep learning era [7]. Since then, deep learning methods have been widely used in visual detection in the fields of transportation, industry, medicine, etc. Their development process is shown in Figure 1.
Figure 1.
Deep Learning Object Detection Algorithm Timeline.
Object detection based on deep learning is mainly divided into two categories: two-stage detection algorithms based on candidate regions, such as R-CNN [8], Fast R-CNN [9], Faster R-CNN [10], and Cascade R-CNN [11]; and single-stage detection algorithms based on regression, such as the YOLO series [12,13,14,15,16,17] and Single-Shot Multibox Detector (SSD) [18]. In 2013, OverFeat emerged as a pioneer of single-stage detection. From 2015 to 2018, two-stage detection dominated, while in the past five years, single-stage detection has developed rapidly and has become widely favored by researchers.
In the field of two-stage detection, in 2018, Yang et al. [19] introduced the attention mechanism based on Faster R-CNN to solve the problem of GPU resource limitation when processing high-resolution images. In 2019, Faming Shao et al. [20] proposed a candidate region algorithm combining Gabor wavelet and MSER to improve the performance of small target detection. In 2022, Yang et al. [21] improved Faster R-CNN and introduced attention-guided context feature pyramid network to improve detection accuracy. The two-stage algorithm has achieved remarkable results in accuracy, but the lack of real-time performance means that most methods are difficult to apply to actual detection tasks.
YOLO is a new single-stage detection algorithm that directly predicts the location of the ground-truth bounding box and the probability of the target category from the entire image. Huibing Zhang et al. [22] introduced a multi-scale spatial pyramid pooling block in the Darknet53 network of YOLOv3 to comprehensively learn object features. However, the model parameters are too large and the computing resource requirements are too large. Junfan Wang et al. [23] replaced the original feature pyramid of YOLOv5 with AF-FPN to reduce information loss in the feature map generation process, and proposed an automatic learning data enhancement method to enrich the data set and improve the robustness of the model. However, the detection speed of this model is significantly slower in complex scenes, and even missed detections occur. Ravinder Kaur et al. [24] used YOLOv6 and an improved logistic regression (LR)-based classifier to improve real-time traffic sign recognition. However, this method has low accuracy when recognizing small objects and is prone to misclassification.
Songjiang Li et al. [25] added a small target detection layer to the neck region of YOLOv7 to enhance the detection capability of small traffic sign targets. The feature extraction capability was enhanced by replacing the conventional convolution module in the neck layer with ODConv.
The EMA-BiFPN proposed by Yukang Zou et al. [26] utilizes dynamic sparse attention to fuse shallow and deep features to better detect small targets, and improves the accuracy of YOLOv10 by employing MPDIoU box regression loss to enhance the accuracy of detecting complex small targets.
Linfeng Jiang et al. [27] designed the C2Fast and Combined Spatial–Channel Attention (MSCA) modules to reduce model parameters and enhance multi-level feature fusion in the neck network.
Issam Dagher et al. [28] integrated Detectron2 and ViT classifiers into YOLOv12, achieving significant improvements in detecting occluded and overlapping symbols.
Mengqi Lei et al. [29] introduced attention-centric designs and advanced architectures, exploring multi-head self-attention, improved multi-scale fusion, and training regularization strategies. However, they still rely on non-maximum suppression (NMS) and distributed focus loss (DFL), which introduces latency overhead and derived challenges, especially for low-power devices.
Ranjan Sapkota et al. [30] achieved faster convergence and a more reliable cross-scale platform through architectural simplification and DFL removal, the use of end-to-end NMS-free inference, and the adoption of a novel MuSGD hybrid optimizer.
However, the computational complexity of the model in time and space was high, and the detection speed was slow.
Despite the superior performance of the YOLO model in traffic sign detection, its latest version still faces several significant challenges in practical applications, primarily in the following aspects:
- Insufficient accuracy in small-scale target detection: Existing systems show a significant decrease in their ability to recognize small traffic signs, easily leading to missed detections or misclassifications of key signs. To improve the model’s robustness and reliability in diverse and complex environments, it is urgent to optimize its detection performance for small targets.
- Insufficient detection stability under adverse weather conditions: Complex weather conditions such as rain, snow, and fog significantly weaken the model’s detection reliability, leading to decreased recognition accuracy.
- High computational complexity and poor real-time performance: Existing models have a large number of parameters and a heavy computational burden, which not only reduces GPU utilization efficiency and prolongs training time, but also makes it difficult to meet the real-time requirements of practical deployments due to insufficient inference speed.
Based on the above analysis, this paper proposes DAYOLO, whose core innovations mainly include the following aspects:
- Offline data augmentation strategy for severe weather: To improve the model’s accuracy under complex weather conditions such as rain, snow, and fog, we adopt an offline data augmentation method. This method introduces motion blur, fog, precipitation, and other image degradation simulations that closely resemble severe weather into the training data, effectively enhancing data diversity and thus significantly improving the model’s generalization ability and detection accuracy in challenging environments.
- Improved DAttention module for enhanced feature extraction: This study improves the C2f0DAttention module to optimize the model’s feature extraction capabilities. This module dynamically adjusts its receptive field, allowing the network to focus more on key information regions, thus significantly improving detection accuracy in complex multi-scale scenes.
- DySample module for optimized model efficiency: The DySample module is added to reduce the number of model parameters while maintaining detection performance. This module uses an efficient point sampling method to replace dynamic convolution operations, significantly reducing computational complexity and inference latency.
- Enhancing Inter-Task Interaction with TADDH: This study proposes a Task Aligned Dynamic Detector Head (TADDH) to address the insufficient interaction between classification and regression tasks in the YOLOv8 decoupled head structure. It also utilizes shared convolutional modules to reduce the number of parameters, which is particularly beneficial for improving inference efficiency on resource-constrained devices.
- Adding an Additional Detector Head to Improve Small Object Detection Capabilities: An additional Layer2 detector head is integrated into the model to strengthen multi-scale feature fusion. This design complements the FPN and PAN structures, effectively mitigating information loss during feature transmission and significantly improving the recognition accuracy of small traffic signs.
- In order to further improve the model’s ability to detect small objects at different scales and in complex backgrounds, the NWD metric is referenced in the model. NWD provides a more detailed metric to distinguish objects from their surroundings, thereby improving detection accuracy at different scales.
This paper is organized as follows: Section 2 introduces the relevant content of traffic signal detection. Section 3 introduces the proposed DAYOLO model in detail. Section 4 describes the experimental results and analysis, including ablation studies and comparative studies. Finally, Section 5 presents the discussion of the experimental results.
2. Related Works
2.1. Traffic Signs Detection
Traffic sign detection has three major challenges: First, in small object detection, small objects have a small number of pixels, limited information, and are prone to noise, which brings challenges to feature extraction. Second, complex weather conditions can easily lead to missed detection of objects. Finally, the types of traffic signs are uneven, and different types have different probabilities of appearing in actual detection.
2.2. Traditional Algorithms
Traditional detection methods are mainly based on color and shape features, and are gradually identified and classified through template matching and machine learning. In 1987, Japanese scholar Akatsuka proposed a color threshold-based method to identify speed traffic signs through template matching [31]. This method lays the foundation for traffic sign detection.Early detection methods relied on the RGB color space and separated traffic signs from images through threshold segmentation. However, the RGB color space is sensitive to lighting, which affects the detection effect. The threshold segmentation method of HSI color space is less affected by lighting. Sha et al. [32] combined RGB with HSI in 2009 to improve the robustness of the system, but the detection effect on complex images still needs to be improved.The HSV color space performs well in traffic sign detection due to its robustness to lighting changes. In 2011, Long et al. [33] set three-channel values in the HSV color space for segmentation and positioning, but different values need to be set for different environments.
In addition to color space, traditional methods can also perform detection based on shape. In 2014, Jeon et al. [34] used Haar-like features for real-time detection in a real road environment and adopted masking and histogram equalization methods to improve the detection rate, but a large number of training images were required. In 2015, Yakimov et al. [35] used the improved generalized Hough transform to detect traffic signs and achieved effective results, but it depended on the input data. Saxena et al. introduced an automatic recognition system to identify traffic signs through similarity detection.In addition, traditional methods are combined with machine learning techniques such as support vector machines, random forests, genetic algorithms, AdaBoost, and artificial neural networks. Among them, HOG features are the most commonly used. In 2011, Zaklouta et al. [36] used HOG features and SVM to classify traffic signs. In 2012, the team combined HOG and random forest methods to select the most effective features, reduce the dimension of feature space, and improve accuracy [37]. However, these methods are susceptible to extreme weather, lighting changes, shooting angle changes, and obstacles, and are therefore only applicable to limited scenarios.
2.3. Standard YOLOv8 Model
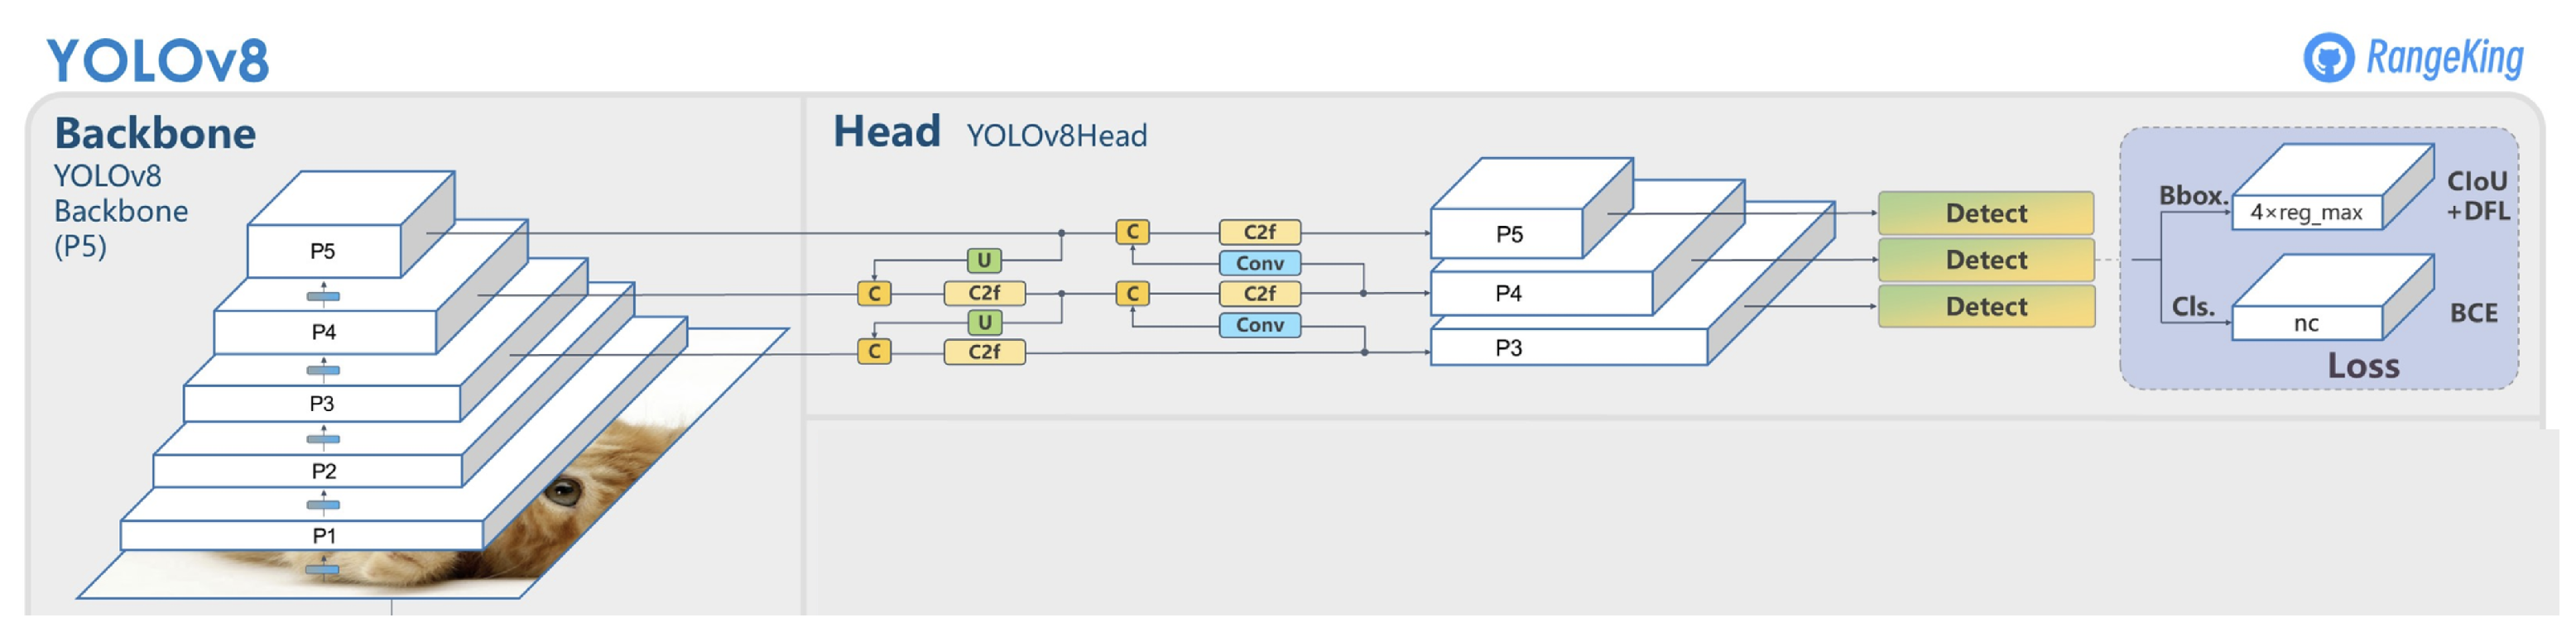
YOLOv8’s architecture is clear and highly modular. This structure allows for precise and independent replacement or enhancement of specific components. Our goal is to significantly improve accuracy while maintaining or even improving its extreme efficiency. Secondly, YOLOv9 has lower computational efficiency, YOLOv10 has relatively limited ecosystem support, YOLOv11 has a more complex architecture with more parameters, and YOLOv12’s complex architecture incurs computational overhead without significant performance improvements [38,39,40,41]. Finally, experiments have shown that DAYOLO, based on improvements to YOLOv8, exhibits superior performance with fewer model parameters; therefore, YOLOv8 was chosen as the baseline architecture. Its core innovations include a CSPDarknet53 backbone for powerful feature extraction, a CIoU loss function for refined localization, and a PANet structure for fusing features across scales. This synthesis of components, illustrated in Figure 2, establishes a foundation for robust performance and generalization.
Figure 2.
Standard YOLOv8 model structure diagram.
3. DAYOLO Traffic Sign Detection Algorithm
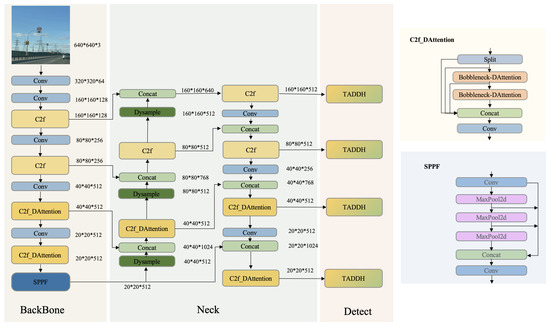
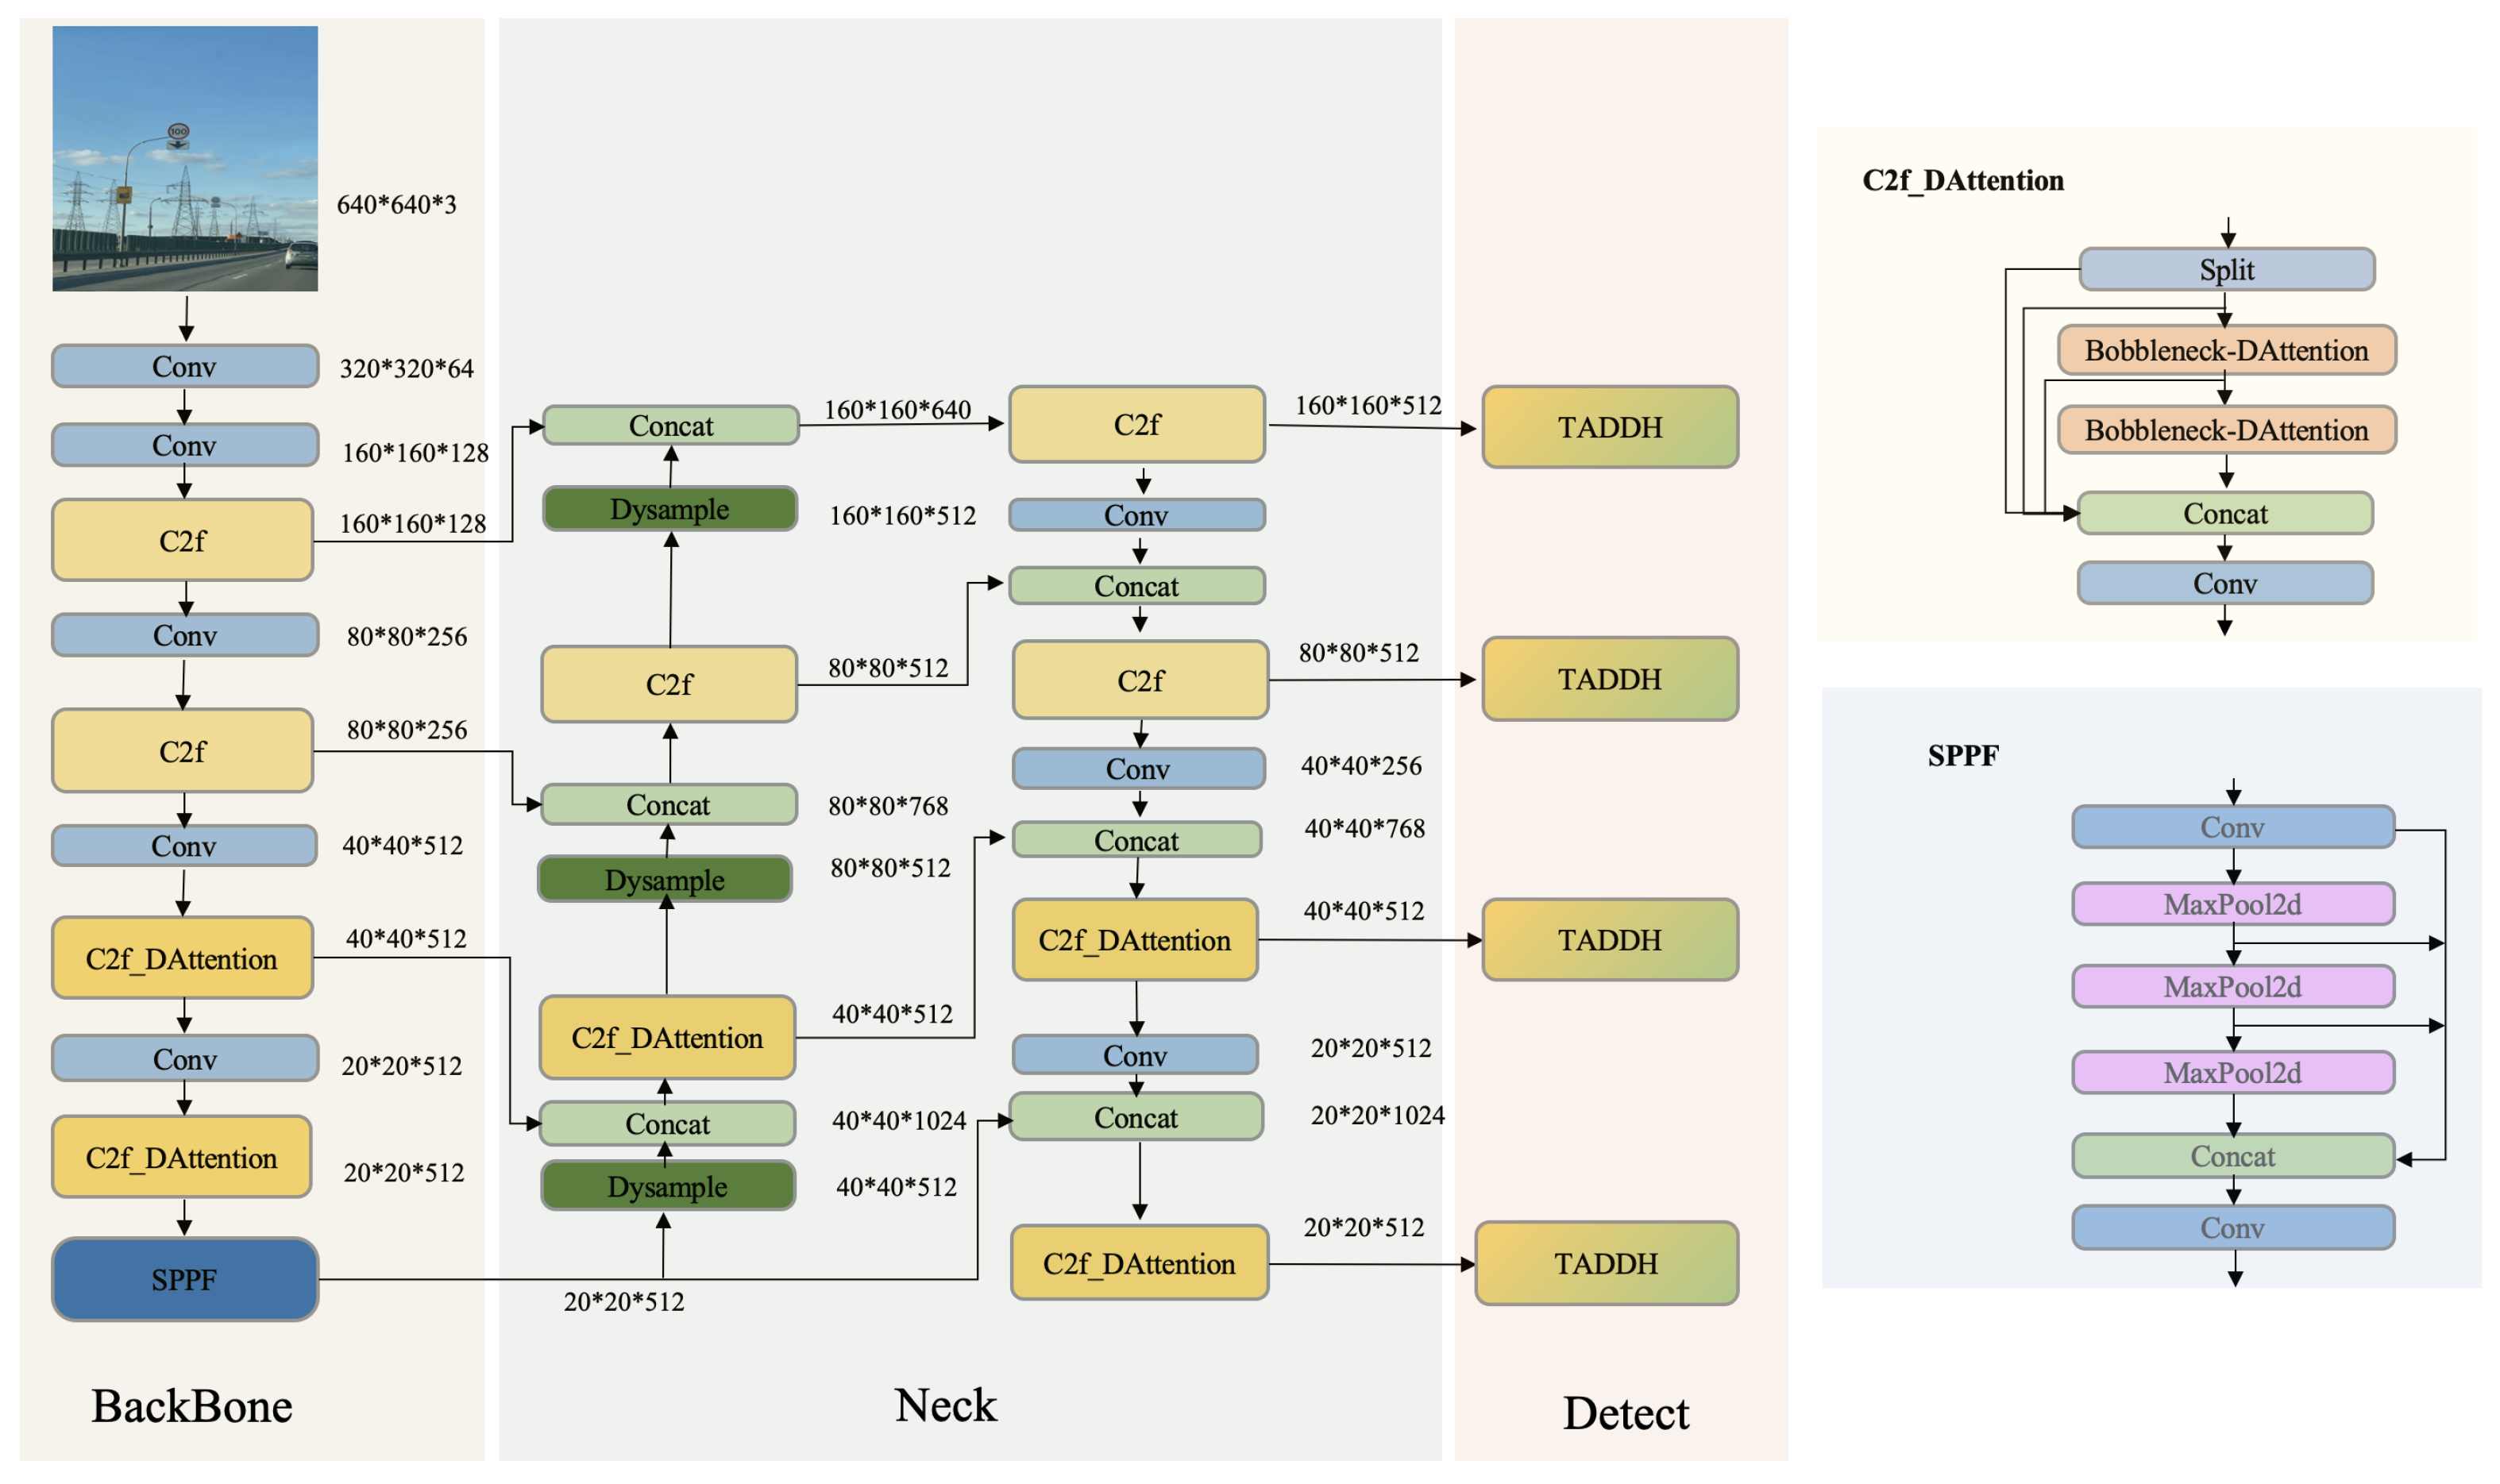
Traffic sign detection in autonomous driving faces multiple challenges, including significant scale variations and complex weather conditions. The core requirement is to accurately identify small-sized signs in complex scenarios, ensuring timely vehicle responses to dynamic traffic environments. To address this, this study proposes the DAYOLO model, aiming for an optimal balance between detection accuracy and computational efficiency. As shown in Figure 3, its structural improvements are mainly reflected in the following five aspects:
Figure 3.
Structure of the DAYOLO model.
The proposed DAYOLO model enhances the accuracy and efficiency of traffic sign detection through a series of structural improvements. Specific technical optimizations include: introducing a deformable self-attention mechanism to dynamically focus salient features, resulting in the improved C2f-DAttention; replacing the original neck network upSample upsampling with a DySample module, significantly reducing computational complexity and latency while maintaining detection performance; designing a lightweight task-aligned dynamic detection head (TADDH), which strengthens task interaction through dynamic attention and reduces the number of parameters by leveraging shared convolutions, thereby improving detection convergence speed and accuracy in complex scenes; adding a Layer2 detection head to enhance multi-scale feature fusion capabilities, and combining FPN and PAN structures to alleviate the problem of feature loss for small targets, effectively improving the recall and precision of small-sized traffic signs; and replacing the bounding box regression loss with normalized Wasserstein distance (NWDLoss), providing a more robust similarity metric for complex scenes, thereby improving localization accuracy. In summary, these systematic improvements make DAYOLO a traffic sign detection solution that combines high accuracy and high speed.
3.1. Vision Transformer with Deformable Attention
DAttention is a deformable self-attention mechanism that dynamically adjusts the receptive field, enabling the model to more effectively focus on key feature regions. Unlike global attention, this module employs a query-independent sampling strategy, directing computational resources to important parts of the image. Its core is to relocate candidate keys and values by generating adaptive reference points and offsets, thereby enhancing the module’s representational flexibility and computational efficiency. This structure significantly reduces memory usage and computational overhead while improving performance in image classification and dense prediction tasks [42].
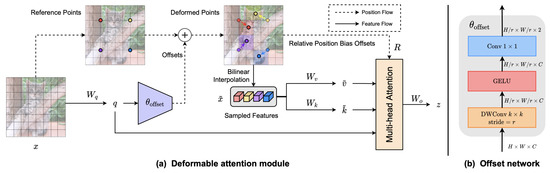
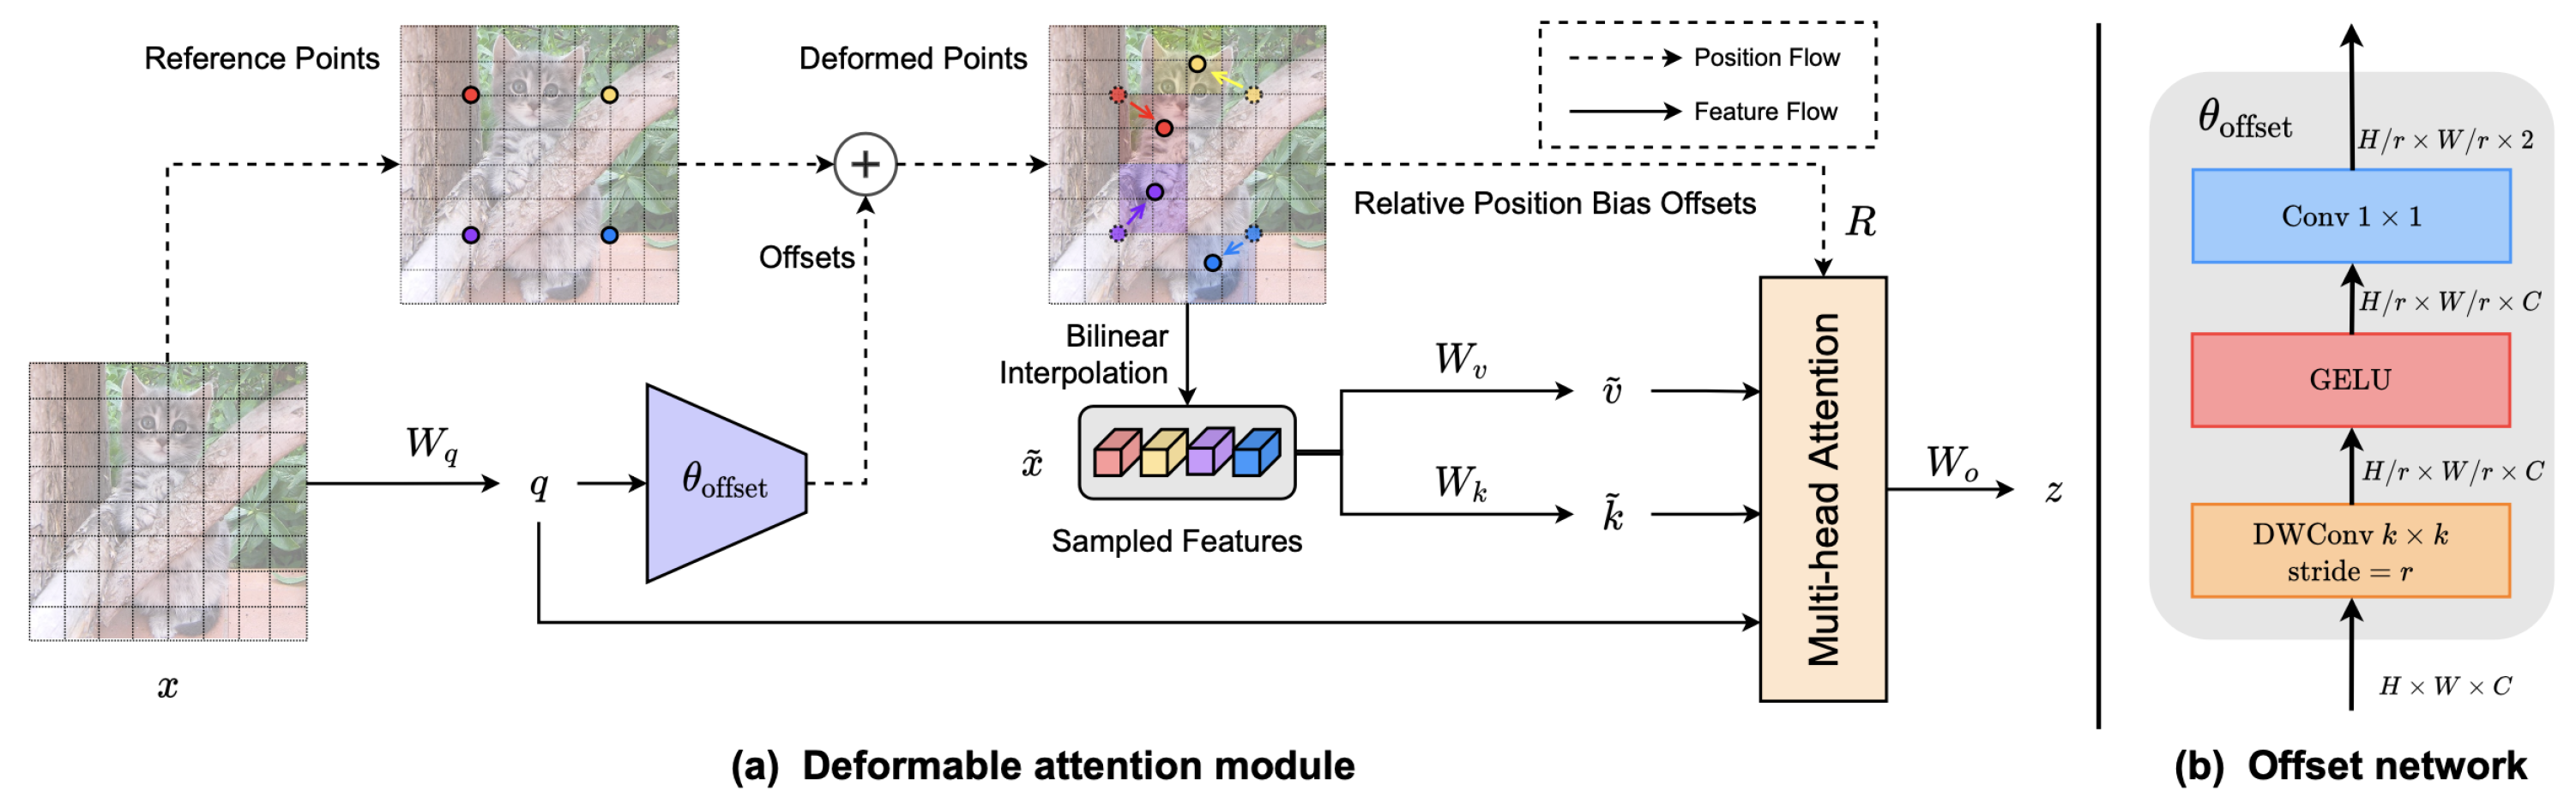
In traffic sign detection tasks, introducing the DAttention module helps the model focus on target regions more accurately, especially in complex backgrounds and multi-scale target scenes, effectively improving detection accuracy. The specific structure of DAttention is shown in Figure 4.
Figure 4.
Model design of DAttention.
As shown in Figure 4a, a uniform reference grid is initialized from the input feature map . The grid dimensions and are obtained by downsampling the original spatial size by a factor r. The grid coordinates are defined as linearly spaced 2D points, normalized to the interval , where the extremes correspond to the top-left and bottom-right corners of the spatial domain [42].
To generate offsets for each reference point, the feature maps undergo linear projection to query tokens , which are then processed by a lightweight sub-network to yield . For training stability, the magnitude of is scaled by a factor s and constrained using a hyperbolic tangent function: . Subsequently, features are sampled at the deformed point locations to form keys and values for subsequent projections [42].
The deformed key and value embeddings are denoted as and , respectively. A bilinear interpolation function is employed as the sampling function for differentiability:
where , and enumerates all spatial locations in . The kernel g ensures that only the four nearest integer coordinates to contribute to the sum, reducing the operation to a local weighted average. Following established practice, multi-head attention is applied to the projected queries q, keys k, and values v, incorporating relative position offsets R. The output of a single attention head is computed as [42].
3.2. Lightweight Image Upsampler DySamply
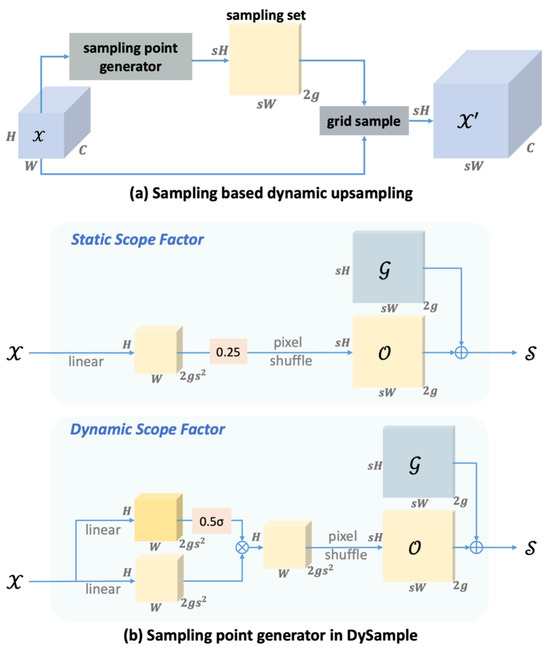
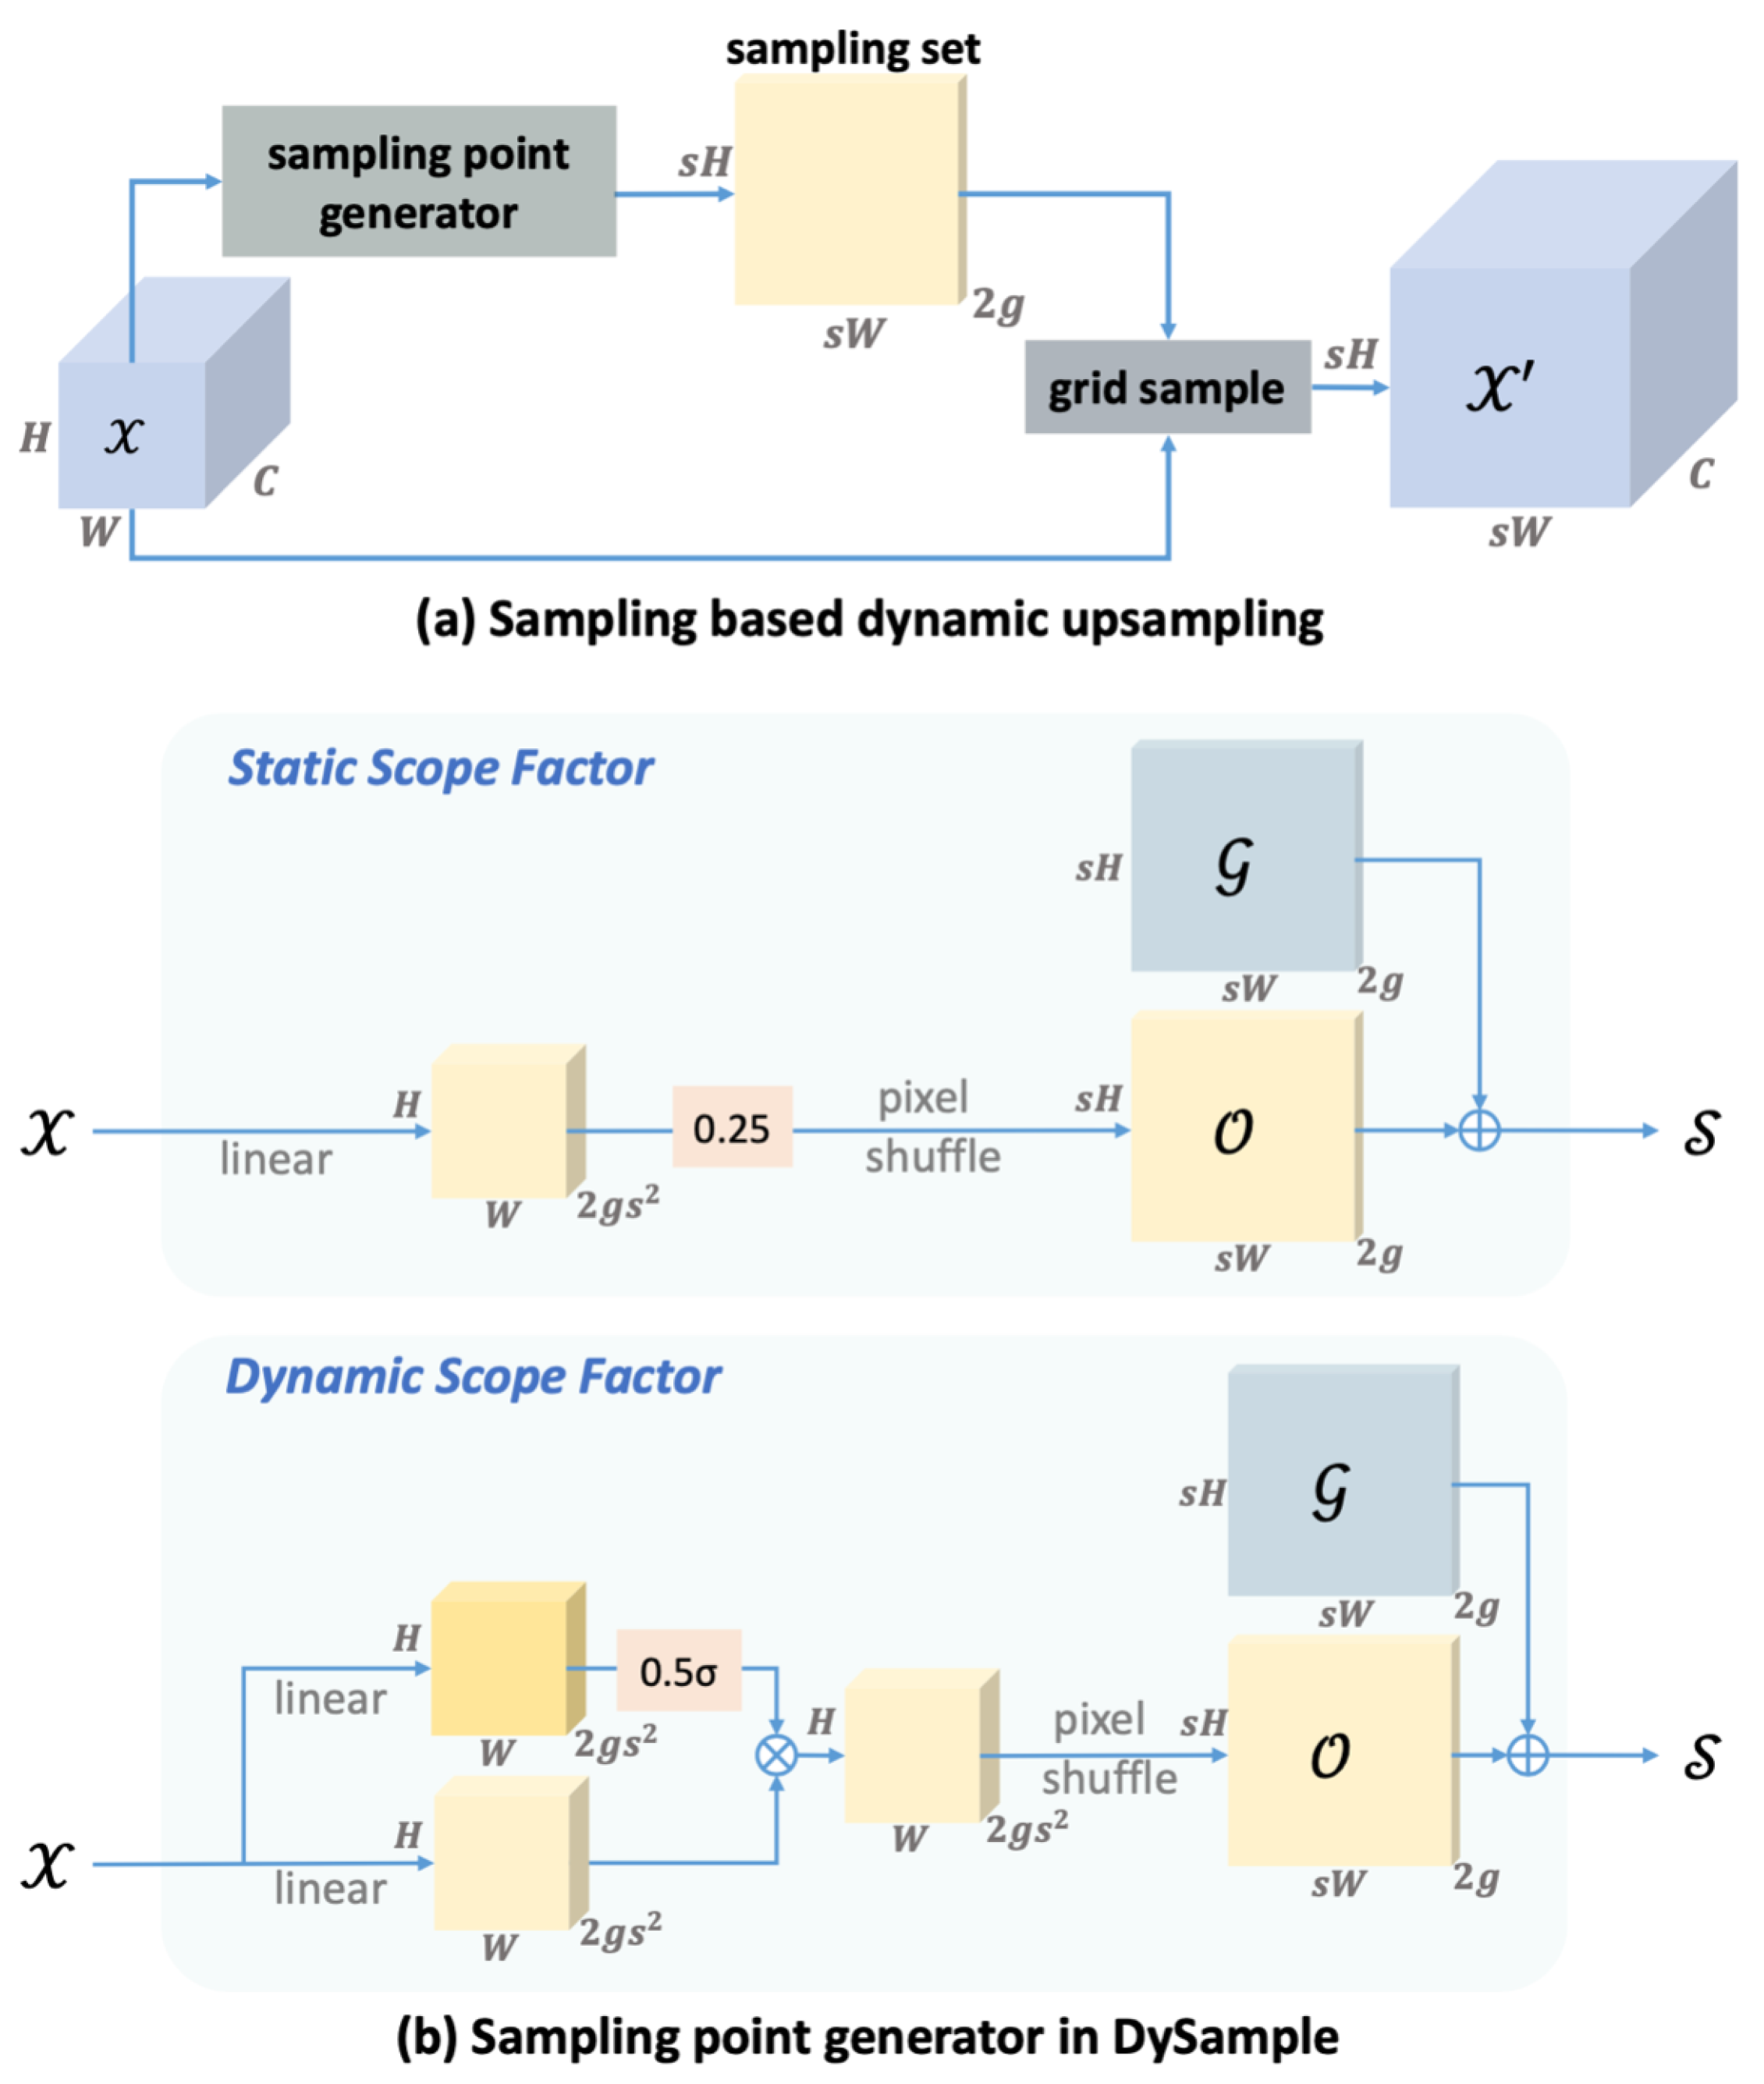
To optimize the performance of YOLOv8n in traffic sign detection, this study introduces the DySample upsampling module. This module is an ultra-lightweight dynamic upsampling unit that effectively improves image resolution with extremely low computational overhead. Unlike convolutional kernel-based methods such as CARAFE, DySample employs a point sampling strategy, significantly reducing the number of parameters, computational burden, and inference latency. Another practical advantage is that it is implemented entirely based on standard PyTorch operators, eliminating the need for custom CUDA code and greatly simplifying the deployment process [43].
DySample performs excellently in resource-constrained environments and various intensive prediction tasks. In this study, the addition of this module not only accelerated inference speed but also improved detection accuracy, validating its practical performance in traffic sign detection. The module structure of DySample is shown in Figure 5.
Figure 5.
Model design of DySample.
Figure 5a illustrates the feasibility of a sampling-based dynamic upsampling paradigm. The process commences with a feature map and a sample set , where the latter’s first dimension encodes x and y coordinate offsets. The core operation resamples via a bilinear interpolation function, producing the output [43]:
For a target upscaling factor s, the module ingests and generates an offset tensor . This tensor is reshaped to via a pixel shuffling operation. The final sample set for resampling is obtained by summing this restructured offset with the original sampling grid . This is formally expressed as [43]:
3.3. Task Align Dynamic Detection Head
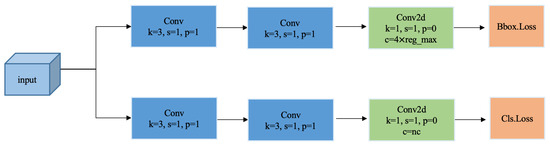
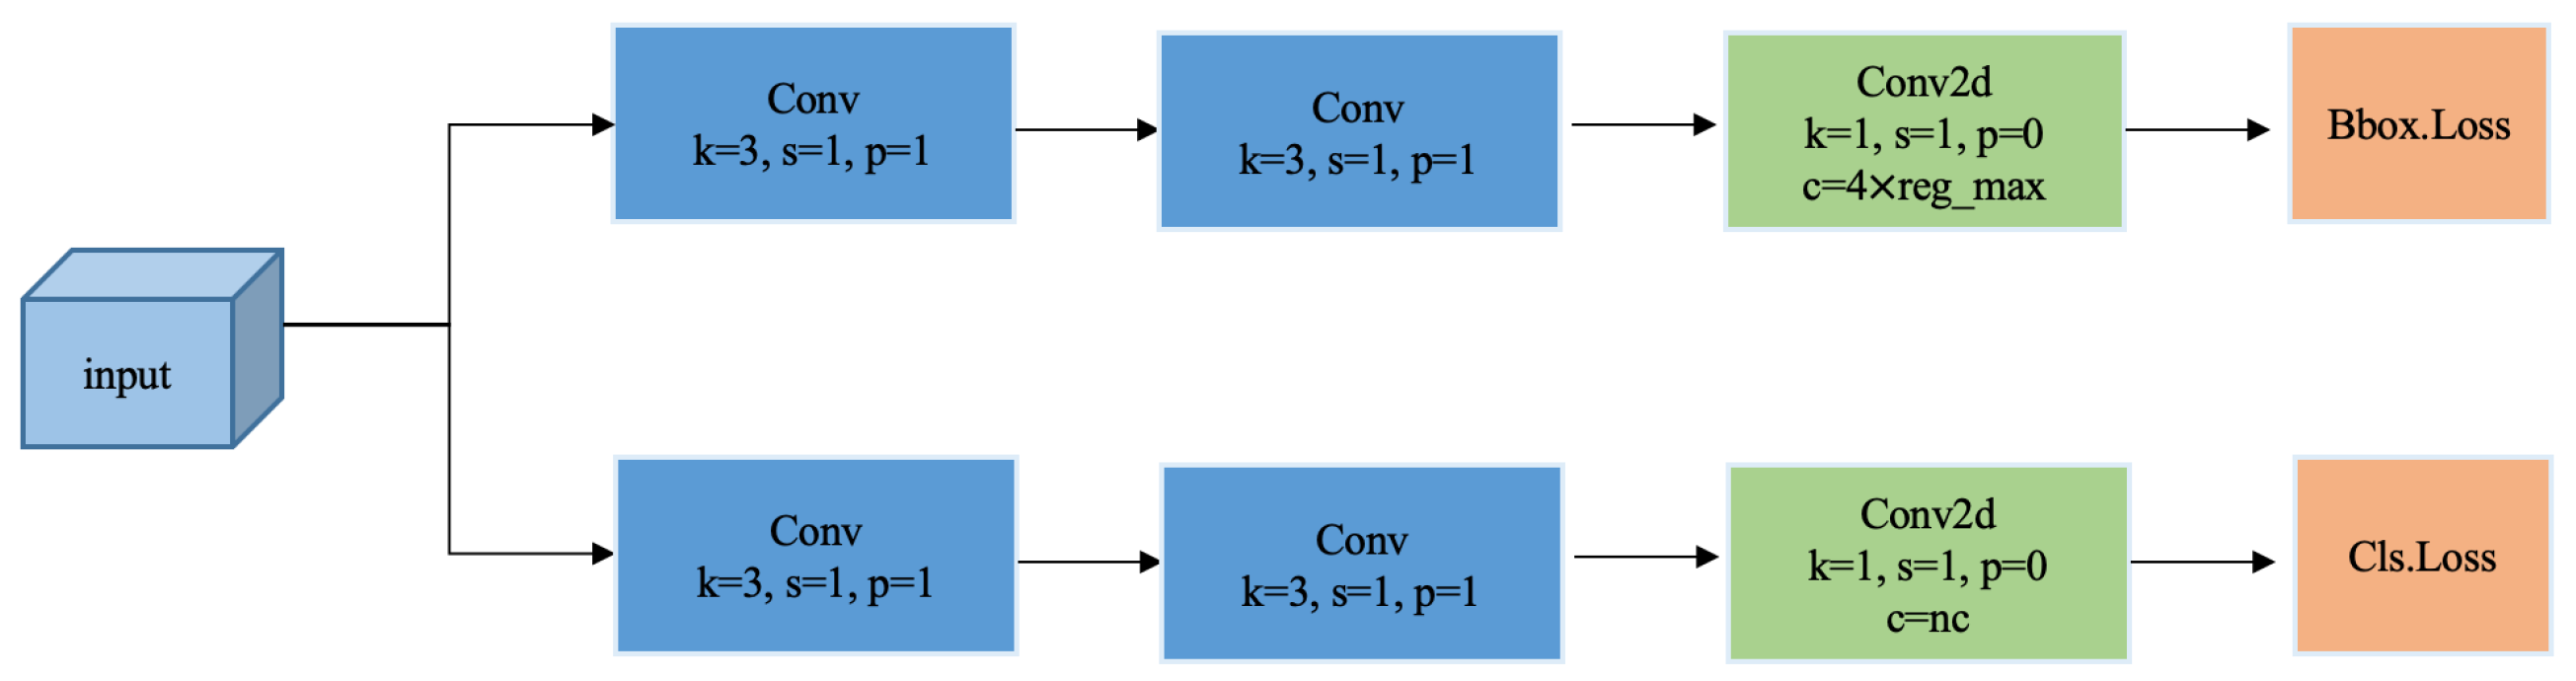
To improve the clarity of task differentiation, YOLOv8 employs a decoupled head structure, separating the target classification and bounding box regression tasks. Input features are first processed by two independent convolutional blocks (CBS), and then fused through a Conv2d layer, with corresponding loss functions calculated separately. Specifically, the classification task uses binary cross-entropy (BCE), while bounding box regression uses a combination of complete intersection–union ratio (CIoU) and distributed focusing loss (DFL) to ensure robust localization. This structure design is shown in Figure 6.
Figure 6.
Schematic diagram of the decoupled head structure.
However, YOLOv8’s decoupled head structure has certain limitations in traffic sign detection. The separation of classification and regression tasks leads to insufficient feature interaction between the two, which can easily affect model performance in complex scenes. Furthermore, this structure has limited adaptability to changes in the scale and shape of traffic signs, often resulting in poor localization of small-sized or distant signs. Under complex background interference, the outputs of the two tasks may also become misaligned, further reducing detection accuracy.
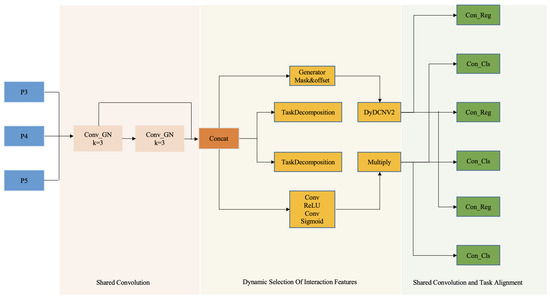
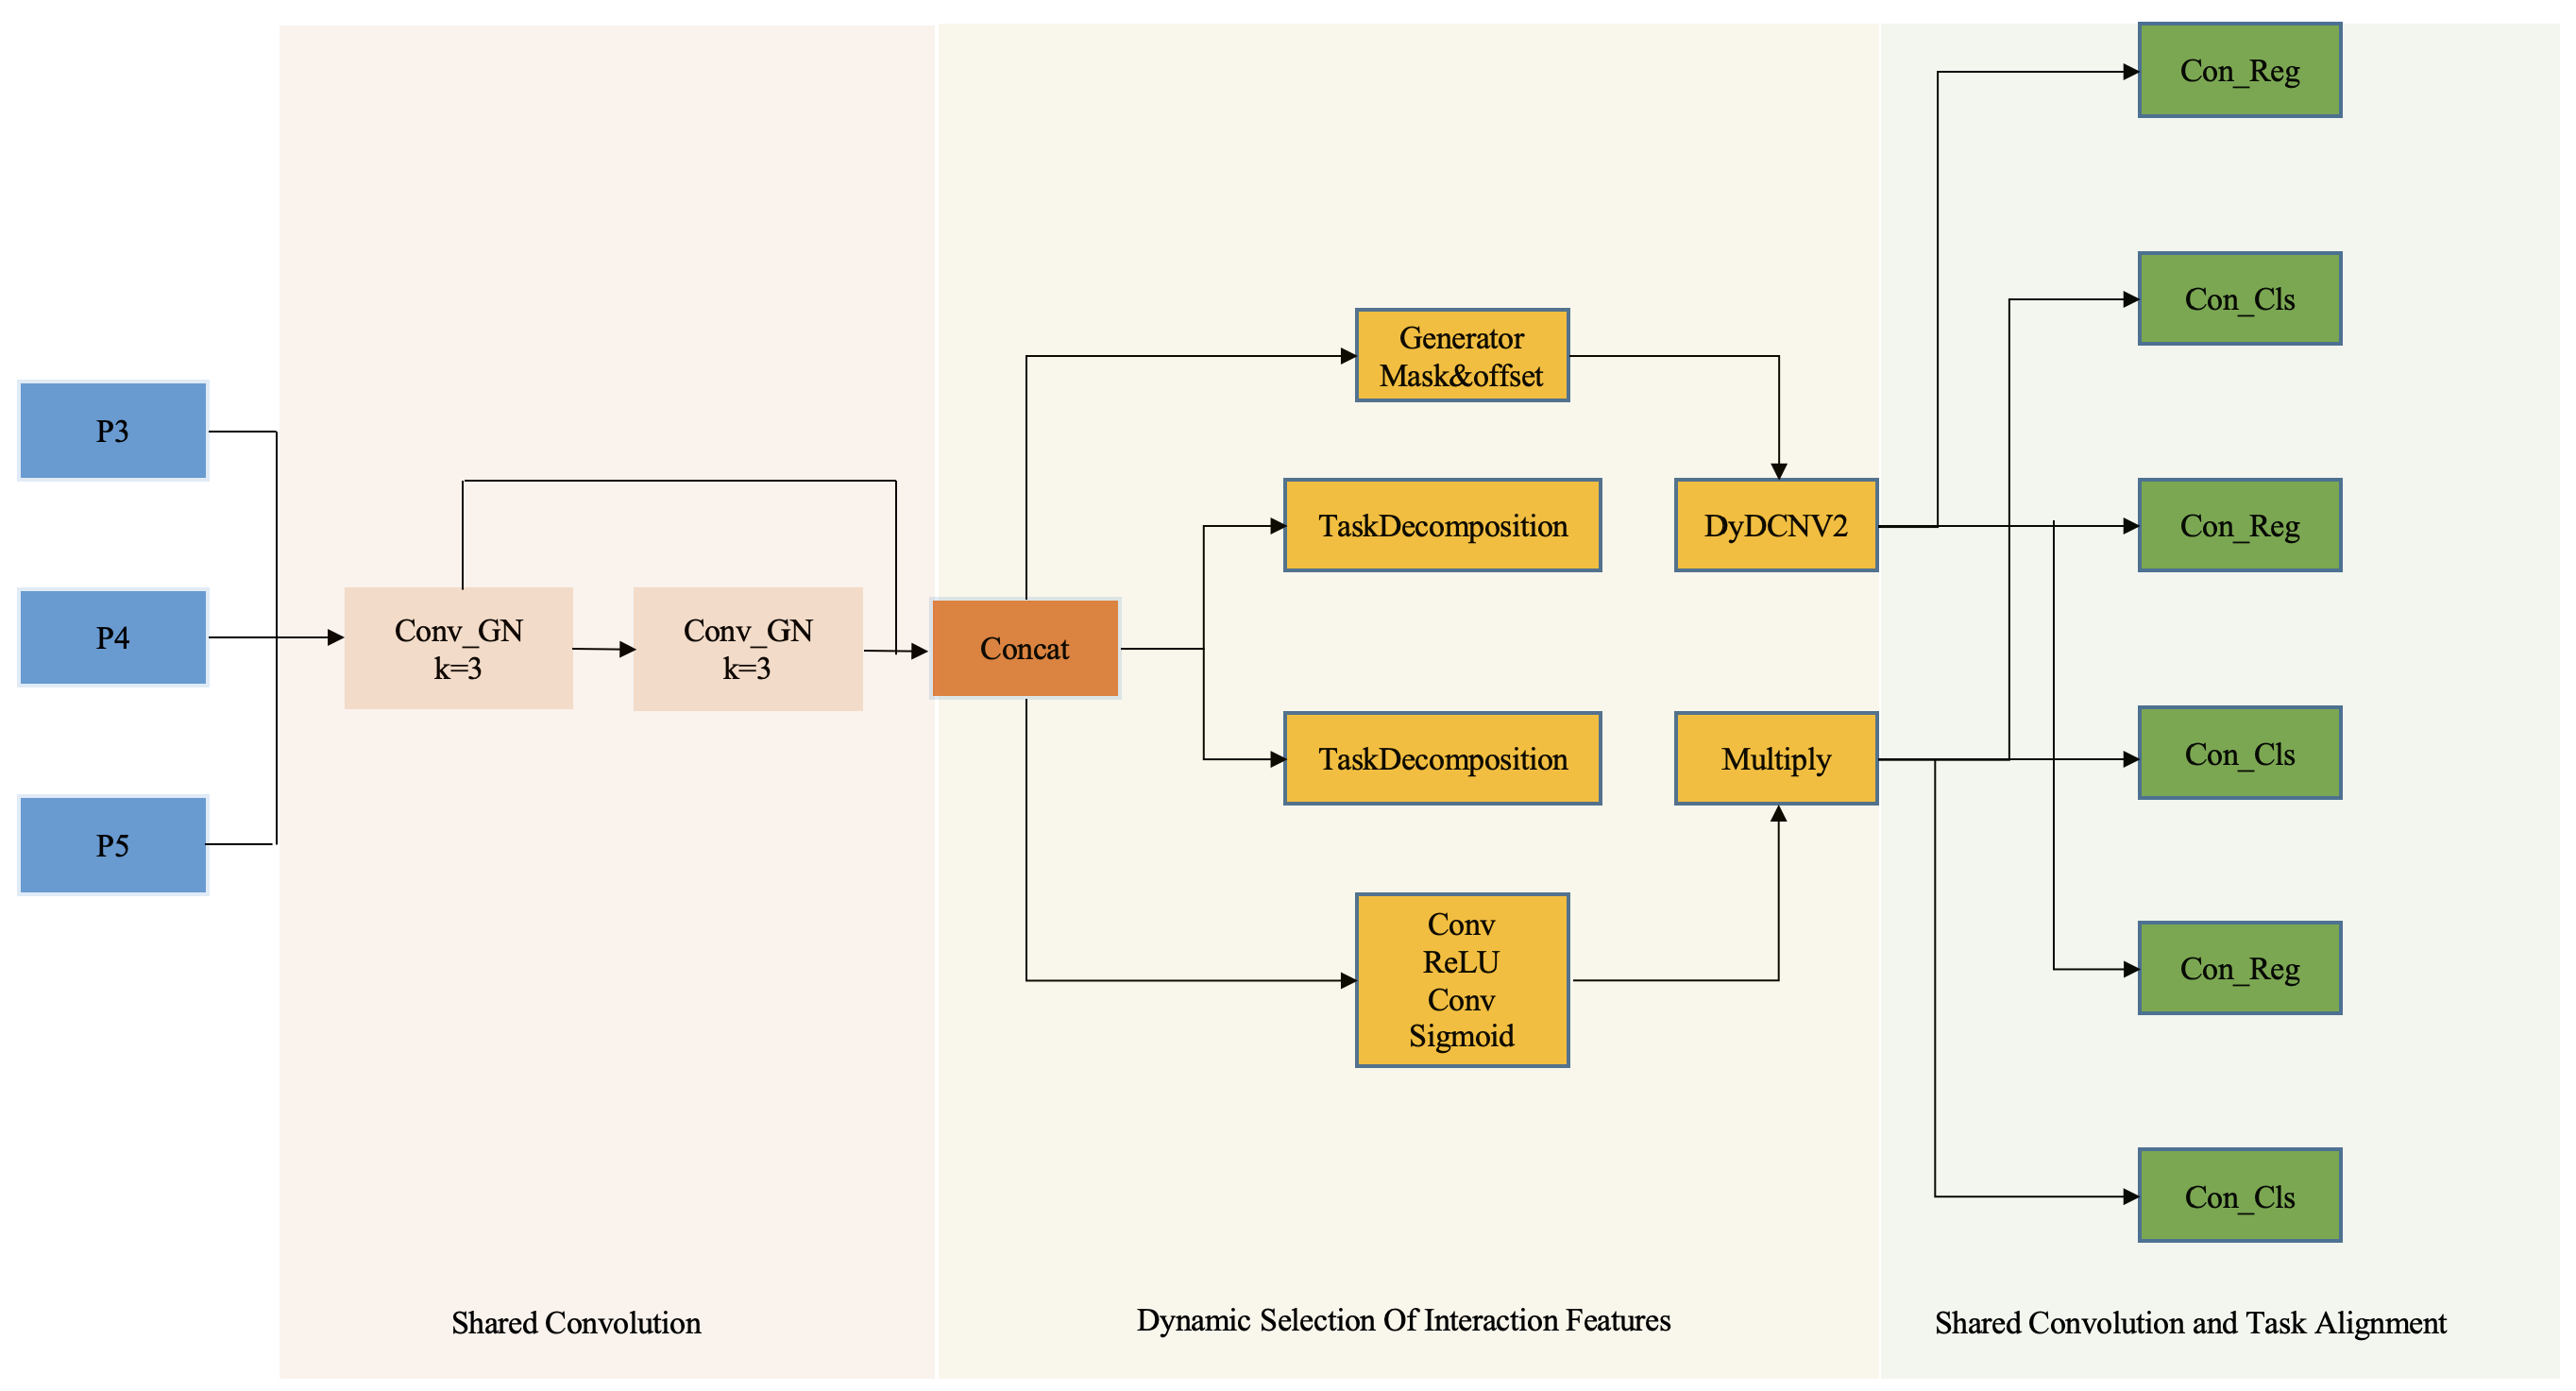
To address the aforementioned issues, this paper proposes a Task Alignment Dynamic Detection Head (TADDH). This structure enhances the interaction between tasks through a dynamic feature alignment mechanism and introduces a shared convolutional module to improve parameter efficiency, which is particularly important for resource-constrained deployment scenarios. TADDH can dynamically adjust the detection head parameters based on task-related features, thereby possessing better scale adaptability and robustness, significantly improving detection accuracy in complex environments. Its overall structure is detailed in Figure 7.
Figure 7.
Task Align Dynamic Detection Head.
In TADDH, the classification and regression branches are specifically designed: the classification branch optimizes task alignment through dynamic feature selection, while the regression branch utilizes DCNv2 and interactive features to generate offsets and masks, further improving localization accuracy. Furthermore, a spatial convolutional offset mechanism enhances the model’s adaptability to spatial transformations of traffic signs, thereby comprehensively improving detection performance. Through these designs, TADDH significantly improves detection accuracy and robustness in diverse traffic sign scenarios and complex environmental environments.
3.4. Detection Head for Detecting Small Objects
The feature fusion structure based on FPN+PAN in the standard YOLOv8 framework has a key limitation: features gradually degrade during inter-layer propagation. This information loss is particularly pronounced in the vertical propagation path, severely weakening the ability to represent small-scale targets. In traffic sign detection tasks, due to the large differences in target scale and the fact that they are often in complex environments, this deficiency directly leads to insufficient accuracy and poor Intersection over Union (IoU) performance for small-sized signs, becoming a significant performance bottleneck.
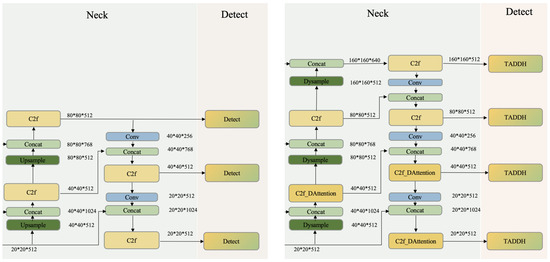
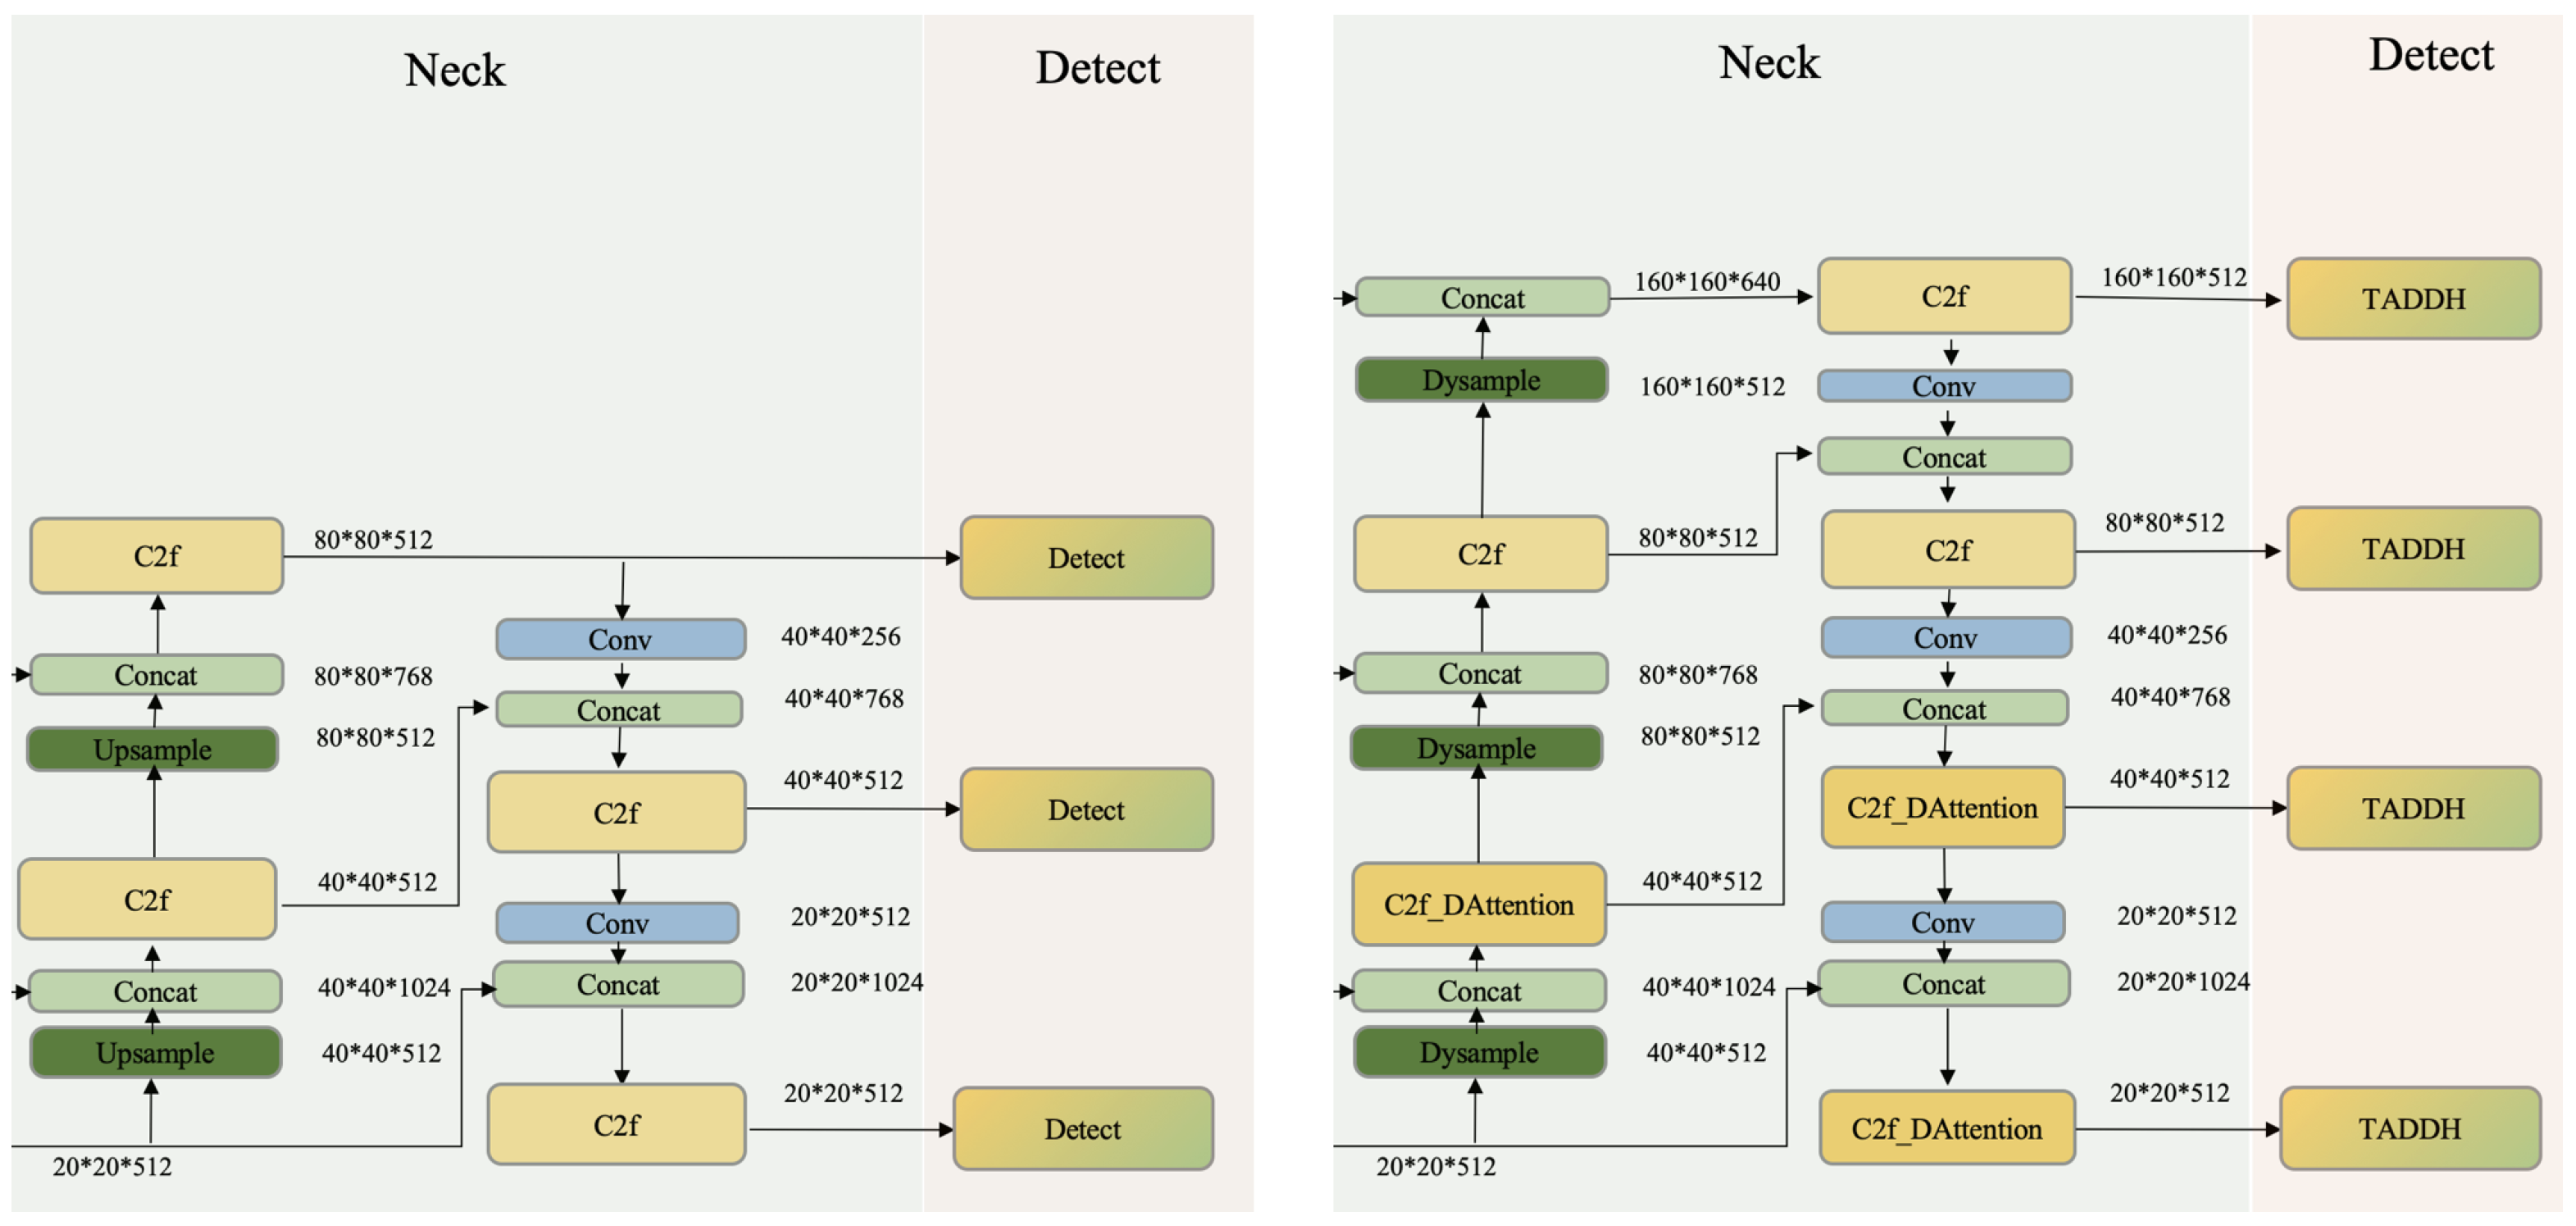
To address this, we expanded the original three detection heads of YOLOv8 to four to enhance the extraction and fusion capabilities of multi-scale features, focusing on improving the representation of small-sized traffic signs. This improvement is mainly implemented in the FPN and PAN structures by introducing additional operational layers to strengthen the learning of small target features. The details of the optimized architecture are shown in Figure 8.
Figure 8.
Comparison of the added detection head and the original YOLOv8 neck.
To further enhance feature representation capabilities, this paper adds an auxiliary Layer 2 detector head on top of the existing layers (4, 6, 9) in the PANet structure after a 4× downsampling. This design effectively improves localization accuracy, training stability, and overall model performance by introducing finer-grained information. The enhanced architecture better understands contextual information, resulting in significant improvements in small-sized traffic sign detection.
Furthermore, the overall design of the four detector heads optimizes the interaction between classification and regression tasks during object detection. By introducing a dynamic task alignment mechanism (TADDH), the model can more accurately locate targets when faced with traffic signs of varying sizes and types, and effectively reduce false positives and false negatives in complex backgrounds.
In summary, the above improvements significantly enhance the Intersection over Union (IoU) and small target extraction capabilities for traffic sign detection. Experimental results show that the improved model with four detector heads significantly improves detection accuracy in complex traffic scenes, especially for low-contrast and small-sized traffic signs, exhibiting higher stability and accuracy.
3.5. Normalized Gaussian Wasserstein Distance
Optimal Transport theory leverages the Wasserstein distance to quantify distributional divergence. For two bivariate Gaussian distributions, and , the squared second-order Wasserstein distance is defined as [44]:
This expression can be equivalently formulated using the Frobenius norm :
where the Frobenius norm, denoted by , is applied.
For Gaussian distributions parameterized by bounding boxes A and B, the Wasserstein distance simplifies consequently:
However, while functions as a distance metric, its value is unbounded and thus not directly suitable as a similarity measure comparable to IoU. To bridge this gap, we propose the Normalized Wasserstein Distance (NWD), which applies exponential normalization to constrain the output within the [0, 1] range [44]:
where C is a constant, here taken as 12.8 [44]. The final loss formula is as follows:
The loss function based on normalized Wasserstein distance (NWD) can significantly improve the model’s ability to distinguish targets of different scales and complex backgrounds. Compared with the traditional IoU-based loss function, NWDLoss can more accurately capture subtle differences between traffic signs and the background, thereby effectively improving detection accuracy.
4. Experiments
4.1. Experimental Dataset
4.1.1. SDCCVP Dataset
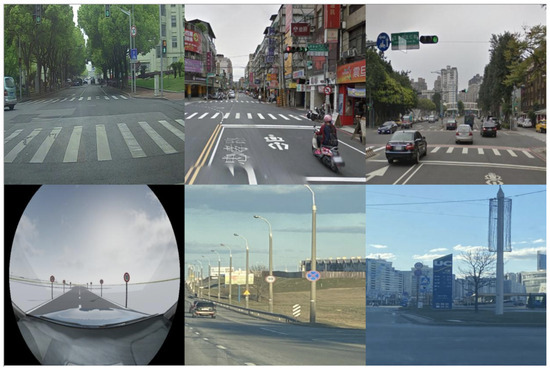
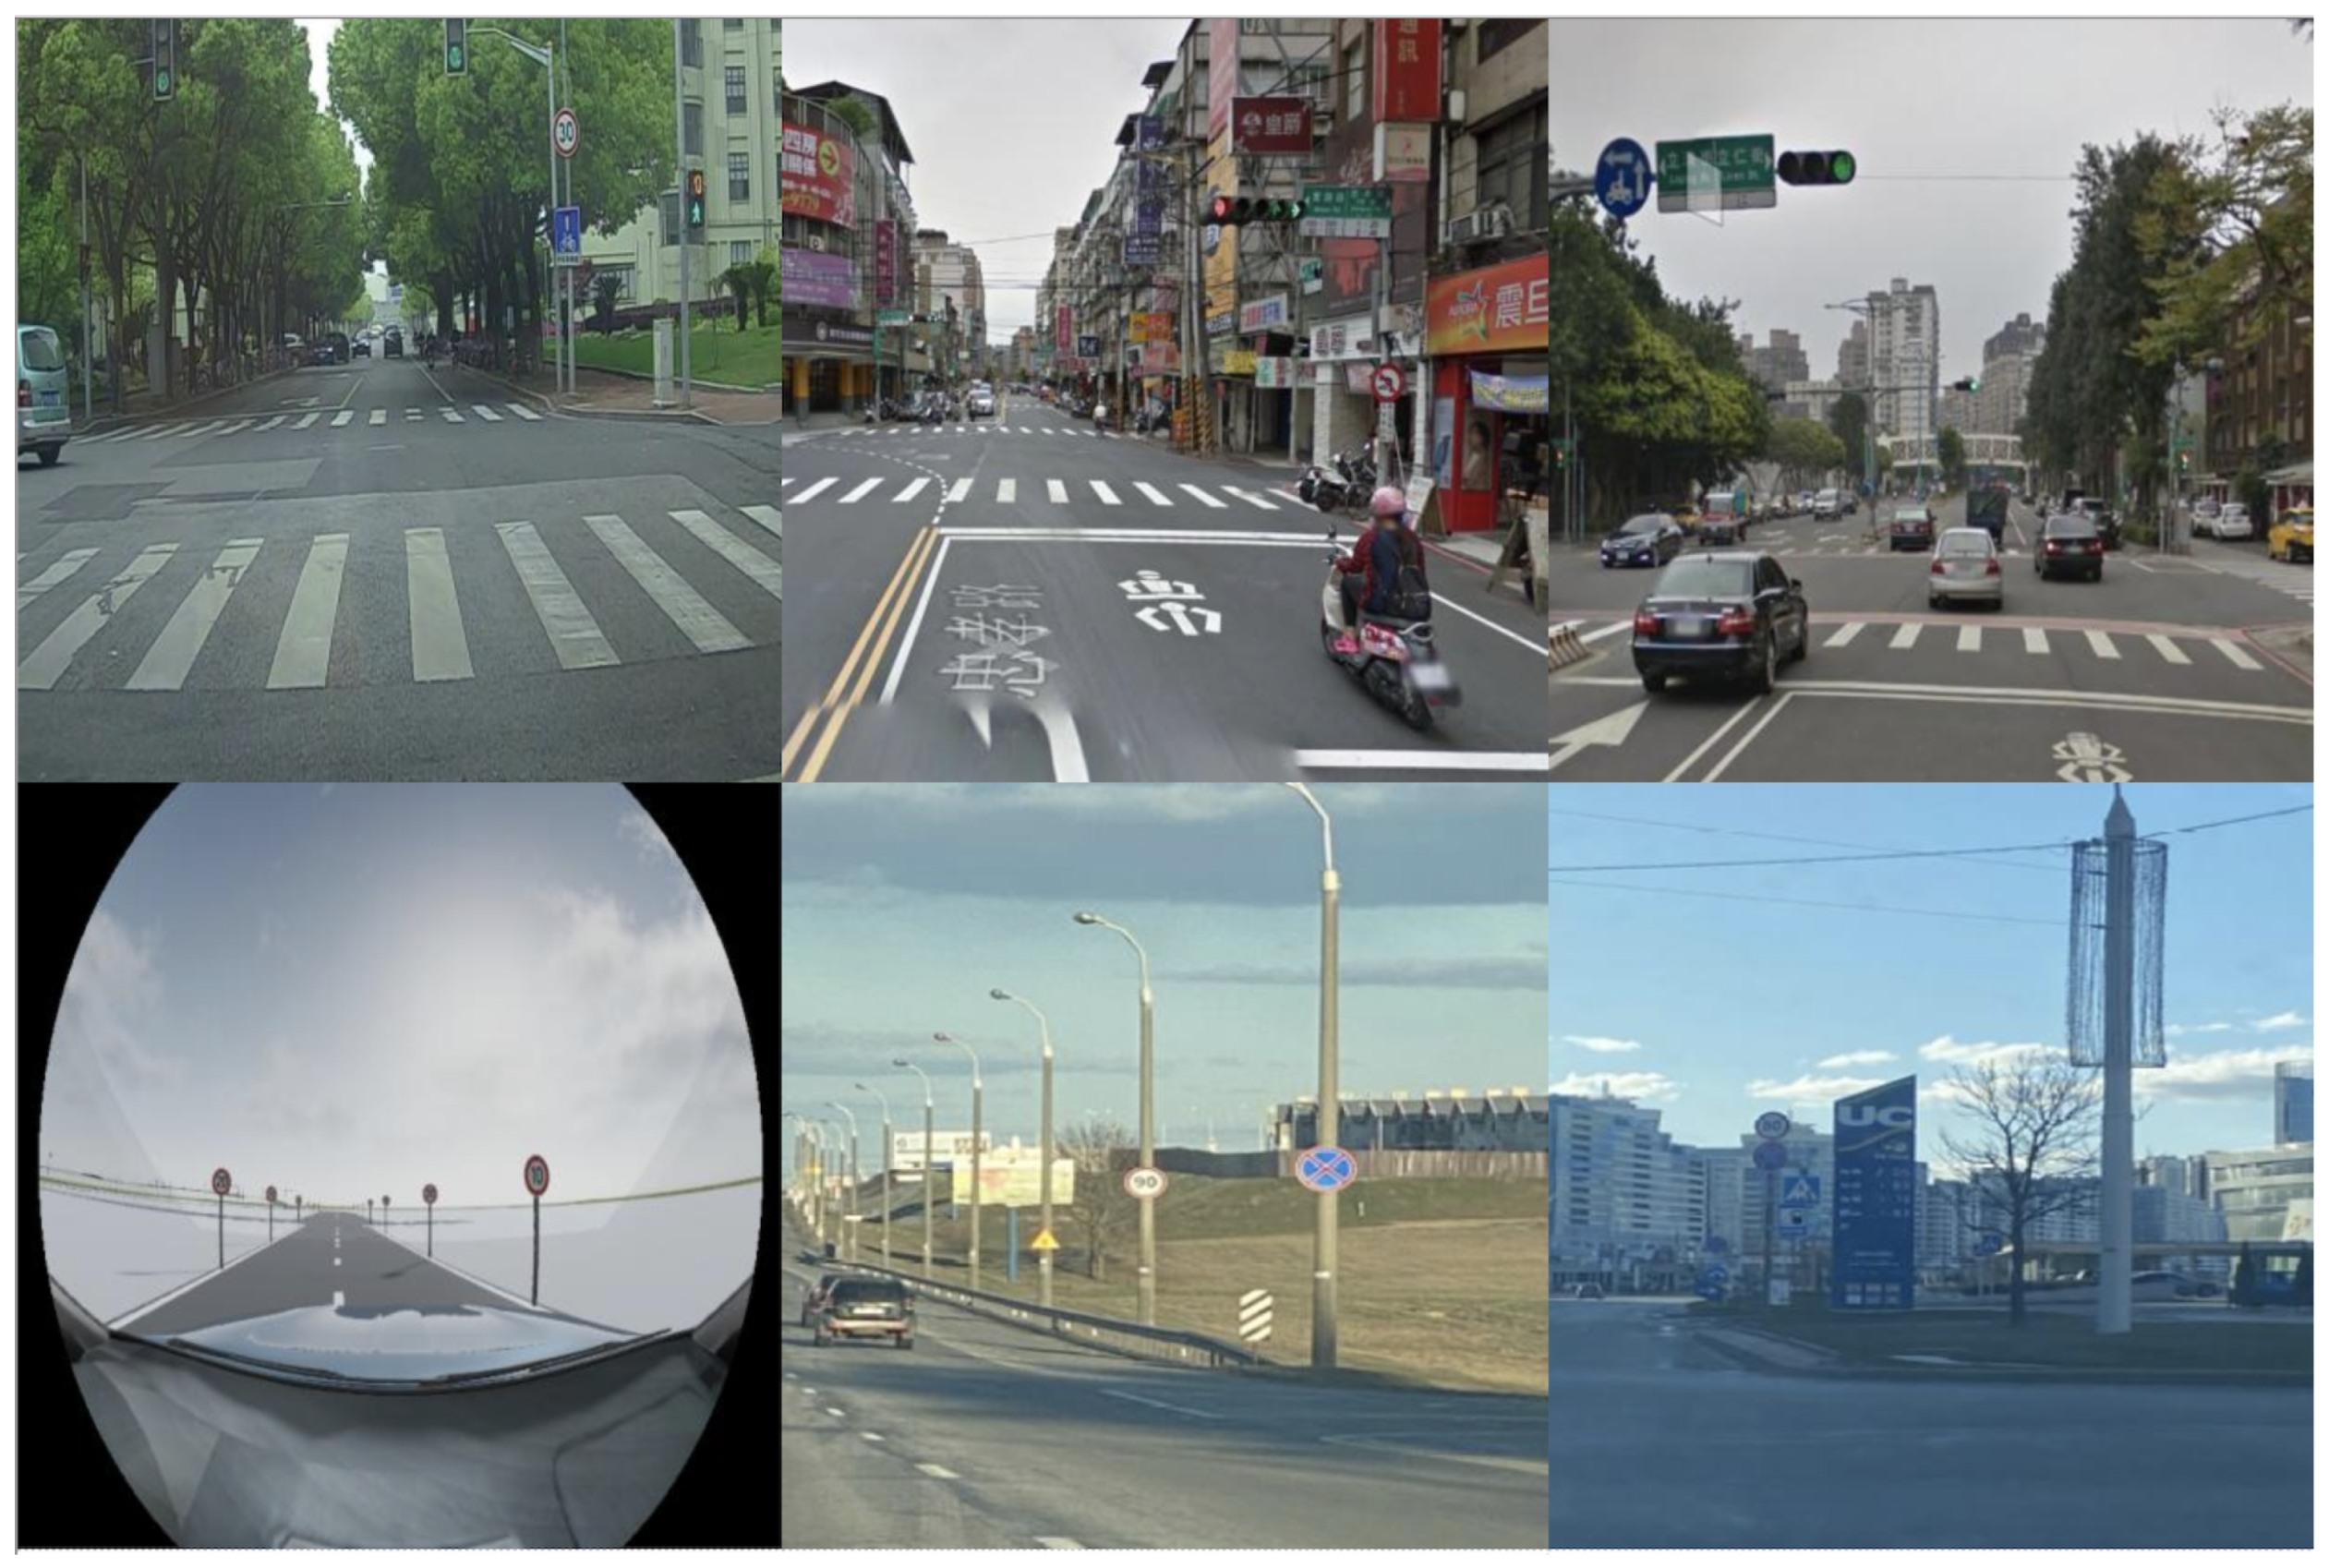
This study uses the SDCCVP dataset, a dedicated dataset for autonomous driving vision, sourced from the Roboflow traffic sign public repository [45]. The original data contains 4969 traffic sign images across 15 categories, covering various speed limit signs and traffic signals. The “Speed Limit 10” category contains only 22 samples, significantly underrepresented in the dataset, consistent with its rarity in real-world traffic scenarios. To avoid the negative impact of insufficient samples in this category on the model’s generalization ability, we removed it to improve training effectiveness and recognition accuracy. The final dataset used contains 4956 images. Figure 9 shows representative samples for six categories under different lighting and weather conditions.
Figure 9.
SDCCVP Dataset Samples.
4.1.2. TT100K Dataset
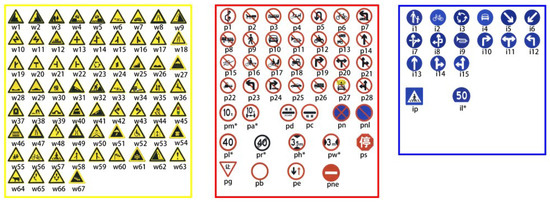
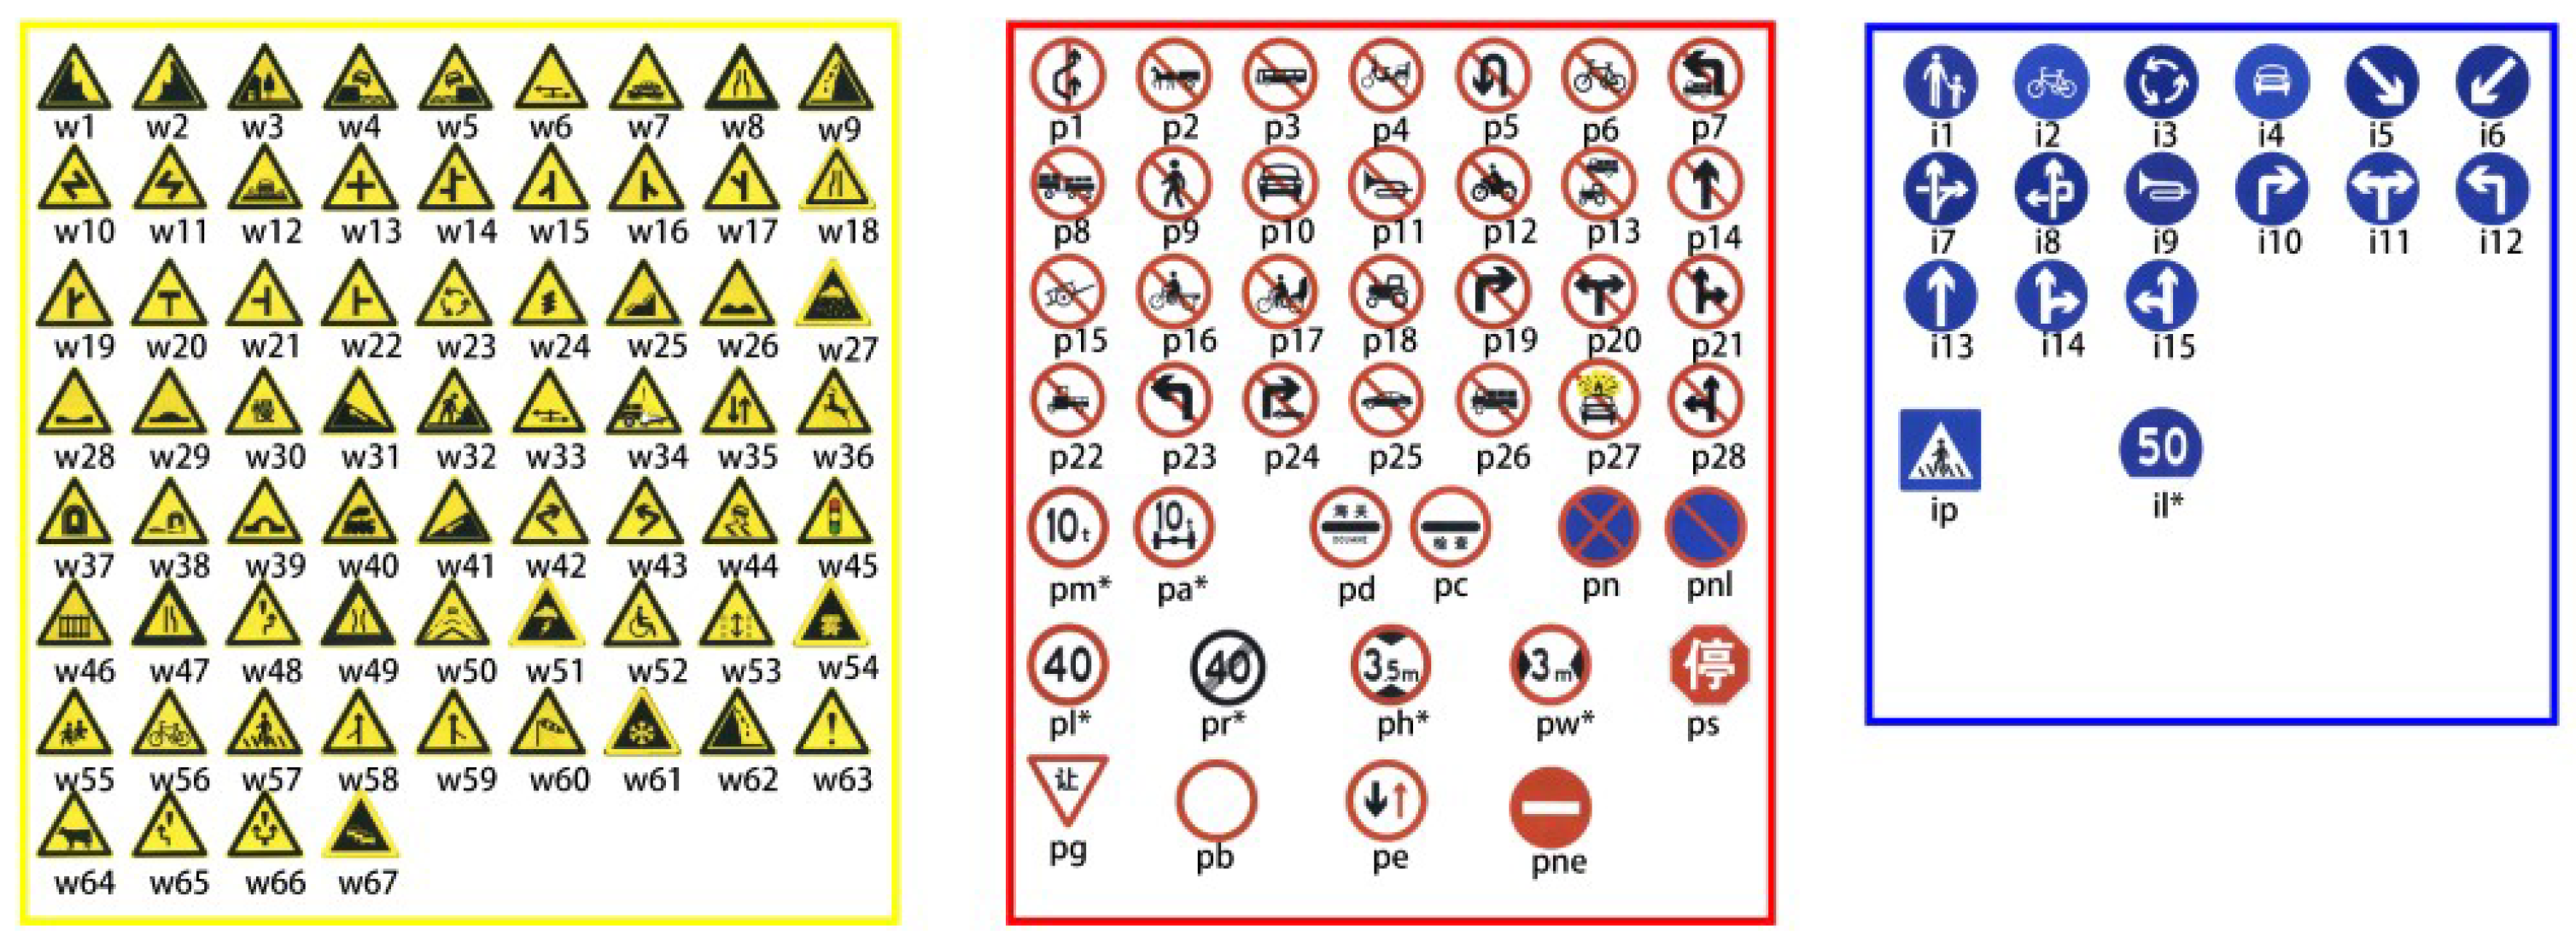
To specifically verify the model’s small object detection capability and generalization performance, this study selected the TT100K dataset as a benchmark. This dataset, jointly released by Tsinghua University and Tencent, contains 100,000 high-resolution images (up to 2048 × 2048) covering various road scenes in China, including approximately 30,000 instances of 221 traffic signs, covering different lighting and weather conditions, making it suitable for evaluating the model’s robustness in real-world environments. According to the SPIE standard, small-scale objects account for approximately 84% of this dataset [46], making it particularly suitable for small object detection research [47]. Figure 10 shows examples of some traffic sign categories in the dataset. The asterisks (*) in the image represent the corresponding numbers in the icons; for example, “pl*” represents “pl40” and “il*” represents “il50”.
Figure 10.
Traffic sign categories in TT100K.
It should be noted that the distribution of categories in the dataset is uneven, and the sample size of some signs is too small, which is not conducive to effective model training. Therefore, we adopted a data filtering strategy to remove categories with fewer than 100 labeled instances to reduce the risk of overfitting the model to low-frequency categories and improve the reliability of subsequent analysis. Finally, 42 categories meeting the quantity requirements were selected for the experiment. The data is divided as follows: 6600 images for training, 1891 images for validation, and 972 images for test.
4.2. Data Augmentation
4.2.1. Offline Data Augmentation
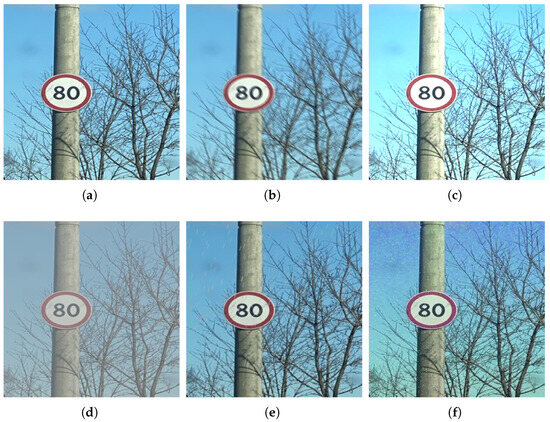
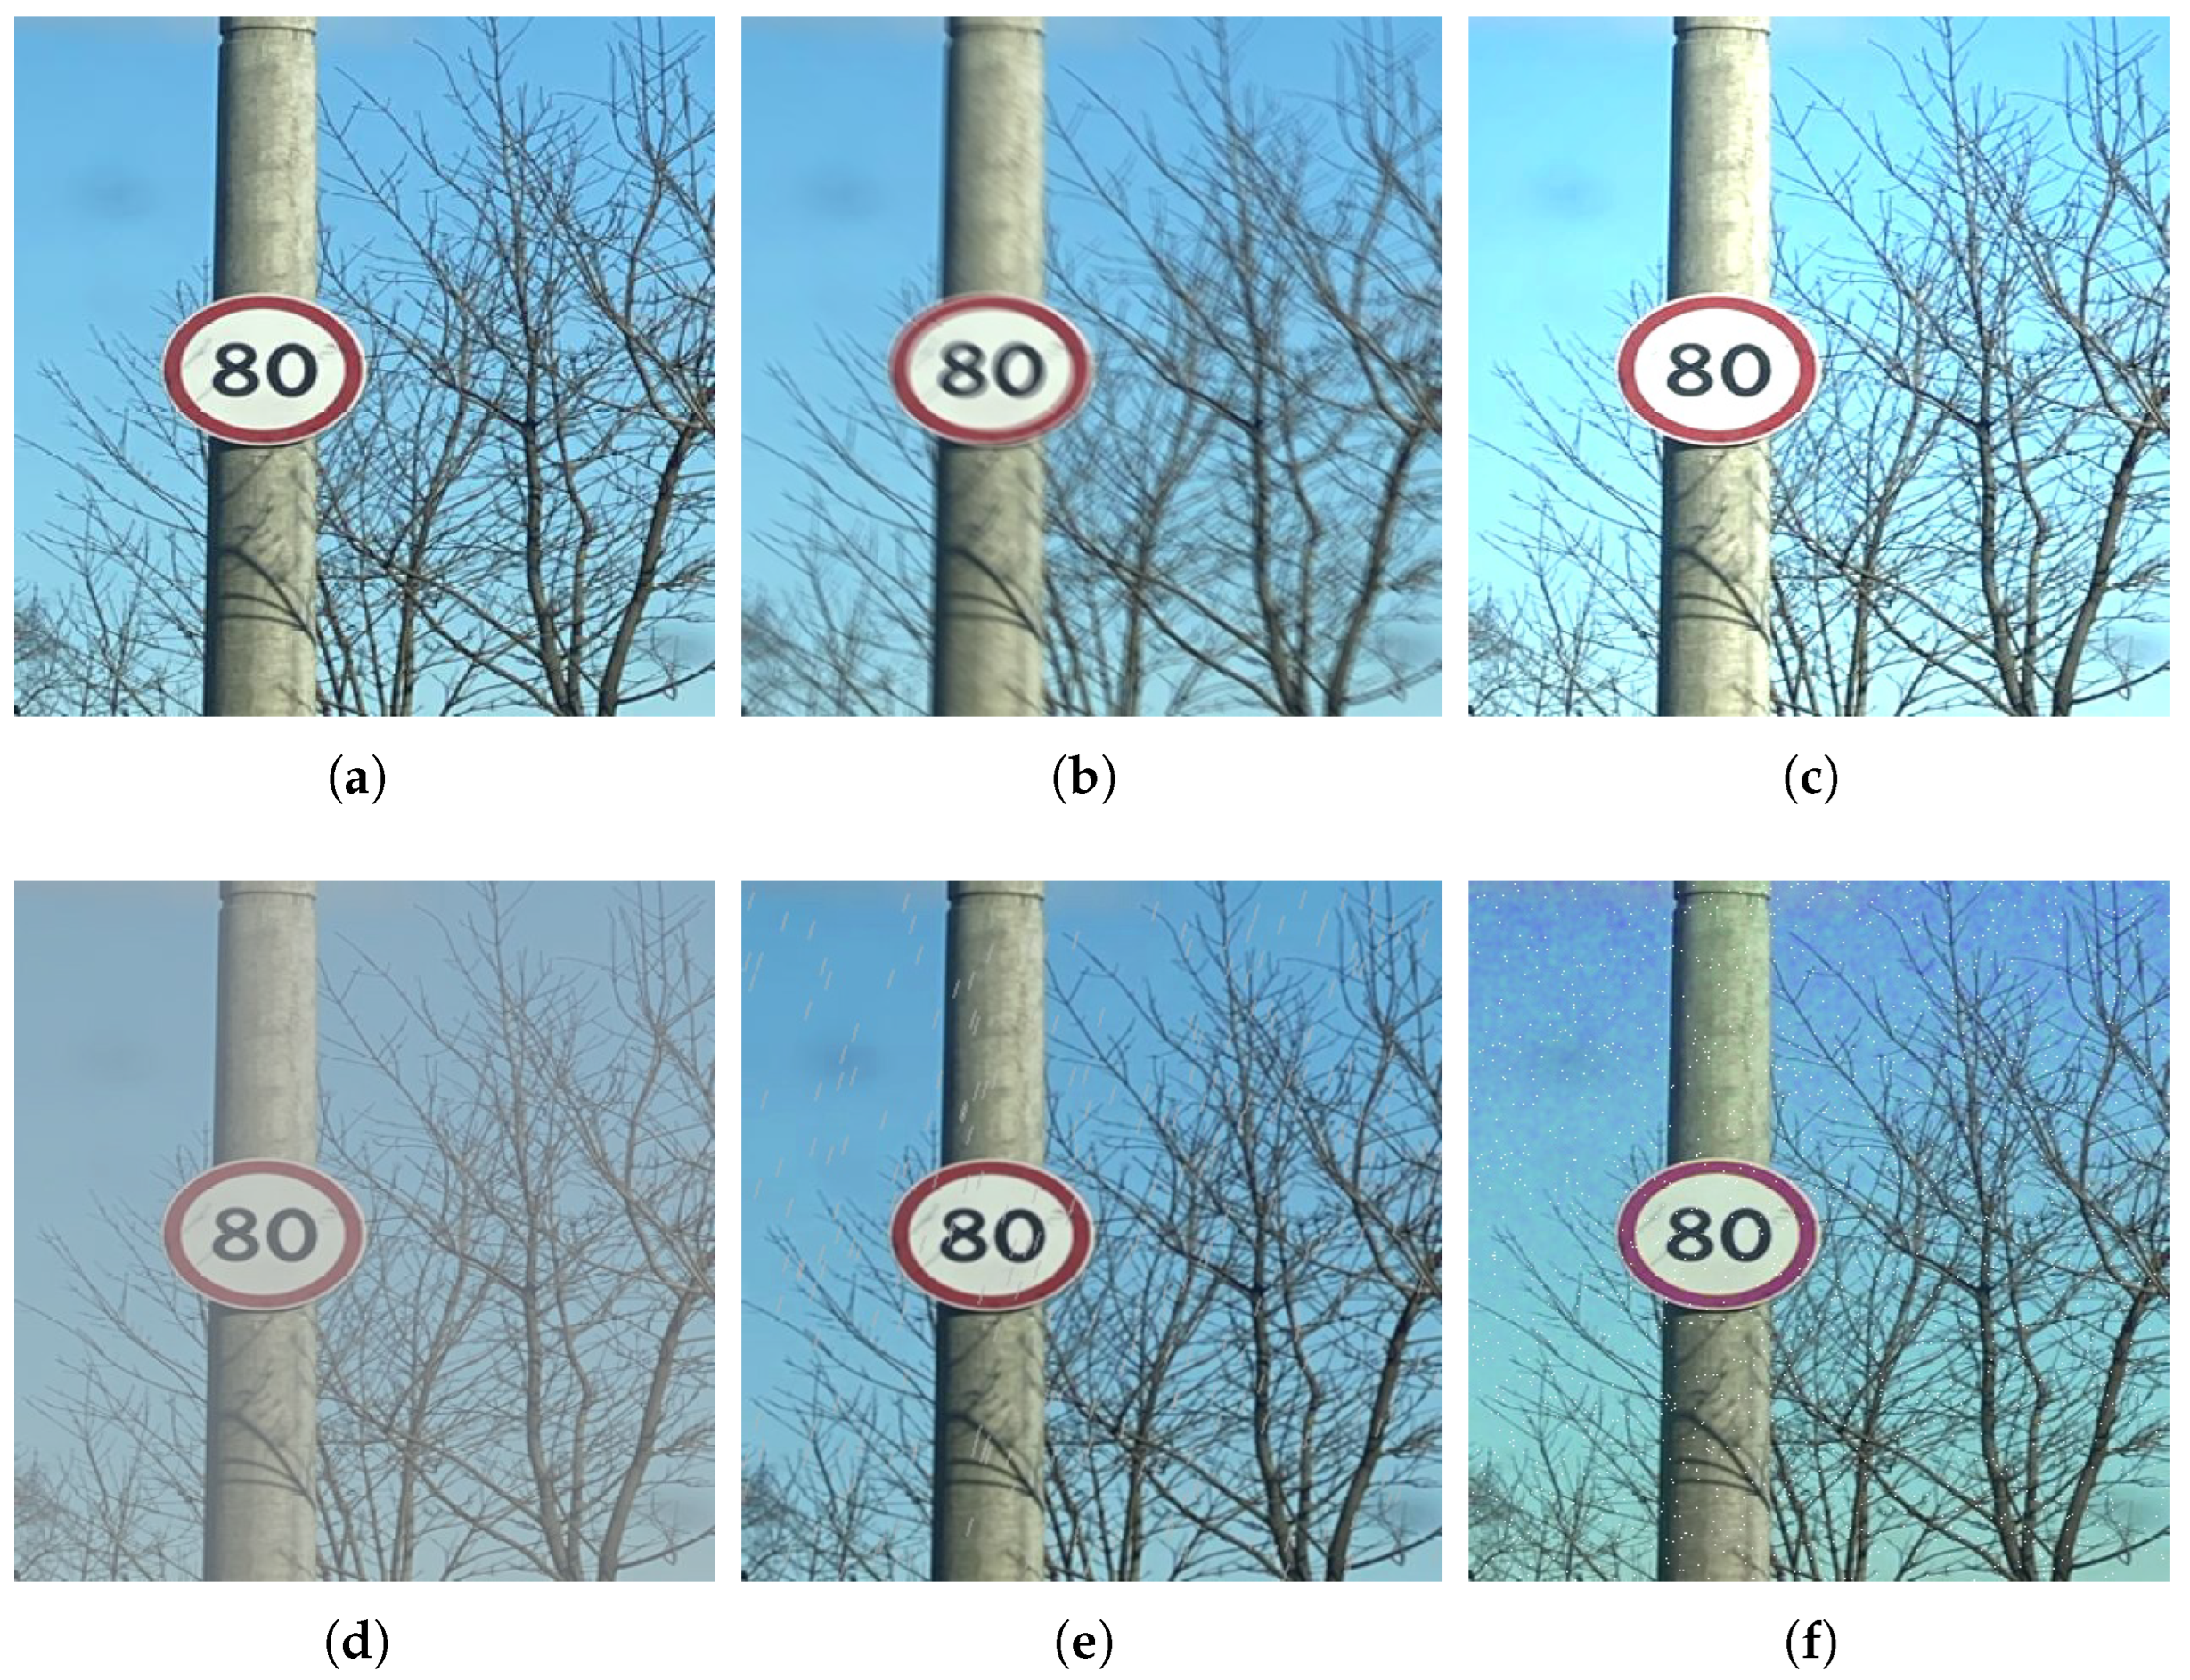
Severe weather conditions such as rain and snow are a key factor contributing to traffic accidents [48]. However, currently available mainstream public datasets lack labeled data covering such extreme conditions, potentially posing safety risks to models in real-world deployments. To bridge this data gap and improve the model’s robustness in various scenarios, we employ a series of data augmentation techniques designed to simulate typical image degradation processes under severe weather conditions. Therefore, we use Motion Blur to simulate vehicle braking or bumping on slippery roads, and employ enhancements such as Illumination, Random Fog, Random Rain, and Random Snow to comprehensively simulate the attenuation of sign visibility caused by complex static environments such as low visibility, dim lighting, water accumulation on vehicle windows, or snow cover. These methods effectively expand the physical diversity of the training data, and their effectiveness has been validated in numerous detection tasks [49].
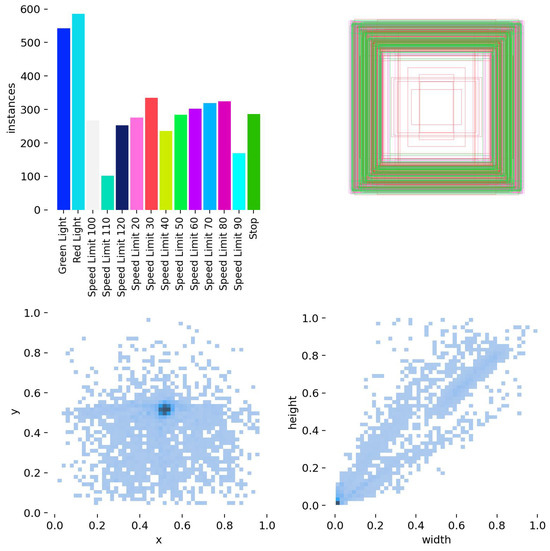
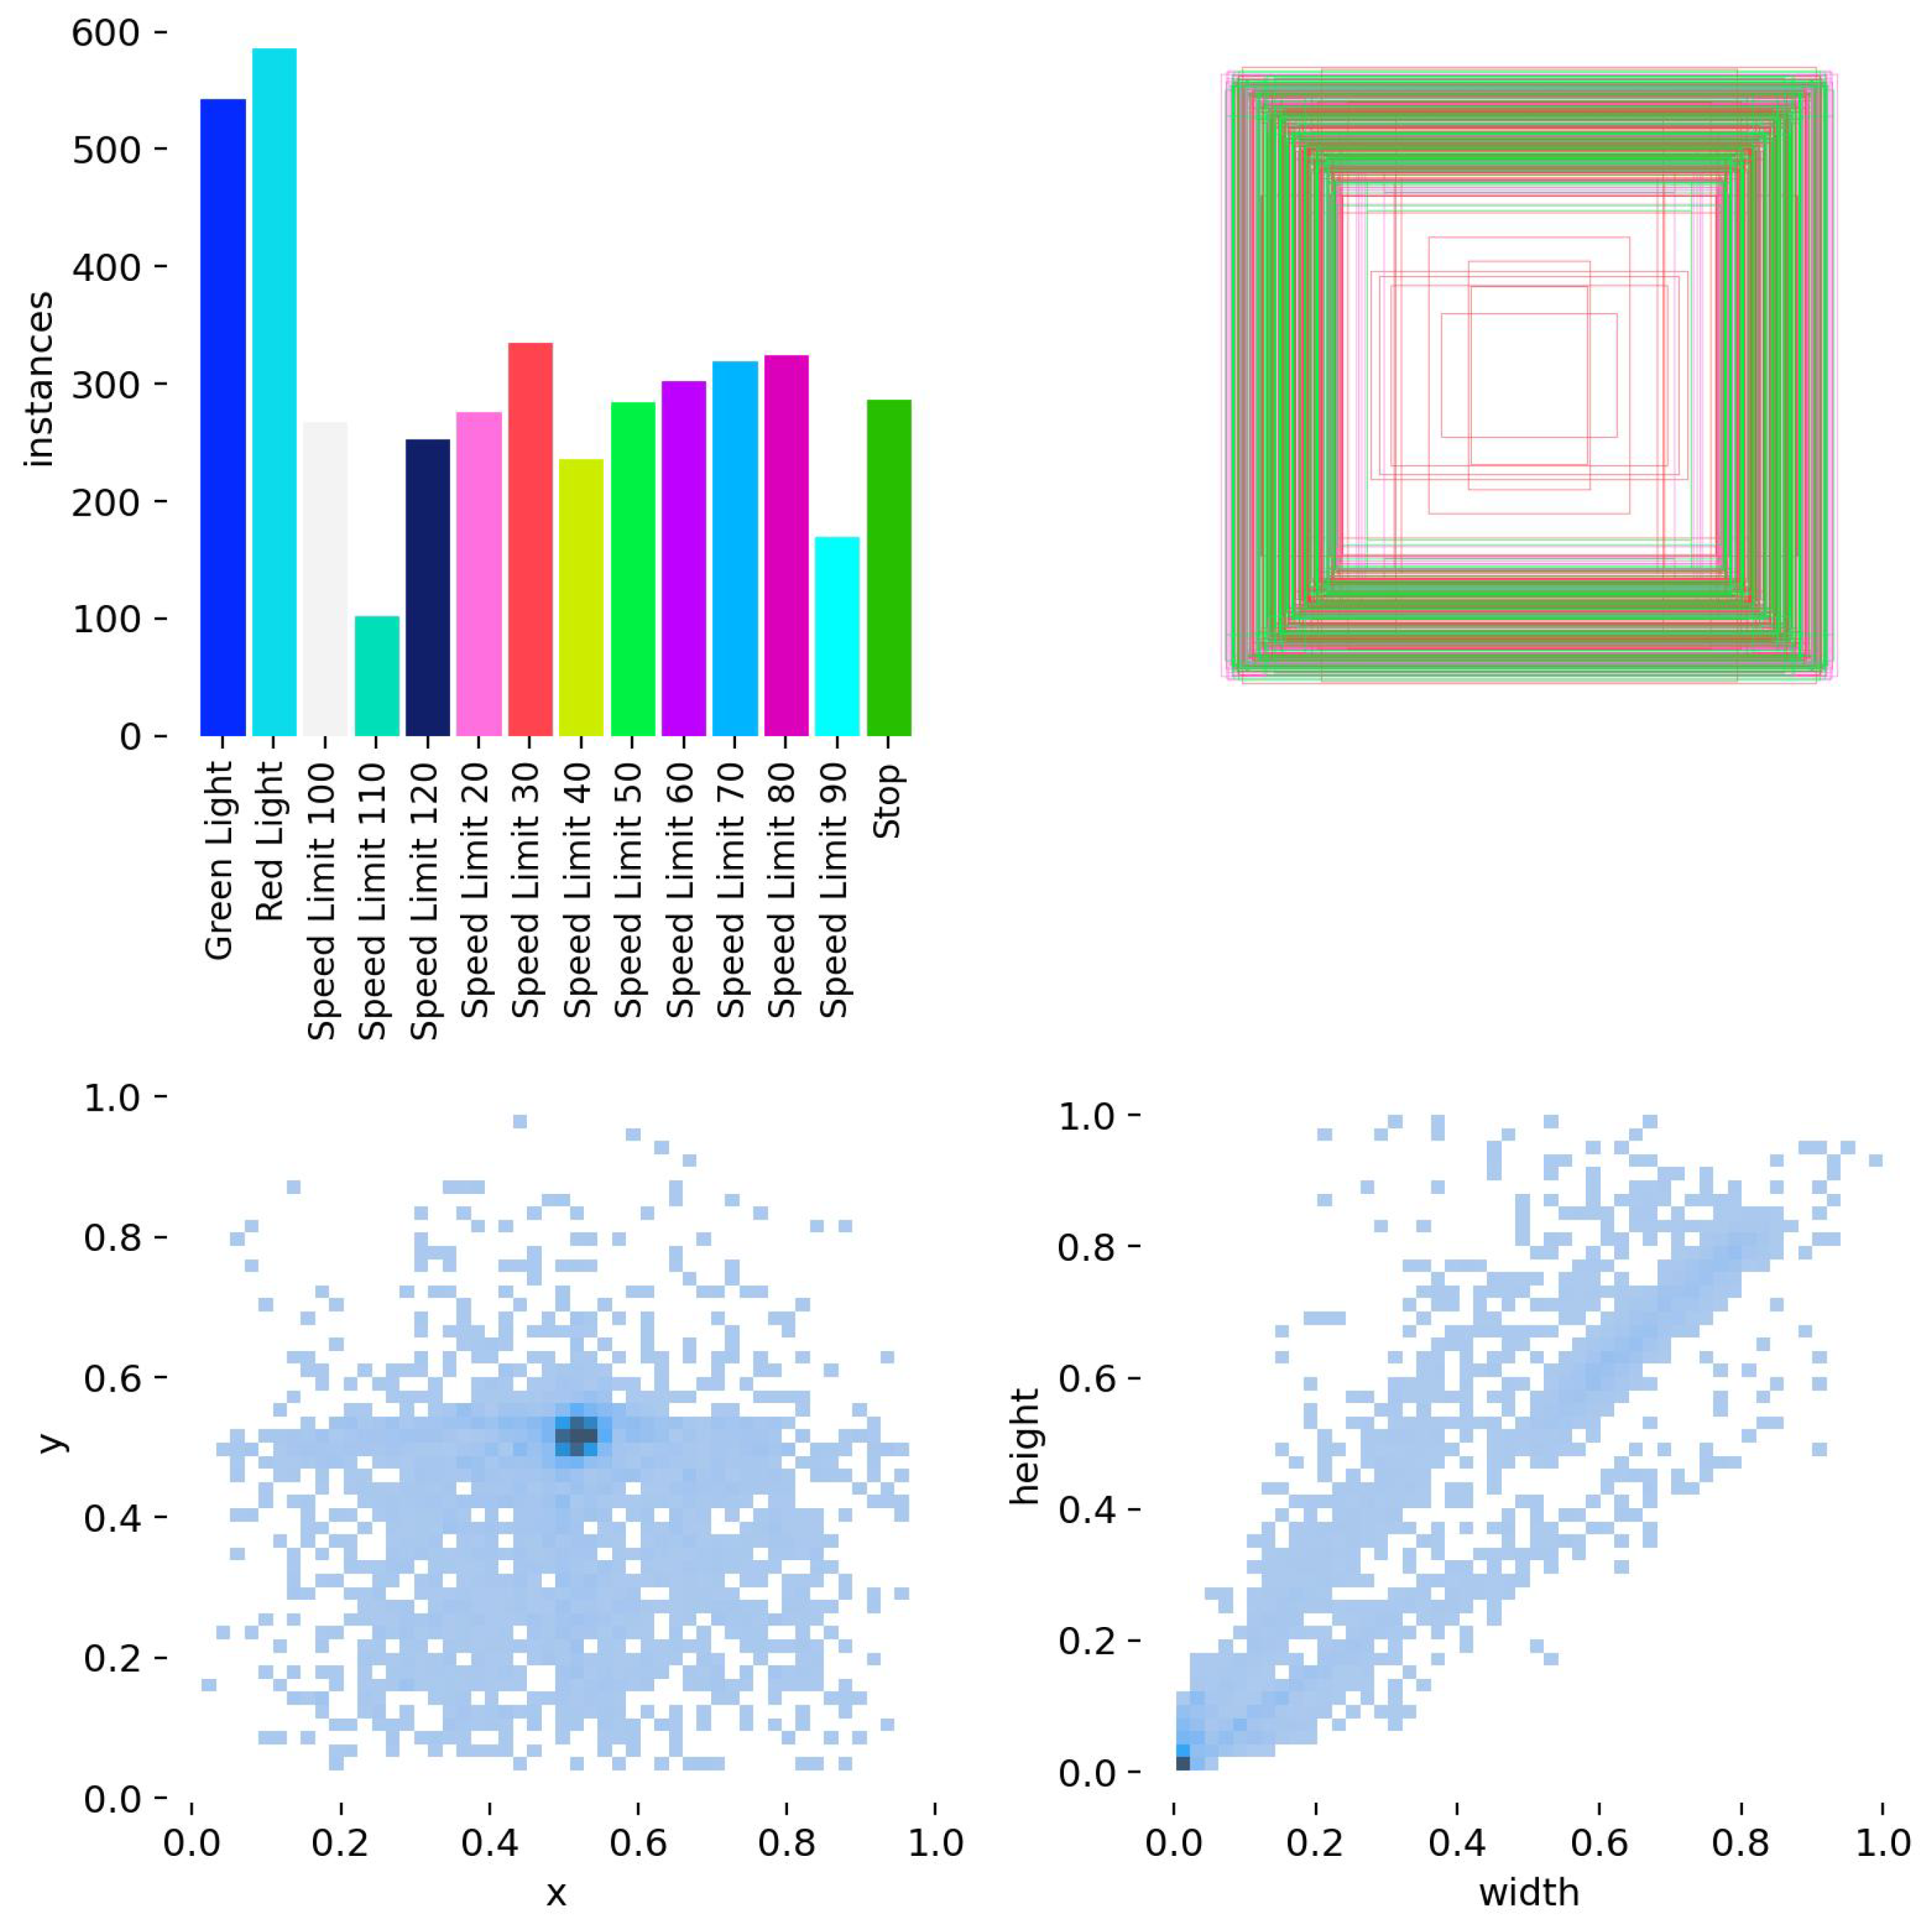
The base dataset, comprising 4956 images across 14 traffic sign categories after the removal of the ‘speed limit 10’ class, was expanded using five augmentation techniques: Motion Blur, Illumination variation, Random Rain, Random Snow, and Random Fog [50]. This process significantly increased data diversity, yielding a final dataset of 24,765 images, partitioned into 17,580 for training, 4005 for validation, and 3180 for testing. The augmented dataset enables the model to learn more invariant features, thereby improving detection accuracy and generalization. Table 1 shows the parameter configurations for offline data augmentation. For detailed dataset statistics, see Table 2. Figure 11 showcases original and augmented samples, while Figure 12 illustrates the category distribution, object boxes, and spatial characteristics.
Table 1.
Offline data augmentation parameter configurations.
Table 2.
Training, Validation, and Test Data Counts for Different Object Classes.
Figure 11.
Sample image after raw image and data enhancement. (a) Original image. (b) MotionBlur. (c) Illumination. (d) RandomFog. (e) RandomRain. (f) RandomSnow.
Figure 12.
SDCCVP dataset labeling information.
4.2.2. Online Data Augmentation
YOLOv8 is an advanced object detection model whose online data augmentation technology can significantly improve the robustness and accuracy of the model. Online data augmentation simulates different visual conditions by randomly applying a series of image transformations during training, so that the model can better generalize to various environments in real applications. Its online data augmentation technologies include: random flipping, color transformation, cropping and padding, rotation and scaling, noise addition, and Mosaic image enhancement. For example, the idea of the Mosaic data augmentation method is to randomly select 4 different images and randomly splice them into a large image, which can increase the diversity and difficulty of the training set and help improve the generalization ability of the object detection model.The online data augmentation parameters are shown in Table 3.
Table 3.
Online augmentation parameters configurations.
4.3. Experimental Configuration
This paper is dedicated to optimizing the YOLOv8n algorithm for traffic sign detection. As a cutting-edge target detection technology, YOLOv8n has significant advantages in ensuring the immediacy and high accuracy of detection. However, the experiment found that the YOLOv8n benchmark model has problems such as overfitting and insufficient performance. Therefore, during the experiment, we solved these problems by adjusting the hyperparameters and structure of the model. This experiment rented a GPU on the AutoDL cloud computing platform for the experiment. The experimental environment in this article is shown in Table 4.
Table 4.
Experimental environment configuration.
Key hyperparameters for the experiment are summarized in Table 5. The input resolution was standardized at . A low initial learning rate of 0.0001 was employed to stabilize early convergence and prevent local optimum entrapment, with training capped at 100 epochs. For accelerated and effective learning, a momentum of 0.937 and weight decay of 0.0005 were utilized. Furthermore, a Dropout rate of 0.15 was implemented for the purpose of regularizing the model and improving its generalization capability.
Table 5.
Hyperparameter settings.
4.4. Experimental Evaluation Index
This study uses precision (P), recall (R), and mean precision () as the main accuracy evaluation metrics [51,52]. Precision measures the proportion of positive instances correctly predicted by the model, while recall reflects the model’s ability to identify all relevant instances. is used to average the precision at different recall levels and for different target categories, comprehensively characterizing the detection performance; a higher value indicates better model accuracy. Furthermore, inference time and the number of parameters are used to evaluate the model’s operational efficiency and complexity, respectively. Here, true positives and false positives are denoted as and , respectively, N is the total number of samples, and Q is the number of traffic sign categories. The mean precision for the i-th category is calculated as follows:
Model complexity is quantified by its parameter count, which is calculated as:
where is the number of output channels, and are the kernel sizes, and is the number of input channels.
Detection speed is measured in frames per second (FPS), a key indicator of real-time processing capability [53], and is defined as the reciprocal of inference latency:
The loss function is a core component of deep learning, used to quantify the difference between model predictions and true values, thereby guiding the model optimization process. In the YOLOv8n object detection framework, model performance is primarily determined by three key loss terms: Localization Loss, which optimizes the spatial coordinate regression of bounding boxes; Classification Loss, which improves class prediction accuracy; and Dual Focal Loss, specifically designed to enhance small object detection capabilities. The overall loss function is composed of the following three parts:
4.5. Experimental Results
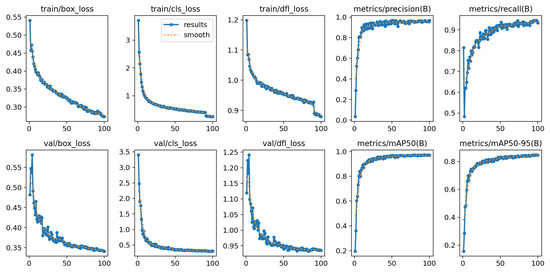
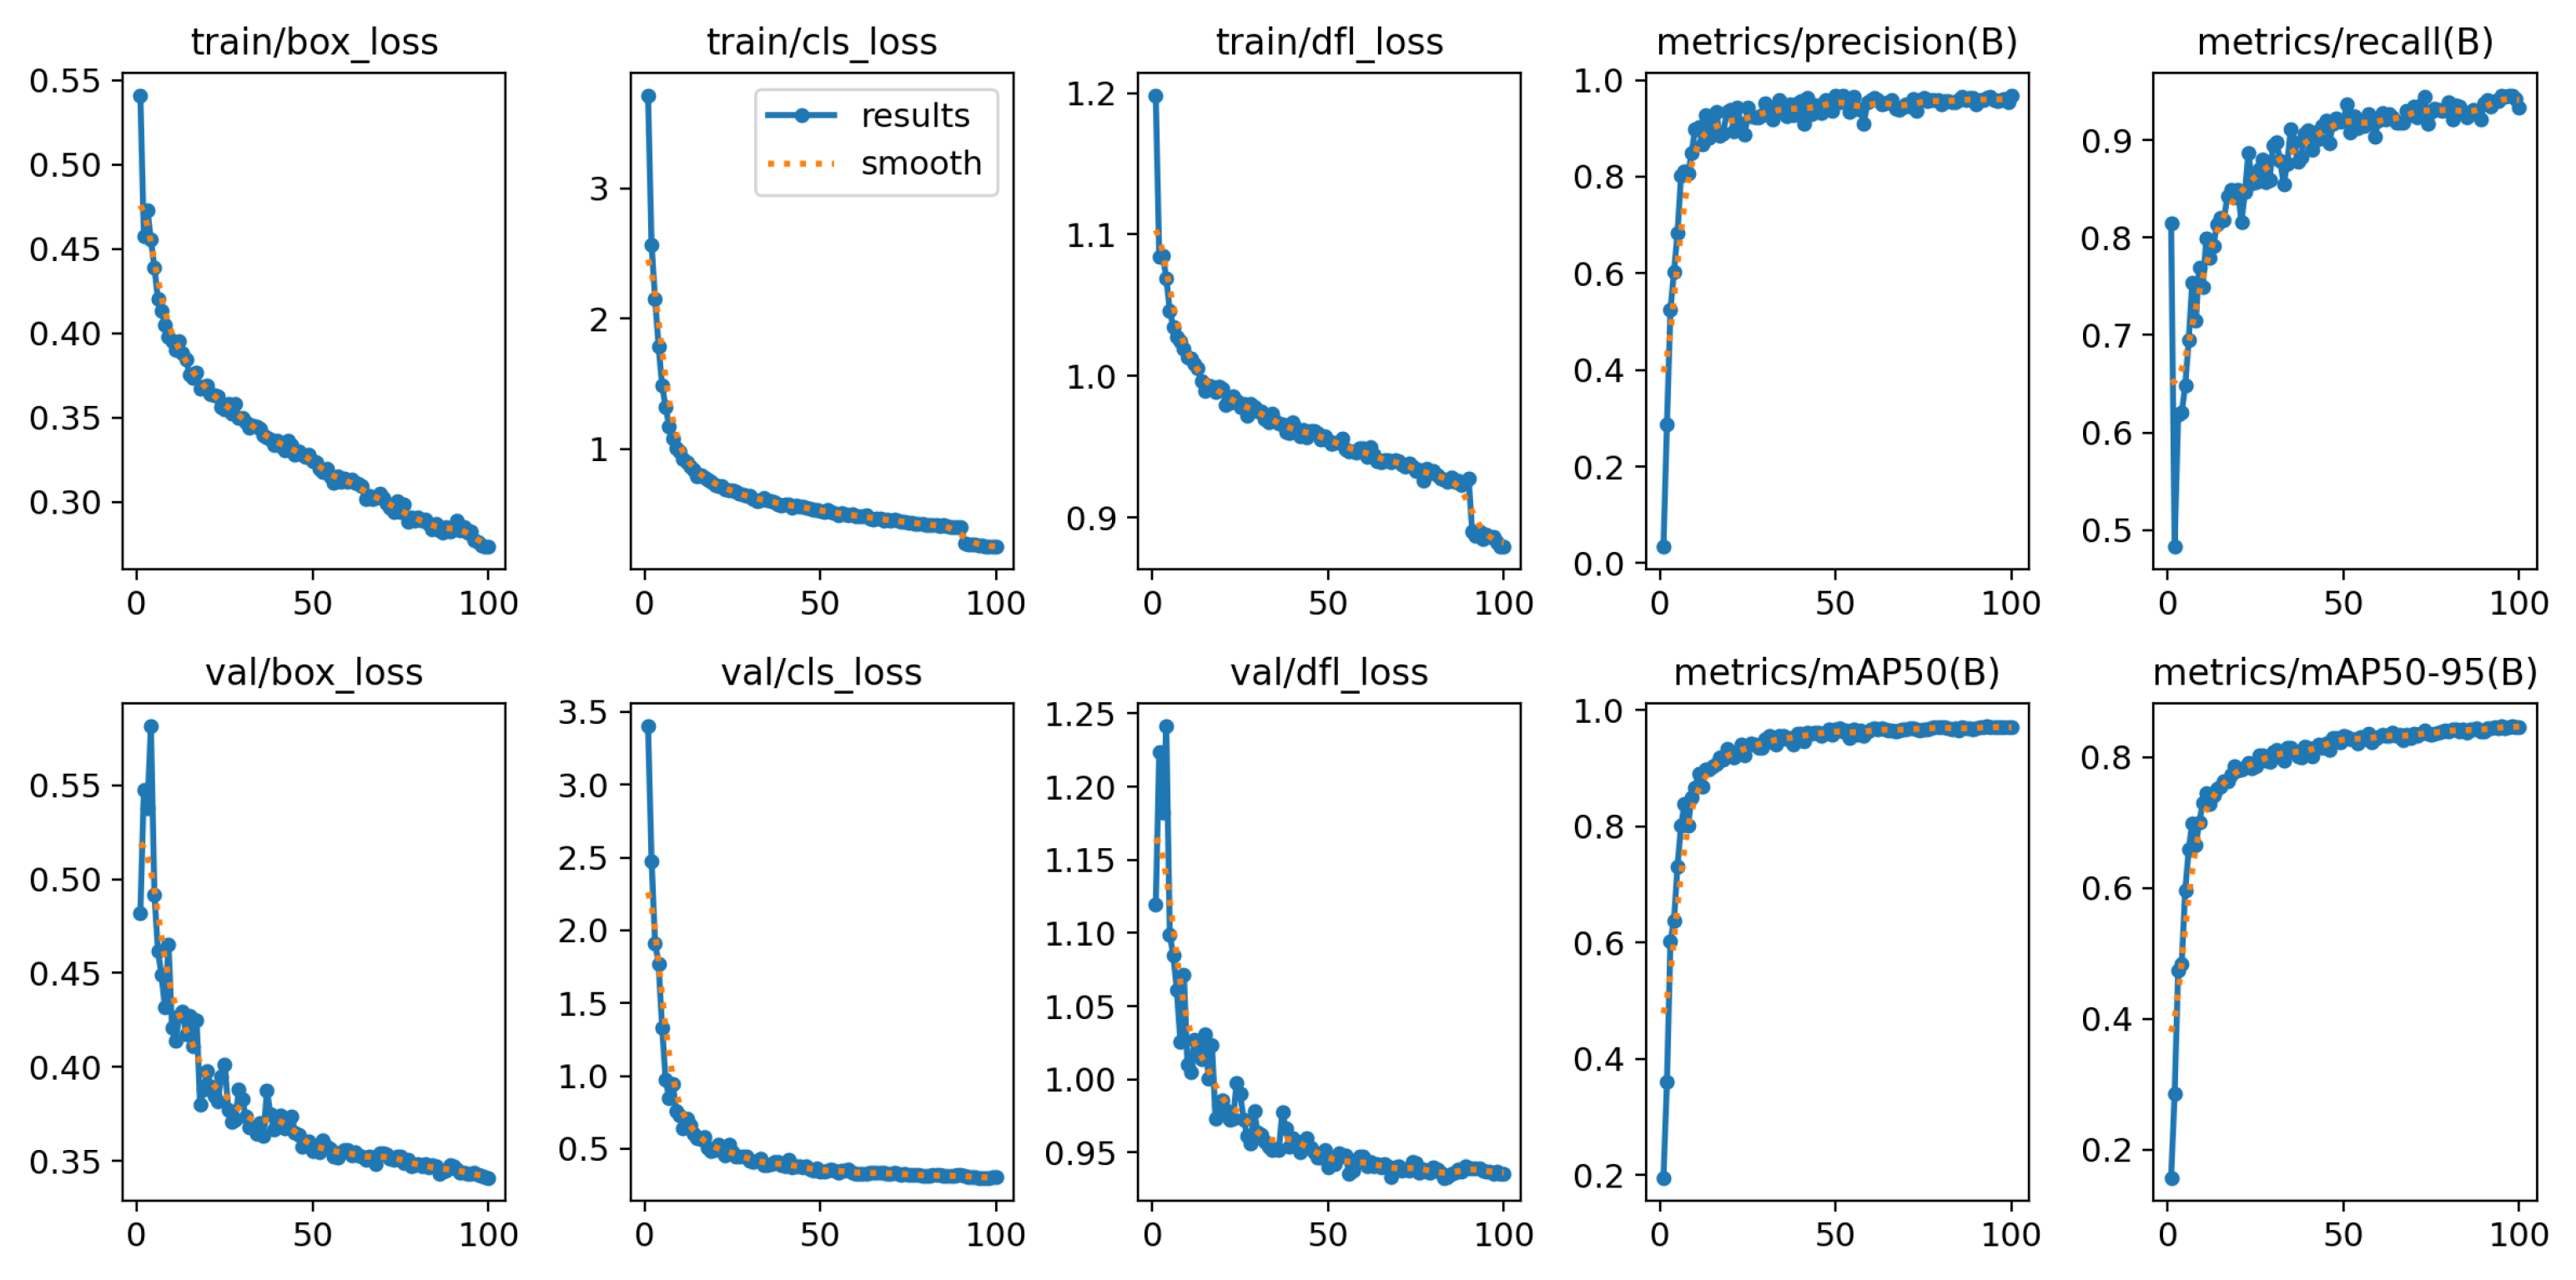
Figure 13 shows the changes in training loss and validation loss of the DAYOLO algorithm over 100 training epochs. The curves in the figure cover the trends of localization loss (box_loss), classification loss (cls_loss), and dual-focusing loss (dfl_loss) with the number of iterations. The analysis shows that the loss convergence exhibits a clear two-stage pattern: the loss value decreases rapidly in the initial stage, and then enters a plateau period after about 20 iterations, with the loss gradually approaching zero.
Figure 13.
Loss function curve of DAYOLO algorithm.
The changes in the loss function show that the algorithm exhibits extremely high accuracy and detailed discrimination capabilities when identifying and classifying traffic sign objects. Looking further, this phenomenon reflects that in the process of adjusting parameters at various stages of model training, DAYOLO effectively improves its recognition accuracy for small traffic signs. This continuous optimization strategy significantly reduces possible errors during target detection. The four images on the right side of the figure show the change curves of evaluation indicators such as precision, recall, mAP50 and mAP50-95 of the DAYOLO algorithm during 100 cycles of training. It can be seen that the accuracy of the model increases rapidly in the early stages of training, and then The slow growth with the increase of training times shows that the improved model has very strong learning ability and is very good at handling tasks such as traffic detection.
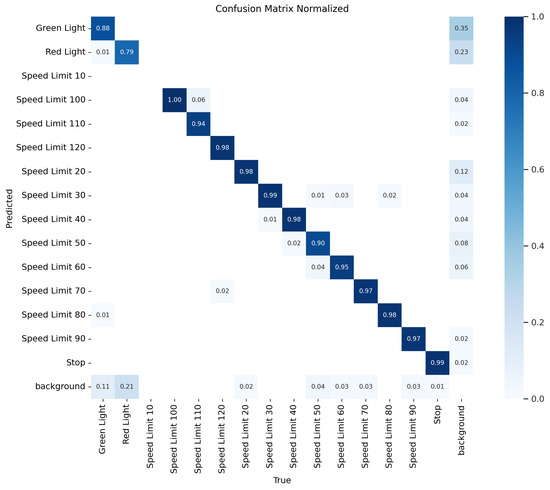
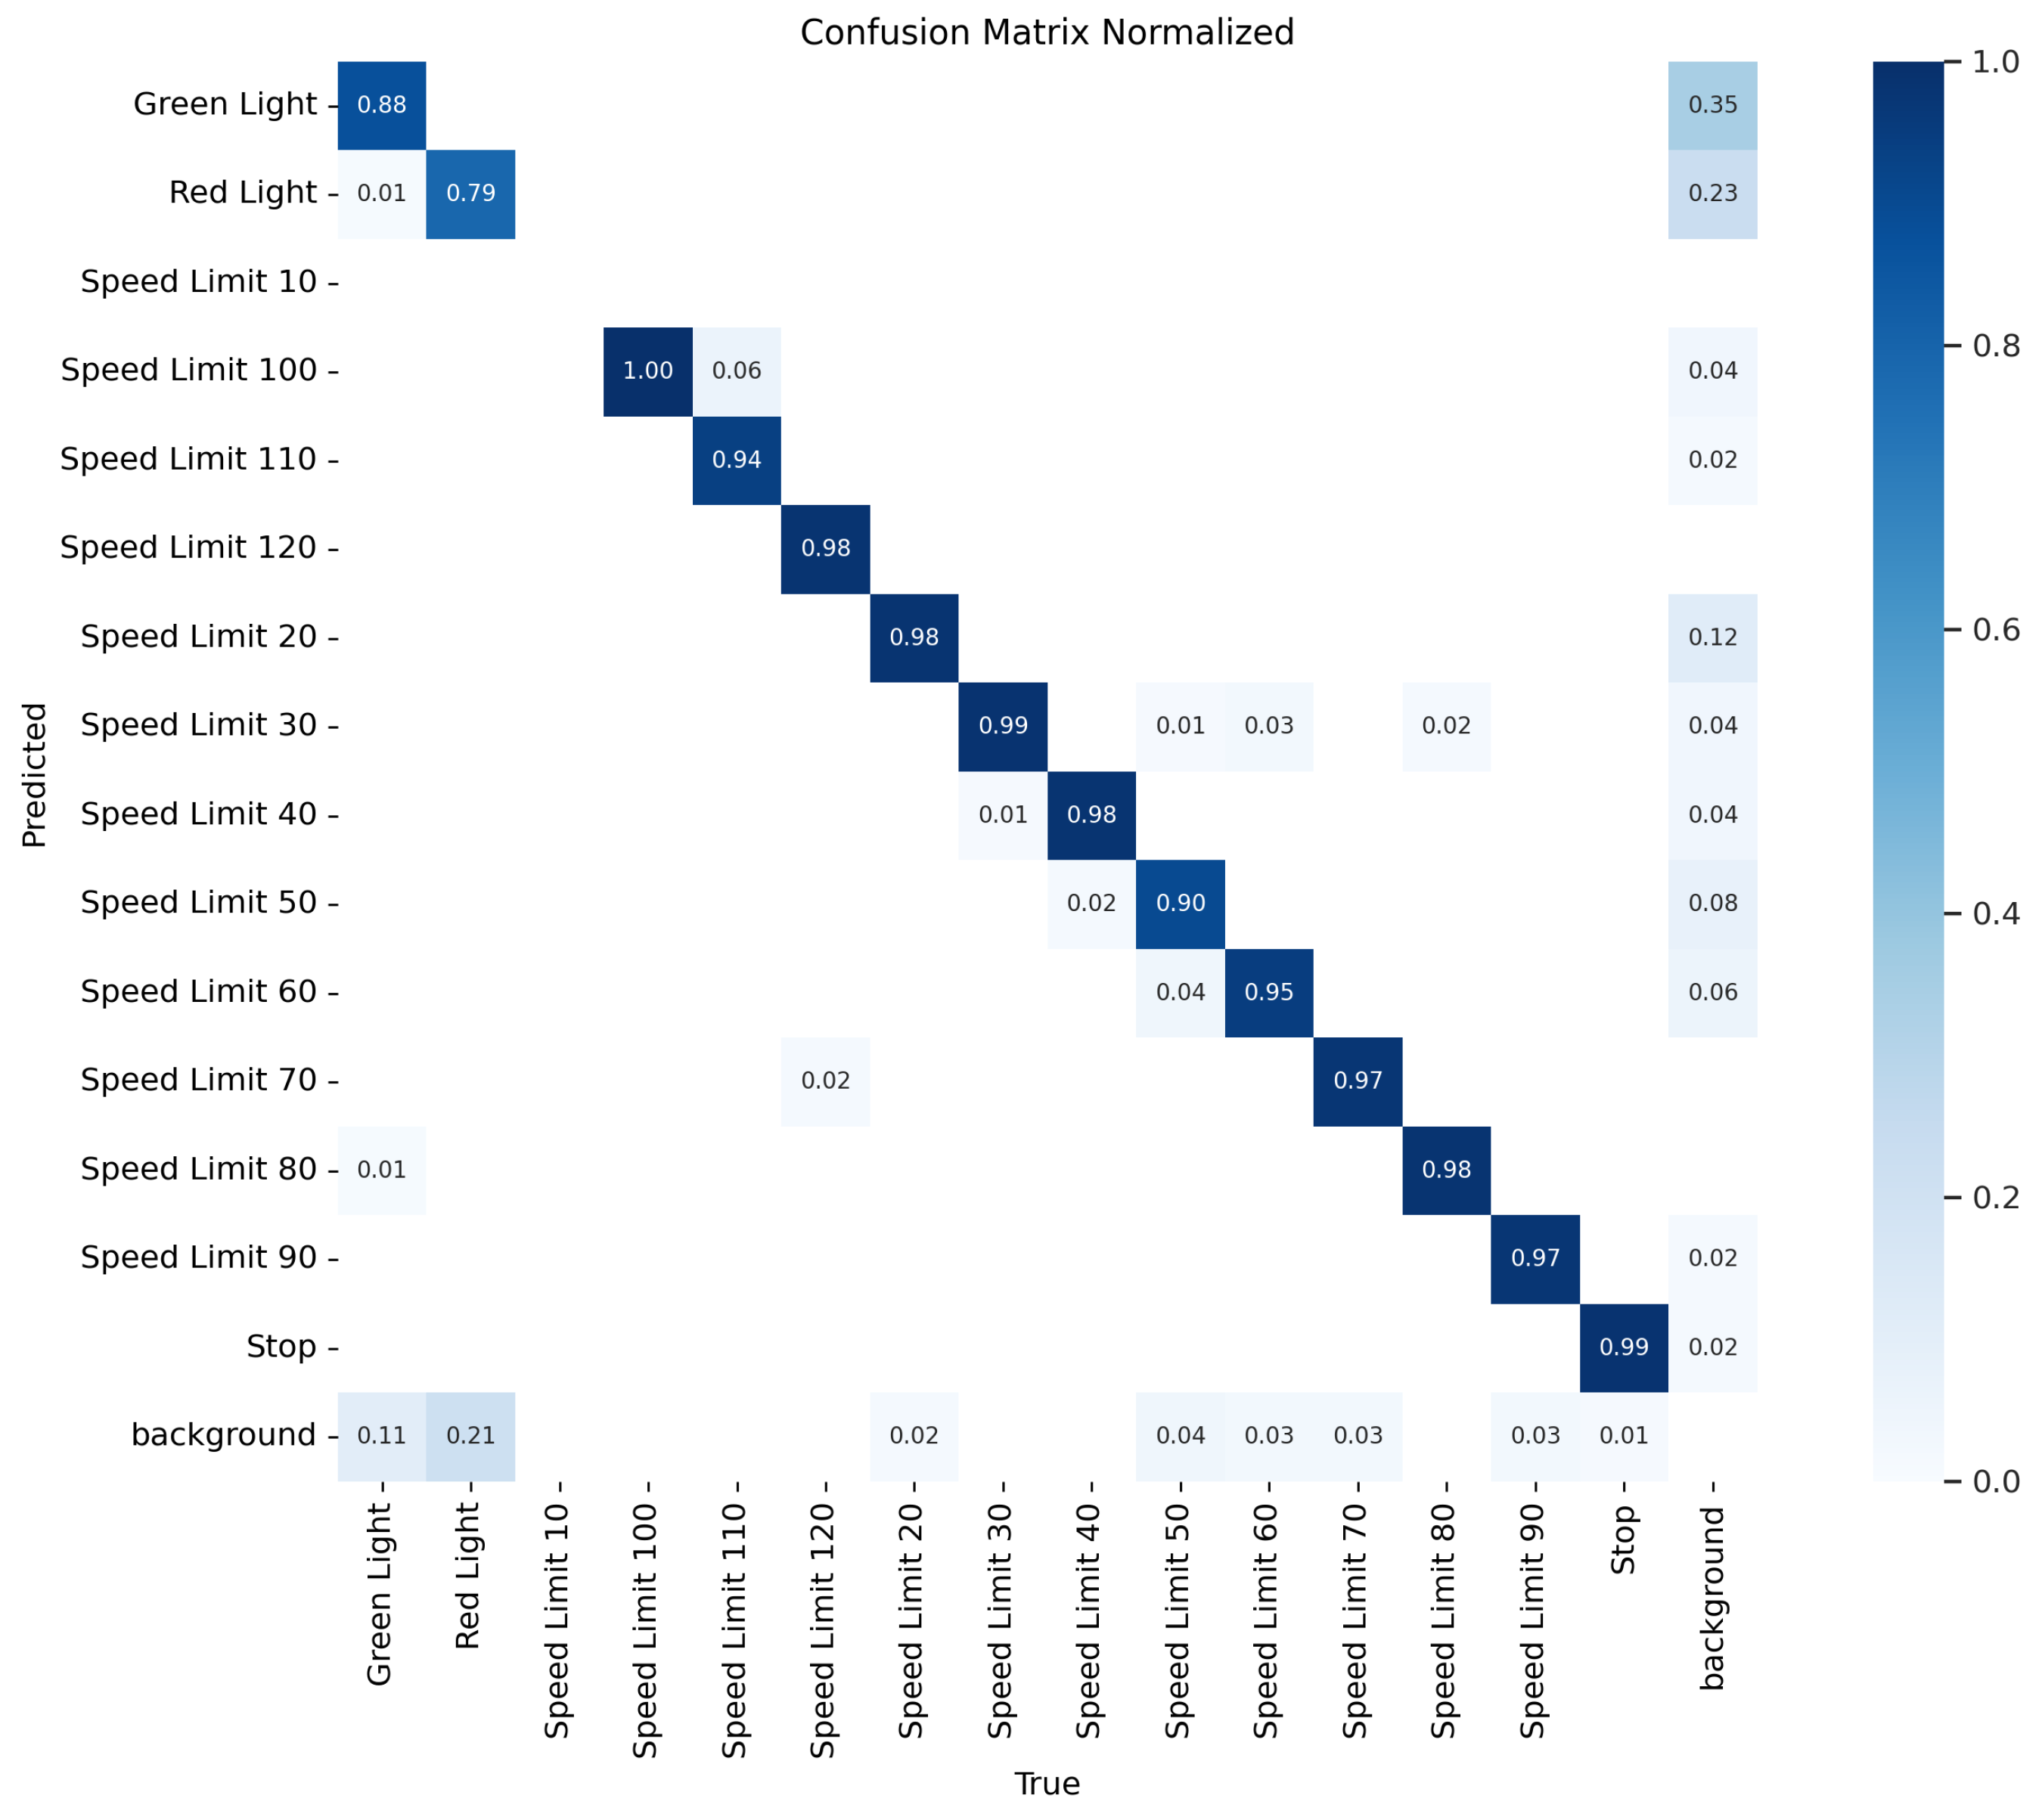
The key mathematical symbols and their definitions are summarized as follows: q denotes the ground-truth label, and IoU quantifies the spatial overlap between predicted and true bounding boxes. The Euclidean distance between box centers is represented by , while c is the diagonal length of their minimum enclosing box. The parameter measures aspect ratio consistency, and serves as a balancing weight for the loss components. In the context of distribution modeling, y signifies a general distribution value, and i acts as an index within a sequence. The interpolation weights are defined as and . The corresponding confusion matrix is provided in Figure 14.
Figure 14.
Confusion metrics.
4.6. Ablation Experiment
In this study, we conducted an ablation experiment on the improved YOLOv8n model to evaluate the contribution of different modules to the performance of traffic sign detection. The ablation results of the experiment are shown in Table 6. By adding C2f-DAttention, DySample, TADDH, Layer2 detection head and NWD modules, we observed the impact of each module on performance indicators such as model accuracy, recall rate and mAP@0.5.
Table 6.
Ablation experiment results.
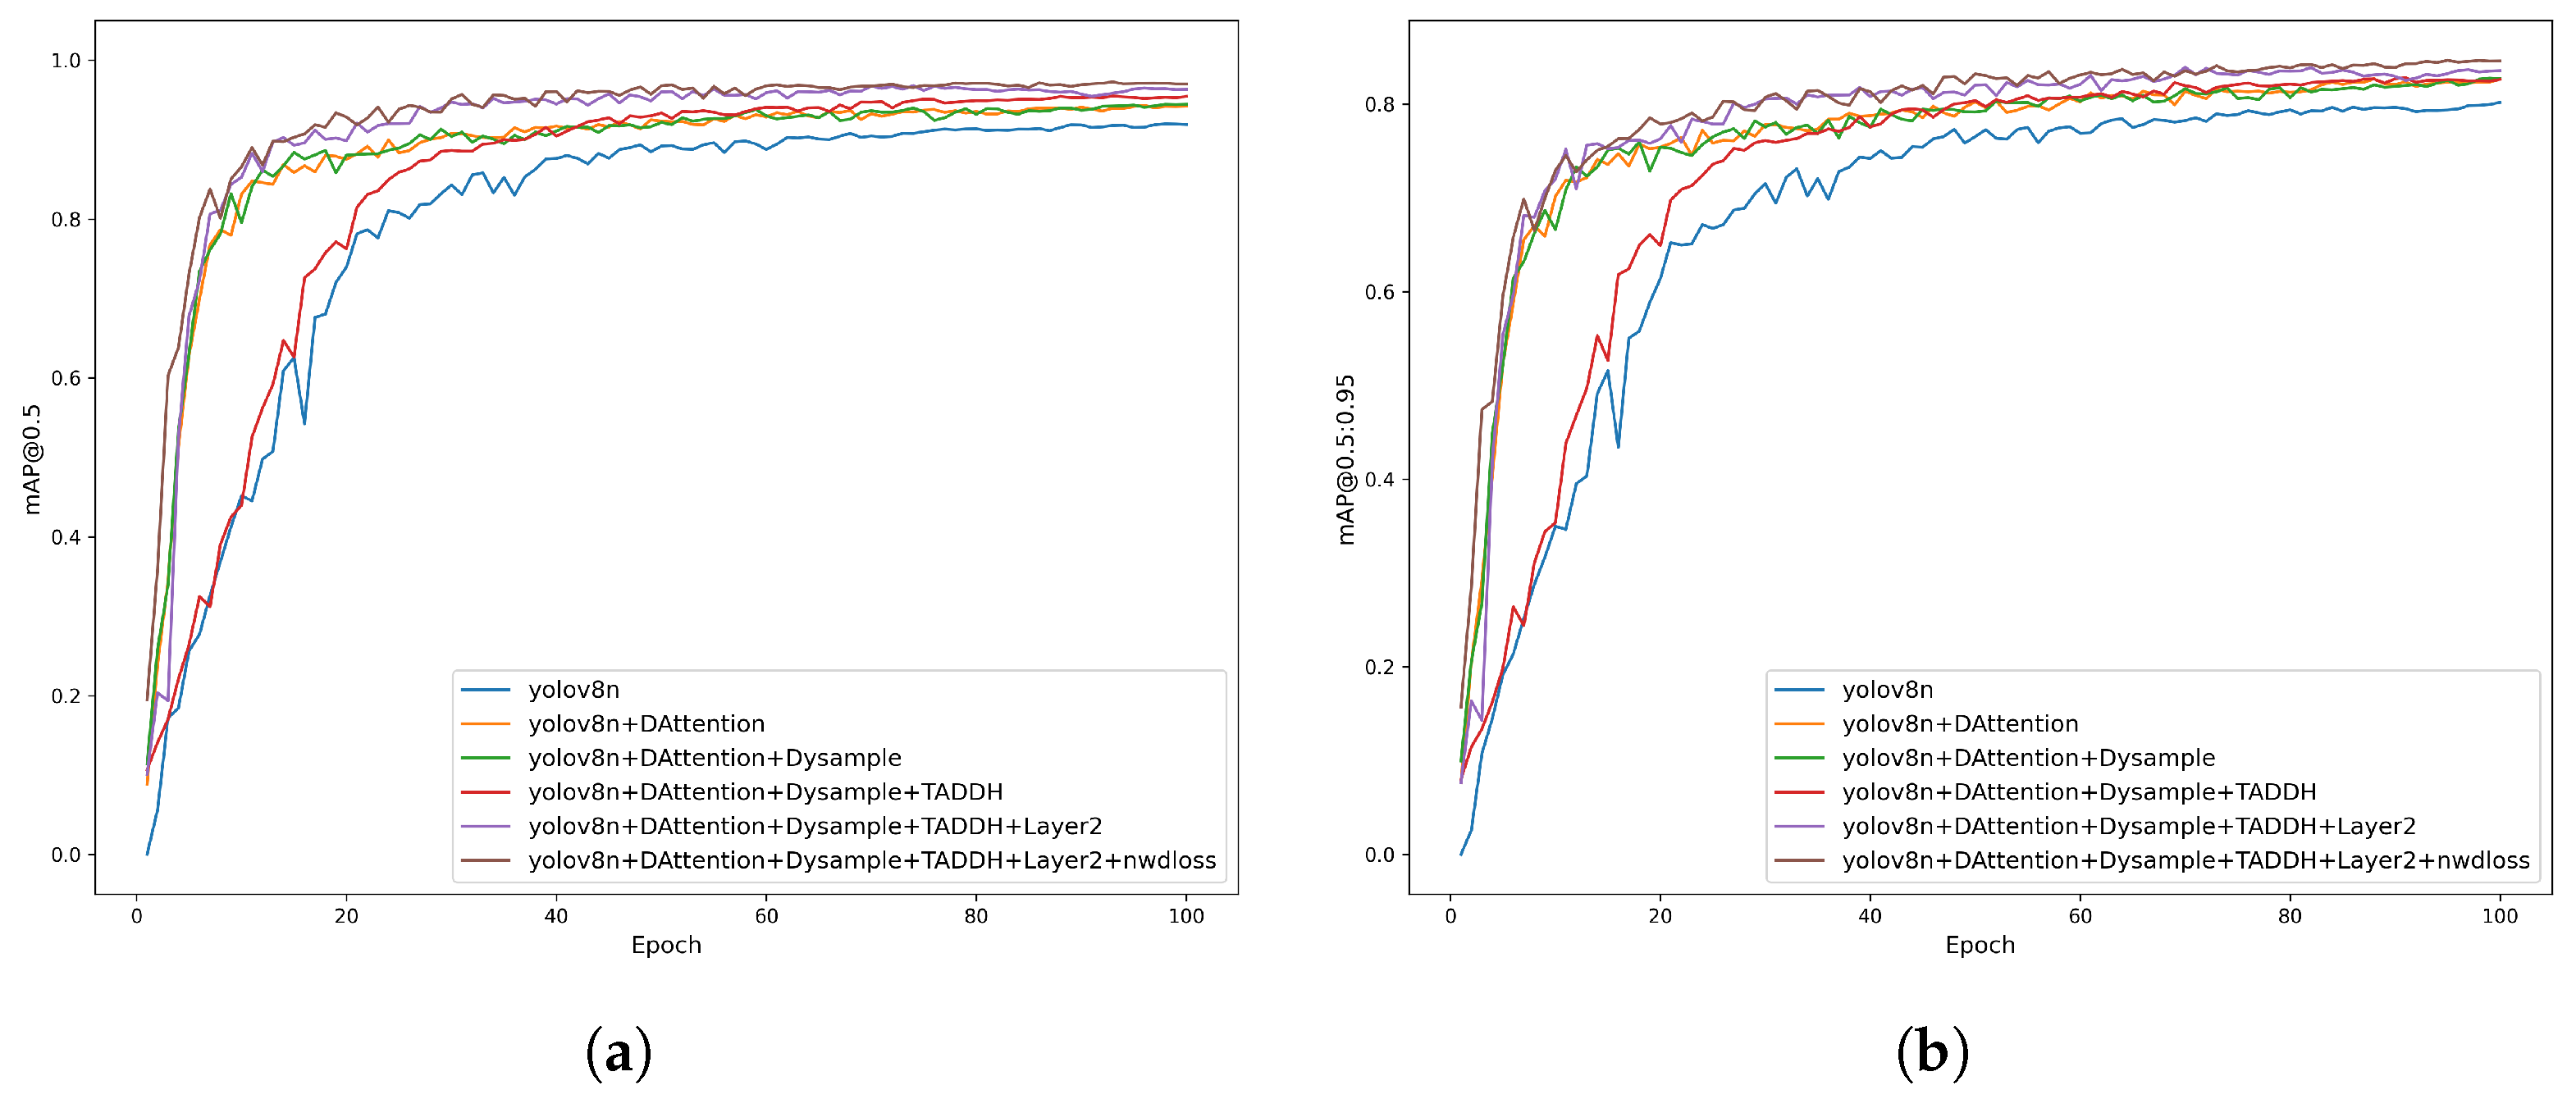
After introducing the C2f-DAttention module, the accuracy of the model decreased by 2.1% compared with the baseline model, but the recall rate increased by 2.4%, and mAP@0.5 and mAP@0.5:0.95 also increased by 0.4% and 0.1% respectively, indicating that the attention mechanism helps the model better focus on the target features. Adding the DySample module, the accuracy increased by 2.9%, the recall rate decreased by 1.7%, but mAP@0.5 and mAP@0.5:0.95 increased by 0.1% and 0.4% respectively, showing that this module reduces the number of parameters and FLOPs while ensuring the detection accuracy of the model. The introduction of the TADDH module caused the precision and recall rate to drop slightly by 0.6% and 0.5% respectively, but mAP@0.5 increased significantly by 1.1%, and mAP@0.5:0.95 remained basically unchanged, indicating that the detection head has fewer parameters and less calculations, while minimizing the loss of precision. By introducing the Layer2 Detection Head, the model has improved its precision by 1.3% and its recall rate by 2.9%. At the same time, the mAP@0.5 and mAP@0.5:0.95 indicators have also increased by 1.0%, which shows that this module has played a significant role in improving the model’s ability to detect small targets. Finally, the addition of the NWD module resulted in the final DAYOLO model, which achieved the best performance in all evaluation indicators. The precision and recall rate were further improved by 0.7% and 2.6% to 96.3% and 94.6%, respectively. The mAP@0.5 and mAP@0.5:0.95 were also further improved by 0.7% and 1.0%, reaching 97.2% and 84.6%, respectively. This verifies the effectiveness of the NWD module in improving the overall performance of the model.
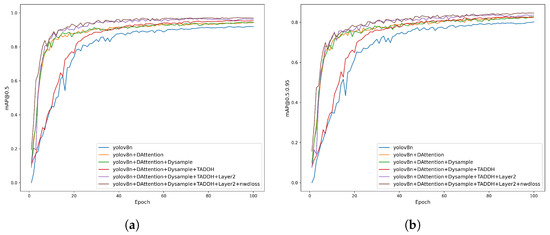
Figure 15 shows the impact of improving different modules on the mAP@0.5 and mAP@0.5:0.95 of the model.
Figure 15.
Performance Curve Comparison Chart. (a) mAP@50 curve. (b) mAP@50:95 curve.
4.7. Comparison of Detection Performance Between Different Models
In order to further confirm the advantages of the DAYOLO model in traffic sign detection, comparative experiments with existing models were conducted on the detection capabilities of complex and changeable environments (such as small targets, long distances, occlusions, etc.). Models participating in the comparison include YOLOv3, YOLOv5, YOLOv6, YOLOv7, YOLOv9 and Faster R-CNN. The experimental results are evaluated through multiple key indicators, including precision (Precision), recall rate (Recall), mAP@0.5, mAP@0.5:0.95, parameter quantity (Parameters), FLOPs and model size, as shown in Table 7.
Table 7.
Model Performance Comparison.
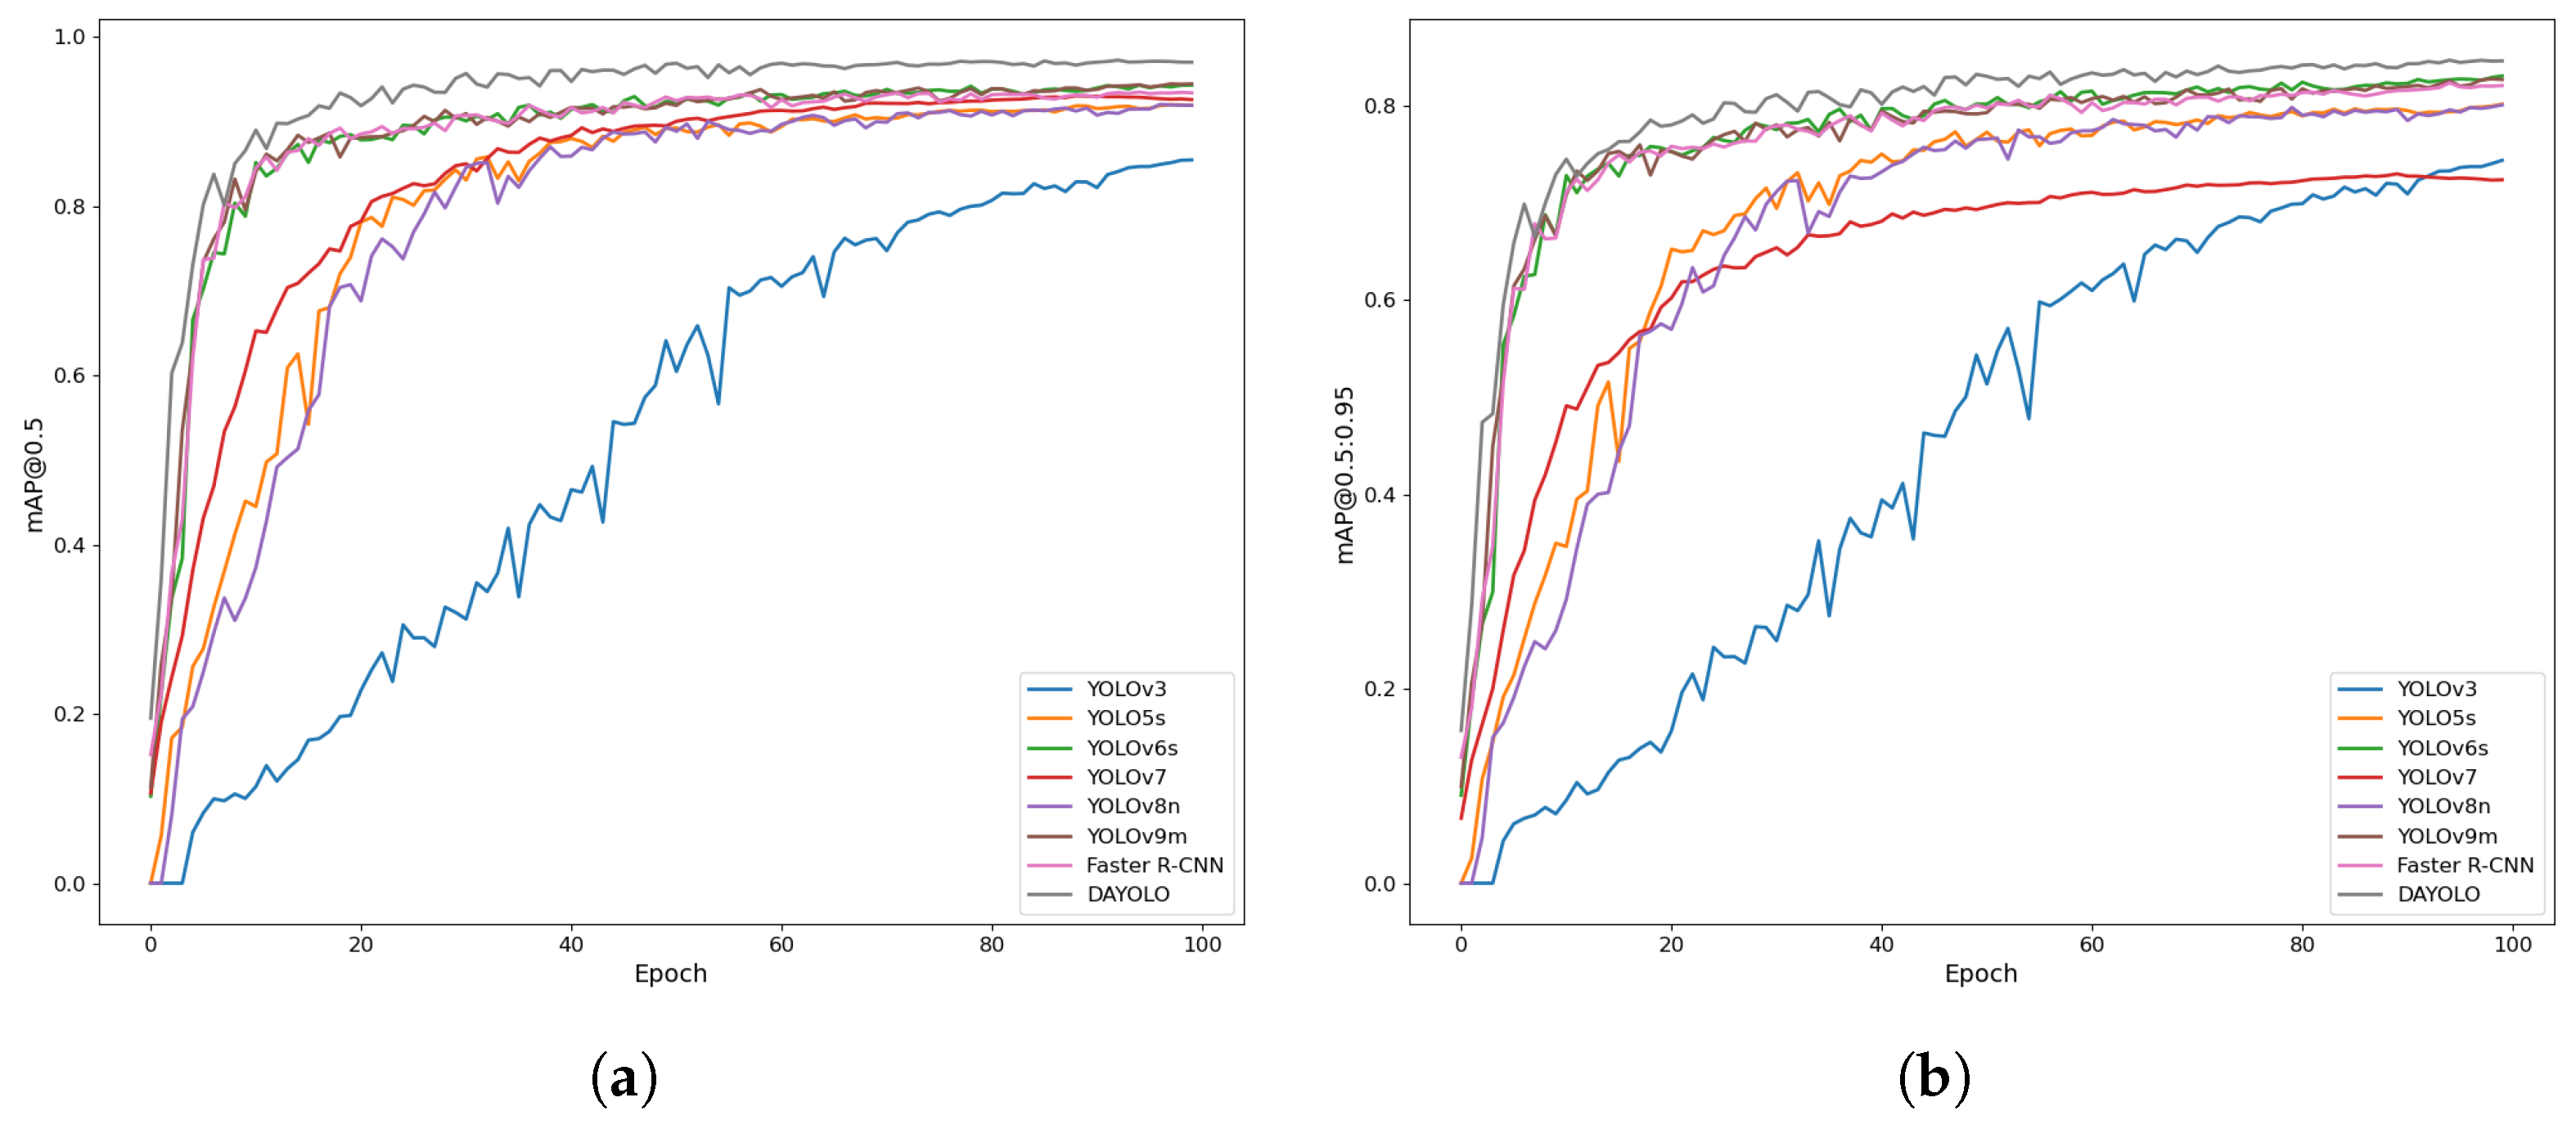
In multiple comparisons, the mAP@0.5 of the DAYOLO model reached 97.2%, which is significantly improved than most existing models. For example, the mAP@0.5 of YOLOv5s is 91.6% and YOLOv6s is 94%, while DAYOLO has significantly improved accuracy compared to these models. Compared with Faster R-CNN, which has better performance, DAYOLO also has a slight advantage. Faster R-CNN’s mAP@0.5 is 91.2%, which is slightly lower than DAYOLO’s 97.2%. At the same time, the DAYOLO model also reached a recall rate of 94.6%, surpassing most YOLO series models and Faster R-CNN, indicating that DAYOLO has higher target capture capabilities in complex scenes.
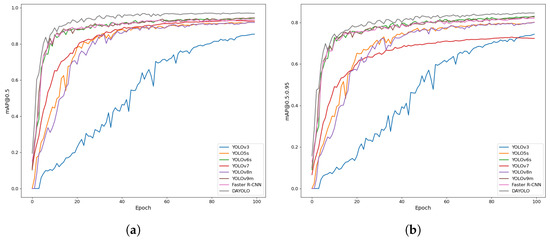
The training result curves of mAP@0.5 and mAP0.5:0.95 of various mainstream algorithms in 100 rounds of training are shown in Figure 16. As can be seen from Figure 16, during the entire training process, DAYOLO outperforms other algorithms in terms of mAP0.5 and mAP0.5:0.95 indicators.
Figure 16.
mAP@0.5 and mAP@0.5:0.95 curves of different algorithms. (a) Comparison of mAP@50 curve over Epochs. (b) Comparison of mAP@50:95 curve over Epochs.
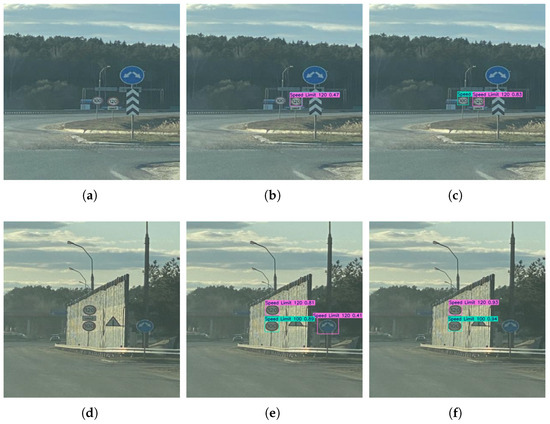
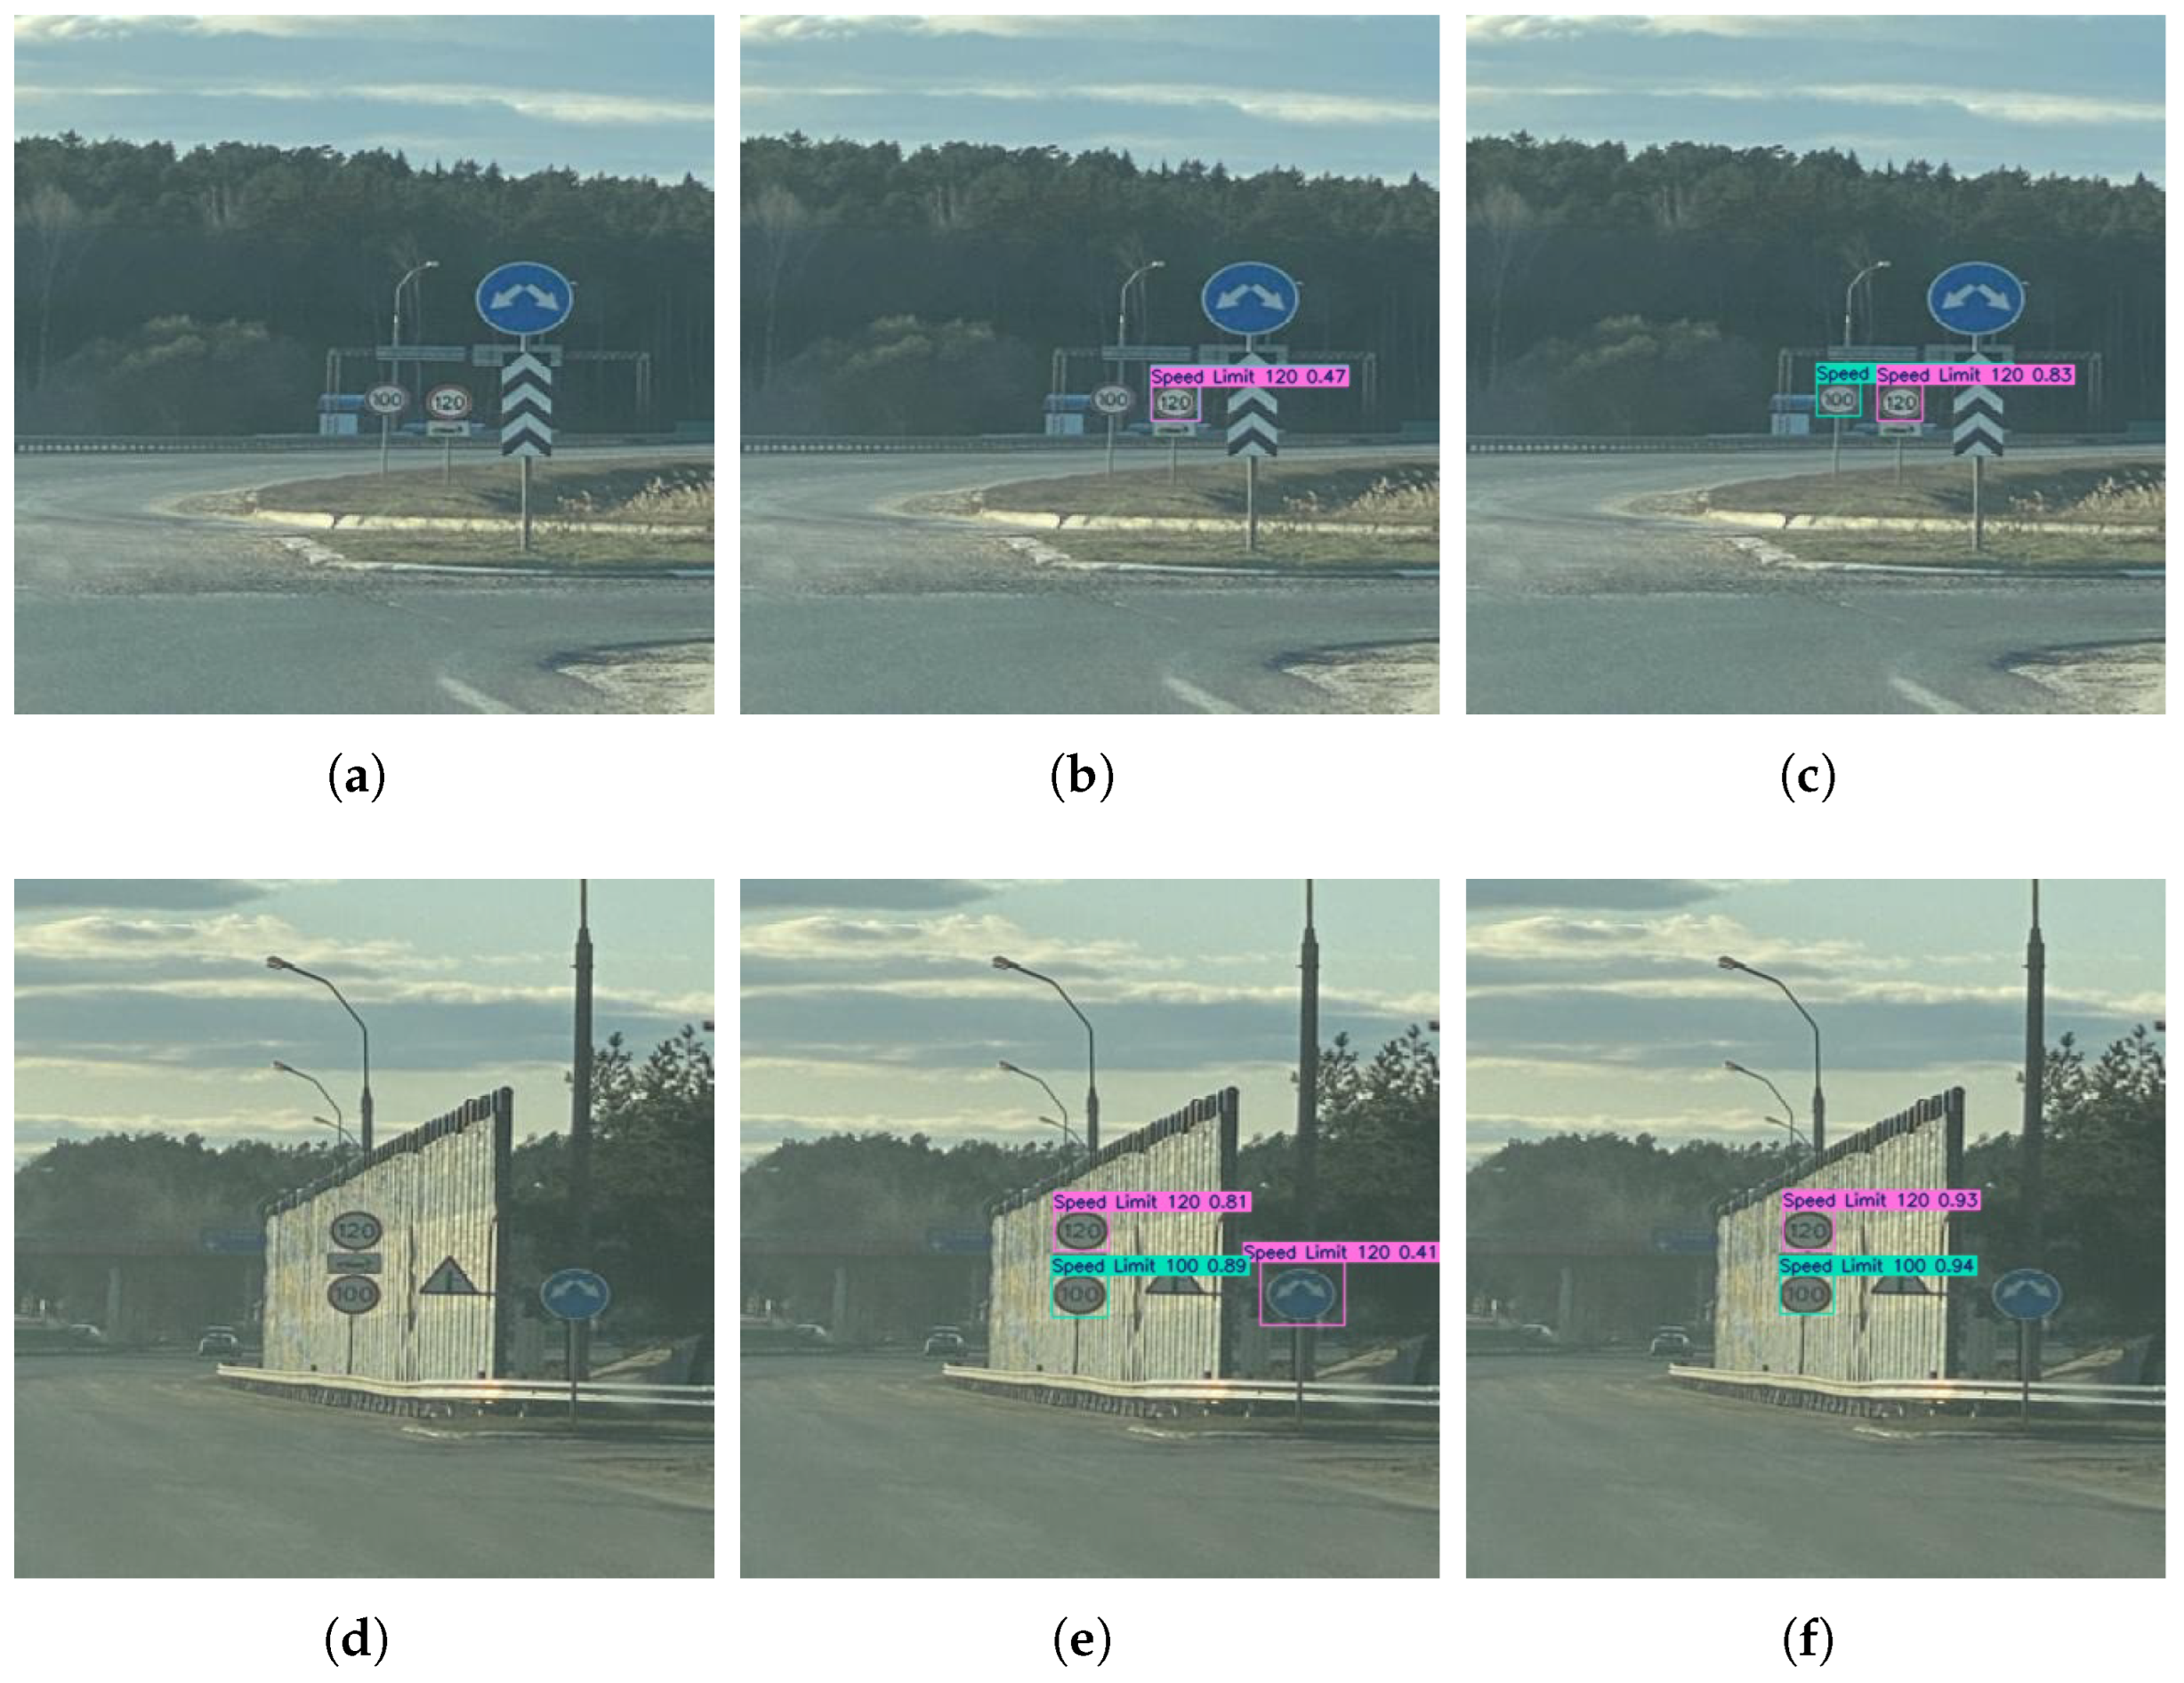
The test set data was tested using the YOLOv8n and DAYOLO models, and the test results are shown in Figure 17.
Figure 17.
Comparison diagram of algorithms in normal environment. (a) Original Image 1. (b) Original Image 1–YOLOv8n. (c) Original Image 1–DAYOLO. (d) Original Image 2. (e) Original Image 2–YOLOv8n. (f) Original Image 2–DAYOLO.
First, in image 1, DAYOLO can accurately identify the two traffic signs of speed limit 100 and speed limit 120, while the YOLOv8n model fails to detect speed limit 100. Secondly, in image 2, the DAYOLO model also accurately detects the speed limit 100 and speed limit 120 traffic signs, but the YOLOv8n model incorrectly detects other traffic signs. In summary, through comparative experiments under different environments, it can be seen that the DAYOLO algorithm has excellent detection accuracy and reliability in normal environments, which is better than the standard YOLOv8n algorithm. The optimization of the algorithm in this paper achieves higher accuracy in traffic sign detection tasks, especially under complex and occluded conditions, providing a more effective solution for traffic sign detection.
4.8. Generalization Experiment
In order to further verify the generalization ability of the proposed DAYOLO algorithm, this study conducted experiments on the TT100K data set. Table 8 presents experimental results comparing the performance of DAYOLO with YOLOv8n and other widely used object detection models. Compared with YOLOv8n, DAYOLO’s precision increased by 3.8%, recall rate increased by 5.6%, mAP@0.5 increased by 5.1%, and mAP@0.5:0.95 index also increased by 3.6%. These results demonstrate that DAYOLO significantly improves detection accuracy and recall over YOLOv8n while maintaining computational efficiency, making it an efficient solution for traffic sign detection.
Table 8.
Experimental results on the TT100K dataset.
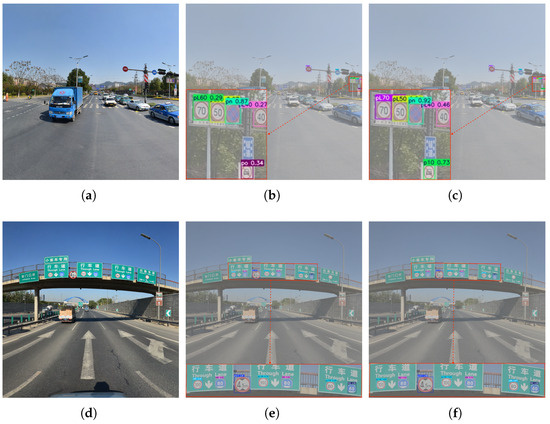
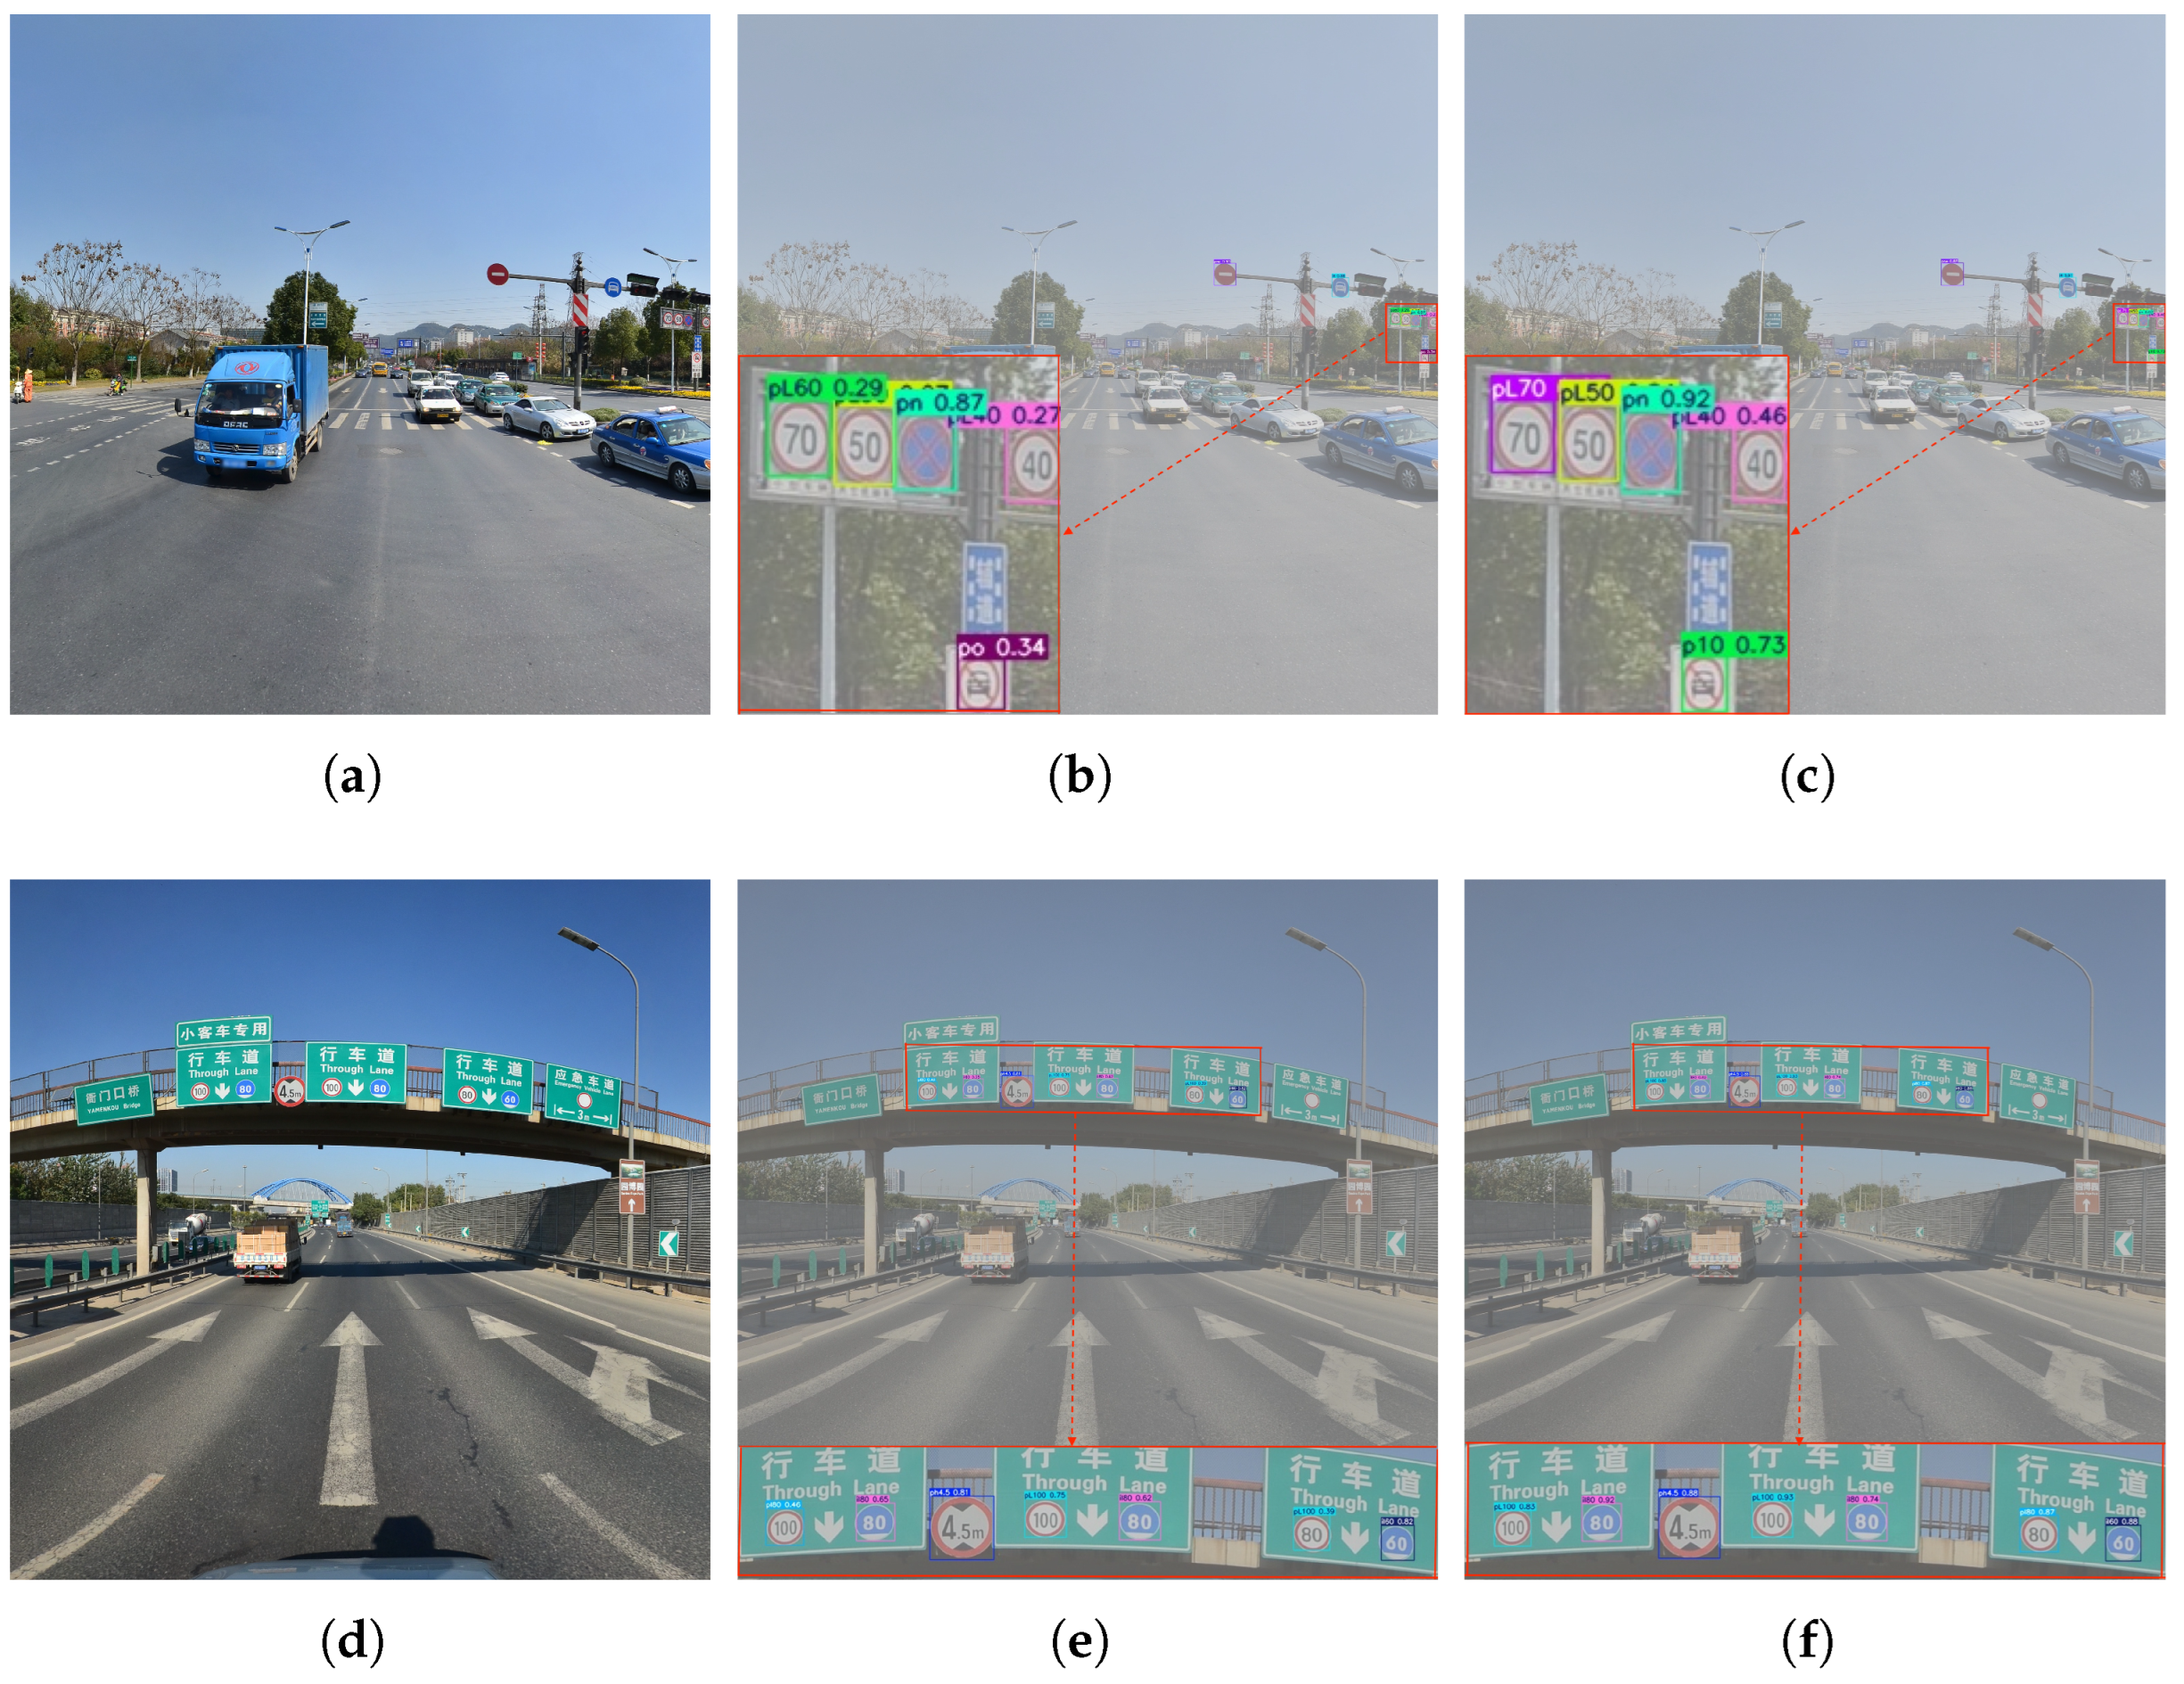
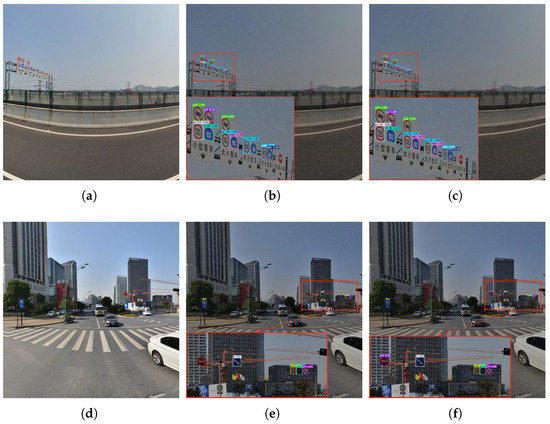
In order to verify the model’s ability to detect traffic signs in complex environments, this paper selects the TT100K dataset, adds fog, rain, and snow effects to the images for testing, and compares the YOLOv8n algorithm with the algorithm in this paper.
The algorithm comparison results in the random fog environment are shown in Figure 18. Compared with the test results in the random fog environment, it can be seen that the detection accuracy of the DAYOLO algorithm is better than that of the YOLOv8n algorithm. In the foggy environment, the YOLOv8n algorithm has poor detection ability for small blurred targets. In Figure 18b, it failed to detect the no-motor-vehicle-entry sign, and in Figure 18e, it mistakenly identified the speed limit of 100 as the speed limit of 80, and the speed limit of 80 as the speed limit of 100. The DAYOLO algorithm perfectly detected smaller blurred traffic signs in the complex foggy environment without omissions or detection errors.
Figure 18.
Comparison of algorithms under random fog environment. (a) Original Image 3. (b) Random Fog–YOLOv8n. (c) Random Fog–DAYOLO. (d) Original Image 4. (e) Random Fog–YOLOv8n. (f) Random Fog–DAYOLO.
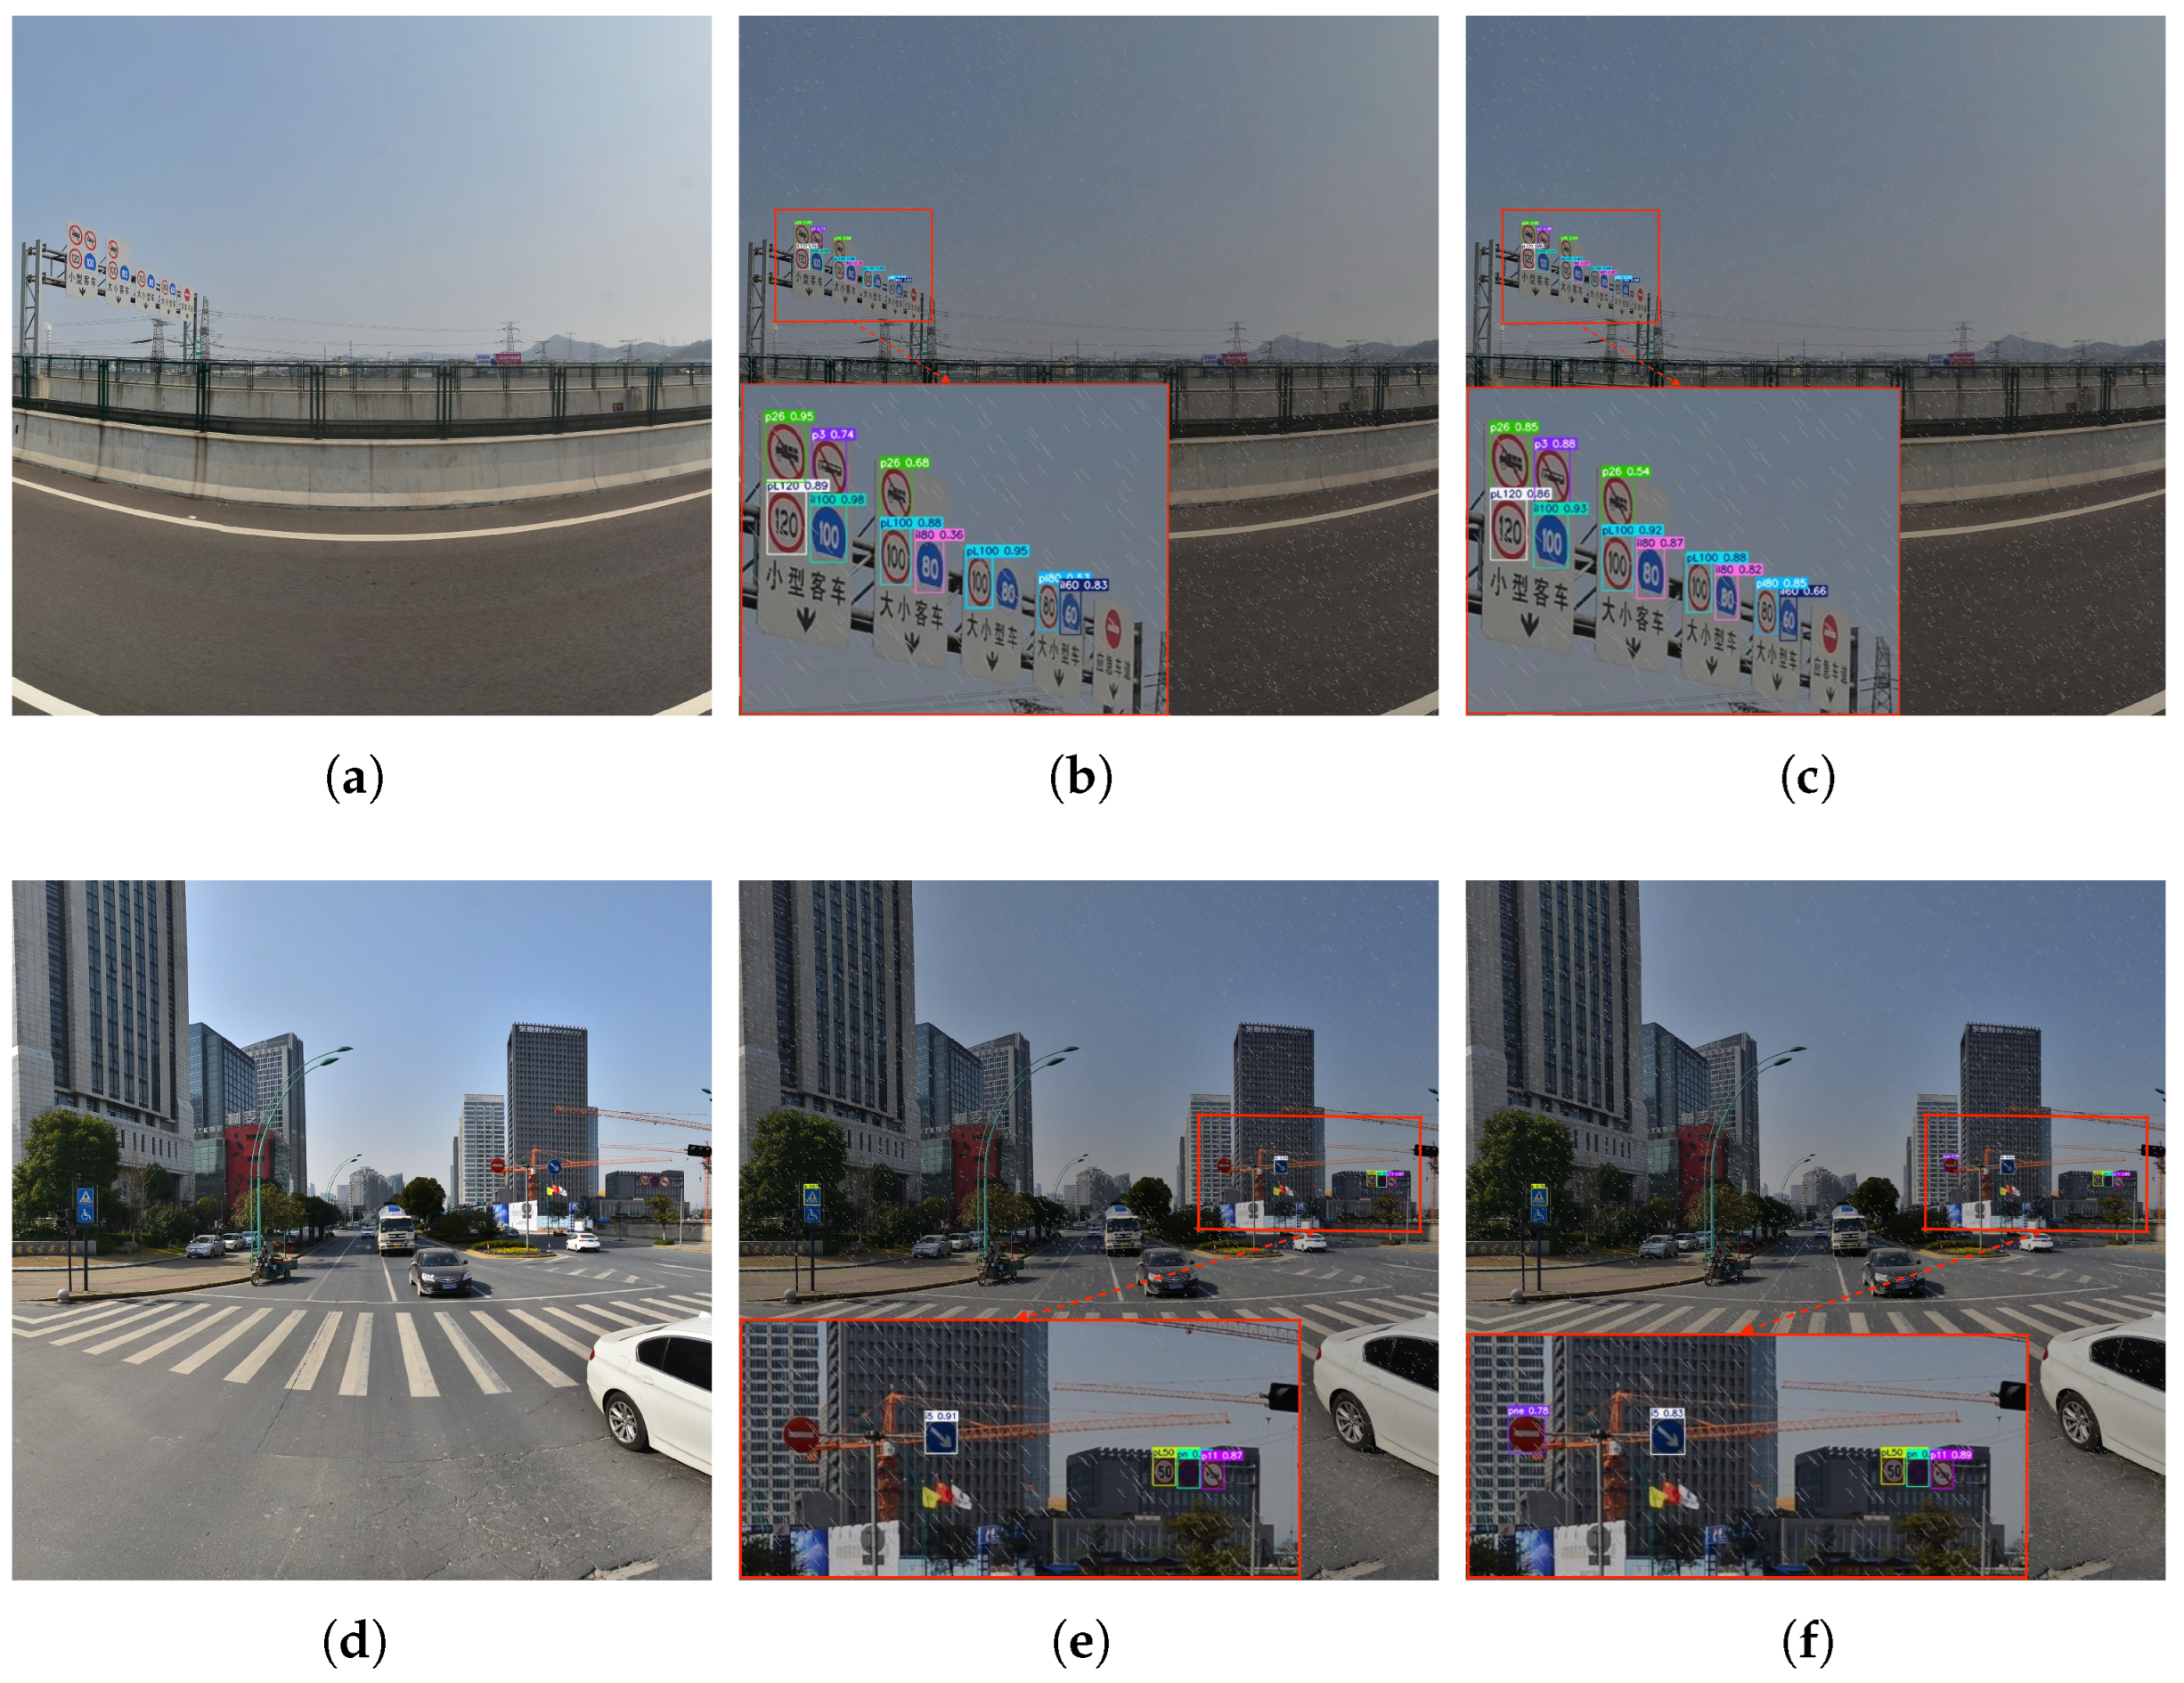
The algorithm comparison results in the random rain environment are shown in Figure 19. Compared with the test results in the random rain environment, it can be seen that the detection accuracy of the DAYOLO algorithm is not much different from that of the YOLOv8n algorithm. However, in the rainy environment, the YOLOv8n algorithm has poor detection ability for small targets. In Figure 19b, the minimum speed limit of 80 is missed, and in Figure 19e, the no-entry sign is missed. The DAYOLO algorithm perfectly detects smaller traffic signs in a complex rainy environment without missing any.
Figure 19.
Comparison of algorithms under random rain environment. (a) Original Image 5. (b) Random Rain–YOLOv8n. (c) Random Rain–DAYOLO. (d) Original Image 6. (e) Random Rain–YOLOv8n. (f) Random Rain–DAYOLO.
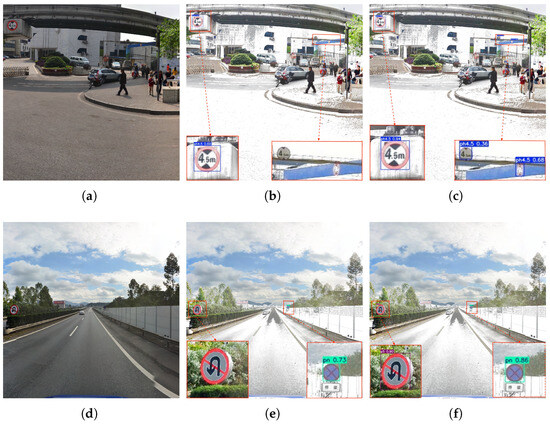
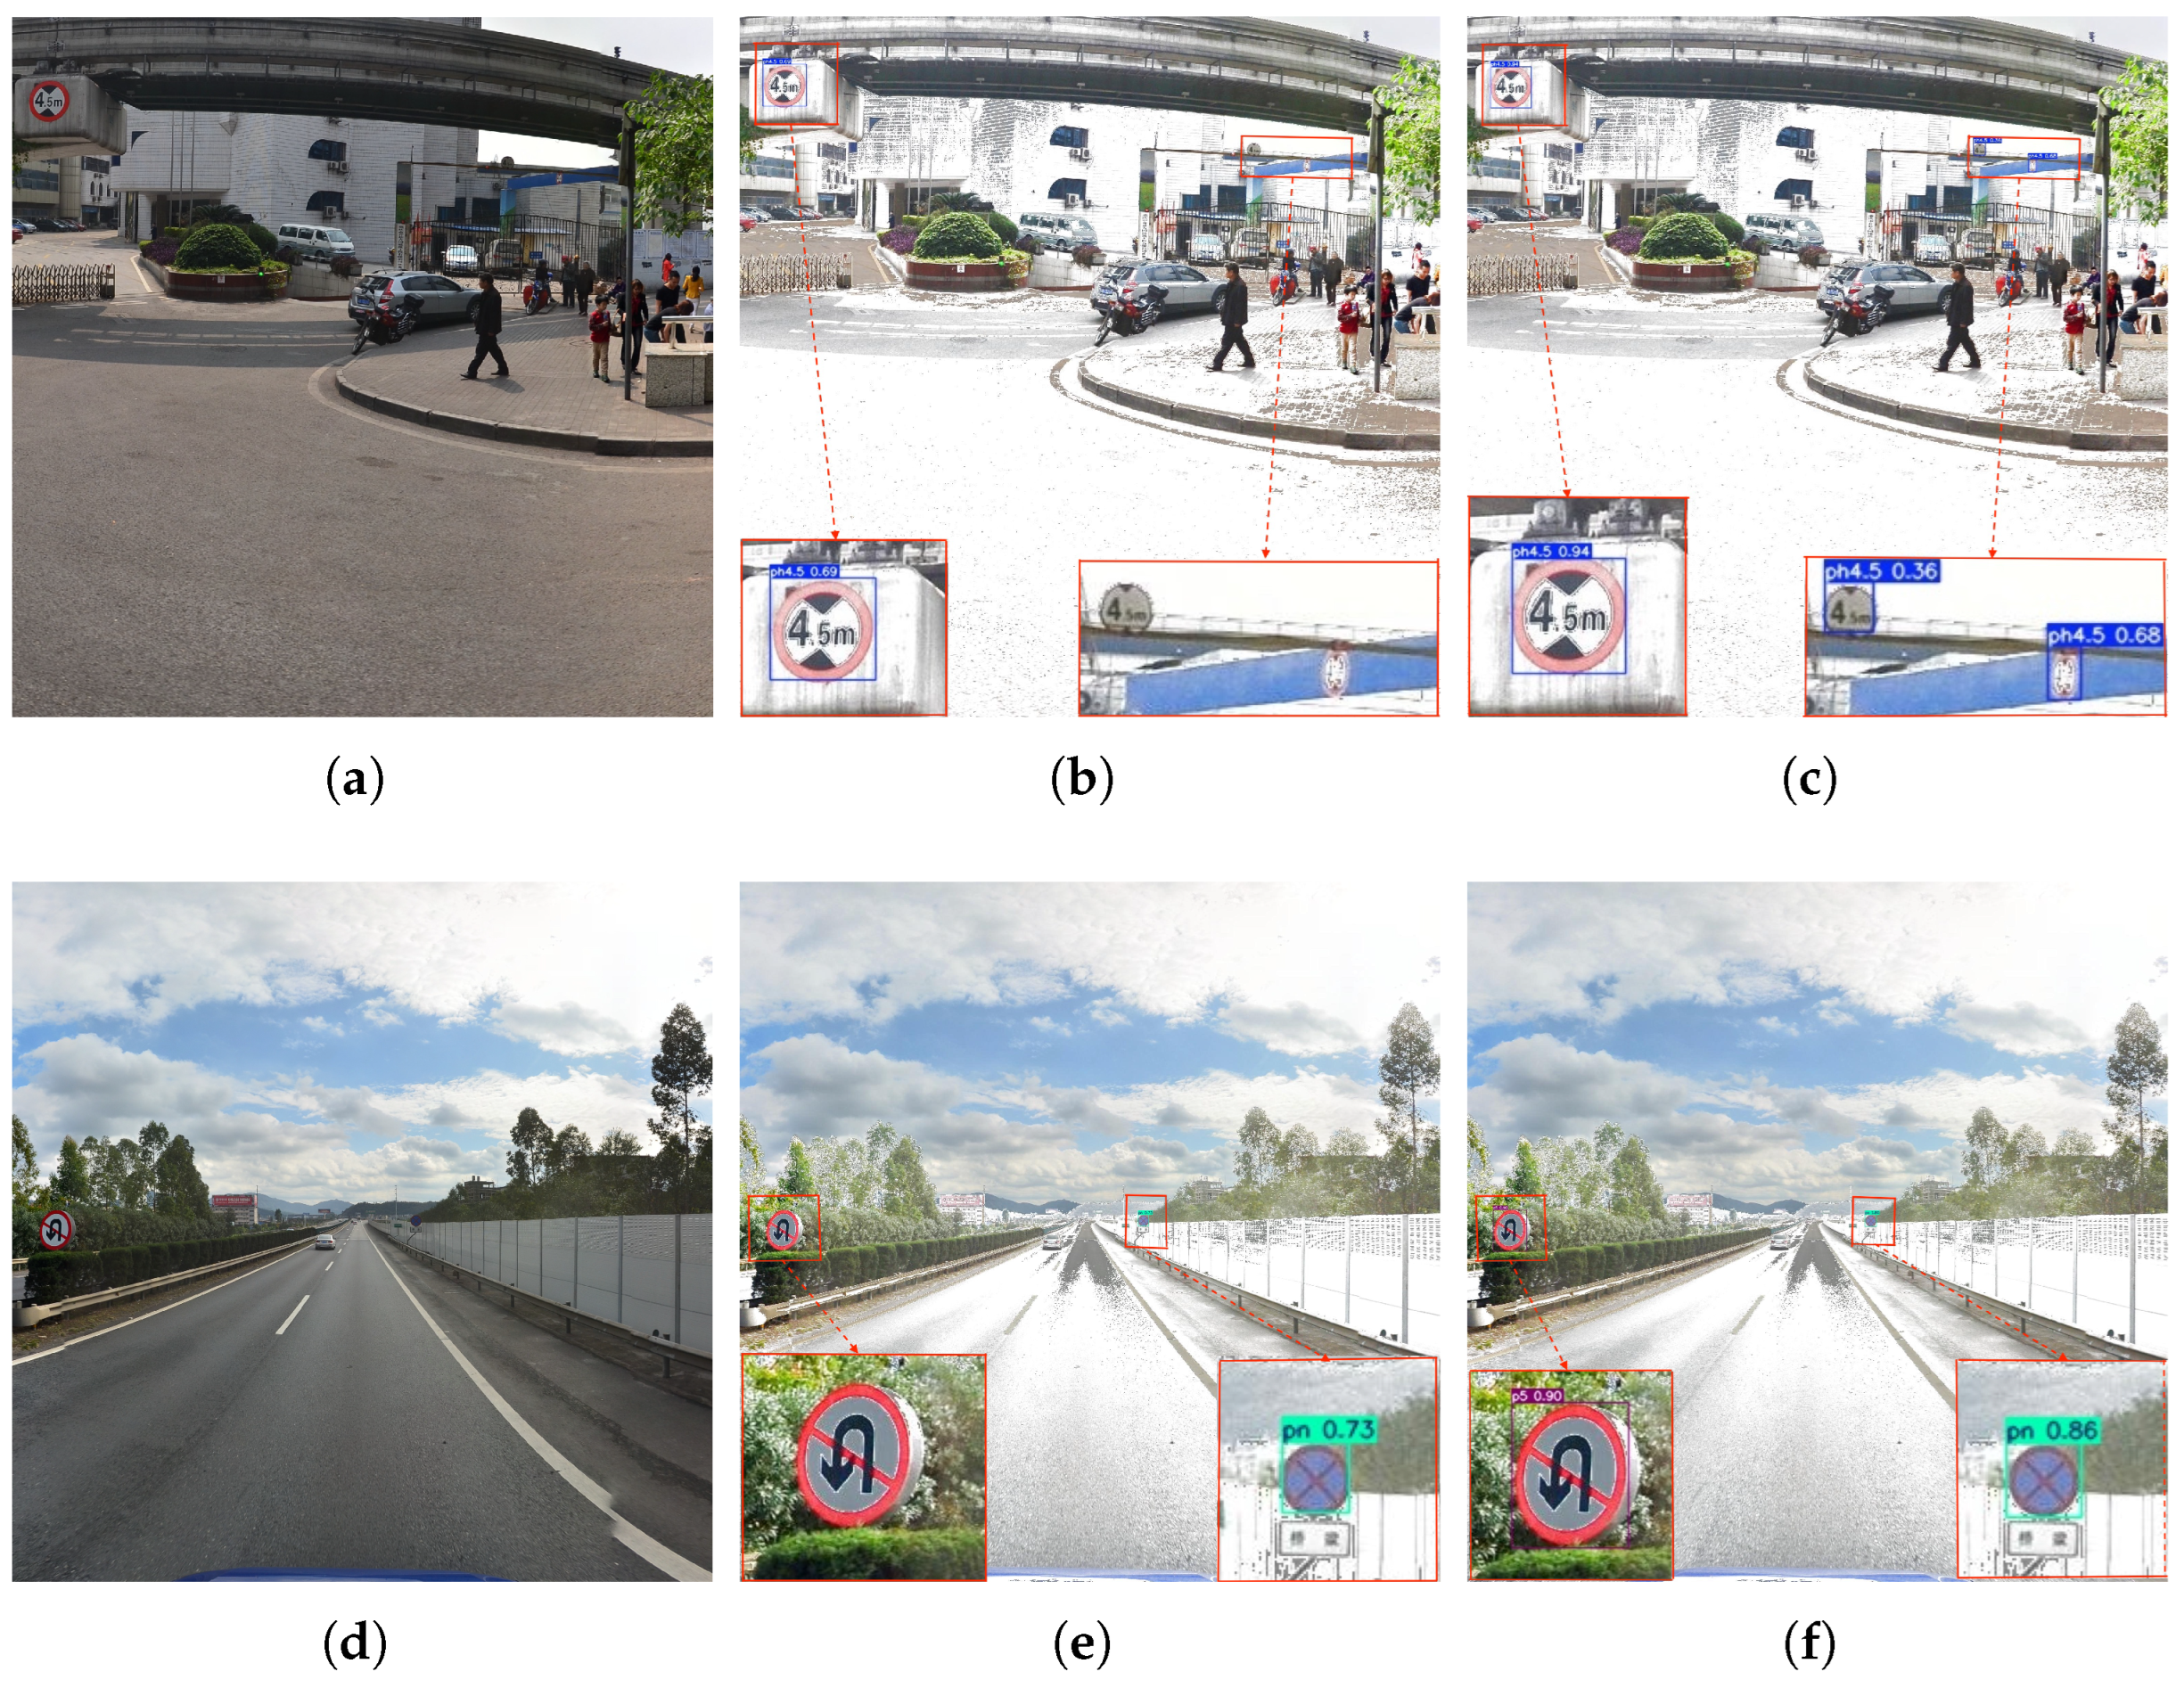
The algorithm comparison results in the random snow environment are shown in Figure 20. Compared with the test results in the random snow environment, it can be seen that the detection accuracy of the DAYOLO algorithm is higher than that of the YOLOv8n algorithm. In the snowy environment, in Figure 20c, there are two traffic signs with a height limit of 4.5m, which are very small and even blurred, but the DAYOLO algorithm can still detect them accurately, but the YOLOv8n algorithm cannot detect them. In Figure 18e, the YOLOv8 algorithm cannot detect the prohibition of U-turn; while the DAYOLO algorithm perfectly detects all small and blurred traffic signs in the complex foggy environment without omissions and detection errors.
Figure 20.
Comparison of algorithms under random Snow environment. (a) Original Image 7. (b) Random Snow–YOLOv8n. (c) Random Snow–DAYOLO. (d) Original Image 8. (e) Random Snow–YOLOv8n. (f) Random Snow–DAYOLO.
5. Conclusions
To address the core challenges of accuracy and speed in traffic sign detection, this study proposes the DAYOLO model. This model integrates several technological innovations to solve the common performance degradation problem in complex dynamic scenes.
DAYOLO makes key improvements in five main aspects: employing offline data augmentation strategies simulating adverse weather conditions such as rain, snow, and fog to improve generalization ability; introducing a deformable self-attention module to obtain the C2f-DAttention module, which dynamically adjusts the region of interest to enhance the model’s performance in multi-scale complex scenes; replacing dynamic convolution with the DySample module, significantly reducing parameter count and computational overhead through point sampling; adding a Layer2 auxiliary detection head to enhance multi-scale feature fusion and reduce information loss from small targets; designing a task-aligned dynamic detection head (TADDH) to improve task interaction and parameter sharing; and combining normalized Wasserstein distance (NWD) to improve the localization accuracy of small targets in cluttered environments.
Experimental results show that DAYOLO outperforms existing YOLO variants and other detection algorithms on multiple evaluation metrics. On the SDCCVP dataset, its mAP@0.5 reaches 97.2%, and the mAP@0.5:0.95 ratio is 84.6%, with only 3.0 M model parameters, a computational cost of 8.5 G FLOPs, and a model size of 6.1 MB, demonstrating excellent efficiency. On the TT100K dataset, DAYOLO improves precision, recall, and mAP@0.5 by 4.7%, 11.1%, and 9.2% respectively compared to YOLOv8n, showcasing its advanced performance in small object detection and complex environments.
In recent years, the YOLO series has continued to evolve, with versions such as YOLOv13 and YOLOv26 being successively introduced, achieving further breakthroughs in backbone networks, lightweight mechanisms, and end-to-end optimization. Future work could explore combining modules such as dynamic attention, lightweight upsampling, and task-aligned detection heads proposed in DAYOLO with the next-generation YOLO architecture. In particular, it could focus on integrating the hypergraph-enhanced adaptive visual perception mechanism introduced in YOLOv13 with the improvements in cross-stage aggregation and gradient propagation in YOLOv26 to further enhance the model’s robustness and real-time performance in extreme scenarios [29,30]. Furthermore, the model will be further optimized for more challenging environments such as low light, reflective surfaces, and target occlusion to expand its practical application value.
Author Contributions
Conceptualization, Z.F. and L.L.; Methodology, L.L.; Software, L.L.; Validation, L.L., K.X. and Z.F.; Formal analysis, Z.F.; Investigation, L.L.; Data curation, K.X.; Writing—original draft, L.L.; Writing—review & editing, L.L. and K.X.; Visualization, L.L.; Supervision, Z.F. and Y.W. All authors have read and agreed to the published version of the manuscript.
Funding
This work was supported by the National Natural Science Foundation of China (No. 12162020), the Young Scholars Science Foundation of Lanzhou Jiaotong University (No. 2020022), the Foundation for Innovative Fundamental Research Group Project of Gansu Province (No. 25JRRA805), the Sichuan Provincial Natural Science Foundation (No. 2023NSFSC0428), the Central Government Funds of Guiding Local Scientific and Technological Development (No. 2023ZYD0004), the Chengdu Science and Technology Project (No. 2025-YF05-00323-SN), the Sichuan Province Science and Technology Innovation Seedling Engineering Cultivation Project (No. MZGC20240034), the Open Fund for Key Laboratory of Numerical Simulation of Sichuan Provincial Universities (No. KLNS-2024SZFZ001), the Open Fund for State Key Laboratory of Intelligent Construction and Healthy Operation and Maintenance of Deep Underground Engineering (No. SDGZ2530), the Open Fund for Key Laboratory of Cognitive Computing and Intelligent Information Processing of Fujian Education Institutions (Wuyi University) (No. KLCCIIP202402), the Open Fund for Intelligent Perception and Control Key Laboratory of Sichuan Province (No. 2025IPCY03).
Institutional Review Board Statement
Not applicable.
Informed Consent Statement
Not applicable.
Data Availability Statement
The datasets were collected from publicly available sources and can all be found within the article, and further inquiries can be directed to the corresponding author.The code can be found at https://github.com/Arnold551/DAYOLO.git (accessed on 17 December 2024).
Acknowledgments
The authors sincerely thank the referees for their valuable comments.
Conflicts of Interest
The authors declare no conflicts of interest.
References
- Houben, S.; Stallkamp, J.; Salmen, J.; Schlipsing, M.; Igel, C. Detection of traffic signs in real-world images: The German Traffic Sign Detection Benchmark. In Proceedings of the 2013 International Joint Conference on Neural Networks (IJCNN), Dallas, TX, USA, 4–9 August 2013; pp. 1–8. [Google Scholar]
- Saadna, Y.; Behloul, A. An overview of traffic sign detection and classification methods. Int. J. Multimed. Inf. Retr. 2017, 6, 193–210. [Google Scholar] [CrossRef] [Scilit]
- Berkaya, S.K.; Gunduz, H.; Ozsen, O.; Akinlar, C.; Gunal, S. On circular traffic sign detection and recognition. Expert Syst. Appl. 2016, 48, 67–75. [Google Scholar] [CrossRef] [Scilit]
- Zhang, T.; Zou, J.; Jia, W. Fast and robust road sign detection in driver assistance systems. Appl. Intell. 2018, 48, 4113–4127. [Google Scholar] [CrossRef] [Scilit]
- Yu, L.; Xia, X.; Zhou, K. Traffic sign detection based on visual co-saliency in complex scenes. Appl. Intell. 2019, 49, 764–790. [Google Scholar] [CrossRef] [Scilit]
- Papageorgiou, C.; Poggio, T. A trainable system for object detection. Int. J. Comput. Vis. 2000, 38, 15–33. [Google Scholar] [CrossRef] [Scilit]
- Krizhevsky, A.; Sutskever, I.; Hinton, G.E. Imagenet classification with deep convolutional neural networks. Adv. Neural Inf. Process. Syst. 2012, 25. Available online: https://proceedings.neurips.cc/paper_files/paper/2012/file/c399862d3b9d6b76c8436e924a68c45b-Paper.pdf (accessed on 17 December 2024). [CrossRef] [Scilit]
- Girshick, R.; Donahue, J.; Darrell, T.; Malik, J. Rich feature hierarchies for accurate object detection and semantic segmentation. In Proceedings of the IEEE Conference on Computer Vision and Pattern Recognition, Columbus, OH, USA, 23–28 June 2014; pp. 580–587. [Google Scholar]
- Girshick, R. Fast r-cnn. arXiv 2015, arXiv:1504.08083. [Google Scholar] [CrossRef] [Scilit]
- Ren, S.; He, K.; Girshick, R.; Sun, J. Faster R-CNN: Towards real-time object detection with region proposal networks. IEEE Trans. Pattern Anal. Mach. Intell. 2016, 39, 1137–1149. [Google Scholar] [CrossRef] [Scilit]
- Cai, Z.; Vasconcelos, N. Cascade r-cnn: Delving into high quality object detection. In Proceedings of the IEEE Conference on Computer Vision and Pattern Recognition, Salt Lake City, UT, USA, 18–22 June 2018; pp. 6154–6162. [Google Scholar]
- Redmon, J. You only look once: Unified, real-time object detection. In Proceedings of the IEEE Conference on Computer Vision and Pattern Recognition, Las Vegas, NV, USA, 26 June–1 July 2016. [Google Scholar]
- Farhadi, A.; Redmon, J. Yolov3: An incremental improvement. In Proceedings of the Computer Vision and Pattern Recognition, Salt Lake City, UT, USA, 18–22 June 2018; Springer: Berlin/Heidelberg, Germany, 2018; Volume 1804, pp. 1–6. [Google Scholar]
- Bochkovskiy, A.; Wang, C.Y.; Liao, H.Y.M. Yolov4: Optimal speed and accuracy of object detection. arXiv 2020, arXiv:2004.10934. [Google Scholar] [CrossRef] [Scilit]
- Li, C.; Li, L.; Jiang, H.; Weng, K.; Geng, Y.; Li, L.; Ke, Z.; Li, Q.; Cheng, M.; Nie, W.; et al. YOLOv6: A single-stage object detection framework for industrial applications. arXiv 2022, arXiv:2209.02976. [Google Scholar] [CrossRef] [Scilit]
- Wang, C.Y.; Bochkovskiy, A.; Liao, H.Y.M. YOLOv7: Trainable bag-of-freebies sets new state-of-the-art for real-time object detectors. In Proceedings of the IEEE/CVF Conference on Computer Vision and Pattern Recognition, Vancouver, BC, Canada, 18–22 June 2023; pp. 7464–7475. [Google Scholar]
- Sohan, M.; Sai Ram, T.; Reddy, R.; Venkata, C. A review on yolov8 and its advancements. In Data Intelligence and Cognitive Informatics, Proceedings of the International Conference on Data Intelligence and Cognitive Informatics, Tirunelveli, India, 27–28 June 2023; Springer: Singapore, 2024; pp. 529–545. [Google Scholar]
- Liu, W.; Anguelov, D.; Erhan, D.; Szegedy, C.; Reed, S.; Fu, C.Y.; Berg, A.C. Ssd: Single shot multibox detector. In Computer Vision–ECCV 2016, Proceedings of the 14th European Conference, Amsterdam, The Netherlands, 11–14 October 2016, Proceedings, Part I; Springer: Cham, Switzerland, 2016; pp. 21–37. [Google Scholar]
- Yang, T.; Long, X.; Sangaiah, A.K.; Zheng, Z.; Tong, C. Deep detection network for real-life traffic sign in vehicular networks. Comput. Netw. 2018, 136, 95–104. [Google Scholar] [CrossRef] [Scilit]
- Shao, F.; Wang, X.; Meng, F.; Zhu, J.; Wang, D.; Dai, J. Improved faster R-CNN traffic sign detection based on a second region of interest and highly possible regions proposal network. Sensors 2019, 19, 2288. [Google Scholar] [CrossRef] [Scilit]
- Li, X.; Xie, Z.; Deng, X.; Wu, Y.; Pi, Y. Traffic sign detection based on improved faster R-CNN for autonomous driving. J. Supercomput. 2022, 78, 7982–8002. [Google Scholar] [CrossRef] [Scilit]
- Zhang, H.; Qin, L.; Li, J.; Guo, Y.; Zhou, Y.; Zhang, J.; Xu, Z. Real-Time Detection Method for Small Traffic Signs Based on Yolov3. IEEE Access 2020, 8, 64145–64156. [Google Scholar] [CrossRef] [Scilit]
- Wang, J.; Chen, Y.; Dong, Z.; Gao, M. Improved YOLOv5 network for real-time multi-scale traffic sign detection. Neural Comput. Appl. 2023, 35, 7853–7865. [Google Scholar] [CrossRef] [Scilit]
- Kaur, R.; Singh, J. Local Regression Based Real-Time Traffic Sign Detection using YOLOv6. In Proceedings of the 2022 4th International Conference on Advances in Computing, Communication Control and Networking (ICAC3N), Greater Noida, India, 16–17 December 2022; pp. 522–526. [Google Scholar]
- Li, S.; Wang, S.; Wang, P. A small object detection algorithm for traffic signs based on improved YOLOv7. Sensors 2023, 23, 7145. [Google Scholar] [CrossRef] [Scilit]
- Zou, Y.; Liu, S. Small object detection algorithm based on improved YOLOv10 for traffic sign. Transp. Res. Interdiscip. Perspect. 2025, 32, 101501. [Google Scholar] [CrossRef] [Scilit]
- Jiang, L.; Zhan, P. FM-YOLOv11: A Lightweight Traffic Sign Detection Network Based on Mixed Attention. In Proceedings of the 2025 International Conference on Artificial Intelligence and Computational Intelligence, Dalian, China, 29–31 August 2025. [Google Scholar]
- Dagher, I.; Makary, A. Detection Framework for Traffic Signs Using a Hybrid Approach. IEEE Access 2025, 13, 160619–160626. [Google Scholar] [CrossRef] [Scilit]
- Lei, M.; Li, S.; Wu, Y.; Hu, H.; Zhou, Y.; Zheng, X.; Ding, G.; Du, S.; Wu, Z.; Gao, Y. YOLOv13: Real-Time Object Detection with Hypergraph-Enhanced Adaptive Visual Perception. arXiv 2025, arXiv:2506.17733. [Google Scholar]
- Sapkota, R.; Cheppally, R.H.; Sharda, A.; Karkee, M. Yolo26: Key architectural enhancements and performance benchmarking for real-time object detection. arXiv 2025, arXiv:2509.25164. [Google Scholar] [CrossRef] [Scilit]
- Akatsuka, H.; Imai, S. Road Signposts Recognition System; Technical Report, SAE Technical Paper; SAE International: Warrendale, PA, USA, 1987. [Google Scholar]
- Sha, S.; Xiao, X. Traffic sign detection method with multi-channel integration. Comput. Eng. 2009, 35, 202–204. [Google Scholar]
- Chen, L.; Li, Q.; Li, M.; Mao, Q. Traffic sign detection and recognition for intelligent vehicle. In Proceedings of the 2011 IEEE Intelligent Vehicles Symposium (IV), Baden-Baden, Germany, 5–9 June 2011; pp. 908–913. [Google Scholar]
- Jeon, W.J.; Sanchez, G.A.R.; Lee, T.; Choi, Y.; Woo, B.; Lim, K.; Byun, H. Real-time detection of speed-limit traffic signs on the real road using haar-like features and boosted cascade. In Proceedings of the 8th International Conference on Ubiquitous Information Management and Communication, Siem Reap, Cambodia, 9–11 January 2014; pp. 1–5. [Google Scholar]
- Yakimov, P.; Fursov, V. Traffic signs detection and tracking using modified hough transform. In Proceedings of the 2015 12th International Joint Conference on e-Business and Telecommunications (ICETE), Colmar, France, 20–22 July 2015; Volume 5, pp. 22–28. [Google Scholar]
- Zaklouta, F.; Stanciulescu, B. Real-time traffic sign recognition using spatially weighted HOG trees. In Proceedings of the 2011 15th International Conference on Advanced Robotics (ICAR), Tallinn, Estonia, 20–23 June 2011; pp. 61–66. [Google Scholar]
- Zaklouta, F.; Stanciulescu, B. Real-time traffic-sign recognition using tree classifiers. IEEE Trans. Intell. Transp. Syst. 2012, 13, 1507–1514. [Google Scholar] [CrossRef] [Scilit]
- Wang, C.-Y.; Yeh, I.-H.; Liao, H.-Y. M. Yolov9: Learning what you want to learn using programmable gradient information. In Computer Vision–ECCV 2024, Proceedings of the 18th European Conference, Milan, Italy, 29 September–4 October 2024; Springer Nature: Cham, Switzerland, 2024. [Google Scholar]
- Wang, A.; Chen, H.; Liu, L.; Chen, K.; Lin, Z.; Han, J. Yolov10: Real-time end-to-end object detection. Adv. Neural Inf. Process. Syst. 2024, 37, 107984–108011. [Google Scholar]
- Khanam, R.; Hussain, M. Yolov11: An overview of the key architectural enhancements. arXiv 2024, arXiv:2410.17725. [Google Scholar] [CrossRef] [Scilit]
- Tian, Y.; Ye, Q.; Doermann, D. Yolov12: Attention-centric real-time object detectors. arXiv 2025, arXiv:2502.12524. [Google Scholar]
- Xia, Z.; Pan, X.; Song, S.; Li, L.E.; Huang, G. Vision transformer with deformable attention. In Proceedings of the IEEE/CVF Conference on Computer Vision and Pattern Recognition, New Orleans, LA, USA, 19–20 June 2022; pp. 4794–4803. [Google Scholar]
- Liu, W.; Lu, H.; Fu, H.; Cao, Z. Learning to upsample by learning to sample. In Proceedings of the IEEE/CVF International Conference on Computer Vision, Paris, France, 1–6 October 2023; pp. 6027–6037. [Google Scholar]
- Wang, J.; Xu, C.; Yang, W.; Yu, L. A normalized Gaussian Wasserstein distance for tiny object detection. arXiv 2021, arXiv:2110.13389. [Google Scholar]
- Car, S. Self-Driving Cars Dataset. 2023. Available online: https://universe.roboflow.com/selfdriving-car-qtywx/self-driving-cars-lfjou (accessed on 12 January 2025).
- Zhaosheng, Y.; Tao, L.; Tianle, Y.; Chengxin, J.; Chengming, S. Rapid detection of wheat ears in orthophotos from unmanned aerial vehicles in fields based on YOLOX. Front. Plant Sci. 2022, 13, 851245. [Google Scholar] [CrossRef] [Scilit] [PubMed]
- Zhu, Z.; Liang, D.; Zhang, S.; Huang, X.; Li, B.; Hu, S. Traffic-sign detection and classification in the wild. In Proceedings of the IEEE Conference on Computer Vision and Pattern Recognition, Las Vegas, NV, USA, 26 June–1 July 2016; pp. 2110–2118. [Google Scholar]
- Theofilatos, A. Incorporating real-time traffic and weather data to explore road accident likelihood and severity in urban arterials. J. Saf. Res. 2017, 61, 9–21. [Google Scholar] [CrossRef] [Scilit] [PubMed]
- Wang, S. Effectiveness of traditional augmentation methods for rebar counting using UAV imagery with Faster R-CNN and YOLOv10-based transformer architectures. Sci. Rep. 2025, 15, 33702. [Google Scholar] [CrossRef] [Scilit] [PubMed]
- Buslaev, A.; Iglovikov, V.I.; Khvedchenya, E.; Parinov, A.; Druzhinin, M.; Kalinin, A.A. Albumentations: Fast and Flexible Image Augmentations. Information 2020, 11, 125. [Google Scholar] [CrossRef] [Scilit]
- Everingham, M.; Eslami, S.A.; Van Gool, L.; Williams, C.K.; Winn, J.; Zisserman, A. The pascal visual object classes challenge: A retrospective. Int. J. Comput. Vis. 2015, 111, 98–136. [Google Scholar] [CrossRef] [Scilit]
- Lin, T.Y.; Maire, M.; Belongie, S.; Hays, J.; Perona, P.; Ramanan, D.; Dollár, P.; Zitnick, C.L. Microsoft coco: Common objects in context. In Computer Vision–ECCV 2014, Proceedings of the 13th European Conference, Zurich, Switzerland, 6–12 September 2014, Proceedings, Part V; Springer: Cham, Switzerland, 2014; pp. 740–755. [Google Scholar]
- Lee, J.; Hwang, K.i. YOLO with adaptive frame control for real-time object detection applications. Multimed. Tools Appl. 2022, 81, 36375–36396. [Google Scholar] [CrossRef] [Scilit]

Disclaimer/Publisher’s Note: The statements, opinions and data contained in all publications are solely those of the individual author(s) and contributor(s) and not of MDPI and/or the editor(s). MDPI and/or the editor(s) disclaim responsibility for any injury to people or property resulting from any ideas, methods, instructions or products referred to in the content. |
© 2025 by the authors. Licensee MDPI, Basel, Switzerland. This article is an open access article distributed under the terms and conditions of the Creative Commons Attribution (CC BY) license.