


Abstract
Renewable energy resources have become extremely important in the current context of air pollution and the production of significant amounts of greenhouse gas emissions that contribute to global warming. One of the most important renewable energy sources that has shown the highest growth in recent years is photovoltaic (PV) systems. Due to their significance, this research presents a review of the applications in which artificial computer vision can be used in photovoltaic systems. From the results presented in this review, it will be evident that artificial vision can be applied for several different purposes. The advantages of using this technique will also be highlighted. Additionally, a systematic literature review is presented on the research associated with this topic. Through this review, it will be evident that many advanced algorithms related to image acquisition equipment have been proposed to ensure high reliability and fast results. This review does not merely focus on a specific topic or algorithms associated with image processing applied to photovoltaic systems. Rather, this work presents a broad and comprehensive review detailing all viable applications and associated computer vision technologies that can be deployed within these systems. Besides that, the review will clearly specify which work one is based on public datasets. To allow future reproducibility or research, the links to all public datasets utilized in the works based on them are included.
1. Introduction
Energy is fundamental to economic growth in all areas, including industry, commerce, and agriculture. To meet the growing energy needs, fossil fuels have been the primary option. However, this type of fuel, in addition to being limited, has been the main cause of various problems, such as air pollution and global warming. It is therefore essential to develop and promote technologies to reduce the demand for fossil fuels. This urgency is critical considering that the energy sector is one of the pillars of growth, development, and competitiveness in modern companies and economies. In fact, ensuring energy security and environmental protection are goals of an economy focused on sustainability.
The production of electricity from renewable energy sources is currently the main solution to combat dependence on fossil fuels [1]. As such, practically all governments have encouraged its development and use. For example, the European Union has been one of the main advocates of using this type of energy. In fact, the starting points for a European energy policy have been defined as combating climate change, limiting the EU’s external dependence on imported hydrocarbons, and promoting growth and jobs, thus providing safe and affordable energy for consumers [2]. The renewable energy sources that have shown strong growth in recent years and have contributed to changing the energy paradigm are those based on wind and photovoltaic systems. According to data from the International Renewable Energy Agency (IREA) [3], the installed capacity of wind and photovoltaic systems worldwide has grown sharply over the last few years. However, of these two technologies, the one that has grown the most in recent years is photovoltaics. In fact, an analysis of the data from the IREA (shown in Figure 1) shows that the installed capacity of photovoltaic systems worldwide grew by 1854% between 2011 and 2023.
Figure 1.
Electricity capacity trends worldwide [3].
Due to the importance of photovoltaic systems, many aspects are fundamental to consider, such as, for example, PV output power forecast, maintenance, optimization of their position, and management.
The importance of image processing vision systems has also been seen by the high number of research works presented in journals and conferences. This also resulted in several review papers, although they only focused on particular aspects. In [4], a review was presented to the inspection of PV modules and the detection of faults using imaging technologies in large-scale PV plants. The focus was on examining the dependability of PV systems, potential faults that impact PV system performance, the present status of Infrared Thermography imaging, and innovative imaging methods that can enhance Infrared Thermography imaging and provide detailed PV module diagnostics. A similar review was presented, but it focused on UAV-based approaches [5]. A technological review of the instrumentation for aerial thermographic inspection of photovoltaic plants was presented in [6]. A review, presented in [7], centered on the application of Infrared Thermography (IRT) for Photovoltaic (PV) system detection and diagnostics. A review focusing on different aspects of IR imaging for PV system inspection using Remotely Piloted Aircraft was conducted in [8]. In [9], a review was provided on fault classification in operating c-Si PV modules and fault diagnosis through field infrared thermal imaging (IRTI). A review of the current state and future challenges of infrared imaging in the context of gigawatt photovoltaic power stations was presented in [10]. Reference [4] details imaging technologies and analysis methods for photovoltaic (PV) module fault detection and characterization. A review focusing on evaluating the impact of defects and degradation on modules from Electroluminescence images was presented in [11]. A review that presented various image sources and existing public image datasets was also presented in [12]. Additionally, it categorized and evaluated current photovoltaic (PV) identification models. An examination of various techniques for automating various tasks within the AIRT (Artificial Intelligence-based Intelligent Reactive Tracking) framework of PV power plants was presented in [13]. A comprehensive discussion of the various types of failures that can occur in PV modules, along with the methods used to detect them, is presented in [14]. The focus of the discussion is on the practical application and suitability of these detection methods for specific problem. Reference [15] presented a review of photovoltaic module damage and the image processing methods employed for its detection. In [16], another study presented a comparative investigation of imaging techniques, pre-processing, and visual fault diagnosis using artificial intelligence models for solar photovoltaic systems. A review assessing the current state of research on automated inspection of PV defects in manufacturing facilities, with a particular emphasis on the application of Convolutional Neural Network (CNN) architectures, was presented by [17]. This type of network is an advanced version of Artificial Neural Networks (ANNs), primarily designed to extract features from datasets. The CNN architecture consists of multiple layers, including the input layer, convolutional layer, pooling layer, and fully connected layers. CNN models are widely used in Computer Vision applications involving image and video datasets due to their effectiveness in processing visual data. Several CNN models have been described in research papers and applied to the field of photovoltaic panels. These models are distinguished primarily by their architecture, specifically the number and arrangement of layers and their interconnections. These factors subsequently influence their feature extraction capacity and computational efficiency.
One of the techniques used with the computer vision is Infrared (IR) thermography. In [18], a study was presented that offers an overview of the data analysis techniques for PV defect detection systems. In [19] a review regarding IR thermography applied to Photovoltaic (PV) systems is presented. The application of Applied Imagery Pattern Recognition to the inspection of photovoltaic modules under the commonly employed spectra of true-color Red, Green, and Blue (RGB), long-wave infrared (LWIR), and electroluminescence-based short-wave infrared (SWIR) is reviewed in [20]. An analysis of the advancements in quantitative Electroluminescence (EL) imaging at the module level was presented in [11]. It examines and assesses the existing literature on various defect and degradation categories, focusing on the quantitative methodology, required EL imaging input, and the quantitative performance. In [21], a survey detailed the application of satellite and aerial imagery for automated detection and capacity assessment of solar PV systems over expansive areas. In [12], a study that explores the prediction PV area and capacity in large regions, as well as assessing the geographical potential for rooftop PV installations, was presented.
As verified, many reviews concerning photovoltaic systems and computer vision have already been presented. However, this review differs from others by not focusing on a specific topic or algorithms associated with image processing applied to photovoltaic systems. Instead, this paper presents a comprehensive review of all possible applications and technologies where computer vision can be applied in these systems.
2. Research Methodology
The study adhered to the PRISMA framework to ensure a systematic and transparent review process. No formal method for assessing the quality of the included studies was employed.
In this study, we focus on the use of AI algorithms (machine learning and deep learning algorithms) in electrical engineering research to examine their application and relevance in the photovoltaic energy field. In this field, there are different research study applications with a focus on the use of AI algorithms employing images as a source of information. Specifically, this study addresses photovoltaic module applications associated with computer vision in the following fields: predicting PV areas, power prediction, solar forecasting, detection of soiling or faults in PV modules, maintenance of PV modules, fault detection of PV trackers, and maximum power point tracking algorithms.
This study addresses the main research question: What is the current status, including trends and future directions, of computer image-based approaches used in photovoltaic energy applications? We conducted a comprehensive literature review to synthesize the relevant information and aim to provide high-level thematic findings based on this synthesis.
This study was performed in three stages:
- Identification: Papers were retrieved from various databases using predefined search terms and phrases;
- Screening: The full text of the retrieved papers was assessed to determine their applicability and relevance to our research topic;
- Synthesis: The papers that successfully passed the full-text screening process.
The databases include Google Scholar, Web of Science, IEEE Xplore Library, Wiley Online Library, EBSCO and Science Direct. All retrieved papers from these databases were combined, and duplicates were subsequently removed.
During the screening stage, a set of exclusion criteria was applied to remove publications irrelevant to the research topics, leaving the papers to be included in the study. The papers that met any of the following five exclusion criteria (EC) were because they did not align with the purpose of the study: (EC-1) papers not published in English will be excluded; (EC-2) papers that do not focus on computer image-based algorithms will be excluded; (EC-3) papers that do not focus on photovoltaic applications will be excluded; (EC-4) papers that are work-in-progress will be excluded; (EC-5) papers that are books, magazines, and thesis will be excluded.
In the synthesis stage, relevant information was obtained from the remaining papers. This information includes publication title, year of publication, research methodology, used dataset, data analysis techniques, research limitations, and future work.
Furthermore, this review includes papers published since 1996. This also allowed us to also include foundational or seminal studies that contributed to the early development of computer image-based approaches in photovoltaic applications. By limiting the literature search to English-language papers, we may have captured only a portion of the global studies related to computer image-based approaches on photovoltaic applications.
3. Computer Vision
Computer vision is a field of artificial intelligence that focuses on enabling computers to interpret, process, analyze, and understand visual data from images and videos. Its goal is to replicate and enhance the human ability to see and understand the world, providing machines with the capability to perceive, reason, and act upon visual information. It uses techniques and algorithms from computer science, mathematics, statistics, machine learning, and deep learning to extract meaningful information from visual data, enabling machines to recognize objects, detect patterns, classify images, and perform other tasks that require visual interpretation. Figure 2 illustrates the key components of a computer vision system and how they are interconnected.
Figure 2.
Block diagram of the computer vision components.
The first step in computer vision is image acquisition, which involves capturing an image or video using a camera or other imaging device. Once the image is acquired, it might be necessary to pre-process it using techniques such as noise reduction, image enhancement, or color correction, making it easier for the computer to analyze. In the feature extraction step, the computer analyzes the image to identify and extract specific features relevant to the task. This might involve detecting edges, corners, or other shapes. Edge detection is one type of algorithm used in image segmentation to partition an image into multiple objects. After the relevant features have been extracted, the computer can perform object recognition within the image. This may involve comparing the image’s features to a database of known items or using machine learning algorithms to recognize patterns and shapes. Once the objects within the image have been identified, the computer can proceed to the final analysis phase. This allows for detailed inspection, enabling tasks such as tracking the movement of objects over time, recognizing patterns within the image, or detecting anomalies. Based on image analysis, the computer can make decisions or take actions, such as controlling a robot arm in a manufacturing plant or detecting potential hazards in a surveillance video feed.
Some of the most common computer vision types include image classification [22], object detection [23], object tracking [24], pose estimation [25], semantic or instance segmentation [26], action recognition [27,28,29], image restoration [30], facial recognition [31], pattern detection [32], motion analysis [33], and scene reconstruction [34].
Computer vision can quickly surpass human capabilities due to its inherent advantages in speed, objectivity, continuity, accuracy, and scalability. There are numerous benefits of computer vision, with applications across a wide range of industries and fields. Some of the main advantages of computer vision include automation, improved efficiency and accuracy, enhanced safety, enhanced customer experience, cost savings, and better decision-making. Some practical and important applications used in various industries include scanning images, videos, and texts; attendance management systems [35]; detecting and tracking humans or vehicles [36,37]; medical imaging in clinical applications [38]; manufacturing quality control [39]; use in pick and place industrial robot controllers [40]; autonomous driving of vehicles [41]; precision agriculture for grain crops [42]; transportation in smart cities [43]; and home surveillance and security [44].
The objective of machine vision is the appropriate choice of hardware and software solutions. The hardware includes components such as cameras, image sensors, lighting, communication interfaces, and processing units, while the software ensures the necessary analysis and decision-making capabilities. This inspection technology can cover the entire electromagnetic spectrum, ranging from gamma rays to radio waves [45]. It provides visual data, which is the necessary support for computer vision algorithms in real-time or industrial settings, allowing that data to be processed and interpreted.
Data acquisition is a critical task that necessitates the selection of appropriate hardware, which itself has specific requirements. For each application, choosing the right camera is essential. Cameras are typically grouped into categories such as high-resolution, compact, high-speed, and standard types. The imaging sensors present in cameras may capture data as a line scan, a depth perception image replicating three dimensions, or a standard two-dimensional image where width and height directly correspond to the sensor’s resolution (number of pixels). Sensors are further characterized by their speed (frames per second) and the number of colors they capture. Table 1 illustrates the different camera types corresponding to each imaging sensor used.
Table 1.
Different types of cameras.
Another way of providing images or videos to a computer vision system is through the use of large datasets. It is necessary to train and test computer vision models by providing images or videos accompanied by labels, annotations, or metadata. The images in these datasets are obtained through different methods, which include satellite or aerial imagery. Commonly used satellite images originate from sources like Landsat-8 [46], Sentinel [47], SPOT-6/7 [48], and Gaofen-2 [49], with the first two being openly accessed through Google Earth Engine. Satellite images generally contain multiple spectral bands but typically offer low resolution. Unmanned aerial vehicles (UAVs) can be used to obtain aerial images [50].
The acquired data utilizes specific hardware to process it efficiently in either parallel or serialized threads. This hardware must also be low-cost, portable, fast-processing, and possess an optimized memory architecture for rapid access. With the increasing number of applications deployed on the edge, additional critical features must be considered when selecting a development board, specifically edge processing ability and low power consumption. Depending on the type of computer vision application, the processing unit might vary, including Central Processing Units (CPU), integrated or discrete Graphics Processing Units (GPU), heterogeneous systems (CPU + GPU + others), Field-Programmable Gate Arrays (FPGA), Application-Specific Integrated Circuits (ASIC), microcontroller boards, and embedded systems (smart cameras).
The quality control in the PV production environment can affect the performance of the installation as a whole and, depending on the deployment’s size, cause clients to suffer significant financial losses. The micro-cracks in the PV cell surface, when not detected early, have the potential to grow over their surface substantially over time, intensifying their negative effects on the lifespan and performance of the PV string. The Electroluminescence (EL) procedure is effectively an X-ray of the PV cells through image analysis, which enables the detection of micro-cracks that are hidden from human sight and impossible to detect using techniques such as flash testing, voltage–ampere characteristics, or infrared imaging using thermal cameras [51]. An EL camera is used for capturing the illuminated cell surface image, which occurs when a current is applied into the PV module via an external power supply. In the EL image, the illuminated surface corresponds to the active area of the cell surface, with darker regions representing busbar connections in a periodic manner. Other darker regions that may appear sporadically indicate defective regions. The EL procedure can be completed during the manufacturing process or can also be carried out at any point in the PV lifetime, though it requires some additional investment and expert knowledge of the EL procedure.
After PV modules are delivered to the client and implemented, if an EL inspection is requested, it is necessary to first use infrared (IR) imaging obtained from thermal cameras [52]. This step helps to detect PV modules that have anomalies, allowing them to be taken out of the PV string before being sent for the costlier and more specialized EL inspection. The use of IR imaging for the evaluation of PV modules offers several advantages. A great number of failures developed on PV modules can be detected using IR imaging, ranging from hot spots and mismatch losses to installation failures. A typical system is shown in Figure 3. The IR imaging technique is valuable for non-destructive testing and can be used to scan large areas of installed PV modules during normal operation.
Figure 3.
Typical system for the detection of deteriorated PV modules using a drone with a thermal camera.
The inspection of solar cells at an early stage of production and development can also be performed using the Photoluminescence (PL) technique [53]. In this process, the solar cell is excited by a high-intensity light source at a specific wavelength. The invisible photoluminescence radiation subsequently emitted by the cell is then detected by a highly sensitive camera. The PL emissions occur at wavelengths associated with the semiconductor band gap, which are detectable by high-sensitivity, uncooled, short-wave infrared (SWIR) cameras.
Ultraviolet fluorescence (UVF) measurements are widely employed across many applications. For photovoltaic (PV) applications, UVF is specifically used to analyze the degradation of the encapsulant (the ‘yellowing effect’) in PV modules and to detect cracks in the solar cells [54]. The UVF method relies on the fluorescence effects of the polymeric lamination material within a PV module. Fluorescence is a form of luminescence—the emission of light by an activated material that has absorbed light or other electromagnetic radiation. A simpler UVF method consists of irradiating the entire PV module with an excitation light source and observing the fluorescence effect either with the naked eye or with a camera (UVF imaging). In fluorescence photography, a filter is placed in front of the camera lens to block unwanted short-wavelength light from entering the camera, as this light would compromise the resulting image. However, some filters exhibit fluorescence under UV light and therefore have the potential to produce a color cast on the image. Since detection operates in three spectral ranges (red, green, and blue), the imaging method provides qualitative spectral information. Due to the small efficiency of UVF conversion and the limited emission power of UV LEDs, imaging is often performed in dark environments. Table 2 shows the advantages and limitations of IR imaging and the three luminescence techniques (EL, PL, and UVF) for fault detection in PV modules.
Table 2.
Benefits and drawbacks of measuring methodologies.
4. Applications of Artificial Vision in Renewable Photovoltaic Systems
Computer vision plays a significantly vital role in numerous sectors, including healthcare, mobility and transportation, surveillance, robotics, augmented reality, and many others, owing to its ability to extract meaningful information from visual data. However, one important area in which these systems have been applied is in renewable energy sources, particularly in photovoltaic systems. In fact, many works have been published in recent years that demonstrate the importance of this application. However, one fact that is possible to see from those works is that artificial vision can be applied to several different applications within renewable photovoltaic systems. Therefore, based on the analysis of these works, which will be referenced below, the applications in which artificial vision has been applied are:
- -
- Predicting PV areas;
- -
- Identification of Solar PV power plants;
- -
- Ecological performance of the PV landscape;
- -
- Power prediction of PV generators;
- -
- Fault detection and diagnosis of PV modules;
- -
- Fault detection of PV trackers (Detection of PV modules orientation);
- -
- Orientation of the PV modules;
- -
- Maintenance of PV systems;
- -
- Finding the optimal operating point of photovoltaic panels (MPPT).
Another aspect to consider is the technology associated with each application. In fact, different technologies can be applied depending on the specific purpose, as will be discussed below. These aspects are related not only to the hardware technology described in the previous section but also to the algorithms used in computer science. In this context, most of the algorithms are based on deep learning approaches. In image processing, deep learning uses multi-layer convolutional neural networks (CNNs) or similar architectures to automatically extract visual features and recognize patterns within images. Figure 4 presents the general principle of operation of deep learning. The process operates as follows: input images are fed into the network in the form of pixel matrices; the early layers learn low-level features, such as edges, corners, and textures; deeper layers learn high-level features, such as shapes, objects, or shading patterns. Through convolution, pooling, and nonlinear activation functions, the network progressively builds a hierarchical representation of the visual content. The network then produces a prediction (e.g., classification or segmentation), and the error between the prediction and the ground truth is computed and backpropagated, allowing the model to adjust its parameters and improve accuracy. After training, the network is able to automatically interpret new images, detect relevant patterns, or classify visual characteristics without manual feature engineering. Thus, deep learning in image processing relies on layered neural structures to automatically learn and extract meaningful visual features, enabling tasks such as object detection, segmentation, shading analysis, and image classification.
Figure 4.
Simplified diagram illustrating the flow of information in a Deep Neural Network.
4.1. Predicting PV Areas
The primary objective of PV identification is to estimate the area and capacity of the photovoltaic system. This is especially important since estimating the installed capacity and total generation potential of solar photovoltaic (PV) systems can help inform the development of effective policies aimed at reducing carbon emissions in the relevant sector. Currently, methods for estimating the number and capacity of installed PV systems include official registers, crowd-sourced field surveys, behind-the-meter analysis, and identification through satellite and aerial images. Recent years have seen a surge in research employing satellite and aerial imagery to map land cover, roads, and buildings [55,56]. Previous studies have also confirmed that satellite imagery can be successfully employed to identify solar PV installations. Moreover, this method is at this time the best option available [4,12]. Usually, this prediction is performed at two levels, at the national or global and rooftop potential.
Several CNN models have been described in research papers and applied to predicting PV areas. Some models perform instance segmentation (such as Mask R-CNN) or semantic and panoptic segmentation (such as U-Net or EfficientNet-B7), while others use rectangular regions (bounding boxes) for detection. The architectures of these model types differ in the level of precision of their outputs and in the complexity of the tasks they perform. Traditional machine-learning models, such as the Random Forest algorithm, have also been used in the field of PV area prediction.
4.1.1. PV at the National or Global Level
One of the fundamental goals of photovoltaic (PV) identification is to estimate the PV system’s area and capacity. In fact, the forecasting of global solar radiation levels for various regions is highly significant as it provides valuable guidance for the planning, design, and operation of solar energy conversion systems. It also aids in identifying suitable regions and informing future investment strategies for decision-makers in the solar energy sector. Thus, several works proposed the use of artificial vision for the identification of the PV at the national or global level. The methods in these studies were implemented using images captured by satellites, planes, or unmanned aerial vehicles (UAVs). Conversely, the acquisition system relied on various technologies, including satellite imagery, charge-coupled device (CCD) cameras, and infrared thermography.
The work in [57] presents a scalable deep learning framework for generating a global map of solar panels. This is achieved by identifying their locations and estimating their surface areas using aerial imagery. The system combines an image classification model with a semantic segmentation model in a two-branch architecture, enabling both accurate detection and precise delineation of solar panels. The models are trained on a custom-built dataset of satellite images, specifically curated for this task. This paper [58] presents an enhanced semantic segmentation network (DeepLabv3+) for more accurate extraction of photovoltaic (PV) panels from high-resolution remote sensing images. To address under-segmentation issues, a multi-level context aggregation module is introduced, which improves the model’s ability to capture detailed features of PV panels and their surroundings by incorporating rich contextual information across multiple semantic and spatial scales. The authors in [59] created a comprehensive photovoltaic (PV) dataset using satellite and aerial imagery. The spatial resolutions of 0.8 m, 0.3 m, and 0.1 m were specifically chosen to correspond to concentrated PV systems, distributed ground-mounted PVs, and fine-grained rooftop PVs, respectively. The dataset includes 3716 annotated samples featuring PV installations across a variety of terrains, such as shrubland, grassland, cropland, saline–alkali land, and water surfaces, as well as rooftop types including flat concrete, steel tile, and brick. This dataset is used to evaluate the performance of various deep learning models for PV segmentation tasks. In [60], a computer algorithm is introduced for the automated detection of photovoltaic (PV) panels from very high-resolution color satellite imagery. The method offers a fast and scalable solution for accurately identifying the location and approximate size of PV arrays, with significantly higher spatial resolution than existing approaches. This work represents the first large-scale demonstration of automated PV detection in aerial imagery, confirming the feasibility of the approach and providing a performance baseline for future research. In this study [61], the authors enhance a previously developed algorithm [58] for detecting photovoltaic (PV) arrays in high-resolution aerial imagery. The enhancement is achieved by integrating two machine learning approaches: a Random Forest (RF) classifier and a deep convolutional neural network (CNN). In this paper [62], the authors propose a deep learning solution for accurately detecting and segmenting solar panels from orthorectified RGB aerial imagery covering Washington, DC, San Francisco, CA, and Boston, MA, from 2011 to 2013. The method not only identifies the locations of solar panels but also captures their spatial footprint. The approach is based on a custom-designed convolutional neural network (ConvNet), optimized for the specific challenges of solar panel detection in urban environments. The article [63] introduces a novel method for automatically extracting the boundaries of utility-scale photovoltaic (PV) plants using a fully convolutional network (FCN). Accurate boundary detection is critical for aerial inspection, photogrammetry, flight path planning, and autonomous monitoring by aerial robots. To support this task, the authors compile the “Amir” dataset, which includes aerial imagery of PV plants from multiple countries. The proposed method uses a Mask R-CNN architecture with a VGG16 backbone to achieve precise boundary detection. In this paper [64], the authors present ‘DetEEktor’, a novel model capable of simultaneously detecting and classifying six types of renewable energy (RE) plants in aerial imagery using a Mask R-CNN architecture. The paper first details the model’s design, architecture, and dataset, then demonstrates its effectiveness in addressing data gaps in existing RE system registries. In this study [65], the authors investigate the effectiveness of deep convolutional neural networks (DCNNs) for extracting photovoltaic (PV) arrays from high spatial resolution remote sensing (HSRRS) imagery. Unlike previous work that primarily applied DCNNs without analyzing model architecture, this research focuses on how different network structures influence extraction accuracy. The study [66] introduces PVNet, a novel semantic segmentation framework designed specifically for extracting high-quality, detailed footprints of PV panels in large-scale solar farms. PVNet is composed of two main modules: The Coarse Prediction Module (CPM), which integrates low-level local and high-level global features to identify full PV panel regions and the Fine Optimization Module (FOM), which refines the CPM’s output by aligning panel boundaries more accurately with the ground truth using residual learning. This paper [67] introduces an enhanced deep learning approach for accurately segmenting photovoltaic (PV) panels from remote sensing imagery. The method integrates prior knowledge of PV panel characteristics with a Constraint Refinement Module (CRM) to improve both localization and shape regularization. The main innovations include: (1) A color loss function that leverages known color characteristics of PV panels to reduce confusion with similar-looking objects; (2) A shape loss function based on multi-layer shape constraints, which sharpens edge definition and refines initial segmentation outputs. In this paper [68], the authors propose CrossNets, a cross-learning-driven U-Net ensemble, and its variant Adaptive CrossNets, for the automatic segmentation of rooftop solar panels (RSPs) in satellite imagery. The method uses a community of generic U-Nets, each initialized using either transfer learning or standard methods, to improve segmentation accuracy and robustness. A novel cross-learning strategy is introduced, where each U-Net individually trains its parameters at every epoch and periodically learns from the best-performing model in the group. This study [69] proposes a method to identify optimal parking spaces for solar-powered electric vehicles (EVs) using hemispherical imagery and shading analysis. Hemispherical images were captured for each parking spot to generate shading matrices, which were used to calculate a Parking Space Suitability Index (PSSI)—quantifying the reduction in direct and diffuse solar radiation due to shading during EV charging hours. To designate exclusive solar EV parking zones, genetic algorithms were employed to group spatially adjacent parking spaces and select those with the highest PSSI. This approach was tested on 69 parking spaces at Pukyong National University. Seasonal analysis revealed that shading patterns were consistent in spring and summer and similarly affected morning and afternoon periods in autumn and winter. Due to varying sunlight availability, the study recommends adjusting designated solar EV parking spaces seasonally, optimizing solar energy capture throughout the year. This study [70] focuses on Chinese coastal provinces and introduces a random forest classification method that integrates morphological, optical, and SAR data to mitigate the effects of cloud interference in remote sensing. The identified photovoltaic (PV) areas were further analyzed in relation to geographic and socioeconomic factors to assess regional development patterns. The study provides critical insights for evaluating solar power capacity, identifying future development opportunities, and assessing ecological and environmental impacts in coastal regions. the authors of [71] developed a physics-based detection method using airborne imaging spectroscopy and spectral analysis of PV materials. This study demonstrates the potential of airborne and spaceborne imaging spectroscopy as a reliable tool for automated PV module mapping and monitoring. Finally, a summary of key aspects for each work is presented in Table 3. These aspects include image type, method, overall accuracy, and algorithm type.
Table 3.
Summary of key aspects for each work regarding predicting PV areas at the national or global level.
The studies presented in Table 3 utilize different image datasets, which makes it impossible to directly compare the overall accuracy obtained by the respective methodologies. Table 4 presents a description of whether the database used for each work is public, thereby allowing for benchmarking and future research. In the case of public databases, the link to the specific database utilized for that work is also provided. It is important to note that some databases referenced as non-public are, in fact, based on public sources. However, they were categorized as non-public because the specific labeled dataset used for the method was not clearly released publicly with a download link or DOI in the paper.
Table 4.
Databases used for each work regarding predicting PV areas at the national or global level (all website links accessed on 18 November 2025).
Several works have focused on using computer vision to predict PV (photovoltaic) areas at national or global levels. This approach has proven to be the most economical and practical tool for delivering this important prediction. One major conclusion drawn from these studies is that image resolution is fundamental to the accuracy of the proposed methods. The highest reported accuracy was achieved by Sizkouhi et al. (2020) [63]. However, this finding is not conclusive, as the dataset utilized in that study was not consistent with those used by other authors. Standardizing the datasets used in future research is, therefore, critical to drawing definitive conclusions regarding method performance. Furthermore, a common limitation across many of these works is their failure to account for the variability in image quality, which is often degraded by factors such as weather changes, shadows, varying sensor angles, and seasonal changes. Furthermore, aerial imagery presents challenges such as occlusions (e.g., from trees or buildings), shadows, and varying brightness, which negatively impact segmentation performance. Based on this analysis, several avenues for future work can be identified, including:
- Standardization of Datasets: Establish a public and uniform benchmark dataset to enable objective comparison between algorithms and approaches proposed by different studies;
- Temporal Monitoring and Analysis: Extend current approaches to incorporate time-series data for monitoring installation dynamics, enabling the detection of newly installed, removed, or degraded panels;
- Policy and Infrastructure Integration: Integrate the comprehensive solar panel maps directly into urban planning tools, energy infrastructure planning systems, and climate policy dashboards to support data-driven decision-making and incentivize renewable energy adoption;
- Enhancing Model Robustness: Significantly improve the model’s resilience to challenging image conditions (e.g., shadows, occlusions, varying lighting, and seasonal changes). This can be achieved through advanced techniques such as data augmentation, adversarial training, or the design of more robust network architectures.
4.1.2. Rooftop PV Potential
Distributed photovoltaic (PV) represents an area of growth for renewable energy generation. Due to the diurnal cycle, weather conditions, and other factors, distributed PV has a highly variable generation. This means that distributed PV would be expected to have an impact on grid operations that is different from more traditional forms of electricity generation. Much research has focused on improving the ability to predict the impacts of distributed generation on the electricity grid. However, sometimes the data about the location and capacity of distributed PV installations may be limited or unavailable. In particular, rooftop PV installations may be difficult to find complete data due to customer privacy concerns and lack of availability of information at a granular level. Depending on the specific location, rooftop PV installations may represent a substantial share of installed capacity [72]. In recent years, using satellite and aerial images to identify land cover types, road distribution and solar PV buildings has become a popular and a feasible method. The use of state-of-the-art CNN models, such as Mask R-CNN for roof detection and instance segmentation, also allows the identification of the roof material, its usable area, and its orientation [73]. Figure 5 shows an example of the rooftop segmentation including the flat-roof, hip-roof, shed-roof, or any other.
Figure 5.
Example of a Rooftop image segmentation.
A dataset of aerial images for semantic segmentation of roof segments and roof superstructures named Roof Information Dataset (RID) was presented by [74]. A semantic segmentation algorithm based on U-Net is applied to the dataset for extracting roof information for estimating unexploited rooftop PV potential. However, the lack of shadow information in 2D aerial images shows the necessity of searching for new approaches such as merging 2D and 3D data to increase the accuracy of potential estimation. In [75], an automated method is presented for accurately mapping the geocoordinates of all photovoltaic (PV) modules in a plant using incremental structure-from-motion. The method combines visual cues from drone imagery with GPS trajectory data to localize each module and extract multiple infrared (IR) images per module. The approach successfully mapped 99.3% of 35,084 modules across four large-scale and one rooftop PV plant, resulting in the extraction of over 2.2 million IR images. In [76], the authors present a partially automated method for generating training samples to detect rooftop photovoltaic (PV) systems, eliminating the need for manual labeling. This is achieved by integrating data from the German Plant Register, Georeferenced Address Data, and Official House Surroundings of Germany to automatically identify PV-equipped rooftops. Using 100,000 automatically generated samples, a RetinaNet-based deep learning model is trained. This paper [77] proposes a novel method for generating photovoltaic (PV) training samples using a text-guided stable diffusion inpainting model, enabling the creation of many rooftop PV panel images across diverse backgrounds. Recent advances in high-resolution satellite imagery and deep learning offer a pathway to automate Roof Structure Lines (RSLs) extraction, but two key challenges persist, namely: the diversity in roof shapes, sizes, and spatial configurations makes it difficult for generic deep learning models to extract relevant RSL features and a severe class imbalance between RSLs (foreground) and background in satellite imagery hampers the models’ ability to focus on relevant features. To address these issues, the study [78] introduces Deep Roof Refiner, a detail-oriented, end-to-end deep learning framework specifically designed for RSL extraction. The rapid growth of the photovoltaic (PV) industry and the increasing deployment of PV systems underscore the need for accurate, up-to-date data on installed capacity to support better planning and decision-making. While traditional manual data collection methods are often labor-intensive and time-consuming, leveraging satellite and aerial imagery offers a cost-effective and consistent alternative for estimating PV capacity at scale. Although previous studies have explored the use of machine learning for PV panel segmentation, the unique challenges of semantic segmentation in this context require careful consideration. In this study [79], the authors analyze the specific characteristics of PV panel imagery from a computer vision perspective and highlight several key challenges, such as the severe class imbalance and scattered distribution of PV panels in images, homogeneous textures combined with heterogeneous color features, making panel identification non-trivial and the critical resolution threshold below which effective segmentation performance significantly drops. Accurate statistics on installed solar energy systems (SES) are vital for stakeholders such as policymakers, utilities, and financial analysts. For example, grid operators require reliable data on PV penetration to maintain power quality and grid stability. In this study [80], an automated method for generating SES statistics using deep learning and image processing is proposed. Specifically, it employs a U-Net convolutional neural network (CNN) architecture to detect SES from aerial imagery. In this study [81], a supervised deep learning approach using convolutional neural networks (CNNs) for pixel-wise segmentation and size detection of rooftop solar panels is presented. The model is trained on high-resolution aerial imagery provided by the Swiss Federal Office of Topography. In this paper [82], it is introduced the 3D-PV-Locator, a novel approach for large-scale, three-dimensional detection of roof-mounted photovoltaic (PV) systems. Unlike traditional methods that rely solely on aerial imagery, the 3D-PV-Locator integrates deep learning-based image classification and segmentation with 3D building data to not only identify PV installations but also estimate their azimuth and tilt angles. The system was evaluated using a comprehensive dataset of over one million buildings from the official German PV registry. In [83], the identification of small, decentralized grid-connected, off-grid PV systems, and solar thermal (ST) systems using aerial imagery and deep learning to support solar energy market analysis and statistical reporting is proposed. It is applied to Sweden, a country characterized by a significant share of small-scale and off-grid solar systems. The analysis covers 3513 km2 across three Swedish municipalities and aims to assess the real-world accuracy of detecting such systems using aerial image classification. Accurately determining the location and size of distributed photovoltaic (PV) systems is essential for estimating installed capacity and assessing untapped generation potential—key to effective planning and deployment strategies. However, detecting small-scale distributed PVs in complex urban settings using high spatial resolution remote sensing (HSRRS) imagery remains a challenge. To address this, the study [84] introduces PV Identifier, an advanced deep learning model specifically designed to improve the detection of small-scale PV systems. The model incorporates a Fine-Grained Feature Layer (FFL) that enhances sensitivity to the small size of residential PV panels, and a Semantic Constraint Module (SCM) that improves discrimination between PVs and visually similar background elements. Finally, a summary of key aspects for each work is presented in Table 5. These aspects include image type, method, overall accuracy, and algorithm type.
Table 5.
Summary of key aspects for each work regarding rooftop PV potential.
The studies presented in Table 5 utilize different image datasets, which are not always fully characterized. This prevents a fair comparison of the accuracy obtained by the methodologies used. Table 6 presents a description of whether the database used for each work is public, thereby allowing for benchmarking and future research. In the case of public databases, the link to the specific database utilized for that work is also provided. We note that certain databases categorized as non-public are based on public sources. However, they retain the non-public classification because the specific labeled dataset employed in the method was not explicitly made available with an accessible download link or DOI in the paper.
Table 6.
Databases used for each work regarding rooftop PV potential (all website links accessed on 18 November 2025).
The analysis of rooftops using computer image-based approaches is also one of the most economical and practical tools for delivering this important prediction. One aspect these studies consistently demonstrate is that image resolution is fundamental to the accuracy of the proposed methods. This is evidenced by the high accuracy obtained in works utilizing high-resolution imagery, such as that by Castello et al. (2019) [81]. Furthermore, it was observed that combining aerial thermography and Structure-from-Motion (SfM) provides significant operational and analytical benefits, as shown by Bomme et al. (2022) [75]. In fact, using this approach, it was possible to obtain the highest accuracy. However, another key conclusion is that the creation of specialized, high-quality datasets inherently introduces several limitations. Therefore, standardizing the use of datasets is critical for future research to allow for objective comparisons and the drawing of definitive conclusions regarding method performance. Furthermore, a common limitation across many of these studies is their failure to account for variability in image quality, which is frequently degraded by factors such as weather, shadows, varying sensor angles, and seasonal changes. Based on this analysis, several avenues for future work can be identified, including:
- Standardization of Datasets: Promote the creation and use of a publicly available, standardized benchmark dataset to allow for fair and objective comparisons between different PV mapping algorithms and studies;
- Enhancing Robustness to Variability: Develop techniques (e.g., data augmentation, adversarial training, or domain adaptation) to make the model resilient to challenging conditions such as shadows, occlusions, varying sun angles, and seasonal changes;
- Temporal Monitoring and Change Detection: Extend the approach to incorporate time-series imagery (multitemporal data) to monitor installation dynamics. This would allow for the detection of newly installed, removed, or degraded panels over time;
- Application Integration: Integrate the generated solar panel maps into higher-level applications, such as urban planning tools, energy infrastructure planning, or dashboards designed for monitoring national-level climate policy targets;
- Model Benchmarking and Comparison: Use the RID as a standardized benchmark to host challenges or comparative studies, allowing researchers to objectively test and compare new computer vision algorithms for PV potential assessment.
4.2. Power Prediction of PV Generators
Despite the many benefits of photovoltaic (PV) power generation systems compared to other renewable energy sources, there are still challenges to integrating them on a large scale. Factors such as changes in solar irradiation, humidity, airborne dust, temperature, and wind speed can significantly affect the variability of the output power produced by the PV system. The unpredictability of weather parameters makes it difficult to accurately forecast the power output of solar PV systems, which in turn creates challenges for efficient electric power utility-grid system planning and pricing. In other words, the uncertainty surrounding weather factors can hinder effective planning and pricing in utility-grid systems. An effective way to address this challenge is by accurately forecasting the power output of solar PV systems. By performing so, it becomes possible to improve the planning and operation of utility-grid systems, leading to better management of solar power generation. This forecast can be realized through advanced computer vision techniques (see Figure 6). These techniques allow better understanding and predicting the impact of cloud cover on solar power generation, among other aspects, leading to improved management and integration of solar energy into utility-grid systems.
Figure 6.
Production forecast of PV generators using advanced computer vision techniques.
Accurate and efficient performance monitoring of photovoltaic (PV) modules is crucial for reliable economic forecasting in large-scale solar installations. The study referenced in [85] introduces a transparent approach to distinguish between genuine physical insights and dataset-specific biases learned by convolutional neural networks (CNNs). Deep learning models, particularly CNNs, can automate the prediction of module power output directly from electroluminescence (EL) images. However, these models require large datasets of EL images from defective modules for training. Due to financial or technical constraints, such datasets are often biased, which limits the model’s ability to generalize. To evaluate whether the network learns underlying physical principles or simply overfits to data bias, the study uses synthetic EL images generated from a predefined, unbiased feature set. The predictions of the CNN trained on real, biased data are then compared to those of a physics-based equivalent model. Discrepancies between the two reveal the extent of the model’s bias. This methodology allows for an in-depth assessment of how much true physical understanding a deep learning model incorporates, offering valuable insights into its predictive capabilities and reliability.
In PV generator power prediction, the U-Net model and its variants are used to estimate solar energy. The U-Net architecture is a type of CNN specifically designed for image segmentation. In this application, U-Net is used to segment PV panels and determine their total area. The study [86] presents a deep learning-based approach for estimating solar energy potential from satellite imagery using image segmentation techniques. While many studies focus on network architecture, this work emphasizes the importance of high-quality annotated data for accurate segmentation results. The research evaluates five popular segmentation architectures—UNet, UNet++, Feature Pyramid Network (FPN), Pyramid Scene Parsing Network (PSPNet), and DeepLabV3—each tested with various encoders. After segmenting rooftop and ground-mounted solar panels, the pixel count is converted into surface area, adjusted for the average panel tilt angle. Using this calculated area, the annual energy output is estimated by factoring in average panel efficiency, global tilted solar irradiation, and system loss coefficients.
To accurately estimate electricity generation and assess the socio-economic impact of solar photovoltaic (PV) systems, it is essential to identify installed PV areas and quantify capacity over large regions. However, conventional deep learning models struggle to segment small, dispersed PV arrays with precise boundaries due to complex backgrounds, visual similarity to non-PV objects, and varying lighting conditions. To address these challenges, the study [87] introduces the Deep Solar PV Refiner, a detail-oriented deep learning network designed for enhanced PV segmentation from satellite imagery. The model integrates advanced components, such as Split-Attention Networks for improved feature representation, Dual-Attention Networks with Atrous Spatial Pyramid Pooling for multi-scale context understanding and PointRend for fine-grained boundary refinement. Through transfer learning, synthetic data augmentation, hybrid loss functions, and extensive ablation studies, the optimized model significantly outperforms benchmarks.
The growing demand for renewable energy to mitigate climate change has significantly increased the need for accurate detection and capacity estimation of photovoltaic (PV) installations. However, traditional fully convolutional network (FCN)-based methods often struggle with modeling long-range dependencies and diverse PV structures—especially in residential areas—due to their reliance on localized convolution operations. These limitations hinder accurate semantic segmentation when PV panels vary in size, shape, and texture. To address these challenges, this study in [88] proposes TransPV, a novel semantic segmentation model that combines U-Net architecture with a Vision Transformer (ViT). The main innovations of this study are: (1) Mix Transformer blocks in the encoder to enhance global context modeling; (2) A U-shaped architecture to integrate multi-level features for richer representations; (3) A PointRend module in the decoder to refine segmentation boundaries; and (4) A custom refiner loss function to handle extreme class imbalance during training.
In response to rising energy demands and carbon reduction goals, many countries—led by China—are expanding the deployment of water-based photovoltaics (WPV). Mapping the spatial distribution of WPV using satellite image time series is essential for evaluating its scale, development potential, and environmental impact. However, reliable spatial data and studies on WPV distribution remain limited. To address this gap, the study [89] developed a Random Forest-based classification algorithm using Sentinel time series imagery to detect and categorize water-based photovoltaics (WPV) installations. The results reveal that by 2019, WPV coverage in China had reached 165 km2, growing at an average rate of 43.8 km2 per year from 2016 to 2019. The majority—95%—are Stationary PV (SPV) systems, while Floating PV (FPV) accounts for just 5%. Based on the spatial mapping, the study estimates that WPV contributes approximately 6911 MW of installed capacity and 7.8 TWh of annual power generation, representing 3.4% and 3.5%, respectively, of China’s total PV capacity and generation. This research offers a robust, scalable methodology for large-scale WPV detection and presents detailed spatial data that complements official statistics. The findings can support strategic planning, resource allocation, and environmental assessments for future WPV development.
Modeling and predicting power loss from snow is also vital for economic planning, load management, and optimizing photovoltaic (PV) systems of all sizes. The paper in [90] presents a new method to measure snow shedding on PV modules using time-lapse images captured every five minutes. Applied at a commercial PV plant in Vermont, with modules arranged in both portrait and landscape orientations, the method processes images to distinguish snow-covered and clear areas on each module, enabling accurate quantification of snow coverage and estimation of power output over time.
Finally, a summary of key aspects for each work is presented in Table 7.
Table 7.
Summary of key aspects for each work regarding power prediction of PV generators.
Table 8 describes the public status of the database utilized in each work, thereby enabling benchmarking and supporting subsequent research. It is possible to observe from this table that only one study includes a link to a publicly available database.
Table 8.
Summary of key aspects for each work regarding power prediction of PV generators (all website links accessed on 18 November 2025).
As verified, several works have focused on the energy and/or capacity estimation of photovoltaic (PV) installations. It was possible to verify through these works that computer image-based systems can be an important support. Most of the works only focused on the capacity estimation of PV installations. They used different algorithms, but since the majority did not use the same dataset, the comparisons between them are not conclusive. This is one of the important gaps in this work and field of application. The only work that focused specifically on the produced PV energy, more specifically the power losses due to snow coverage, was Braid et al., 2020 [90]. However, this work cannot be reproduced since it did not use a public dataset. Based on this analysis, several avenues for future work can be identified, including:
- Establishing Standardized datasets: To enable objective comparison, a uniform and publicly available benchmark dataset should be established for evaluating algorithms from different studies;
- Model Generalization and Transferability: Expand training datasets to include more diverse geographic areas (different climates, building types, solar installation styles) to make the segmentation + capacity estimation more robust;
- Capacity Estimation Model Refinement: Instead of (or in addition to) simple area-based estimates, develop a more sophisticated model that accounts for panel efficiency, tilt, orientation, degradation, and shading losses;
- Variation in Illumination Conditions: The accuracy of the image analysis algorithm (especially those based on simple thresholding) is drastically reduced under challenging illumination conditions (low light, long shadows, or different sun angles), leading to false positives or false negatives in snow detection;
- Multimodal Data Integration: Combining visual information (RGB cameras) with thermal information (infrared cameras) to detect residual ice or wet snow (which have different thermal signatures), thereby improving the quantification of energy losses.
4.3. Computer Vision in Solar Forecasting
One of the major problems associated with the power prediction of PV generators is the cloud cover dynamics. In fact, the variability in intraday solar irradiance is largely caused by changes in cloud cover. Thus, to better predict solar power fluctuations, computer vision techniques that are based on cloud observations have been used. In addition to the random component present in cloud modeling, the partially predictable nature of cloud motion can be utilized to estimate the future spatial configuration of cloud cover based on past observations. The capability to predict cloud movement provides a substantial advantage over forecasting methods that are based solely on local weather data. These methods cannot provide reliable predictions beyond the short-term correlation period of solar time series data. Thus, the forecast of cloud movement is therefore critical for providing truly valuable solar predictions at different spatiotemporal scales.
The primary data sources for short-term solar forecasting that rely on cloud observations are: sky cameras and satellites. The sky camera is usually equipped with a fish-eye lens. This equipment allows capturing the local cloud cover layout over a few square kilometers at a time resolution of less than a minute [91]. In terms of the forecast time frame, methods that use sky cameras aim to provide predictions on local solar variability up to 30 min in the future, depending on the local cloud speed. In contrast, satellite-based imagery offers longer-term forecasts, up to several hours in advance, due to its wider field of view. Sky cameras are most appropriate for use in locations with high solar power density, such as solar plants or hybrid power plants, unless they are used as part of a network that covers a larger area (see Figure 7). On the other hand, satellite-based methods can offer predictions of solar output across an entire country, which can be useful for applications such as grid balancing or energy trading.
Figure 7.
Example of sky images in the prediction of cloud position.
The typical approach used in computer vision methods that rely on sky images or satellite images uses similar techniques, such as cloud segmentation, cloud localization, estimation of cloud properties, cloud tracking, and modeling of cloud motion [92].
This section is dedicated to computer vision or image processing in solar PV forecasting systems. Notice that in parallel to satellite-based and sky cameras methods, Numerical Weather Prediction (NWP) data-based models are also used for intra-day and beyond forecasts. Numerical Weather Prediction (NWP) methods use mathematical models of the atmosphere and oceans to forecast weather conditions. These models solve complex physical equations (like those for temperature, pressure, humidity, wind, and radiation) using observed meteorological data as initial input. NWP models are typically run by national meteorological agencies and produce grid-based forecasts over regions and time intervals. They are also considered very important and are the main source of weather forecasts from 6 to 48 h. Nevertheless, they are out of scope of the proposed review since they only rely on weather data and not satellite or sky images. Despite the description of many solar PV forecasting methods, the details about forecast accuracy and obtained results were not introduced in most cases to reduce the complexity of the review analysis.
Image-based forecasting is an emerging area in machine learning that leverages visual data—such as satellite imagery, medical scans, solar forecasting or sensor maps—to predict future events or patterns. In computer vision for solar forecasting, regression models are typically used for short- and medium-term solar predictions. Studies in this area employ several types of models, including:
- Classic machine learning models, such as SVM, k-NN, or ANNs;
- Time series-based models, such as ARMA;
- Deep learning models, such as CNNs (e.g., LSTMs).
These models are used to predict Global Horizontal Irradiance (GHI) or the energy production of photovoltaic panels based on historical time-series data and meteorological variables.
Traditional forecasting methods often struggle to capture the complex spatial relationships inherent in image data. On the other hand, Artificial Neural Networks (ANN) and other methods play a critical role in solar photovoltaic (PV) forecasting due to their ability to model complex, nonlinear relationships between environmental inputs and energy output. Solar energy generation is highly dependent on dynamic factors such as irradiance, temperature, cloud cover, and weather patterns, which are often difficult to capture using traditional models. Their flexibility allows them to integrate various data sources—like satellite images, sky cameras, and meteorological forecasts—enabling short-term and long-term prediction of solar energy yield. This improves the reliability of solar PV systems, supports grid stability, and optimizes energy management strategies. The study presented in [93] introduces a standalone, real-time solar forecasting platform designed to predict 1 min averaged solar irradiance ramps up to 10 min ahead. The system combines cloud tracking using a low-cost fisheye network camera with an artificial neural network (ANN) that forecasts solar ramps based on real-time sky imagery and exogenous inputs. A novel short-term solar forecasting system was presented in [94] using inexpensive ground-based sky imaging cameras. The solution can predict changes in irradiance by forecasting cloud movement up to 20 min ahead, with a 10 s update frequency. The solution includes several features, such as a new high-performance approach to cloud classification using a machine learning model based on ANN to provide an estimate of the ‘cloudiness’ of individual cloud pixels. In [95], several authors present two novel low-cost methodologies for predicting global solar irradiance from 1 to 5 min ahead using sky images and real-time global horizontal solar irradiance (GHI) measurements (see Figure 8). Unlike traditional approaches, these methodologies bypass the need for cloud detection or segmentation. Instead, they extract color information from 60 or fewer sampled points within each sky image to serve as ANN inputs. Additionally, the models do not rely on historical meteorological data, such as humidity or temperature, making them particularly well-suited for deployment in locations lacking comprehensive weather monitoring systems.
Figure 8.
Low-cost methodology for predicting global solar irradiance using sky image camera and pyranometer.
Another study described in [96] presents a smart, real-time reforecasting method designed to improve intra-hour power predictions for a 48 MWe photovoltaic (PV) plant. This method leverages artificial neural network (ANN) optimization to enhance the accuracy of three baseline forecasting models: (1) A physical deterministic model based on cloud tracking; (2) An autoregressive moving average (ARMA) model; and (3) A k-Nearest Neighbor (kNN) model. Results show that the reforecasting method significantly improves forecast skill for all three models at 5, 10, and 15 min horizons.
A smart forecasting model for 1 min averaged direct normal irradiance (DNI), combining sky image processing with Artificial Neural Network (ANN) optimization is presented in [97]. The solution was developed over six months of high-resolution data, the models predict DNI for 5- and 10 min horizons and are tailored to both low and high DNI variability seasons. Techniques include deterministic and ANN-based forecasting, genetic algorithm (GA) optimization, and two validation methods: Cross Validation Method (CVM) and Randomized Training Method (RTM). The best-performing models for each season are integrated into a hybrid model, which is evaluated using independent test data. ANNs were trained with the Bayesian regularization process that uses the Levenberg–Marquardt optimization to minimize the error between the ANN’s output and the targets by adjusting the weights and biases.
A novel image-based method for forecasting short-term fluctuations in solar irradiance using sky images was presented in [98]. To achieve this, the authors propose a convolutional neural network (CNN) with residual blocks, designed to learn from a small sequence of sky images. This deep learning model captures both site-specific features (e.g., sun position variations by time of day and season) and general cloud dynamics (e.g., cloud movement, formation, and dissipation). The solution described in [99] presents the SolarNet, a pure CNN designed to forecast GHI one hour ahead, using only sky images, without relying on numerical weather data or manual feature engineering. SolarNet consists of a set of parallel CNN models, each producing fixed-step GHI forecasts. Each model includes 20 layers of convolution, max-pooling, and fully connected operations, learning the relationship between cloud patterns and irradiance in a fully end-to-end fashion. Another convolutional neural network (CNN)-based model to forecast 15 min-ahead PV power output is described in [100] using two input types: historical PV output data and ground-based sky images from the preceding 15 min. A key challenge addressed is how to effectively fuse these heterogeneous data sources within the CNN architecture to optimize forecasting accuracy. A novel multistep forecasting (MSF) approach for photovoltaic (PV) power ramp-rate control (PRRC) is presented in [101] which is based on Three-channel RGB 1500 × 1500-pixel images from sky images (SI). The algorithm is based on deep CNN, making it simpler and more practical for industrial deployment. The MSF method provides multiple short-term forecasts at high temporal resolution, offering more actionable information than conventional single-point forecasts. The study in [102] addresses some gaps in very short-term solar forecasting—specifically, predictions 10 to 60 min ahead—by leveraging two deep custom CNN models trained exclusively on sequences of sky images. In [103], the authors address the limitations of traditional time-series-based solar forecasting models, which struggle with capturing short-term, nonlinear spatiotemporal variations during cloudy periods. To overcome this, they propose a multi-modal fusion network CNN-based that integrates infrared sky images and past irradiance data for micro solar irradiance forecasting. Sky images provide rich spatio-temporal insights into local weather conditions at PV plants, while PV outputs from geographically distributed systems show strong regional correlations. To harness both, the study proposed in [104] introduces the Bi-level Spatio-Temporal (BILST) model using CNN-style spatio-temporal learning for PV nowcasting (see Figure 9). In this paper, the sky-image module extracts spatio-temporal features from a sequence of sky images captured by the all-sky imager installed at the target PV site. To achieve effective learning performance, the image sequence is pre-processed and applied deep neural networks to capture its latent features. The PV-data module is used for learning the global spatio-temporal correlations among PV-measurement datasets collected from several different PV sites (including the target PV site) spread over a certain geographical area.
Figure 9.
Bi-level spatio-temporal (BILST) nowcasting model.
A different study introduced in [105] shows an intra-day forecasting model for GHI that operates without requiring real-time measurements or on-site training data. Instead, the model estimates solar irradiance based on CNN with dense layers using only satellite imagery for GHI without ground sensors. An end-to-end short-term forecasting model was introduced in [106] which directly processes satellite imagery to predict solar irradiance. The model captures cloud motion dynamics by learning from stacked optical flow maps, which effectively represent temporal changes in cloud positions. The solution is also CNN-based and employs dynamic Regions of Interest (ROIs) to manage the large volume of satellite data. Another study presented in [107] introduces “SUNSET,” a specialized CNN designed to predict PV power output 15 min ahead using minute-averaged data. The model combines hybrid inputs—historical PV output and sky images—with strong regularization to improve accuracy. In the study [108], a CNN algorithm is also employed to perform “now-casting”—predicting current PV power output directly from sky images. The study also examines how CNN architecture—such as depth, width, and input image resolution—affects performance. The results demonstrate the potential of CNN-based sky image models for accurate short-term solar power forecasting. In study [109], a novel end-to-end deep learning approach is proposed to accurately estimate GHI, particularly under cloudy sky conditions where GHI exhibits strong nonstationary behavior. Unlike traditional methods that separate image feature extraction and regression into two disconnected steps, this work formulates GHI estimation as a single image regression task using a CNN. The proposed model integrates multilayer CNN architectures inspired by AlexNet and VGG, leveraging their nonlinear regression capabilities. A two-stage classification-prediction framework for contemporaneous (nowcast) PV power output prediction is described in [110] where the authors propose the use of sky images and compare its performance with an end-to-end CNN approach. In this work two classifiers are explored: (1) A CNN-based classifier trained using clear sky index (CSI) labels and (2) a non-parametric, physics-based classifier using a cloudiness threshold derived from sky images. The article [111] presents a forecasting model designed to predict the clear-sky index with a 20 min horizon at 1 min resolution. The model incorporates a classifier to determine sky conditions and an optical flow-based AI model (CNN-based model), specifically trained for each sky condition class. This tailored approach performs comparably to non-classified models but requires significantly less training data and achieves a forecast skill improvement of 5–20% over the smart persistence model across most sky conditions.
A very short-term solar radiation forecasting with lead times of 5 to 15 min was addressed in [112]. It introduces a Convolutional Neural Network (CNN) that processes sequences of infrared images from an all-sky imager to predict GHI across multiple time horizons. Using six months of high-resolution data from a real-world case study, the authors also propose an innovative variant: the Enhanced Convolutional Neural Network (ECNN). This model integrates exogenous inputs, such as measured solar radiation, by encoding them as colored pixel markers in a corner of the input images. The study introduced in [113] presents an advanced method for improving ultra-short-term solar irradiance forecasting using ground-based sky images. While many computer vision techniques have been applied to this field, effectively capturing spatiotemporal features from sequences of sky images remains a major challenge. To address this, the authors introduce a sparse spatio-temporal descriptor extraction designed to capture dynamic changes from continuous grayscale sky images (see Figure 10). This is enhanced using spatial pyramid pooling to refine feature quality. At the same time, a DenseNet and SPP-Net are applied to extract static and dynamic features from the most recent RGB sky image. Both dynamic and static features are then fused to enable multi-step forecasting of GHI.
Figure 10.
Overall framework of the proposed solar forecast method.
In [114], a hybrid deep learning-based mapping model for real-time PV power forecasting was proposed, which establishes a precise relationship between sky images and surface irradiance. The method involves: (1) preprocessing and feature extraction from sky images using a convolutional autoencoder, followed by K-means clustering to group similar sky conditions; (2) development of a hybrid deep learning CNN-based model to estimate surface irradiance based on clustered image features and (3) performance comparison with other deep learning models, including traditional CNN, LSTM, and ANN. In [115], the authors examine the relationship between sky images and the power output of three types of photovoltaic (PV) systems: fixed-tilt, single-axis tracking, and dual-axis tracking arrays. Building on this correlation analysis, they develop an image-based PV output nowcasting approach. Rather than feeding raw sky images directly into a convolutional neural network (CNN), the study introduces a pre-processing step to extract statistical features from the images. These extracted features are then used as input to a recurrent neural network (RNN) for short-term PV output prediction. Experimental results demonstrate that the proposed lightweight deep learning model delivers promising forecasting accuracy, making it an efficient and effective solution for nowcasting PV power output under various sky conditions. Another solution described in [116] presents a hybrid forecasting model combining a Convolutional Neural Network (CNN) and a Multilayer Perceptron (MLP) to predict GHI 15 min ahead. The model leverages data from a hemispherical sky imager, along with GHI time series and weather variables collected from a ground-based meteorological station in Morocco. Performance evaluations conducted across clear, mixed, and overcast conditions demonstrate that the CNN–MLP model significantly outperforms the traditional persistence model. The study developed in [117] introduces a hybrid model for intra-hour DNI forecasting with prediction horizons of 5, 10, and 15 min. The DNI forecast model can be divided into three main parts. The first part, responsible for image feature extraction, is a convolutional neural network (CNN). The second part is a MLP with the cloud fraction (CF) in the ROI and the clear-sky DNI forecast as inputs. The outputs of the CNN and the MLP networks are then fed to a Regression MLP, used to merge extracted features and forecast DNI at horizon H. The work presented in [118] proposes a hybrid deep learning framework that integrates ground data with satellite-derived cloud information. Using convolutional neural networks, the model captures cloud motion patterns from satellite images, while a long short-term memory (LSTM) network models the long-range spatio-temporal impact of clouds on PV output.
A 3D-CNN method is proposed for DNI forecasting using sequences of ground-based camera (GBC) images [119]. The solution recognizes that cloud motion significantly impacts DNI, the model leverages multiple consecutive images to capture both spatial textures and temporal dynamics. Unlike traditional CNNs, the 3D-CNN architecture processes data across both dimensions, making it particularly effective for extracting meaningful features from time-series image sequences. A novel approach using a three-dimensional (3D) convolutional neural network (CNN) to extract richer features from sky image sequences [120]. This 3D-CNN is trained efficiently on a large dataset, and various machine learning models are tested for GHI forecasting using these features.
A deep learning–based image processing method for short-term solar radiation forecasting was presented in [121]. The approach focuses on predicting 1 min average solar radiation values with a 5 min forecast horizon, using a combination of cloud motion tracking and extraterrestrial solar radiation data. Cloud classification is achieved through a method that combines K-means clustering with a red/blue color ratio to distinguish cloud pixels from sky. Finally, the forecast of short-term solar radiation is performed using a Long Short-Term Memory (LSTM) neural network. Another study in [122] discusses a novel system is proposed for accurate solar irradiance and PV power estimation using all-sky images. The method extracts regional and global features from these images, which are then used to generate input weights for a Long Short-Term Memory (LSTM) model to estimate solar irradiance. Subsequently, a solar power curve is constructed by combining the estimated irradiance with actual power output data to forecast PV power. The system’s performance is assessed using standard evaluation metrics. The work proposed in [123] explores the use of a long short-term memory (LSTM) deep learning model applied in forecasting cloud cover from sky images. Cloud cover data were extracted through image processing of sky images and used to train the model to predict cloud cover 10 min in advance. The predicted cloud cover values were then input into solar radiation models to estimate GH). Forecast accuracy was evaluated under three sky conditions: clear, partly cloudy, and overcast. This LSTM-based model significantly outperformed the persistence model, particularly under high irradiance variability such as on partly cloudy days. A novel multi-source forecasting framework for intra-hour photovoltaic (PV) power prediction solution was introduced in [124]. In this work, a flexible, data-driven architecture is developed that integrates local measurement data (LMD), numerical weather predictions (NWP), and satellite images. A specialized U-Net-based module is designed for extracting spatial features from satellite images, particularly shortwave radiation (SWR) fluxes. The structured data module employs an encoder–decoder structure enhanced with attention mechanisms (AM) and LSTM networks, allowing the model to robustly capture temporal dependencies across multiple variables.
A different study presented in [125] introduces an innovative method for improving photovoltaic (PV) power forecasting using satellite imagery, addressing the limitations of low update frequency of satellite images (typically hourly), and rapidly changing cloud patterns, which affect solar radiation and PV output. To overcome these challenges, the authors propose a multi-step forecasting approach that enhances the temporal relevance and spatial targeting of satellite-derived cloud data. In this a Convolutional long short-term memory (CLSTM) is applied on the hourly satellite image forecast, which takes the nonlinear cloud motion into account, providing more accurate cloud movement trajectories. Meanwhile, the thickness and shape changes in the cloud are also considered in the model. A ultra-short-term photovoltaic (PV) power forecasting method using multi-exposure high-resolution total sky images (TSIs) and deep learning was described in [126]. To maximize the utility of high-resolution imagery, an overlapping sliding window strategy is employed to extract both global and local image features. This forecasting method consists of four modules: a high-resolution image detection module, the multi-head self-attention layer, LSTM layer, and full-connection layer (see Figure 11). The core of the forecasting model is a convolutional long short-term memory (CLSTM) network enhanced with a multi-head self-attention mechanism, enabling the effective extraction of both spatial and temporal features critical for PV prediction.
Figure 11.
Proposed ultra-short-term photovoltaic power forecasting method.
Another solution uses a novel infrared sky imager mounted on a solar tracker that keeps the Sun centered in images while minimizing scattering from direct sunlight [127]. This setup enables extraction of detailed physical cloud features. By analyzing sequences of these infrared images, the method calculates the probability of the Sun being obscured by clouds (air parcels or voxels). Combining data from multiple sensors—including pyranometers, sky imagers, solar trackers, and weather stations—the study employs a multi-task deep learning model based on recurrent neural networks.
The study in [128] proposes a machine learning framework that combines both data sources—sky images and satellite observations—to enhance intra-hour irradiance forecasting (up to 60 min ahead). The model is evaluated under various weather conditions (clear-sky, cloudy, overcast) and input combinations (sky images, satellite data, and past irradiance values). The backbone of this architecture is ECLIPSE (Envisioning Cloud-Induced Perturbations in Solar Energy) [129]. The original model is composed of a spatial encoder (1) and a temporal encoder (2) to learn a spatio-temporal representation of past frames with 2D and 3D convolutions. Finally, future states are then iteratively predicted through a Gated Recurrent Unit (GRU) module (3). This integrated approach demonstrates the potential of unifying ground-based and satellite observations within a single ML framework, paving the way for more accurate and robust solar nowcasting systems.
Other work addresses the limited research on integrating image data with quantitative irradiance measures using deep learning by enhancing the current framework with gated architectures and introducing a transformer-based model [130]. Compared to traditional CNNs using late feature fusion, the transformer model with early fusion improved ramp event prediction accuracy by 9.43% (2 min) and 3.91% (6 min). The results also show that a single sky image’s predictive value diminishes beyond a 10 min forecast horizon. The proposed work advances the interpretability and adaptability of deep learning models using sky images. A novel multimodal learning framework is introduced for ultra-short-term forecasting of GHI was described in [131]. This approach combines two data modalities: (1) Historical and clear-sky GHI estimates, encoded using an Informer model and (2) Sky images, converted into optical flow maps and processed by a Vision Transformer. To effectively fuse these inputs, a cross-modality attention mechanism is developed in this work to capture the interactions between numerical and visual data. Another study demonstrates that a vision transformer (ViT)-based machine learning model can accurately estimate solar irradiance from sky images without the need for auxiliary input data [132]. The model is trained on a comprehensive dataset spanning 17 years, including measurements of global horizontal, diffuse, and direct irradiance captured using high-precision pyranometers and pyrheliometers, along with sky images from both fisheye (all-sky) and standard lens cameras. The work described in the paper [133] proposes a novel hybrid ultra-short-term PV generation forecasting framework based on cloud images. It combines a Vision Transformer (ViT) with a Gated Recurrent Unit (GRU) encoder to effectively analyze high-dimensional features, creating a hybrid solution. A Multi-Layer Perceptron (MLP) then produces one-step-ahead forecasts. Tested on real-world solar PV data, the framework outperforms several baseline methods, delivering more accurate ultra-short-term PV predictions.
According to the study presented in [134], authors claim that the accurate minute-level forecasting of individual PV power station output depends heavily on precise cloud distribution prediction, as cloud cover significantly affects solar generation. To address these issues, the study proposes advanced convolutional autoencoder (CAE)-based sky image prediction models, leveraging both 2D and 3D CAE architectures for more effective spatiotemporal feature extraction. A different work developed in [106] presents a novel end-to-end deep learning model for short-term solar irradiance forecasting using satellite images based on an autoencoder (AE) framework designed especially to serve multi-frame image learning tasks. The accuracy of solar forecast is improved as well due to the model’s ability of extracting dynamic motion features. Regions of interest (ROIs) are also introduced to solve the problem of determining satellite image sizes. Static ROIs scoped by the distribution of historical cloud velocities decide input shapes of learning models, and dynamic ROIs reduce the image feature redundancy by shifting receptive attention over time. A novel hybrid convolutional autoencoder-based method was introduced in [135] to extract cloud distribution features (CDFs) from sky images for solar irradiance forecasting. To enhance prediction accuracy, the authors develop an LSTM-FUSION model, which fuses features across time steps using a Long Short-Term Memory (LSTM) network. This fusion leverages the one-to-one correspondence between CDFs and GHI. Additionally, a new technique is proposed to determine the optimal input time step length based on attention distribution analysis, ensuring that the model effectively focuses on the most relevant temporal information.
Other authors in [136] demonstrate the development and evaluation of two short-term (3 h horizon) forecasting models for predicting photovoltaic (PV) energy production. The forecasting approach combines sky camera imagery with Artificial Intelligence (AI) techniques. Two different AI models were implemented and compared: one based on Multilayer Perceptron (MLP) and the other on a Support Vector Machine (SVM). Both models use predicted global irradiance derived from sky images as a key input. Additionally, the performance ratio—a measure of the plant’s operational condition—is incorporated to improve prediction accuracy. Another study exhibited in [137] introduces a sky-imaging system featuring a low-cost fisheye camera mounted on an automatic solar tracker. This system tracks the Sun’s trajectory and captures sky images centered on the Sun’s apparent position. To address this, a smart masking algorithm was developed to automatically analyze color gradients and segment the sky area from less-informative regions. After identifying the sky area, image features are extracted and used as exogenous inputs to a stochastic learning model, specifically, a MultiLayer Perceptron (MLP) to forecast intra-hour DNI.
A different study described in [138] presents an ultra-short-term photovoltaic power forecasting model based on cloud dynamics affecting sunlight. It includes three steps: (1) tracking sun-obscuring clouds using motion vectors, (2) extracting cloud features via image processing, and (3) predicting power with a radial basis function (RBF) neural network. Compared to an autoregressive (AR) model, the RBF approach improves accuracy, reducing error from 13.6% to 7.4%. The study introduced in [139] presents an innovative artificial intelligence-based method for real-time GHI nowcasting using sky images, with a particular focus on enhancing accuracy under cloudy conditions. The proposed model incorporates a Convolutional Block Attention Module (CBAM) into VGG-based neural network architecture, enabling more refined feature extraction from sky images. To further boost performance, the model integrates local cloud cover (LCC) as a numerical input alongside visual cloud features, enhancing the model’s ability to capture complex cloud dynamics affecting solar irradiance. Another paper presents a short-term solar irradiance forecasting method based on transfer learning, using Total Sky Imager (TSI) data from the Atmospheric Radiation Measurement (ARM) Southern Great Plains (SGP) site [140]. Accurate irradiance estimation from sky images is essential for improving short-term solar power forecasting and optimizing energy consumption strategies. This approach utilizes deep neural network architectures —specifically AlexNet and ResNet-101—to extract rich convolutional features from TSI (see Figure 12). The pre-processing block removes the rotating arm that appears in the sky images and is used to track the sun’s location. The extracted features from the deep neural network architectures are then processed using an ensemble learning framework to forecast solar radiation. It uses multiple decision tree-based models to separately forecast 5 min, 10 min, and 15 min ahead.
Figure 12.
Block diagram of the short-term solar radiation forecast approach.
Other study introduces an innovative approach to 15 min ahead solar irradiance forecasting combining machine learning methods, satellite imagery, and meteorological data [141]. The Machine Learning techniques adopted are the Single-Hidden Layer Feed Forward Neural Network plus Softmax function (SHLNN), the Double-Hidden Layer Feed Forward Neural Network plus Softmax function (DHLNN) with categorical and continuous data delivered in two different input layers, and the Random Forest (RF) technique. The focus of this paper is on improving forecast accuracy while minimizing computational effort. Another work presented introduces a photovoltaic (PV) energy forecasting model capable of generating high-resolution energy yield forecasts at 1 s intervals for up to 15 min ahead [142]. In this paper a NARX (non-linear auto-regressive with exogenous input) neural network was selected to model energy yield, due to its ability to account for system history and future sky conditions using RGB forecasts. The chosen architecture includes two hidden layers and uses 70% of data for training and 30% for testing/validation. The paper introduced in [143] introduces a novel generative approach for regional solar forecasting across flexible spatial scales. The method involves the creation of solar irradiance maps (SIMs) for the first time using spatial Kriging interpolation applied to satellite-derived irradiance data. These sequential SIMs capture the spatiotemporal dynamics of solar irradiance and are used as inputs to a multi-scale Generative Adversarial Network (GAN) (Generative Model Based on ANN), which predicts the next-step irradiance maps. These predicted SIMs are then converted into PV power output using an irradiance-to-power conversion model.
Reference [144] explores how combining various solar irradiance forecasting models can improve prediction accuracy. The study integrates four all-sky imager (ASI)-based models, two satellite-based models, and one data-driven model, using two blending strategies: general and horizon-specific. Linear and random forest (RF) models are employed to generate one-minute resolution forecasts of GHI and DNI up to 90 min ahead. Findings show that the general blending strategy with the RF model delivers the most accurate forecasts. In paper [145], a novel machine learning approach is introduced for short-term solar irradiance forecasting using sky images. The solution is based on two machine learning algorithms, namely the Random Forest (RF) and the k-Nearest Neighbors (kNN). The algorithms extract key visual features from the images and apply learning-based models to estimate GHI. These results achieved are competitive compared to the state-of-the-art algorithms, while utilizing computationally efficient techniques for the nowcasting and forecasting of surface irradiance.
Another paper presented in [146] focuses on developing a smart forecasting model to generate intra-hour Prediction Intervals (PIs) for one-minute averaged DNI, which is known for its high variability due to cloud cover. The proposed model combines Support Vector Machines (SVM) and Artificial Neural Networks (ANN). Inputs to the model include lagged time series data of local-sensing variables—specifically DNI and diffuse irradiance. Reference [147] addresses the challenge of solar energy instability caused by cloud-induced Sun occlusion. It introduces a novel method for visualizing wind velocity fields from sequences of longwave infrared cloud images. Using unsupervised learning, the method identifies the distribution of cloud velocity vectors and heights within these complex wind patterns. To extend and predict cloud movement across the entire image frame, the approach employs a multi-output weighted SVM with flow constraints. A solar power forecasting model that uses various satellite images—including atmospheric motion vectors (AMVs), cloud, and irradiance images—combined with a Support Vector Machine (SVM) learning approach was presented in [148]. The satellite images provide a broad, macroscopic view of cloud amount and movement, which enhances forecasting accuracy. The SVM model is designed to minimize prediction errors while maximizing its ability to generalize. Also, the study introduces a method to extract AMVs from satellite data to forecast cloud motion effectively. Another work described in [149] proposes a minute-level solar irradiance forecasting method based on a real-time surface irradiance mapping model derived from all-sky images. The approach aims to enhance the accuracy of short-term solar power forecasts. The method involves essentially two methods, the backpropagation neural network (BPNN) and SVM.
A novel all-sky imager (ASI) nowcasting system and benchmarks its performance against three alternatives: a conventional ASI method, a satellite-based nowcasting system, and a persistence model were described in [150]. These nowcasts are also integrated into a hybrid model, which achieves enhanced accuracy. ASI systems use fisheye sky images to monitor cloud conditions and forecast solar irradiance. The proposed method leverages a machine-learning (ML) based approach called Linear-Times-dependent regression that directly analyzes pixel values and other image features. To train and validate the ASI and hybrid models, irradiance data are collected from a network of eight measurement stations within a 10 km radius of the imaging camera. Another work described in [151], combines the radiance measurements with clear-sky irradiance estimates to perform nowcasting of PV energy production across peninsular Spain. Four machine learning models are employed: Two linear models (Lasso regression and linear Support Vector Regression (SVR)) and two nonlinear models (Multilayer Perceptrons (MLPs) and Gaussian SVR). A clear-sky persistence model is used as a baseline for comparison, evaluated over forecast horizons of up to 6 h. Reference [152] presents a novel system for short-term solar irradiance forecasting that employs multiple total sky imagers (TSIs). The system introduces an advanced method for 3D cloud detection and tracking, which is combined with a forecasting pipeline that utilizes cloud image features to forecast the surface radiation. To ensure the uniformity of the TSI and consistency of cloud movements, the cloud projection area and its counterparts in other TSI were constrained to have the same dimensions, without scaling or shearing (see Figure 13). The method proposes four irradiance models, each using some or all of these features to establish either linear or non-linear relationships: (1) linear RBR (Red-Blue Ratio) delta, (2) ordinary linear regression, (3) Support Vector Regression (SVR) with a linear kernel, and (4) SVR with a non-linear kernel.
Figure 13.
Overview of two-TSI tracking with the corresponding cloud projection area.
The study expressed in [153] presents SkyGPT, a novel physics-constrained stochastic video prediction model that leverages recent advances in generative AI to forecast realistic future sky images based on historical sky imagery. SkyGPT effectively models cloud dynamics, generating high-quality, diverse future sky sequences. When integrated with a U-Net-based PV power forecasting model, SkyGPT enables 15 min-ahead probabilistic PV output forecasting using real-world data from a 30 kW rooftop system. Reference [154] proposes a new short-term solar radiation forecasting method called Cloud Index Advection and Diffusion Cast (CIADCast). This method combines Meteosat Second Generation (MSG) satellite cloud index images with the Weather Research and Forecasting (WRF) model to predict cloud movement and diffusion. The forecasted cloud index is then converted into GHI and DNI forecasts using the Heliosat-2 technique. Cloud index image data is integrated into WRF layers corresponding to cloud heights measured by a ceilometer, enabling forecasts up to 6 h ahead with 15 min intervals. The authors of the study [155] introduce the development of a data processing method to extract cloud dynamic features from raw sky images and GSI measurements, aimed at improving solar forecasting while minimizing hardware maintenance. This investigation introduces a hybrid approach based on the clear sky physical model of the scattered atmospheric radiation and the Sun’s direct radiation to process IR sky images and a hybrid ML model called linear Support Vector for Classification (SVC) is proposed that predicts the optimal parameters. A hybrid forecasting method for predicting one-minute averaged solar irradiance up to 10 min ahead was presented in [156]. This approach integrates real-time all-sky images and irradiance measurements, which are jointly processed to estimate cloud motion and forecast the future obstruction of the sun disk by clouds. The process begins with offline camera calibration. Then the cloud detection uses the Fixed Threshold and Clear Sky Library (CSL) methods on the red-to-blue ratio. The Cloud displacement estimation involves reversing the camera’s projection and applying cross-correlation method (CCM) to image pairs. A Flowchart of the main processing steps involved in this approach is presented in Figure 14 where the two-input data are all-sky images and real-time GHI time series, which are used to forecast GHI one to ten minutes in advance.
Figure 14.
Flow chart of the main processing steps involved in the solar forecasting solution based on all-sky images and real-time GHI time series.
The approach introduced in [157] uses a network of seven affordable hemispheric sky-imaging cameras with CMOS sensors to capture sky images whose pixel color intensities show a strong correlation with solar irradiance. To establish this relationship, an Image-to-Irradiance (I2I) algorithm was developed, enabling the extraction of all solar irradiance components—GHI, DNI, and DHI—from the images. Spatial interpolation via the Kriging method is then applied to estimate the irradiance distribution across the entire basin. The method was assessed through cross-validation and benchmarked against satellite-derived GHI data with a 15 min temporal resolution. Reference [158] presents a cost-effective, real-time multi-task solar forecasting method aimed at optimizing energy dispatch and increasing photovoltaic (PV) integration into power grids. It predicts GHI by estimating cloud motion from sequences of sky images captured with a low-cost infrared imager on a solar tracker. Using kernel learning techniques, the model relates cloud features to the clear sky index to produce forecasts at 1 min intervals up to 8 min ahead, achieving a forecasting skill of 16.48%, an improvement over previous method. Another reference introduces a novel approach to intra-hour forecasting of DNI with lead times of up to 30 min [159]. The method leverages the decomposition of DNI into two components: clear-sky DNI and the clear-sky index. The Clear-sky DNI is predicted using an empirical model based on historical DNI measurements and assumes persistence in atmospheric turbidity. The clear-sky index is predicted using High Dynamic Range (HDR) sky images generated within the CSPIMP (Concentrating Solar Power plant efficiency IMProvement) project. The forecasting approach employs an Adaptive Network-based Fuzzy Inference System (ANFIS), which is improved through a hybrid algorithm drawing on classification and thresholding methods described in prior studies [160,161].
A deep learning approach to model the relationship between sky appearance and short-term photovoltaic (PV) power output was described in [162] where several neural network architectures are trained using historical PV power data and corresponding sky images to predict PV output in the immediate future. Three model types are compared: a multi-layer perceptron (MLP), a convolutional neural network (CNN), and a long short-term memory (LSTM) network. The paper presented in [163] evaluates and compares four widely used deep learning (DL) architectures for forecasting solar irradiance using sequences of hemispherical sky images combined with additional external data. The four common deep learning architectures are the CNN, CNN + LSTM, 3D-CNN and a convolutional long short-term memory network (CLSTM). To a certain extent, these are representative of the current state of the field as they share similar designs: convolutional layers, recurrent layers and densely connected layers trained end-to-end to predict a future irradiance value. Similarly, in [164], the authors introduce and compare a series of innovative deep learning architectures for very short-term solar PV generation forecasting, targeting lookahead times ranging from 4 to 20 min. The comparison is made in these models: CLSTM, CLSTM-H, CNN-LSTM, CNN-LSTM-H, PREDNET (Predictive Coding Network), PREDNET-H, PM (persistence model), SPM (the smart persistence model), SLNN (simple machine learning model), SLNN-weather, Static Image Only and Static Image Hybrid. These models leverage both static whole-sky images and dynamic sky image sequences to enhance forecasting accuracy. The study systematically explores multiple deep learning configurations, integrating image-based features from both individual frames and image streams.
In another reference the authors quantitatively evaluate the impact of cloud transmittance and cloud velocity on the accuracy of short-term DNI forecasts [165]. The methodology begins with DNI forecasting using manually detected cloud velocity, incorporating both invariant and real-time sky and cloud transmittance inputs. Cloud velocity is manually determined by visually comparing two consecutive sky images, measuring the displacement of clouds using an e-ruler to compute their speed and direction. Additionally, the proposed study compares four automated cloud velocity estimation methods (Scale-Invariant Feature Transform (SIFT) [166], Optical Flow (OF) [167], Cross-Correlation [168], and Particle Image Velocimetry (PIV) [169]) against the manual detections to evaluate their accuracy. The authors of the study described in [170] present a method for intra-hour, sub-kilometer cloud and irradiance nowcasting using a ground-based sky imager at the University of California, San Diego. Sky images captured every 30 s were processed to estimate sky cover using a clear sky library and sunshine parameter. A two-dimensional cloud map was generated to forecast surface cloud shadows. Validation across four partly cloudy days showed a 70% accuracy in predicting binary cloud conditions at six pyranometer stations within a 2 km2 area. Cloud motion vectors were derived through image cross-correlation, and cloud positions up to 5 min ahead were forecasted via advection. The study presented in [171] focuses on accurately nowcasting DNI up to 15 min in advance to improve the efficiency of concentrating solar power (CSP) plants. The approach uses data from four spatially distributed ground-based all-sky imagers (ASIs) and introduces a novel object-oriented method for cloud tracking. A key innovation of this solution is the use of a 3D voxel carving technique to model each detected cloud as a distinct object, characterized by attributes such as height, position, surface area, volume, transmittance, and motion vector. A different solution is described in [172] where a statistical method is presented for deriving cloud motion vector fields using a Bayesian-based algorithm. This approach offers high accuracy with low computational cost, making it well-suited for short-term forecasting of cloud movement and solar irradiance. By applying the estimated motion vectors to satellite images, the method predicts future cloud positions and corresponding irradiance levels for upcoming time steps. The article [173] introduces a novel method for estimating cloud transmittance, based on historical and recent cloud height and transmittance measurements. The required cloud height is measured with a stereoscopic method. For these unshaded clouds, the method estimates transmittance using: (1) Cloud height measurements; (2) A probabilistic model based on historical cloud height–transmittance relationships and (3) Recent transmittance data paired with corresponding cloud heights. Cloud height is determined using a stereoscopic technique with two all-sky imagers (ASIs). The study also examines the influence of site-specific conditions and discusses integrating automatic cloud classification to enhance the estimation process. In [174], a new method—PCPOW—is proposed to improve the accuracy of cloud motion speed estimation for minute-level PV power forecasting. Since cloud movement directly impacts solar irradiance, accurately tracking it is essential. Traditional single-method approaches struggle with complex cloud dynamics. PCPOW combines cloud pattern classification and particle swarm optimization (PSO). First, k-means clustering and texture features from a gray-level co-occurrence matrix classify cloud types. Then, customized models are applied to each class to calculate cloud motion speed more accurately. Tested with real data from the Yunnan Electric Power Research Institute, the method significantly enhances displacement accuracy, improving short-term PV power predictions. Reference [175] introduces a shadow camera system capable of generating spatially resolved maps for DNI, GHI and Global Tilted Irradiance (GTI). These irradiance maps serve two key purposes: (1) providing spatial averages to benchmark all-sky imager-based nowcasting systems, and (2) offering potential for real-time plant operation support and use as a standalone nowcasting system. The system comprises six cameras capturing images that are processed into an ortho-normalized image (orthoimage). This work validates GHI and DNI forecasts from a four-camera system called WobaS-4cam, deployed at two solar research centers and a commercial 50-MW PV plant. The working principle of the WobaS all-sky imager-based nowcasting system can be seen in Figure 15. The WobaS all-sky imager–based nowcasting system operates by using all-sky imagers (ASIs) to detect, 3D-locate, and track clouds. By projecting the resulting cloud shadows onto the ground, the system can estimate future irradiance with high spatial and temporal resolution.
Figure 15.
Working principle of the WobaS all-sky imager-based nowcasting solution with a flow chart of the main stategy.
In [176], researchers introduce a novel parameter called the Sun-Blocking Index (SBI) to better model the partial obstruction of the Sun by clouds, thereby improving solar irradiance estimation under variable weather conditions. An image processing algorithm is developed to compute the SBI from sky images. By establishing a correlation between SBI and the clearness index, the model incorporates SBI-adjusted clearness values into solar radiation calculations. Once the correlation between the clearness index and SBI is established, the SBI-dependent clearness index is applied to solar radiation models. Table 9 provides a summary of the methods, techniques, and respective references that will be discussed in the subsequent sections on computer vision and image processing applied to solar PV forecasting.
Table 9.
Methods and Techniques adopted in Computer vision for solar forecasting.
This section reviews computer vision and deep learning methods used for short-term solar photovoltaic (PV) forecasting, focusing mainly on sky-camera and satellite imagery. It explains how cloud detection, tracking, and motion prediction are essential for forecasting solar irradiance and PV power. The review highlights a wide range of approaches—including CNNs, LSTMs, hybrid models, optical flow, autoencoders, and transformer-based architectures—showing how visual data can significantly improve forecast accuracy from seconds to hours ahead. Comparability of the accuracy metrics is made difficult because the studies listed in Table 9 employ different image datasets and that are not always fully characterized and available as shown in Table 10. This table shows the information about methods and techniques adopted in computer vision in solar forecasting, where most databases are not publicly available, which makes it very difficult to perform a fair and clear comparison.
Table 10.
Database information about the Methods and Techniques adopted in Computer vision for solar forecasting (all website links accessed on 18 November 2025).
Across the diverse body of research on short-term and intra-hour solar PV forecasting, several recurring limitations and failure modes emerge. These challenges appear consistently in approaches relying on sky imagery, satellite data, cloud-tracking algorithms, machine learning (ML), and deep learning (DL), such as:
- Limited Generalization Across Sites, Seasons, and Weather Regimes;
- Heterogeneous Datasets and Lack of Standard Benchmarks;
- Field-of-View Constraints and Spatial-Scale Mismatch;
- Cloud Motion Estimation Errors;
- Sun-Region Artifacts and Camera Limitations;
- Limited Treatment of Uncertainty and Extreme Events
- Underrepresentation of Ramp and Event-Based Evaluation;
- Computational Complexity and Deployment Constraints;
- Dependence on Proprietary or Non-Standard Hardware,
Overall, the literature shows strong progress in exploiting sky images, satellite products, and Machine Learning (ML)/Deep Learning (DP) architectures for ultra-short-term solar forecasting. However, generalization, robustness, uncertainty, and real-world deployment remain major open challenges. Addressing these limitations through standardized datasets, cross-site validation, probabilistic modeling, and computational efficiency is essential for translating research models into operational forecasting tools.
4.4. Detection of Clean/Unclean PV Modules
Dust accumulation on PV surfaces has detrimental effects, including reduced efficiency and power output [177]. Dust particles block sunlight, hindering power generation. Furthermore, prolonged dust deposition leads to diminished energy output and accelerated system degradation, ultimately reducing the lifespan of PV systems. In desert and arid regions, solar power plants face harsh environmental conditions, particularly dust accumulation and limited rainfall, which significantly reduce the efficiency of photovoltaic (PV) panels. Another factor with a negative effect on the electricity generation of a photovoltaic cell is the snow layer that occurs in countries with snowy climates. In these locations, the energy loss resulting from partial or full snow coverage on PV panels significantly reduces renewable energy efficiency. Consequently, regular cleaning is essential for maximizing performance and ensuring the durability of PV systems. Accurately identifying dust and snow accumulation on PV surfaces is crucial for maintaining efficiency and extending system lifespan. Figure 16 shows RGB images of photovoltaic panels containing dust and snow on their surface. Figure 16a,b are used in single classification of the PV panel fault, while Figure 16c is used in the detection and classification of multi-class fault types.
Figure 16.
Examples of two types of dirt on the PV panel surfaces (a) Dust; (b) Snow; (c) Dust and bird drop.
Current methods heavily rely on manual inspections, which are labor-intensive, time-consuming, and prone to human error [178]. These inspections require specialists to manually access and visually examine each panel, presenting significant challenges for large-scale installations or those located in remote areas. Furthermore, manual checks increase maintenance costs and expose workers to potential safety hazards. Solar energy production is a clean, renewable, and low-carbon energy source, serving as an alternative to fossil fuels. However, the locations chosen for the installation of solar parks often do not present the best environmental conditions, which can lead to a reduction in the energy production efficiency of photovoltaic panels. Among the environmental factors that influence the energy efficiency of the panels are high temperature and humidity, and excessive dust. To reduce power losses caused by dust accumulation on solar panel surfaces, it have been implemented several state-of-the-art image classification models based on deep learning networks have been implemented.
The image dataset used to train and test these deep learning models allows the analysis of their performance in detection and classification (see Figure 17). In the detection of clean/unclean PV modules, three different tasks can be identified: detection, classification, and a combination of both. In the reviewed works, various CNN models are used to perform these tasks, including models that execute only detection (e.g., R-CNN), only classification (e.g., SqueezeNet), and models that handle both tasks simultaneously (e.g., YOLO). One of the main architectural differences between detection models and classification models lies in the design of the network head, which determines the structure and purpose of the output.
Figure 17.
Deep-learning models for detection of dust in PV models.
To enhance data quality and subsequently improve model performance, data augmentation techniques are frequently employed in both detection and classification tasks. Alatwi et al. [179] uses several state-of-the-art deep learning-based models for feature extraction as the input to feed into a SVM image classifier for dusty solar panel detection. Among the tested deep learning-based models, it was obtained the maximum classification of 86.79% when the images were encoded with the pre-trained model of DenseNet169 and then used these encodings with a linear SVM for image classification.
A computer vision-based approach to detect soil and dust on PV surfaces was proposed by [180]. After PV detection, the proposed approach extracts several features and feeds into a classifier to perform the classification. Although the obtained results show high recognition rates the tested images include only PV panels of the same type and size containing dust and soil. The amount and characteristics of depositions determine the cost and the frequency of the cleaning process. Hanafy et al. [181] proposes a machine learning approach to determine the amount of dust in PV modules using terrestrial and aerial images. In countries with snowy climates face negative effects in electricity generation of a photovoltaic cell it is crucial to detect and remove the snow layer on the solar panels. A deep learning-based approach for detecting snowy conditions on solar panels was presented in [182]. A method for detecting and monitoring sand deposition (wind-blown dust) on photovoltaic (PV) panels in arid environments using multitemporal remote sensing data was described in [183]. The research focuses on the Bhadla Solar Park in Rajasthan, India, a region frequently impacted by sandstorms from westerly and north-westerly winds. The proposed method highlights the effectiveness of the application in cost-effective and near-real-time monitoring of PV soiling. These types of methods allow solar operators to develop proactive cleaning and maintenance strategies, improving PV performance in desert environments. Efficiency loss in photovoltaic (PV) panels, particularly in power stations exposed to varied soil types and high winds, has highlighted the need for automated condition monitoring systems. In [184], three semantic segmentation approaches were evaluated to detect and assess PV panel soiling or degradation. Results showed that supervised ML models offered the best trade-off between accuracy, speed, and resource efficiency. In contrast, deep learning models excelled in handling non-standardized or low-quality image inputs, offering greater robustness in less controlled environments. Solar power plants in desert and arid regions face harsh environmental conditions, particularly dust accumulation and limited rainfall, which significantly reduce the efficiency of photovoltaic (PV) panels. Once dust levels exceed a certain threshold, cleaning becomes essential to restore performance. In the study presented in [185], the authors propose a novel low-cost image processing-based system that quantifies dust accumulation on the surface of PV panels and estimates the resulting power loss due to soiling. This approach offers a precise solution for monitoring soiling and optimizing maintenance in PV installations. Environmental factors such as solar irradiance, module temperature, dust accumulation, and shading critically influence the energy output of photovoltaic (PV) power plants, with soiling levels highly dependent on installation location. The impact of dust density on PV efficiency using controlled laboratory conditions with an artificial light source was proposed by [186]. Power outputs were measured for three levels of dust accumulation, and corresponding images of PV modules were captured. The proposed method demonstrates the effectiveness of image-based analysis for automated assessment of soiling effects on PV performance. (Onim et al., 2023) developed a new image dataset of clean and dust-covered solar panels and used it to evaluate current state-of-the-art classification algorithms for detecting dust on PV panels [187]. In future research the dataset can be extended for multiclass classification. A method for automatically detecting and classifying contaminated photovoltaic (PV) panels using RGB images captured by UAVs is described in [188]. It focuses on water-based photovoltaic installations, which are a growing renewable energy sector that does not occupy land resources but lacks effective monitoring systems. The obtained results demonstrate the model’s effectiveness in visual localization and classification of soiled PV panels offering a practical solution for improving the operation and maintenance of floating PV systems. Evaluating dust accumulation on photovoltaic (PV) panels is crucial for planning cleaning schedules and ensuring reliable grid integration. A novel image enhancement algorithm based on similarity minimization to obtain the transmittance was proposed in [189]. By minimizing pixel differences between these images, a mathematical relationship is established between model coefficients and dust levels. An experimental setup was used to collect RGB images of PV panels under varying dust conditions. Results show that the methodology is suitable for automated PV maintenance systems providing a practical tool for smart cleaning operations. A critical issue that disrupts thermal balance across photovoltaic panels and significantly reduces both power output and lifespan is the uneven dust accumulation on their surfaces. In [190] a method is proposed to estimate regional dust concentration offering a reliable and precise solution for detecting non-uniform dust accumulation as well as supporting smarter maintenance and operation of PV systems.
Energy loss from partial or full snow coverage on photovoltaic (PV) panels significantly reduces renewable energy efficiency in cold climates. The efficiency reduction in solar photovoltaic systems impacts in its economic viability. A new method using image processing and deep learning to quantify snow’s impact on installed PV panels is presented in [191]. This approach highlights how deep learning and remote imaging can effectively monitor snow coverage on PV panels to improve energy production in cold regions. Despite existing methods for detecting snow accumulation on the surface of photovoltaic panels, real-time detection and precise quantification of energy loss remain areas for further exploration. The detection of snow cover on photovoltaic panels using a deep learning model was proposed by [192]. This model allows maximizing solar energy conversion by obtaining a prediction of energy losses on solar panels close to real-world data, with an error of less than 5% in predicting snow cover. A lightweight deep learning model for PV panel fault detection was presented by [193]. It uses a Vanilla SqueezeNet model that can generalize effectively from limited samples of labeled classes. With its few parameters and reduced model size, the SqueezeNet model can be stored directly on an embedded device for real-time applications.
Several studies have investigated snow detection using fixed-camera setups, which are limited by their stationary viewpoints and lack of scalability. To address these constraints, Saleem et al. [194] proposed an automated deep learning approach that utilizes drone imagery to detect and quantify snow coverage on solar panels. The proposed approach improves power forecasting and supports more effective snow removal strategies under winter conditions. It estimates snow coverage percentages to inform snow management decisions, reduce downtime, and maximize power generation. By reliably detecting snow-covered solar panels, the method enables more efficient use of heating-based snow removal techniques, restoring photovoltaic systems to normal operation more quickly. Qualitative and quantitative analyses are conducted to highlight the framework’s strengths and weaknesses across different environmental conditions.
The detection and classification performance model analysis for snow-covered solar panel images, called BIDA-CNN, is described in [195]. The detection analysis is based on three backbones to detect the three categories of solar panels (all_snow, no_snow, and partial) and in the classification analysis it is used five deep learning models are trained, validated, and tested under different conditions. The accuracy results of the model outperformed other models also evaluated in this study.
The authors in [196] propose a system to help operators decide the optimal timing for cleaning photovoltaic modules. An Unmanned Aerial Vehicle (UAV) captures RGB images of the PV panels and those images are fed into specialized computer vision techniques to calculate the soiling rate on the modules. An autonomous soiling detection model for inspecting solar photovoltaic (PV) panels using aerial RGB images acquired by an UAV was presented by [197]. The proposed approach, named SDS-YOLO, focuses on the detection of small bird droppings and dust, which constitutes a challenging task because these types of dirt are often small in size and do not exhibit specific color characteristics. This task is critical due to the difficulty in cleaning bird droppings from solar panels through natural processes like rain, as well as the formation of hot spots—factors that affect photovoltaic energy production. The efficiency reduction in photovoltaic energy production can also be caused by decrease in the PV modules’ efficiency due to failures or malfunctions operating conditions. The use of a convolutional neural network to classify anomaly conditions (cell breakage, delamination, dust, dirt and bird droppings) using thermographic images was proposed by [198]. The proposed approach shows an accuracy of 98% and a maximum execution time of 2 min. Depending on the model configuration.
In utility-scale photovoltaic installations, physical fault detection at the module level predominantly employs infrared thermography and electroluminescence imaging. However, these modalities can hinder precise attribution of the fault’s origin within the broader plant context. Espinosa et al. [199] presents a convolutional neural network that uses RGB images for semantic segmentation and classification to detect physical faults in PV plants. Some of the identified faults include breakages, shadows, and dust that cannot be easily detected.
Among the various methods, vision-based inspection has gained prominence due to the continuous advancements in camera technologies, graphics processing unit architectures, artificial intelligence and computer vision algorithms. Table 11 shows the methods used in dust and snow PV panel detection, the characteristics of the images used, as well as the accuracy results in their detection.
Table 11.
Methodologies used in dust and snow detection and classification for solar panels.
Table 12 lists the links to the public datasets used in dust and snow detection, facilitating benchmarking and future research. Furthermore, some databases that were previously referenced as unavailable are, in fact, based on public sources.
Table 12.
Databases used for each work in dust and snow detection and classification for solar panels (all website links accessed on 18 November 2025).
Since 2020, there has been an increased adoption of deep learning models in place of machine learning models, which require significant domain expertise and are a time-consuming process (Table 11). The studies presented in Table 12 employ different datasets that are not always fully characterized. Crucially, essential factors that influence model performance—such as image size, the percentage split for training and testing, and the used data augmentation techniques are often incompletely described. This collective lack of detail prevents a direct comparison of the overall accuracy obtained by each type of algorithm for detecting dust and snow in solar panels. Another factor that makes it difficult to directly compare the performance of the methodologies implemented in the studies described in Table 11 is the variation in metrics used, such as accuracy, precision, recall, F1-Score, Dice coefficient, mean AP, and average recognition rate.
The work carried out reveals a future need for a faster, more robust, and more accurate deep learning model for use in real-time scenarios. Furthermore, the study highlights the necessity of a significantly larger dataset to ensure the model’s broad applicability across diverse solar systems. This dataset should include:
- -
- A greater variety of classes (e.g., broken panels, inhomogeneous dust particles, and wet panels);
- -
- Additional factors such as environmental variables, particle size, and distribution uniformity;
- -
- Images captured under various lighting conditions and featuring photovoltaic panels of different sizes and orientations.
4.5. Advanced Computer Vision Techniques: Fault Detection and Classification of PV Modules
PV modules endure diverse environmental pressures and challenging conditions throughout their lifetime, which can impact their consistent and enduring operation. Thus, considering these environmental factors and conditions that PV modules and cells are exposed to, it is vital to employ precise measurement and regular monitoring methods to maintain their efficiency and durability. Given the increasing adoption of photovoltaic (PV) technology and the installation of large-scale PV systems globally, the automation of PV monitoring methods has become crucial. Manual or visual monitoring approaches have limited applicability and are suitable only for small-scale operations. Furthermore, visual inspection is a laborious, time-intensive, and costly endeavor. Additionally, visual inspection is prone to human error and requires specialized expertise to analyze and interpret the module images. In light of these limitations, automatic monitoring and remote inspection methods have garnered substantial interest from researchers in recent years.
The faults that could occur in PV modules can be divided into three main groups: physical faults, environmental faults and electrical faults [200].
A Python-based web application for real time data processing and classification of different type faults was developed by [201]. It is a tool that incorporates several CNN architectures for testing the detection and classification of faults in PV panels. Pre-trained models such as ResNet50, VGG16 and InceptionV3 were used with specific dataset containing RGB images, infrared images and Electroluminescence Imaging in performing feature extraction and classification. The developed tool permits to the operators and technicians the continuous monitoring of the system and quick and accurate feedback to aid in photovoltaic system maintenance.
The following subsection will address the works that addressed the detection of these faults through artificial vision.
4.5.1. Physical Faults
The physical faults that occur in photovoltaic (PV) arrays are typically caused by either mechanical stress or the inherent properties of the materials used in their manufacturing. The various types of failures and faults that can occur in PV modules are due to both internal and external factors, such as:
- Failure in the encapsulation
Encapsulation failure typically involves delamination and/or discoloration due to factors such as harsh environmental conditions, contamination, salt accumulation, moisture penetration, and other causes. In the case of the discoloration, it will reduce the optical transmission, leading to a decline in module performance. According to [202], encapsulant discoloration is the most commonly observed failure mode in older PV modules. Encapsulant delamination can lead to the appearance of corrosion in PV modules.
Unmanned aerial vehicles to capture images of photovoltaic modules with delamination, burn marks, glass breakage, discoloration, and snail trails fault types was presented by [203]. Each fault condition contains a unique image pattern that is extracted using AlexNet convolutional neural networks and classified with the help of decision tree algorithms. The classification is carried out with several decision tree algorithms and the obtained accuracies are compared to suggest the best-in-class algorithm for real-time application. Among all the available tree-based algorithms, the random forest algorithm produced a maximum classification accuracy of 98.25% with a computational time of 0.89 s. An approach using two voting-based ensemble models combining support vector machines and k-nearest neighbor were developed by [204] for classifying the same fault types. Results show that the proposed approach achieved an accuracy of 98.30% reducing inspection costs and instrument monitoring efforts contributing to the sustainable and efficient operation of PV systems.
- Degradation fault
The degradation can occur in the crystalline silicon modules or by the physical reaction as a result of the p-n junction of a PV cell. The first type of degradation is called potential-induced degradation and is caused by stray currents in most ungrounded PV systems. The other degradation type, called light-induced power degradation, shows a loss in silicon solar cell efficiency resulting from a reduction in the short-circuit current and open-circuit voltage of the solar cell [205]. To maximize power output and maintain the long-term reliability of PV modules, faults must be diagnosed at an early stage. A solar module fault detection using infrared thermography and a fuzzy logic classifier was proposed by [206]. The fuzzy rule base was defined by the knowledge of several faults in the form of hot-spot formation on PV modules and the input features used in the If-Then fuzzy rules are the matching score and the panel temperature. The proposed fault detection algorithm allows the technical department to plan required actions and facilitates the improvement of the system’s overall reliability.
- Cell cracks
Any defect arising during the manufacturing or packaging stages can adversely affect the power output of photovoltaic (PV) cells. Excessive mechanical stress applied during packaging or transportation may induce cracks within the cell structure [205]. As PV cells undergo aging, the probability of crack occurrence correspondingly increases. Such cracks may develop either within the silicon substrate of the PV module or across various layers of its lamination. Micro-cracks, which are imperceptible to the naked eye, can be effectively identified through the Electroluminescence (EL) technique. EL imaging facilitates the visualization of local irregularities and structural non-uniformities within each cell, providing superior spatial resolution for micro-crack detection relative to alternative methods such as lock-in thermography [207]. Recent studies have explored advanced convolutional neural network (CNN) architectures for the classification of micro-cracks in EL images of PV modules [208]. Pretrained models, including VGG-16, VGG-19, Inception-v3, Inception-ResNet50-v2, ResNet50-v2, and Xception, were independently evaluated and subsequently integrated using an ensemble learning framework. The ensemble approach demonstrated enhanced micro-crack classification performance, achieving detection accuracies of 96.97% and 97.06% for monocrystalline and polycrystalline solar panels, respectively. The acquisition of high-quality data, particularly in the form of EL images of PV cells, poses a significant challenge due to the scarcity of open-source datasets. This limitation constrains the advancement of automated quality inspection systems within the domain of PV module evaluation. Although conventional data augmentation techniques have been employed to simulate production-related variability, their effectiveness remains limited in generating datasets that enable robust and generalized learning. To mitigate the challenge of data insufficiency, the filter-induced augmentations (FIA) method was introduced by [209] to synthetically produce representative samples of PV cell surfaces. A custom lightweight CNN architecture named PV-CrackNet using EL-based PV samples was developed for micro-crack detection. Results show a higher validation accuracy of 97.42% in the micro-crack detection using the FIA technique when compared with the 96.1% achieved using generic augmentation transformations.
- Corrosion
The UV is considered one of the main causes of encapsulant ethylene-vinyl acetate (EVA) discolouration responsible for the emergence of corrosion. Although advanced encapsulating materials with superior protection features against environmental stress factors exist, EVA is still used in more than 75% of all PV modules due to its cost-effectiveness [14]. The released acetic acid is characteristically found responsible for the corrosion of contacts that frequently occurs after the initiation of discolouration failure. The corrosion attacks the metallic connections of the PV cells, causing a leakage current and performance degradation [205].
- Snail trails
One of the primary factors contributing to the degradation of solar module performance is physical damage, which may occur during manufacturing or installation processes. A common manifestation of such damage includes the formation of fractures and snail trails on the surface of photovoltaic (PV) modules [210]. Snail trail defects are typically visible to the naked eye and are most often associated with the presence of microcracks within the solar cells [211]. Snail trails refer to the discoloration of the silver fingers on solar cells, resulting from the formation of silver carbonate nanoparticles (Ag2CO3) produced through the reaction between silver, carbon dioxide, and moisture. Because these gases can readily penetrate through micro-cracks, snail trails predominantly occur in proximity to cell cracks and along cell edges [200]. A method for detecting snail trail defects in photovoltaic (PV) module images based on the YOLOv3 architecture was proposed by [212]. The architecture employed a single Convolutional Neural Network (CNN) designed for object classification and rapid detection through the use of bounding boxes. The model achieved a detection accuracy of 99.7% in identifying snail trail defects on the surface of solar panels. Venkatesh et al. developed a fault identification framework for photovoltaic (PV) modules utilizing key features extracted from aerial imagery [213]. In this approach, feature extraction was performed using a pretrained AlexNet model [214], while feature selection was conducted through the J48 decision tree algorithm. The selected features were subsequently classified into six categories—intact panel, discoloration, burn marks, delamination, snail trail, and glass breakage—using a Bayesian Network (Bayes Net) classifier. The system attained an overall classification accuracy of 96.83% with a model-building time of 0.26 s, underscoring its efficiency and reliability in identifying faults within PV modules.
4.5.2. Environmental Faults
There exist many environmental causes for PV failures where it can be found, among others, the weather, shading conditions, temperature, dust, rust and snow.
- Hot spots
The shading may occur if PV panels are shaded by a solid material, e.g., buildings, snow, or dust or it can be caused by smog in the air. Both affect PV module performance, the first one result in a voltage decrease and the second one affects the current. During partial shading, the shaded cells act as power dissipaters rather than power sources, increasing cell temperature, potentially leading to hot spots. Hot spot faults create regions having relatively higher temperatures and different IV characteristics when compared with the overall PV panel.
There exist several approaches in the detection of hot spots in PV panels using machine learning and deep learning algorithms that use IR images. Some approaches use segmentation algorithms to detect hot spots and other methodologies use detection and classification algorithms for single and multiple hot spot faults (see Figure 18).
Figure 18.
Methodologies used in hot spot analysis: (a–d) Semantic segmentation; (b–e) Boundary detection; (c–f) Detection and classification.
Several CNN models have been described in research papers applied in hot spot detection and classification based on computer vision. One of the most widely used CNN models is the RCNN model, along with its more optimized versions, the Fast R-CNN model and the Faster R-CNN model. The Fast R-CNN model optimizes the R-CNN model where the input image passes through the CNN only once, making it faster. The Faster R-CNN model has an external algorithm that is faster than previous models for generating regional proposals. Several Yolo models are also used in hot spot detection and classification based on computer vision. The architectural difference between YOLO and R-CNN models lies in their object detection approach, which directly impacts speed and accuracy. The YOLO model uses a one-stage approach, allowing for faster inference speeds but often resulting in less precision in locating small regions. Conversely, R-CNN uses a two-stage approach, which is more precise and robust in locating objects, but is inherently slower.
Unmanned aerial vehicles (UAVs) equipped with infrared cameras are increasingly used to capture thermal images and detect hotspots in photovoltaic (PV) modules. These systems typically rely on infrared thermography, a widely accepted, non-destructive technique that enables contactless, real-time inspection. In study [215], a machine learning approach is applied to automatically detect, evaluate, and categorize hotspots from UAV-acquired thermal images. The approach demonstrates its effectiveness and potential for large-scale PV monitoring. A non-invasive method for detecting and quantifying localized heating, or hotspots, in photovoltaic (PV) modules was presented in [216]. Using an infrared camera, thermal images of operating PV modules are acquired and analyzed with a Hotspot Detection algorithm. The algorithm also quantifies each hotspot by calculating its average temperature and relative area, providing a comprehensive assessment of thermal anomalies. The solution described in [217] introduces an intelligent UAV-based inspection method for detecting hotspots in large-scale photovoltaic (PV) plants. The approach extracts individual module infrared (IR) images from a larger IR image using line detection. A CNN-based model is employed to detect and classify hotspots within the extracted module images.
A modified U-Net architecture is employed by [218] for segmenting infrared images to detect bright spots as an indication of hotspots within photovoltaic modules. These bright regions are identified in the HSV color space and mapped back to their original image locations. A comprehensive photovoltaic plant maintenance and inspection system is proposed by [219], utilizing a UAV equipped with both thermal and RGB cameras. The infrared (IR) images are used to detect thermal defects such as hotspots, while the RGB images identify surface-level issues. The two image types are cross-validated to accurately diagnose the root causes of module defects. Another method that uses an RGB camera and a thermal camera to automatically identify anomalies in solar panels and determine their root causes using drone-based imagery is described in [220]. The author’s focus is mainly on the detection of anomalies using thermal imagery but also addresses the root cause of the anomaly.
An approach is presented in [221] proposing a method for detecting and classifying faults on PV modules, through aerial Infrared Thermography (IRT) images, combining Digital Image Processing (DIP) and Convolutional Neural Networks (CNNs) algorithms. The developed neural network algorithm can detect faults on the IRT images and classify them in three categories: disconnected substrings, hot spots, and disconnected strings. Another solution for automatic detection and analysis of photovoltaic modules in aerial infrared images was proposed by [222]. Each individual photovoltaic module is located in a low-resolution infrared image features are extracted. Those features are tested for outliers using statistical tests to identify the hotspots and hot areas. A similar method was described in [223] presenting an automatic fault detection system for photovoltaic modules based on CNN classifier that accurately identifies hotspot faults using thermographic images The system classifies faults based on the presence of hotspots. Ren et al. [224] proposes an improved SSD algorithm for PV hotspot detection. Using the network for feature extraction reduces the number of parameters in the structure and achieve the purpose of speeding up the network. The obtained results show that the proposed algorithm can detect the hot spots of PV array with good confidence, low detection rate and good robustness.
Ramírez et al. [225] introduces an image analysis approach using two sequential CNNs integrated into an Internet of Things (IoT) platform for hotspot detection and identification in photovoltaic panels. This method achieves a high accuracy for panel detection and hotspot identification, while significantly reducing false positives.
A novel method for automatic segmentation and analysis of hotspots and snail trails on photovoltaic panels is described in [226]. This method combines unsupervised sensing algorithms with 3D Augmented Reality to provide enhanced visualization. By integrating drone technology, this methodology aims to transform PV maintenance by enabling real-time, automatic detection of solar panels and faults, improving efficiency and accuracy.
A hotspot detection model is proposed that balances detection accuracy with improved speed [227]. The study provides a detailed comparison of the model’s accuracy, detection speed, and parameter size. Another research focused on finding the soiling hotspot in solar panels with help of Principal Components Thermal Analysis (PCTA) obtained by thermal image processing, is presented in [228].
In [229], a machine learning approach based on feature extraction and an SVM model is proposed for detecting and classifying hotspots in photovoltaic (PV) panels using infrared thermography. The features are based on RGB color space, texture, Histogram of Oriented Gradients (HOG), and Local Binary Patterns (LBP). The SVM model classifies thermal images of PV panels into three categories: healthy, non-faulty hotspot, and faulty. Experimental results show that the proposed approach requires less computational power and storage than alternative machine learning methods. Using also infrared thermography images of PV modules and analyzing the I-V characteristics to indicate the hotspots and to find the relation between hotspot and the defective area was an approach proposed by [230]. A modified real-time object detection framework based on the YOLO network was employed to analyze and detect defects in PV modules. The experimental results highlight the critical role of dataset diversity in enhancing the accuracy of hotspot detection.
A portable, ground-based system for the detection and classification of hotspots associated with PV module failures, utilizing both RGB and infrared imaging, was proposed in [231]. This system integrates three-dimensional thermal information of the panel structure to achieve precise hotspot identification. An important advantage of the approach lies in its capability to differentiate genuine hotspots from false detections caused by reflections from people, equipment, or external radiation sources.
In a related study [232], the application of standard thermal image processing techniques combined with the Canny edge detection operator was employed to identify module-related faults responsible for hotspot formation. The proposed method demonstrated promising performance by successfully detecting hotspots and associating them with specific defective cells within each inspected module.
With the continued expansion and increasing complexity of photovoltaic power plants, the need for advanced and reliable condition monitoring systems has become imperative to ensure system stability and efficiency. Addressing this need, Huerta Herraiz et al. [233] presented a hotspot detection method for PV panels that utilizes a thermographic camera integrated into an UAV, thereby enabling efficient and comprehensive inspection of large-scale PV installations. It combines thermography and telemetry data to detect and locate hot spots providing a response of the panel condition monitoring. The method uses two unified region-based convolutional neural networks to automatically process the data allowing fault detection during the inspection. The accuracy, the efficiency and the performance of the approach under different real scenarios are evaluated statistically obtaining satisfactory results. Liu et al. [234] proposes an enhanced U-Net with Visual Geometry Group-19 (VGG19) and squeeze-and-excitation block to achieve accurate hot spot identification at the granularity level of pixels and the correspondent location. The thermal infrared image of the PV module is pre-processed by the Gaussian blur and image sharpening method to improve the quality of the hot spot image. The U-Net architecture is used to extract feature information of PV module hot spot images, and the squeeze-and-excitation block is used for extracting global features. Although numerous studies have concentrated on image classification, one approach employs a drone fitted with a thermal infrared sensor to assess PV cell degradation via deep convolutional neural networks [235]. The resulting performance metrics—precision, recall, and F1-score—demonstrate the effectiveness and suitability of the proposed method.
One of the paramount challenges in the photovoltaic domain is the development of robust inspection methodologies for fault detection in PV modules. A method that identifies hotspots in infrared images of PV modules by employing the Hough line transform to delineate PV regions and the Canny edge detector for hotspot identification was presented by [236]. To counteract interference from reflective areas, precise hotspot localization is attained through a trained Faster R-CNN model.
The identification of overheating in PV modules through thermographic non-destructive testing is crucial for ensuring the proper operation of PV systems without disrupting their normal functionality. A system for the automatic classification of faults using a CNN and thermographic images of varying quality, acquired with different equipment, was presented by [237]. The dataset comprised images captured by both UAVs and ground-based operators. To enhance image quality, several pre-processing techniques were assessed to mitigate noise and improve feature clarity. The proposed system enables rapid detection of failures in PV panels with high accuracy, providing an effective solution for remote fault detection and offering adaptability for use across various scientific and industrial domains.
The detection of small hotspot defects in PV farms presents a significant challenge, primarily due to the problem of feature vanishing as the network depth increases. To overcome this challenge, a Residual Channelwise Attention Gate network is proposed to achieve multiscale feature fusion, complex background suppression, and defect feature highlighting [238]. Obtained results demonstrate the effectiveness of the proposed approach in detecting small hotspot defects within PV farms.
Overheating in photovoltaic modules constitutes an anomalous condition encountered during PV plant inspections. Although previous studies have employed thermographic imaging to identify hotspots in PV modules, these approaches typically fail to automatically classify specific hotspot types or precisely localize varied overheated regions within a single thermography image. Moreover, the diminutive scale of certain overheated areas leads many conventional methods to overlook them. To overcome this limitation, the present study [239] proposes a deep learning-based framework. Experimental assessments confirm that the proposed method surpasses benchmark techniques in both efficacy and computational efficiency.
As shown in Table 8, the different approaches used for PV panel hotspot detection, the characteristics of the images used, as well as the accuracy results in their detection are visible. It is worth noting that higher detection values do not mean better performance of the applied algorithms when compared to other methods because in many situations different databases are used. None of the datasets used in the works described in Table 13 are publicly available from the authors for benchmarking and further research.
Table 13.
Methodologies used in hot spot detection and classification.
The studies presented in Table 13 employ diverse datasets that are often incompletely characterized. This lack of descriptive detail extends to critical performance factors—such as the percentage split for training and testing and the data augmentation techniques utilized—which are not always fully reported. Crucially, many studies also fail to use a unified metric to assess the performance of the proposed methodology. Collectively, these factors prevent a direct comparison of the performance of different methodologies for detecting hot spots in PV panels.
Research conducted on detecting hot spots in PV panels shows a growing use of unmanned aerial vehicles (UAVs) equipped with infrared cameras for image acquisition. These images are used as datasets in specific studies and are not publicly available. The application of UAVs with infrared technology significantly improves the hot spot detection efficiency while providing high economic benefits. The infrared imaging provides the precise physical location of the defect, identifying it not only at the solar module or panel level but also within the solar cell itself. However, the use of UAVs still presents limitations. If the image is acquired at a high altitude, the image background becomes more complex, and the hot spot defect appears too small. The infrared camera mounted in UAV should be protected against the interference of the sun as well as from adjacent structures and trees. For avoiding blurring the image attention should be paid to the relation between the UAV speed and the time constant of the camera sensor. For a better field of view for hot spot detection, the infrared camera should be perpendicular to the surface of the photovoltaic module. In some situations, due to camera limitations, only a portion of the solar PV module may be acquired, rather than the entire unit. Some conducted works, to determine the spot with the highest temperature it is compute the relative percent area of the potential hot spot based on the specified PV module area. The identified limitations and necessary operational considerations make it difficult the hotspot detection to achieve good performance in real-time applications.
4.5.3. Electrical Faults
Faults where alternating current (AC) or direct current (DC) is present are all classified as electrical faults.
Bypass diode failure arises from mismatches in the current-voltage characteristics of photovoltaic cells. These diodes mitigate power losses and performance degradation due to module shading, thereby preventing reverse bias heating, hot spots, and potential module destruction [205]. Xiao et al. highlighted that defective bypass diodes represent the primary cause of power loss in solar modules, detailing failure mechanisms through analysis of shunted diodes retrieved from rooftop installations [240]. Another study conducted bypass diode failure analysis via color identification in thermal images was described in [241]. The images were transformed into the HSV color space, followed by a filtering process to separate panel images from background clutter. Threshold values were then established by evaluating filter output vectors against each panel characteristic. The Faster R-CNN Mask was employed for fault detection, with continuous faults across predefined areas classified as bypass diode failures. This approach achieved a 96.9% accuracy in predicting bypass diode malfunctions using thermal imagery. Mellit developed a classifier for diagnosing partial shading, dust accumulation on PV module surfaces, short-circuited modules, and bypass diode failures [242]. This deep convolutional neural network classifier was optimized and deployed on a Raspberry Pi 4, enabling real-time notifications via SMS or email to operators for informed decision-making. Experimental validation confirmed the system’s real-time efficacy, attaining 95.55% diagnostic accuracy. Mellit noted that accuracy could be enhanced by expanding the dataset size and improving infrared thermographic image quality.
The identification of electrical faults in photovoltaic (PV) panels constitutes a domain of application where there exists a scarcity of studies employing computer vision methodologies. The examination of bypass diode malfunctions through imaging techniques has remained relatively underexplored to date. The limited investigations into bypass diode failure analysis utilizing thermal imaging in conjunction with deep learning methodologies indicate the potential for this approach to serve as an efficacious solution for the detection of faults in PV systems. Furthermore, several critical types of electrical faults warrant further investigation utilizing image-based computational solutions and should be prioritized in forthcoming research endeavors:
- The Balance of System (BOS) components failures, which are considered the main reason behind the existence of non-producing modules in the PV area leading to a reduced production;
- The inverter failure is considered the brain of the PV system and represents an expensive and complex element in the plant.
Another key aspect for future work is the development of lightweight, computer vision-based approaches suitable for real-time implementation on low-power, inexpensive edge devices with limited memory capacity.
4.6. Fault Detection of PV Trackers
An additional domain in which artificial vision has been implemented concerning renewable photovoltaic systems pertains to the identification of faults in photovoltaic module tracking systems. These trackers accompany PV modules to optimize power generation. Optimal module positioning depends on factors such as geographic location and local weather conditions, necessitating adjustments for latitude and altitude, particularly in tilt and azimuth angles. Numerous studies have investigated optimal tilt and orientation angles [243,244]. However, the sun’s position varies continuously throughout the day and year, preventing fixed modules from achieving maximum power output at all times. Tracking platforms address this limitation by dynamically adjusting panel positions, potentially increasing energy production by 20% to 50%, contingent on the specific location [245]. Nevertheless, these systems are susceptible to faults that impair tracker movement. Various methods have been proposed to identify such faults, but they typically require multiple sensors and extensive data measurement [246]. Visual inspections represent an alternative, yet they are often time-consuming or expensive. Consequently, image-based fault detection offers a more straightforward and cost-effective solution.
As mentioned, the use of images to detect faults in PV module trackers can provide an important advantage, with some works proposing this approach for this type of problem. In recent years, this approach has been addressed, with works proposing a method that takes into account the existence of multiple photovoltaic (PV) systems [247,248]. In this way, a pattern recognition method has been implemented, which considers the comparison between them. Since the number of PV systems with a fault in a tracker is typically quite small (often just one), detecting this fault is accomplished by comparing the slopes of these systems (as shown in Figure 19). This method is effective because it highlights the differences in performance between the PV systems, making it easier to identify any issues.
Figure 19.
Strategy for detecting tracker faults that involves comparing the slopes between PV panels [248].
In [247], the orientation was established using statistical moments or by calculating the slope of the line that connects the two centroids of the photovoltaic (PV) cells, which are situated at the vertices of the PV module. On the other hand, Amaral et al. [248] used an image processing method that utilizes Principal Component Analysis (PCA) to analyze and process images. Unlike the usual use of PCA for reducing data dimensions, this study proposes using it to determine object inclination. In the context of multiple photovoltaic (PV) modules, this method can be used to identify any modules with a slope that differs from the majority. This is achieved by analyzing the PCA results to determine the inclination of each PV module and comparing them to identify any outliers.
As verified, not many works have focused on this specific area of PV applications. However, the presented works showed that this could be a very effective and low-cost solution for this kind of problem that exists with PV trackers. Nevertheless, there is much work that needs to be developed and should be a focus in the future, namely:
- Real-time Implementation: Integrating the image processing algorithm into an automated, real-time monitoring system that captures images, calculates the deviation index, and alerts operators immediately;
- Large-scale field validation: Conduct multi-site studies over multiple climates and tracker types (single-axis, dual-axis);
- Benchmark datasets and open-source image sets for PV tracking faults would accelerate research;
- Automatic Seasonal Adaptation: Develop algorithms that adjust thresholds dynamically based on seasonal lighting, sun path changes, and background environment changes. This improves robustness without manual recalibration;
- Expand to Night-Time Fault Detection: Integrate IR imaging or thermal cameras and use low-light or NIR-enabled cameras. This ensures 24/7 tracker monitoring.
4.7. Maintenance of PV Modules
While many studies highlight the low maintenance costs of PV systems [249], real-world applications outside of research settings often reveal a different reality, necessitating ongoing maintenance and support. One potential issue lies in the design or installation process. PV modules are often connected in a series-parallel arrangement, where several panels or cells are joined in series to form a string of modules and obtain an optimal voltage. Multiple strings of modules are then connected in parallel. Therefore, discrepancies between strings can lead to a decrease in overall system performance. Furthermore, in various climate zones, the persistent accumulation of dirt and debris on solar panels can markedly impair their performance. Thus, to ensure the maximum efficiency of the PV generators, maintenance programs are required [250].
This is another specific area in which not many works have focused, particularly when taking into consideration computer image-based approaches. However, this could be a very useful tool for the maintenance of PV systems. Nevertheless, further research is still needed to ensure that this tool becomes truly important in this context. In fact, the following can be mentioned as future work:
- Multimodal Data Fusion for Enhanced Diagnostics: Move beyond basic visual (RGB) or thermal inspection to fuse data from multiple image modalities;
- AI-Driven Anomaly Detection and False Positive Reduction: Refine Machine Learning and Deep Learning algorithms to distinguish between genuine, performance-impacting faults and temporary anomalies (e.g., passing bird droppings, transient shadows, or temporary reflections);
- Standardized Image Datasets and Benchmarks: Address the lack of standard, publicly available, and diverse datasets;
- Integration of Image-Based State Estimation with Remaining Useful Life (RUL) Models: Connect the fault severity detected in an image to the panel’s overall health and estimated time until complete failure.
4.8. Finding the Optimal Operating Point of Photovoltaic Panels (MPPT)
Maximum power point tracking (MPPT) algorithms are designed to track and extract the maximum available power from photovoltaic (PV) systems, regardless of the environmental conditions. The goal of MPPT is to optimize the power output of PV systems under varying conditions, such as changes in solar irradiance or temperature, in order to maximize the energy harvested. Many MPPT (Maximum Power Point Tracking) algorithms are capable of accurately identifying the maximum power point when the photovoltaic (P-V) characteristic curve has a single peak. However, traditional MPPT methods can fail when the solar cells are subjected to partial shading conditions. Under partial shading, the P-V curve can exhibit multiple peaks, and the conventional MPPT techniques may become trapped at a local maximum power point, rather than tracking the true global maximum power point. Consequently, a local maximum might be attained instead of the global peak. In this way, to avoid these problems new algorithms designated as global MPPT (GMPPT) methods have been proposed. One of the innovative approaches to attaining maximum power point (MPP) under partial shading conditions (GMPPT) is the use of computer vision algorithms.
In contrast to existing MPPT methods that exclusively rely on analog electronics, algorithms based on computer vision offer an effective and economical solution. By analyzing shading patterns on solar cells through mathematical modeling, these algorithms can accurately determine the voltage at maximum power. This approach can be implemented by simply placing a camera in front of the solar panel(s), as illustrated in Figure 20.
Figure 20.
PV panel shading detection using computer vision.
A MPPT technique characterized by its capability to identify the Global Maximum Power Point (GMPP) without requiring periodic curve scanning and using computer was presented in [251]. The proposed approach leverages the mathematical model of the PV module and the irradiance levels received by its cells to analytically determine the GMPP location. The required irradiance values are estimated using an optical camera to capture an image of the PV module. Additionally, the method is integrated with the perturb and observe (P&O) technique to mitigate potential errors in the model or irradiance estimation. A similar approach was used by [252]. However, in this case the artificial vision, which uses a webcam to identify the shadow irradiance in real-time, is used to determine the reference voltage for maximum power extraction, irrespective of the number of peaks in the P-V curve. Another MPPT system utilizing artificial vision to track the maximum power point under partial shading conditions was presented in [253]. This system was controlled and monitored by a wireless sensor network based on IEEE 802.15.4 technology.
A method using artificial vision to obtain the maximum power point under partial shading conditions is proposed in [252]. A webcam is employed to analyze shading patterns in real time and estimate the corresponding irradiance distribution. The shadow detection process uses some image processing algorithms such as thresholding, morphological transformation and blob coloring. From this analysis, a reference voltage corresponding to the global MPP is determined and used by a nonlinear backstepping controller to adjust the input voltage of the DC/DC converter, ensuring the PV system operates at its optimal point. Outdoor experiments validate the proposed method, achieving MPP tracking efficiencies between 98.1% and 99.6%, even in dynamically changing shading conditions. Reconfiguration of photovoltaic (PV) arrays is crucial for maintaining efficiency, especially under partial shading conditions. Existing methods for reconfiguration tend to be complex and challenging. Karakose et al. investigate the effects of full and partial shading on PV arrays and propose a simpler reconfiguration approach using image processing algorithms to analyze moving shadows [254]. Unlike traditional methods, this approach does not require direct measurements of current, voltage, or power, which are often difficult to obtain. Experimental validation using video footage from a real PV array demonstrates the effectiveness of the method in improving system performance under shading.
Although few works have focused on this area, it can be a useful tool. However, the current artificial-vision approaches presented in these studies typically rely on classical image-processing techniques such as thresholding, segmentation, and color analysis. More advanced algorithms could therefore be employed, including CNN-based shading segmentation, shadow detection using U-Net or Vision Transformers, and real-time classification of cloud shadows, soiling, bird droppings, snow, or structural shading. Moreover, due to the limited research available, several directions for future work can be identified:
- Methods to improve accuracy under varying lighting, angles, and weather;
- Hybrid optimization (vision + heuristic MPPT);
- Predictive MPPT that uses vision to anticipate shading events before power drops;
- Reinforcement learning–based MPPT that uses video feedback.
5. Conclusions
In this paper it was presented a review of the applications in which artificial computer vision can be used in photovoltaic systems was presented. These systems, which convert sunlight directly into electricity, are crucial within renewable energy. They play a vital role in transitioning away from fossil fuels towards a more sustainable global energy mix. Consequently, owing to their significance, numerous research efforts have been undertaken in several contexts related to these systems. As shown in this paper, computer vision has been applied to several contexts within photovoltaic system applications. Additionally, this review highlights the use of various acquisition systems for computer vision, noting that their selection was performed with great care. Furthermore, this paper highlights that a variety of algorithms have been proposed for use with the acquisition system. These algorithms have also incorporated modern AI techniques, such as machine learning, deep learning, and hybrid methods. Beyond the importance of the acquisition systems themselves, the choice and development of these algorithms significantly influence the accuracy of the overall system. While numerous reviews concerning photovoltaic (PV) systems and computer vision have already been published, this review distinguishes itself by not focusing on a specific topic or subset of algorithms associated with image processing. Instead, it concentrates on diverse applications, such as predicting PV areas, forecasting solar output, detecting clean/unclean PV modules, and classifying module faults (all in their various aspects). Furthermore, the review clearly specifies for each work whether it relies on public datasets. This enhances future reproducibility and research, as links to all utilized public datasets are presented for every relevant study.
From this review, several avenues for future work were also identified. One of the first key aspects is the standardization of Datasets. This will allow the community to establish a public and uniform benchmark dataset, enabling objective comparison between algorithms and approaches proposed by different studies. Another aspect identified, which affects virtually all applications, is the need to enhance model robustness. This involves improving model resilience to challenging image conditions, specifically addressing variability in image quality caused by factors such as shadows, occlusions, varying lighting conditions, and seasonal changes. A further issue observed across many applications was the reliance on static analysis. Therefore, temporal monitoring and analysis should be considered for future investigation.
Other specific lines for future work were also identified for particular applications. Their detailed description was presented at the end of each respective section.
Author Contributions
Conceptualization, T.G.A. and V.F.P.; methodology, T.G.A. and V.F.P.; validation, T.G.A., A.C. and V.F.P.; formal analysis, T.G.A., A.C. and V.F.P.; investigation, T.G.A., A.C. and V.F.P.; resources, T.G.A. and A.C.; writing—original draft preparation, T.G.A., A.C. and V.F.P.; writing—review and editing, T.G.A., A.C. and V.F.P.; visualization, A.C.; supervision, V.F.P.; project administration, T.G.A. All authors have read and agreed to the published version of the manuscript.
Funding
This work was partially supported by national funds through FCT Fundação para a Ciência e a Tecnologia with reference UIDB/00066/2020 and UIDP/00066/2020, and project H2020 MSCA-ITN SMARTGYsum (under Grant no. 955614).
Institutional Review Board Statement
Not applicable.
Informed Consent Statement
Not applicable.
Data Availability Statement
No new data were created in this study.
Acknowledgments
The authors would like to thank the Polytechnic University of Setúbal and Polytechnic University of Lisbon for providing laboratorial and computer resources necessary for carrying out this research work.
Conflicts of Interest
The authors declare no conflicts of interest.
Abbreviations
The following abbreviations in alphabetical order are used in this manuscript:
| (AC) | Alternating current |
| (AE) | Autoencoder |
| (AI) | Artificial Intelligence |
| (AIRT) | Artificial Intelligence-based Intelligent Reactive Tracking |
| (AM) | Attention mechanisms |
| (AMV) | Atmospheric motion vector |
| (ANFIS) | Adaptive Network-based Fuzzy Inference System |
| (ANN) | Artificial Neural Networks |
| (AR) | Autoregressive |
| (ARM) | Atmospheric Radiation Measurement |
| (ARMA) | Auto-regressive moving average |
| (ASI) | All-sky imager |
| (BILST) | Bi-level Spatio-Temporal |
| (BOS) | Balance of System |
| (BPNN) | Backpropagation neural network |
| (CAE) | Convolutional autoencoder |
| (CBAM) | Convolutional Block Attention Module |
| (CCD) | Charge-coupled device |
| (CCM) | Cross-correlation method |
| (CDF) | Cloud distribution feature |
| (CF) | Cloud fraction |
| (CIADCast) | Cloud Index Advection and Diffusion Cast |
| (CLNSTM) | [Note: CLSTM—placed below] |
| (CLSTM) | Convolutional long short-term memory |
| (CNN) | Convolutional Neural Network |
| (CPM) | Coarse Prediction Module |
| (CPU) | Central Processing Units |
| (CRM) | Constraint Refinement Module |
| (CSL) | Clear Sky Library |
| (CSP) | Concentrating solar power |
| (CSPIMP) | Concentrating Solar Power plant efficiency IMProvement |
| (CVM) | Cross Validation Method |
| (DC) | Direct current |
| (DCNN) | Deep convolutional neural network |
| (DHLNN) | Double-Hidden Layer Feed Forward Neural Network plus Softmax function |
| (DIP) | Digital Image Processing |
| (DL) | Deep learning |
| (DNI) | Direct Normal Irradiance |
| (DRR) | Deep Roof Refiner |
| (ECLIPSE) | Envisioning CLoud Induced Perturbations in Solar Energy |
| (EL) | Electroluminescence |
| (EV) | Electric vehicle |
| (EVA) | Ethylene-vinyl acetate |
| (FCN) | Fully convolutional network |
| (FFL) | Fine-Grained Feature Layer |
| (FIA) | Filter-induced augmentations |
| (FOM) | Fine Optimization Module |
| (FPGA) | Field Programmable Gate Arrays |
| (FPN) | Feature Pyramid Network |
| (FPV) | Floating PV |
| (GA) | Genetic algorithm |
| (GAN) | Generative Adversarial Network |
| (GBC) | Ground-based camera |
| (GHI) | Global horizontal solar irradiance |
| (GMPP) | Global Maximum Power Point |
| (GMPPT) | Global Maximum power point tracking |
| (GPU) | Graphics Processing Units |
| (GRU) | Gated Recurrent Unit |
| (GTI) | Global Tilted Irradiance |
| (HDR) | High Dynamic Range |
| (HOG) | Histogram of Oriented Gradients |
| (HSRRS) | High spatial resolution remote sensing |
| (HSV) | Hue, Saturation, Value |
| (IR) | Infrared |
| (IREA) | International Renewable Energy Agency |
| (IRT) | Infrared Thermography |
| (IRTI) | Infrared thermal imaging |
| (IoT) | Internet of Things |
| (kNN) | k-Nearest Neighbor |
| (LBP) | Local Binary Patterns |
| (LCC) | Local cloud cover |
| (LMD) | Local measurement data |
| (LSTM) | Long short-term memory |
| (LWIR) | Long-wave infrared |
| (ML) | Machine Learning |
| (MLP) | Multilayer Perceptron |
| (MPPT) | Maximum power point tracking |
| (MPP) | Maximum power point |
| (MSG) | Meteosat Second Generation |
| (MSF) | Multistep forecasting |
| (NWP) | Numerical Weather Prediction |
| (OF) | Optical Flow |
| (PCA) | Principal Component Analysis |
| (PCTA) | Principal Components Thermal Analysis |
| (PIV) | Particle Image Velocimetry |
| (PI) | Prediction Interval |
| (PL) | Photoluminescence |
| (PM) | Persistence model |
| (PREDNET) | Predictive Coding Network |
| (PRRC) | Power ramp-rate control |
| (PSO) | Particle swarm optimization |
| (PSPNet) | Pyramid Scene Parsing Network |
| (PSSI) | Parking Space Suitability Index |
| (PV) | Photovoltaic |
| (RBF) | Radial basis function |
| (RBR) | Red-Blue Ratio |
| (RE) | Renewable energy |
| (RF) | Random Forest |
| (RGB) | Red, Green, and Blue |
| (RID) | Roof Information Dataset |
| (RNN) | Recurrent neural network |
| (ROIs) | Regions of Interest |
| (RSL) | Roof Structure Line |
| (RSP) | Rooftop solar panel |
| (RTM) | Randomized Training Method |
| (SBI) | Sun-Blocking Index |
| (SCM) | Semantic Constraint Module |
| (SES) | Solar energy systems |
| (SGP) | Southern Great Plains |
| (SHLNN) | Single-Hidden Layer Feed Forward Neural Network plus Softmax function |
| (SI) | Sky images |
| (SIFT) | Scale-Invariant Feature Transform |
| (SIM) | Solar irradiance map |
| (SLNN) | Simple machine learning model |
| (SPM) | Smart persistence model |
| (SPV) | Stationary PV |
| (ST) | Solar thermal |
| (SVC) | Support Vector for Classification |
| (SVM) | Support Vector Machine |
| (SVR) | Support Vector Regression |
| (SWIR) | Short-wave infrared |
| (TSIs) | Total sky images |
| (UAV) | Unmanned Aerial Vehicle |
| (UVF) | Ultraviolet fluorescence |
| (VGG19) | Visual Geometry Group-19 |
| (ViT) | Vision Transformer |
| (WPV) | Water-based photovoltaics |
| (WRF) | Weather Research and Forecasting |
References
- Rashid, M.H. Electric Renewable Energy Systems; Academic Press: New York, NY, USA, 2016; 240p. [Google Scholar]
- Communication from the Commission to the European Council and the European Parliament an Energy Policy for Europe. Commission of the European Communities, Brussels. 2007. Available online: https://eur-lex.europa.eu/legal-content/EN/TXT/PDF/?uri=CELEX:52007DC0001&from=en (accessed on 10 September 2025).
- IRENA—International Renewable Energy Agency. Available online: https://www.irena.org/Energy-Transition/Technology/Solar-energy (accessed on 24 May 2021).
- Høiaas, I.; Grujic, K.; Imenes, A.G.; Burud, I.; Olsen, E.; Belbachir, N. Inspection and condition monitoring of large-scale photovoltaic power plants: A review of imaging technologies. Renew. Sustain. Energy Rev. 2022, 161, 112353. [Google Scholar] [CrossRef] [Scilit]
- Michail, A.; Livera, A.; Tziolis, G.; Candás, J.L.C.; Fernandez, A.; Yudego, E.A.; Martínez, D.F.; Antonopoulos, A.; Tripolitsiotis, A.; Partsinevelos, P.; et al. A comprehensive review of unmanned aerial vehicle-based approaches to support photovoltaic plant diagnosis. Heliyon 2024, 10, e23983. [Google Scholar] [CrossRef] [Scilit] [PubMed]
- Gallardo-Saavedra, S.; Hernández-Callejo, L.; Duque-Perez, O. Technological review of the instrumentation used in aerial thermographic inspection of photovoltaic plants. Renew. Sustain. Energy Rev. 2018, 93, 566–579. [Google Scholar] [CrossRef] [Scilit]
- Kandeal, A.; Elkadeem, M.; Thakur, A.K.; Abdelaziz, G.B.; Sathyamurthy, R.; Kabeel, A.; Yang, N.; Sharshir, S.W. Infrared thermography-based condition monitoring of solar photovoltaic systems: A mini review of recent advances. Sol. Energy 2021, 223, 33–43. [Google Scholar] [CrossRef] [Scilit]
- Rahaman, S.A.; Urmee, T.; Parlevliet, D.A. PV system defects identification using Remotely Piloted Aircraft (RPA) based infrared (IR) imaging: A review. Sol. Energy 2020, 206, 579–595. [Google Scholar] [CrossRef] [Scilit]
- Tsanakas, J.A.; Ha, L.; Buerhop, C. Faults and infrared thermographic diagnosis in operating c-Si photovoltaic modules: A review of research and future challenges. Renew. Sustain. Energy Rev. 2016, 62, 695–709. [Google Scholar] [CrossRef] [Scilit]
- Buerhop, C.; Bommes, L.; Schlipf, J.; Pickel, T.; Fladung, A.; Peters, I.M. Infrared imaging of photovoltaic modules: A review of the state of the art and future challenges facing gigawatt photovoltaic power stations. Prog. Energy 2022, 4, 042010. [Google Scholar] [CrossRef] [Scilit]
- Puranik, V.E.; Kumar, R.; Gupta, R. Progress in module level quantitative electroluminescence imaging of crystalline silicon PV module: A review. Sol. Energy 2023, 264, 111994. [Google Scholar] [CrossRef] [Scilit]
- Mao, H.; Chen, X.; Luo, Y.; Deng, J.; Tian, Z.; Yu, J.; Xiao, Y.; Fan, J. Advances and prospects on estimating solar photovoltaic installation capacity and potential based on satellite and aerial images. Renew. Sustain. Energy Rev. 2023, 179, 113276. [Google Scholar] [CrossRef] [Scilit]
- de Oliveira, A.K.V.; Aghaei, M.; Rüther, R. Automatic Inspection of Photovoltaic Power Plants Using Aerial Infrared Thermography: A Review. Energies 2022, 15, 2055. [Google Scholar] [CrossRef] [Scilit]
- Al Mahdi, H.; Leahy, P.G.; Alghoul, M.; Morrison, A.P. A Review of Photovoltaic Module Failure and Degradation Mechanisms: Causes and Detection Techniques. Solar 2024, 4, 43–82. [Google Scholar] [CrossRef] [Scilit]
- Afifah, A.N.N.; Indrabayu, S.; Syafaruddin, A. A Review on Image Processing Techniques for Damage detection on Photovoltaic Panels. ICIC Express Lett. 2021, 15, 779–790. [Google Scholar] [CrossRef]
- Balachandran, G.B.; Devisridhivyadharshini, M.; Ramachandran, M.E.; Santhiya, R. Comparative investigation of imaging techniques, pre-processing and visual fault diagnosis using artificial intelligence models for solar photovoltaic system–A comprehensive review. Measurement 2024, 232, 114683. [Google Scholar] [CrossRef] [Scilit]
- Hussain, T.; Hussain, M.; Al-Aqrabi, H.; Alsboui, T.; Hill, R. A Review on Defect Detection of Electroluminescence-Based Photovoltaic Cell Surface Images Using Computer Vision. Energies 2023, 16, 4012. [Google Scholar] [CrossRef] [Scilit]
- Hijjawi, U.; Lakshminarayana, S.; Xu, T.; Fierro, G.P.M.; Rahman, M. A review of automated solar photovoltaic defect detection systems: Approaches, challenges, and future orientations. Sol. Energy 2023, 266, 112186. [Google Scholar] [CrossRef] [Scilit]
- Spagnolo, G.S.; Del Vecchio, P.; Makary, G.; Papalillo, D.; Martocchia, A. A review of IR thermography applied to PV systems. In Proceedings of the 11th International Conference on Environment and Electrical Engineering, Venice, Italy, 18–25 May 2012; pp. 879–884. [Google Scholar] [CrossRef] [Scilit]
- Yahya, Z.; Imane, S.; Hicham, H.; Ghassane, A.; Safia, E.B.-I. Applied imagery pattern recognition for photovoltaic modules’ inspection: A review on methods, challenges and future development. Sustain. Energy Technol. Assess. 2022, 52, 102071. [Google Scholar] [CrossRef] [Scilit]
- Hoog, J.; Maetschke, S.; Ilfrich, P.; Kolluri, R.R. Using Satellite and Aerial Imagery for Identification of Solar PV: State of the Art and Research Opportunities. In Proceedings of the e-Energy ‘20: Proceedings of the Eleventh ACM International Conference on Future Energy Systems, Virtual Event, 22–26 June 2020; Association for Computing Machinery: New York, NY, USA, 2020; pp. 308–313. [Google Scholar] [CrossRef] [Scilit]
- Scherer, R. Computer Vision Methods for Fast Image Classification and Retrieval; Springer: Berlin/Heidelberg, Germany, 2020. [Google Scholar]
- Cazzato, D.; Cimarelli, C.; Sanchez-Lopez, J.L.; Voos, H.; Leo, M. A Survey of Computer Vision Methods for 2D Object Detection from Unmanned Aerial Vehicles. J. Imaging 2020, 6, 78. [Google Scholar] [CrossRef] [Scilit]
- Kadam, P.; Fang, G.; Zou, J.J. Object Tracking Using Computer Vision: A Review. Computers 2024, 13, 136. [Google Scholar] [CrossRef] [Scilit]
- Murphy-Chutorian, E.; Trivedi, M.M. Head Pose Estimation in Computer Vision: A Survey. IEEE Trans. Pattern Anal. Mach. Intell. 2008, 31, 607–626. [Google Scholar] [CrossRef] [Scilit]
- Wołk, K.; Tatara, M.S. A Review of Semantic Segmentation and Instance Segmentation Techniques in Forestry Using LiDAR and Imagery Data. Electronics 2024, 13, 4139. [Google Scholar] [CrossRef] [Scilit]
- Nouriani, A.; McGovern, R.; Rajamani, R. Activity recognition using a combination of high gain observer and deep learning computer vision algorithms. Intell. Syst. Appl. 2023, 18, 200213. [Google Scholar] [CrossRef] [Scilit]
- Yilmaz, A.A.; Guzel, M.S.; Bostanci, E.; Askerzade, I. A Novel Action Recognition Framework Based on Deep-Learning and Genetic Algorithms. IEEE Access 2020, 8, 100631–100644. [Google Scholar] [CrossRef] [Scilit]
- Kong, Y.; Fu, Y. Human Action Recognition and Prediction: A Survey. Int. J. Comput. Vis. 2022, 130, 1366–1401. [Google Scholar] [CrossRef] [Scilit]
- Tang, Y.; Qiu, J.; Gao, M. Fuzzy Medical Computer Vision Image Restoration and Visual Application. Comput. Math. Methods Med. 2022, 2022, 6454550. [Google Scholar] [CrossRef] [Scilit]
- Harikrishnan, J.; Sudarsan, A.; Sadashiv, A.; Ajai, R.A. Vision-Face Recognition Attendance Monitoring System for Surveillance using Deep Learning Technology and Computer Vision. In Proceedings of the International Conference on Vision Towards Emerging Trends in Communication and Networking (ViTECoN), Vellore, India, 30–31 March 2019. [Google Scholar] [CrossRef] [Scilit]
- Matthey-Doret, C.; Baudry, L.; Breuer, A.; Montagne, R.; Guiglielmoni, N.; Scolari, V.; Jean, E.; Campeas, A.; Chanut, P.H.; Oriol, E.; et al. Computer vision for pattern detection in chromosome contact maps. Nat. Commun. 2020, 11, 5795. [Google Scholar] [CrossRef] [Scilit]
- Hesse, N.; Bodensteiner, C.; Arens, M.; Hofmann, U.G.; Weinberger, R.; Schroeder, A.S. Computer Vision for Medical Infant Motion Analysis: State of the Art and RGB-D Data Set. In Proceedings of the European Conference on Computer Vision (ECCV) Workshops, Munich, Germany, 8–14 September 2018. [Google Scholar]
- Gadasin, D.V.; Shvedov, A.V.; Kuzin, I.A. Reconstruction of a Three-Dimensional Scene from its Projections in Computer Vision Systems. In Proceedings of the Intelligent Technologies and Electronic Devices in Vehicle and Road Transport Complex (TIRVED), Moscow, Russia, 11–12 November 2021. [Google Scholar] [CrossRef] [Scilit]
- Shehu, V.; Dika, A. Using real time computer vision algorithms in automatic attendance management systems. In Proceedings of the 32nd International Conference on Information Technology Interfaces, Cavtat, Croatia, 21–24 June 2010. [Google Scholar]
- Brunetti, A.; Buongiorno, D.; Trotta, G.F.; Bevilacqua, V. Computer vision and deep learning techniques for pedestrian detection and tracking: A survey. Neurocomputing 2018, 300, 17–33. [Google Scholar] [CrossRef] [Scilit]
- Pena-Gonzalez, R.H.; Nuno-Maganda, M.A. Computer vision based real-time vehicle tracking and classification system. In Proceedings of the IEEE 57th International Midwest Symposium on Circuits and Systems (MWSCAS), College Station, TX, USA, 3–6 August 2014. [Google Scholar] [CrossRef] [Scilit]
- Dey, N.; Bhateja, V.; Hassanien, A.E. Medical Imaging in Clinical Applications—Algorithmic and Computer-Based Approaches; Studies in Computational Intelligence; Springer: Cham, Switzerland, 2016; Volume 651. [Google Scholar]
- Ettalibi, A.; Elouadi, A.; Mansour, A. AI and Computer Vision-based Real-time Quality Control: A Review of Industrial Applications. Procedia Comput. Sci. 2024, 231, 212–220. [Google Scholar] [CrossRef] [Scilit]
- Andhare, P.; Rawat, S. Pick and place industrial robot controller with computer vision. In Proceedings of the 2016 International Conference on Computing Communication Control and Automation (ICCUBEA), Pune, India, 12–13 August 2016; pp. 1–4. [Google Scholar]
- Kanchana, B.; Peiris, R.; Perera, D.; Jayasinghe, D.; Kasthurirathna, D. Computer Vision for Autonomous Driving. In Proceedings of the 3rd International Conference on Advancements in Computing (ICAC), Colombo, Sri Lanka, 9–11 December 2021. [Google Scholar] [CrossRef] [Scilit]
- Patrício, D.I.; Rieder, R. Computer vision and artificial intelligence in precision agriculture for grain crops: A systematic review. Comput. Electron. Agric. 2018, 153, 69–81. [Google Scholar] [CrossRef] [Scilit]
- Chang, M.-C.; Chiang, C.-K.; Tsai, C.-M.; Chang, Y.-K.; Chiang, H.-L.; Wang, Y.-A.; Chang, S.-Y.; Li, Y.-L.; Tsai, M.-S.; Tseng, H.-Y. AI City Challenge 2020—Computer Vision for Smart Transportation Applications. In Proceedings of the IEEE/CVF Conference on Computer Vision and Pattern Recognition (CVPR) Workshops, Online, 14–19 June 2020; pp. 620–621. [Google Scholar]
- Zhang, X.; Yi, W.-J.; Saniie, J. Home Surveillance System using Computer Vision and Convolutional Neural Network. In Proceedings of the IEEE International Conference on Electro Information Technology (EIT), Brookings, SD, USA, 20–22 May 2019. [Google Scholar] [CrossRef] [Scilit]
- Batchelor, B.G. Machine Vision Handbook; Springer: Berlin/Heidelberg, Germany, 2012. [Google Scholar]
- Nair, S.; Sharifzadeh, S.; Palade, V. Farmland Segmentation in Landsat 8 Satellite Images Using Deep Learning and Conditional Generative Adversarial Networks. Remote Sens. 2024, 16, 823. [Google Scholar] [CrossRef] [Scilit]
- da Costa, M.V.C.V.; de Carvalho, O.L.F.; Orlandi, A.G.; Hirata, I.; de Albuquerque, A.O.; e Silva, F.V.; Guimarães, R.F.; Gomes, R.A.T.; de Carvalho Júnior, O.A. Remote Sensing for Monitoring Photovoltaic Solar Plants in Brazil Using Deep Semantic Segmentation. Energies 2021, 14, 2960. [Google Scholar] [CrossRef] [Scilit]
- Hubert-Moy, L.; Fabre, E.; Rapinel, S. Contribution of SPOT-7 multi-temporal imagery for mapping wetland vegetation. Eur. J. Remote Sens. 2020, 53, 201–210. [Google Scholar] [CrossRef] [Scilit]
- Tong, X.-Y.; Lu, Q.; Xia, G.-S.; Zhang, L. Large-Scale Land Cover Classification in Gaofen-2 Satellite Imagery. In Proceedings of the IEEE International Geoscience and Remote Sensing Symposium, Valencia, Spain, 22–27 July 2018. [Google Scholar] [CrossRef] [Scilit]
- Lin, Y.; Saripalli, S. Road detection from aerial imagery. In Proceedings of the IEEE International Conference on Robotics and Automation, Saint Paul, MN, USA, 14–18 May 2012. [Google Scholar] [CrossRef] [Scilit]
- Pratt, L.; Govender, D.; Klein, R. Defect detection and quantification in electroluminescence images of solar PV modules using U-net semantic segmentation. Renew. Energy 2021, 178, 1211–1222. [Google Scholar] [CrossRef] [Scilit]
- Henry, C.; Poudel, S.; Lee, S.-W.; Jeong, H. Automatic Detection System of Deteriorated PV Modules Using Drone with Thermal Camera. Appl. Sci. 2020, 10, 3802. [Google Scholar] [CrossRef] [Scilit]
- Zikulnig, J.; Mühleisen, W.; Bolt, P.J.; Simor, M.; De Biasio, M. Photoluminescence Imaging for the In-Line Quality Control of Thin-Film Solar Cells. Solar 2022, 2, 1–11. [Google Scholar] [CrossRef] [Scilit]
- Eder, G.C.; Voronko, Y.; Hirschl, C.; Ebner, R.; Újvári, G.; Mühleisen, W. Non-Destructive Failure Detection and Visualization of Artificially and Naturally Aged PV Modules. Energies 2018, 11, 1053. [Google Scholar] [CrossRef] [Scilit]
- Lian, R.; Wang, W.; Mustafa, N.; Huang, L. Road Extraction Methods in High-Resolution Remote Sensing Images: A Comprehensive Review. IEEE J. Sel. Top. Appl. Earth Obs. Remote Sens. 2020, 13, 5489–5507. [Google Scholar] [CrossRef] [Scilit]
- Jia, J.; Sun, H.; Jiang, C.; Karila, K.; Karjalainen, M.; Ahokas, E.; Khoramshahi, E.; Hu, P.; Chen, C.; Xue, T.; et al. Review on Active and Passive Remote Sensing Techniques for Road Extraction. Remote Sens. 2021, 13, 4235. [Google Scholar] [CrossRef] [Scilit]
- Parhar, P.; Sawasaki, R.; Todeschini, A.; Reed, C.; Vahabi, H.; Nusaputra, N.; Vergara, F. HyperionSolarNet: Solar Panel Detection from Aerial Images. arXiv 2022, arXiv:2201.02107. [Google Scholar] [CrossRef] [Scilit]
- Qi, Q.; Zhao, J.; Lin, L.; Zhang, X.; Tian, Y. Combined multi-level context aggregation and attention mechanism method for photovoltaic panel extraction from high resolution remote sensing images. Int. J. Remote Sens. 2024, 45, 3560–3576. [Google Scholar] [CrossRef] [Scilit]
- Jiang, H.; Yao, L.; Lu, N.; Qin, J.; Liu, T.; Liu, Y.; Zhou, C. Multi-resolution dataset for photovoltaic panel segmentation from satellite and aerial imagery. Earth Syst. Sci. Data 2021, 13, 5389–5401. [Google Scholar] [CrossRef] [Scilit]
- Malof, J.M.; Bradbury, K.; Collins, L.M.; Newell, R.G. Automatic detection of solar photovoltaic arrays in high resolution aerial imagery. Appl. Energy 2016, 183, 229–240. [Google Scholar] [CrossRef] [Scilit]
- Malof, J.M.; Collins, L.M.; Bradbury, K.; Newell, R.G. A deep convolutional neural network and a random forest classifier for solar photovoltaic array detection in aerial imagery. In Proceedings of the 2016 IEEE International Conference on Renewable Energy Research and Applications (ICRERA), Birmingham, UK, 20–23 November 2016; pp. 650–654. [Google Scholar] [CrossRef] [Scilit]
- Yuan, J.; Yang, H.-H.L.; Omitaomu, O.A.; Bhaduri, B.L. Large-scale solar panel mapping from aerial images using deep convolutional networks. In Proceedings of the 2016 IEEE International Conference on Big Data (Big Data), Washington, DC, USA, 5–8 December 2016; pp. 2703–2708. [Google Scholar] [CrossRef] [Scilit]
- Sizkouhi, A.M.M.; Aghaei, M.; Esmailifar, S.M.; Mohammadi, M.R.; Grimaccia, F. Automatic Boundary Extraction of Large-Scale Photovoltaic Plants Using a Fully Convolutional Network on Aerial Imagery. IEEE J. Photovolt. 2020, 10, 1061–1067. [Google Scholar] [CrossRef] [Scilit]
- Schulz, M.; Boughattas, B.; Wendel, F. DetEEktor: Mask R-CNN based neural network for energy plant identification on aerial photographs. Energy AI 2021, 5, 100069. [Google Scholar] [CrossRef] [Scilit]
- Li, L.; Lu, N.; Jiang, H.; Qin, J. Impact of Deep Convolutional Neural Network Structure on Photovoltaic Array Extraction from High Spatial Resolution Remote Sensing Images. Remote Sens. 2023, 15, 4554. [Google Scholar] [CrossRef] [Scilit]
- Wang, J.; Chen, X.; Jiang, W.; Hua, L.; Liu, J.; Sui, H. PVNet: A novel semantic segmentation model for extracting high-quality photovoltaic panels in large-scale systems from high-resolution remote sensing imagery. Int. J. Appl. Earth Obs. Geoinf. 2023, 119, 103309. [Google Scholar] [CrossRef] [Scilit]
- Tan, H.; Guo, Z.; Zhang, H.; Chen, Q.; Lin, Z.; Chen, Y.; Yan, J. Enhancing PV panel segmentation in remote sensing images with constraint refinement modules. Appl. Energy 2023, 350, 121757. [Google Scholar] [CrossRef] [Scilit]
- Zhuang, L.; Zhang, Z.; Wang, L. The automatic segmentation of residential solar panels based on satellite images: A cross learning driven U-Net method. Appl. Soft Comput. 2020, 92, 106283. [Google Scholar] [CrossRef] [Scilit]
- Baek, J.; Choi, Y. Optimal installation and operation planning of parking spaces for solar-powered electric vehicles using hemispherical images. Renew. Energy 2023, 219, 119444. [Google Scholar] [CrossRef] [Scilit]
- Jiang, W.; Tian, B.; Duan, Y.; Chen, C.; Hu, Y. Rapid mapping and spatial analysis on the distribution of photovoltaic power stations with Sentinel-1&2 images in Chinese coastal provinces. Int. J. Appl. Earth Obs. Geoinf. 2023, 118, 103280. [Google Scholar] [CrossRef] [Scilit]
- Ji, C.; Bachmann, M.; Esch, T.; Feilhauer, H.; Heiden, U.; Heldens, W.; Hueni, A.; Lakes, T.; Metz-Marconcini, A.; Schroedter-Homscheidt, M.; et al. Solar photovoltaic module detection using laboratory and airborne imaging spectroscopy data. Remote Sens. Environ. 2021, 266, 112692. [Google Scholar] [CrossRef] [Scilit]
- Zech, M.; Ranalli, J. Predicting PV Areas in Aerial Images with Deep Learning. In Proceedings of the 47th IEEE Photovoltaic Specialists Conference, Online, 15–21 June 2020; pp. 767–774. [Google Scholar]
- Available online: https://getsolar.ai/blog/machine-learning-rooftop-detection-solar-installations/ (accessed on 4 August 2025).
- Krapf, S.; Bogenrieder, L.; Netzler, F.; Balke, G.; Lienkamp, M. RID—Roof Information Dataset for Computer Vision-Based Photovoltaic Potential Assessment. Remote Sens. 2022, 14, 2299. [Google Scholar] [CrossRef] [Scilit]
- Bommes, L.; Buerhop-Lutz, C.; Pickel, T.; Hauch, J.; Brabec, C.; Peters, I.M. Georeferencing of photovoltaic modules from aerial infrared videos using structure-from-motion. Prog. Photovolt. Res. Appl. 2022, 30, 1122–1135. [Google Scholar] [CrossRef] [Scilit]
- Kleebauer, M.; Horst, D.; Reudenbach, C. Semi-Automatic Generation of Training Samples for Detecting Renewable Energy Plants in High-Resolution Aerial Images. Remote Sens. 2021, 13, 4793. [Google Scholar] [CrossRef] [Scilit]
- Tan, H.; Guo, Z.; Lin, Z.; Chen, Y.; Huang, D.; Yuan, W.; Zhang, H.; Yan, J. General generative AI-based image augmentation method for robust rooftop PV segmentation. Appl. Energy 2024, 368, 123554. [Google Scholar] [CrossRef] [Scilit]
- Qian, Z.; Chen, M.; Zhong, T.; Zhang, F.; Zhu, R.; Zhang, Z.; Zhang, K.; Sun, Z.; Lü, G. Deep Roof Refiner: A detail-oriented deep learning network for refined delineation of roof structure lines using satellite imagery. Int. J. Appl. Earth Obs. Geoinf. 2022, 107, 102680. [Google Scholar] [CrossRef] [Scilit]
- Li, P.; Zhang, H.; Guo, Z.; Lyu, S.; Chen, J.; Li, W.; Song, X.; Shibasaki, R.; Yan, J. Understanding rooftop PV panel semantic segmentation of satellite and aerial images for better using machine learning. Adv. Appl. Energy 2021, 4, 100057. [Google Scholar] [CrossRef] [Scilit]
- Frimane, Â.; Johansson, R.; Munkhammar, J.; Lingfors, D.; Lindahl, J. Identifying small decentralized solar systems in aerial images using deep learning. Sol. Energy 2023, 262, 111822. [Google Scholar] [CrossRef] [Scilit]
- Castello, R.; Roquette, S.; Esguerra, M.; Guerra, A.; Scartezzini, J.-L. Deep learning in the built environment: Automatic detection of rooftop solar panels using Convolutional Neural Networks. Phys. Conf. Ser. 2019, 1343, 012034. [Google Scholar] [CrossRef] [Scilit]
- Mayer, K.; Rausch, B.; Arlt, M.-L.; Gust, G.; Wang, Z.; Neumann, D.; Rajagopal, R. 3D-PV-Locator: Large-scale detection of rooftop-mounted photovoltaic systems in 3D. Appl. Energy 2022, 310, 118469. [Google Scholar] [CrossRef] [Scilit]
- Lindahl, J.; Johansson, R.; Lingfors, D. Mapping of decentralised photovoltaic and solar thermal systems by remote sensing aerial imagery and deep machine learning for statistic generation. Energy AI 2023, 14, 100300. [Google Scholar] [CrossRef] [Scilit]
- Lu, N.; Li, L.; Qin, J. PV Identifier: Extraction of small-scale distributed photovoltaics in complex environments from high spatial resolution remote sensing images. Appl. Energy 2024, 365, 123311. [Google Scholar] [CrossRef] [Scilit]
- Paletta, Q.; Terrén-Serrano, G.; Nie, Y.; Li, B.; Bieker, J.; Zhang, W.; Dubus, L.; Dev, S.; Feng, C. Advances in solar forecasting: Computer vision with deep learning. Adv. Appl. Energy 2023, 11, 100150. [Google Scholar] [CrossRef] [Scilit]
- Jurakuziev, D.; Jumaboev, S.; Lee, M. A framework to estimate generating capacities of PV systems using satellite imagery segmentation. Eng. Appl. Artif. Intell. 2023, 123, 106186. [Google Scholar] [CrossRef] [Scilit]
- Zhu, R.; Guo, D.; Wong, M.S.; Qian, Z.; Chen, M.; Yang, B.; Chen, B.; Zhang, H.; You, L.; Heo, J.; et al. Deep solar PV refiner: A detail-oriented deep learning network for refined segmentation of photovoltaic areas from satellite imagery. Int. J. Appl. Earth Obs. Geoinf. 2022, 116, 103134. [Google Scholar] [CrossRef] [Scilit]
- Guo, Z.; Lu, J.; Chen, Q.; Liu, Z.; Song, C.; Tan, H.; Zhang, H.; Yan, J. TransPV: Refining photovoltaic panel detection accuracy through a vision transformer-based deep learning model. Appl. Energy 2023, 355, 122282. [Google Scholar] [CrossRef] [Scilit]
- Xia, Z.; Li, Y.; Guo, X.; Chen, R. High-resolution mapping of water photovoltaic development in China through satellite imagery. Int. J. Appl. Earth Obs. Geoinf. 2022, 107, 102707. [Google Scholar] [CrossRef] [Scilit]
- Braid, J.L.; Riley, D.; Pearce, J.M.; Burnham, L. Image Analysis Method for Quantifying Snow Losses on PV Systems. In Proceedings of the 2020 47th IEEE Photovoltaic Specialists Conference (PVSC), Calgary, AB, Canada, 15 June–21 August 2020; pp. 1510–1516. [Google Scholar] [CrossRef] [Scilit]
- Lin, F.; Zhang, Y.; Wang, J. Recent advances in intra-hour solar forecasting: A review of ground-based sky image methods. Int. J. Forecast. 2022, 39, 244–265. [Google Scholar] [CrossRef] [Scilit]
- Sawant, M.; Shende, M.K.; Feijóo-Lorenzo, A.E.; Bokde, N.D. The State-of-the-Art Progress in Cloud Detection, Identification, and Tracking Approaches: A Systematic Review. Energies 2021, 14, 8119. [Google Scholar] [CrossRef] [Scilit]
- Chu, Y.; Pedro, H.T.; Li, M.; Coimbra, C.F. Real-time forecasting of solar irradiance ramps with smart image processing. Sol. Energy 2015, 114, 91–104. [Google Scholar] [CrossRef] [Scilit]
- West, S.R.; Rowe, D.; Sayeef, S.; Berry, A. Short-term irradiance forecasting using skycams: Motivation and development. Sol. Energy 2014, 110, 188–207. [Google Scholar] [CrossRef] [Scilit]
- Kamadinata, J.O.; Ken, T.L.; Suwa, T. Sky image-based solar irradiance prediction methodologies using artificial neural networks. Renew. Energy 2019, 134, 837–845. [Google Scholar] [CrossRef] [Scilit]
- Chu, Y.; Urquhart, B.; Gohari, S.M.; Pedro, H.T.; Kleissl, J.; Coimbra, C.F. Short-term reforecasting of power output from a 48 MWe solar PV plant. Sol. Energy 2015, 112, 68–77. [Google Scholar] [CrossRef] [Scilit]
- Chu, Y.; Pedro, H.T.; Coimbra, C.F. Hybrid intra-hour DNI forecasts with sky image processing enhanced by stochastic learning. Sol. Energy 2013, 98, 592–603. [Google Scholar] [CrossRef] [Scilit]
- Pothineni, D.; Oswald, M.R.; Poland, J.; Pollefeys, M. KloudNet: Deep Learning for Sky Image Analysis and Irradiance Forecasting. In Pattern Recognition; Brox, T., Bruhn, A., Fritz, M., Eds.; GCPR 2018. Lecture Notes in Computer Science; Springer: Cham, Switzerland, 2019; Volume 11269. [Google Scholar] [CrossRef] [Scilit]
- Feng, C.; Zhang, J. SolarNet: A sky image-based deep convolutional neural network for intra-hour solar forecasting. Sol. Energy 2020, 204, 71–78. [Google Scholar] [CrossRef] [Scilit]
- Venugopal, V.; Sun, Y.; Brandt, A.R. Short-term solar PV forecasting using computer vision: The search for optimal CNN architectures for incorporating sky images and PV generation history. J. Renew. Sustain. Energy 2019, 11, 066102. [Google Scholar] [CrossRef] [Scilit]
- Wen, H.; Du, Y.; Chen, X.; Lim, E.; Wen, H.; Jiang, L. Deep Learning Based Multistep Solar Forecasting for PV Ramp-Rate Control Using Sky Images. IEEE Trans. Ind. Inform. 2021, 17, 1397–1406. [Google Scholar] [CrossRef] [Scilit]
- Feng, C.; Zhang, J.; Zhang, W.; Hodge, B.-M. Convolutional neural networks for intra-hour solar forecasting based on sky image sequences. Appl. Energy 2022, 310, 118438. [Google Scholar] [CrossRef] [Scilit]
- Ajith, M.; Martínez-Ramón, M. Deep learning based solar radiation micro forecast by fusion of infrared cloud images and radiation data. Appl. Energy 2021, 294, 117014. [Google Scholar] [CrossRef] [Scilit]
- Zhang, R.; Ma, H.; Saha, T.K.; Zhou, X. Photovoltaic Nowcasting with Bi-Level Spatio-Temporal Analysis Incorporating Sky Images. IEEE Trans. Sustain. Energy 2021, 12, 1766–1776. [Google Scholar] [CrossRef] [Scilit]
- Pérez, E.; Pérez, J.; Segarra-Tamarit, J.; Beltran, H. A deep learning model for intra-day forecasting of solar irradiance using satellite-based estimations in the vicinity of a PV power plant. Sol. Energy 2021, 218, 652–660. [Google Scholar] [CrossRef] [Scilit]
- Cheng, L.; Zang, H.; Wei, Z.; Ding, T.; Xu, R.; Sun, G. Short-term Solar Power Prediction Learning Directly from Satellite Images with Regions of Interest. IEEE Trans. Sustain. Energy 2021, 13, 629–639. [Google Scholar] [CrossRef] [Scilit]
- Sun, Y.C.; Venugopal, V.; Brandt, A.R. Short-term solar power forecast with deep learning: Exploring optimal input and output configuration. Sol. Energy 2019, 188, 730–741. [Google Scholar] [CrossRef] [Scilit]
- Sun, Y.; Szűcs, G.; Brandt, A.R. Solar PV output prediction from video streams using convolutional neural networks. Energy Environ. Sci. 2018, 11, 1811–1818. [Google Scholar] [CrossRef] [Scilit]
- Jiang, H.; Gu, Y.; Xie, Y.; Yang, R.; Zhang, Y. Solar Irradiance Capturing in Cloudy Sky Days–A Convolutional Neural Network Based Image Regression Approach. IEEE Access 2020, 8, 22235–22248. [Google Scholar] [CrossRef] [Scilit]
- Nie, Y.; Sun, Y.; Chen, Y.; Orsini, R.; Brandt, A. PV power output prediction from sky images using convolutional neural network: The comparison of sky-condition-specific sub-models and an end-to-end model. J. Renew. Sustain. Energy 2020, 12, 046101. [Google Scholar] [CrossRef] [Scilit]
- Lopez, V.A.M.; van Urk, G.; Doodkorte, P.J.; Zeman, M.; Isabella, O.; Ziar, H. Using sky-classification to improve the short-term prediction of irradiance with sky images and convolutional neural networks. Sol. Energy 2024, 269, 112320. [Google Scholar] [CrossRef] [Scilit]
- Ogliari, E.; Sakwa, M.; Cusa, P. Enhanced Convolutional Neural Network for solar radiation nowcasting: All-Sky camera infrared images embedded with exogeneous parameters. Renew. Energy 2024, 221, 119735. [Google Scholar] [CrossRef] [Scilit]
- Liu, J.; Zang, H.; Ding, T.; Cheng, L.; Wei, Z.; Sun, G. Harvesting spatiotemporal correlation from sky image sequence to improve ultra-short-term solar irradiance forecasting. Renew. Energy 2023, 209, 619–631. [Google Scholar] [CrossRef] [Scilit]
- Zhen, Z.; Liu, J.; Zhang, Z.; Wang, F.; Chai, H.; Yu, Y.; Lu, X.; Wang, T.; Lin, Y. Deep Learning Based Surface Irradiance Mapping Model for Solar PV Power Forecasting Using Sky Image. IEEE Trans. Ind. Appl. 2020, 56, 3385–3396. [Google Scholar] [CrossRef] [Scilit]
- Zhang, R.; Ma, H.; Saha, T.K.; Zhou, X. On Sky Imaging Analysis and Deep Learning for Photovoltaic Output Nowcasting. In Proceedings of the 2020 IEEE Power & Energy Society General Meeting (PESGM), Montreal, QC, Canada, 2–6 August 2020; pp. 1–5. [Google Scholar] [CrossRef] [Scilit]
- El Alani, O.; Abraim, M.; Ghennioui, H.; Ghennioui, A.; Ikenbi, I.; Dahr, F.-E. Short term solar irradiance forecasting using sky images based on a hybrid CNN–MLP model. Energy Rep. 2021, 7, 888–900. [Google Scholar] [CrossRef] [Scilit]
- Karout, Y.; Thil, S.; Eynard, J.; Guillot, E.; Grieu, S. Hybrid intrahour DNI forecast model based on DNI measurements and sky-imaging data. Sol. Energy 2022, 249, 541–558. [Google Scholar] [CrossRef] [Scilit]
- Qin, J.; Jiang, H.; Lu, N.; Yao, L.; Zhou, C. Enhancing solar PV output forecast by integrating ground and satellite observations with deep learning. Renew. Sustain. Energy Rev. 2022, 167, 112680. [Google Scholar] [CrossRef] [Scilit]
- Zhao, X.; Wei, H.; Wang, H.; Zhu, T.; Zhang, K. 3D-CNN-based feature extraction of ground-based cloud images for direct normal irradiance prediction. Sol. Energy 2019, 181, 510–518. [Google Scholar] [CrossRef] [Scilit]
- Yang, H.; Wang, L.; Huang, C.; Luo, X. 3D-CNN-Based Sky Image Feature Extraction for Short-Term Global Horizontal Irradiance Forecasting. Water 2021, 13, 1773. [Google Scholar] [CrossRef] [Scilit]
- Eşlik, A.H.; Akarslan, E.; Hocaoğlu, F.O. Short-term solar radiation forecasting with a novel image processing-based deep learning approach. Renew. Energy 2022, 200, 1490–1505. [Google Scholar] [CrossRef] [Scilit]
- Chu, T.-P.; Guo, J.-H.; Leu, Y.-G.; Chou, L.-F. Estimation of solar irradiance and solar power based on all-sky images. Sol. Energy 2022, 249, 495–506. [Google Scholar] [CrossRef] [Scilit]
- Rajagukguk, R.A.; Kamil, R.; Lee, H.-J. A Deep Learning Model to Forecast Solar Irradiance Using a Sky Camera. Appl. Sci. 2021, 11, 5049. [Google Scholar] [CrossRef] [Scilit]
- Yao, T.; Wang, J.; Wu, H.; Zhang, P.; Li, S.; Xu, K.; Liu, X.; Chi, X. Intra-Hour Photovoltaic Generation Forecasting Based on Multi-Source Data and Deep Learning Methods. IEEE Trans. Sustain. Energy 2021, 13, 607–618. [Google Scholar] [CrossRef] [Scilit]
- Si, Z.; Yang, M.; Yu, Y.; Ding, T. Photovoltaic power forecast based on satellite images considering effects of solar position. Appl. Energy 2021, 302, 117514. [Google Scholar] [CrossRef] [Scilit]
- Bo, Y.; Xia, Y.; Ni, Y.; Liu, K.; Wei, W. The ultra-short-term photovoltaic power prediction based on multi-exposure high-resolution total sky images using deep learning. Energy Rep. 2023, 9, 123–133. [Google Scholar] [CrossRef] [Scilit]
- Terrén-Serrano, G.; Martínez-Ramón, M. Deep learning for intra-hour solar forecasting with fusion of features extracted from infrared sky images. Inf. Fusion 2023, 95, 42–61. [Google Scholar] [CrossRef] [Scilit]
- Paletta, Q.; Arbod, G.; Lasenby, J. Omnivision forecasting: Combining satellite and sky images for improved deterministic and probabilistic intra-hour solar energy predictions. Appl. Energy 2023, 336, 120818. [Google Scholar] [CrossRef] [Scilit]
- Paletta, Q.; Hu, A.; Arbod, G.; Lasenby, J. ECLIPSE: Envisioning CLoud Induced Perturbations in Solar Energy. Appl. Energy 2022, 326, 119924. [Google Scholar] [CrossRef] [Scilit]
- Zhang, L.; Wilson, R.; Sumner, M.; Wu, Y. Advanced multimodal fusion method for very short-term solar irradiance forecasting using sky images and meteorological data: A gate and transformer mechanism approach. Renew. Energy 2023, 216, 118952. [Google Scholar] [CrossRef] [Scilit]
- Liu, J.; Zang, H.; Cheng, L.; Ding, T.; Wei, Z.; Sun, G. A Transformer-based multimodal-learning framework using sky images for ultra-short-term solar irradiance forecasting. Appl. Energy 2023, 342, 121160. [Google Scholar] [CrossRef] [Scilit]
- Mercier, T.M.; Sabet, A.; Rahman, T. Vision transformer models to measure solar irradiance using sky images in temperate climates. Appl. Energy 2024, 362, 122967. [Google Scholar] [CrossRef] [Scilit]
- Xu, S.; Zhang, R.; Ma, H.; Ekanayake, C.; Cui, Y. On vision transformer for ultra-short-term forecasting of photovoltaic generation using sky images. Sol. Energy 2023, 267, 112203. [Google Scholar] [CrossRef] [Scilit]
- Fu, Y.; Chai, H.; Zhen, Z.; Wang, F.; Xu, X.; Li, K.; Shafie-Khah, M.; Dehghanian, P.; Catalao, J.P.S. Sky Image Prediction Model Based on Convolutional Auto-Encoder for Minutely Solar PV Power Forecasting. IEEE Trans. Ind. Appl. 2021, 57, 3272–3281. [Google Scholar] [CrossRef] [Scilit]
- Zhen, Z.; Zhang, X.; Mei, S.; Chang, X.; Chai, H.; Yin, R.; Wang, F. Ultra-short-term irradiance forecasting model based on ground-based cloud image and deep learning algorithm. IET Renew. Power Gener. 2021, 16, 2604–2616. [Google Scholar] [CrossRef] [Scilit]
- Trigo-González, M.; Cortés-Carmona, M.; Marzo, A.; Alonso-Montesinos, J.; Martínez-Durbán, M.; López, G.; Portillo, C.; Batlles, F.J. Photovoltaic power electricity generation nowcasting combining sky camera images and learning supervised algorithms in the Southern Spain. Renew. Energy 2023, 206, 251–262. [Google Scholar] [CrossRef] [Scilit]
- Chu, Y.; Li, M.; Coimbra, C.F. Sun-tracking imaging system for intra-hour DNI forecasts. Renew. Energy 2016, 96, 792–799. [Google Scholar] [CrossRef] [Scilit]
- Hu, K.; Cao, S.; Wang, L.; Li, W.; Lv, M. A new ultra-short-term photovoltaic power prediction model based on ground-based cloud images. J. Clean. Prod. 2018, 200, 731–745. [Google Scholar] [CrossRef] [Scilit]
- Song, S.; Yang, Z.; Goh, H.; Huang, Q.; Li, G. A novel sky image-based solar irradiance nowcasting model with convolutional block attention mechanism. Energy Rep. 2022, 8, 125–132. [Google Scholar] [CrossRef] [Scilit]
- Manandhar, P.; Temimi, M.; Aung, Z. Short-term solar radiation forecast using total sky imager via transfer learning. Energy Rep. 2022, 9, 819–828. [Google Scholar] [CrossRef] [Scilit]
- Nespoli, A.; Niccolai, A.; Ogliari, E.; Perego, G.; Collino, E.; Ronzio, D. Machine Learning techniques for solar irradiation nowcasting: Cloud type classification forecast through satellite data and imagery. Appl. Energy 2022, 305, 117834. [Google Scholar] [CrossRef] [Scilit]
- Anagnostos, D.; Schmidt, T.; Cavadias, S.; Soudris, D.; Poortmans, J.; Catthoor, F. A method for detailed, short-term energy yield forecasting of photovoltaic installations. Renew. Energy 2019, 130, 122–129. [Google Scholar] [CrossRef] [Scilit]
- Wen, H.; Du, Y.; Chen, X.; Lim, E.G.; Wen, H.; Yan, K. A regional solar forecasting approach using generative adversarial networks with solar irradiance maps. Renew. Energy 2023, 216, 119043. [Google Scholar] [CrossRef] [Scilit]
- López-Cuesta, M.; Aler-Mur, R.; Galván-León, I.M.; Rodríguez-Benítez, F.J.; Pozo-Vázquez, A.D. Improving Solar Radiation Nowcasts by Blending Data-Driven, Satellite-Images-Based and All-Sky-Imagers-Based Models Using Machine Learning Techniques. Remote Sens. 2023, 15, 2328. [Google Scholar] [CrossRef] [Scilit]
- Al-lahham, A.; Theeb, O.; Elalem, K.A.; Alshawi, T.A.; Alshebeili, S. Sky Imager-Based Forecast of Solar Irradiance Using Machine Learning. Electronics 2020, 9, 1700. [Google Scholar] [CrossRef] [Scilit]
- Chu, Y.; Li, M.; Pedro, H.T.; Coimbra, C.F. Real-time prediction intervals for intra-hour DNI forecasts. Renew. Energy 2015, 83, 234–244. [Google Scholar] [CrossRef] [Scilit]
- Terrén-Serrano, G.; Martínez-Ramón, M. Multi-layer wind velocity field visualization in infrared images of clouds for solar irradiance forecasting. Appl. Energy 2021, 288, 116656. [Google Scholar] [CrossRef] [Scilit]
- Jang, H.S.; Bae, K.Y.; Park, H.; Sung, D.K. Solar Power Prediction Based on Satellite Images and Support Vector Machine. IEEE Trans. Sustain. Energy 2016, 7, 1255–1263. [Google Scholar] [CrossRef] [Scilit]
- Wang, F.; Xuan, Z.; Zhen, Z.; Li, Y.; Li, K.; Zhao, L.; Shafie-Khah, M.; Catalão, J.P. A minutely solar irradiance forecasting method based on real-time sky image-irradiance mapping model. Energy Convers. Manag. 2020, 220, 113075. [Google Scholar] [CrossRef] [Scilit]
- Straub, N.; Herzberg, W.; Dittmann, A.; Lorenz, E. Blending of a novel all sky imager model with persistence and a satellite based model for high-resolution irradiance nowcasting. Sol. Energy 2024, 269, 112319. [Google Scholar] [CrossRef] [Scilit]
- Catalina, A.; Torres-Barrán, A.; Alaíz, C.M.; Dorronsoro, J.R. Machine Learning Nowcasting of PV Energy Using Satellite Data. Neural Process. Lett. 2020, 52, 97–115. [Google Scholar] [CrossRef] [Scilit]
- Peng, Z.; Yu, D.; Huang, D.; Heiser, J.; Yoo, S.; Kalb, P. 3D cloud detection and tracking system for solar forecast using multiple sky imagers. Sol. Energy 2015, 118, 496–519. [Google Scholar] [CrossRef] [Scilit]
- Nie, Y.; Zelikman, E.; Scott, A.; Paletta, Q.; Brandt, A. SkyGPT: Probabilistic ultra-short-term solar forecasting using synthetic sky images from physics-constrained VideoGPT. Adv. Appl. Energy 2024, 14, 100172. [Google Scholar] [CrossRef] [Scilit]
- Arbizu-Barrena, C.; Ruiz-Arias, J.A.; Rodríguez-Benítez, F.J.; Pozo-Vázquez, D.; Tovar-Pescador, J. Short-term solar radiation forecasting by advecting and diffusing MSG cloud index. Sol. Energy 2017, 155, 1092–1103. [Google Scholar] [CrossRef] [Scilit]
- Terrén-Serrano, G.; Martínez-Ramón, M. Processing of global solar irradiance and ground-based infrared sky images for solar nowcasting and intra-hour forecasting applications. Sol. Energy 2023, 264, 111968. [Google Scholar] [CrossRef] [Scilit]
- Caldas, M.; Alonso-Suárez, R. Very short-term solar irradiance forecast using all-sky imaging and real-time irradiance measurements. Renew. Energy 2019, 143, 1643–1658. [Google Scholar] [CrossRef] [Scilit]
- Chu, Y.; Li, M.; Pedro, H.T.; Coimbra, C.F. A network of sky imagers for spatial solar irradiance assessment. Renew. Energy 2022, 187, 1009–1019. [Google Scholar] [CrossRef] [Scilit]
- Terrén-Serrano, G.; Martínez-Ramón, M. Kernel learning for intra-hour solar forecasting with infrared sky images and cloud dynamic feature extraction. Renew. Sustain. Energy Rev. 2023, 175, 113125. [Google Scholar] [CrossRef] [Scilit]
- Nou, J.; Chauvin, R.; Eynard, J.; Thil, S.; Grieu, S. Towards the intrahour forecasting of direct normal irradiance using sky-imaging data. Heliyon 2018, 4, e00598. [Google Scholar] [CrossRef] [Scilit] [PubMed]
- Ghonima, M.S.; Urquhart, B.; Chow, C.W.; Shields, J.E.; Cazorla, A.; Kleissl, J. A method for cloud detection and opacity classification ground-based round-based sky imagery. Atmos. Meas. Tech. 2012, 5, 2881–2892. [Google Scholar] [CrossRef] [Scilit]
- Li, Q.; Lu, W.; Yang, J. A Hybrid Thresholding Algorithm for Cloud Detection on Ground-Based Color Images. J. Atmos. Ocean. Technol. 2011, 28, 1286–1296. [Google Scholar] [CrossRef] [Scilit]
- Zhang, J.; Verschae, R.; Nobuhara, S.; Lalonde, J.-F. Deep photovoltaic nowcasting. Sol. Energy 2018, 176, 267–276. [Google Scholar] [CrossRef] [Scilit]
- Paletta, Q.; Arbod, G.; Lasenby, J. Benchmarking of deep learning irradiance forecasting models from sky images –An in-depth analysis. Sol. Energy 2021, 224, 855–867. [Google Scholar] [CrossRef] [Scilit]
- Kong, W.; Jia, Y.; Dong, Z.Y.; Meng, K.; Chai, S. Hybrid approaches based on deep whole-sky-image learning to photovoltaic generation forecasting. Appl. Energy 2020, 280, 115875. [Google Scholar] [CrossRef] [Scilit]
- Li, M.; Chu, Y.; Pedro, H.T.; Coimbra, C.F. Quantitative evaluation of the impact of cloud transmittance and cloud velocity on the accuracy of short-term DNI forecasts. Renew. Energy 2016, 86, 1362–1371. [Google Scholar] [CrossRef] [Scilit]
- Lourenco, M.; Barreto, J.P.; Vasconcelos, F. sRD-SIFT: Keypoint Detection and Matching in Images With Radial Distortion. IEEE Trans. Robot. 2012, 28, 752–760. [Google Scholar] [CrossRef] [Scilit]
- Nonnenmacher, L.; Coimbra, C.F. Streamline-based method for intra-day solar forecasting through remote sensing. Sol. Energy 2014, 108, 447–459. [Google Scholar] [CrossRef] [Scilit]
- Gui, L.C.; Merzkirch, W. A method of tracking ensembles of particle images. Exp. Fluids 1996, 21, 465–468. [Google Scholar] [CrossRef] [Scilit]
- Marquez, R.; Coimbra, C.F. Intra-hour DNI forecasting based on cloud tracking image analysis. Sol. Energy 2013, 91, 327–336. [Google Scholar] [CrossRef] [Scilit]
- Chow, C.W.; Urquhart, B.; Lave, M.; Dominguez, A.; Kleissl, J.; Shields, J.; Washom, B. Intra-hour forecasting with a total sky imager at the UC San Diego solar energy testbed. Sol. Energy 2011, 85, 2881–2893. [Google Scholar] [CrossRef] [Scilit]
- Nouri, B.; Kuhn, P.; Wilbert, S.; Prahl, C.; Pitz-Paal, R.; Blanc, P.; Schmidt, T.; Yasser, Z.; Santigosa, L.R.; Heineman, D. Nowcasting of DNI maps for the solar field based on voxel carving and individual 3D cloud objects from all sky images. AIP Conf. Proc. 2018, 2033, 190011. [Google Scholar] [CrossRef] [Scilit]
- Hammer, A.; Heinemann, D.; Lorenz, E.; Lückehe, B. Short-term forecasting of solar radiation: A statistical approach using satellite data. Sol. Energy 1999, 67, 139–150. [Google Scholar] [CrossRef] [Scilit]
- Nouri, B.; Wilbert, S.; Segura, L.; Kuhn, P.; Hanrieder, N.; Kazantzidis, A.; Schmidt, T.; Zarzalejo, L.; Blanc, P.; Pitz-Paal, R. Determination of cloud transmittance for all sky imager based solar nowcasting. Sol. Energy 2019, 181, 251–263. [Google Scholar] [CrossRef] [Scilit]
- Zhen, Z.; Pang, S.; Wang, F.; Li, K.; Li, Z.; Ren, H.; Shafie-Khah, M.; Catalao, J.P.S. Pattern Classification and PSO Optimal Weights Based Sky Images Cloud Motion Speed Calculation Method for Solar PV Power Forecasting. IEEE Trans. Ind. Appl. 2019, 55, 3331–3342. [Google Scholar] [CrossRef] [Scilit]
- Kuhn, P.; Nouri, B.; Wilbert, S.; Prahl, C.; Kozonek, N.; Schmidt, T.; Yasser, Z.; Ramirez, L.; Zarzalejo, L.; Meyer, A.; et al. Validation of an all-sky imager–based nowcasting system for industrial PV plants. Prog. Photovolt. Res. Appl. 2017, 26, 608–621. [Google Scholar] [CrossRef] [Scilit]
- Rajagukguk, R.A.; Choi, W.-K.; Lee, H. Sun-blocking index from sky image to estimate solar irradiance. Build. Environ. 2022, 223, 109481. [Google Scholar] [CrossRef] [Scilit]
- Fouad, M.M.; Shihata, L.A.; Morgan, E.I. An integrated review of factors influencing the perfomance of photovoltaic panels. Renew. Sustain. Energy Rev. 2017, 80, 1499–1511. [Google Scholar] [CrossRef] [Scilit]
- Kazem, H.A.; Chaichan, M.T.; Al-Waeli, A.H.; Sopian, K. A review of dust accumulation and cleaning methods for solar photovoltaic systems. J. Clean. Prod. 2020, 276, 123187. [Google Scholar] [CrossRef] [Scilit]
- Alatwi, A.M.; Albalawi, H.; Wadood, A.; Anwar, H.; El-Hageen, H.M. Deep Learning-Based Dust Detection on Solar Panels: A Low-Cost Sustainable Solution for Increased Solar Power Generation. Sustainability 2024, 16, 8664. [Google Scholar] [CrossRef] [Scilit]
- Abuqaaud, K.A.; Ferrah, A. A Novel Technique for Detecting and Monitoring Dust and Soil on Solar Photovoltaic Panel. In Proceedings of the 2020 Advances in Science and Engineering Technology International Conferences (ASET), Dubai, United Arab Emirates, 4 February–9 April 2020; pp. 1–6. [Google Scholar] [CrossRef] [Scilit]
- Hanafy, W.A.; Pina, A.; Salem, S.A. Machine Learning Approach for Photovoltaic Panels Cleanliness Detection. In Proceedings of the 2019 15th International Computer Engineering Conference, Cairo, Egypt, 29–30 December 2019. [Google Scholar] [CrossRef] [Scilit]
- Ozturk, O.; Hangun, B.; Eyecioglu, O. Detecting Snow Layer on Solar Panels using Deep Learning. In Proceedings of the 10th IEEE International Conference on Renewable Energy Research and Applications (ICRERA), Istanbul, Turkey, 26–29 September 2021. [Google Scholar] [CrossRef] [Scilit]
- Supe, H.; Avtar, R.; Singh, D.; Gupta, A.; Yunus, A.P.; Dou, J.; Ravankar, A.A.; Mohan, G.; Chapagain, S.K.; Sharma, V.; et al. Google Earth Engine for the Detection of Soiling on Photovoltaic Solar Panels in Arid Environments. Remote Sens. 2020, 12, 1466. [Google Scholar] [CrossRef] [Scilit]
- Cruz-Rojas, T.; Franco, J.A.; Hernandez-Escobedo, Q.; Ruiz-Robles, D.; Juarez-Lopez, J.M. A novel comparison of image semantic segmentation techniques for detecting dust in photovoltaic panels using machine learning and deep learning. Renew. Energy 2023, 217, 119126. [Google Scholar] [CrossRef] [Scilit]
- Tribak, H.; Zaz, Y. Dust Soiling Concentration Measurement on Solar Panels based on Image Entropy. In Proceedings of the 2019 7th International Renewable and Sustainable Energy Conference (IRSEC), Agadir, Morocco, 27–30 November 2019; pp. 1–4. [Google Scholar] [CrossRef] [Scilit]
- Unluturk, M.; Kulaksiz, A.A.; Unluturk, A. Image Processing-based Assessment of Dust Accumulation on Photovoltaic Modules. In Proceedings of the 2019 1st Global Power, Energy and Communication Conference (GPECOM), Nevsehir, Turkey, 12–15 June 2019; pp. 308–311. [Google Scholar] [CrossRef] [Scilit]
- Onim, S.H.; Sakif, Z.M.M.; Ahnaf, A.; Kabir, A.; Azad, A.K.; Oo, A.M.T.; Afreen, R.; Hridy, S.T.; Hossain, M.; Jabid, T.; et al. SolNet: A Convolutional Neural Network for Detecting Dust on Solar Panels. Energies 2023, 16, 155. [Google Scholar] [CrossRef] [Scilit]
- Zhou, Y.-J.; Sun, H.-R. Water photovoltaic plant contaminant identification using visible light images. Sustain. Energy Technol. Assess. 2022, 53, 102476. [Google Scholar] [CrossRef] [Scilit]
- Fan, S.; Wang, X.; Wang, Z.; Sun, B.; Zhang, Z.; Cao, S.; Zhao, B.; Wang, Y. A novel image enhancement algorithm to determine the dust level on photovoltaic (PV) panels. Renew. Energy 2022, 201, 172–180. [Google Scholar] [CrossRef] [Scilit]
- Fan, S.; Wang, Y.; Cao, S.; Zhao, B.; Sun, T.; Liu, P. A deep residual neural network identification method for uneven dust accumulation on photovoltaic (PV) panels. Energy 2022, 239, 122302. [Google Scholar] [CrossRef] [Scilit]
- Zhang, X.; Araji, M.T. Snow loss modeling for solar modules using image processing and deep learning. Sustain. Energy Grids Netw. 2023, 34, 101036. [Google Scholar] [CrossRef] [Scilit]
- Araji, M.T.; Waqas, A.; Ali, R. Utilizing deep learning towards real-time snow cover detection and energy loss estimation for solar modules. Appl. Energy 2024, 375, 124201. [Google Scholar] [CrossRef] [Scilit]
- Amaral, T.G.; Pires, A.J.; Pires, F.V. Solar Panel Fault Detection using Lightweight SqueezeNet model. In Proceedings of the 14th International Conference on Renewable Energy Research and Applications, Vienna, Austria, 27–30 October 2025. [Google Scholar]
- Saleem, A.; Awad, A.; Mazen, A.; Mazurkiewicz, Z.; Dyreson, A. Estimating Snow Coverage Percentage on Solar Panels Using Drone Imagery and Machine Learning for Enhanced Energy Efficiency. Energies 2025, 18, 1729. [Google Scholar] [CrossRef] [Scilit]
- Al-Dulaimi, A.A.; Guneser, M.T.; Hameed, A.A.; Márquez, F.P.G.; Fitriyani, N.L.; Syafrudin, M. Performance Analysis of Classification and Detection for PV Panel Motion Blur Images Based on Deblurring and Deep Learning Techniques. Sustainability 2023, 15, 1150. [Google Scholar] [CrossRef] [Scilit]
- Hwang, P.C.; Ku, C.C.-Y.; Chan, J.C.-C. Soiling Detection for Photovoltaic Modules Based on an Intelligent Method with Image Processing. In Proceedings of the 2020 IEEE International Conference on Consumer Electronics—Taiwan (ICCE-Taiwan), Taoyuan, Taiwan, 28–30 September 2020; pp. 1–2. [Google Scholar] [CrossRef] [Scilit]
- Naeem, U.; Chadda, K.; Vahaji, S.; Ahmad, J.; Li, X.; Asadi, E. Aerial Imaging-Based Soiling Detection System for Solar Photovoltaic Panel Cleanliness Inspection. Sensors 2025, 25, 738. [Google Scholar] [CrossRef] [Scilit] [PubMed]
- Cipriani, G.; D’amico, A.; Guarino, S.; Manno, D.; Traverso, M.; Di Dio, V. Convolutional Neural Network for Dust and Hotspot Classification in PV Modules. Energies 2020, 13, 6357. [Google Scholar] [CrossRef] [Scilit]
- Espinosa, A.R.; Bressan, M.; Giraldo, L.F. Failure signature classification in solar photovoltaic plants using RGB images and convolutional neural networks. Renew. Energy 2020, 162, 249–256. [Google Scholar] [CrossRef] [Scilit]
- Venkatakrishnan, G.R.; Rengaraj, R.; Tamilselvi, S.; Harshini, J.; Sahoo, A.; Saleel, C.A.; Abbas, M.; Cuce, E.; Jazlyn, C.; Shaik, S.; et al. Detection, location, and diagnosis of different faults in large solar PV system—A review. Int. J. Low-Carbon Technol. 2023, 18, 659–674. [Google Scholar] [CrossRef] [Scilit]
- Josè, D.F.; Janeiro, F.M.; Pires, V.F.; Pires, A.J.; Martins, J.F. Artificial Intelligence for Fault Detection in Photovoltaic Panels. In Proceedings of the IEEE 19th International Conference on Compatibility, Power Electronics and Power Engineering (CPE-POWERENG), Antalya, Türkiye, 20–22 May 2025. [Google Scholar] [CrossRef] [Scilit]
- Jordan, D.C.; Silverman, T.J.; Wohlgemuth, J.H.; Kurtz, S.R.; VanSant, K.T. Photovoltaic failure and degradation modes. Prog. Photovolt. Res. Appl. 2017, 25, 318–326. [Google Scholar] [CrossRef] [Scilit]
- Sridharan, N.V.; Sugumaran, V. Visual fault detection in photovoltaic modules using decision tree algorithms with deep learning features. Energy Sources Part A Recover. Util. Environ. Eff. 2021, 47, 2020379. [Google Scholar] [CrossRef] [Scilit]
- Sridharan, N.V.; Vaithiyanathan, S.; Aghaei, M. Voting based ensemble for detecting visual faults in photovoltaic modules using AlexNet features. Energy Rep. 2024, 11, 3889–3901. [Google Scholar] [CrossRef] [Scilit]
- Triki-Lahiani, A.; Abdelghani, A.B.-B.; Slama-Belkhodja, I. Fault detection and monitoring systems for photovoltaic installations: A review. Renew. Sustain. Energy Rev. 2018, 82, 2680–2692. [Google Scholar] [CrossRef] [Scilit]
- Jaffery, Z.A.; Dubey, A.K.; Irshad; Haque, A. Scheme for predictive fault diagnosis in photo-voltaic modules using thermal imaging. Infrared Phys. Technol. 2017, 83, 182–187. [Google Scholar] [CrossRef] [Scilit]
- Breitenstein, O.; Bauer, J.; Bothe, K.; Hinken, D.; Muller, J.; Kwapil, W.; Schubert, M.C.; Warta, W. Can luminescence imaging replace lockin thermography on solar cells? IEEE J. Photovolt. 2011, 1, 159–167. [Google Scholar] [CrossRef] [Scilit]
- Rahman, R.; Tabassum, S.; Haque, E.; Nishat, M.M.; Faisal, F.; Hossain, E. CNN-based Deep Learning Approach for Micro-crack Detection of Solar Panels. In Proceedings of the 3rd International Conference on Sustainable Technologies for Industry 4.0 (STI), Dhaka, Bangladesh, 18–19 December 2021. [Google Scholar]
- Hussain, M.; Al-Aqrabi, H.; Hill, R. PV-CrackNet Architecture for Filter Induced Augmentation and Micro-Cracks Detection within a Photovoltaic Manufacturing Facility. Energies 2022, 15, 8667. [Google Scholar] [CrossRef] [Scilit]
- Pillai, D.S.; Rajasekar, N. A comprehensive review on protection challenges and fault diagnosis in PV systems. Renew. Sustain. Energy Rev. 2018, 91, 18–40. [Google Scholar] [CrossRef] [Scilit]
- Dolara, A.; Leva, S.; Manzolini, G.; Ogliari, E. Investigation on Performance Decay on Photovoltaic Modules: Snail Trails and Cell Microcracks. IEEE J. Photovolt. 2014, 4, 1204–1211. [Google Scholar] [CrossRef] [Scilit]
- Lestary, F.D.; Syafaruddin; Areni, I.S. Deep Learning Implementation for Snail Trails Detection in Photovoltaic Module. In Proceedings of the FORTEI-International Conference on Electrical Engineering (FORTEI-ICEE), Riau, Indonesia, 11–12 October 2022. [Google Scholar] [CrossRef] [Scilit]
- Venkatesh, S.N.; Sugumaran, V.; Subramanian, B.; Josephin, J.F.; Varuvel, E.G. A comparative study on bayes classifier for detecting photovoltaic module visual faults using deep learning features. Sustain. Energy Technol. Assess. 2024, 64, 103713. [Google Scholar] [CrossRef] [Scilit]
- Krizhevsky, A.; Sutskever, I.; Hinton, G.E. ImageNet Classification with Deep Convolutional Neural Networks. Commun. ACM 2017, 60, 84–90. [Google Scholar] [CrossRef] [Scilit]
- Niazi, K.A.K.; Akhtar, W.; Khan, H.A.; Yang, Y.; Athar, S. Hotspot diagnosis for solar photovoltaic modules using a Naive Bayes classifier. Sol. Energy 2019, 190, 34–43. [Google Scholar] [CrossRef] [Scilit]
- Salazar, A.M.; Macabebe, E.Q.B. Hotspots Detection in Photovoltaic Modules Using Infrared Thermography. MATEC Web Conf. 2016, 70, 10015. [Google Scholar] [CrossRef] [Scilit]
- Nie, J.; Luo, T.; Li, H. Automatic hotspots detection based on UAV infrared images for large-scale PV plant. Electron. Lett. 2020, 56, 993–995. [Google Scholar] [CrossRef] [Scilit]
- Liu, J.; Ji, N. A bright spot detection and analysis method for infrared photovoltaic panels based on image processing. Front. Energy Res. 2023, 10, 978247. [Google Scholar] [CrossRef] [Scilit]
- Kuo, C.-F.J.; Chen, S.-H.; Huang, C.-Y. Automatic detection, classification and localization of defects in large photovoltaic plants using unmanned aerial vehicles (UAV) based infrared (IR) and RGB imaging. Energy Convers. Manag. 2023, 276, 116495. [Google Scholar] [CrossRef] [Scilit]
- Vlaminck, M.; Heidbuchel, R.; Philips, W.; Luong, H. Region-Based CNN for Anomaly Detection in PV Power Plants Using Aerial Imagery. Sensors 2022, 22, 1244. [Google Scholar] [CrossRef] [Scilit]
- de Oliveira, A.K.V.; Aghaei, M.; Rüther, R. Automatic Fault Detection of Photovoltaic Array by Convolutional Neural Networks during Aerial Infrared Thermography. In Proceedings of the 36th European Photovoltaic Solar Energy Conference and Exhibition, Marseille, France, 9–13 September 2019; pp. 1302–1307. [Google Scholar] [CrossRef]
- Dotenco, S.; Dalsass, M.; Winkler, L.; Wurzner, T.; Brabec, C.; Maier, A.; Gallwitz, F. Automatic detection and analysis of photovoltaic modules in aerial infrared imagery. In Proceedings of the 2016 IEEE Winter Conference on Applications of Computer Vision (WACV), Lake Placid, NY, USA, 7–9 March 2016; pp. 1–9. [Google Scholar] [CrossRef] [Scilit]
- Bakır, H.; Kuzhippallil, F.A.; Merabet, A. Automatic detection of deteriorated photovoltaic modules using IRT images and deep learning (CNN, LSTM) strategies. Eng. Fail. Anal. 2023, 146, 107132. [Google Scholar] [CrossRef] [Scilit]
- Ren, Y.; Yu, Y.; Li, J.; Zhang, W. Design of photovoltaic hot spot detection system based on deep learning. J. Phys. Conf. Ser. 2020, 1693, 012075. [Google Scholar] [CrossRef] [Scilit]
- Ramírez, I.S.; Márquez, F.P.G.; Chaparro, J.P. Convolutional neural networks and Internet of Things for fault detection by aerial monitoring of photovoltaic solar plants. Measurement 2024, 234, 114861. [Google Scholar] [CrossRef] [Scilit]
- Oulefki, A.; Himeur, Y.; Trongtirakul, T.; Amara, K.; Agaian, S.; Benbelkacem, S.; Guerroudji, M.A.; Zemmouri, M.; Ferhat, S.; Zenati, N.; et al. Detection and analysis of deteriorated areas in solar PV modules using unsupervised sensing algorithms and 3D augmented reality. Heliyon 2024, 10, e27973. [Google Scholar] [CrossRef] [Scilit]
- Zheng, Q.; Ma, J.; Liu, M.; Liu, Y.; Li, Y.; Shi, G. Lightweight Hot-Spot Fault Detection Model of Photovoltaic Panels in UAV Remote-Sensing Image. Sensors 2022, 22, 4617. [Google Scholar] [CrossRef] [Scilit]
- Sriram, A.; Sudhakar, T.D. Photovoltaic Cell Panels Soiling Inspection Using Principal Component Thermal Image Processing. Comput. Syst. Sci. Eng. 2023, 45, 2761–2772. [Google Scholar] [CrossRef] [Scilit]
- Ali, M.U.; Khan, H.F.; Masud, M.; Kallu, K.D.; Zafar, A. A machine learning framework to identify the hotspot in photovoltaic module using infrared thermography. Sol. Energy 2020, 208, 643–651. [Google Scholar] [CrossRef] [Scilit]
- Mobin, O.H.; Tajwar, T.; Khan, F.R.; Hossain, S.F. Infrared Thermography Based Defect Analysis of Photovoltaic Modules Using Machine Learning. Bachelor’s Thesis, Brac University, Dhaka, Bangladesh, 2020. [Google Scholar]
- Menéndez, O.; Guamán, R.; Pérez, M.; Cheein, F.A. Photovoltaic Modules Diagnosis Using Artificial Vision Techniques for Artifact Minimization. Energies 2018, 11, 1688. [Google Scholar] [CrossRef] [Scilit]
- Tsanakas, J.; Chrysostomou, D.; Botsaris, P.; Gasteratos, A. Fault diagnosis of photovoltaic modules through image processing and Canny edge detection on field thermographic measurements. Int. J. Sustain. Energy 2013, 34, 351–372. [Google Scholar] [CrossRef] [Scilit]
- Huerta Herraiz, A.; Marugán, A.P.; Márquez, F.P.G. Photovoltaic plant condition monitoring using thermal images analysis by convolutional neural network-based structure. Renew. Energy 2020, 153, 334–348. [Google Scholar] [CrossRef] [Scilit]
- Liu, B.; Chen, L.; Sun, K.; Wang, X.; Zhao, J. A Hot Spot Identification Approach for Photovoltaic Module Based on Enhanced U-Net with Squeeze-and-Excitation and VGG19. IEEE Trans. Instrum. Meas. 2024, 73, 3516510. [Google Scholar] [CrossRef] [Scilit]
- Pierdicca, R.; Malinverni, E.S.; Piccinini, F.; Paolanti, M.; Felicetti, A.; Zingaretti, P. Deep convolutional neural network for automatic detection of damaged photovoltaic cells. Int. Arch. Photogramm. Remote Sens. Spat. Inf. Sci. 2018, 42, 893–900. [Google Scholar] [CrossRef] [Scilit]
- Wei, S.; Li, X.; Ding, S.; Yang, Q.; Yan, W. Hotspots Infrared detection of photovoltaic modules based on Hough line transformation and Faster-RCNN approach. In Proceedings of the 2019 6th International Conference on Control, Decision and Information Technologies (CoDIT), Paris, France, 23–26 April 2019; pp. 1266–1271. [Google Scholar]
- Manno, D.; Cipriani, G.; Ciulla, G.; Di Dio, V.; Guarino, S.; Brano, V.L. Deep learning strategies for automatic fault diagnosis in photovoltaic systems by thermographic images. Energy Convers. Manag. 2021, 241, 114315. [Google Scholar] [CrossRef] [Scilit]
- Su, B.; Chen, H.; Liu, K.; Liu, W. RCAG-Net: Residual Channelwise Attention Gate Network for Hot Spot Defect Detection of Photovoltaic Farms. IEEE Trans. Instrum. Meas. 2021, 70, 3510514. [Google Scholar] [CrossRef] [Scilit]
- Su, Y.; Tao, F.; Jin, J.; Zhang, C. Automated Overheated Region Object Detection of Photovoltaic Module with Thermography Image. IEEE J. Photovolt. 2021, 11, 535–544. [Google Scholar] [CrossRef] [Scilit]
- Xiao, C.; Hacke, P.; Johnston, S.; Sulas-Kern, D.B.; Jiang, C.; Al-Jassim, M. Failure analysis of field-failed bypass diodes. Prog. Photovolt. Res. Appl. 2020, 28, 909–918. [Google Scholar] [CrossRef] [Scilit]
- Baltacı, Ö.; Kıral, Z.; Dalkılınç, K.; Karaman, O. Thermal Image and Inverter Data Analysis for Fault Detection and Diagnosis of PV Systems. Appl. Sci. 2024, 14, 3671. [Google Scholar] [CrossRef] [Scilit]
- Mellit, A. An embedded solution for fault detection and diagnosis of photovoltaic modules using thermographic images and deep convolutional neural networks. Eng. Appl. Artif. Intell. 2022, 116, 105459. [Google Scholar] [CrossRef] [Scilit]
- Hafez, A.; Soliman, A.; El-Metwally, K.; Ismail, I. Tilt and azimuth angles in solar energy applications—A review. Renew. Sustain. Energy Rev. 2017, 77, 147–168. [Google Scholar] [CrossRef] [Scilit]
- Yadav, A.K.; Chandel, S. Tilt angle optimization to maximize incident solar radiation: A review. Renew. Sustain. Energy Rev. 2013, 23, 503–513. [Google Scholar] [CrossRef] [Scilit]
- Quesada, G.; Guillon, L.; Rousse, D.R.; Mehrtash, M.; Dutil, Y.; Paradis, P.-L. Tracking strategy for photovoltaic solar systems in high latitudes. Energy Convers. Manag. 2015, 103, 147–156. [Google Scholar] [CrossRef] [Scilit]
- Dienst, S.; Schmidt, J.; Kühne, S. Case Study: Condition Assessment of a Photovoltaic Power Plant using Change-Point Analysis. In Proceedings of the International Conference on Smart Grids and Green IT Systems (SMARTGREENS), Aachen, Germany, 9–10 May 2013; pp. 1–16. [Google Scholar]
- Amaral, T.G.; Pires, V.F. Fault detection in trackers for PV systems based on a pattern recognition approach. Int. Trans. Electr. Energy Syst. 2018, 29, e2771. [Google Scholar] [CrossRef] [Scilit]
- Amaral, T.G.; Pires, V.F.; Pires, A.J. Fault Detection in PV Tracking Systems Using an Image Processing Algorithm Based on PCA. Energies 2021, 14, 7278. [Google Scholar] [CrossRef] [Scilit]
- Singh, U.P.; Chandra, S. A Predictive Maintenance Scheme for Solar PV System. In Control Applications in Modern Power Systems; Kumar, J., Tripathy, M., Jena, P., Eds.; Lecture Notes in Electrical Engineering; Springer: Singapore, 2022; Volume 870. [Google Scholar] [CrossRef] [Scilit]
- Bosman, L.B.; Leon-Salas, W.D.; Hutzel, W.; Soto, E.A. PV System Predictive Maintenance: Challenges, Current Approaches, and Opportunities. Energies 2020, 13, 1398. [Google Scholar] [CrossRef] [Scilit]
- Mahmoud, Y.; El-Saadany, E.F. A Novel MPPT Technique Based on an Image of PV Modules. IEEE Trans. Energy Convers. 2016, 32, 213–221. [Google Scholar] [CrossRef] [Scilit]
- Martin, A.D.; Vazquez, J.R.; Cano, J. MPPT in PV systems under partial shading conditions using artificial vision. Electr. Power Syst. Res. 2018, 162, 89–98. [Google Scholar] [CrossRef] [Scilit]
- Martin, A.D.; Cano, J.M.; Medina-García, J.; Gómez-Galán, J.A.; Hermoso, A.; Vazquez, J.R. Artificial vision wireless PV system to efficiently track the MPP under partial shading. Int. J. Electr. Power Energy Syst. 2023, 151, 109198. [Google Scholar] [CrossRef] [Scilit]
- Karakose, M.; Baygin, M. Image processing based analysis of moving shadow effects for reconfiguration in PV arrays. In Proceedings of the 2014 IEEE International Energy Conference (ENERGYCON), Cavtat, Croatia, 13–16 May 2014; pp. 683–687. [Google Scholar] [CrossRef] [Scilit]
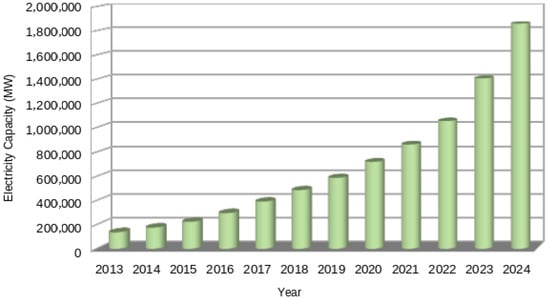
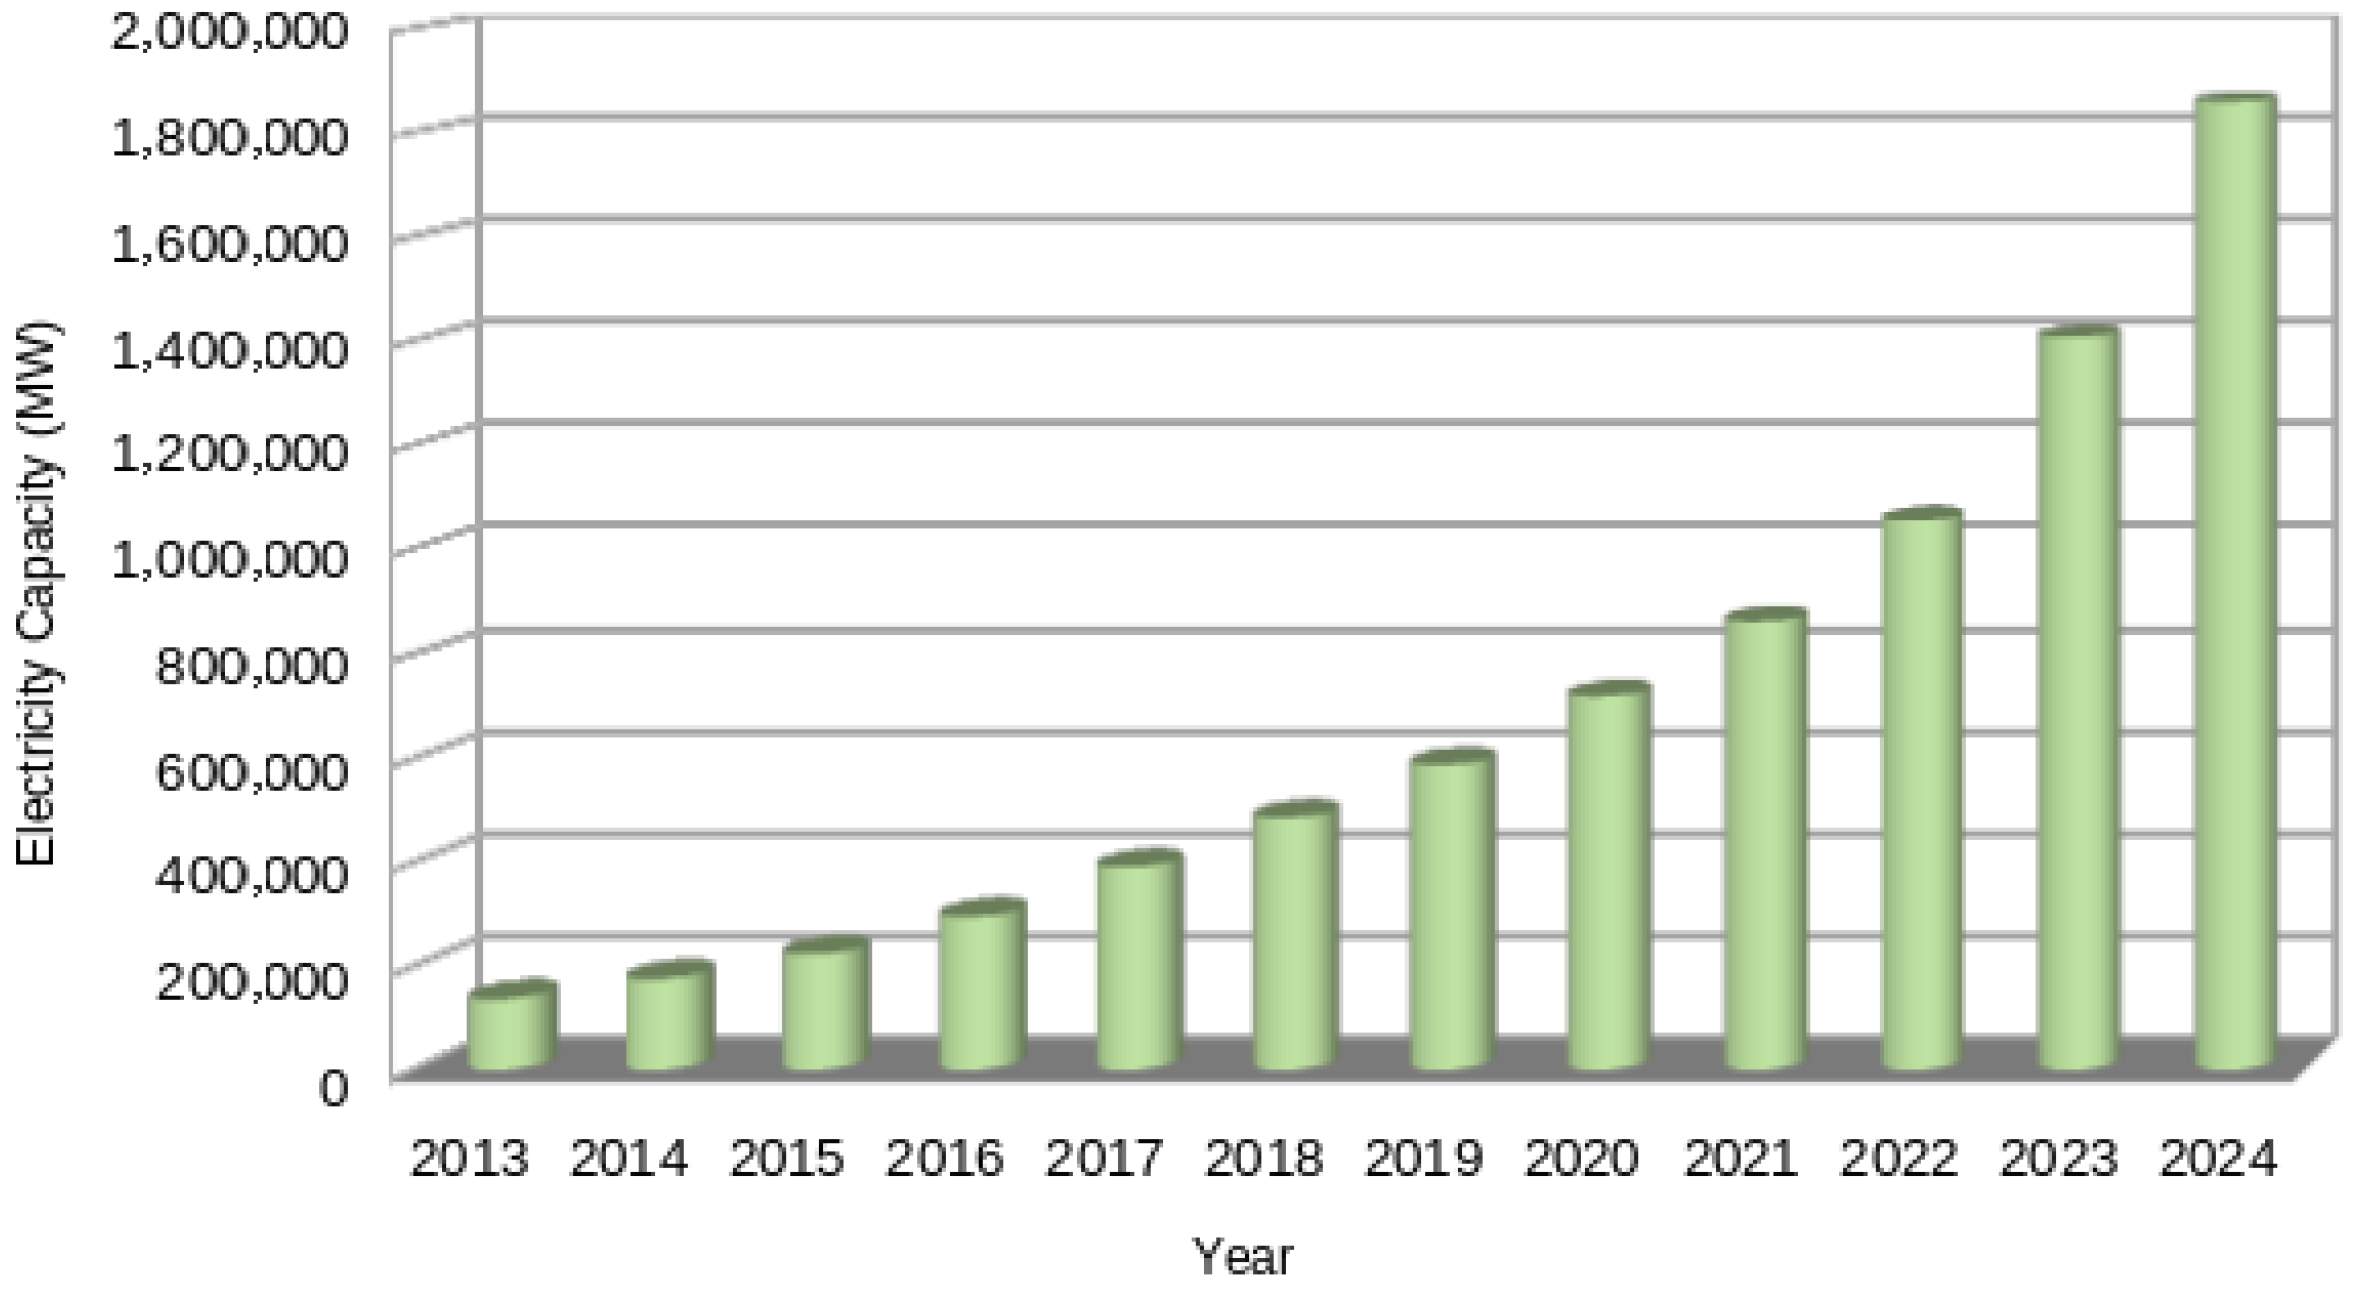
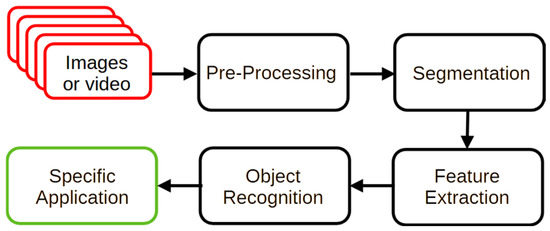
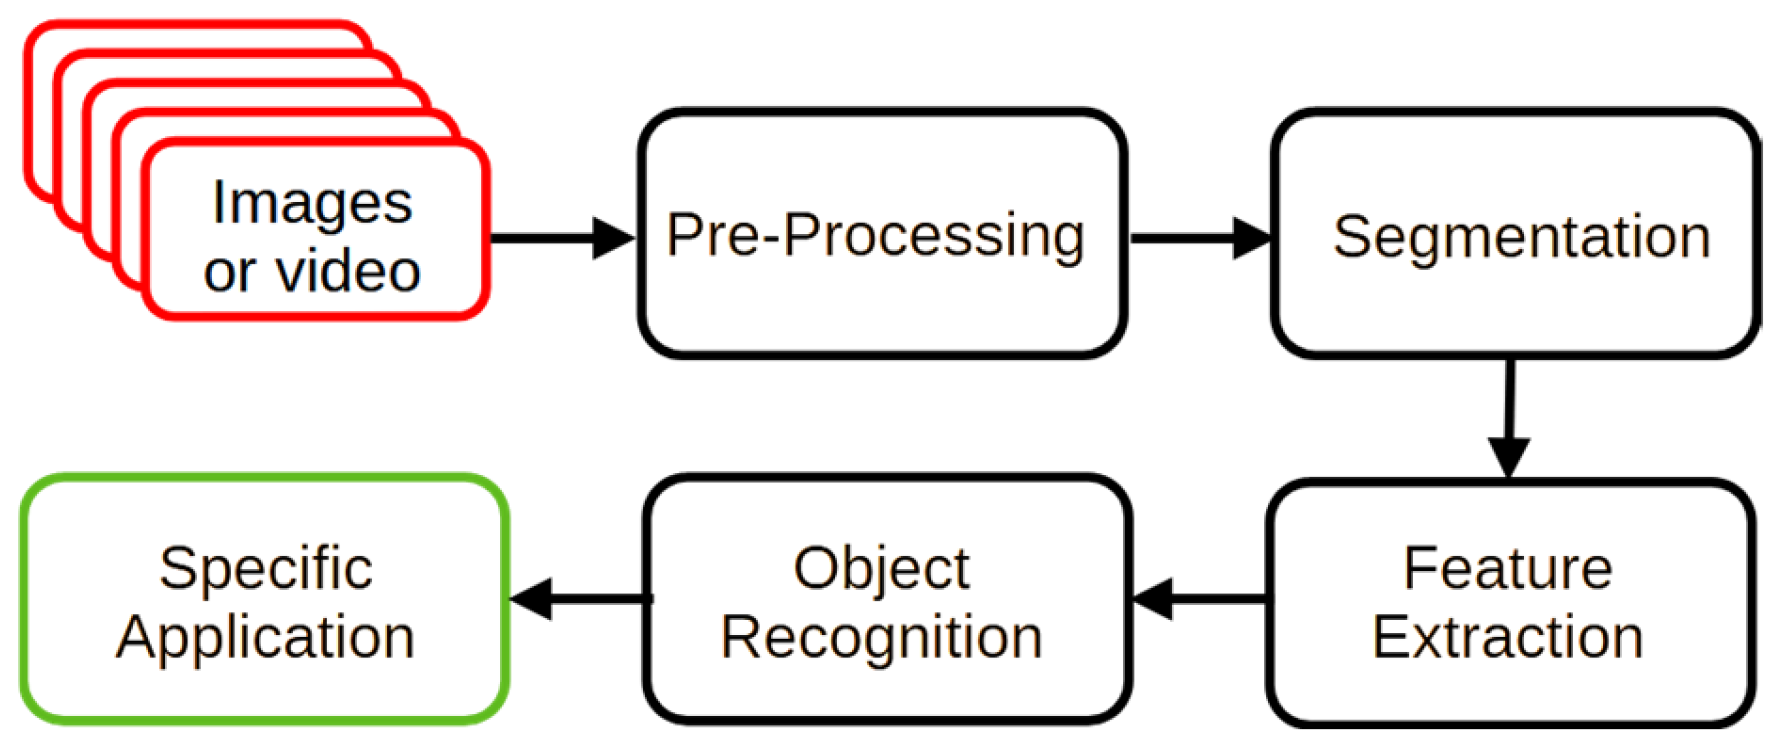
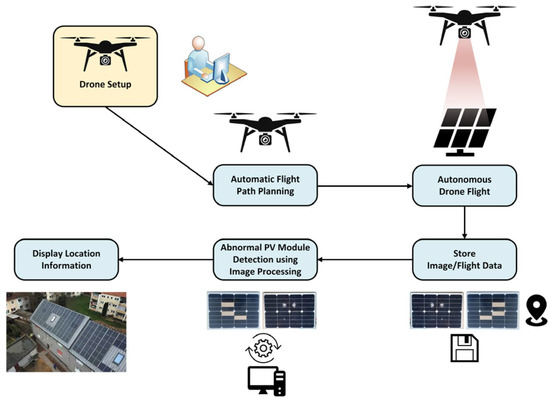
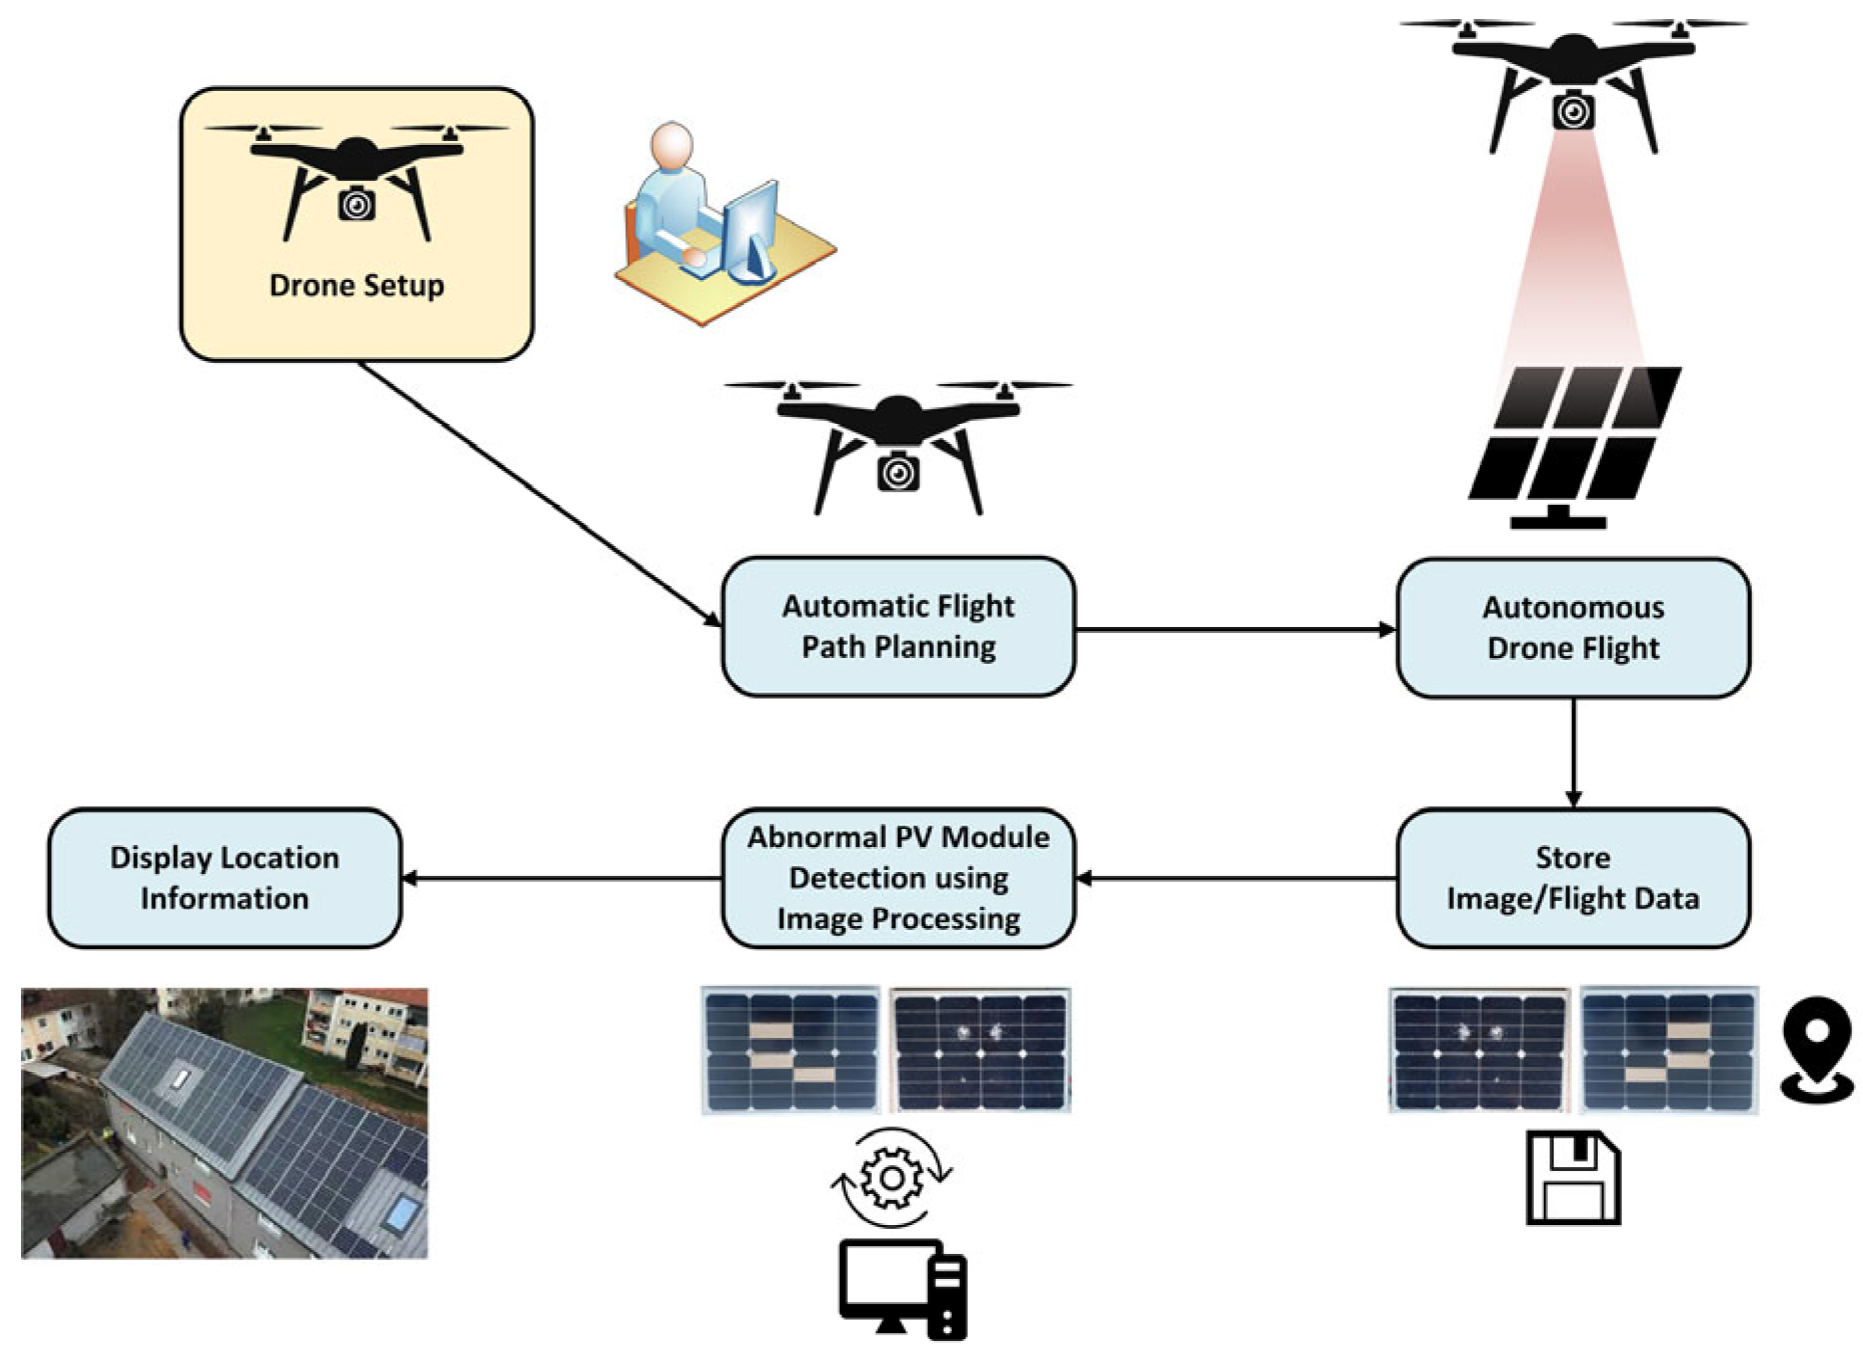
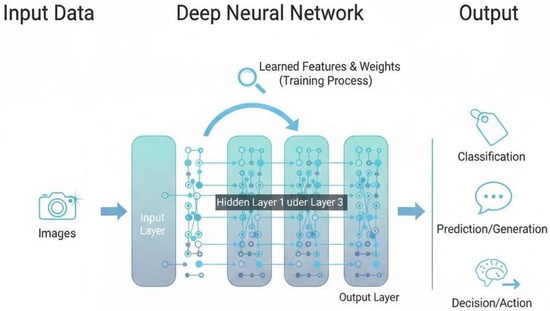
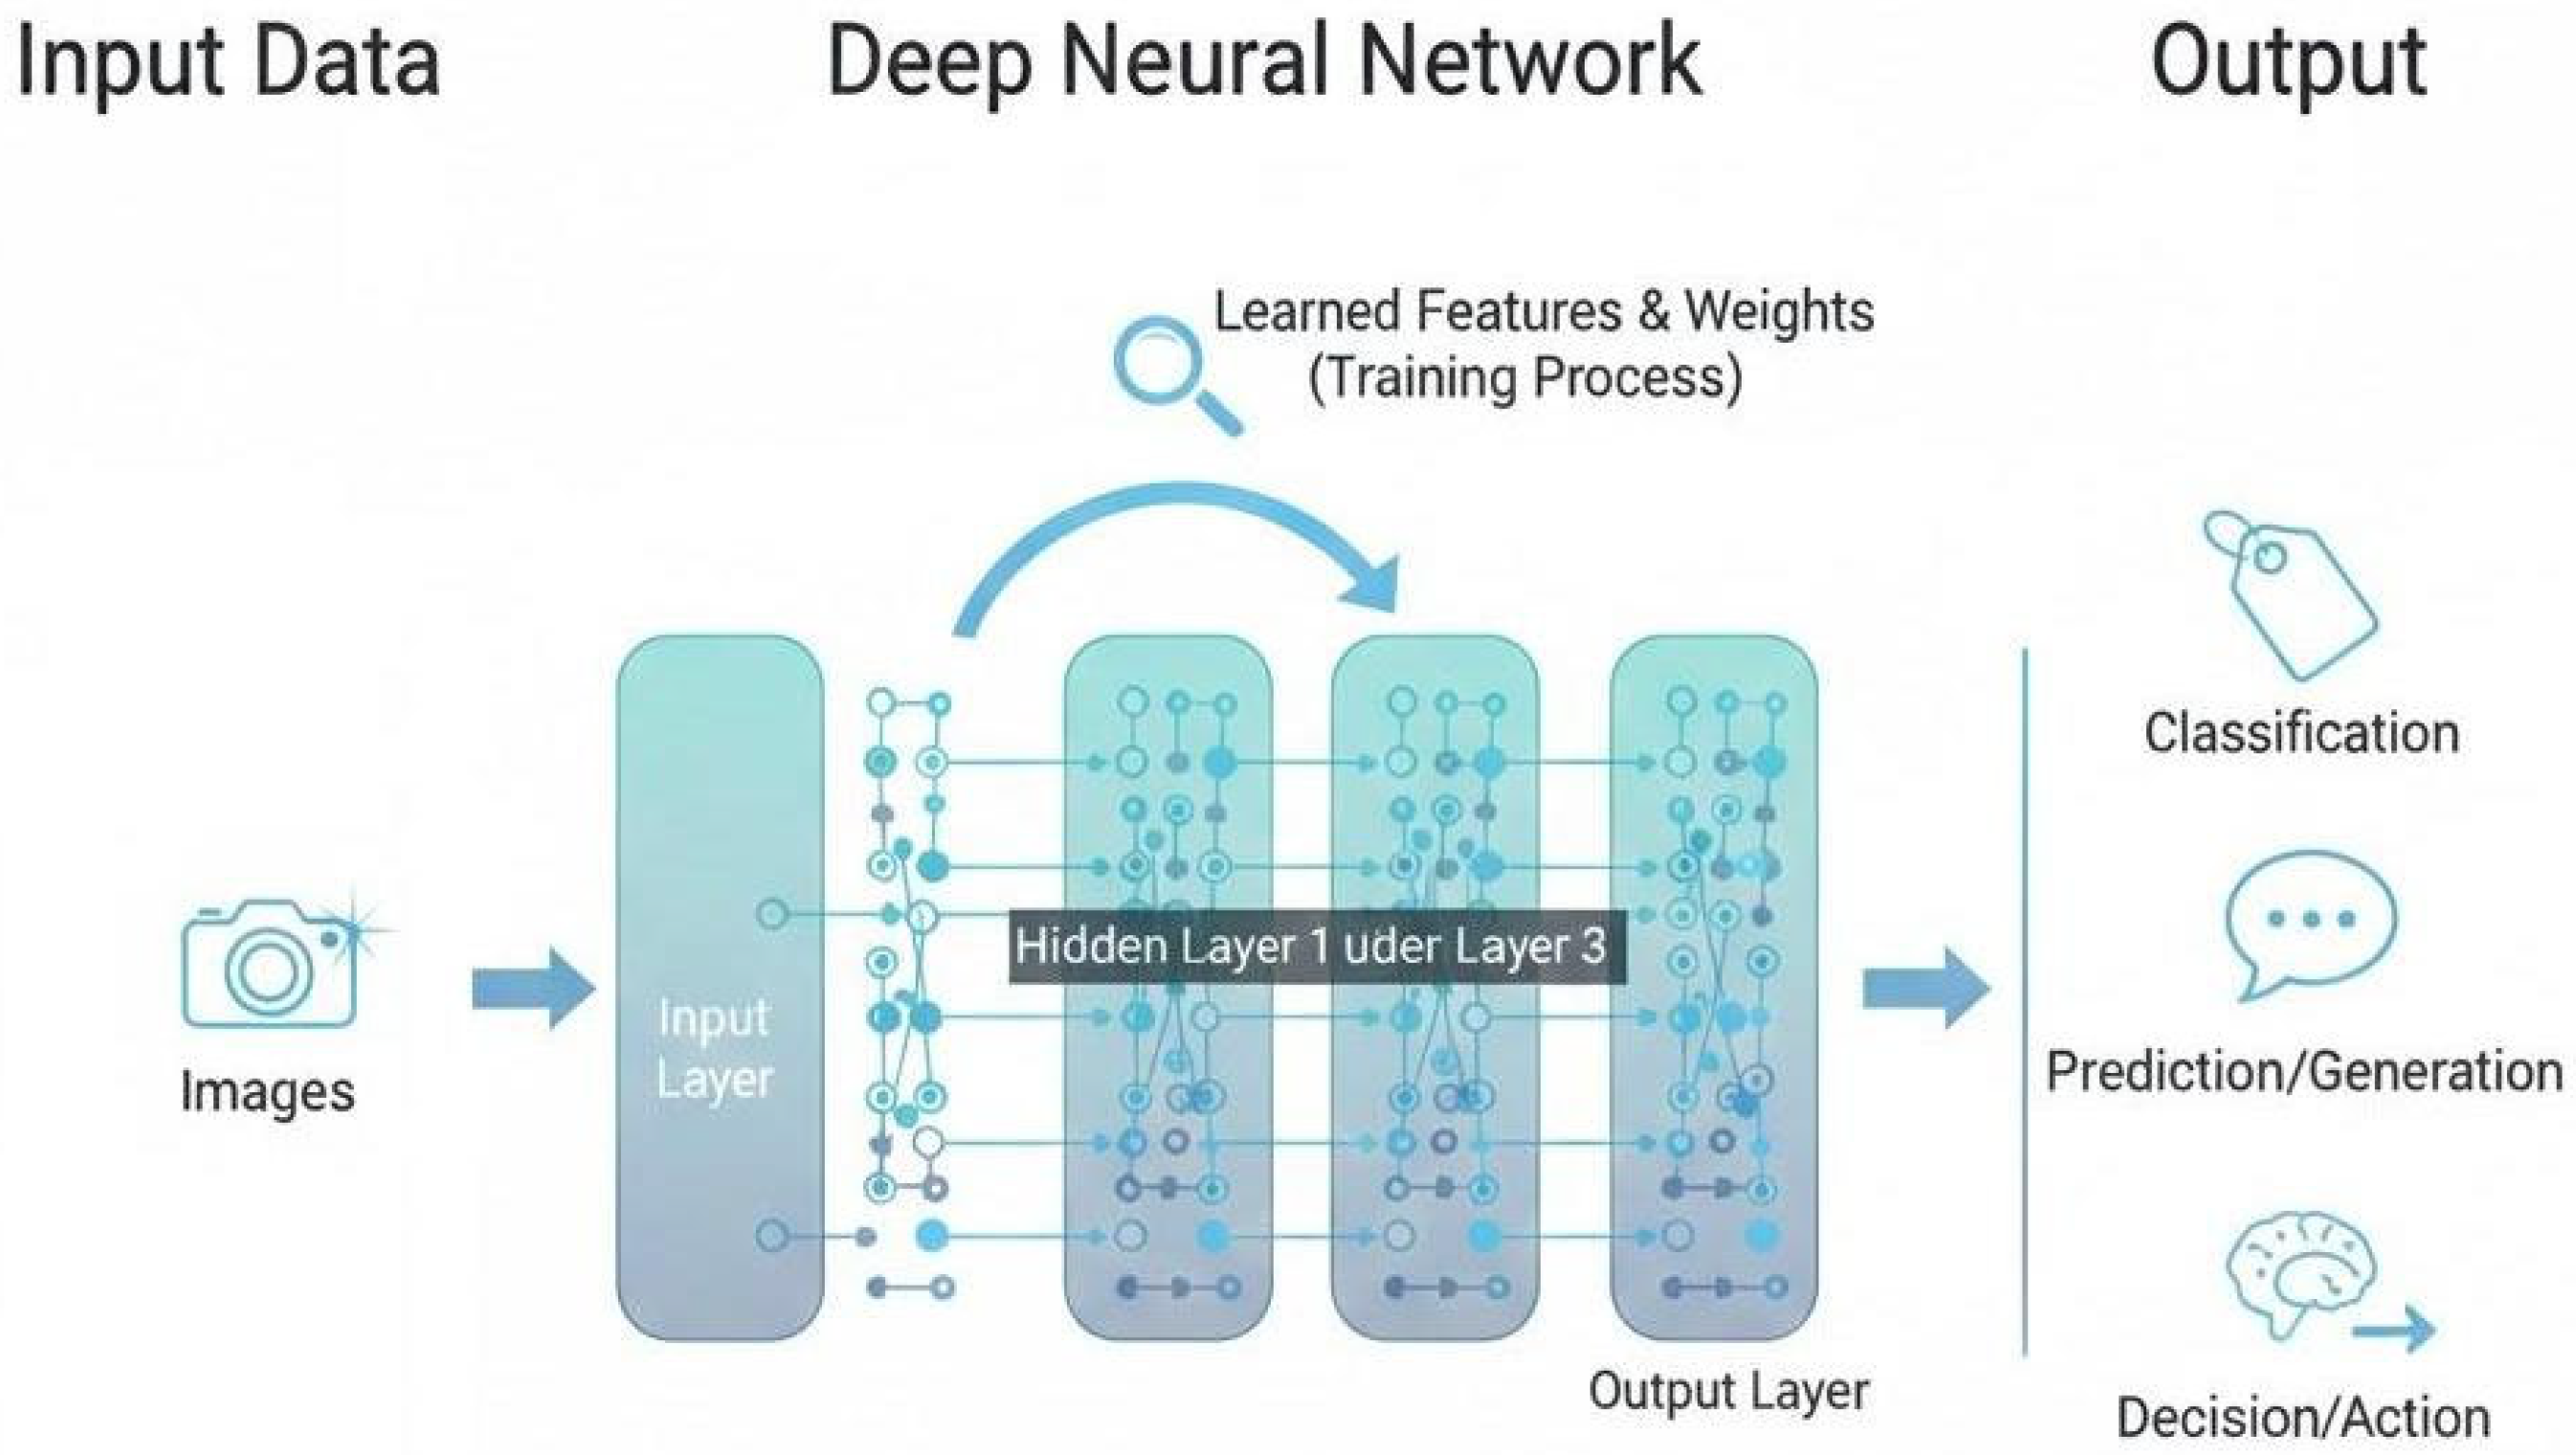
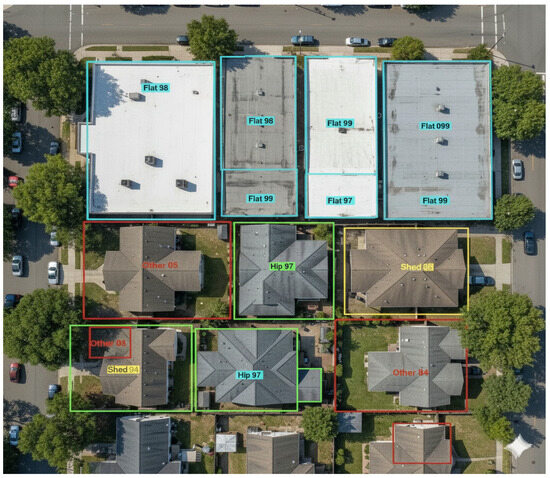
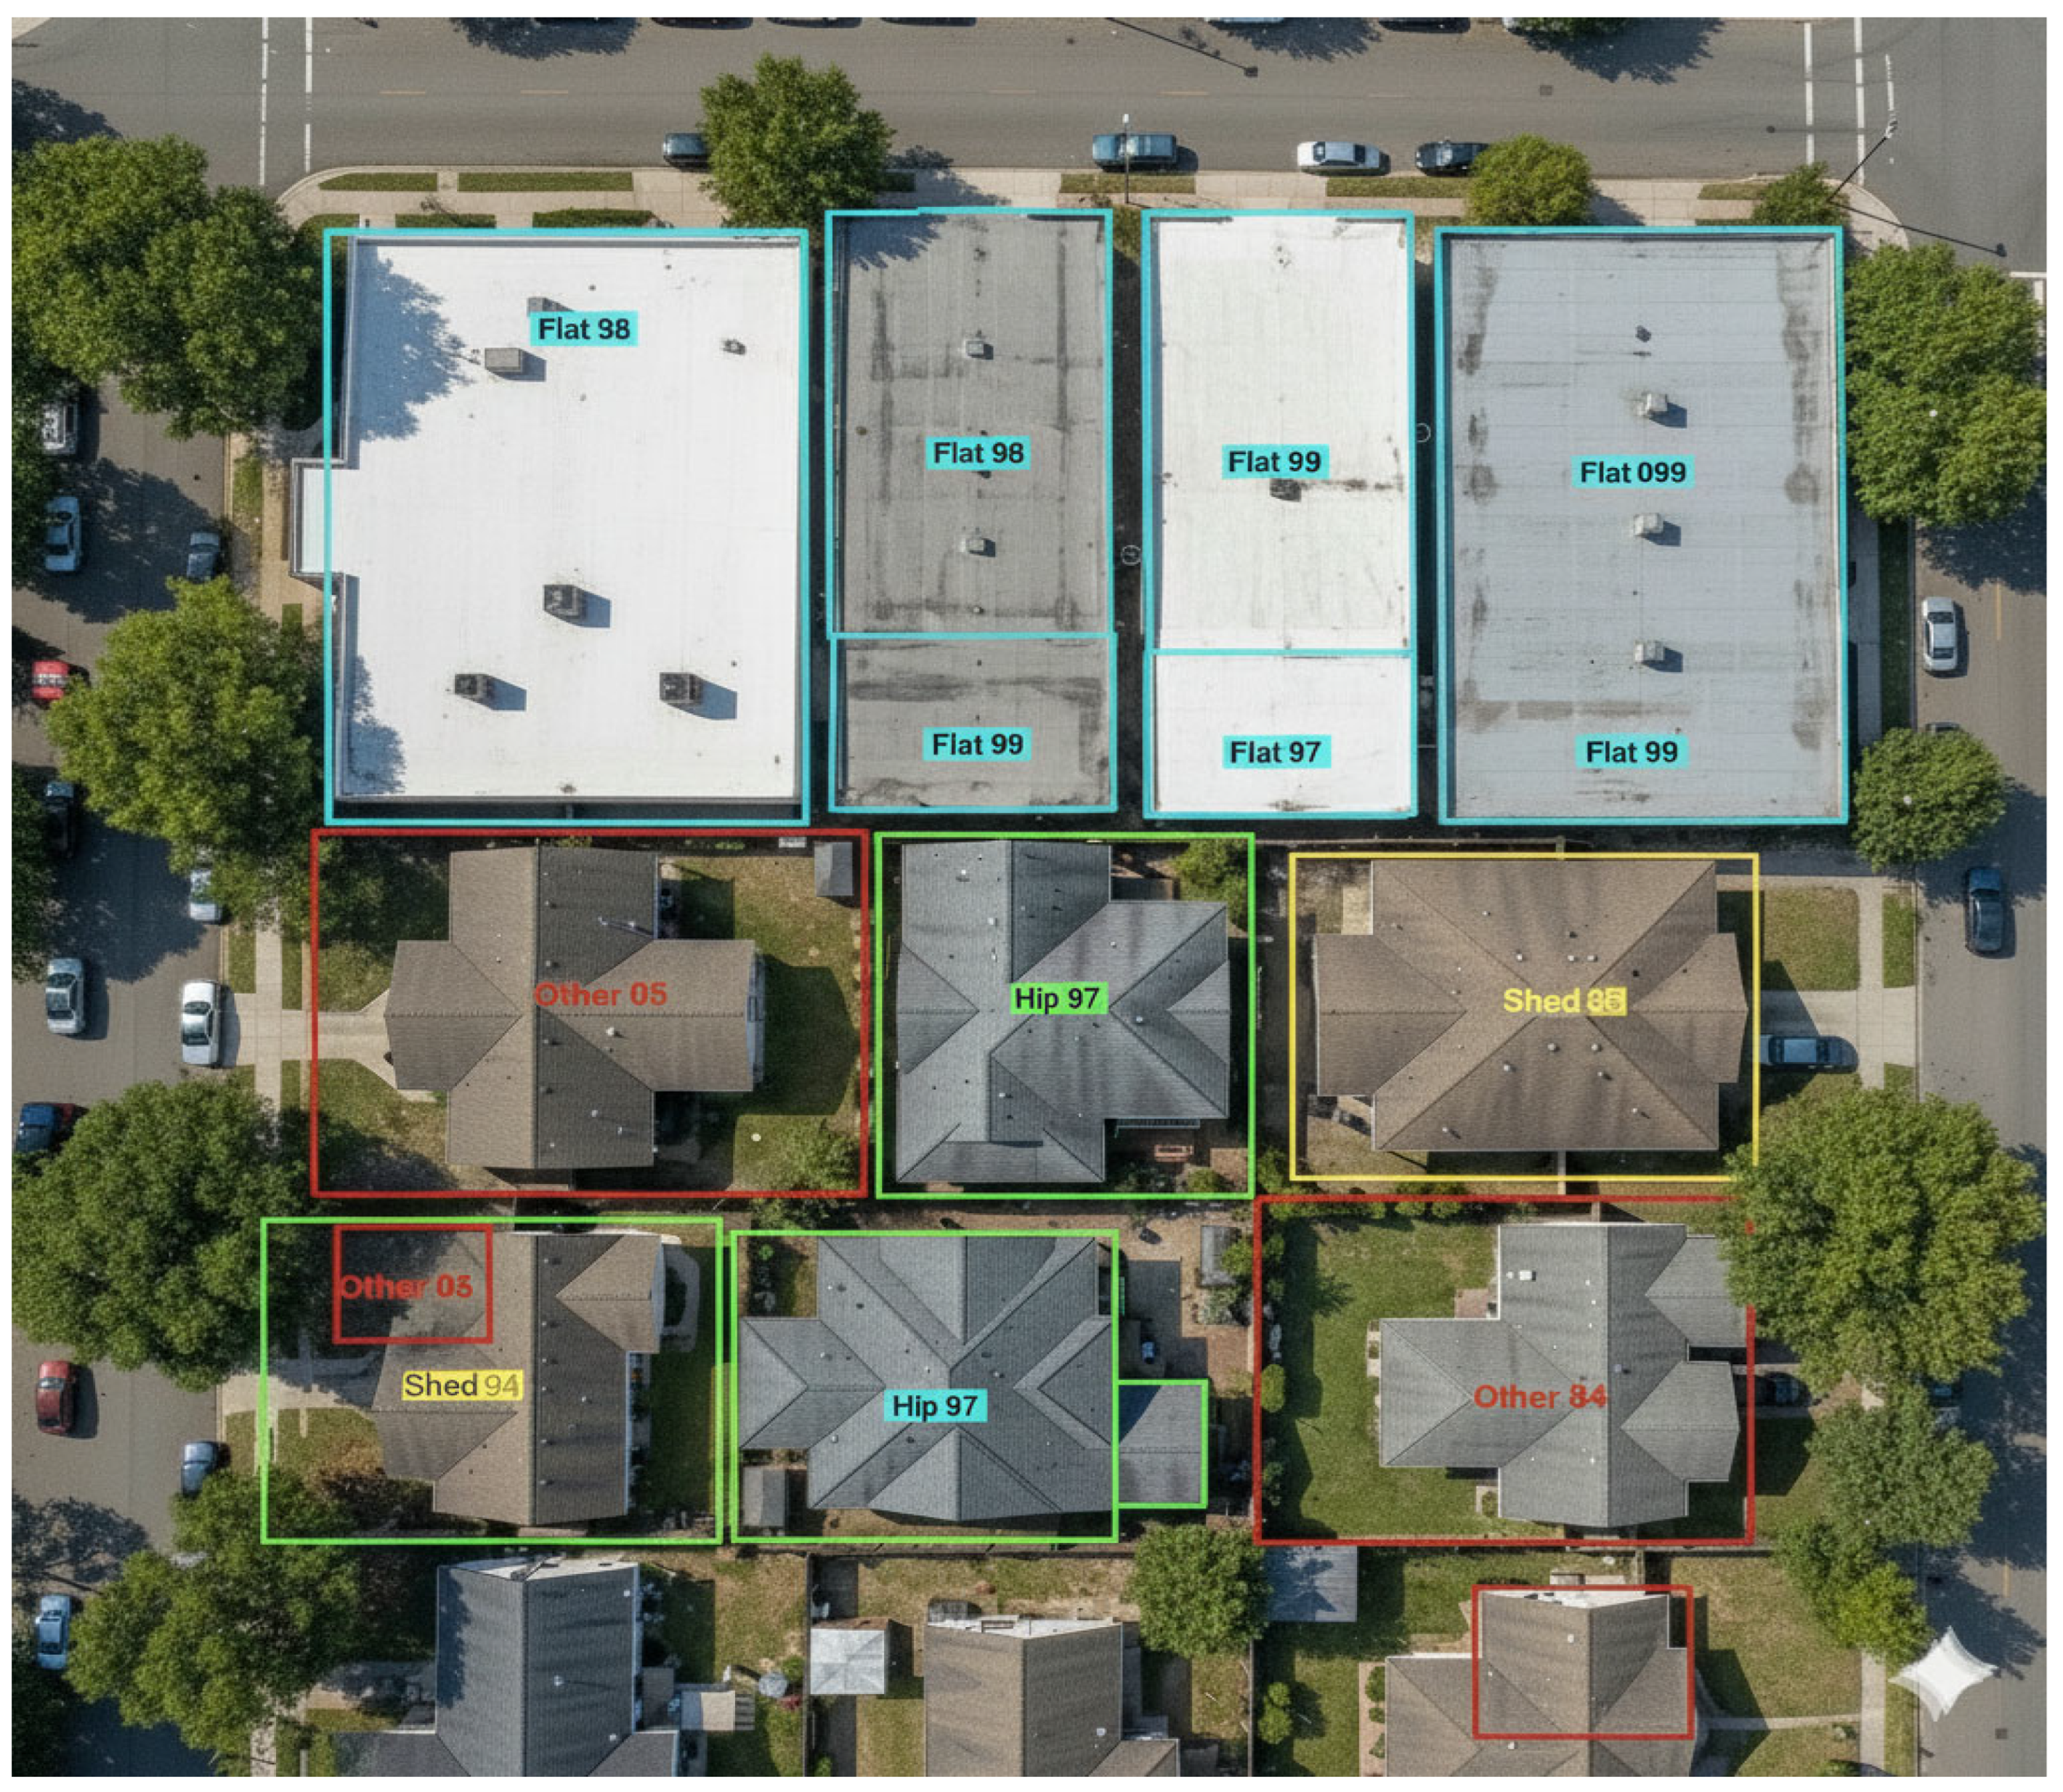
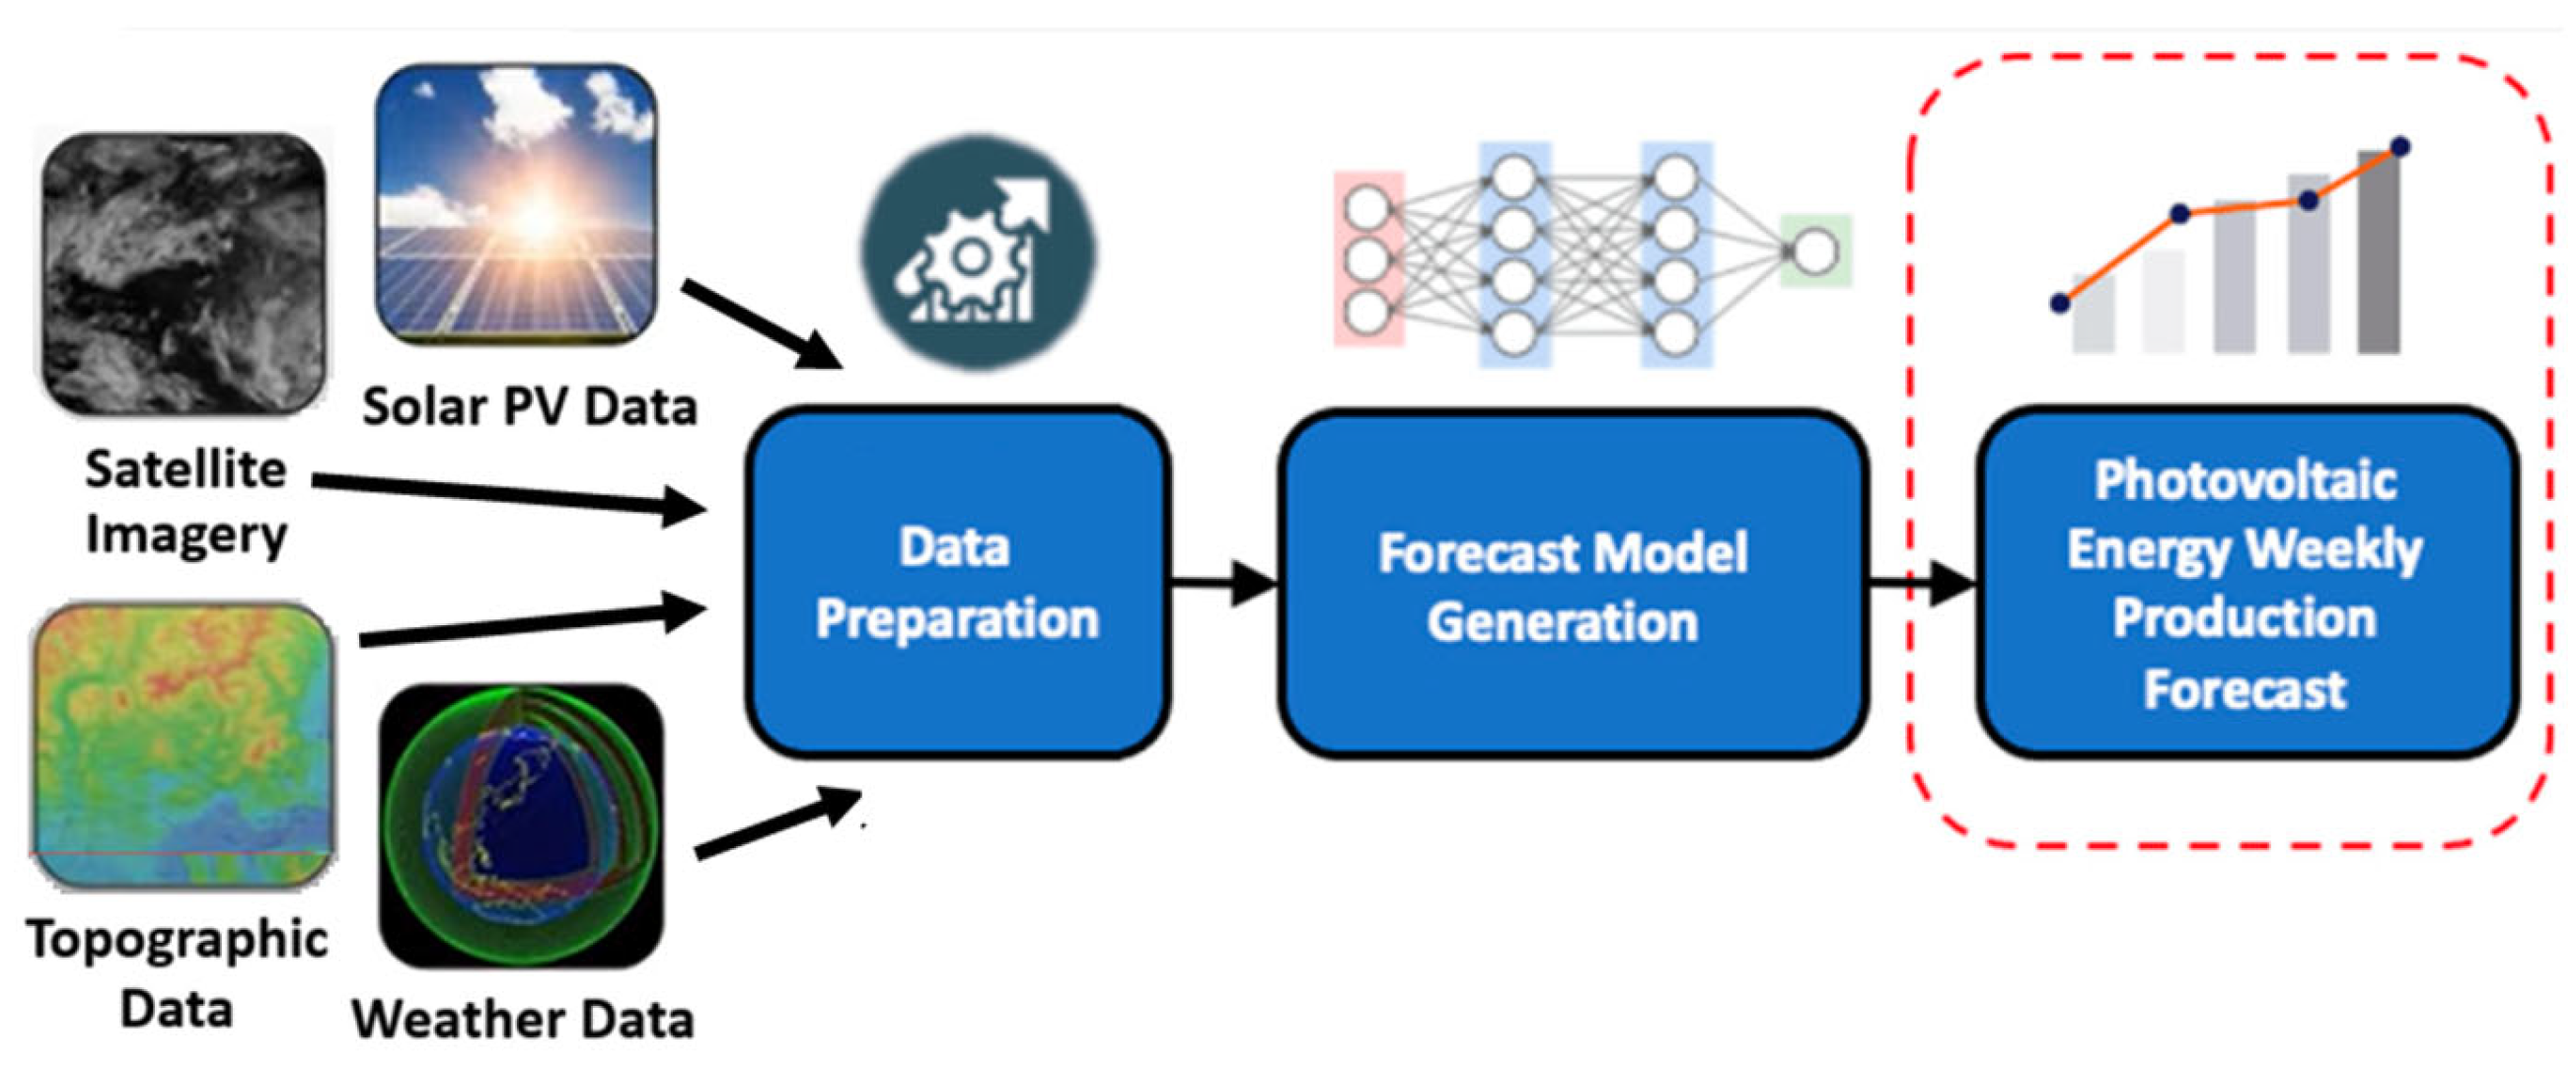
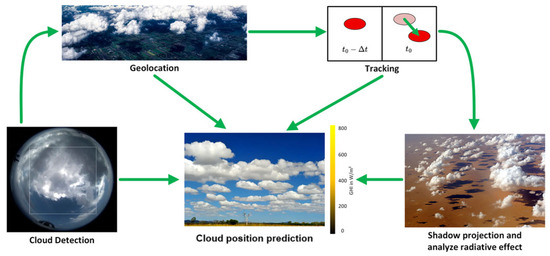
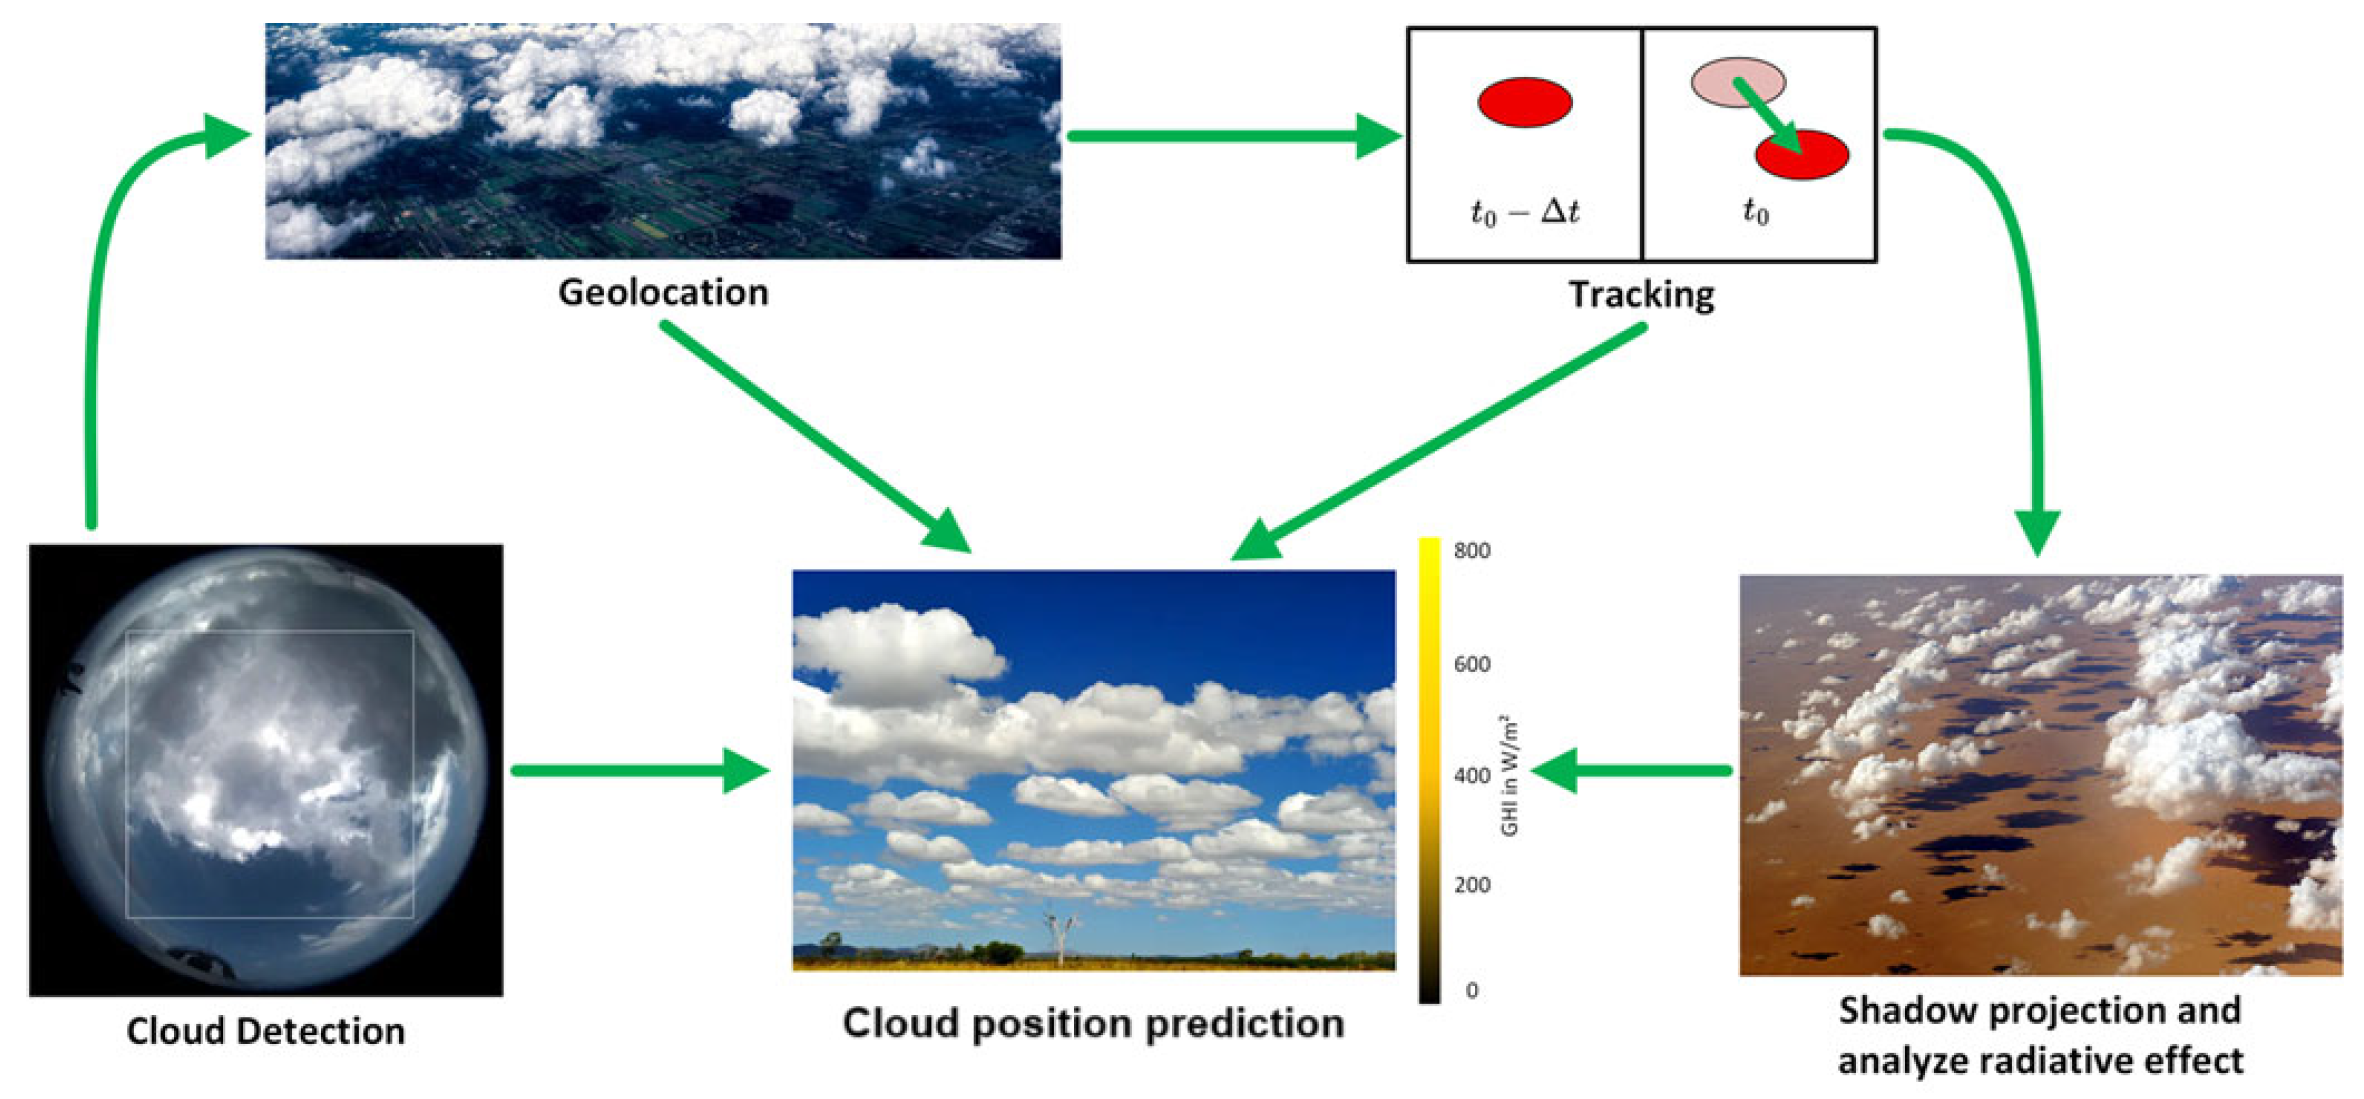
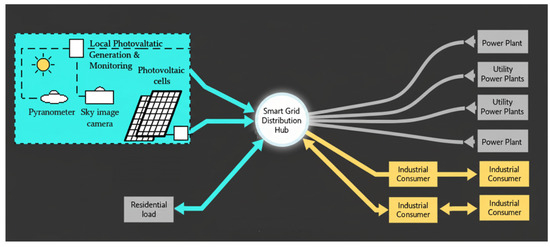
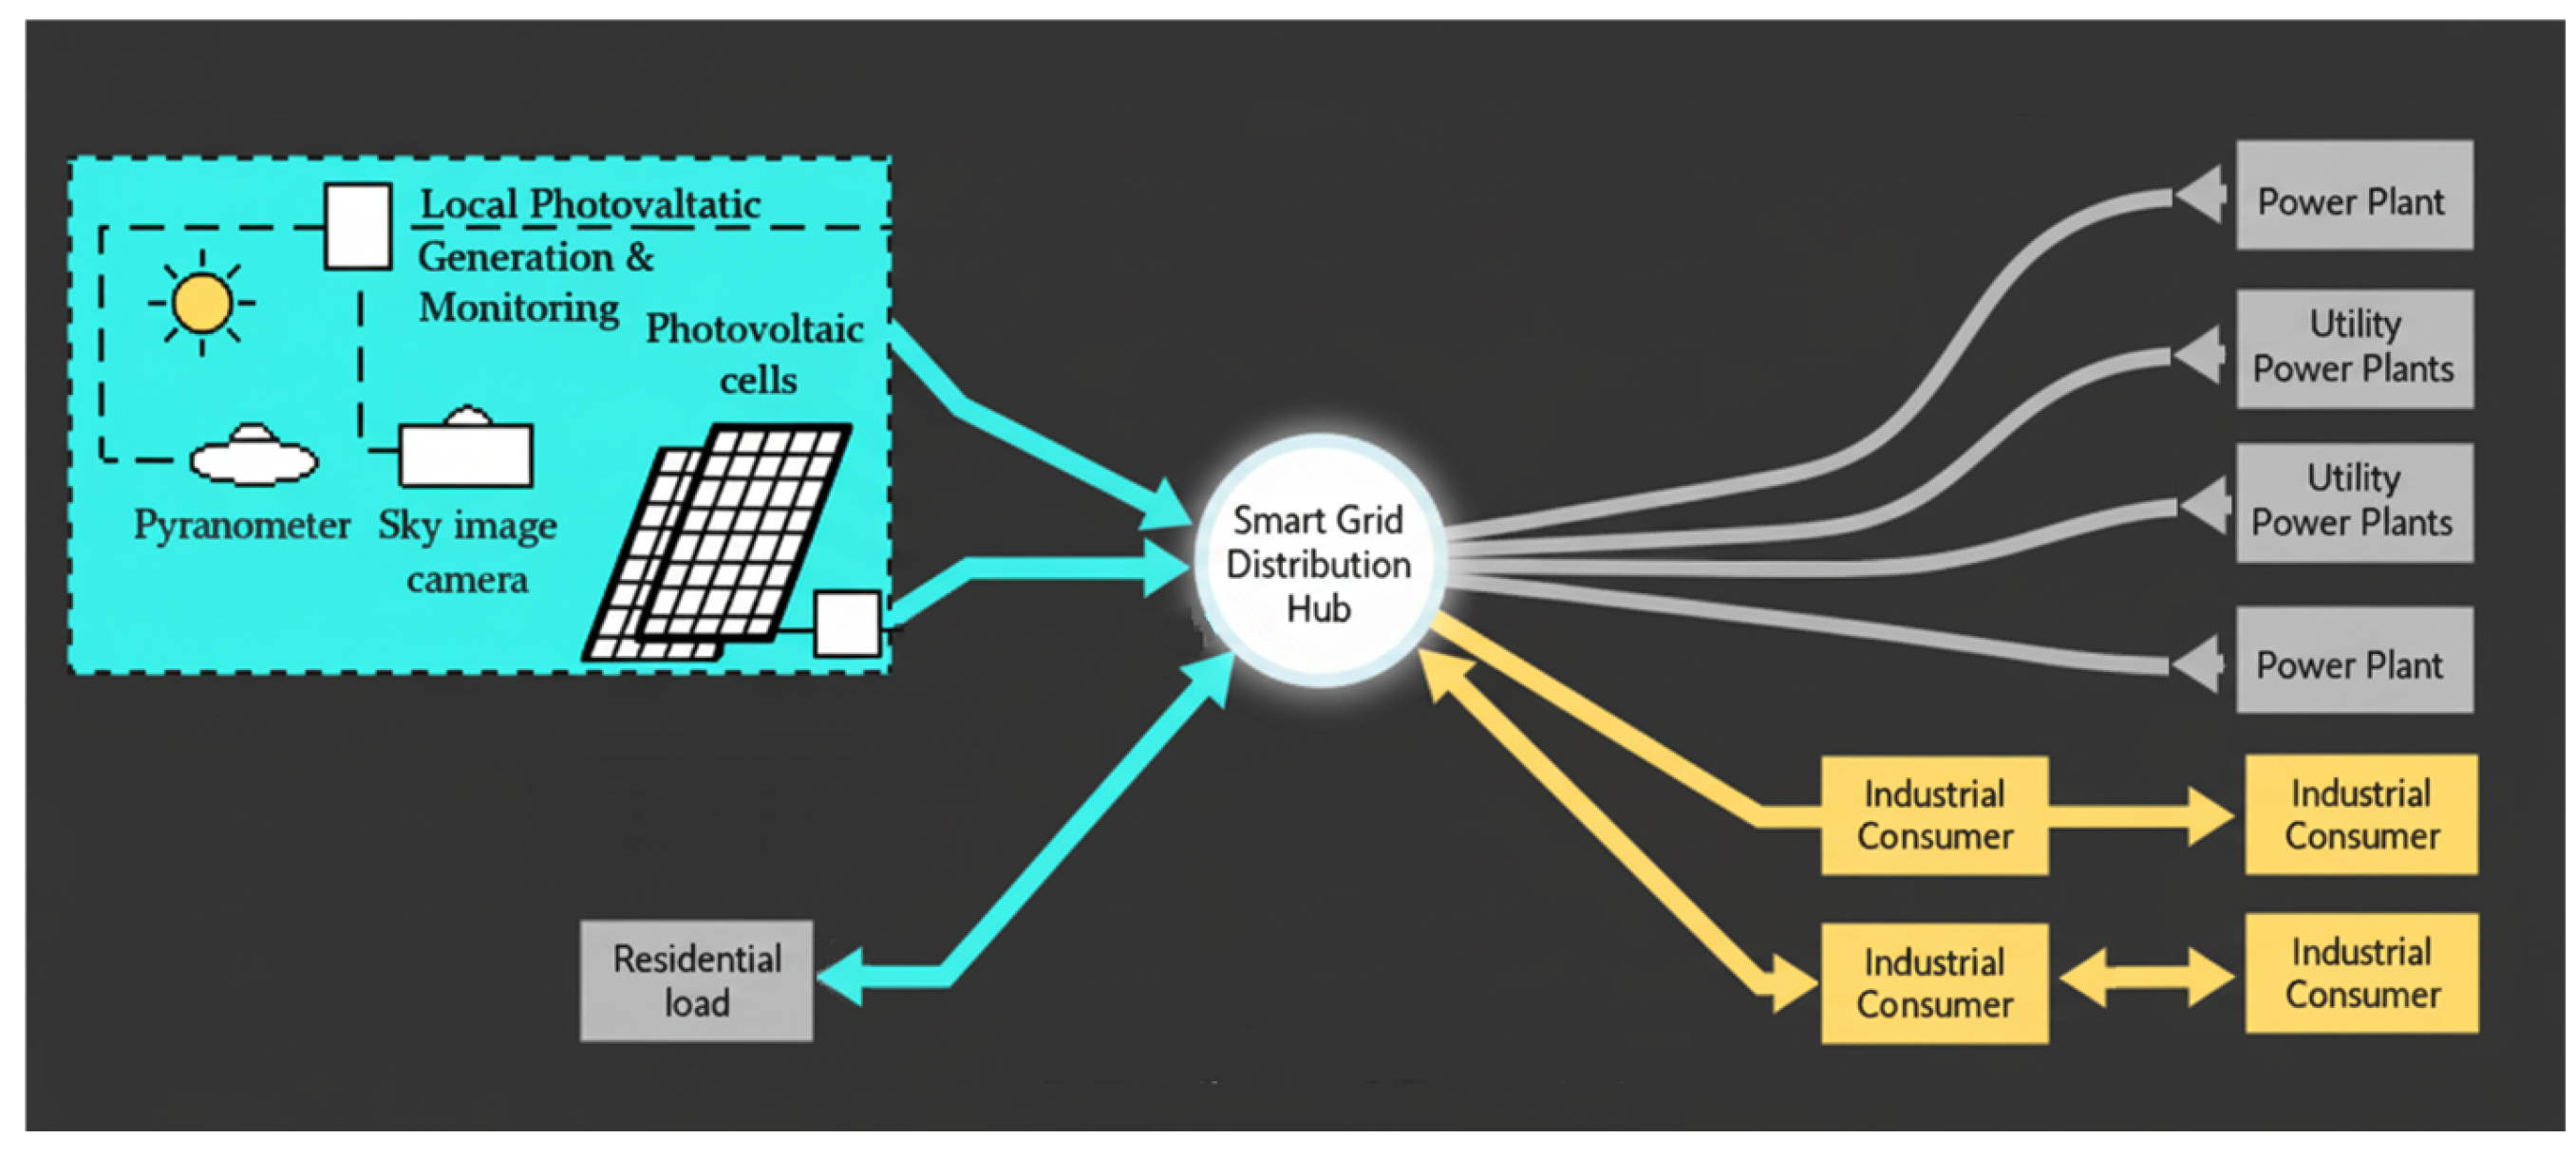
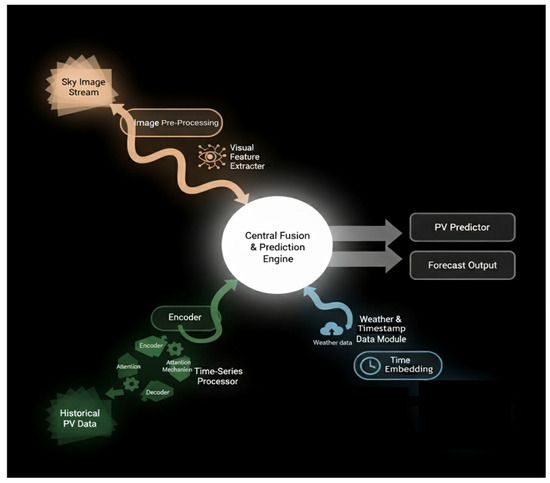
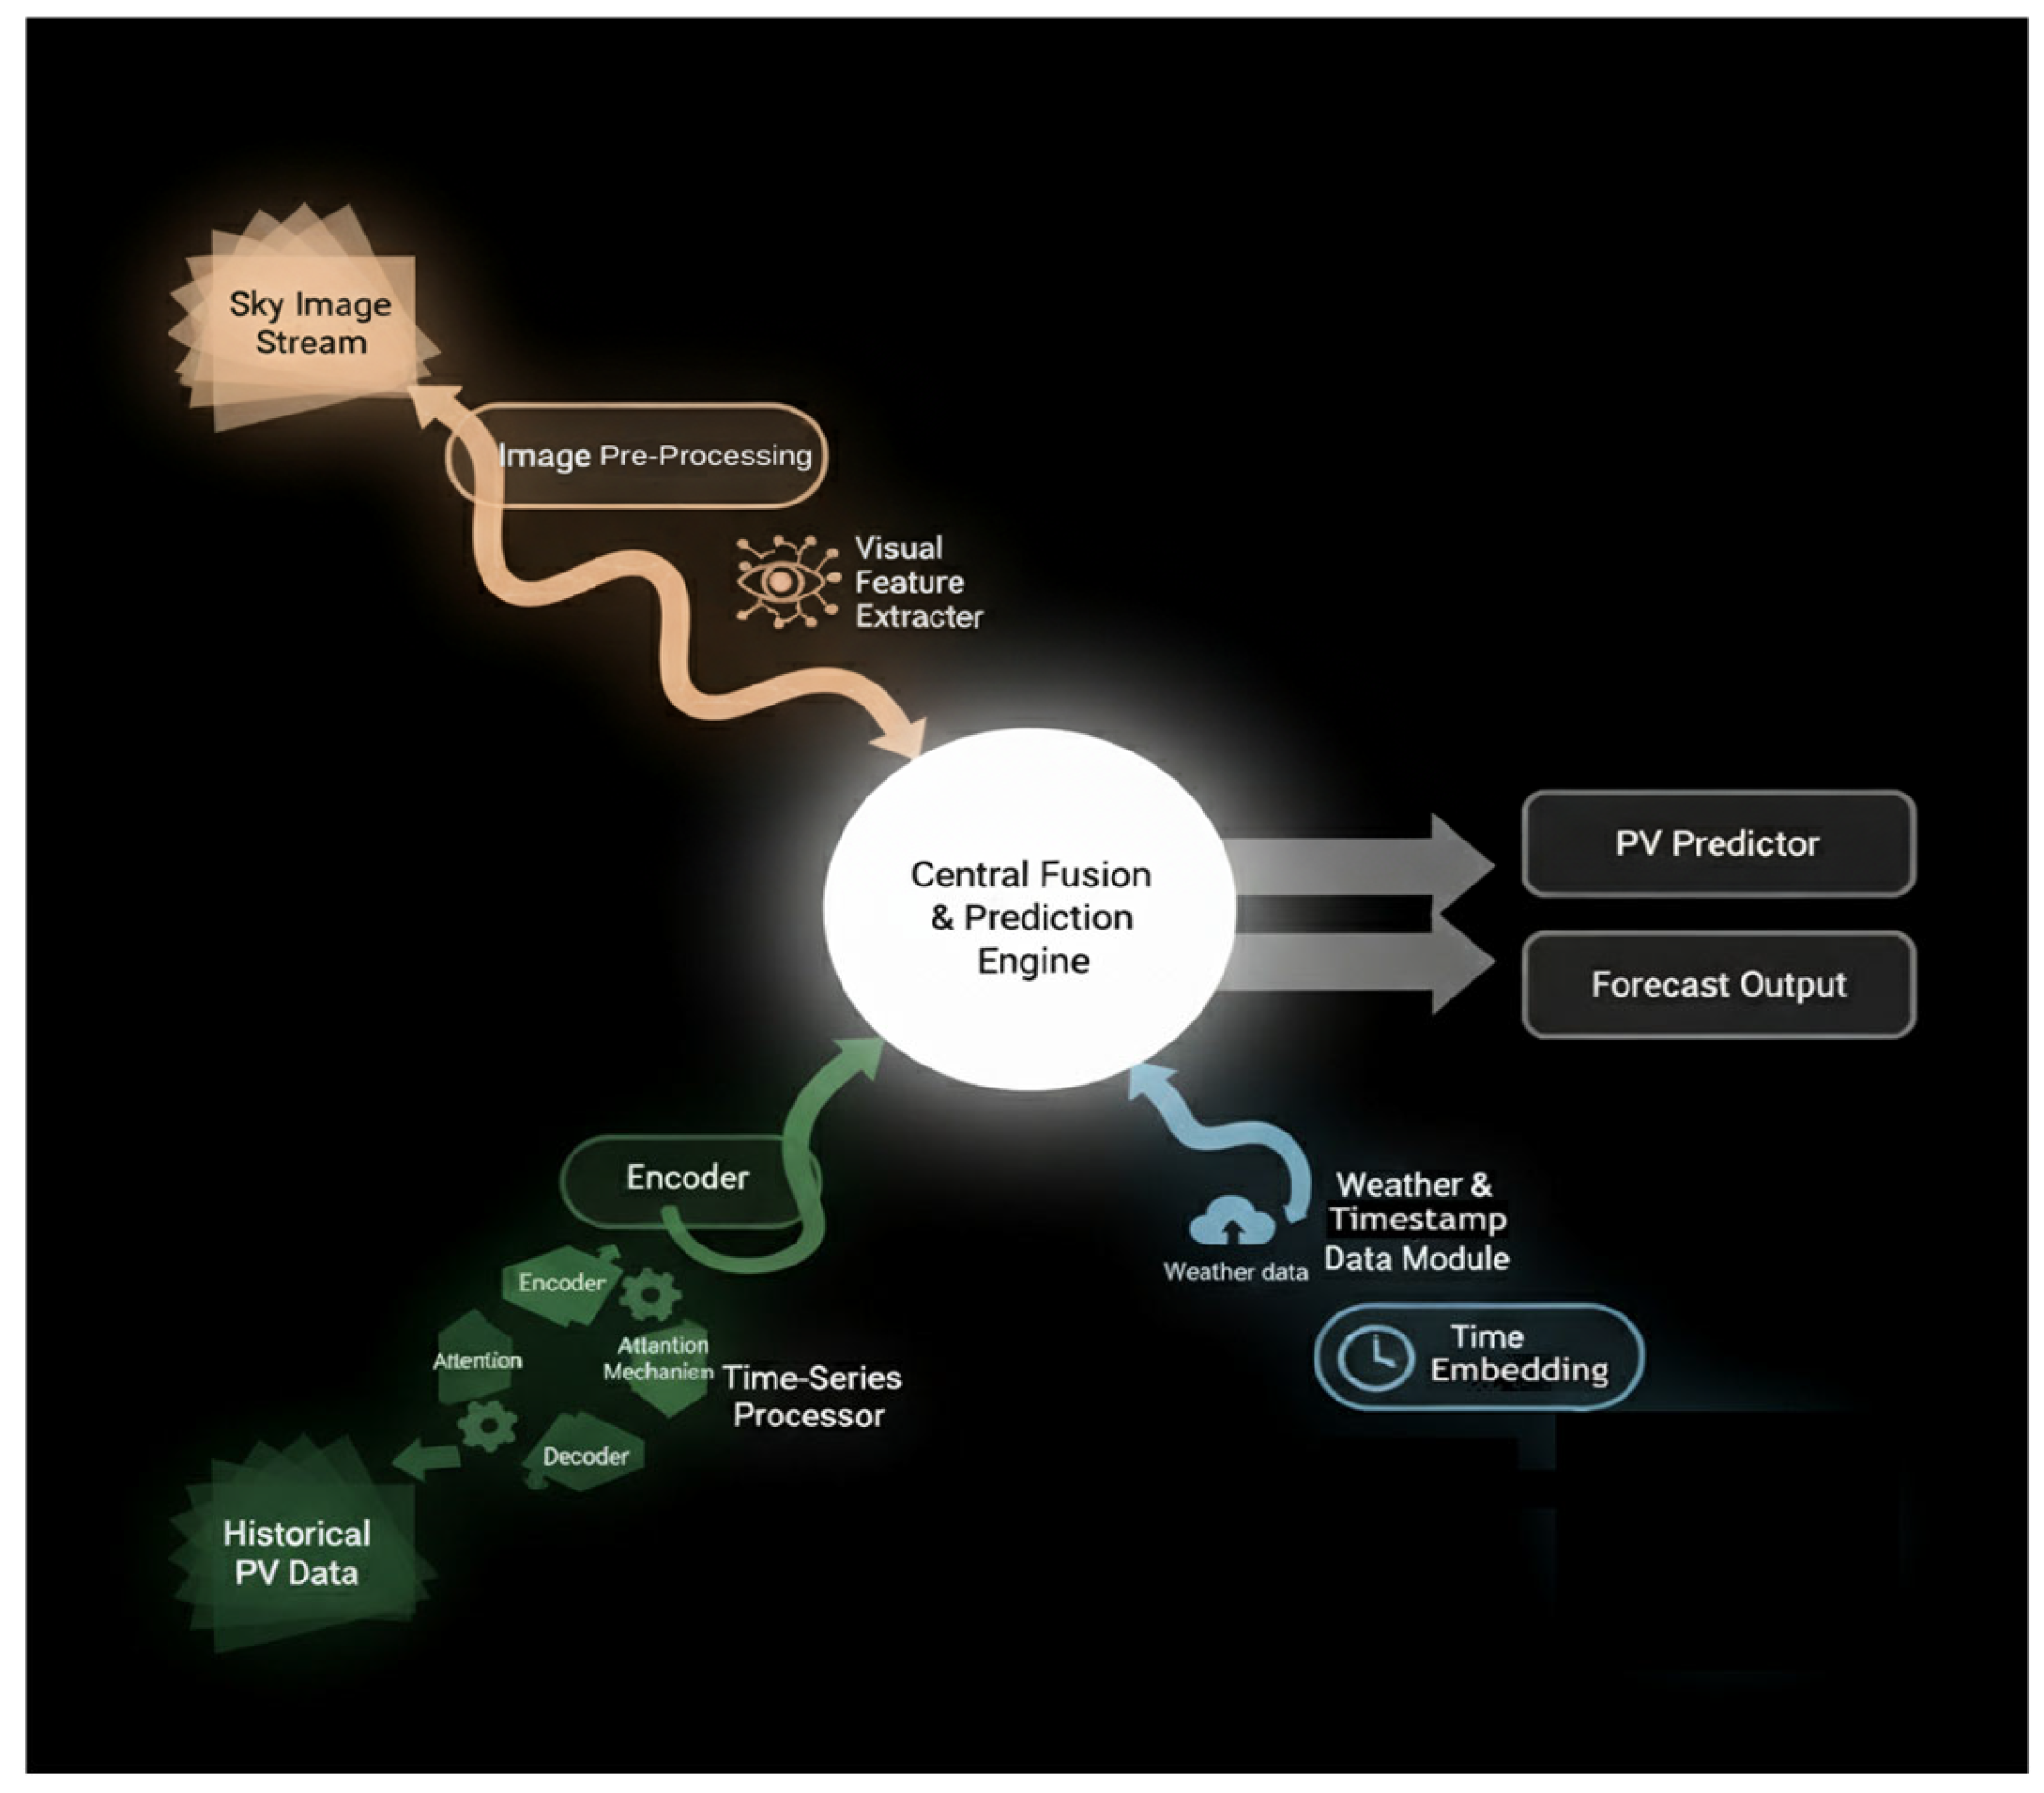
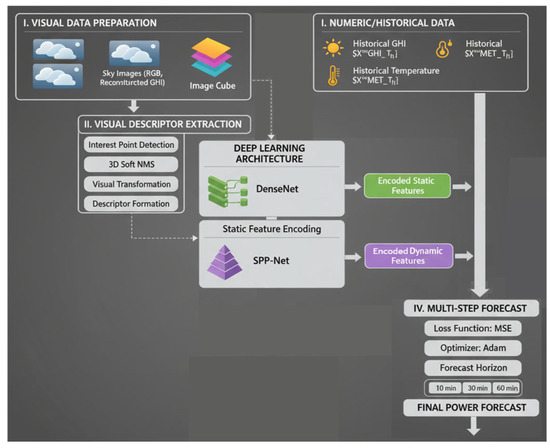
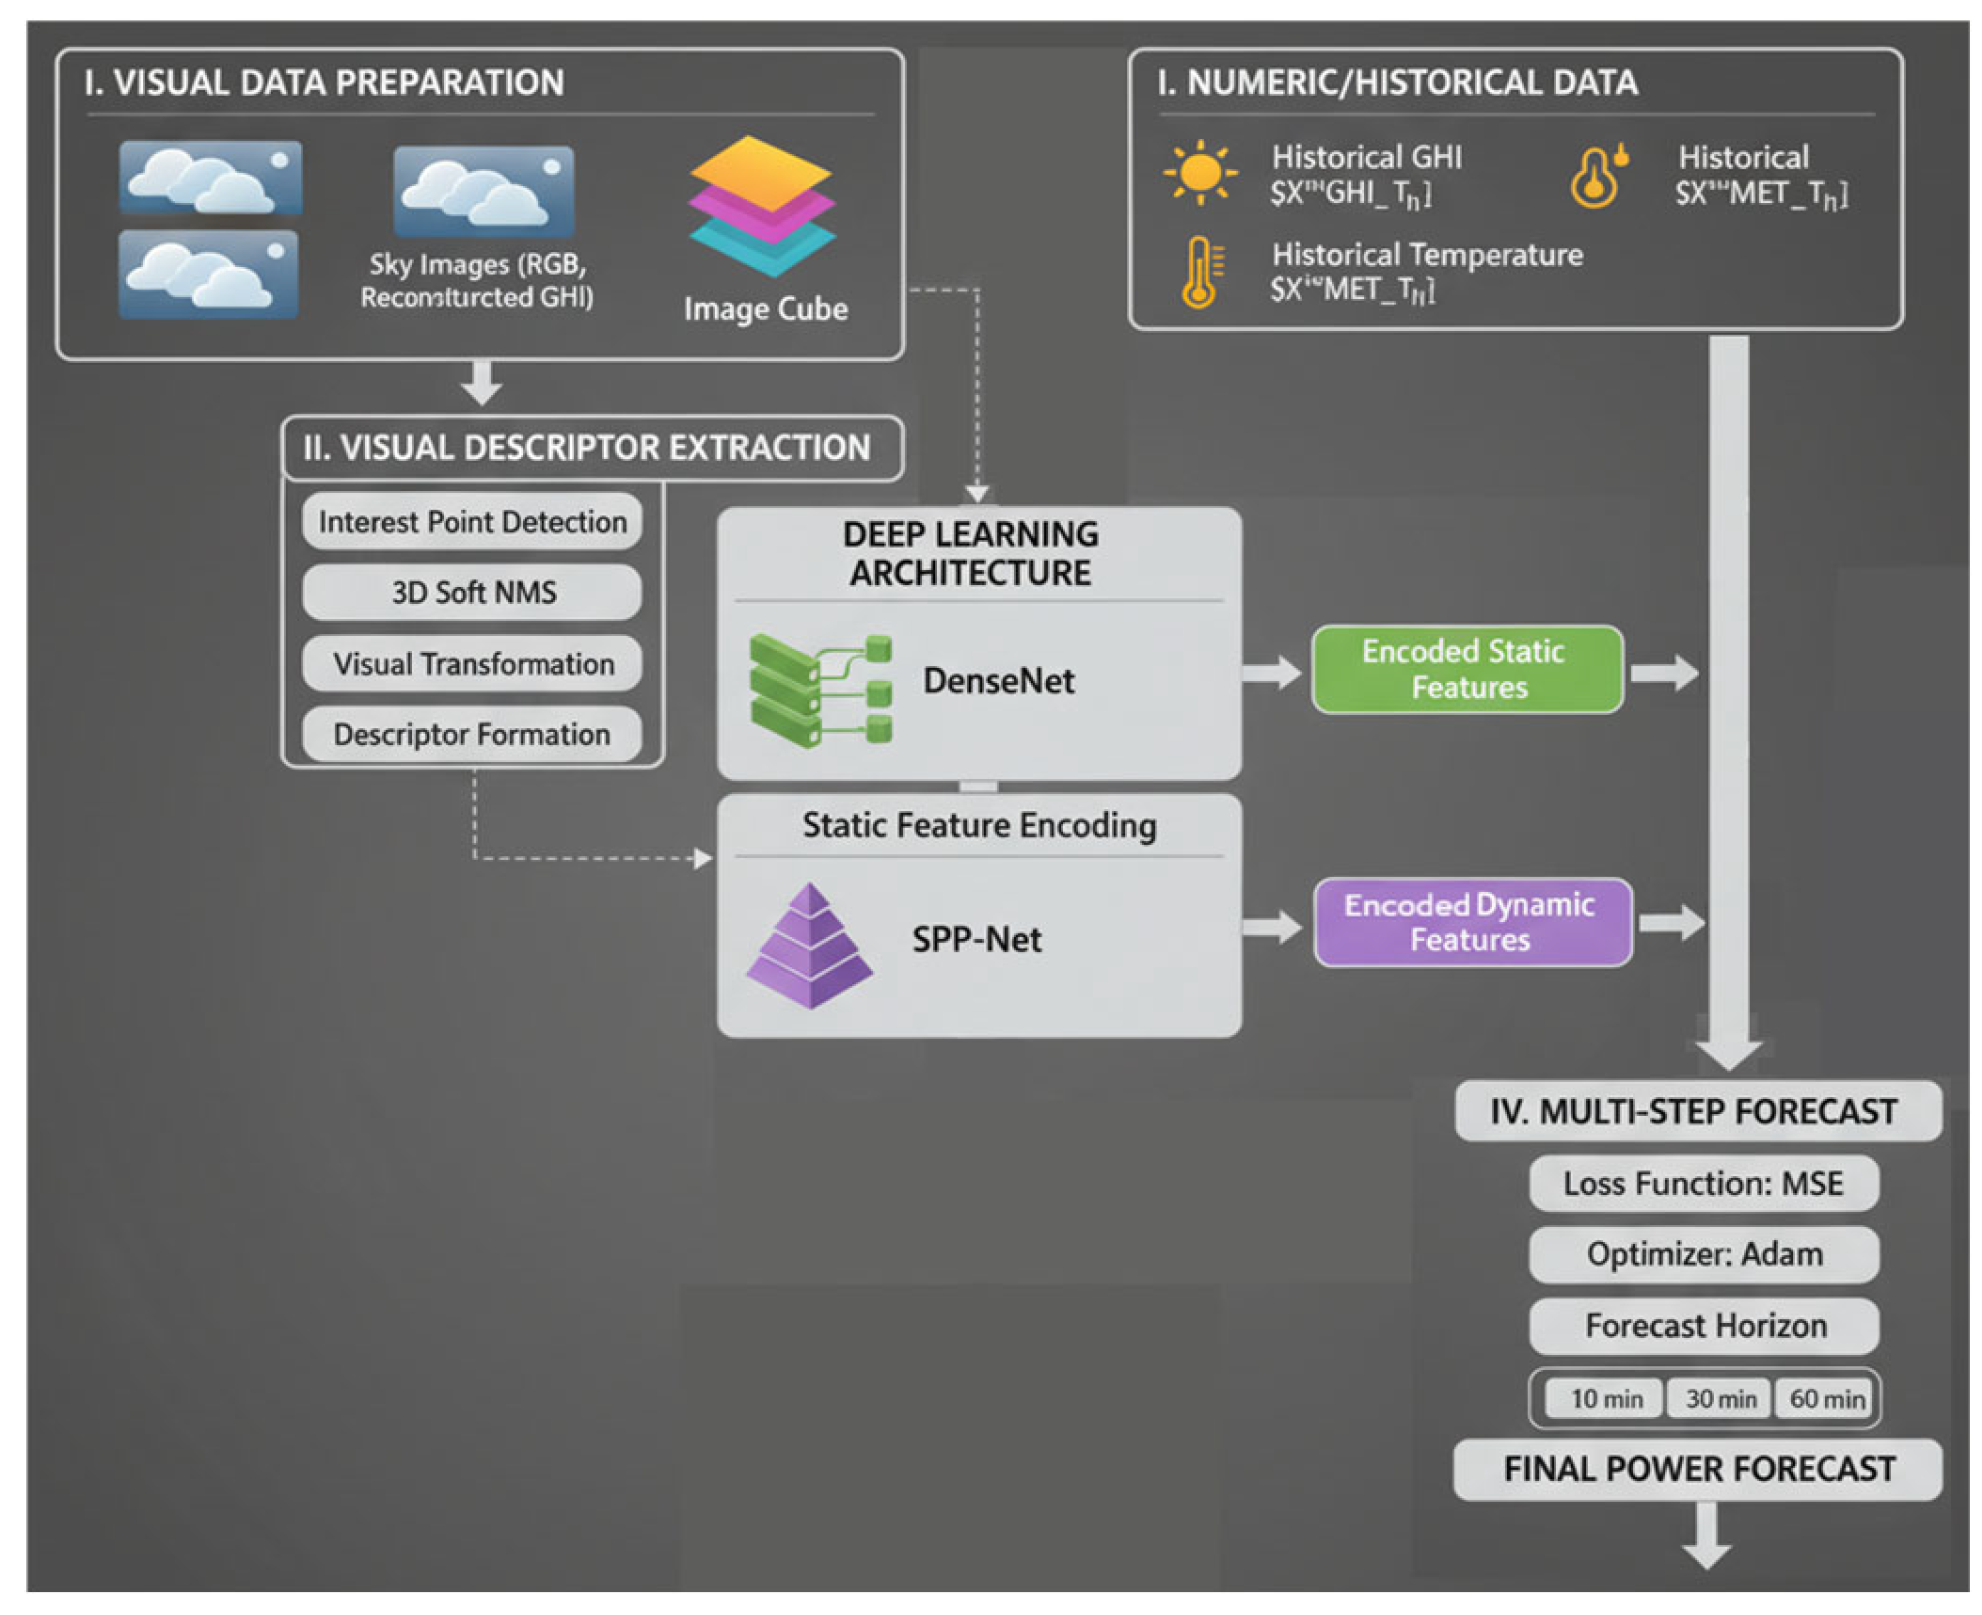
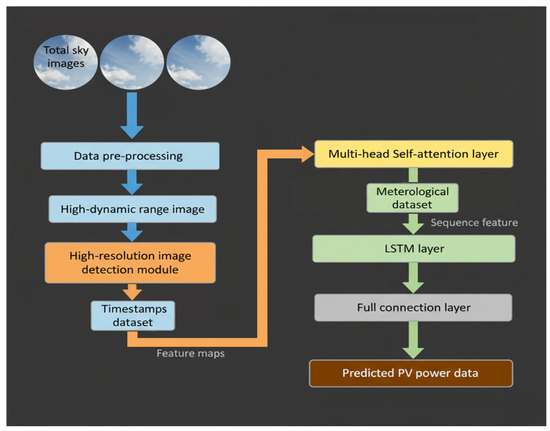
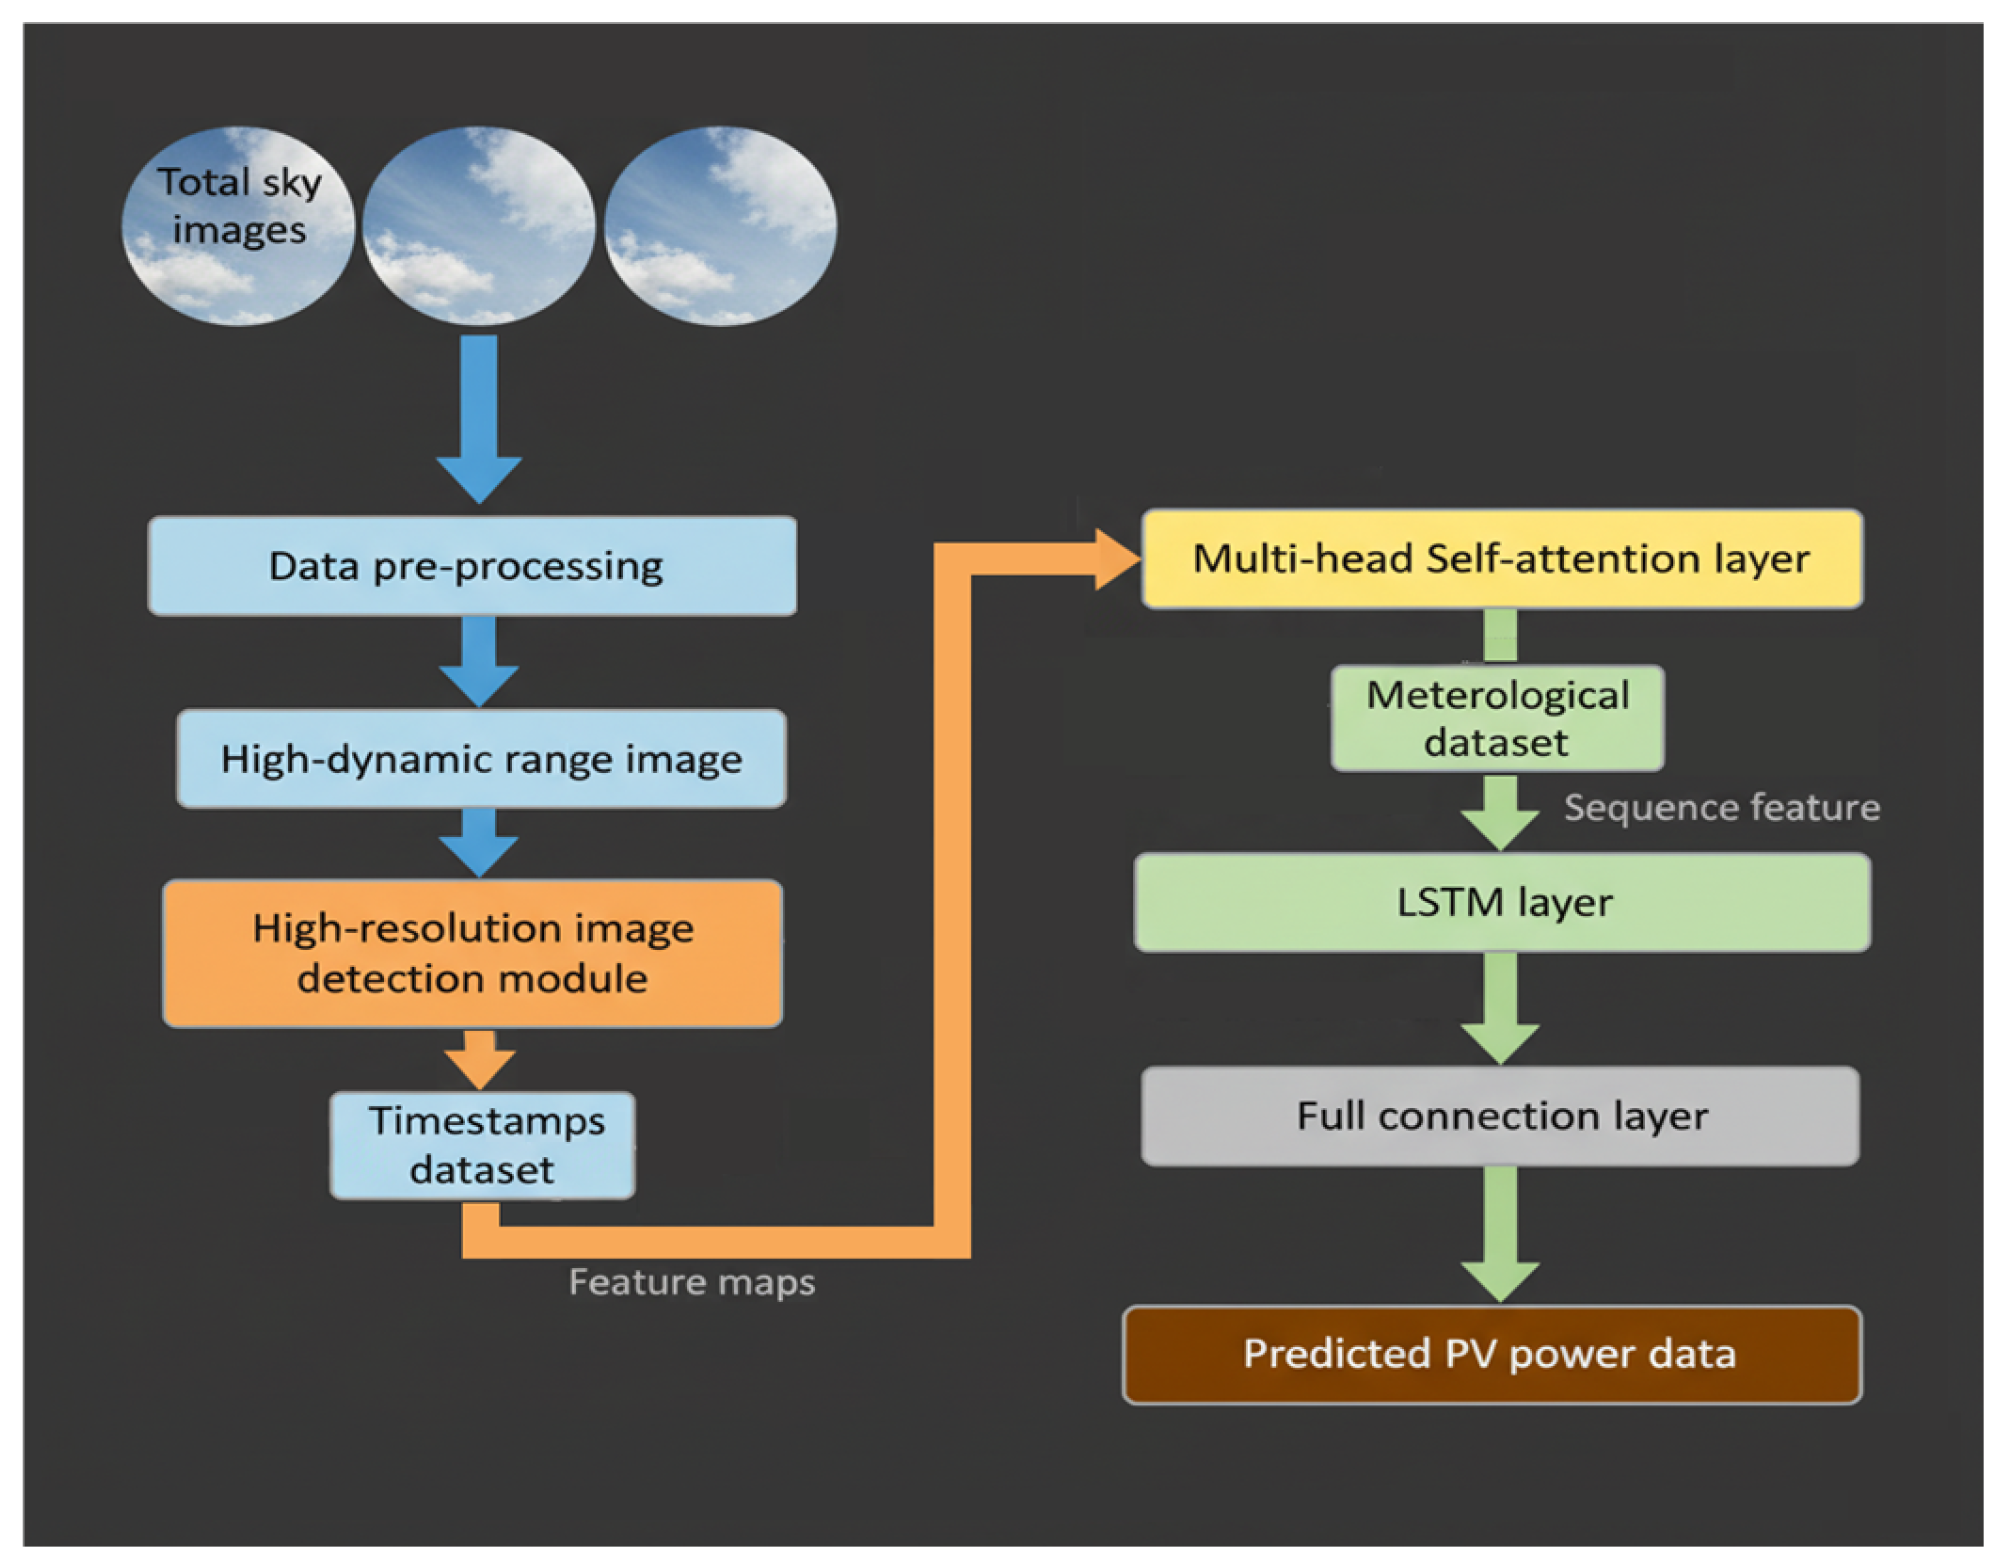
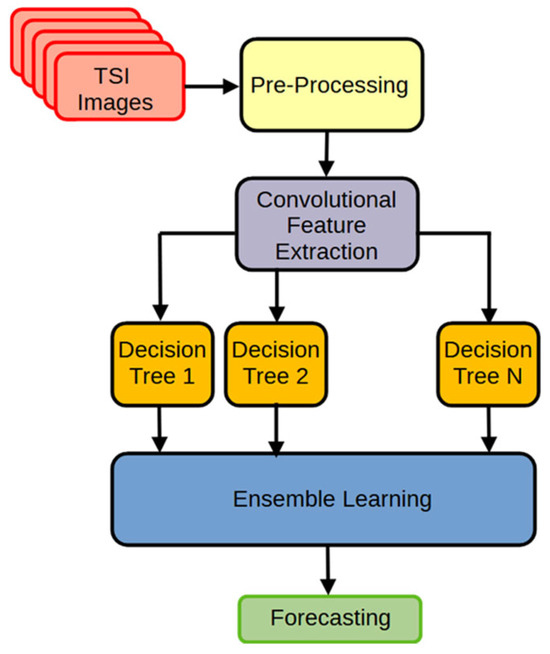
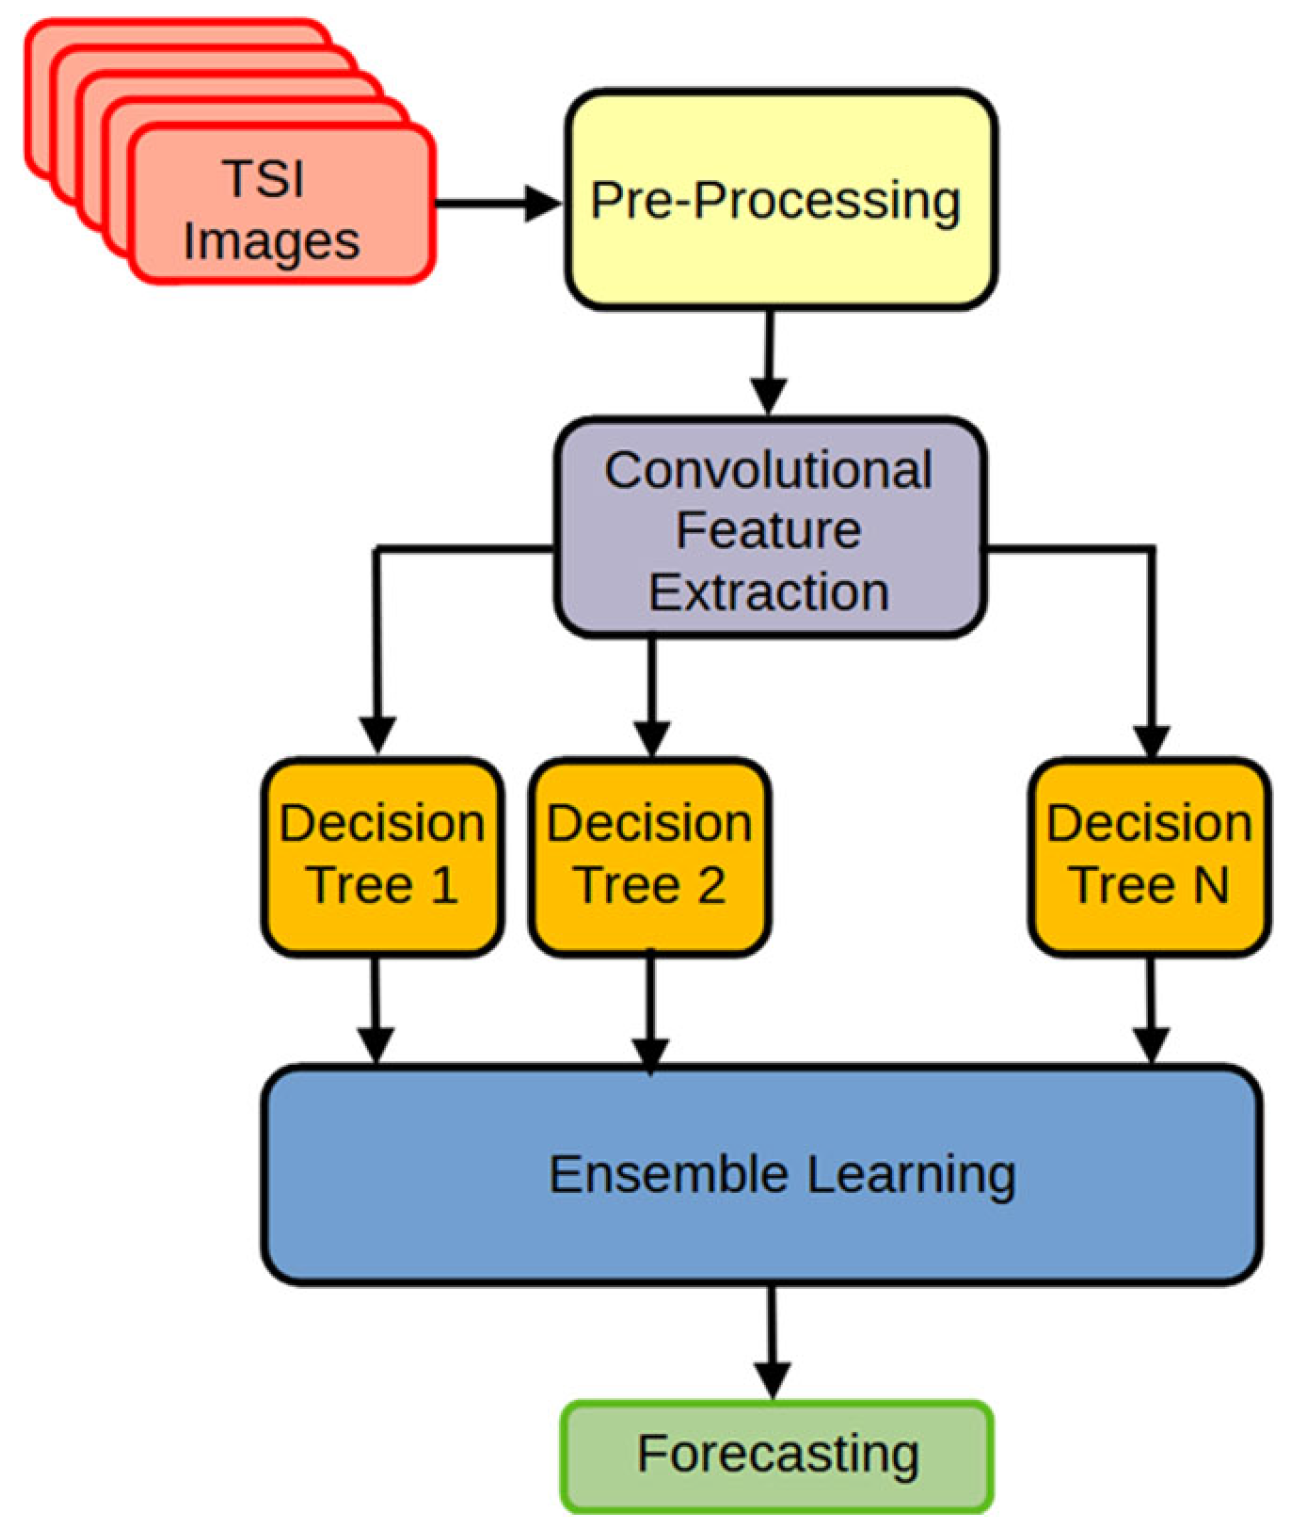
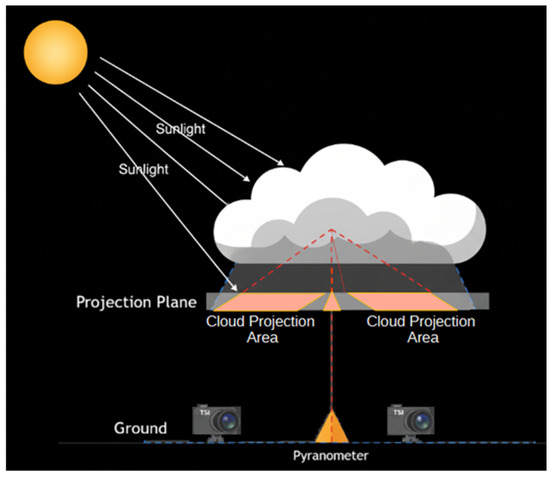
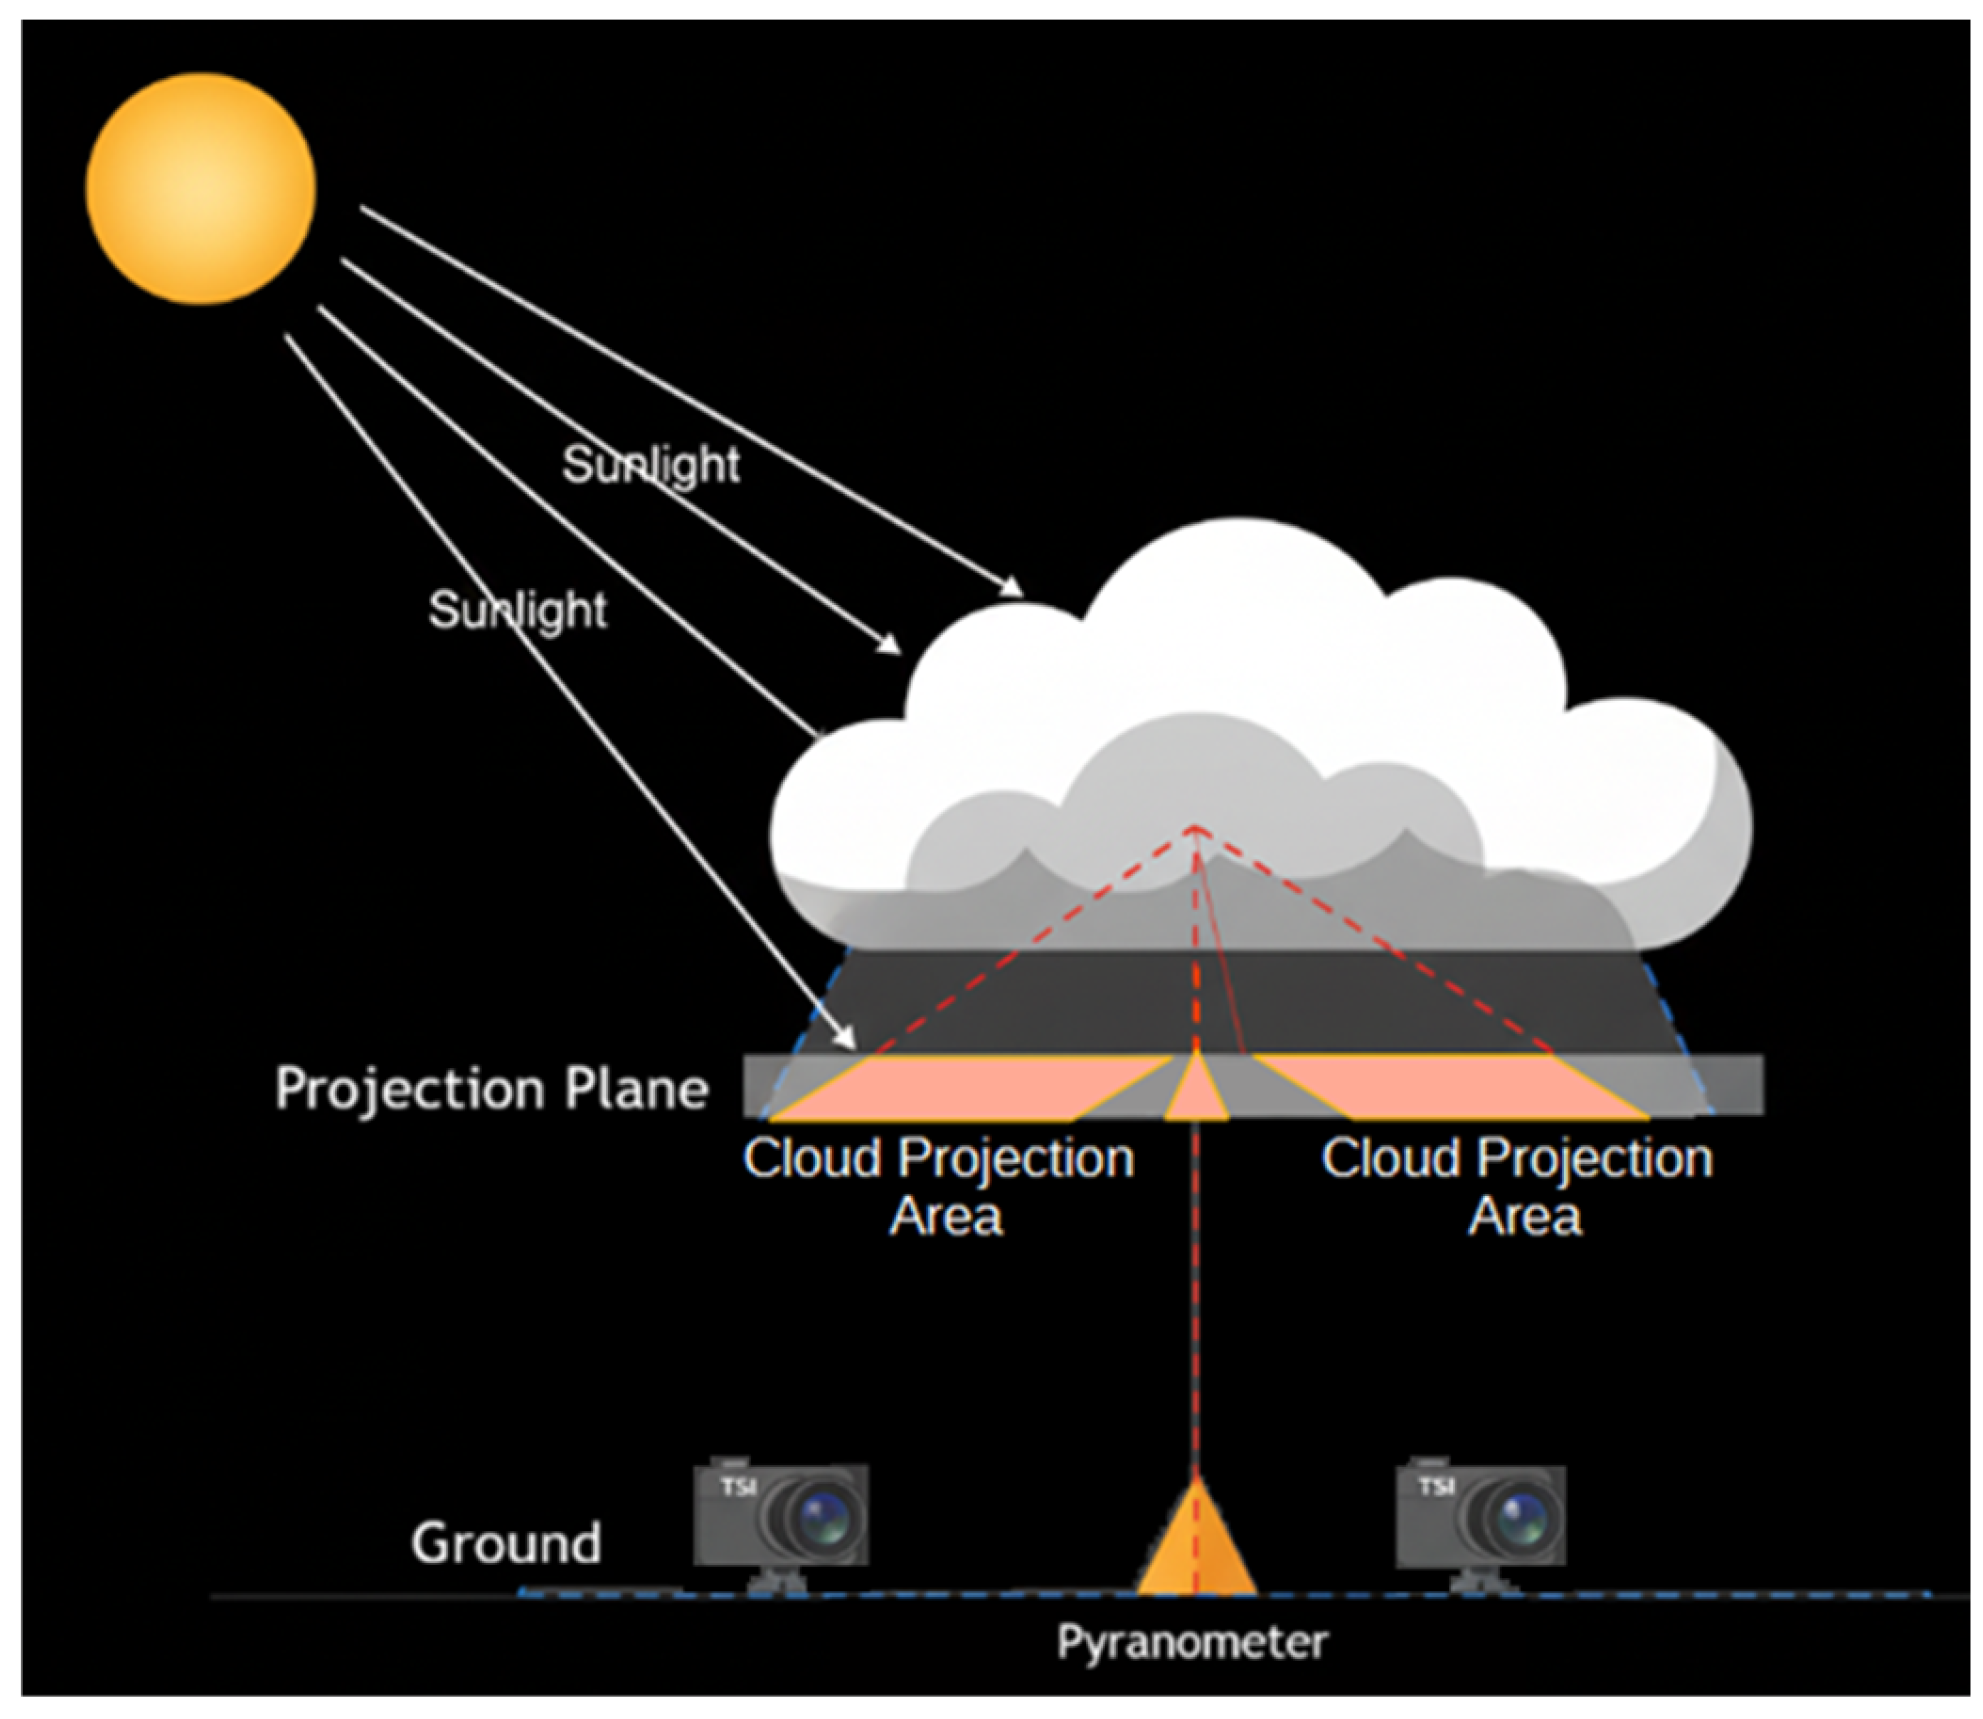
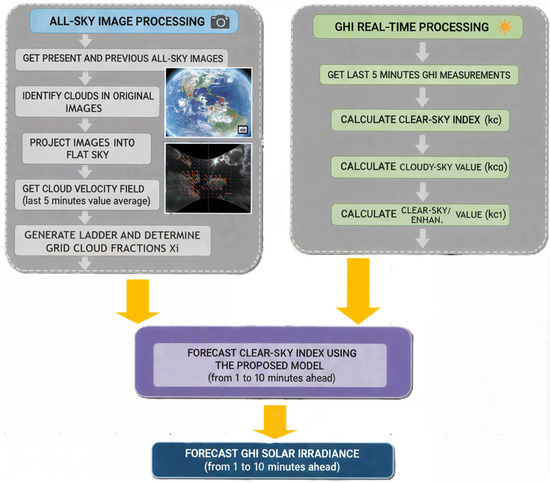
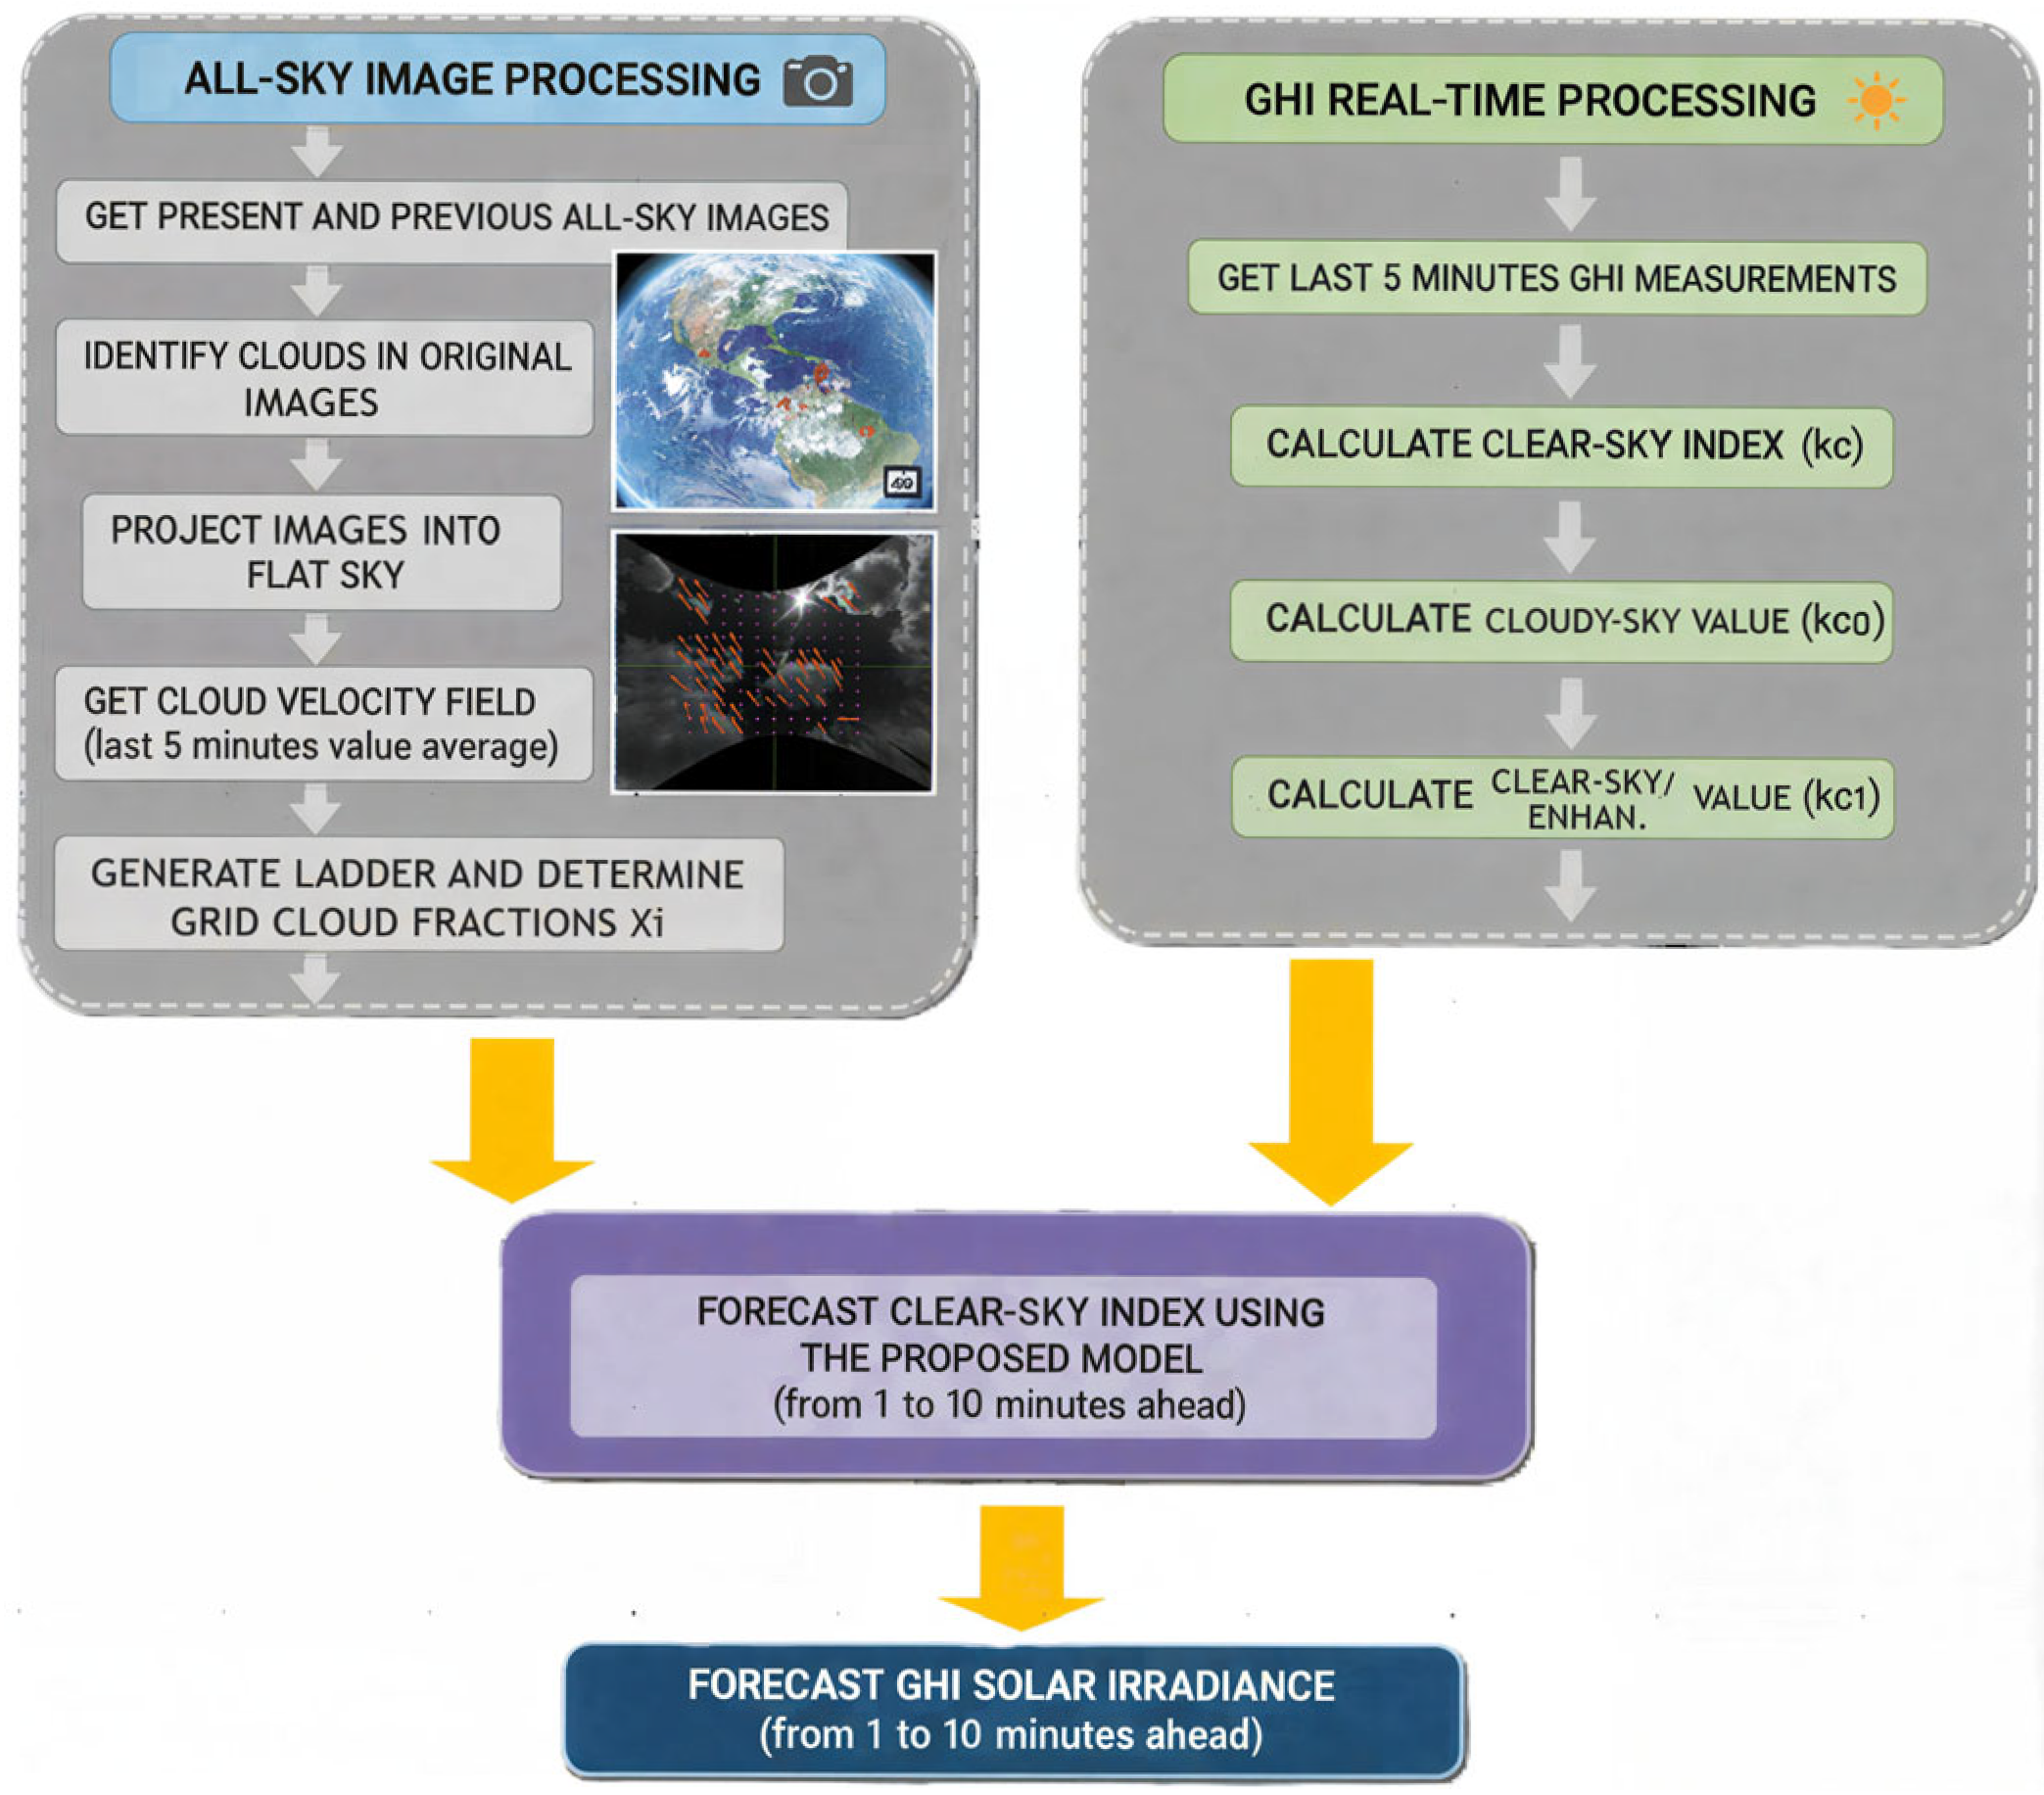
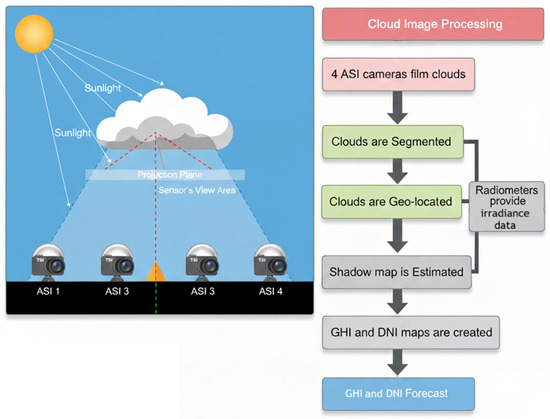
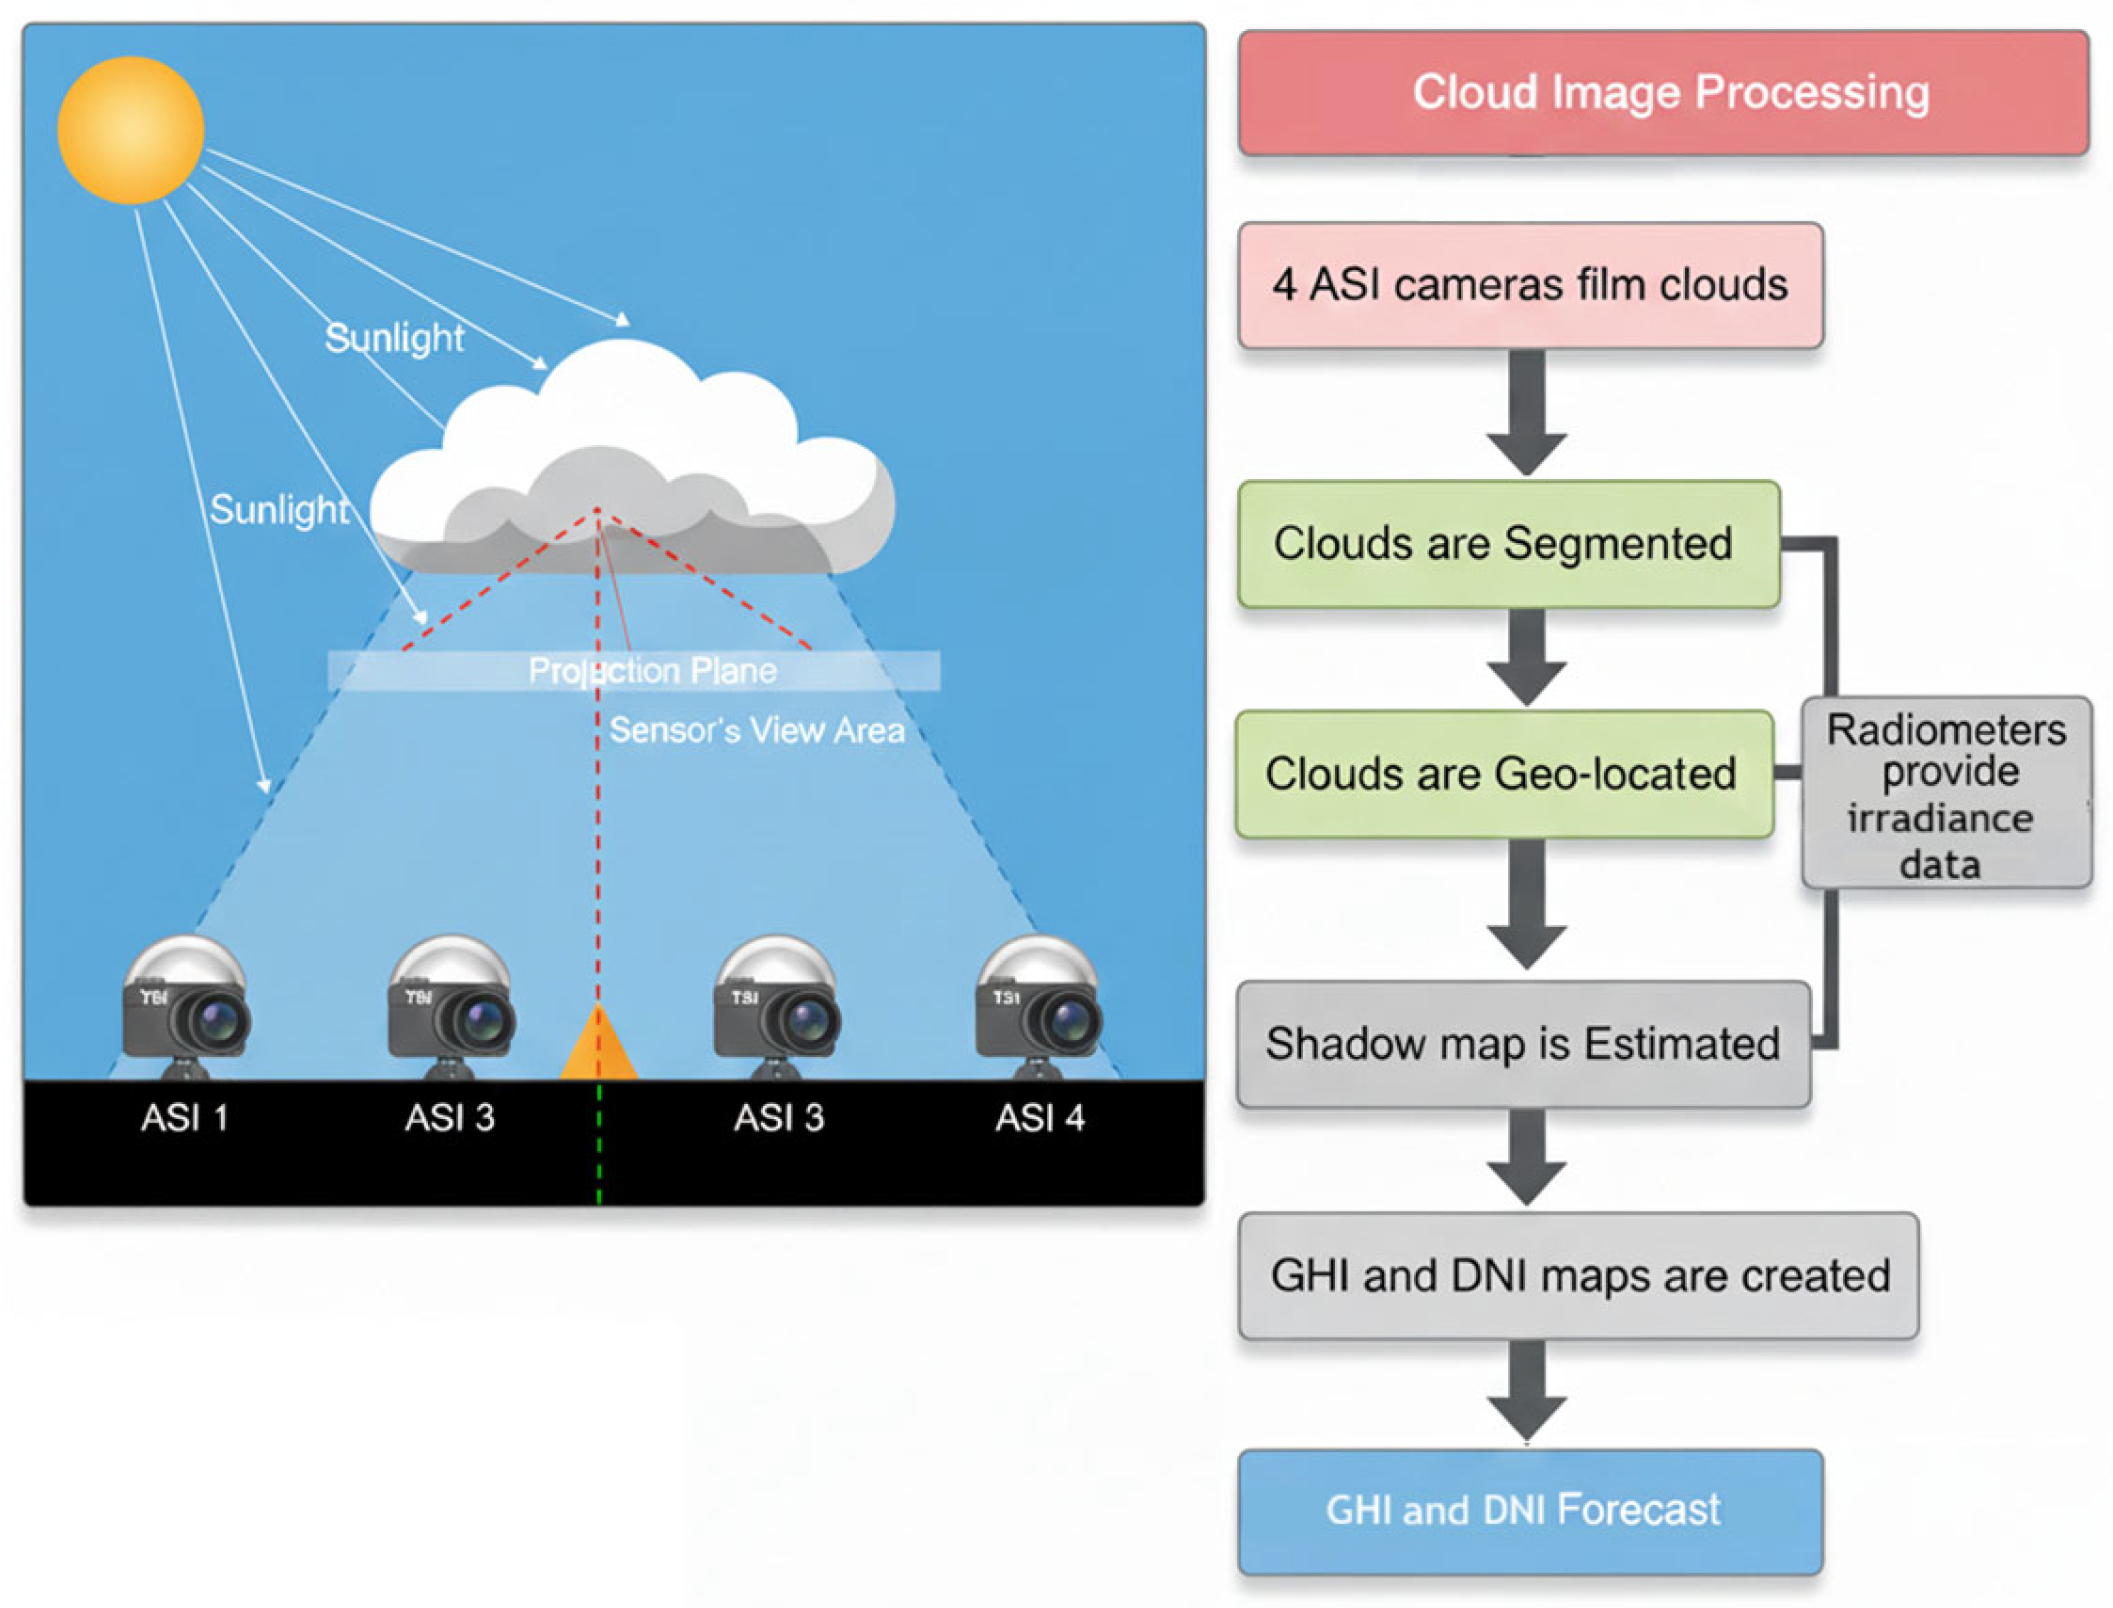
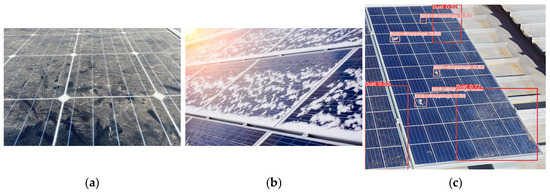
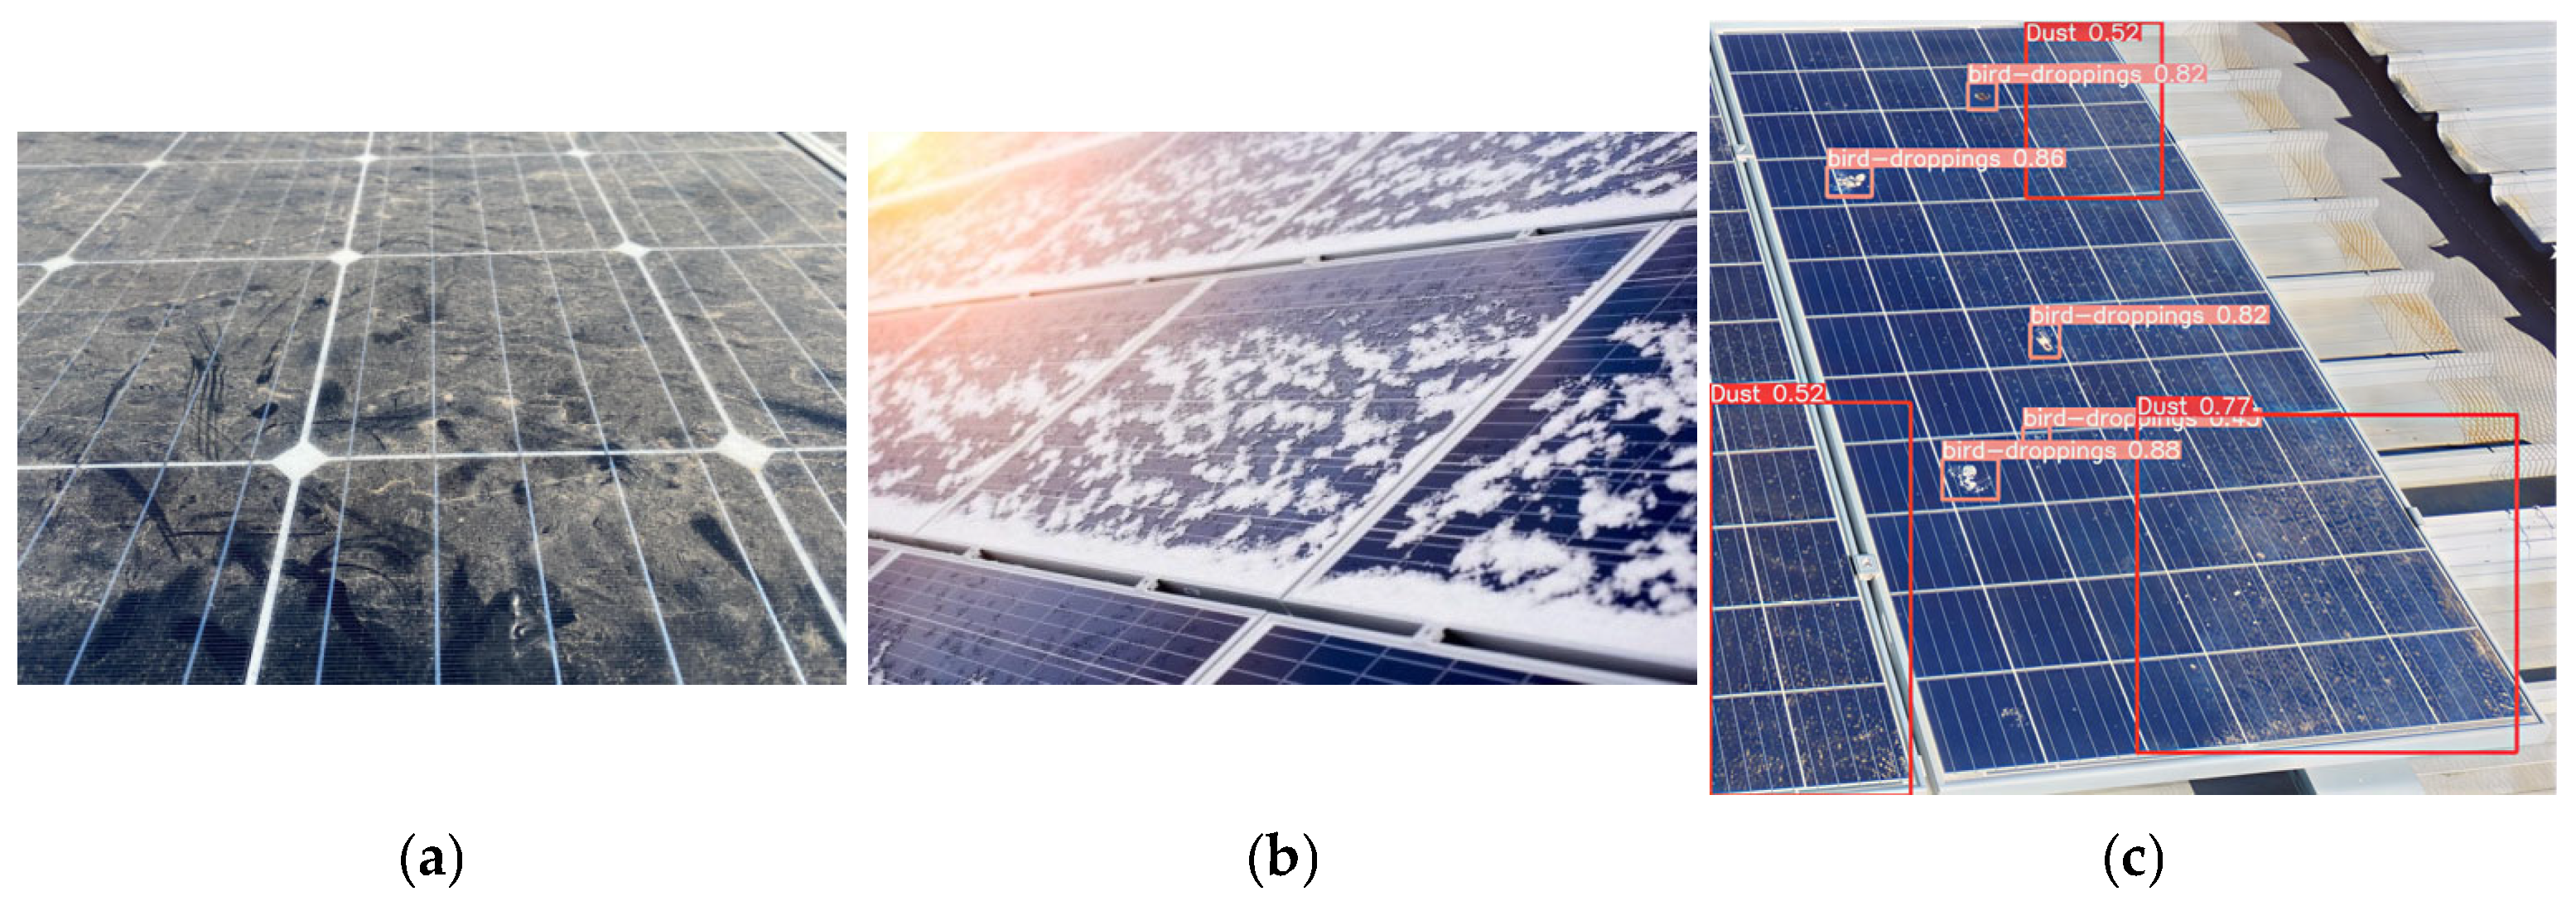
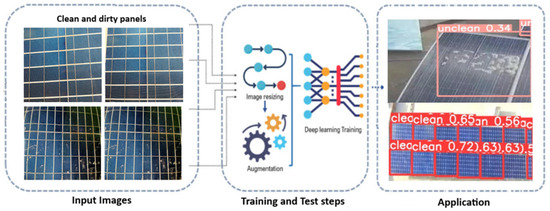
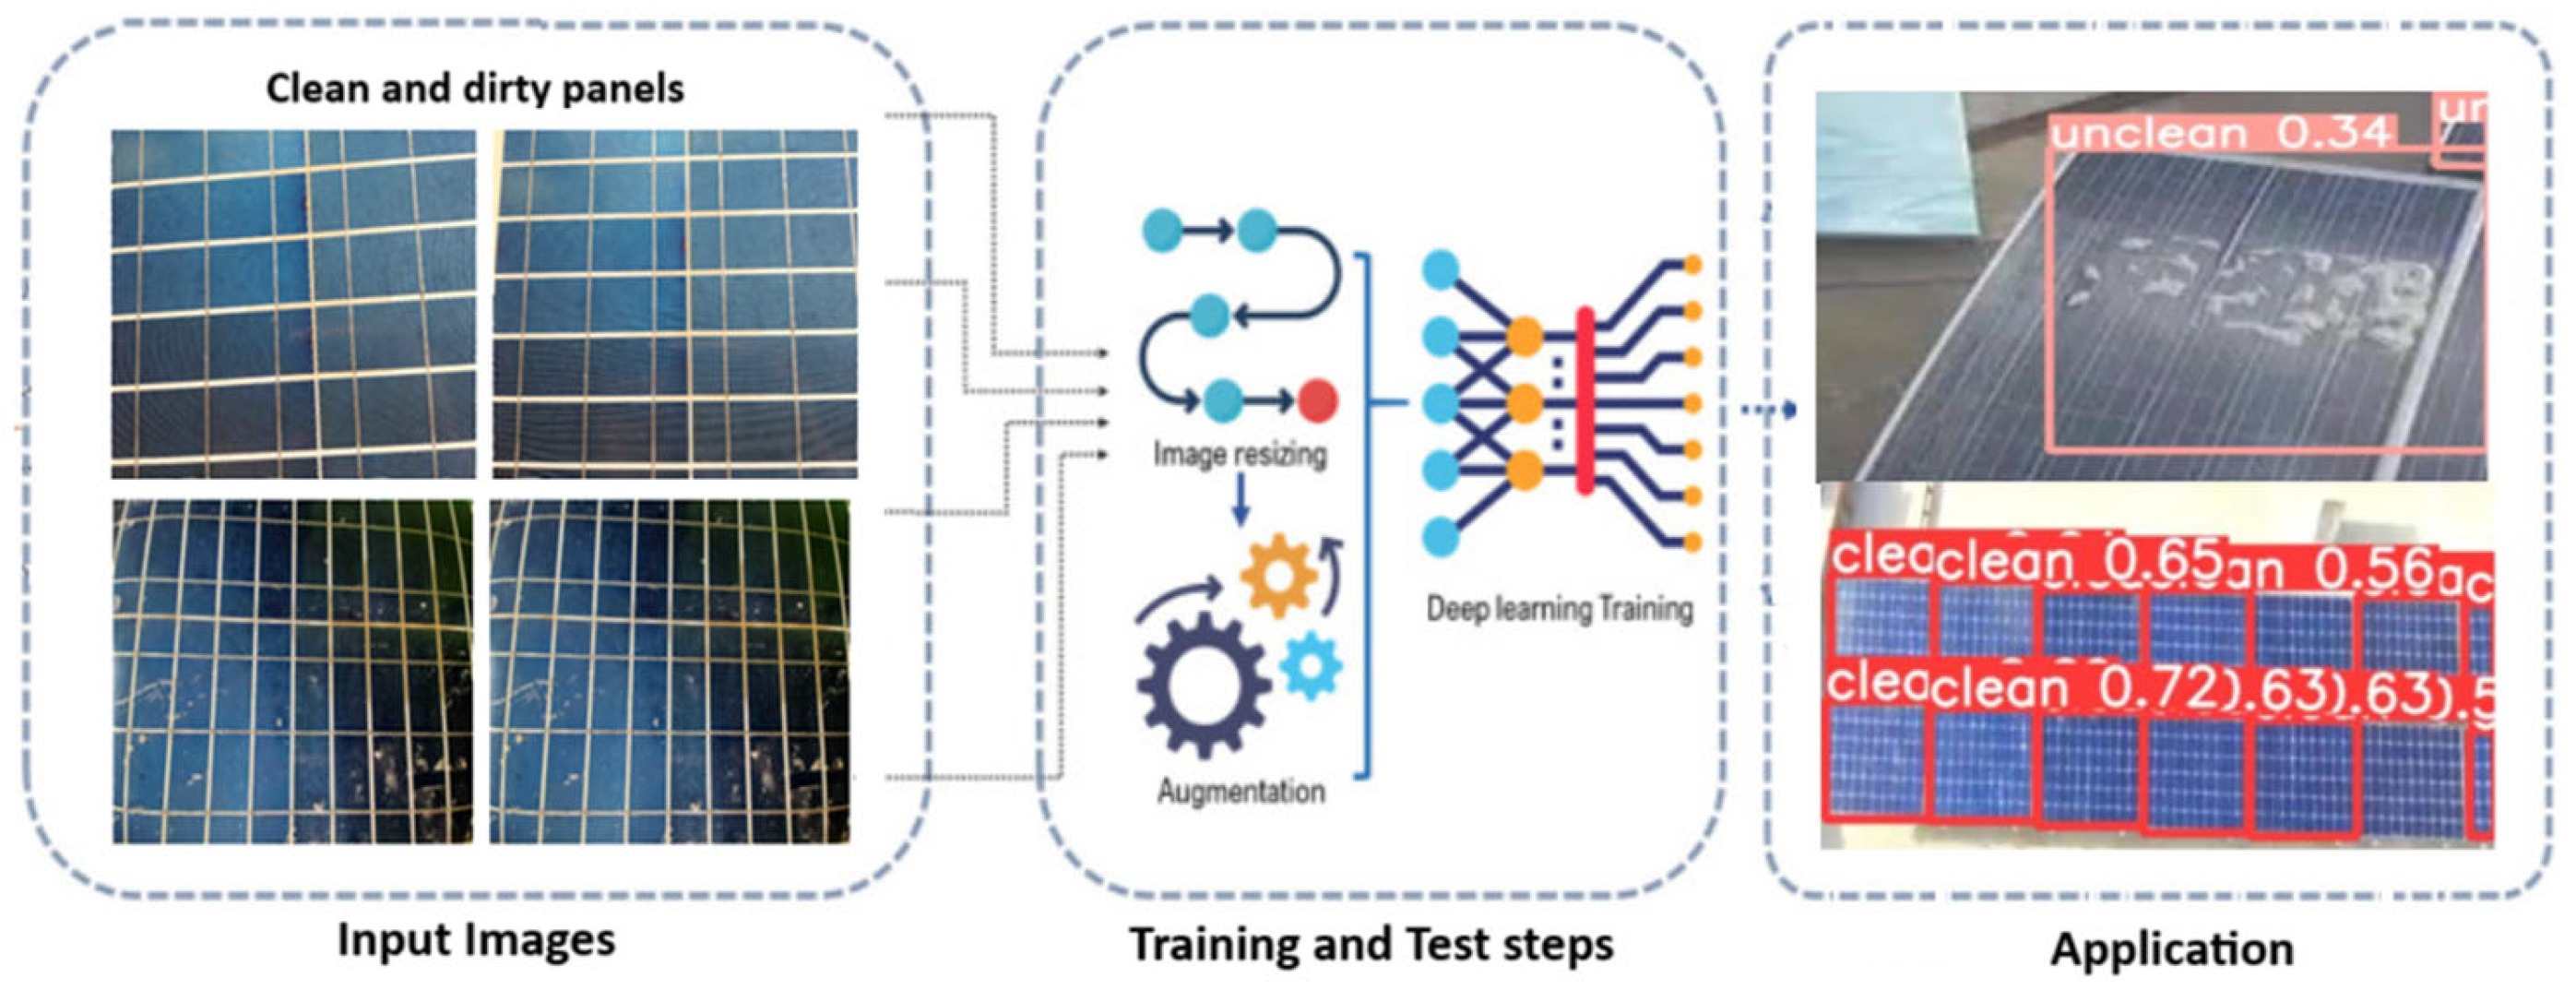
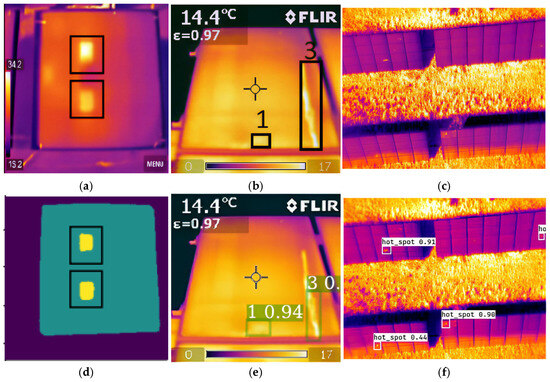
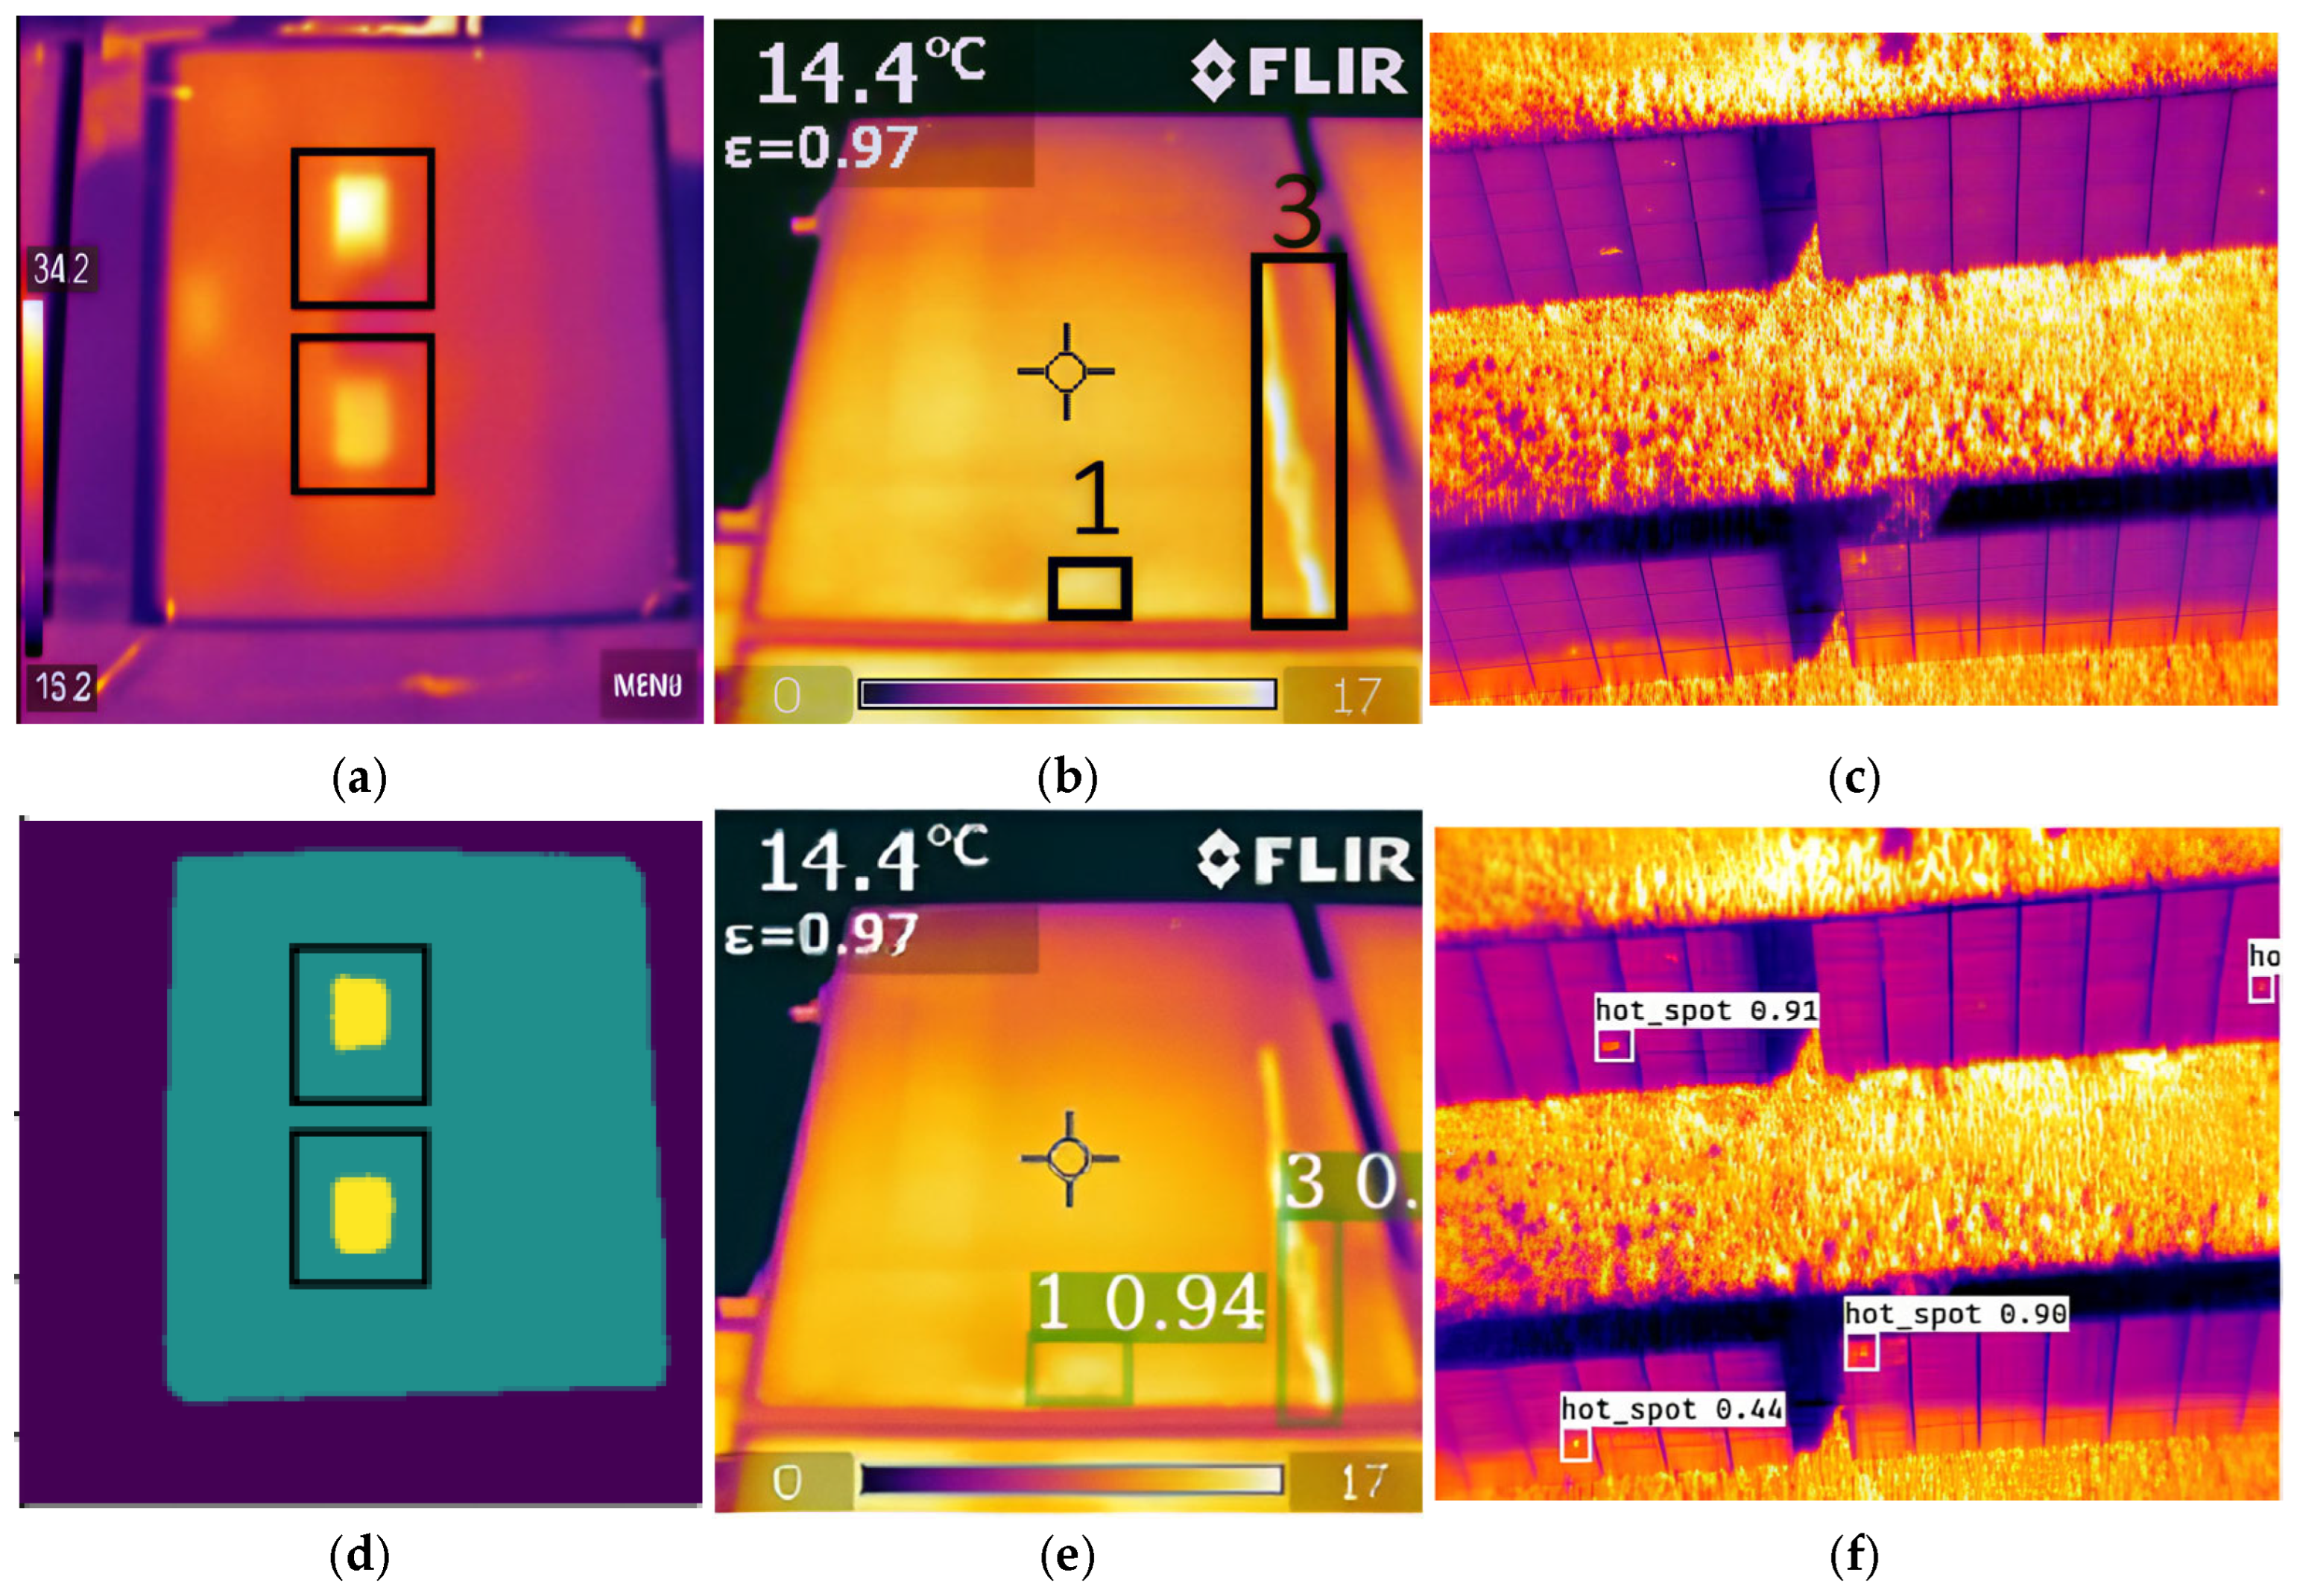
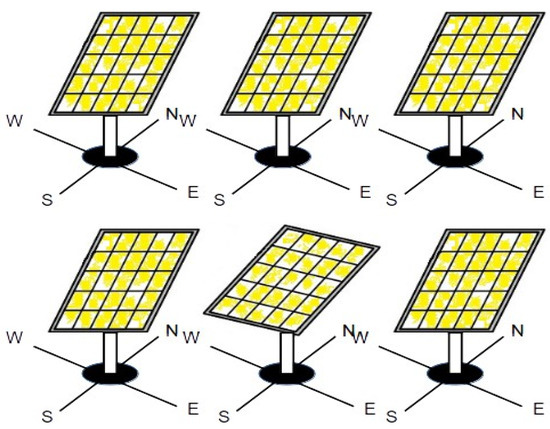
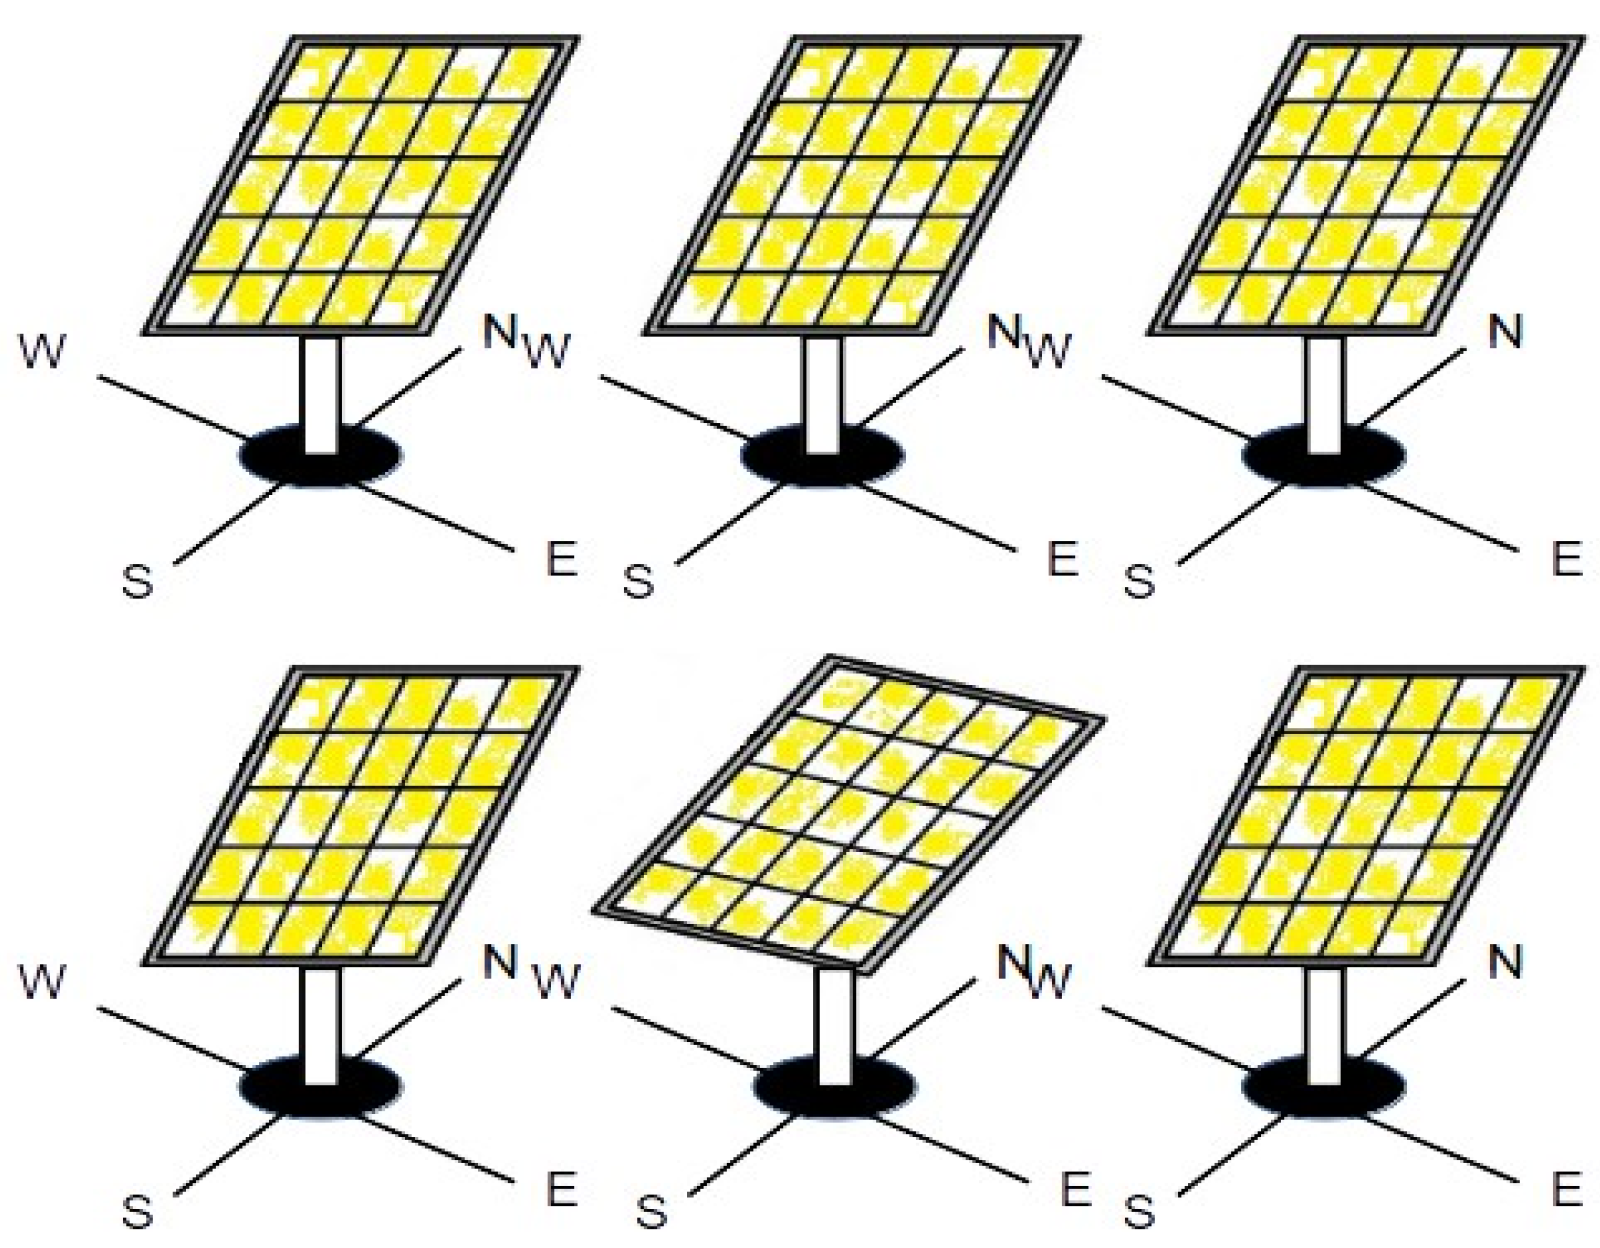
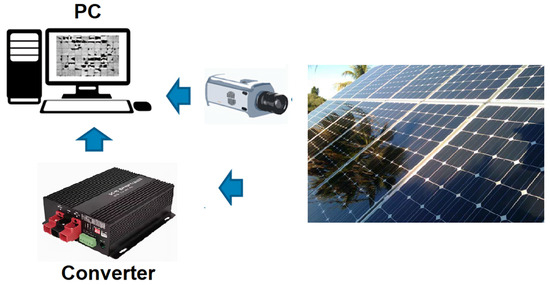
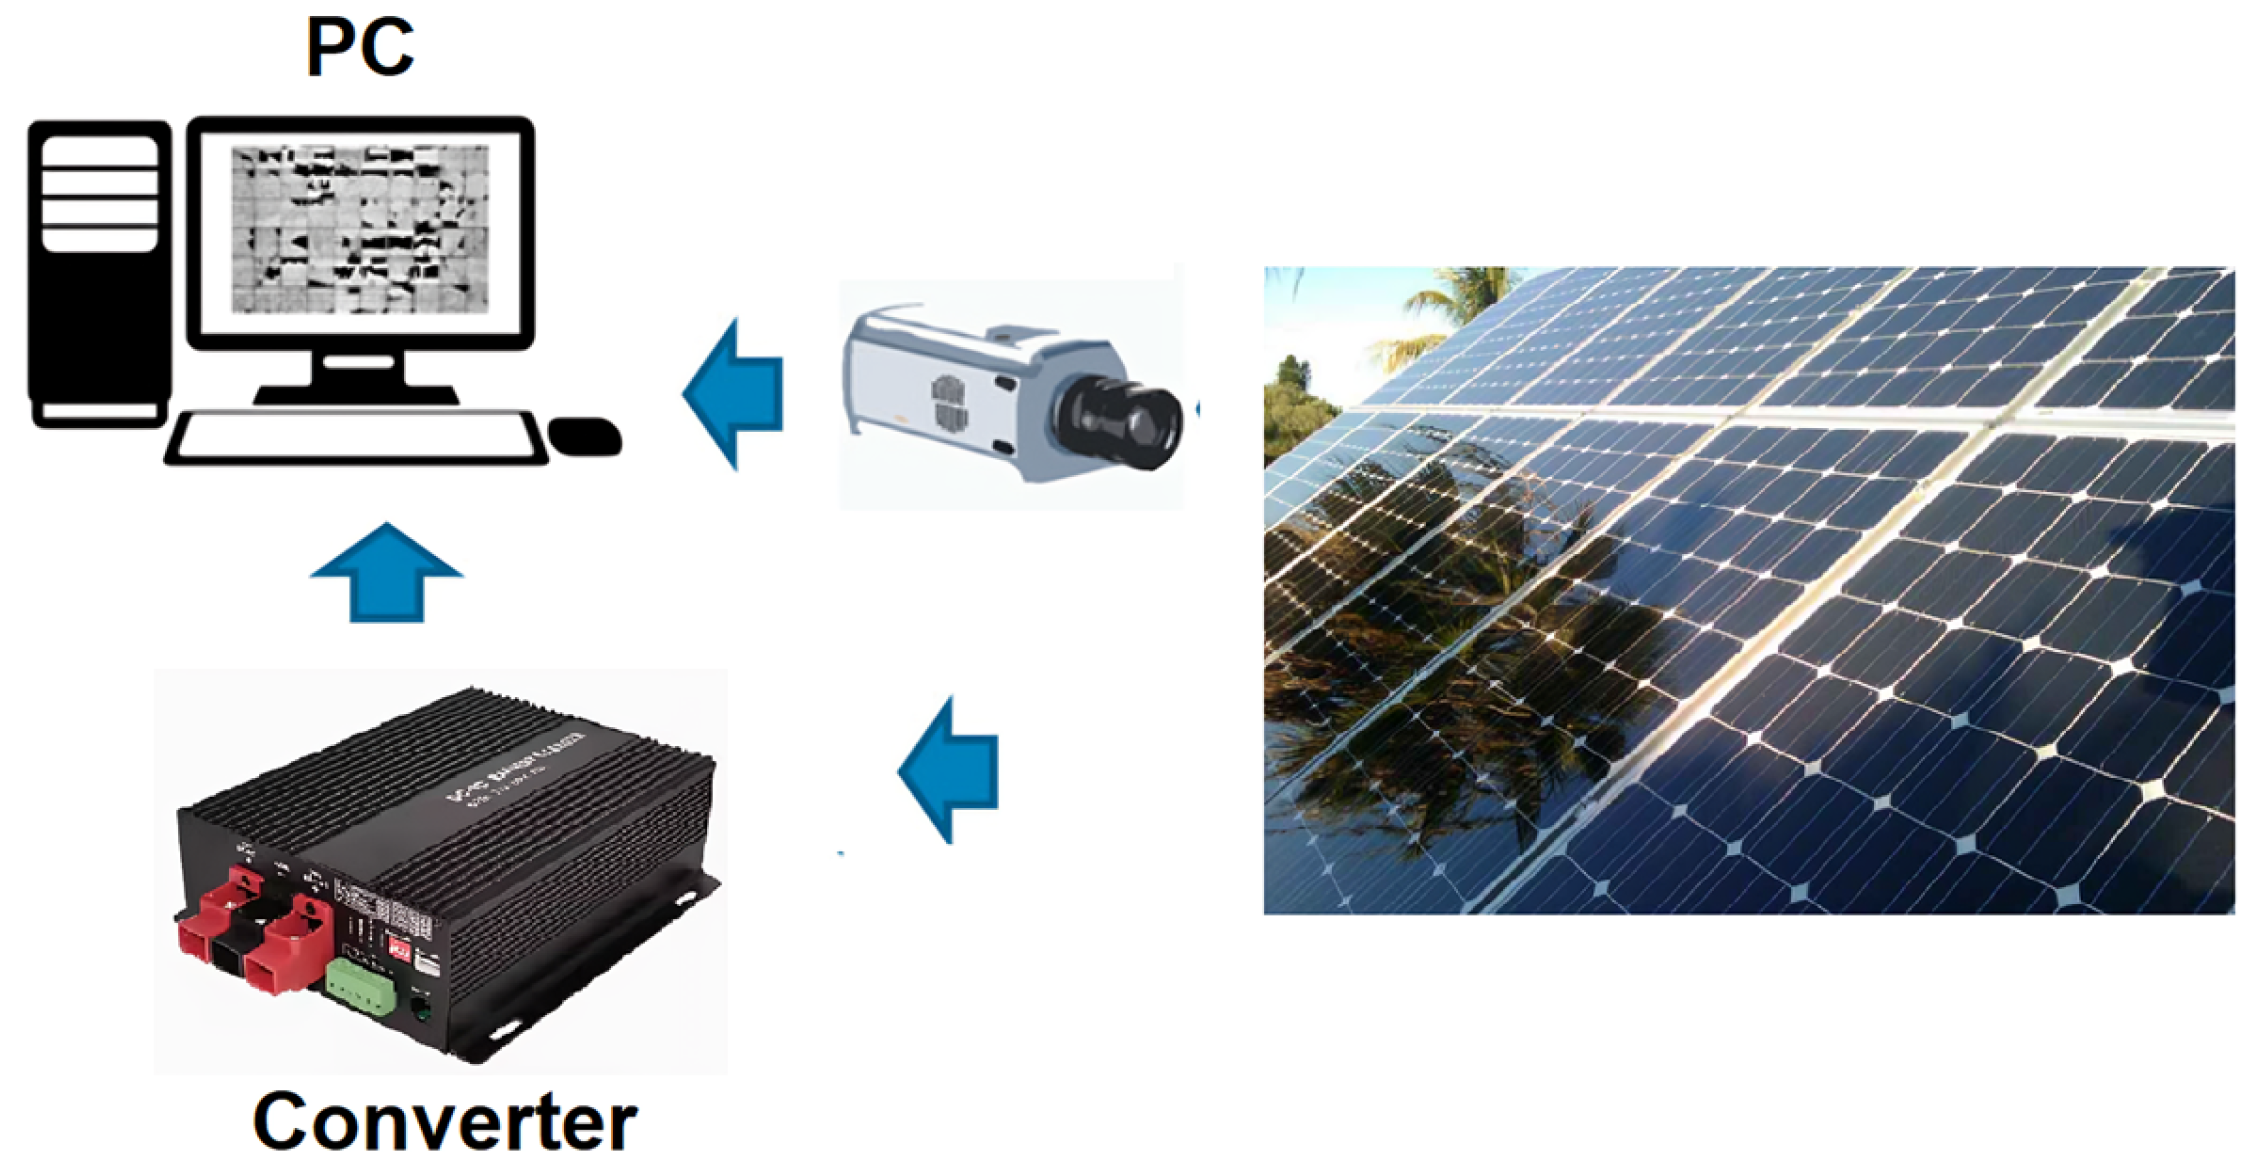

Disclaimer/Publisher’s Note: The statements, opinions and data contained in all publications are solely those of the individual author(s) and contributor(s) and not of MDPI and/or the editor(s). MDPI and/or the editor(s) disclaim responsibility for any injury to people or property resulting from any ideas, methods, instructions or products referred to in the content. |
© 2025 by the authors. Licensee MDPI, Basel, Switzerland. This article is an open access article distributed under the terms and conditions of the Creative Commons Attribution (CC BY) license (https://creativecommons.org/licenses/by/4.0/).