Abstract
Efficient truck–shovel allocation is essential for optimizing open-pit mining operations, but the integration of heterogeneous diesel and electric fleets introduces complex scheduling challenges, including charging requirements, range limitations, and equipment capacity constraints. This study proposes an integrated allocation framework tailored to heterogeneous fleets, formulating a multi-objective optimization model that minimizes transportation cost and waiting time under realistic constraints. An enhanced multi-objective particle swarm optimization algorithm with adaptive penalty mechanisms is developed, providing superior convergence and computational efficiency compared to traditional methods. A case study demonstrates that heterogeneous fleets achieve a better trade-off, with a balanced fleet configuration reducing transportation cost by 26.1% and waiting time by 19.2% compared to pure diesel and electric fleets, respectively. Sensitivity analyses reveal that fluctuations in fuel and electricity prices reshape the trade-off, while faster charging enhances electric truck competitiveness but increases diesel idle time. These findings offer practical insights for configuring heterogeneous fleets and adapting scheduling strategies in dynamic energy and technology environments, supporting sustainable mining operations.
1. Introduction
In open-pit mining operations, the truck–shovel allocation problem is a central factor determining transportation efficiency and production cost. The transportation process typically accounts for 50–60% of total mine operating expenses, and improper truck–shovel allocation often leads to equipment idleness, increased waiting time, and excessive energy consumption, thereby becoming a critical bottleneck to production efficiency [1,2,3,4]. With the continuous expansion of production scale and the gradual increase in transportation distances, achieving efficient and stable truck–shovel allocation under complex operating conditions has become a key challenge for mining enterprises.
In recent years, driven by energy-saving and emission-reduction policies as well as the demand for green mine construction, more mining enterprises have introduced electric trucks in addition to traditional diesel fleets, gradually forming heterogeneous diesel–electric fleets [5]. The term “heterogeneous” specifically refers to energy heterogeneity, where diesel and electric trucks differ fundamentally in their energy sources, refueling mechanisms, and operational characteristics. Compared with diesel trucks, electric trucks offer clear advantages in operating cost and environmental performance, but their limited range and frequent charging requirements constrain operational flexibility [6]. Diesel trucks, by contrast, are capable of handling long-distance and high-intensity transportation tasks, but at the cost of high fuel consumption and substantial maintenance expenses [7]. The differences between the two vehicle types create strong complementarity within the fleet but also introduce new challenges for scheduling [8]. Traditional allocation and scheduling methods designed for homogeneous fleets often fail under heterogeneous conditions, leading to reduced system efficiency and increased transportation costs [9]. Therefore, developing scientifically sound and efficient truck–shovel allocation strategies in heterogeneous diesel–electric fleet environments represent a critical issue in both research and practice.
To overcome these limitations, this paper proposes an integrated truck–shovel allocation framework for heterogeneous diesel–electric fleets in open-pit mines. The framework formulates a multi-objective optimization model that minimizes transportation cost and truck waiting time while explicitly considering shovel capacity, unloading throughput, and energy and charging constraints of electric trucks. The primary contributions of this paper are summarized as follows:
- (1)
- An integrated multi-objective truck–shovel allocation model is developed for heterogeneous diesel–electric fleets in open-pit mines, explicitly incorporating practical constraints including shovel capacity, unloading throughput, battery energy consumption, and charging requirements.
- (2)
- An improved multi-objective particle swarm optimization (MOPSO) algorithm with adaptive penalty mechanisms is designed to efficiently handle the complex, constraint-intensive scheduling problem and generate high-quality Pareto-optimal solutions.
- (3)
- Comprehensive case studies and sensitivity analyses are conducted to compare homogeneous and heterogeneous fleet configurations, providing practical insights into cost–efficiency trade-offs and the operational roles of diesel and electric trucks under varying energy and technology conditions.
The rest of this study is organized as follows: Section 2 reviews the relevant literature on truck–shovel allocation in open-pit mining, electric haulage systems, and evolutionary optimization methods, and identifies the research gaps addressed in this study. Section 3 presents the multi-objective truck–shovel allocation model, including model assumptions, objective functions, and constraints. Section 4 details the algorithm design and parameter configuration, outlining the solution procedure of the improved MOPSO. Section 5 first validates the proposed MOPSO algorithm through a benchmark comparison with NSGA-II and SPEA2, and then applies it in a case study to compare different fleet configurations, demonstrating the overall effectiveness of the approach. Finally, Section 6 summarizes the conclusions and discusses potential directions for future research.
2. Literature Review
In this section, we systematically review the current state of research on truck–shovel allocation in open-pit mining, electric haulage systems, and evolutionary optimization methods for complex scheduling problems.
- (1)
- Truck–Shovel Allocation in Open-Pit Mining
Extensive research has been devoted to truck–shovel allocation in open-pit mining, as this problem directly determines hauling efficiency and system productivity. Early studies primarily relied on queuing theory and linear programming to capture the relationship between fleet size, shovel utilization, and overall system performance. Ercelebi and Bascetin [10] combined queuing analysis with linear programming, demonstrating that coordinated fleet sizing and dispatching strategies could significantly reduce hauling costs. As research progressed, more sophisticated optimization models were developed to address allocation efficiency under realistic operational conditions. Ta et al. [11] incorporated linearized shovel idle probabilities into an integer programming model, improving the balance between fleet size, throughput, and production targets. Zhang and Xia [12] formulated an integer programming approach that minimized operating costs while meeting production requirements, while Bajany et al. [13] developed a MILP-based scheduling model focusing on fuel consumption minimization under the m-trucks-for-n-shovels strategy. Simulation and stochastic modeling approaches have further enriched truck–shovel allocation studies. Mena et al. [14] introduced an availability-based simulation-optimization framework that integrates RAM (reliability, availability, and maintainability) characteristics to guide dynamic fleet assignment. Dindarloo et al. [15] developed a stochastic discrete-event simulation framework to account for uncertainties in loading, hauling, and queuing processes during equipment selection and sizing. More recent contributions emphasize multi-objective and uncertainty-aware allocation models. Bakhtavar et al. [16] employed scenario-based robust optimization to capture variations in shovel capacity and crusher throughput. Mohtasham et al. [17] introduced a chance-constrained goal programming approach that jointly considers production, grade, tonnage, and fuel consumption targets under uncertainty. Matamoros and Dimitrakopoulos [18] proposed a stochastic integer programming formulation for short-term mine scheduling that integrates fleet allocation decisions. Upadhyay and Askari-Nasab [19] designed a multi-objective goal programming framework that simultaneously optimizes production, grade stability, feed consistency, and cost control in truck–shovel operations.
- (2)
- Electrification and Electric Haulage Systems in Open-Pit Mining
With the growing awareness of energy conservation, emission reduction, and sustainable development in the mining industry, mine electrification has attracted increasing attention from both academia and industry. Halim et al. [20] conducted a field trial at the Kittilä gold mine, comparing battery-electric vehicles (BEVs) with diesel machines, and reported substantial reductions in harmful gas and particulate emissions, noise, and heat generation, along with improved working conditions and predominantly positive worker feedback. Building upon such findings, recent research has increasingly shifted toward addressing the operational constraints and optimization challenges of electric haulage fleets. Lindgren et al. [21] proposed a combined electric road-battery electric truck scheme for open-pit mines, developing a simulation model based on field measurements and demonstrating its feasibility in reducing both CO2 emissions and operating costs compared to diesel alternatives. From the perspective of route and energy modeling, Junhuathon et al. [22] introduced a route feature-based energy consumption model for electric trucks that incorporates regenerative braking probability into traditional models and uses genetic algorithm-based parameter optimization to enhance both consumption prediction and state-of-charge estimation accuracy. Similarly, Zhang et al. [23] developed an electric vehicle routing problem (EVRP) model with recharging stations to minimize energy consumption, solved via an ant colony optimization approach, which better reflects the impact of load and speed on consumption compared to traditional distance-minimization models. In terms of scheduling optimization specifically tailored for electric truck operations, Zhang et al. [24] proposed a rolling-horizon MILP model for heterogeneous electric trucks under charging and service queue constraints, introducing branch-and-price and labeling algorithms to manage large-scale constraints. Xiao et al. [25] examined battery-swapping trucks in open-pit mining, formulating a multi-objective optimization model solved by both standard and adaptive genetic algorithms; results showed that the adaptive approach reduced transportation costs by 5.6% and waiting times by 17.4% without violating operational constraints. Beyond static charging, Zähringer et al. [26] developed an online dynamic programming-based charging strategy for long-haul battery-electric trucks that explicitly considers actual charging curves, driver rest regulations, and station occupancy, halving the time losses compared to driver-led decisions and providing actionable infrastructure planning recommendations. These advances in energy modeling, routing, and scheduling for electric haul trucks lay a solid methodological and technological foundation for addressing the truck–shovel allocation challenge in heterogeneous diesel–electric fleets.
Given that the literature specifically focusing on electric haulage systems in open-pit mining remains relatively limited, it is appropriate to draw methodological insights from related research areas, such as electric vehicle fleet routing and charging optimization. These studies provide useful approaches for modeling energy consumption and charging behavior of electric vehicles. However, truck–shovel systems in open-pit mining exhibit distinct operational characteristics, including cyclic hauling processes and strong coupling between loading, hauling, and unloading activities. Accordingly, this study extends existing methods by integrating charging constraints into a truck–shovel allocation framework that is explicitly tailored to heterogeneous diesel–electric fleets.
- (3)
- Evolutionary Algorithms for Complex Scheduling Problems
Complex scheduling and allocation problems are typically characterized by large-scale decision spaces, nonlinear relationships, multiple conflicting objectives, and various operational constraints. Traditional exact optimization methods often struggle to obtain high-quality solutions within acceptable computational time under such conditions. Consequently, evolutionary algorithms have been widely adopted due to their population-based search mechanisms and strong global exploration capability.
To improve convergence efficiency and solution diversity, Akopov [27] addressed bi-objective optimization problems by developing an improved parallel hybrid real-coded genetic algorithm with clustering-based selection. By introducing clustering-based parent selection and parallel computation strategies, the proposed method achieved higher computational efficiency while preserving high-quality Pareto-optimal solutions. Building upon genetic-based evolutionary frameworks, PSO has gained increasing attention because of its simple structure and fast convergence. However, conventional PSO and its multi-objective variants often suffer from premature convergence when applied to constrained and high-dimensional problems. To address this issue, Akopov [28] proposed a clustering-based hybrid particle swarm optimization (CBHPSO) algorithm for multisectoral agent-based models. In this approach, clustering strategies were introduced to enhance information sharing among particles, while real-coded genetic operators were incorporated to improve population diversity and convergence stability in multi-objective optimization. Further improvements have been achieved by hybridizing PSO with other evolutionary mechanisms. Asija and Choudekar [29] developed a multi-objective hybrid differential evolution-particle swarm optimization (DE-PSO) algorithm by embedding differential evolution mutation and crossover operators into the PSO updating process, the proposed method enhanced global search capability and significantly improved Pareto-front approximation quality compared with conventional PSO-based approaches. To improve adaptability in dynamic and complex optimization environments, Xu et al. [30] proposed a hybrid differential evolution-particle swarm optimization algorithm based on dynamic strategies. Their method introduced adaptive inertia weights and dynamically adjusted acceleration coefficients together with differential evolution operators, enabling faster convergence and improved ability to escape local optima. Hybrid evolutionary algorithms have also been increasingly applied to practical scheduling problems. Shao et al. [31] addressed task scheduling problems by proposing a hybrid PSO-GA method in which genetic crossover and mutation operators were directly integrated into the PSO framework. This hybridization effectively alleviated premature convergence while preserving fast convergence speed, demonstrating the effectiveness of evolutionary algorithm hybridization for complex scheduling applications.
Overall, research on truck–shovel allocation has evolved from early queuing theory and linear programming approaches to advanced optimization models capable of addressing multi-objective, multi-constraint, and uncertainty conditions, with significant progress made in simulation, robust optimization, and goal programming. However, most existing studies focus on homogeneous diesel fleets and cannot be directly applied to heterogeneous fleets that include electric trucks. Although recent studies have explored aspects such as energy consumption modeling, route optimization, and scheduling strategies for electric haul trucks, they largely address single vehicle types, lacking a systematic framework that jointly considers the operational characteristics of diesel and electric trucks, energy supply constraints, and loading-unloading capacity. In addition, recent evolutionary optimization studies further indicate that hybridization strategies integrating clustering mechanisms, genetic operators, and differential evolution can effectively enhance convergence efficiency and solution quality. However, most of these methods are designed for generic optimization problems and are rarely tailored to the operational characteristics and energy-related constraints of truck–shovel allocation in heterogeneous diesel–electric fleets.
To overcome the limitations of existing methods, this study develops a multi-objective truck–shovel allocation model for heterogeneous diesel–electric fleets in open-pit mines, aiming to minimize both transportation cost and waiting time. The model systematically incorporates practical constraints such as battery energy consumption, charging requirements, shovel capacity, and unloading point throughput. To effectively solve this complex problem, an improved MOPSO algorithm with embedded constraint-handling mechanisms is developed to generate truck–shovel allocation schemes. The proposed approach not only addresses the lack of systematic scheduling methods for heterogeneous fleets in existing research but also enables a dynamic trade-off between cost and efficiency, thereby significantly enhancing the overall performance of the transportation system.
3. Methodology
3.1. Description
In the heterogeneous diesel–electric truck transportation system of open-pit mines, the operational process involves multiple shovels, unloading points, and energy supply facilities (gas stations and charging stations), as illustrated in Figure 1. Both diesel trucks and electric trucks must execute ore transportation tasks among these functional nodes, subject to the operational capacities of each node as well as energy supply constraints. Unlike a homogeneous fleet of diesel trucks, electric trucks must additionally account for charging time and driving range limitations when performing transportation tasks. To minimize total system waiting time and transportation cost, the truck–shovel allocation must achieve effective matching across different vehicle types, transportation routes, and operational nodes.

Figure 1.
Schematic diagram of the heterogeneous diesel–electric truck transportation system in open-pit mines.
In this study, the model is developed with reference to the actual operating conditions of large-scale open-pit mines. Considering the large fueling capacity and the high degree of operational standardization of equipment in such mines, several idealized assumptions are made to simplify the real-world conditions:
- (1)
- Gas and charging stations: Gas stations are deployed in a distributed network layout at critical nodes of the road system and are assumed to have unlimited refueling capacity. Charging stations are assumed to be centrally located near shovel operation areas and equipped with sufficient fast-charging facilities to serve electric trucks without queuing delays. Accordingly, charging availability is assumed to be guaranteed during a working shift. This assumption enables the model to concentrate on truck–shovel allocation and scheduling decisions under heterogeneous fleet configurations. In practice, limited charging infrastructure or charging congestion may increase waiting times for electric trucks. Therefore, the results of this study are most applicable to large-scale open-pit mines with adequate charging infrastructure.
- (2)
- Shovels and unloading points access restrictions: Each shovel can load only one truck at a time. Similarly, each unloading point, equipped with a crusher, can unload the ore of only one truck at a time. Trucks arriving simultaneously must queue, and both loading and unloading times are assumed to be constant.
- (3)
- Truck speed: Diesel and electric trucks travel at constant but distinct speeds in loaded and unloaded states, with the loaded speed being lower. The dynamic effects of road conditions, slopes, and other factors on instantaneous speed are not considered.
- (4)
- Fuel and Power Constraints: Refueling time for diesel trucks during transportation on the mine road network is negligible. Electric trucks, however, must recharge at charging stations when predicted remaining power is insufficient to complete subsequent tasks. All electric trucks are assumed to start with fully charged batteries.
- (5)
- Road network and terrain: The mine road network is predefined and fixed, covering topology, road lengths, connectivity, and the locations of all functional nodes. The positions of shovels and unloading points remain unchanged during a work shift.
Based on these assumptions, the truck–shovel allocation mathematical model is established. The definitions of model symbols are provided in Table 1.

Table 1.
Mathematical notation for open-pit mine truck–shovel allocation.
3.2. Multi-Objective Truck–Shovel Allocation Model
3.2.1. Objective Functions
Considering both efficiency and cost in heterogeneous diesel–electric truck fleets for open-pit mining, this study formulates a multi-objective optimization model with two objectives: minimizing total transportation cost and minimizing overall truck waiting time. Formally, the objective function F is defined as follows:
where the objective function f1 represents the total transportation cost of the heterogeneous fleet, consisting of the transportation costs of diesel trucks (fo1) and electric trucks (fe1), as well as their respective maintenance costs during a working shift. The objective function f2 represents the total waiting time of the fleet, which is composed of the waiting time of diesel trucks (fo2) and electric trucks (fe2) within a shift.
The transportation cost objective function of diesel trucks is defined as the sum of the costs of loaded trips from shovels to unloading points, empty trips from unloading points to shovels, and maintenance costs:
where dij denotes the transportation distance from shovel i to unloading point j in the open-pit mine road network. xijo represents the number of loaded trips performed by diesel truck o from shovel i to unloading point j and yijo represents the number of empty trips by diesel truck o from unloading point j to shovel i. Cl and Cnl denote the unit transportation cost per distance for diesel trucks in the loaded and unloaded states, respectively. H denotes the duration of a working shift and denotes the unit maintenance cost per time for diesel trucks.
The total waiting time objective function of a diesel truck can be obtained by subtracting its transportation time, loading time at the shovel, and unloading time at the unloading point from the duration of a working shift:
where sl denotes the transportation speed of truck in the loaded state, snl denotes its transportation speed in the unloaded state, tl represents the average loading time required at a shovel and tu represents the average unloading time required at an unloading point.
The transportation cost objective function of electric trucks is defined as the sum of the energy consumption cost of loaded and empty trips, as well as maintenance cost:
where xije represents the number of loaded trips performed by electric truck e from shovel i to unloading point j and yije represents the number of empty trips by electric truck e from unloading point j to shovel i. and denote the energy consumption of electric trucks when traveling loaded from shovel i to unloading point j, and when traveling unloaded from unloading point j to shovel i, respectively. C1 denotes the unit electricity cost per KWh, and denotes the unit maintenance cost per time for electric trucks.
The energy consumption of electric trucks during transportation is affected by both vehicle-specific factors and external environmental factors. The vehicle-specific factors mainly include truck load and travel speed, while the environmental factors involve road gradient and road class. Due to the influence of road quality, slope conditions, and varying travel speeds on different road types in open-pit mines, the energy consumption of trucks during transportation exhibits dynamic variability. To achieve a more accurate calculation of energy consumption, it is necessary to analyze the forces acting on the truck during transportation. Since the road network in open-pit mines is characterized by large gradients and frequent uphill and downhill segments, the force analysis must consider three scenarios: uphill, downhill, and flat road segments. Force diagrams of trucks operating on different road conditions are shown in Figure 2.
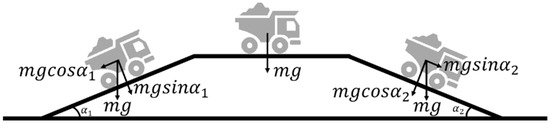
Figure 2.
Force analysis diagram of a truck.
The battery of an electric truck serves as the device for energy storage and supply. In open-pit mine operations, electric trucks are subject to resistances similar to those experienced by diesel trucks, primarily including rolling resistance, gradient resistance, and aerodynamic drag. These resistances constitute the main sources of battery energy consumption for pure electric trucks [21,32,33].
(1) Rolling resistance
When a truck travels on the road, the wheels deform under the vehicle load during rotation. This deformation dissipates part of the energy transmitted from the motor, resulting in rolling resistance. The resistance force is calculated as:
where m denotes the weight of the electric truck, f represents the rolling resistance coefficient, and is the road gradient angle.
(2) Gradient resistance
When a truck travels on a sloped road, its weight can be decomposed into components perpendicular and parallel to the road surface. During uphill driving, the horizontal component of gravity acts in the opposite direction of motion, thereby becoming a resistance force. The calculation formula is as follows:
(3) Aerodynamic drag
During truck operation, aerodynamic drag is the resultant force of frictional resistance and pressure resistance exerted by the air on the truck. The calculation formula is given as:
where CD denotes the aerodynamic drag coefficient, A represents the frontal area, is the air density, and s is the truck travel speed.
To evaluate the energy consumption of electric trucks in open-pit mines, the total resistance acting on the vehicle during transportation is first determined as
Converting the required mechanical energy into the truck’s electrical energy consumption necessitates accounting for both motor efficiency and battery discharge efficiency [23]. Motor efficiency characterizes how effectively the traction motor supplies the required mechanical energy, whereas discharge efficiency measures how effectively stored battery energy is converted into usable electrical energy [34]. Accordingly, neglecting regenerative braking, the electrical energy consumed by a pure electric truck during travel is calculated as:
where denotes the motor efficiency, denotes the battery discharge efficiency, and dij denotes the transportation distance from shovel i to unloading point j.
The objective function of the total waiting time for electric trucks is formulated as follows. Unlike diesel trucks, the charging duration of electric trucks is typically on the order of hours and therefore cannot be neglected. Accordingly, the total waiting time of an electric truck is obtained by subtracting its transportation time, loading time at shovels, unloading time at unloading points, and charging time from the duration of a working shift. The charging time of an electric truck within a shift can be calculated as the ratio of its total energy consumption during the shift to the charging rate.
where Et represents the charging rate of the electric truck, denotes the energy consumption of electric truck e when traveling loaded from shovel i to unloading point j, and denotes the energy consumption when traveling unloaded from unloading point j back to shovel i.
3.2.2. Constraints
In the truck–shovel allocation model for open-pit mines, multiple practical operating factors must be considered, including production demand, equipment characteristics, and process continuity. With the introduction of electric trucks, the model is subject to additional constraints. It must not only satisfy the throughput requirements at unloading points and the production capacity limits of shovels, but also incorporate energy consumption constraints related to battery capacity. Satisfying these constraints is essential to ensure feasible scheduling and allocation solutions in the optimization framework.
- (1)
- Unloading point throughput constraints
Constraint (13) restricts the total amount of material received at each unloading point from exceeding its maximum handling capacity, thereby preventing resource overload. Constraint (14) ensures that the total material received at each unloading point within a working shift is not lower than its expected throughput, thus guaranteeing the smooth implementation of the production plan.
- (2)
- Shovel capacity constraints
Constraint (15) limits the total loading volume of each shovel within a working shift to not exceed its theoretical maximum capacity, thus avoiding equipment overload. Constraint (16) requires that the output of each shovel during a shift reaches its expected production level, thus ensuring production continuity and efficiency.
- (3)
- Shovel and unloading point operation time constraints
Constraints (17) and (18) restrict the operating time of shovels and unloading points within a working shift, ensuring that neither exceeds the predefined shift duration H.
- (4)
- Maximum working time constraints for diesel and electric trucks
Constraint (19) ensures that the total operating time of each diesel truck within a working shift does not exceed the prescribed duration H, including the cumulative loading, transportation, and unloading times. Constraint (20) imposes the same time limitation on electric trucks.
- (5)
- Flow continuity constraints
Constraints (21) and (22) maintain the balance of the open-pit mine transportation system by restricting the flow consistency of truck trips within the transportation network. Specifically, Constraint (21) requires that, for each truck within a working shift, the total number of trips departing from a shovel and arriving at a particular unloading point must equal the total number of trips departing from that unloading point and heading toward any shovel. Constraint (22) ensures that the total trips departing from unloading points and arriving at each shovel equal the trips departing from that shovel and heading toward unloading points.
- (6)
- Battery capacity constraint for electric trucks
Constraint (23) limits the number of transportation tasks that an electric truck can complete within a single charging cycle. Specifically, after subtracting the total energy consumed by all round-trip transportation tasks within one charging cycle from the truck’s maximum battery capacity, the remaining energy must not fall below the safety threshold.
- (7)
- Variable constraints
Constraint (24) specifies that all decision variables representing transportation trips are restricted to non-negative integers.
4. Algorithm
The multi-objective heterogeneous truck–shovel allocation model developed in this study simultaneously addresses two interdependent objectives, transportation cost and truck waiting time, while incorporating multiple operational constraints arising in open-pit mining. The resulting problem is characterized by a high-dimensional decision space and strong coupling among constraints, making exact optimization methods impractical for large-scale instances due to excessive computational complexity and poor scalability. Metaheuristic algorithms with global search capability therefore provide a more suitable solution framework [35].
The MOPSO algorithm, an extension of PSO, has been widely applied in scheduling and resource allocation problems due to its high efficiency, simple implementation, and adaptability to complex scenarios. By simulating swarm intelligence and using Pareto dominance with external archiving, MOPSO maintains diverse non-dominated solutions and provides a robust framework for complex scheduling optimization [36,37,38].
Based on these advantages, this study develops a tailored MOPSO algorithm to solve the proposed heterogeneous truck–shovel allocation problem. The overall solution framework, including particle representation, constraint-aware initialization, multi-objective evaluation, and archive management, is illustrated in Figure 3.
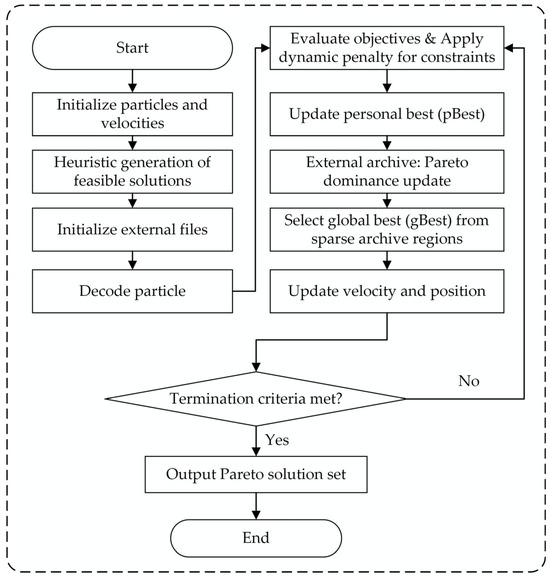
Figure 3.
Flowchart of the MOPSO algorithm for solving the truck–shovel allocation model.
4.1. Particle Encoding and Initialization
In the proposed MOPSO framework, each particle represents a complete truck–shovel allocation and scheduling scheme for a single production shift. The particle position vector encodes the number of trips assigned to each truck on specific routes, including loaded trips from shovel i to unloading point j and empty return trips from unloading point j to shovel i.
Given the high dimensionality of the decision space and the presence of multiple operational constraints, a heuristic-based initialization strategy is adopted instead of purely random initialization. The objective of this strategy is to generate an initial population that satisfies key production and operational constraints as much as possible, thereby improving feasibility and accelerating convergence.
During initialization, trips are assigned sequentially to individual trucks. For each shovel and unloading point, the available production capacity and throughput are continuously tracked. A candidate trip is accepted only if the corresponding shovel production and unloading capacity constraints are not violated. In this way, the total tonnage assigned to each shovel and unloading point remains within its allowable range throughout the initialization process.
Truck working-time constraints are enforced at the individual vehicle level. For each truck, the remaining available working time within the shift is updated after each assigned trip. A new trip is allocated only if the sum of travel time, loading time, unloading time, and associated auxiliary time does not exceed the remaining shift duration. This mechanism prevents infeasible schedules in which a truck is assigned more tasks than can be completed within a single shift.
For electric trucks, charging time is explicitly incorporated into the working-time feasibility check. The charging time required for assigned trips is estimated based on the cumulative electricity consumption and the charging rate of the vehicle, and it is treated as part of the total working time. This ensures that electric trucks remain schedulable under the same shift-length constraint as diesel trucks.
By jointly considering shovel production limits, unloading throughput constraints, truck working-time restrictions, and charging-time requirements during initialization, the proposed heuristic significantly reduces the number of infeasible particles in the initial population. This constraint-aware initialization provides a high-quality starting point for the subsequent multi-objective particle swarm optimization process and enhances both convergence stability and solution quality.
4.2. Multi-Objective PSO with Adaptive Penalty Mechanism
Each particle is decoded into a detailed operational plan and evaluated using two conflicting objective functions: total transportation cost and total truck waiting time. Transportation cost includes fuel or electricity consumption and vehicle maintenance cost, while waiting time reflects system inefficiency and resource underutilization.
Due to the presence of multiple operational constraints, an adaptive penalty mechanism is introduced to guide the swarm toward feasible and high-quality solutions. All constraint violations are aggregated into a unified violation measure V(x), representing the total degree of infeasibility of a particle. The penalized objective functions are defined as:
where fk(x) denotes the original objective values and is an iteration-dependent penalty coefficient. The penalty coefficient increases linearly over iterations:
where t is the current iteration number and T is the maximum number of iterations, and denote the minimum and maximum penalty coefficients, respectively. A smaller penalty coefficient in the early iterations allows the swarm to explore a wider solution space, including mildly infeasible regions, whereas a larger penalty coefficient in later iterations gradually strengthens constraint enforcement and guides the search toward feasible and high-quality solutions. This adaptive strategy enables broad exploration in the early search stage and progressively enforces feasibility as the optimization proceeds.
Particle velocity and position are updated according to the standard PSO mechanism. The velocity update rule is given by:
and the position update is expressed as:
where is the inertia weight, a1 and a2 are acceleration coefficients, r1 and r2 are random vectors, denotes the personal best position of particle i, and gt is a global guide selected from the Pareto archive. Since the decision variables represent discrete truck trip numbers, updated positions are rounded to the nearest integer and bounded within predefined limits to ensure feasibility.
4.3. Pareto Archive Management and Termination
An external archive is maintained to store non-dominated solutions based on Pareto dominance relations. Only constraint-satisfying solutions are admitted into the archive, ensuring that the resulting Pareto front consists of operationally implementable schedules. When the archive becomes crowded, a crowding-distance strategy is applied to preserve solution diversity by removing densely populated solutions. Global guide particles are preferentially selected from sparsely populated regions of the archive to enhance exploration and prevent premature convergence.
The algorithm terminates when the maximum number of iterations is reached. The final external archive provides an approximation of the Pareto front, offering decision-makers multiple alternative truck–shovel allocation strategies that reflect different trade-offs between transportation cost and truck waiting time under practical operational constraints.
5. Case Study
5.1. Data Preparation
The production system consists of 10 shovels serving as loading points and 8 unloading points. All key parameters of the production system are summarized in Table 2. To accurately characterize the spatial relationships among facilities within the mine, two parameter matrices are defined: a distance matrix and an elevation matrix, as shown in Table 3 and Table 4. The distance matrix quantifies the actual transportation distances between each shovel and unloading point, which serve as the basis for calculating diesel truck transportation time and cost. The elevation matrix records the relative elevation differences between shovels and unloading points, which are used to estimate the energy consumption of electric trucks when operating between facilities. The entire system is scheduled and optimized over an 8-h working shift.
Table 2.
Parameter table.
Table 3.
Distance matrix between shovels and unloading points (km).
Table 4.
Elevation difference matrix between shovels and unloading points (m).
For diesel trucks, the parameters are defined as follows: The load capacity is 35 tons. In terms of transportation cost, the unit cost is 13.2 USD per kilometer when loaded and 6 USD per kilometer when unloaded [39]. Regarding operating speed, the average speed is 30 km/h when loaded and 35 km/h when unloaded. In addition, diesel trucks incur maintenance costs during operation, with a unit maintenance cost of 13.7 USD per hour.
For electric trucks, the parameters are defined as follows: The load capacity is 30 tons. The unit maintenance cost is relatively low, at 8.2 USD per hour. Key parameters of the power system include a battery capacity of 330 kWh, with a minimum safety threshold of 60 kWh that must be maintained during operation [24,26,40]. The charging rate is 600 kW, and the electricity price is set at 0.1 USD per kWh [41]. Regarding operating speed, the average speed is 25 km/h when loaded and 30 km/h when unloaded. To calculate energy consumption more accurately, the model incorporates additional physical parameters: motor efficiency of 1.25, battery discharge efficiency of 1.1, aerodynamic drag coefficient of 0.85, rolling resistance coefficient of 0.03, air density of 1.225 kg/m3, and a frontal area of 12 m2 for the electric truck.
In the production process, the capacity and time constraints of each facility are defined as follows: Each shovel has an expected production of 1500 tons per shift, with a maximum capacity limit of 2500 tons. Correspondingly, each unloading point has an expected handling volume of 1875 tons per shift, with a maximum handling capacity of 3125 tons. The operation time of trucks at facilities is fixed, specifically: the average loading time at a shovel is 0.083 h (5 min), and the average unloading time at an unloading point is 0.05 h (3 min). Additionally, the genetic algorithm parameters are configured as shown in Table 5.
Table 5.
MOPSO algorithm Parameter table.
5.2. Results and Discussion
5.2.1. Performance Evaluation of Proposed Solutions
In this section, we present a comparative performance evaluation of the proposed MOPSO algorithm with other well-known benchmark algorithms, including NSGA-II and SPEA2. This comparison is based on four key performance metrics:
- (1)
- Hypervolume (HV): HV measures the volume dominated by the Pareto front relative to the ideal point, with a higher value indicating better coverage of the objective space.
- (2)
- Processing Time (PT): PT refers to the computational time taken by the algorithm, where a lower value indicates better efficiency.
- (3)
- Cardinality of the Pareto Front (CPF): CPF is the number of Pareto-optimal solutions, with a higher value indicating a larger and more diverse set of solutions.
- (4)
- Average Crowd Distance (ACD): ACD measures the spread of solutions along the Pareto front, with a higher value indicating better distribution and diversity.
The results of optimization experiments completed using the MOPSO in comparison with other evolutionary algorithms are presented in Table 6. These experiments were conducted under the assumption of a pure fuel truck scenario to evaluate the performance of the MOPSO algorithm and its advantages in a traditional mining operation setting.
Table 6.
Evaluation of performance metrics of algorithm.
Table 6 indicates that the MOPSO algorithm outperforms NSGA-II and SPEA2 in terms of HV and PT, achieving the highest HV score of 45,529.26 and a competitive PT of 138.86 s. This suggests that MOPSO provides better overall coverage of the Pareto front and faster computational performance compared to the other two algorithms. In terms of CPF, MOPSO also demonstrates superior performance, with 45 Pareto-optimal solutions, while NSGA-II and SPEA2 show lower values of 24 and 42, respectively. Furthermore, MOPSO achieves a higher ACD value of 50.6053, indicating its ability to maintain a good distribution of solutions along the Pareto front, which is important for multi-objective optimization tasks.
This comparative analysis demonstrates the effectiveness of the proposed MOPSO algorithm in solving the given optimization problem, particularly in balancing the trade-off between solution quality and computational time. The results suggest that MOPSO could be a promising alternative for multi-objective optimization problems, outperforming other evolutionary algorithms in certain key aspects.
5.2.2. Benchmark Analysis of Homogeneous Fleet Configurations: Performance Comparison of Pure Diesel and Pure Electric Truck Fleets
To comprehensively evaluate the scheduling performance of the proposed multi-objective truck–shovel allocation model under different transportation systems, two homogeneous fleet configurations are used as benchmark schemes: a diesel truck fleet comprising 38 trucks and an electric truck fleet comprising 62 trucks. The MOPSO algorithm is employed to derive the Pareto optimal solution sets for both schemes, which illustrate the trade-off between transportation cost and total waiting time. The resulting Pareto fronts are presented in Figure 4.
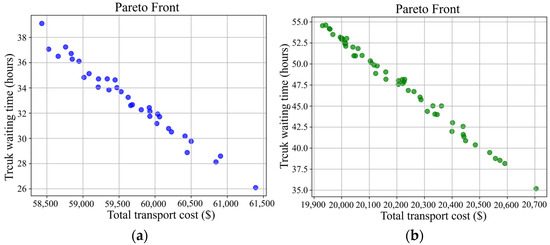
Figure 4.
Pareto fronts of pure diesel truck fleet and pure electric truck fleet. (a) Pareto front of pure diesel truck fleet; (b) Pareto front of pure electric truck fleet.
Figure 4a shows that, under the diesel truck fleet, the total transportation cost of Pareto solutions ranges from 58,429.60 to 61,391.88 USD, while the corresponding total truck waiting time gradually decreases from 39.10 to 26.09 h. Figure 4b presents the Pareto front of the electric truck fleet, where transportation costs are concentrated between 19,930.72 and 20,704.65 USD, and truck waiting times range from 54.56 to 35.19 h. Compared with diesel trucks, the electric truck scheme demonstrates clear advantages in terms of unit transportation cost and energy consumption for operations and maintenance, but generally results in longer waiting times. The Pareto front shows a monotonically decreasing trend: as total waiting time decreases, truck queuing at shovels and unloading points is significantly reduced, thus improving transportation efficiency at the shift level. However, this also leads to an increase in transportation frequency and mileage, which in turn drives up transportation costs.
To provide deeper insights into the characteristics of different solutions, three representative solutions are selected from the Pareto front for detailed analysis: the minimum transportation cost solution (Solution A), the minimum waiting time solution (Solution B), and the balanced solution (Solution C). The detailed comparison of their performance indicators is presented in Table 7. The balanced solution is selected from the Pareto front using an ideal-point-based compromise criterion. Specifically, only feasible Pareto-optimal solutions are considered, and after min-max normalization of both objectives, the solution with the minimum Euclidean distance to the ideal point is identified as the balanced solution, representing a balanced trade-off between transportation cost and waiting time.
Table 7.
Comparison of the objective functions of the different programs for diesel trucks and electric trucks.
By further examining Table 7, the performance of scheduling solutions under different objectives can be compared more intuitively. In the diesel truck scheme, the minimum transportation cost solution (A) achieves a cost of 58,429.60 USD, but with a relatively high waiting time of 39.10 h. The minimum waiting time solution (B) reduces waiting time to 26.09 h, though the cost increases to 61,391.88 USD. The balanced solution (C) provides a compromise between the two objectives, with a cost of 59,661.00 USD and a waiting time of 32.60 h. Similarly, in the electric truck scheme, the minimum transportation cost solution (A) yields the lowest cost of 19,930.72 USD, but at the expense of a long waiting time of 54.56 h. The minimum waiting time solution (B) reduces waiting time to 35.19 h, while the cost rises to 20,704.65 USD. The balanced solution (C) strikes a middle ground, with a cost of 20,310.25 USD and a waiting time of 44.37 h.
In summary, the diesel truck fleet offers clear advantages in transportation efficiency and operational continuity, although its significantly higher costs constrain economic performance. The electric truck fleet, although constrained by charging requirements and range limitations, achieves lower operating costs and delivers environmental benefits. These contrasting outcomes indicate that neither homogeneous fleet type can simultaneously satisfy both efficiency and cost objectives. This reinforces the necessity of adopting heterogeneous diesel–electric fleet configurations to realize a more balanced and synergistic scheduling strategy.
5.2.3. Comparative Performance Analysis of Heterogeneous and Homogeneous Diesel–Electric Fleets
To systematically evaluate the overall performance of heterogeneous fleets relative to homogeneous fleets, this study constructs and solves five different configurations of diesel–electric heterogeneous fleets. A quantitative performance analysis is then conducted by comparing the balanced solutions of these configurations with the two homogeneous benchmark schemes: diesel and electric fleets. The performance indicators of all schemes are presented in Table 8.
Table 8.
Comparison of balanced solutions for different fleet configurations.
As shown in Table 8, schemes with a higher proportion of diesel trucks (32D + 11E, 30D + 15E) maintain waiting times close to that of the pure diesel fleet (33.21 h and 34.50 h, respectively) while reducing transportation costs to 53,012.48 USD and 49,832.52 USD, representing a decrease of about 11–16%. In contrast, schemes with a higher proportion of electric trucks (18D + 38E, 15D + 45E) achieve more significant cost advantages, with costs reduced to 37,482.33 USD and 33,954.39 USD, corresponding to reductions of 37–43%. However, their waiting times rise to 37.32 h and 39.46 h, approaching the level of the pure electric fleet. The medium-ratio scheme (25D + 25E) achieves a balance between the two objectives, with a cost of 44,344.56 USD and a waiting time of 35.12 h, exhibiting superior compromise characteristics.
In summary, the comparative analysis of different fleet configurations highlights the trade-offs between cost and efficiency in heterogeneous diesel–electric systems. Schemes with a higher share of diesel trucks maintain low waiting times comparable to a pure diesel fleet but achieve only modest cost reductions. Conversely, schemes dominated by electric trucks significantly reduce transportation costs, though at the expense of longer waiting times. The medium-ratio configuration provides a balanced solution, effectively combining cost savings with operational continuity. These findings demonstrate that heterogeneous fleets not only integrate the complementary strengths of diesel and electric trucks but also allow dynamic adjustment of fleet composition in response to varying operational priorities and external conditions. By alleviating the limitations of single-type fleets, heterogeneous configurations offer a more adaptive and resilient scheduling strategy for open-pit mining operations.
5.2.4. Truck–Shovel Allocation Patterns of Heterogeneous Diesel–Electric Fleets
This section provides an in-depth analysis of the truck–shovel allocation pattern under the balanced configuration of 25 diesel trucks and 25 electric trucks. This aims to demonstrate how the optimization algorithm enables complementary collaboration between diesel and electric trucks, thus balancing transportation cost and truck waiting time. Based on the MOPSO solution results, representative routes are extracted from the allocation outcomes. The underlying mechanisms of the allocation pattern, with consideration of distance factors, are summarized in Table 9.
Table 9.
Task of representative truck–shovel allocation.
As shown in Table 9, short-haul routes such as D→a and D→f, each less than 1 km, are fully undertaken by electric trucks. These routes are short in distance and low in energy consumption, enabling electric trucks to make frequent round trips without range concerns, thereby maximizing their advantage of low operating costs. Similarly, on medium-to-short routes such as E→a and F→a, electric trucks dominate while diesel trucks play a supplementary role, with electric trucks accounting for more than 50% of trips, indicating their strong adaptability in medium-to-short-haul tasks. In contrast, certain medium-distance routes, such as H→g (3.406 km), exhibit a balanced allocation between diesel and electric trucks (50% each), reflecting the ability of the system to coordinate both vehicle types through flexible scheduling when energy consumption pressure and operational demand coexist. On long-haul routes such as G→c (7.093 km) and F→c (7.017 km), however, all transportation tasks are performed exclusively by diesel trucks, with electric trucks making no trips. This result underscores the central role of diesel trucks in long-distance transportation: they can complete multiple round trips without recharging, thereby avoiding additional waiting times and maintaining continuity and reliability on cross-regional routes with high timeliness requirements.
Figure 5 illustrates the truck–shovel allocation patterns across different routes. It highlights the division of tasks between diesel and electric trucks at varying transportation distances: electric trucks dominate short-haul segments, diesel trucks almost exclusively undertake long-haul routes, and on certain medium-distance routes, both vehicle types share the workload in nearly equal proportions.
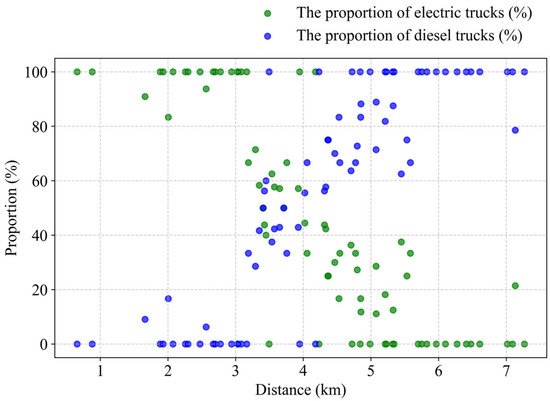
Figure 5.
The proportion of electric and diesel trucks assigned to routes of varying distances.
Overall, electric trucks establish low-cost and high-frequency transportation channels on short- and medium-haul routes, fully exploiting their advantages in low energy consumption and operational efficiency. Diesel trucks, on the other hand, maintain continuity and stability on long-distance routes, avoiding delays caused by recharging interruptions. The complementary division of labor between the two vehicle types not only optimizes resource utilization at the route level but also enables the heterogeneous fleet to achieve a dynamic balance between transportation cost and operational efficiency at the system level, thereby offering a sustainable optimization pathway for mine operations.
5.2.5. Sensitivity Analysis
To assess the robustness of the proposed heterogeneous truck–shovel allocation model, sensitivity analyses are conducted on two key external factors. First, fluctuations in fuel and electricity prices directly affect the relative competitiveness of diesel and electric trucks, reshaping fleet composition and scheduling outcomes. Second, advancements in charging technology, particularly faster charging rates, can reduce the long waiting times of electric trucks and improve their operational viability.
- (1)
- Impact of Diesel and Electricity Price Increases
Energy price fluctuations exert a significant influence on the balance between transportation cost and waiting time in heterogeneous diesel–electric fleets. Figure 6, Figure 7 and Figure 8 present the impacts of diesel price increases, electricity price increases, and simultaneous diesel–electricity price increases, respectively, under different fleet configurations.
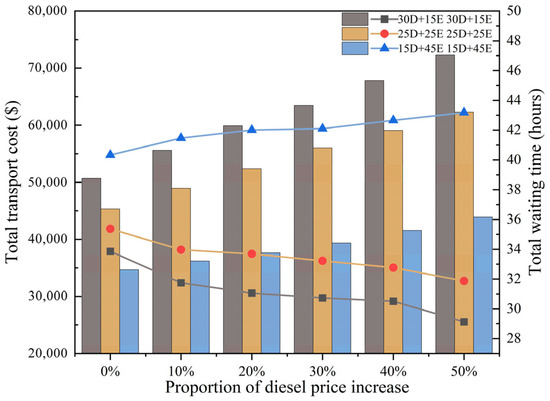
Figure 6.
Impact of fuel price increases on transportation cost and waiting time.
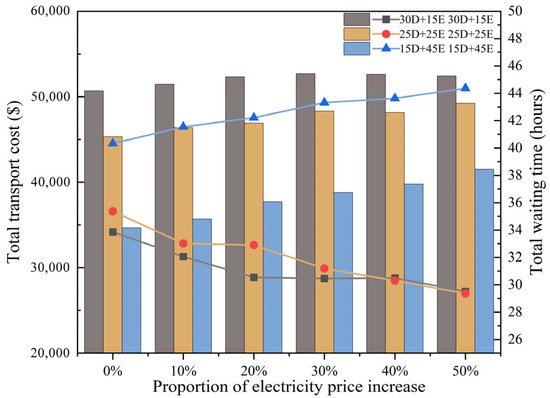
Figure 7.
Impact of electricity price increases on transportation cost and waiting time.
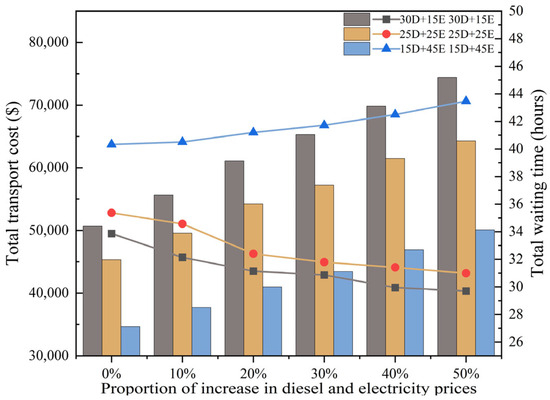
Figure 8.
Impact of simultaneous fuel and electricity price increases on transportation cost and waiting time.
The impact of diesel price increases is shown in Figure 6. For the diesel-dominant configuration (30D + 15E), transportation cost rises sharply with higher fuel prices, since most of the hauling tasks are performed by diesel trucks and fuel expenditures dominate operating costs. The balanced configuration (25D + 25E) exhibits a more moderate increase in transportation cost, reflecting the buffering effect of electric trucks on short- and medium-haul routes. In contrast, the electric-dominant configuration (15D + 45E) shows the lowest sensitivity to diesel price fluctuations, as the larger proportion of electric trucks significantly reduces dependence on fuel costs. In terms of waiting time, diesel-heavy fleets consistently maintain the lowest levels, while electric-heavy fleets incur the longest delays due to charging requirements. The balanced configuration remains between the two extremes, offering a compromise between cost escalation and efficiency loss.
The impact of electricity price increases is shown in Figure 7. As electricity prices rise, the cost competitiveness of electric trucks diminishes, leading to an upward trend in total transportation cost. The diesel-dominant configuration experiences the smallest relative cost increase, while the electric-dominant configuration faces the largest increase due to its heavy reliance on electricity. Waiting times show the opposite pattern: fleets with more electric trucks consistently exhibit higher waiting times, and this difference becomes more pronounced as the electricity price increases.
The impact of simultaneous diesel and electricity price increases is shown in Figure 8. When both energy sources become more expensive, the total transportation cost rises substantially across all fleet configurations. The balanced configuration demonstrates a moderate trajectory, while diesel-heavy and electric-heavy fleets suffer from their respective disadvantages—high fuel expenditures in the former and charging constraints in the latter. Waiting times remain lowest for diesel-heavy fleets, highest for electric-heavy fleets, and intermediate for the balanced configuration. This outcome underscores that no single fleet composition dominates under joint energy price shocks, and operators must weigh the trade-off between economic costs and scheduling efficiency.
Overall, the sensitivity analysis demonstrates that variations in fuel and electricity prices exert a significant influence on fleet scheduling outcomes. Diesel-intensive configurations remain relatively robust under electricity price increases but are highly exposed to fuel price shocks. Electric-intensive configurations, in contrast, perform well under rising fuel prices but incur substantial delays when electricity costs increase. The balanced fleet composition consistently delivers intermediate outcomes, mitigating the extremes of both cost escalation and efficiency deterioration. These findings underscore the importance of flexible fleet management strategies that can adapt to volatile energy markets, thereby ensuring both economic viability and operational stability in open-pit mining operations.
- (2)
- Impact of Charging speed variation
The impact of charging rate variations on transportation cost and waiting time is shown in Figure 9. When the charging rate decreases, electric trucks require more time to replenish their batteries, which reduces their availability for hauling tasks. As a result, a larger proportion of tasks is assigned to diesel trucks, leading to lower waiting times but higher overall transportation costs. This outcome highlights the strong dependence of fleet scheduling performance on charging efficiency.
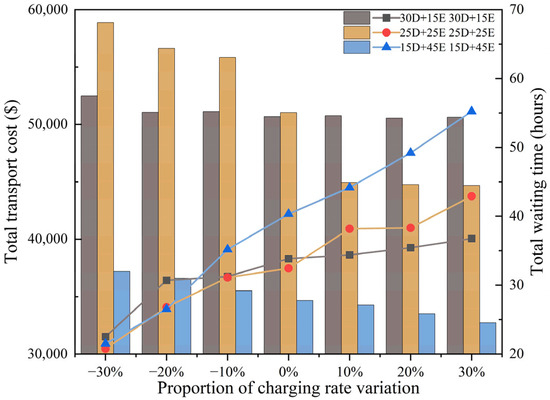
Figure 9.
Impact of charging rate variation on transportation cost and waiting time.
Conversely, when the charging rate increases, electric trucks can be recharged more quickly, significantly improving their utilization. The optimization model responds by allocating a greater share of tasks to electric trucks, particularly on short- and medium-haul routes, where their cost advantage is most evident. This shift effectively reduces transportation costs but results in an increase in overall waiting times. The rise in waiting times is attributed to the reduced workload of diesel trucks, which become underutilized, thereby inflating idle time within the fleet.
These findings suggest that while faster charging improves the economic competitiveness of electric trucks, it also creates imbalances in fleet utilization. To fully exploit the benefits of charging technology improvements, operators should consider timely adjustments to the number of diesel trucks deployed. By reducing excess idle capacity, the system can achieve a more efficient allocation of resources, thereby stabilizing waiting times while sustaining the cost advantages of electrification.
- (3)
- Impact of Algorithmic Parameters
To further evaluate the robustness and stability of the proposed MOPSO algorithm, a series of sensitivity analyses were conducted on four key parameters: swarm size, inertia weight, cognitive factor, and social factor (Figure 10, Figure 11, Figure 12 and Figure 13). Each parameter was varied within a reasonable range, while the others were kept constant at their baseline values. The variations in total transportation cost, total waiting time, and computation time were analyzed to reveal their influence on the optimization performance.
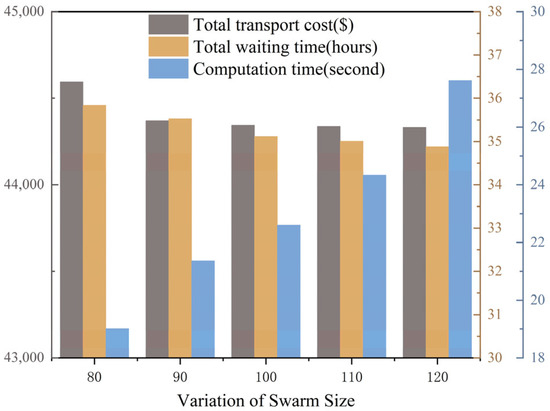
Figure 10.
Impact of swarm size variation.
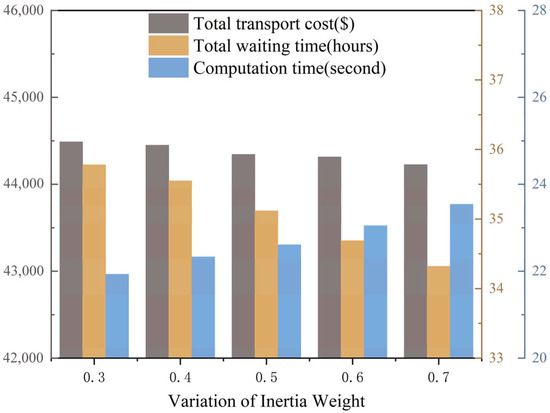
Figure 11.
Impact of inertia weight variation.
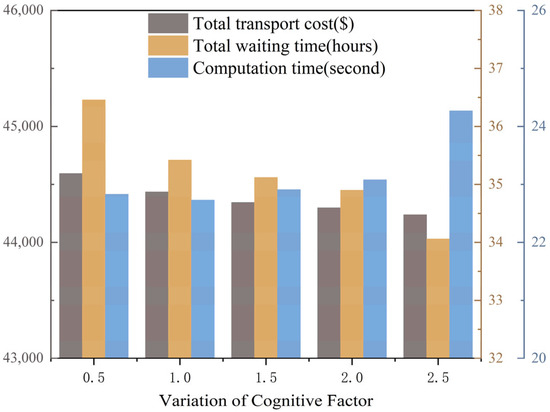
Figure 12.
Impact of cognitive factor variation.
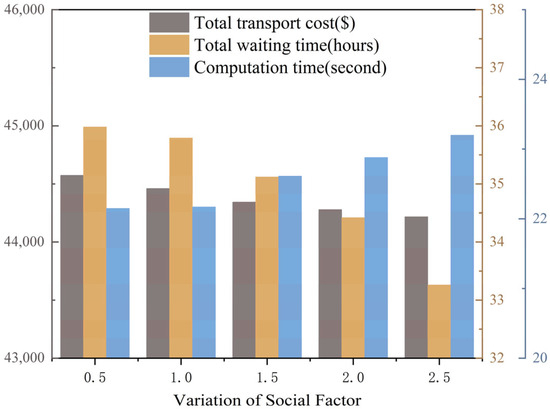
Figure 13.
Impact of social factor variation.
As shown in Figure 10, increasing the swarm size from 80 to 120 slightly improves the solution quality, with transportation cost and waiting time fluctuating within ±1%, while computation time increases almost linearly due to the higher number of particles. Hence, a moderate swarm size of 100–110 offers a good balance between convergence accuracy and efficiency. Figure 11 illustrates that the inertia weight mainly affects the exploration-exploitation balance: larger values enhance global search ability but slow down convergence, leading to marginal increases in both cost and computation time. The best stability is achieved around w = 0.5.
Figure 12 and Figure 13 show the effects of the cognitive factor and social factor, respectively. Raising the cognitive factor strengthens individual learning, slightly reducing waiting time (up to 3%) but increasing computation time because of extended local exploration. Conversely, increasing the social factor accelerates convergence by emphasizing global learning, but overly large values may cause premature convergence and minor fluctuations in cost.
Overall, the variations in all parameters produce less than 3% deviation in the two objective values, confirming that the proposed MOPSO algorithm maintains strong robustness and stability under parameter perturbations.
6. Conclusions
This study addresses the scheduling optimization of heterogeneous diesel–electric truck fleets in open-pit mines by developing a multi-objective truck–shovel allocation model that simultaneously considers transportation cost and waiting time. An enhanced MOPSO algorithm, tailored to the characteristics of heterogeneous fleets, is designed to solve the model. The model incorporates the distinctive features of diesel and electric trucks, including load capacity, range limitations, and operating time, while also accounting for practical operational constraints such as shovel loading capacity, unloading throughput, and charging requirements, thereby ensuring consistency with real production conditions.
To validate the effectiveness of the solution method, the performance of the proposed MOPSO was benchmarked against other well-established algorithms, namely NSGA-II and SPEA2. The comparative results confirmed its superiority, as it excelled in generating a higher-quality and more diverse set of solutions—evidenced by a larger HV, a greater number of CPFs, and a better ACD, while also exhibiting remarkable efficiency with significantly less PT. Leveraging this validated and efficient algorithm, the case study demonstrated significant performance differences across fleet configurations. The diesel fleet achieves shorter waiting times but suffers from high transportation costs, while the electric fleet reduces costs by nearly 60% but incurs substantially longer delays. In contrast, heterogeneous fleets achieve a superior balance between these two objectives. In particular, the balanced configuration of 25 diesel and 25 electric trucks reduced transportation cost by approximately 26.1% relative to the pure diesel fleet while lowering waiting time by 19.2% compared with a pure electric fleet.
Further examination of task allocation reveals clear complementarities between diesel and electric trucks. Short-haul routes (less than 1 km) are almost exclusively served by electric trucks, taking advantage of their low operating costs and minimal charging needs. Long-haul routes (greater than 7 km) are primarily assigned to diesel trucks, which avoid delays from recharging. Medium-distance routes (1–4 km) follow a mixed allocation pattern, depending on energy consumption and operational urgency. This distance-based division of labor enhances fleet utilization and improves overall system stability.
In addition, sensitivity analyses reveal the robustness of both the proposed model and algorithm. Fluctuations in fuel and electricity prices significantly reshape the cost–efficiency trade-off: diesel-intensive fleets remain more resilient to electricity price increases but are highly sensitive to fuel price shocks, whereas electric-intensive fleets show the opposite pattern. Balanced configurations consistently achieve moderate outcomes, avoiding extreme cost surges or long delays. Improvements in charging rates enhance the competitiveness of electric trucks and reduce total costs but also increase diesel idle time, leading to longer overall waiting times. Analyses of algorithmic parameters—including swarm size, inertia weight, cognitive factor, and social factor—further confirm the stability of the optimization results, indicating that the proposed MOPSO maintains reliable convergence and robust performance under parameter variations. These results suggest that fleet composition should be dynamically adjusted to fully capture the benefits of electrification as charging technology advances.
Overall, the proposed model and algorithm effectively exploit the complementary strengths of diesel and electric trucks, enabling a dynamic balance between cost efficiency and operational continuity. By incorporating sensitivity analyses, this study demonstrates the adaptability of heterogeneous fleets to external uncertainties such as volatile energy prices and charging technology advances. The findings provide practical guidance for mine operators in configuring fleet composition and developing adaptive scheduling strategies.
Future research could further incorporate carbon-related factors into the optimization framework, such as carbon emission modeling, carbon pricing, and taxation mechanisms, to evaluate the environmental and economic trade-offs of heterogeneous fleet operations under emerging carbon regulation policies [42]. Moreover, integrating real-time dispatching, battery degradation, and renewable energy-based charging infrastructure could enhance the applicability and sustainability of heterogeneous fleet scheduling in open-pit mining, contributing to the advancement of intelligent and sustainable mining operations.
Author Contributions
Conceptualization, G.C., X.M. and Y.S.; methodology, G.C., X.M. and Y.S.; software, Y.S., G.C. and H.L.; validation, Y.S., H.L. and G.C.; investigation, X.L.; resources, Y.S.; data curation, X.L.; writing—original draft preparation, Y.S.; writing—review and editing, Y.S., X.M. and H.L.; visualization, Y.S. and H.L.; project administration, Y.S. All authors have read and agreed to the published version of the manuscript.
Funding
This research was funded by the National Natural Science Foundation of China, grant number No. 52472318 and the Independently Initiated Scientific and Technological Project of the Central Research Institute of State Power Investment Corporation, grant number No. 042500127554.
Institutional Review Board Statement
Not applicable.
Informed Consent Statement
Not applicable.
Data Availability Statement
The data can be obtained from the corresponding author upon request. The data are not publicly available due to privacy constraints.
Conflicts of Interest
Author Gang Chen is employed by the company State Power Investment Corporation Research Institute. All authors declare that the research was conducted in the absence of any commercial or financial relationships that could be construed as potential conflicts of interest.
References
- Wang, Q.; Zhang, R.; Lv, S.; Wang, Y. Open-pit mine truck fuel consumption pattern and application based on multi-dimensional features and XGBoost. Sustain. Energy Technol. Assess. 2021, 43, 100977. [Google Scholar] [CrossRef]
- Mohtasham, M.; Mirzaei-Nasirabad, H.; Askari-Nasab, H.; Alizadeh, B. Multi-stage optimization framework for the real-time truck decision problem in open-pit mines: A case study on Sungun copper mine. Int. J. Min. Reclam. Environ. 2022, 36, 461–491. [Google Scholar] [CrossRef]
- Moradi Afrapoli, A.; Askari-Nasab, H. Mining fleet management systems: A review of models and algorithms. Int. J. Min. Reclam. Environ. 2019, 33, 42–60. [Google Scholar] [CrossRef]
- Tokac, B.; Zhang, Q.; Sari, Y.A. Environmental and economic comparison of diesel and electric trucks in open-pit mining operations. J. Clean. Prod. 2025, 507, 145540. [Google Scholar] [CrossRef]
- Xu, C.; Chen, G.; Lu, H.; Zhang, Q.; Liu, Z.; Bian, J. Integrated Optimization of Production Scheduling and Haulage Route Planning in Open-Pit Mines. Mathematics 2024, 12, 2070. [Google Scholar] [CrossRef]
- Ertugrul, N.; Kani, A.P.; Davies, M.; Sbarbaro, D.; Moran, L. Status of mine electrification and future potentials. In Proceedings of the International Conference on Smart Grid and Energy Systems (SGES), Perth, Australia, 23–26 November 2020; IEEE: New York, NY, USA, 2020; pp. 151–156. [Google Scholar]
- Paraszczak, J.; Svedlund, E.; Fytas, K.; Laflamme, M. Electrification of loaders and trucks—A step towards more sustainable underground mining. Renew. Energy Power Qual. J. 2024, 12, 81–86. [Google Scholar] [CrossRef]
- Wang, Q.; Gu, Q.; Li, X.; Xiong, N. Comprehensive overview: Fleet management drives green and climate-smart open pit mine. Renew. Sustain. Energy Rev. 2024, 189, 113942. [Google Scholar] [CrossRef]
- Liu, B.; Ma, Z.; Kong, H.; Ma, X. How incentives affect commuter willingness for public transport: Analysis of travel mode shift across various cities. Travel Behav. Soc. 2025, 39, 100966. [Google Scholar] [CrossRef]
- Ercelebi, S.G.; Bascetin, A. Optimization of shovel-truck system for surface mining. J. South Afr. Inst. Min. Metall. 2009, 109, 433–439. [Google Scholar]
- Ta, C.H.; Ingolfsson, A.; Doucette, J. A linear model for surface mining haul truck allocation incorporating shovel idle probabilities. Eur. J. Oper. Res. 2013, 231, 770–778. [Google Scholar] [CrossRef]
- Zhang, L.; Xia, X. An integer programming approach for truck-shovel dispatching problem in open-pit mines. Energy Procedia 2015, 75, 1779–1784. [Google Scholar] [CrossRef]
- Bajany, D.M.; Xia, X.; Zhang, L. A MILP model for truck-shovel scheduling to minimize fuel consumption. Energy Procedia 2017, 105, 2739–2745. [Google Scholar] [CrossRef]
- Mena, R.; Zio, E.; Kristjanpoller, F.; Arata, A. Availability-based simulation and optimization modeling framework for open-pit mine truck allocation under dynamic constraints. Int. J. Min. Sci. Technol. 2013, 23, 113–119. [Google Scholar] [CrossRef]
- Dindarloo, S.; Osanloo, M.; Frimpong, S. A stochastic simulation framework for truck and shovel selection and sizing in open-pit mines. J. S. Afr. Inst. Min. Metall. 2015, 115, 209–219. [Google Scholar] [CrossRef]
- Bakhtavar, E.; Mahmoudi, H. Development of a scenario-based robust model for the optimal truck-shovel allocation in open-pit mining. Comput. Oper. Res. 2020, 115, 104539. [Google Scholar] [CrossRef]
- Mohtasham, M.; Mirzaei-Nasirabad, H.; Alizadeh, B. Optimization of truck-shovel allocation in open-pit mines under uncertainty: A chance-constrained goal programming approach. Min. Technol. 2021, 130, 81–100. [Google Scholar] [CrossRef]
- Matamoros, M.E.V.; Dimitrakopoulos, R. Stochastic short-term mine production schedule accounting for fleet allocation, operational considerations and blending restrictions. Eur. J. Oper. Res. 2016, 255, 911–921. [Google Scholar] [CrossRef]
- Upadhyay, S.P.; Askari-Nasab, H. Truck-shovel allocation optimisation: A goal programming approach. Min. Technol. 2016, 125, 82–92. [Google Scholar] [CrossRef]
- Halim, A.; Lööw, J.; Johansson, J.; Gustafsson, J.; Van Wageningen, A.; Kocsis, K. Improvement of working conditions and opinions of mine workers when battery electric vehicles (BEVs) are used instead of diesel machines—Results of field trial at the Kittilä mine, Finland. Min. Metall. Explor. 2022, 39, 203–219. [Google Scholar] [CrossRef]
- Lindgren, L.; Grauers, A.; Ranggård, J.; Mäki, R. Drive-cycle simulations of battery-electric large haul trucks for open-pit mining with electric roads. Energies 2022, 15, 4871. [Google Scholar] [CrossRef]
- Junhuathon, N.; Sakulphaisan, G.; Prukmahachaikul, S.; Chayakulkheeree, K. Route-based optimization methods for energy consumption modeling of electric trucks. Energies 2025, 18, 1986. [Google Scholar] [CrossRef]
- Zhang, S.; Gajpal, Y.; Appadoo, S.S.; Abdulkader, M.M.S. Electric vehicle routing problem with recharging stations for minimizing energy consumption. Int. J. Prod. Econ. 2018, 203, 404–413. [Google Scholar] [CrossRef]
- Zhang, Y.; Wang, C.; Yu, Q.; Zheng, L. Battery aging-minimal speed control of autonomous heavy-duty electric trucks in adaptation to highway topography and traffic. Sci. China Technol. Sci. 2023, 66, 2942–2957. [Google Scholar] [CrossRef]
- Xiao, Y.; Zhou, W.; Luan, B.; Yang, K.; Yang, Y. Truck transportation scheduling for a new transport mode of battery-swapping trucks in open-pit mines. Appl. Sci. 2024, 14, 10185. [Google Scholar] [CrossRef]
- Zähringer, M.; Teichert, O.; Balke, G.; Schneider, J.; Lienkamp, M. Optimizing the journey: Dynamic charging strategies for battery electric trucks in long-haul transport. Energies 2024, 17, 973. [Google Scholar] [CrossRef]
- Akopov, A.S. An Improved Parallel Biobjective Hybrid Real-Coded Genetic Algorithm with Clustering-Based Selection. Cybern. Inf. Technol. 2024, 24, 32–49. [Google Scholar] [CrossRef]
- Akopov, A.S. A Clustering-Based Hybrid Particle Swarm Optimization Algorithm for Solving a Multisectoral Agent-Based Model. Stud. Inform. Control 2024, 33, 83–95. [Google Scholar] [CrossRef]
- Asija, D.; Choudekar, P. Congestion Management Using Multi-Objective Hybrid DE-PSO Optimization with Solar-ESS-Based Distributed Generation in a Deregulated Power Market. Renew. Energy Focus 2021, 36, 32–42. [Google Scholar] [CrossRef]
- Xu, H.; Deng, Q.; Zhang, Z.; Lin, S. A Hybrid Differential Evolution Particle Swarm Optimization Algorithm Based on Dynamic Strategies. Sci. Rep. 2025, 15, 4518. [Google Scholar] [CrossRef]
- Shao, K.; Song, Y.; Wang, B. PGA: A New Hybrid PSO and GA Method for Task Scheduling with Deadline Constraints in Distributed Computing. Mathematics 2023, 11, 1548. [Google Scholar] [CrossRef]
- Mulge, A.; Zhou, X.; Li, R.; Taylor, A. Modeling and simulation of a hybrid battery pack using Li-ion battery and supercapacitors for class 2A light duty pick-up truck application. In Proceedings of the 2021 International Conference on Electrical, Computer and Energy Technologies (ICECET 2021), Cape Town, South Africa, 9–10 December 2021; IEEE: New York, NY, USA; pp. 1–6. [Google Scholar]
- Bao, H.; Knights, P.; Kizil, M.; Nehring, M. Electrification alternatives for open pit mine haulage. Mining 2023, 3, 1–25. [Google Scholar] [CrossRef]
- Liu, X.; Plötz, P.; Yeh, S.; Liu, Z.; Liu, X.C.; Ma, X. Transforming public transport depots into profitable energy hubs. Nat. Energy 2024, 9, 1206–1219. [Google Scholar] [CrossRef]
- Shi, Y.; Ma, X.; Zhang, P.; Lu, H. A dynamic truck scheduling framework for open-pit mine production under equipment fault uncertainty. Expert Syst. Appl. 2026, 299, 130254. [Google Scholar] [CrossRef]
- Guan, C.; Zhang, Z.; Liu, S.; Gong, J. Multi-objective particle swarm optimization for multi-workshop facility layout problem. J. Manuf. Syst. 2019, 53, 32–48. [Google Scholar] [CrossRef]
- Ghodratnama, A.; Jolai, F.; Tavakkoli-Moghaddam, R. Solving a new multi-objective multi-route flexible flow line problem by multi-objective particle swarm optimization and NSGA-II. J. Manuf. Syst. 2015, 36, 189–202. [Google Scholar] [CrossRef]
- Meidute-Kavaliauskiene, I.; Sütütemiz, N.; Yıldırım, F.; Ghorbani, S.; Činčikaitė, R. Optimizing multi cross-docking systems with a multi-objective green location routing problem considering carbon emission and energy consumption. Energies 2022, 15, 1530. [Google Scholar] [CrossRef]
- Das, R.; Topal, E.; Mardaneh, E. Concurrent optimisation of open pit ore and waste movement with optimal haul road selection. Resour. Policy 2024, 91, 104834. [Google Scholar] [CrossRef]
- Hamlich, M.; Bellatreche, L.; Mondal, A.; Ordonez, C. (Eds.) Smart Applications and Data Analysis. In Proceedings of the Third International Conference on Smart Applications and Data Analysis (SADASC 2020); Marrakesh, Morocco, 25–26 June 2020; Springer: Cham, Switzerland, 2020. [Google Scholar]
- Mirzaei-Nasirabad, H.; Mohtasham, M.; Askari-Nasab, H.; Alizadeh, B. An optimization model for the real-time truck dispatching problem in open-pit mining operations. Optim. Eng. 2023, 24, 2449–2473. [Google Scholar] [CrossRef]
- Liu, B.; Ma, X.; Shi, Y.; Liu, X.; Gao, K.; Tian, Q.; Wang, W. Optimizing a link-based travel incentive scheme integrating personal carbon trading for low-carbon commuting. J. Environ. Manag. 2025, 374, 124032. [Google Scholar] [CrossRef]
Disclaimer/Publisher’s Note: The statements, opinions and data contained in all publications are solely those of the individual author(s) and contributor(s) and not of MDPI and/or the editor(s). MDPI and/or the editor(s) disclaim responsibility for any injury to people or property resulting from any ideas, methods, instructions or products referred to in the content. |
© 2025 by the authors. Licensee MDPI, Basel, Switzerland. This article is an open access article distributed under the terms and conditions of the Creative Commons Attribution (CC BY) license (https://creativecommons.org/licenses/by/4.0/).