Abstract
In this paper, we present a water mist dehazing network to improve the accuracy of radiation temperature measurements of the billet surface in the secondary cooling zone of continuous casting. First, we develop a billet radiation attenuation model that accounts for the wavelength-dependent attenuation coefficient of water mist in the secondary cooling zone. Using this model and the corresponding dataset, the water mist transmittance is calculated. Furthermore, the water mist dehazing network—which is distinct from conventional dehazing networks designed for natural environments—comprises three key components: water mist feature extraction based on a combined Unet and Transformer structure; fusion of prior water mist transmittance data using an attention mechanism; and composite transmittance estimation via a multi-path dense network. The experimental results demonstrate that the proposed network effectively reduces water mist’s interference with billet surface temperature measurements in both the spatial and temporal dimensions. Compared with the standalone Unet and Unet + Transformer network architectures, the proposed network achieves a significantly improved dehazing performance, thus verifying its practical value and reliability for billet surface temperature measurement tasks.
1. Introduction
In continuous casting for steel production, molten steel solidifies into billets through initial cooling in the mold, followed by secondary cooling in the secondary cooling zone []. The solidification rate of the billet significantly influences billet quality, with the surface temperature of the strand serving as a critical parameter in this process. Therefore, obtaining accurate measurements of the billet surface temperature is essential. During secondary cooling, water is sprayed onto the surface of the high-temperature billet, generating a mist upon contact. However, the presence of spray water and mist creates harsh environmental conditions within the secondary cooling zone, presenting considerable challenges for reliable billet surface temperature measurement.
Billet surface temperature measurement methods are divided into two categories: contact temperature measurement and non-contact temperature measurement. Given that the billet casting speed ranges from 3 to 6 m/min, it is difficult for the contact temperature sensor to reach a thermal equilibrium state with the billet; meanwhile, heat exchange between the sensor and the billet surface affects the real surface temperature of the billet. Additionally, friction between the billet and the sensor shortens the sensor’s service life. Consequently, contact methods are not suitable for measuring the billet surface temperature.
Non-contact methods, such as those utilizing infrared thermometers [,,,,] or CCD cameras [,,,,], can be used to measure the temperature of moving billets in the secondary cooling zone. However, water mist absorbs and scatters the radiation emitted by the billet, reducing the radiant flux per unit area received by non-contact thermometers. This issue leads to diminished temperature measurement accuracy and thus requires urgent resolution.
To address this problem, researchers have proposed several theoretical and practical approaches. Zhang [] and Huang [] analyzed the radiation characteristics of water mist in the secondary cooling zone and concluded that positioning the infrared thermometer as close as possible to the billet surface can reduce the temperature measurement error induced by water mist. Nevertheless, the high-temperature billet elevates the ambient temperature around it to a level that far exceeds the operating temperature limit of the radiation thermometer. As a result, the method of mitigating the impact of water mist by placing the thermometer close to the billet surface is not sufficiently effective.
To mitigate the impact of water mist on temperature measurement, multispectral temperature measurement techniques, such as two-color and three-color thermometry [], account for the varying attenuation coefficients of water mist across different wavelengths. These methods rely on the mapping relationship between the radiance ratios at distinct wavelengths and the corresponding temperatures to calibrate thermometers or cameras. However, studies [,] indicate that the wavelength-dependent fluctuation of the attenuation coefficient is relatively limited, leading to insufficient complementary information across different spectral ranges and some duplicate ratio of radiance at different wavelengths. Consequently, these approaches struggle to fully leverage the radiance data from various spectral ranges, thereby restricting the accuracy of temperature measurement.
Obviously, if an effective water mist removal algorithm is designed to process billet images prior to temperature measurement, the accuracy of measuring the billet surface temperature field will be enhanced. Currently, research on dehazing primarily centers on atmospheric scattering, with the main objective of acquiring clear images. For instance, atmospheric scattering models and typical dehazing algorithms share the ultimate goal of eliminating image blurring caused by haze or fog. Narasimhan proposed an atmospheric scattering model [] comprising attenuation and airlight. Attenuation arises from the scattering and absorption of reflected light by haze particles, while airlight is generated when haze particles scatter environmental illuminations such as direct sunlight and diffuse skylight. The widely adopted dehazing algorithms for natural environment images are mainly based on Narasimhan’s model.
The dark channel prior algorithm is used for image dehazing [,,]. Dr. Kaiming He took the lead in proposing the dark channel prior algorithm. This algorithm holds that the pixel values of an image’s dark channel tend to be 0. On this basis, it derives the formula for transmittance and calculates the haze-free image. The algorithm achieves excellent results on images with a small proportion of sky and light-colored objects; however, when the image contains some light-colored objects, it will produce a halo effect. Thomas’s work advanced it via color correction transforms, addressing haze-induced blue shading. Liu’s study further optimized dark channel prior with Retinex and a genetic algorithm, boosting transmittance accuracy. Together, they reflect dark channel prior’s evolution from a baseline to refined, scenario-adapted solutions. Dark channel prior refinement is researched for image dehazing. Li [] optimizes the traditional dark channel prior by introducing a context-aware transmission refinement module, reducing halo artifacts in bright regions. Li [] further enhances the dark channel prior with a residual learning branch, refining transmittance maps to preserve fine textures lost in conventional methods. Zhang [] adopts an adaptive window for dark channel calculation, adapting to scene complexity and improving robustness to light-colored objects.
Zhou [] proposes lightweight Dehaze-Unet and designs the LAYER module, fusing batch normalization into haze feature aggregation to enhance extraction of haze-related features without extra computation. Cai [] put forward an effective dehazing algorithm that utilizes convolutional networks to estimate haze transmittance and then infers haze-free images in accordance with the atmospheric scattering model. Hayat [] proposes lightweight Light-DehazeNet, jointly estimating transmission via a transformed model and adding color restoration, suiting resource-constrained scenarios. He [] advances to Alpha-DehazeNet, using RGBA modeling, spatial attention, and depth consistency loss, boosting PSNR/SSIM while balancing parameters, showing DehazeNet’s evolution. Shifting to other deep learning method, Pang [] proposes BidNet, a binocular dehazing model that avoids explicit disparity estimation, using a Stereo Transformation Module to exploit inter-image correlations for joint dehazing. Jiao [] fuses fractional derivatives (preventing over-enhancement) with CNN-Swin Transformer, capturing local and non-local features to boost texture preservation. Yang [] introduces a haze-aware transformer (HAT) with multi-scale attention, integrating physical priors to reduce color distortion and elevate PSNR/SSIM metrics. Collectively, they reflect dehazing’s evolution from dark channel prior-based refinement to deep learning-driven efficiency and accuracy, addressing key challenges such as artifacts, generalization, and cross-scene adaptability.
Yang [] proposes an asymmetric Unet-based dehazing network which is integrated with the atmospheric scattering physical model. Equipped with depth-wise, self-attention and channel attention mechanisms, the network leverages dark channel prior guidance to enable the more accurate estimation of complex transmission maps. Notably, it achieves stable performance on both remote sensing and natural hazy images. Jian [] introduces a dual-branch feature fusion dehazing network via multispectral channel attention. A multispectral image pre-processing module and a dual-branch feature fusion module were used for image dehazing. The multispectral channel attention dehazing network achieved a state-of-the-art performance for several natural environment image dehazing benchmarks. Sun [] proposed an infrared imaging temperature measurement method based on the calculated spectral radiation characteristics of mist. A temperature retrieval model was built based on radiative transfer theory while the adjacent effect was considered. The exact surface temperature distribution can be retrieved while the parameters of the diffusive mist medium remain unknown. The average retrieval error of high-temperature blackbody targets is less than 7% (about 71 K), whereas the maximum average retrieval measurement error of high-temperature graybody targets is 14% (around 135 K). It is not suitable for measuring temperatures at steel production sites.
The dehazing network for natural environment images is not suitable for dehazing billet images in the secondary cooling zone. The main reasons for this are as follows:
- (1)
- The natural environment image dehazing network based on an atmospheric scattering model is not suitable for dehazing images in the secondary cooling zone. There are significant differences between the natural environment and the secondary cooling zone in terms of factors such as light source, ambient lighting, scattering coefficient, and wavelength dependence. The atmospheric scattering model of the natural environment struggles to accurately describe the scattering and absorption characteristics of the water mist medium in the secondary cooling zone.
- (2)
- The dehazing network for natural environment images has difficulty incorporating prior information about water mist in the secondary cooling zone. In common natural environment image dehazing methods, haze is often considered to have a uniform concentration, while the concentration distribution of water mist in the secondary cooling zone is uneven and closely related to its location. Therefore, additional modules need to be designed in such a way that they can fully utilize the prior information of water mist transmittance in the secondary cooling zone.
- (3)
- The dehazing of natural environments focuses on the overall dehazing visual effect of the image, while the dehazing of images in the secondary cooling zone of continuous casting focuses on the pixel value accuracy and temperature measurement accuracy of details.
To address the aforementioned issues, this paper proposes a billet radiation attenuation model and an end-to-end method for measuring the billet surface temperature, which incorporates a water mist removal network. The proposed water mist removal algorithm is built upon the billet radiation attenuation model and utilizes a convolutional network to estimate transmittance. In comparison with dehazing networks designed for natural environments, the network developed in this paper leverages the prior information of water mist path transmittance in the secondary cooling zone to ensure the accuracy of water mist removal. The experimental results demonstrate that the proposed method for measuring the billet surface temperature field enhances the accuracy of temperature measurements.
2. Materials and Methods
2.1. Water Mist Radiation Attenuation Model
Atmospheric scattering models are already capable of satisfying the accuracy requirements for haze image reconstruction in natural environment object detection tasks. Nevertheless, they fail to meet the accuracy demands of billet surface temperature measurement in the secondary cooling zone.
The traditional atmospheric scattering model describes the scattering mechanism of haze in natural environments. In such environments, the attenuation coefficient of haze varies slightly with wavelength. For a haze in which the meteorological visibility exceeds 4.5 km, the attenuation coefficient tends to be a constant. Additionally, considering the narrow bandwidth, the traditional atmospheric scattering model treats the attenuation coefficient of haze in natural environments as a constant that does not change with the wavelength of incident light. Consequently, the calculations of the energy attenuation of light beams in haze within natural environments are approximate, and the results contain errors.
To address this issue, this paper proposes a billet radiation attenuation model based on the radiation characteristics of water mist in the secondary cooling zone, while taking into account the relationship between the attenuation coefficient and wavelength.
To build the attenuation model in secondary cooling zone, the path attenuation coefficient is defined as follows:
And the relationship between the radiation received by the camera and the total radiation on the surface of steel billet can be written as follows:
According to the Lamber–Beer Transmittance Law, the following equations of could be implemented:
Therefore, the equation of the path attenuation coefficient is as follows:
In Equation (5), is represented by the function of the attenuation coefficient . When and are fixed, the larger the , the larger the . We define the water mist path transmittance as follows:
Equation (2) can be written as shown below:
In secondary cooling zone, the illuminant is casting billet itself, and the environmental illumination is very faint. Therefore, the equation of camera illuminance is as follows:
The relationship between the radiation received by the camera and the current value of the pixel circuit is as follows:
In Equation (9), is the current value of the pixel circuit, is the photoelectric conversion coefficient of the camera, is the radiation, and is the exposure time.
The relationship between pixel value and current value is
In Equation (10), is the pixel value of the camera and is the conversion coefficient from the current value to the pixel value. Therefore, the pixel value is proportional to illuminance:
The following expressions can be calculated according to Equations (12) and (14):
Vector is the position of the pixel in the image, and corresponds to a small area on the billet surface, while s the path transmittance of water mist at position . Finally, the relationship between the pixel value of the water mist image and the pixel value of the mist-free image can be expressed as follows:
Expression (15) is the billet radiation attenuation model proposed in this paper. The model in this paper takes into account the ways in which the water mist attenuation coefficient varies with the wavelength, thus solving the calculation error problem caused by the traditional atmospheric scattering model treating its attenuation coefficient as a constant.
2.2. Acquisition the Continuous Casting Billet Images in Secondary Cooling Zone
2.2.1. Camera Calibration
This paper adopts a multispectral prism industrial camera, which uses two CMOS sensors to simultaneously capture visible-color images and near-infrared images through the same optical path. Their central wavelengths are , , and , respectively.
First, calibration is performed on a blackbody furnace. The calibration temperature range covers the surface temperature of the billet (1193–1453 K). During the calibration process, the object distance is 1.5 m. A neutral density filter with optical density is2.0 (1% transmittance) is added to the camera’s optical system; the focal length of the lens is 35 mm and the aperture is set to F16. The exposure times of the CMOS sensors in the two channels are 11.3 ms for the visible-light channel and 4.6 ms for the near-infrared channel. During the image acquisition process, the camera’s Acquisition Synchronization Mode is used to ensure that the image acquisition of the two channels is synchronized in time.
According to Planck’s theorem, the pixel values obtained by the camera can be expressed as Equation (16). When the optical system and exposure time are fixed, the coefficient K is a constant, commonly referred to as the instrument constant, which can be obtained through calibration in a blackbody furnace.
where is the gray value of the image collected by the CMOS, is the spectral emissivity, K is the instrument constant, and c2 is the Planck’s second radiation constant. Equation (16) contains four equations, and the spectral emissivity is set as a polynomial function relationship [], so that the measured temperature T can be calculated. The calibration results of the instrument constant K under different spectra are shown in Table 1.

Table 1.
The calibration results of instrument constant K under different spectra.
When the measuring temperature is based on results obtained using a CMOS camera (JAI company, Tokyo, Japan), the influence of dark current on temperature measurement accuracy is a notable issue.
Figure 1a shows the relationship between the average grayscale output generated by the dark current and the camera’s ambient temperature. It can be clearly seen from Figure 1a that the average grayscale output caused by the CMOS dark current increases as the CMOS operating temperature rises, showing an approximately exponential growth trend. Figure 1b presents the comparison results of temperature measurement errors caused by the camera dark current under different measured target temperatures. It can be seen from the figure that the temperature measurement error caused by the dark current increases as both the ambient temperature and the temperature of the measured object rise. Therefore, during the actual on-site temperature measurement process, it is necessary to cool the camera to ensure it operates at an appropriate temperature.
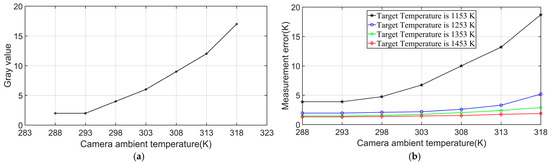
Figure 1.
(a) The relationship between the dark current and the camera’s ambient temperature; (b) temperature measurement errors generated by the dark current.
This paper uses a standard white field instrument to perform flat-field correction on the camera. Figure 2a shows the standard white field generator used for calibration. Figure 2b presents the flat-field experimental correction coefficients and their fitting results along the horizontal center line of the image (with a focal length of 35 mm and f-number of 16). The experimental results show that, due to the small f-number selected, the stable area at the center of the image is relatively large, which can reduce the impact of non-uniformity. In the actual temperature measurement process, the flat-field correction coefficients obtained during the experiment are used to correct the distortion of the optical system.
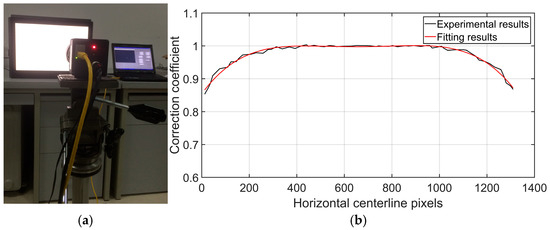
Figure 2.
(a) Experimental equipment; (b) flat-field experimental correction coefficients.
2.2.2. Steel Plant Image Acquisition
During the image acquisition process at the steel plant, the camera is installed at the end of the secondary cooling zone, as shown in Figure 3a. Since this is a short-term on-site experiment, compressed gas cooled by a vortex tube is used to purge and cool the camera during the experiment, maintaining the camera’s operating temperature at approximately 25 °C to ensure low dark current and noise.
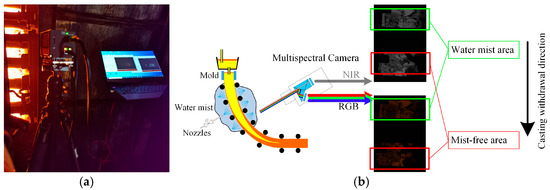
Figure 3.
(a) Image acquisition at the steel plant; (b) schematic diagram of image acquisition area.
The images are captured from a boundary area at the end section of the secondary cooling zone where the nozzles are in both open and closed states: the upper part contains a large amount of water mist, while the nozzles in the lower part are closed, with no water mist present. As shown in Figure 3b, in both the visible-light and near-infrared images, the upper part is the mist area and the lower part is the mist-free area.
During image acquisition, the camera parameters were kept consistent with those used during the blackbody furnace calibration. The frame rate was set to 1 frame per second. The average interval for the continuous casting billet to move from the foggy area to the fog-free area was approximately 30 frames, corresponding to a billet casting speed of around 0.5 m per minute.
Images of continuous casting billets of two steel grades, namely GCr15 and S45CTi, were collected on-site. These images covered different process conditions during production, including variations in casting speed and water flow rate. In total, 5200 sets of visible-light and near-infrared images were acquired, with a ratio of foggy to fog-free images of 1:1.
From the original images, region of interest images of the continuous casting billets (with a size of 360 × 128) were extracted separately for visible-light and near-infrared bands to form the dataset. This dataset was divided into a training set (2000 image sets), a validation set (1000 image sets), and a test set (2200 image sets) so as to meet the sample requirements of the deep learning-based dehazing algorithm described in this paper.
2.3. Water Mist Removal Network Method
In the radiation optical path of the secondary cooling zone, interference from the water mist medium reduces the radiant energy received by the temperature sensor, thereby introducing temperature measurement errors and decreasing measurement accuracy.
To address the limited accuracy of billet surface temperature measurement caused by water mist in the secondary cooling zone, this paper proposes a water mist removal network to be applied prior to temperature measurement. Figure 4 illustrates the key features of the proposed billet temperature measurement method, which consists of three main components: water mist feature extraction in the secondary cooling zone using a Unet and Transformer architecture; prior fusion of water mist transmittance in the secondary cooling zone via an attention mechanism; and estimation of the water mist composite transmittance using a multi-channel dense network.
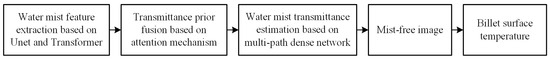
Figure 4.
Characteristics of the proposed method.
The water mist removal network is based on the billet radiation attenuation model and water mist path transmittance prior, and the network outputs mist-free billet images. Compared with traditional temperature measurement methods, the added water mist removal network can reduce water mist’s interference with temperature measurement results.
Figure 5 illustrates the detailed architecture of the proposed method. As shown in this figure, visible-light and near-infrared images of the billet are acquired via the imaging system and subsequently fed into the water mist removal network. This network, which is built upon the billet radiation attenuation model and prior information regarding water mist path transmittance, proceeds to estimate the corresponding water mist transmittance and dehazed billet images.
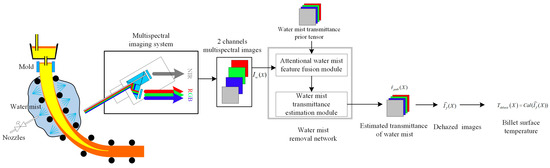
Figure 5.
Structure of the temperature measurement method.
According to Equation (15), if path transmittance is estimated (the estimated value is written as ), the corresponding mist-free billet image can be estimated. The estimated value is written as follows:
Finally, the temperature field of the dehazed billet image value is calculated using multispectral thermometry:
2.4. Water Mist Feature Extraction Based on Unet and Transformer
Since the influence of water mist medium in the secondary cooling zone on the billet temperature image is related to the concentration of water mist distribution, the influence of water mist varies in different regions of the billet image and feature map. In this paper, introducing the Transformer structure into the water mist feature extraction work allowed us to effectively extract features of key regions. The difference from the main structure of the TransUnet network is that this paper retains the complete structure of Unet and adds the Transformer structure at the bottom layer of Unet, so as to utilize the advantages of Transformer’s multi-head attention mechanism while completely retaining the advantages of Unet. Figure 6 shows a schematic diagram of the water mist feature extraction structure in this paper.
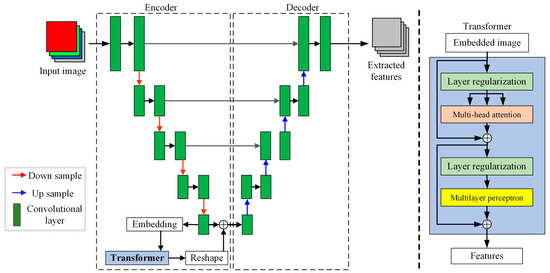
Figure 6.
Diagram of the structure of the water mist feature extraction.
The overall structure of Unet consists of four encoder layers and four decoder layers. Each of these layers contains a two-layer convolutional network. Unet’s encoder has a four-layer structure, in which each layer is composed of a double-layer convolutional network. After key features have been extracted through a layer of max-pooling, the results are passed to the next layer. The decoder part receives the output from the next-layer network and the results from the same-layer encoder before conducting pooling simultaneously. These two types of results are concatenated and then passed to the previous layer. There are four input layer channels; the convolution kernel size is 3 × 3; the input image size is 320 × 128; the activation function is ReLU; and the receptive field is 132. Following the integration of the Transformer structure, the TransUnet network has a parameter count of 93.2 M.
In Figure 6, image embedding refers to the process of converting feature maps into vectors, which are then input into the Transformer. The basic structure of the Transformer block is shown on the right side of the figure: through structures such as layer regularization, multi-head attention, and multilayer perceptron, it ultimately outputs feature vectors. By means of multiple heads, multi-head attention generates multiple subspaces, thereby enabling the model to effectively focus on different aspects of water mist feature information. The output of the Transformer is reshaped to match the size of the feature map and then undergoes an element-wise weighted summation with the output of the fourth layer of Unet. This summed result serves as both the output of the encoder and the input of the decoder. Finally, the decoder performs multiple upsampling operations and outputs the extracted feature.
2.5. Attention Mechanism-Based Fusion of the Water Mist Transmittance Prior
To effectively mitigate the temperature field measurement errors induced by water mist in the secondary cooling zone, it is essential to leverage physical information appropriately in the design of the water mist removal network. Accordingly, the network proposed in this paper employs an attention-weighted summation of the water mist transmittance prior and the extracted water mist features to ensure the accuracy of water mist removal. Figure 7 presents the structure of the aforementioned water mist feature fusion module.
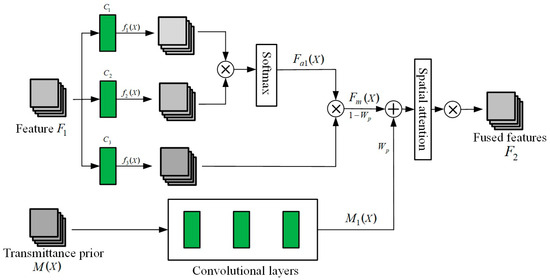
Figure 7.
Water mist feature fusion module.
In the billet images of the secondary cooling zone, the distribution of water mist is region-dependent. For instance, water mist is found in higher concentrations in areas close to the nozzles, while the composite transmittance of the water mist medium and vapor is lower, and thus has a greater impact on temperature measurement accuracy compared to other regions. Additionally, the actual surface temperature of the billet in the secondary cooling zone also exhibits a position-related distribution, and there may be differences in the actual billet temperature corresponding to different positions and regions in the billet image. In conclusion, various features in the billet images of the secondary cooling zone (primarily the distribution of water mist and vapor composite transmittance) are dependent on their locations, whereas ordinary convolutional networks’ ability to extract features of key regions is limited.
The Transformer structure introduced in this paper for water mist feature extraction has, to a certain extent, solved the above-mentioned problems through multi-head attention. To more effectively utilize the features of the key regions of the billet and achieve greater fusion of the water mist and vapor composite transmittance prior, this paper designs a cascaded self-attention and spatial domain attention structure. The self-attention structure is used to extract features more fully, and the spatial domain attention is used to more fully fuse the extracted features with the transmittance prior, as shown in Figure 7.
As can be seen from Figure 7, the water mist feature undergoes two parallel convolution operations. The convolution results and are subjected to element-wise multiplication, and the product is processed using the Softmax function to obtain the attention map . Subsequently, each channel of the result from the third convolution operation is multiplied with the corresponding elements of the attention map , yielding the water mist feature output by the self-attention structure. The transmittance priors of the water mist system and gas system are processed through a series of convolutional layers, resulting in the processed output . This better characterizes both the local and global features of the transmittance prior. Finally, the corresponding elements of and are subjected to a weighted summation according to the following formula:
In Equation (19), denotes the weight tensor corresponding to , denotes the weight tensor corresponding to , and the symbol represents the element-wise multiplication of tensors. The spatial domain attention is used to perform max pooling and average pooling on , followed by transformation, resulting in the prior-fused water mist features of the secondary cooling zone.
2.6. Composite Transmittance Estimation Based on Multi-Path Dense Network
After feature extraction and prior feature fusion, the transmittance of water mist in the continuous casting billet image is estimated based on the fused water mist features. Although convolutional networks are widely used in image-related parameter estimation, as the network deepens and the number of convolutions increases, ordinary convolutional networks often suffer from feature loss. Therefore, this paper designs a multi-path dense network for estimating the composite transmittance of the water mist and vapor, as shown in Figure 8.
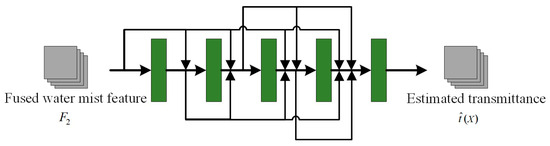
Figure 8.
Multi-path dense network for composite transmittance estimation. (The green rectangles represent the convolutional layers).
As can be seen from the figure, the fused water mist feature input into the dense network passes through multiple multi-path dense layers, and then the estimated value of the composite transmittance of the water mist and the vapor is output.
After estimating the composite transmittance , the water mist in the image can be removed according to Equation (17) to obtain the dehazed billet image . On this basis, the billet surface temperature is calculated using the multi-spectral temperature measurement method according to Equation (18).
3. Results and Discussion
3.1. Model Validation
The dehazing network is implemented using PyTorch1.8.0, CUDA10.0, and Python3.8. The training model is completed on a single NVIDIA RTX 4070 (12 GB). The network is trained using 100 epochs, the network input image size is 360 × 128, and the initial learning rate of the model is set as 0.001. We train the network for 100 epochs with a batch size of 16.
To validate the proposed model, the path transmittance of water mist is compared with the absolute temperature error . Suppose that is the temperature calculated from the water mist-dehazed billet image and is the temperature calculated based on the corresponding mist-free billet image . Thus, can be calculated as follows:
We randomly chose one set of casting billet images from the dataset and calculated and the corresponding water mist path transmittance prior. Thermal images of the billet surface temperature before and after dehazing are shown in Figure 9.
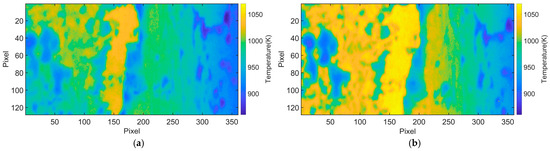
Figure 9.
(a) Thermal image of the billet surface temperature before dehazing. (b) Thermal image of the billet surface temperature after dehazing.
Figure 9 shows that the overall temperature of the image post-dehazing was higher than that of the image before dehazing, which indicates that the dehazing network was successful.
To validate the proposed model, the distortion caused by water mist can be calculated using the model as follows:
where is the image distortion coefficient, vector is the position of the pixel in the image, and is the path transmittance of water mist at position .
After that, we normalize the temperature error matrix as follows:
In Equation (22), the denominator is the normalization constant for each image. Next, we calculate the minimum value ρ of the correlation coefficients of the corresponding rows of and :
In Equation (23), represents row of the image, is the variance, and is the covariance.
The specific calculation process is as follows:
- Randomly select 50 sets of dehazed and mist-free images from the test set and use the first set to begin the calculation process.
- Based on the mist-free image corresponding to the sequence of the dehazed image, calculate the water mist path transmittance matrix of this set of images.
- Calculate the temperature value image Tdehaze (x,y) after dehazing using the method proposed in this paper and compute according to Equation (19).
- Perform normalization processing on Terror (X) in accordance with Equation (21).
- Calculate the row correlation coefficient corresponding to each row in the image using Equation (22), then take the minimum value of these row correlation coefficients as for this image.
- Repeat steps 2–5 to complete the calculation for all 50 sets of images and find the minimum value of among the 50 sets of images.
The value of the row correlation coefficient ranges from −1 to 1. When , it indicates an extremely strong correlation between the two variables; when , it indicates a strong correlation; when , it indicates a moderate correlation; when , it indicates a weak correlation; and when , it indicates an extremely weak correlation or no correlation.
According to our calculations, the minimum value of among the 50 sets of images is 0.97. Therefore, the distortion caused by water mist and the temperature error are strongly correlated, and the proposed billet radiation attenuation model is plausible.
Next, 10% of the visible-light and near-infrared images are randomly selected from the test dataset of water mist and water mist-free billet images with a high matching degree, and the average tensor of the water mist path transmittance of these images is calculated and used as the prior tensor of water mist transmittance in the secondary cooling zone.
3.2. Evaluation Indicators for Billet Image Dehazing for Temperature Measurement
To objectively verify the effect of the water mist dehazing method for billet images, the following indicators are selected for evaluation in this paper.
- (1)
- Root Mean Square Error
The Root Mean Square Error (RMSE) is used to measure the similarity between two billet images, and it is calculated as follows:
where represents the temperature value of the dehazed image and represents the temperature value of the corresponding mist-free image. The RMSE indicator can reflect the degree of difference in temperatures between the dehazed and mist-free images. The smaller the RMSE value, the smaller the difference between the images.
- (2)
- Maximum Temperature Difference
The Maximum Temperature Difference (MTD) is used to measure the maximum absolute deviation of temperature values between the dehazed image and the mist-free image in a specified region, and is defined as follows:
where represents the temperature value of the dehazed image, represents the temperature value of the corresponding mist-free image, and represents the selected evaluation region. This indicator reflects the most extreme error in the temperature recovery of the dehazed image in the local region; the smaller its value, the smaller the extreme deviation, and the closer the restoration of the temperature field is to the real distribution.
- (3)
- Average Temperature Difference
The Average Temperature Difference (ATD) reflects the average level of pixel temperature errors in the entire region and is defined as follows:
where represents the number of pixel points in the evaluation region. This indicator measures the overall temperature deviation of the entire region and is one of the core indicators used to evaluate the accuracy of the billet surface temperature field by the dehazing method. The smaller the ATD is, the smaller the difference between the dehazed image and the mist-free image, which is indicative of a stronger dehazing ability.
- (4)
- Relative Temperature Error
Relative Temperature Error (RTE) is the ratio of the absolute value of the absolute error in temperature measurement to the true temperature. The calculation formula for the relative error of the temperature measurement result is as follows:
RE can more comprehensively evaluate the accuracy and precision of measurement results. It can compare errors under different scales without being affected by the magnitude of absolute values.
In summary, the above four indicators jointly construct a comprehensive evaluation system that ranges from local extreme differences to global averages, and from pixel-level errors to relative errors of temperature trends. These indicators can fully assess the effectiveness and robustness of the image dehazing network proposed in this paper in mitigating the impact of water mist in the secondary cooling zone on the temperature measurement of the billet surface.
3.3. Comparison of Temperature Measurement Results After Image Dehazing with Different Network Combinations
This paper selects different regions from billet images and extracts temperature data using the aforementioned multispectral temperature thermometry. Based on the two dimensions of spatial locality and temporal continuity, a quantitative evaluation is conducted on the water mist dehazing effect of different networks. The details are as follows:
- (1)
- Single-frame billet image row not covered by oxide scale: Select a row of pixels in the area not blocked by oxide scale and obtain its temperature sequence, which can reflect the horizontal temperature change trend.
- (2)
- Rectangular area in a single-frame image not covered by oxide scale: Extract the rectangular area with the largest area and without oxide scale and calculate the temperature values of all pixels in this area, which is used to reflect the overall temperature fluctuation in the local area.
- (3)
- Same coordinate in 30 s time series continuous images: Select a fixed coordinate in the image, record the temperature change trend at the position without oxide scale in multiple consecutive frames of images, and evaluate the actual effect of the algorithm in the time dimension.
In each type of region, five temperature curves are displayed, respectively: the temperature curve of the mist image, the temperature curve of the mist-free image, the temperature curve when the dehazing network is Unet, the temperature curve when the dehazing network is Unet + Transformer, and the temperature curve of the dehazing method proposed in this paper (Unet + Transformer + transmittance prior).
Quantitative indicators such as RMSE, MTD, ATD, and RTE are calculated and analyzed. Using these indicators, the effectiveness of each dehazing method is evaluated from multiple dimensions, ranging from local details to global trends, to verify the proposed model’s effectiveness in improving the accuracy of temperature measurement and reducing water mist interference.
Figure 10 and Figure 11 show the results obtained by processing randomly selected images from the test set using the method proposed in this paper.
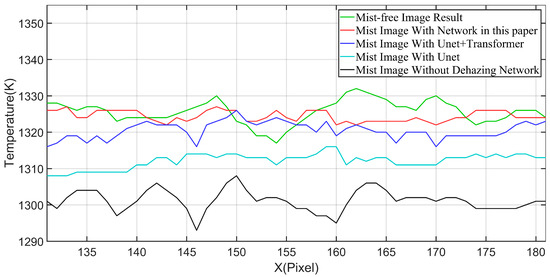
Figure 10.
Temperature curve of a single row in a billet image.
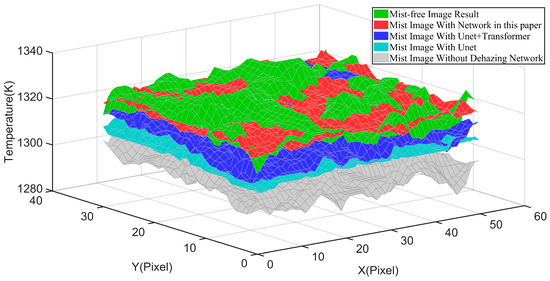
Figure 11.
Temperature curve of the largest rectangular region without oxide scale in a billet image.
Figure 10 and Table 2 show the temperature curve and evaluation indicators extracted from a single row of pixels not covered by oxide scale in a single-frame image, aiming to analyze different dehazing methods’ ability to eliminate the interference of water mist medium on the surface temperature measurement of the casting billet.
Table 2.
Analysis of the temperature curve of a single-frame image.
Figure 10 shows that the water mist medium interferes significantly with the surface temperature measurement of the cast billet. The temperature curve of the image with mist in the figure is at the lowest position, and there is an obvious temperature difference between this curve and that of the mist-free image. The temperature difference between the temperature curve of the Unet network, the temperature curve of the Unet + Transformer network, the temperature curve of the method described in this paper (Unet + Transformer + transmittance prior), and the image without mist decreases gradually.
Table 2 shows that, among the combinations of the three categories, the dehazing network proposed in this paper achieved the best performance across all metrics. The RMSE decreased from 24.7 K (without dehazing) to 6.8 K for the Unet + Transformer dehazing result and to 3.9 K for the proposed method. Both the MTD and the ATD were reduced by approximately 20 K. By calculating the RTE for all pixels and determining the mean, we confirmed that the temperature measurement results of the proposed method were closest to those of the haze-free image, achieving the best dehazing effect. This demonstrates that the water mist transmission prior plays an important role in the model.
Figure 11 and Table 3 show the temperature curves and related evaluation metrics extracted from the largest rectangular region without oxide scale in a single billet image, aiming to assess the ability of different dehazing methods to suppress water mist interference. In Table 3, group 1 represents the maximum and average temperature differences between the mist-containing and mist-free images in this region, which can be used as a comparative baseline.
Table 3.
Analysis of the temperature curve of the largest rectangular region in a single image.
Figure 11 shows that the influence of water mist on the temperature measurement of the billet surface exhibits obvious spatial inhomogeneity, which is specifically reflected in the significant fluctuation of the temperature field in the rectangular region of a single-frame mist image. It also reveals that, through the processing of different dehazing networks, the impact of the water mist medium on the temperature measurement results gradually decreases. The dehazed results obtained using our method coincide with those obtained for the mist-free image, demonstrating the strongest ability to suppress water mist interference.
In Table 3, the dehazing results of the Unet network reduce the RMSE between the mist and mist-free images from 22.9 K to 12.8 K, the MTD from 41 K to 23 K, and the ATD from 22.1 to 11.9 K, which shows that Unet is effective for image dehazing. After adding the Transformer structure and the transmission prior to Unet, the RMSE, MTD, and ATD are further reduced to 4.7 K, 18 K, and 3.6 K, respectively, while the average RTE is also reduced from 1.67% to 0.27%. Notably, the curve in Figure 10 corresponds to the results of the tenth row in Figure 11, and the average RE in Table 2 is lower than that in Table 3, which further indicates the spatial inhomogeneity of the water mist distribution.
Figure 12 presents the temperature curve extracted from the same fixed coordinate over a 30 s continuous image sequence. The troughs in the curve correspond to temperature fluctuations caused by the thick oxide scale on the billet surface; the evaluation results are shown in Table 3.
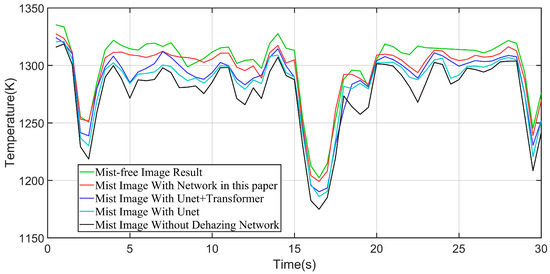
Figure 12.
Temperature curve of continuous images of 30 s time series.
Water mist significantly interfered with the temperature measurement of the billet surface over the time dimension. In each time series, the temperature curves derived from mist images generally appeared at the bottom of the corresponding subplots. After different dehazing models were applied, the interference caused by the water mist medium gradually diminished.
As shown in Table 4, the dehazing model proposed in this study exhibits excellent dehazing effectiveness along the time dimension. Specifically, the RMSE decreases from 25.9 K to 7.5 K; the MTD drops from the original 48.8 K to 23.1 K; the ATD reduces from 24.5 K to 6.6 K; and the average RTE declines from 1.88% to 0.43%. A comparison of the mist and mist-free images reveals that there are distinct temperature troughs near the 5th, 10th, and 25th seconds, which are caused by the time-varying water mist medium. The dehazing model used in this study produces a smoother temperature profile after dehazing, with these troughs effectively restored, outperforming the temperature measurement results obtained by the Unet and Unet + Transformer networks.
Table 4.
Analysis of the temperature curve in a time series continuous image.
To evaluate the effectiveness of the proposed dehazing method in mitigating the effects of water mist on billet surface temperature measurement in the secondary cooling zone, the same spatial coordinate point was selected from a continuous 200 s sequence of 200 frames. The RTE curves before and after dehazing were plotted to visually demonstrate the actual temperature improvement achieved by the dehazing process for mist images over the time dimension. The Relative Temperature Error curves are shown in Figure 13.
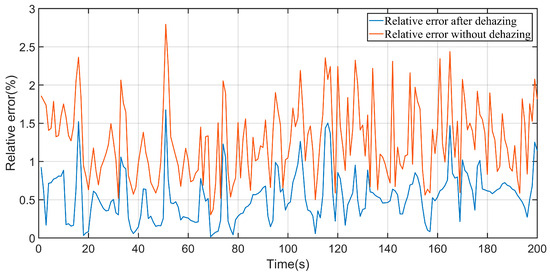
Figure 13.
Temperature relative error before and after dehazing.
Before dehazing, the maximum RTE is 2.79%, and the average RTE is 1.27%. After the application of the proposed dehazing method in this paper, the maximum RTE is reduced to 1.67% and the average RTE is reduced to 0.53%. Compared with the results obtained prior to dehazing, the maximum RTE is reduced by 1.73% and the average RTE is reduced by 0.74%. The dehazing method of Unet and Unet + Transformer lies between the two and is not plotted in Figure 13 for clarity.
Meanwhile, temperature measurement experiments with different steel grades, different casting speeds, and different water flow rates were conducted in the steel plant.
During the actual temperature measurement process, two steel grades representing typical continuous casting processes—high-carbon steel and medium-carbon steel—were selected for the experiment. Their respective designations are GCr15 (bearing steel) and S45CTi (crankshaft steel). The GCr15 steel adopted the hard cooling mode, while the S45CTi steel used the soft cooling mode. The continuous casting process conditions for both materials are detailed in Table 5. Notably, the cooling water flow rate achieved using the hard cooling mode was higher than that achieved via the soft cooling mode.
Table 5.
Continuous casting conditions of GCr15 and S45CTi.
Figure 14 presents the measured surface temperature curves of GCr15 and S45CTi billets under stable continuous casting process conditions. The calculation process prevents large pieces of scale from influencing the billet surface.
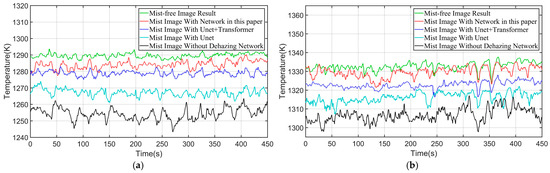
Figure 14.
(a) Surface temperature of GCr15. (b) Surface temperature of S45CTi.
The figure shows that the GCr15 steel grade adopts the hard cooling mode with a large cooling water flow rate, and the billet temperature ranges from 1250 K to 1290 K. In contrast, the S45CTi steel grade uses the soft cooling mode with a small cooling water flow rate, and its billet temperature ranges from 1300 K to 1330 K. Meanwhile, due to the difference in cooling water flow rates, the influence of the water mist medium on temperature measurement is greater for GCr15 than for S45CTi.
The temperature measurement results of the GCr15 steel grade were selected for analysis, as shown in Table 6. For a continuous time-series image sequence with a total of 450 frames, in comparison with the Unet + Transformer and Unet methods, the RMSE of the dehazing method proposed in this paper gradually decreases from 22.5 K to 6.0 K, the MTD gradually decreases from 28.2 K to 12.2 K, the ATD gradually decreases from 22.4 K to 5.6 K, and the average RTE gradually decreases from 1.74 to 0.45. This demonstrates the effectiveness of the dehazing algorithm proposed in this paper.
Table 6.
Analysis of the temperature curve in time series of GCr15.
Meanwhile, to investigate whether the billet surface temperature can respond promptly when the continuous casting process parameters change, experimental studies on variable casting speeds and variable water flow rates were also conducted on-site. The experimental results are shown in Figure 15:
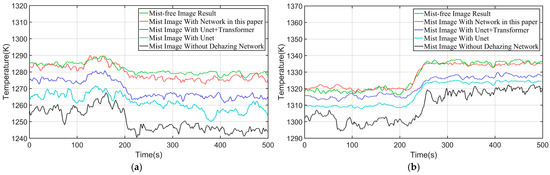
Figure 15.
(a) The surface temperature of GCr15 with flow rates increased; (b) the surface temperature of S45CTi with the casting speed increased.
Figure 15a shows that for the GCr15 steel grade, when the water flow rate in zone 4 increased from 6.6 L/min to 6.9 L/min at 100 s, the billet surface temperature decreased from 1283 K to approximately 1275 K as the water flow rate increased. This is mainly because the increase in water cooling led to a rise in the equivalent cooling water flow rate of the billet, thereby causing a temperature drop.
Figure 15b shows that for the S45CTi steel grade, when the casting speed increased from 0.48 m/min to 0.51 m/min at 220 s, the billet surface temperature increased from 1320 K to approximately 1336 K as the casting speed increased. This is mainly because the increase in casting speed resulted in a reduction in the equivalent cooling time of the billet, thereby causing a temperature rise.
The temperature measurement results of the S45CTi steel grade with increased casting speed were selected for analysis, as shown in Table 7. For a continuous time-series image sequence with a total of 500 frames, the RMSE, MTD, ATD, and average RTE of the dehazing method proposed in this paper, along with those of Unet + Transformer and Unet, all significantly decreased. This demonstrates the effectiveness of our proposed algorithm.
Table 7.
Analysis of the temperature of S45CTi with the casting speed increased.
A comparison with the temperature measurement results of the GCr15 steel grade in Table 7 shows that since the S45CTi steel grade used the soft cooling mode, its cooling water flow rate was lower than that of the GCr15 steel grade, and thus the influence of water mist was weaker, which is consistent with the temperature measurement results.
The above analysis indicates that the proposed network based on Unet + Transformer + transmittance prior effectively reduces the interference caused by water mist on billet surface temperature measurement in both the spatial and temporal dimensions. Compared with the Unet and Unet + Transformer network architectures, the dehazing performance is significantly improved, verifying our proposed model’s practical value and reliability for billet surface temperature measurement tasks.
According to the billet dehazing algorithm studied in this paper, a complete billet surface temperature measurement system can be developed in the future and applied to the secondary cooling zone of continuous casting production sites. This system can provide a billet surface temperature for feedback control in the continuous casting process, realize closed-loop control of the secondary cooling, and improve and stabilize the quality of billet products.
4. Conclusions
In response to the problem of billet surface temperature measurement errors caused by scattering and absorption of water mist in the secondary cooling zone of continuous casting, this paper proposes a model that attenuates the radiation of billets in the secondary cooling zone; designs and implements a billet image dehazing network; and analyzes the effectiveness of the method. The main conclusions are as follows:
The radiation characteristics of the water mist medium in the secondary cooling zone were analyzed, the expression for the composite transmittance of the water mist medium was derived, and a radiation attenuation model for the billet in the secondary cooling zone was established.
A billet image dehazing method based on the billet radiation attenuation model, deep learning, and composite transmittance prior was designed and implemented. In the feature extraction stage, a Transformer structure with multi-head attention was introduced into the bottom layer of the Unet to fully extract key local feature information; in the prior fusion stage, the extracted features were processed through self-attention, and then the transmittance prior was fused with the processed features using spatial domain attention; in the transmittance estimation stage, a multi-path dense network was used to more effectively utilize information at different scales.
Finally, the effectiveness of image dehazing was evaluated by comparing different dehazing models using metrics such as RMSE, Maximum Temperature Difference, Average Temperature Difference, and Average Relative Error. Our results show that the proposed method outperforms other methods in terms of temperature results across various models, effectively reducing the influence of water mist on billet surface temperature measurement and demonstrating a good practical performance.
Author Contributions
Conceptualization, Z.H. and W.W.; methodology, Z.H. and W.W.; software, Z.H.; validation, Z.H., H.M. and J.Y.; data curation, J.Y.; writing—original draft preparation, Z.H.; writing—review and editing, Z.H.; visualization, H.M.; funding acquisition, J.Y. All authors have read and agreed to the published version of the manuscript.
Funding
This research was funded by the National Natural Science Foundation of China, grant number 62573097.
Institutional Review Board Statement
Not applicable.
Informed Consent Statement
Not applicable.
Data Availability Statement
The raw data of this article inquiries can be directed to the corresponding author.
Acknowledgments
We would like to thank Nanjing Iron and Steel Company Limited for their assistance in conducting on-site experiments and collecting the original data.
Conflicts of Interest
The authors declare no conflict of interest.
Abbreviations
The following abbreviations are used in this manuscript:
| CMOS | Complementary Metal Oxide Semiconductor |
| RMSE | Root Mean Square Error. |
| MTD | Maximum Temperature Difference. |
| ATD | Average Temperature Difference. |
| RTE | Relative Temperature Error. |
| Nomenclature | |
| attenuation coefficient with wavelength | |
| constant attenuation coefficient | |
| path attenuation coefficient | |
| radiation received by the camera | |
| total irradiance on the surface of the casting billet | |
| distance of water mist path | |
| irradiance on the surface of the casting billet | |
| water mist path transmittance | |
| current value of the pixel | |
| photoelectric conversion coefficient of the camera | |
| radiation from billet | |
| exposure time | |
| pixel value of the camera | |
| conversion coefficient from the current value to the pixel value | |
| position of the pixel in the image | |
| pixel value of the water mist image | |
| pixel value of the mist-free image | |
| central wavelengths of near-infrared camera channel | |
| central wavelengths of red camera channel | |
| central wavelengths of green camera channel | |
| central wavelengths of blue camera channel | |
| gray value of the image collected by the camera channel | |
| spectral emissivity | |
| K | the instrument constant |
| c2 | Planck’s second radiation constant |
| estimated path transmittance | |
| estimated mist-free billet image | |
| temperature field of the dehazed billet image | |
| water mist feature output by the self-attention structure | |
| transmittance priors processed through a series of convolutional layers | |
| are subjected to a weighted summation | |
| absolute temperature error | |
| temperature calculated from the water mist-dehazed billet image | |
| temperature calculated based on the corresponding mist-free billet image | |
| image distortion coefficient | |
| normalized temperature error matrix | |
| ρ | |
| maximum temperature difference | |
| average temperature difference | |
| the number of pixel points in the evaluation region | |
| relative temperature error | |
References
- Tian, G.; Li, B.; Mo, D.; Xu, J. Systematic Study on the Thermal Performance of Casting Slab Under Varying Environmental Conditions. Metals 2025, 15, 967. [Google Scholar] [CrossRef]
- Wang, J.; Xie, Z.; Che, X. Development of a Novel Pyrometer by Eliminating the Uncertainty of Emissivity Using Reflector with Two Apertures in Medium Plate Rolling Process. Actuators 2022, 11, 188. [Google Scholar] [CrossRef]
- MiŁKowska-Piszczek, K.; DroŻDŻ, P.; Rywotycki, M.; Krajewski, P.; PrzegraŁEk, P. Methods of Surface Temperature Measurement for the Casting Billet in the Continuous Casting Process under Industrial Conditions. In Proceedings of the METAL 2019 Conference Proeedings, Brno, Czech Republic, 22–24 May 2019; pp. 770–775. [Google Scholar]
- Švantner, M.; Vacíková, P.; Honner, M. Non-contact charge temperature measurement on industrial continuous furnaces and steel charge emissivity analysis. Infrared Phys. Technol. 2013, 61, 20–26. [Google Scholar] [CrossRef]
- Huang, Y.; Long, M.; Fan, H.; Gui, L.; Chen, D.; Duan, H. Quantifying the Effects of Combustion Gases’ Radiation on Surface Temperature Measurements Using Two-Color Pyrometry. Energy Fuels 2019, 33, 3610–3619. [Google Scholar] [CrossRef]
- Rosso, L.; Tabandeh, S.; Beltramino, G.; Fernicola, V. Validation of phosphor thermometry for industrial surface temperature measurements. Meas. Sci. Technol. 2019, 31, 034002. [Google Scholar] [CrossRef]
- Zhang, Y.; Lang, X.; Hu, Z.; Shu, S. Development of a CCD-based pyrometer for surface temperature measurement of casting billets. Meas. Sci. Technol. 2017, 28, 065903. [Google Scholar] [CrossRef]
- Yu, R.; Lu, J.; Zhao, Z.; Han, J.; Bai, L. Research on CMT Welding Temperature Field Detection Technology Based on Color CCD. In Proceedings of the 3rd International Conference on Electronic Information Technology and Computer Engineering, Xiamen, China, 18–20 October 2019; pp. 1361–1365. [Google Scholar]
- Bai, H. Research on measurement of high temperature fields with equal precision for commercial CCD cameras. Meas. Sci. Technol. 2017, 28, 085002. [Google Scholar] [CrossRef]
- Yan, J.; Bai, X. Research on slab surface temperature-measurement of continuous casting based on CCD imaging. In Proceedings of the IEEE 10th International Conference on Electronic Measurement & Instruments, Chengdu, China, 16–19 August 2011; pp. 29–32. [Google Scholar]
- Jiaocheng, M.; Jun, L.; Qiang, Y.; Liangyu, C. The Temperature Field Measurement of Billet Based on Multi-Information Fusion. Mater. Trans. 2014, 55, 1319–1323. [Google Scholar] [CrossRef]
- Zhang, Y.; Wen, Z.; Zhao, Z.; Bi, C.; Guo, Y.; Huang, J. Laboratory Experimental Setup and Research on Heat Transfer Characteristics during Secondary Cooling in Continuous Casting. Metals 2019, 9, 61. [Google Scholar] [CrossRef]
- Huang, Y.; Long, M.; Chen, D.; Duan, H.; Tan, K.; Gui, L.; Liu, T. A new wavelength selection criterion for two-color pyrometer interfered with participating media. Infrared Phys. Technol. 2018, 93, 136–143. [Google Scholar] [CrossRef]
- Qi, P.; Wang, G.; Gao, Z.; Liu, X.; Liu, W. Measurements of Temperature Distribution for High Temperature Steel Plates Based on Digital Image Correlation. Materials 2019, 12, 3322. [Google Scholar] [CrossRef]
- Shi, X.; Ming, Y.; Ju, L.; Chen, S. Study on the Robustness of an Atmospheric Scattering Model under Single Transmittance. Photonics 2024, 11, 515. [Google Scholar] [CrossRef]
- Nayar, S.K.; Narasimhan, S.G. Vision in bad weather. In Proceedings of the 7th IEEE International Conference on Computer Vision, Kerkyra, Greece, 20–27 September 1999; pp. 820–827. [Google Scholar]
- Kaiming, H.; Jian, S.; Xiaoou, T. Single image haze removal using dark channel prior. In Proceedings of the IEEE Conference on Computer Vision and Pattern Recognition, Miami, FL, USA, 20–25 June 2009; pp. 1956–1963. [Google Scholar]
- Thomas, J.; Raj, E.D. Improved image dehazing model with color correction transform-based dark channel prior. Vis. Comput. 2024, 40, 8767–8790. [Google Scholar] [CrossRef]
- Wu, L.; Chen, J.; Chen, S.; Yang, X.; Xu, L.; Zhang, Y.; Zhang, J. Hybrid Dark Channel Prior for Image Dehazing Based on Transmittance Estimation by Variant Genetic Algorithm. Appl. Sci. 2023, 13, 4825. [Google Scholar] [CrossRef]
- Li, B.; Peng, X.; Wang, Z.; Xu, J.; Feng, D. AOD-Net: All-in-One Dehazing Network. In Proceedings of the IEEE International Conference on Computer Vision, Venice, Italy, 22–29 October 2017; pp. 4780–4788. [Google Scholar]
- Li, B.; Ren, W.; Fu, D.; Tao, D.; Feng, D.; Zeng, W.; Wang, Z. Benchmarking Single Image Dehazing and Beyond. IEEE Trans. Image Process. 2018, 28, 492–505. [Google Scholar] [CrossRef]
- Zhang, H.; Patel, V.M. Densely Connected Pyramid Dehazing Network. In Proceedings of the IEEE/CVF Conference on Computer Vision and Pattern Recognition, Salt Lake City, UT, USA, 18–23 June 2018; pp. 3194–3203. [Google Scholar]
- Zhou, H.; Chen, Z.; Li, Q.; Tao, T. Dehaze-UNet: A Lightweight Network Based on UNet for Single-Image Dehazing. Electronics 2024, 13, 2082. [Google Scholar] [CrossRef]
- Bolun, C.; Xiangmin, X.; Kui, J.; Chunmei, Q.; Dacheng, T. DehazeNet: An End-to-End System for Single Image Haze Removal. IEEE Trans. Image Process. 2016, 25, 5187–5198. [Google Scholar]
- Ullah, H.; Muhammad, K.; Irfan, M.; Anwar, S.; Sajjad, M.; Imran, A.S.; de Albuquerque, V.H.C. Light-DehazeNet: A Novel Lightweight CNN Architecture for Single Image Dehazing. IEEE Trans. Image Process. 2021, 30, 8968–8982. [Google Scholar] [CrossRef]
- He, J.; Li, R. Alpha-DehazeNet: Single image dehazing via RGBA haze modeling and adaptive learning. PeerJ Comput. Sci. 2025, 11, 3036. [Google Scholar] [CrossRef]
- Pang, Y.; Nie, J.; Xie, J.; Han, J.; Li, X. BidNet: Binocular Image Dehazing Without Explicit Disparity Estimation. In Proceedings of the IEEE/CVF Conference on Computer Vision and Pattern Recognition, Seattle, WA, USA, 13–19 June 2020; pp. 5930–5939. [Google Scholar]
- Jiao, Q.; Liu, M.; Ning, B.; Zhao, F.; Dong, L.; Kong, L.; Hui, M.; Zhao, Y. Image Dehazing Based on Local and Non-Local Features. Fractal Fract. 2022, 6, 262. [Google Scholar] [CrossRef]
- Yang, Y.; Wang, C.; Guo, X.; Tao, D. Robust Unpaired Image Dehazing via Density and Depth Decomposition. Int. J. Comput. Vis. 2023, 132, 1557–1577. [Google Scholar] [CrossRef]
- Du, Y.; Li, J.; Sheng, Q.; Zhu, Y.; Wang, B.; Ling, X. Dehazing network: A symmetric Unet Based on physical model. IEEE Trans. Geosci. Remote Sens. 2024, 62, 5607412. [Google Scholar] [CrossRef]
- Jian, H.; Zhang, Y.; Gao, W.; Wang, B.; Wang, G. Dual-branch feature fusion dehazing network via multispectral channel attention. Int. J. Mach. Learn. Cybern. 2024, 15, 2655–2671. [Google Scholar] [CrossRef]
- Sun, H.; Liang, X.; Ma, W.; Guo, J.; Wang, J.; Qiu, C.; Sun, X. Retrieval of high-temperature field under strong diffusive mist medium via multi-spectral infrared imaging. Spectrosc. Spectr. Anal. 2024, 42, 2702–2708. [Google Scholar]
- Wang, P.; Xie, Z.; Hu, Z. Study on the Multi-wavelength Emissivity of GCr15 Steel and its Application on Temperature Measurement for Continuous Casting Billets. Int. J. Thermophys. 2016, 37, 129. [Google Scholar] [CrossRef]
Disclaimer/Publisher’s Note: The statements, opinions and data contained in all publications are solely those of the individual author(s) and contributor(s) and not of MDPI and/or the editor(s). MDPI and/or the editor(s) disclaim responsibility for any injury to people or property resulting from any ideas, methods, instructions or products referred to in the content. |
© 2025 by the authors. Licensee MDPI, Basel, Switzerland. This article is an open access article distributed under the terms and conditions of the Creative Commons Attribution (CC BY) license (https://creativecommons.org/licenses/by/4.0/).