You are currently viewing a new version of our website. To view the old version click .
Applied Sciences
  • Article
  • Open Access

11 November 2025

Research on In-Cylinder Pressure Monitoring Method of Diesel Engine Based on LSTM

,
,
,
and
1
School of Energy and Power Engineering, North University of China, Taiyuan 030051, China
2
School of Mechanical and Electrical Engineering, North University of China, Taiyuan 030051, China
*
Author to whom correspondence should be addressed.
This article belongs to the Section Applied Physics General

Abstract

The variation in in-cylinder pressure of diesel engine directly determines its working performance; therefore, the real-time monitoring technology for in-cylinder pressure of diesel engine is of great significance for monitoring the operation status of diesel engine. However, restricted by factors such as technology and cost, it is often impossible to monitor the in-cylinder pressure data of diesel engine during actual operation. To solve the above problem, this paper proposes an in-cylinder pressure curve monitoring model for diesel engine based on GRU (Gated Recurrent Unit), using easily collectible data signals such as crankshaft torque, crankshaft angle, and displacement of each cylinder as the basis. The correctness and accuracy of the above monitoring model are trained and verified using data obtained from bench tests, and a comparison is made with the commonly used in-cylinder pressure monitoring method based on simulation model. The results show that the diesel engine in-cylinder pressure monitoring model proposed in this paper has advantages such as high monitoring accuracy and fast calculation speed.

1. Introduction

During the operation of a diesel engine, the variation in in-cylinder pressure directly determines the output torque and power of the diesel engine. The analysis of the in-cylinder pressure curve is one of the important indicators for evaluating the performance of diesel engines. Through the research and analysis of the in-cylinder pressure curve, the performance characteristics of combustion, heat transfer, fuel injection, and intake-exhaust processes during its operation can be obtained; it can also be used to calculate other key performance parameters. On the other hand, the in-cylinder pressure is not completely stable but exhibits certain pressure fluctuations. The amplitude, frequency, and pattern of such fluctuations directly reflect the stability and uniformity of the diesel engine’s combustion process []. When the diesel engine encounters faults related to the in-cylinder working process, such as insufficient intake pressure or intake air volume, incomplete combustion, or cylinder air leakage, the in-cylinder pressure curve can also provide a reference for fault diagnosis. Due to the importance of the in-cylinder pressure curve, real-time monitoring of the in-cylinder pressure of diesel engine is of great significance in practical engineering applications. On the test bench, the in-cylinder pressure data of each cylinder can be accurately collected by drilling holes and installing in-cylinder pressure sensors. However, this method cannot be applied in engineering due to problems such as high cost, limited sensor service life and accuracy, and impact on the cylinder head structure.
Traditional methods mainly use simulation methods or collect vibration signals to obtain in-cylinder pressure data through mathematical methods, but both methods have problems in certain aspects [,,]. The simulation method represented by simulation software such as GT-POWER V2020 has a long solution time, and it often takes dozens of minutes to calculate the in-cylinder working process once. In addition, the error of the simulation model is relatively large. The diesel engine is a complex machine composed of multiple complex systems, so it is difficult to fully reproduce it on the simulation software. Coupled with the interference of factors such as experimental errors and simulation errors, the simulation of the in-cylinder pressure curve always has an error of about 5%, and especially when approaching the maximum pressure, the error is larger [,,]. Moreover, the simulation software cannot be deployed for calculation on ordinary host computers or single-chip microcomputers, which further limits its application scope. The in-cylinder pressure monitoring method that uses collected vibration signals combined with local wave, wavelet analysis, transfer function, or other neural networks has high requirements for the collection quality of vibration signals, complex signal preprocessing, and requires the arrangement of multiple sensors, resulting in high costs in engineering applications. In addition, the error is larger than that of simulation. Depending on the working conditions and the mathematical methods used, the error near the maximum pressure ranges from 8% to 12%, and the maximum error at other positions can reach more than 150% [,,].
To solve the above problems, this paper establishes a diesel engine in-cylinder pressure curve monitoring model that can quickly and accurately monitor the variation in in-cylinder pressure, based on easily collectible data signals and combined with algorithms suitable for processing time series. Different from vibration signals, crankshaft torque, crankshaft angle, and displacement of each cylinder are relatively easy to collect—only sensors need to be arranged at the free end of the crankshaft. The collected signals are not interfered by factors such as vibration, so they have high quality. In addition, the above data are directly related to the variation in in-cylinder pressure. Therefore, this paper constructs a monitoring model based on these three time series: crankshaft torque, crankshaft angle, and displacement of each cylinder.
In recent years, deep learning technologies represented by Deep Neural Networks (DNN), Convolutional Neural Networks (CNN), and Back Propagation (BP) neural networks have achieved rapid development in fields such as image recognition, geological exploration, and hydrological monitoring. Meanwhile, traditional algorithms represented by Support Vector Machines (SVM) have also demonstrated excellent performance in handling small-scale monitoring tasks [,,,,,]. However, these monitoring methods are limited by their inherent “single-input-single-output” structure—input at the previous moment cannot affect the current input, making it difficult to process sequential data. This limitation prevents their application in scenarios such as text analysis, audio processing, and video recognition, where sequential data is typically required as input [,,]. To address this challenge, Recurrent Neural Networks (RNN) emerged. Unlike traditional neural networks, RNN adopts a recurrently interconnected structural system, which enables it to integrate current input and historical input information to update its current state. Currently, unidirectional RNNs and bidirectional RNNs have achieved remarkable results in fields such as computer vision, natural language processing, computational biology, and earth sciences. Nevertheless, due to structural constraints, when there are significant differences between relevant input data, RNNs encounter the “long-term dependency problem,” where they fail to associate key information. Although, theoretically, this problem can be avoided by optimizing parameters, it is difficult to implement in practical applications. For this reason, Hochreiter et al. proposed Long Short-Term Memory (LSTM) networks, which solve the long-term dependency problem by restructuring the network architecture [].
To further improve the performance of neural networks, scholars have conducted multi-directional research on optimizing LSTM architecture in recent years. Among these efforts, Zhou et al. proposed the Minimal Gated Unit (MGU), which can implement the core functions of LSTM using only a single gating unit, effectively reducing the number of parameters in the network unit. Inspired by biological mechanisms, Rahman et al. introduced a structural variant into the LSTM unit and proposed the “biologically inspired variant LSTM.” By adjusting the update method of the unit state, this variant significantly enhances the information storage capacity of the LSTM unit. Pulver et al. introduced LSTM with working memory, replacing the forget gate with a functional layer, and the input of the functional layer is determined by the previous storage unit value. In addition, the academic community has proposed various other LSTM variant structures, such as adding “peephole connections” and using coupled forget gates and input gates. However, most of these variants are only suitable for specific types of datasets. To date, no variant has been able to comprehensively outperform the basic LSTM in terms of overall performance. Among the various improvement directions, Cho et al. focused on reducing computational costs and simplifying the network structure, and proposed the Gated Recurrent Unit (GRU), which provides a new approach for the development of lightweight recurrent neural networks. It realizes the function of LSTM by combining the forget gate and the input gate into a single update gate. Essentially, it is a variant of LSTM with a forget gate. Although the lack of one gate makes it unable to solve problems where the upper and lower data may be irrelevant (such as translation), under the condition of roughly the same number of parameters, the performance of LSTM and GRU is equivalent, both superior to traditional RNN, and the structure is simpler. This is very suitable for solving the diesel engine in-cylinder pressure monitoring problem addressed in this paper, and its simple structure is also suitable for future transplantation to single-chip microcomputers to establish a real-time monitoring system for diesel engine performance. Therefore, this paper selects GRU to establish the diesel engine in-cylinder pressure monitoring model.
In summary, this paper establishes a diesel engine in-cylinder pressure monitoring model based on the easily collectible data signals (crankshaft torque, crankshaft angle, and displacement of each cylinder) obtained from bench tests and combined with GRU algorithm (a variant of LSTM). The monitoring error of this model for the diesel engine in-cylinder pressure curve under different operating states is verified, and a comparison is made with the in-cylinder pressure error obtained from the simulation model and the in-cylinder pressure error fitted by vibration signals obtained from the relevant literature, thus verifying the correctness and accuracy of the proposed monitoring model.

2. Establishment of Diesel Engine Test Bench and One-Dimensional Simulation Model

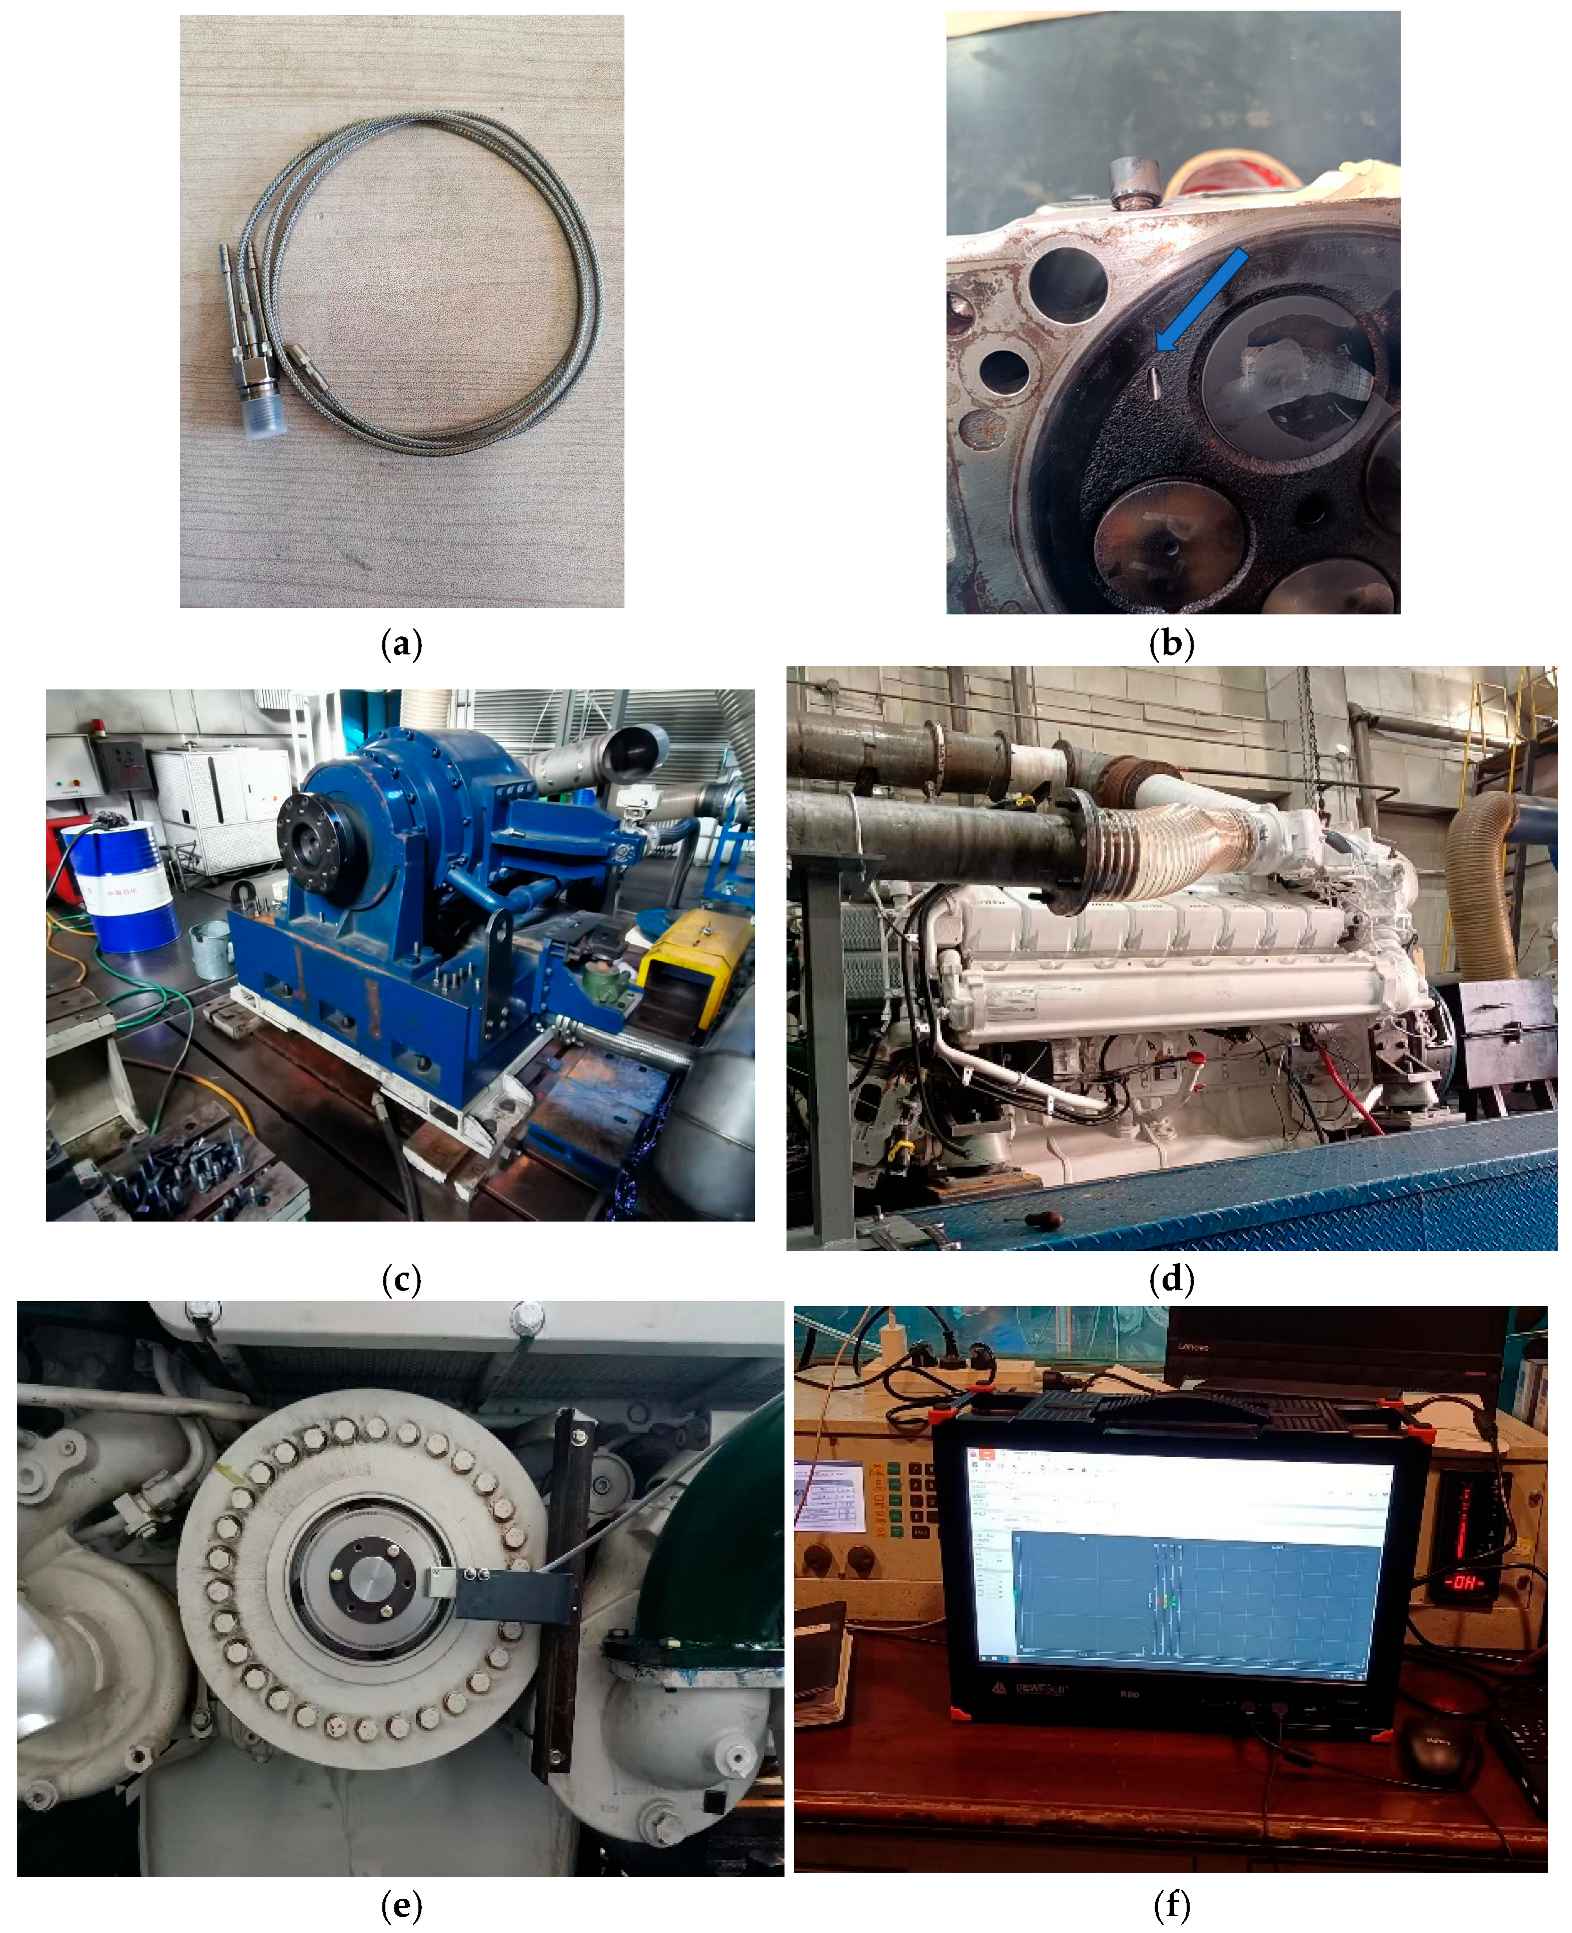
This paper takes a V-type 16-cylinder turbocharged diesel engine as the research object, whose basic structure and technical parameters are shown in Table 1. Relevant data such as in-cylinder pressure curves, crankshaft torque, crankshaft angle, and displacement of each cylinder were collected at a sampling frequency of 5000 Hz. The diesel engine test bench is shown in Figure 1. Figure 1a depicts the cylinder pressure sensor, which is inserted into the cylinder through the hole penetrating the cylinder head indicated by the blue arrow in Figure 1b. Figure 1c shows the dynamometer of the engine test bench, where the sensor required for torque acquisition is integrated into this equipment. In this paper, MATLAB R2020b was used to construct various mathematical models, and GT-power V7.5 was employed to establish a one-dimensional simulation model of the diesel engine. The operating environment of the above software is Windows 10, and the workstation configuration is as follows: Intel C621 series chipset; Intel Xeon Gold 6145 processor (40 cores and 80 threads, with a base frequency of 2.0 GHz and a maximum turbo frequency of 3.7 GHz); 128 GB RAM; NVIDIA GT1030 graphics card with 2 GB memory.
Table 1. Basic data of the diesel engine.
Figure 1. Test bench. (a) Cylinder pressure sensor; (b) cylinder pressure sensor placement location; (c) output torque sensor (dynamometer); (d) diesel engine test bench; (e) crankshaft angle sensor at free end; (f) in-cylinder pressure, torque, and angle collector.
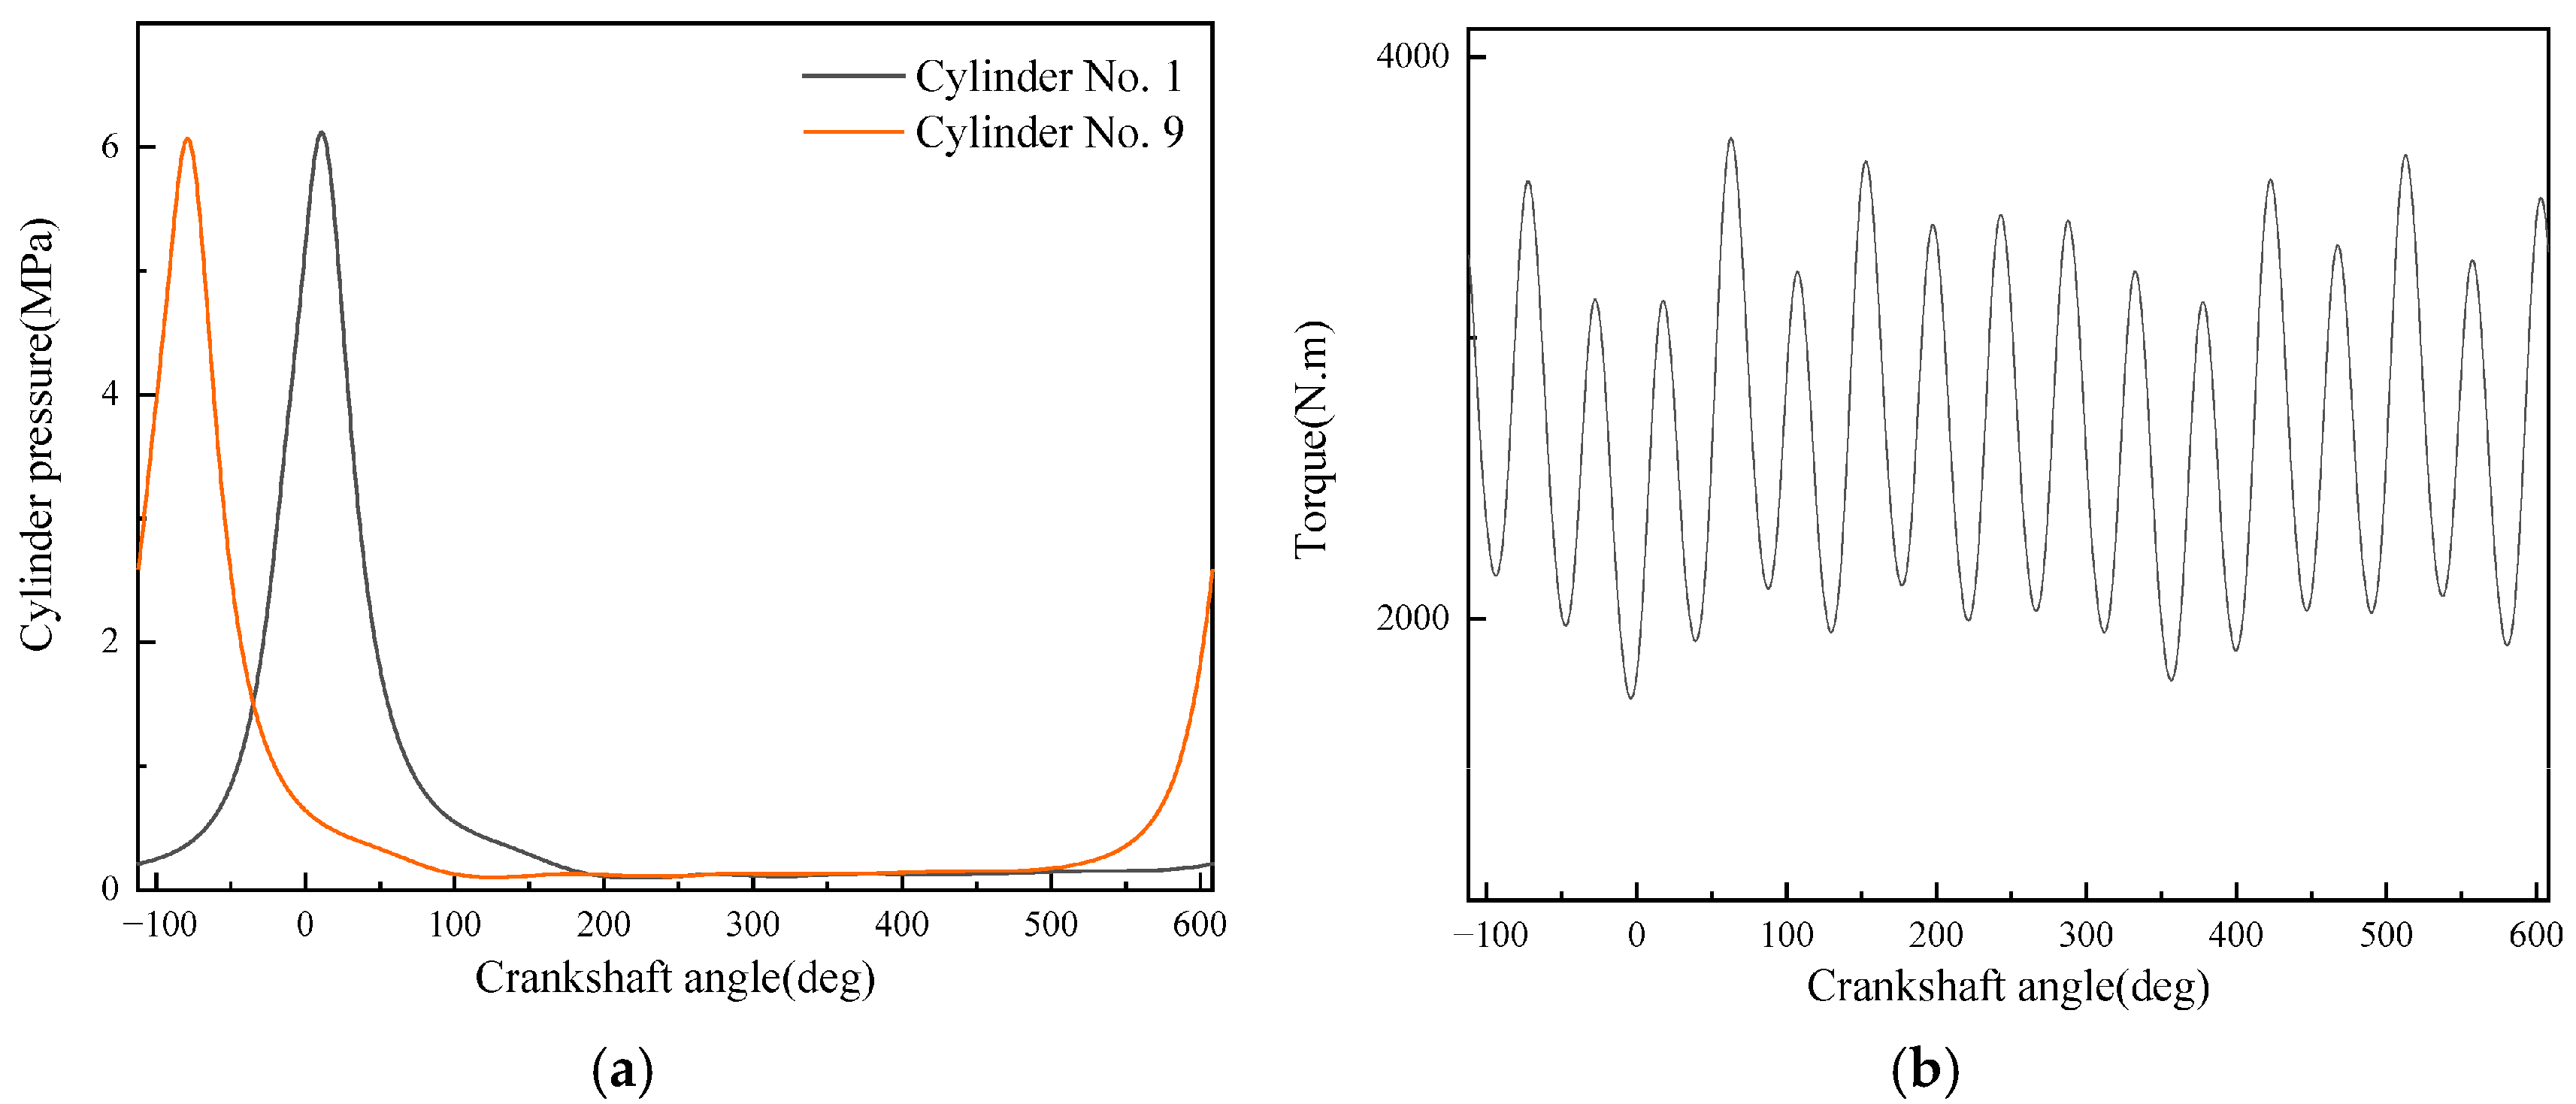
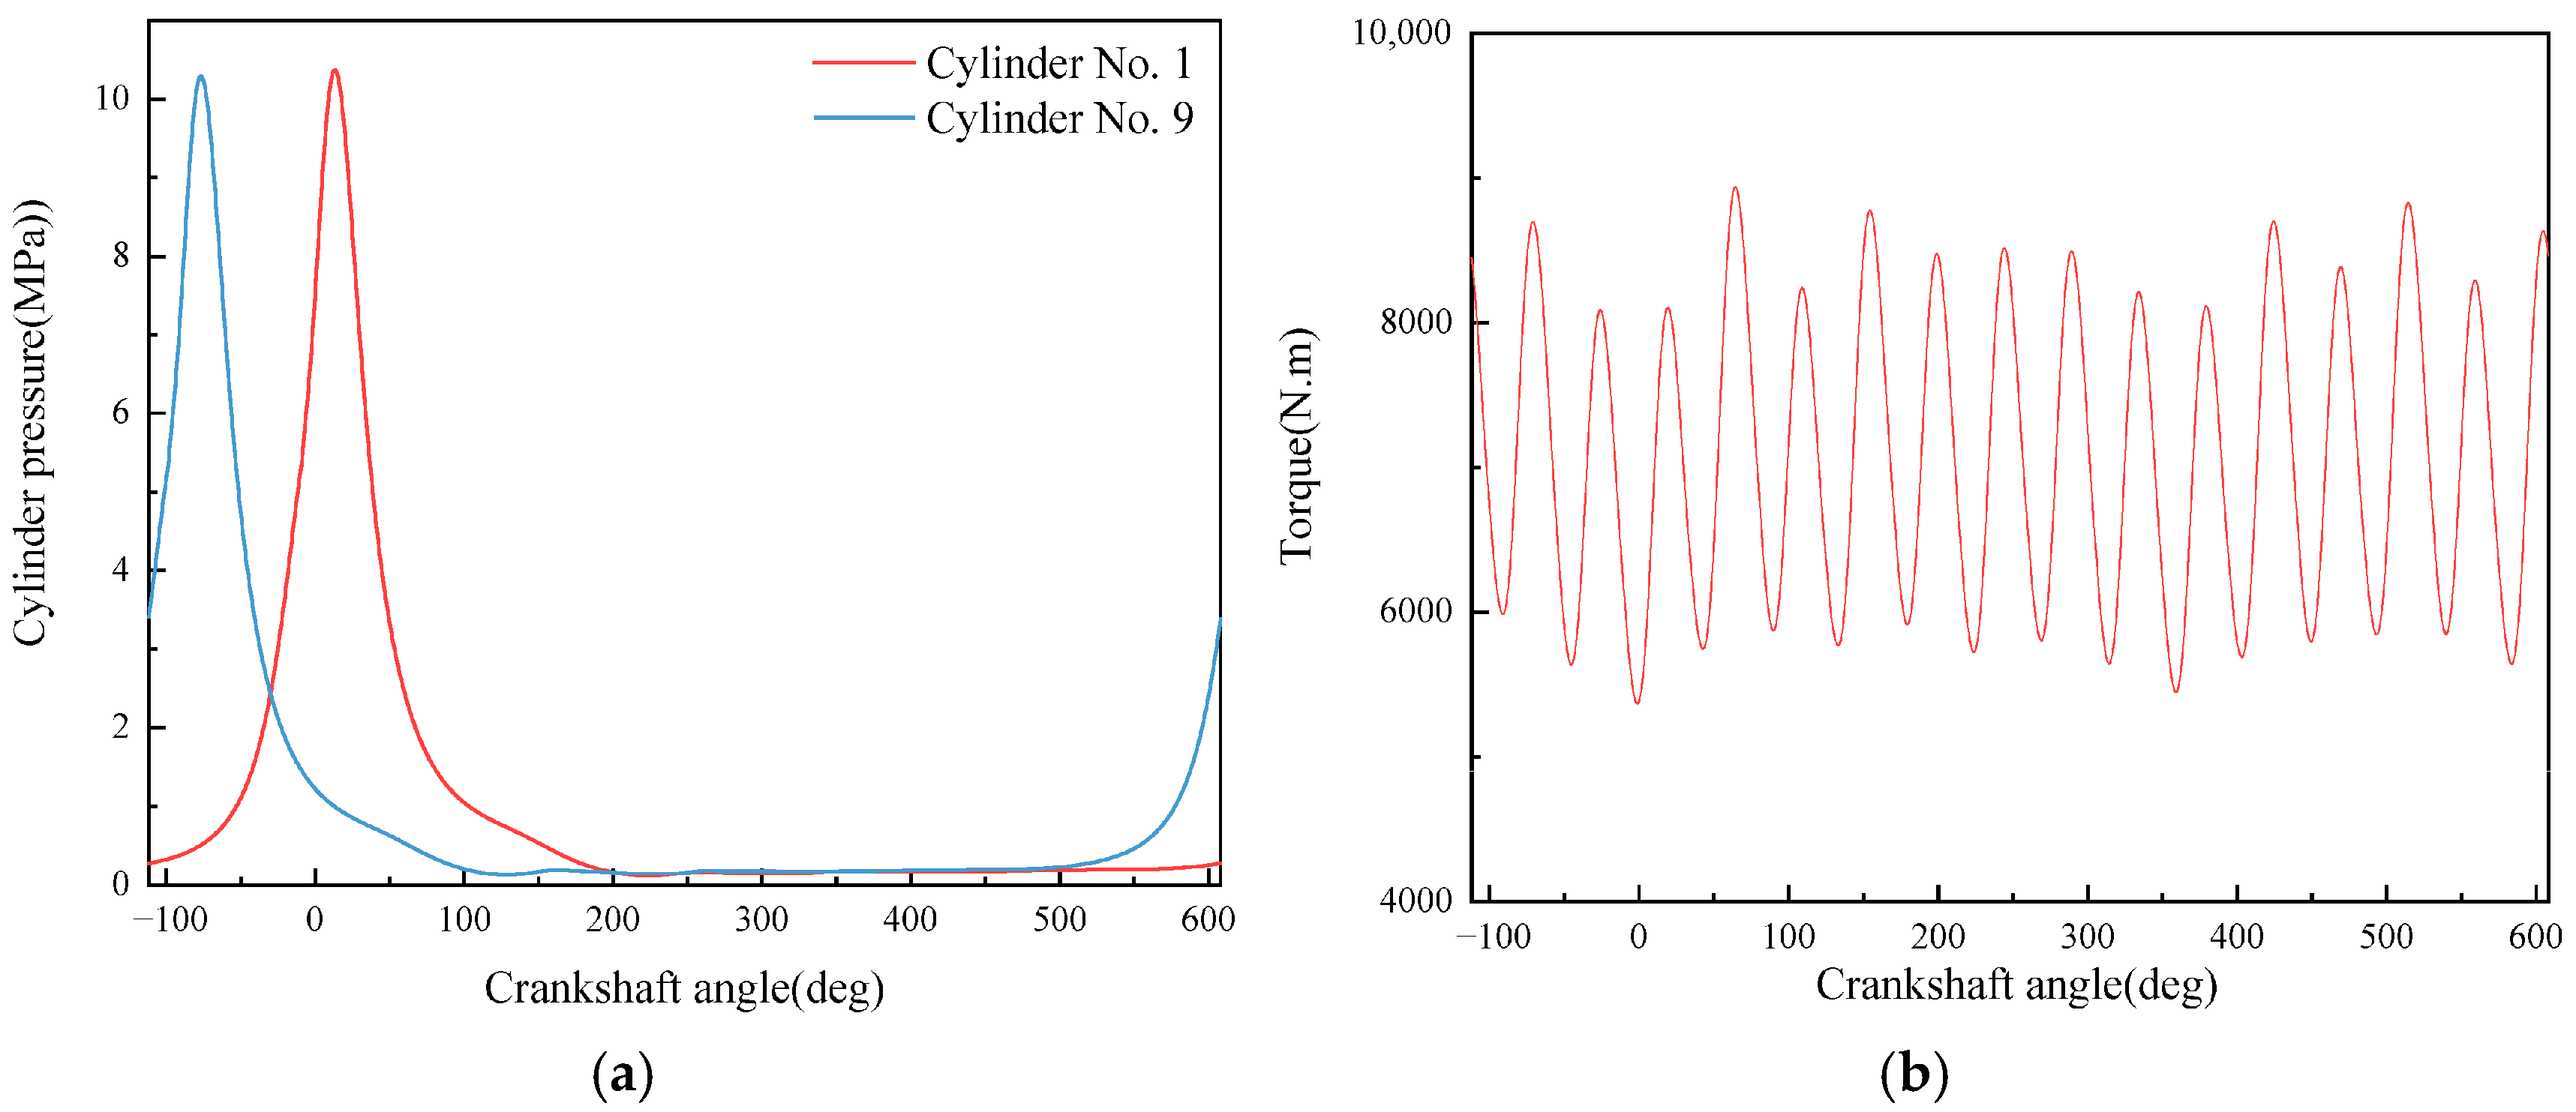
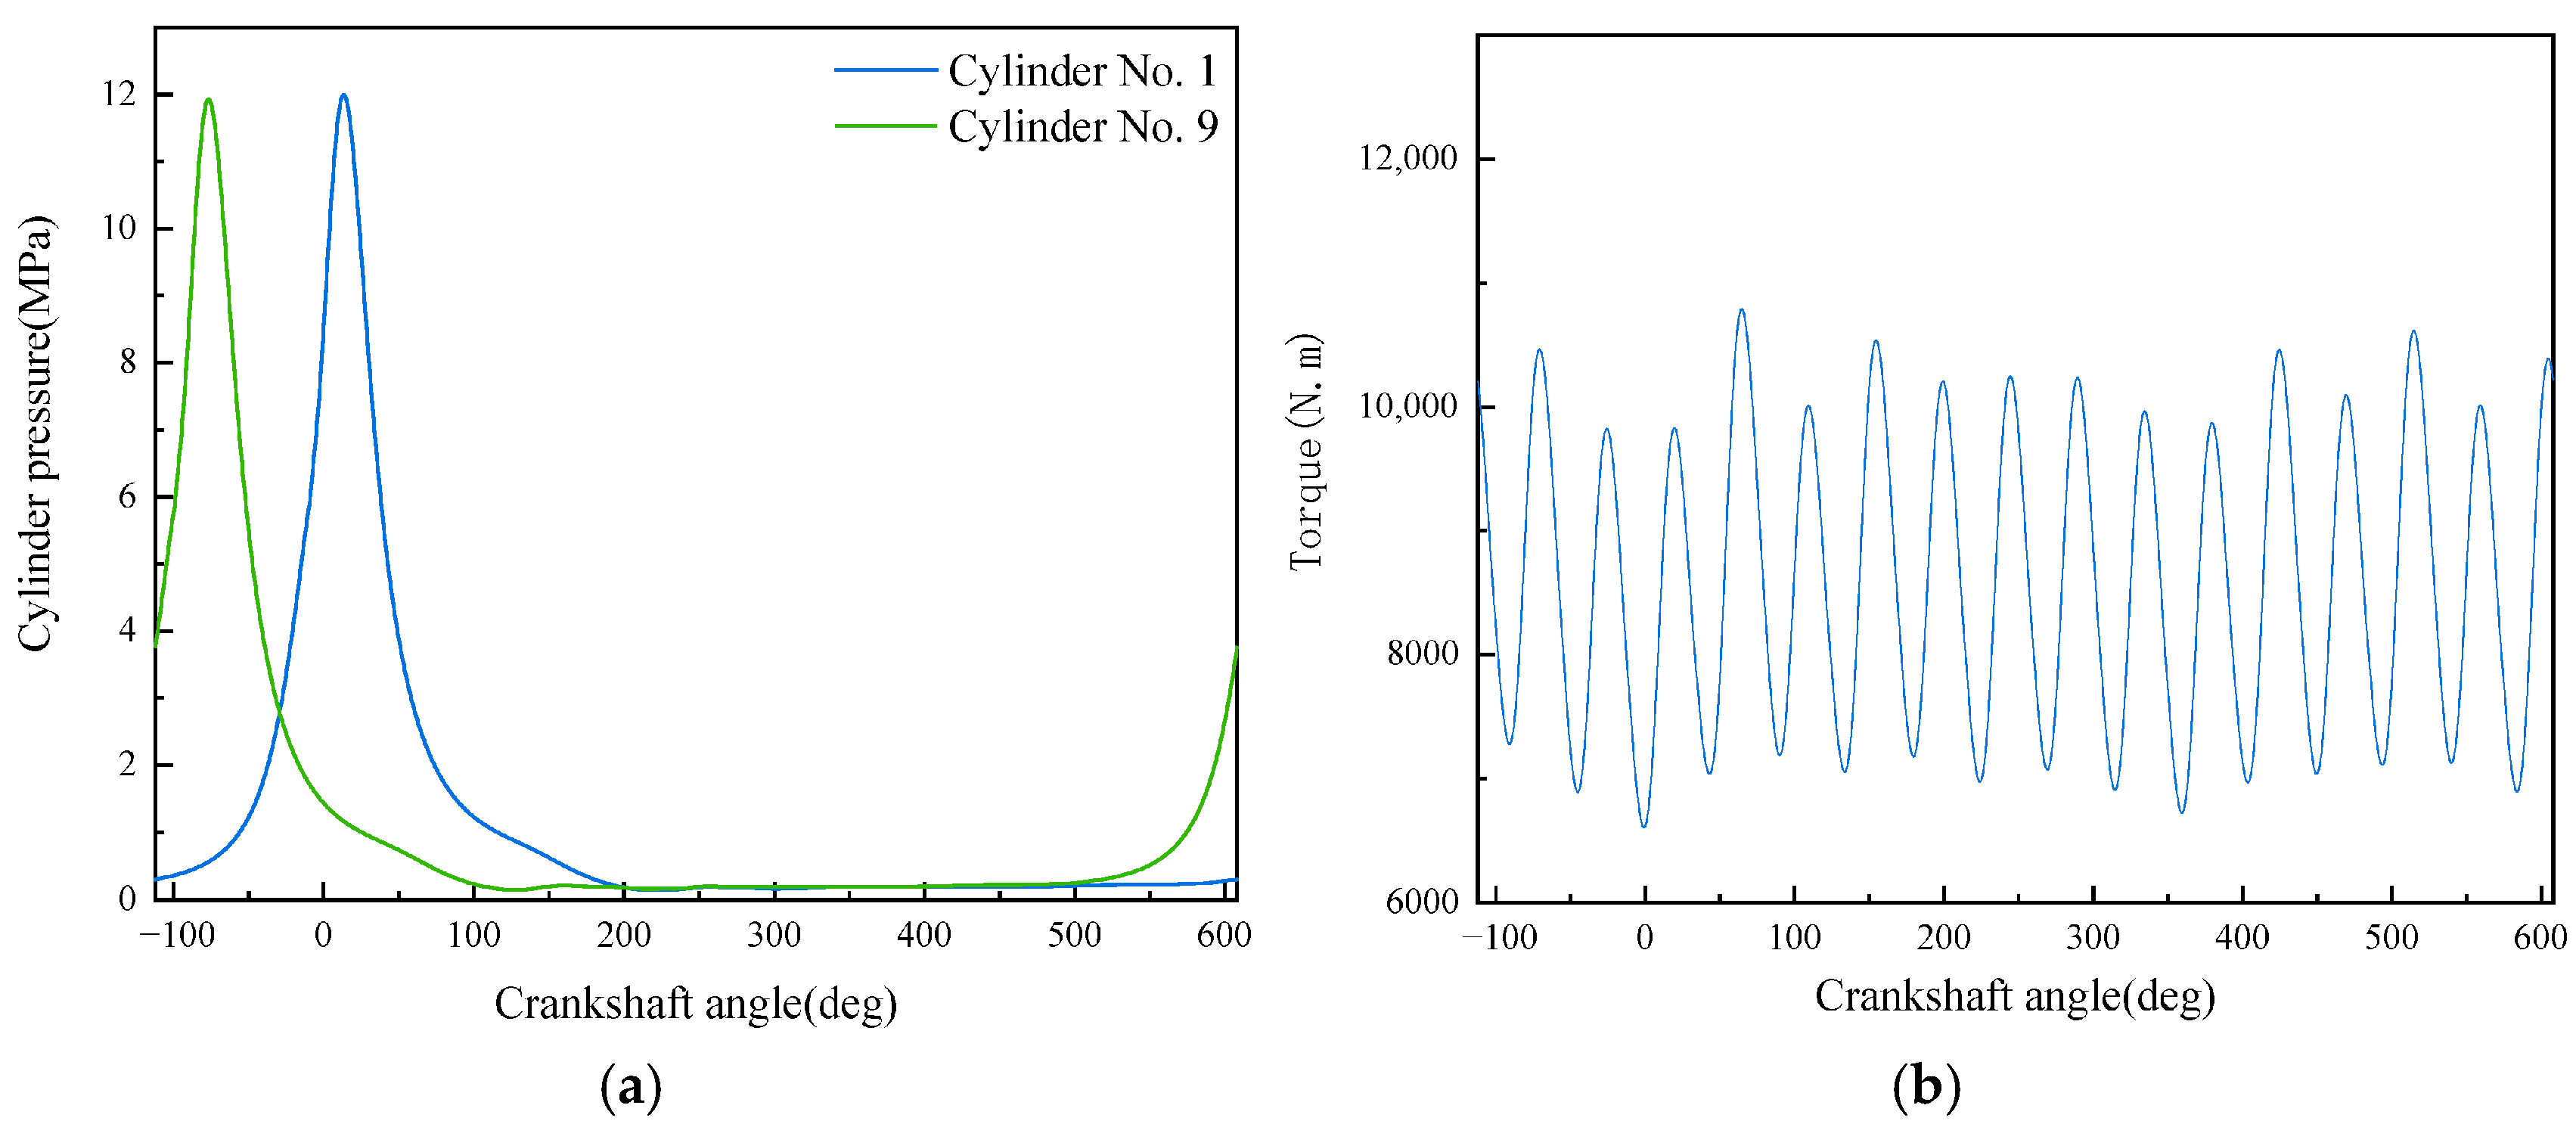
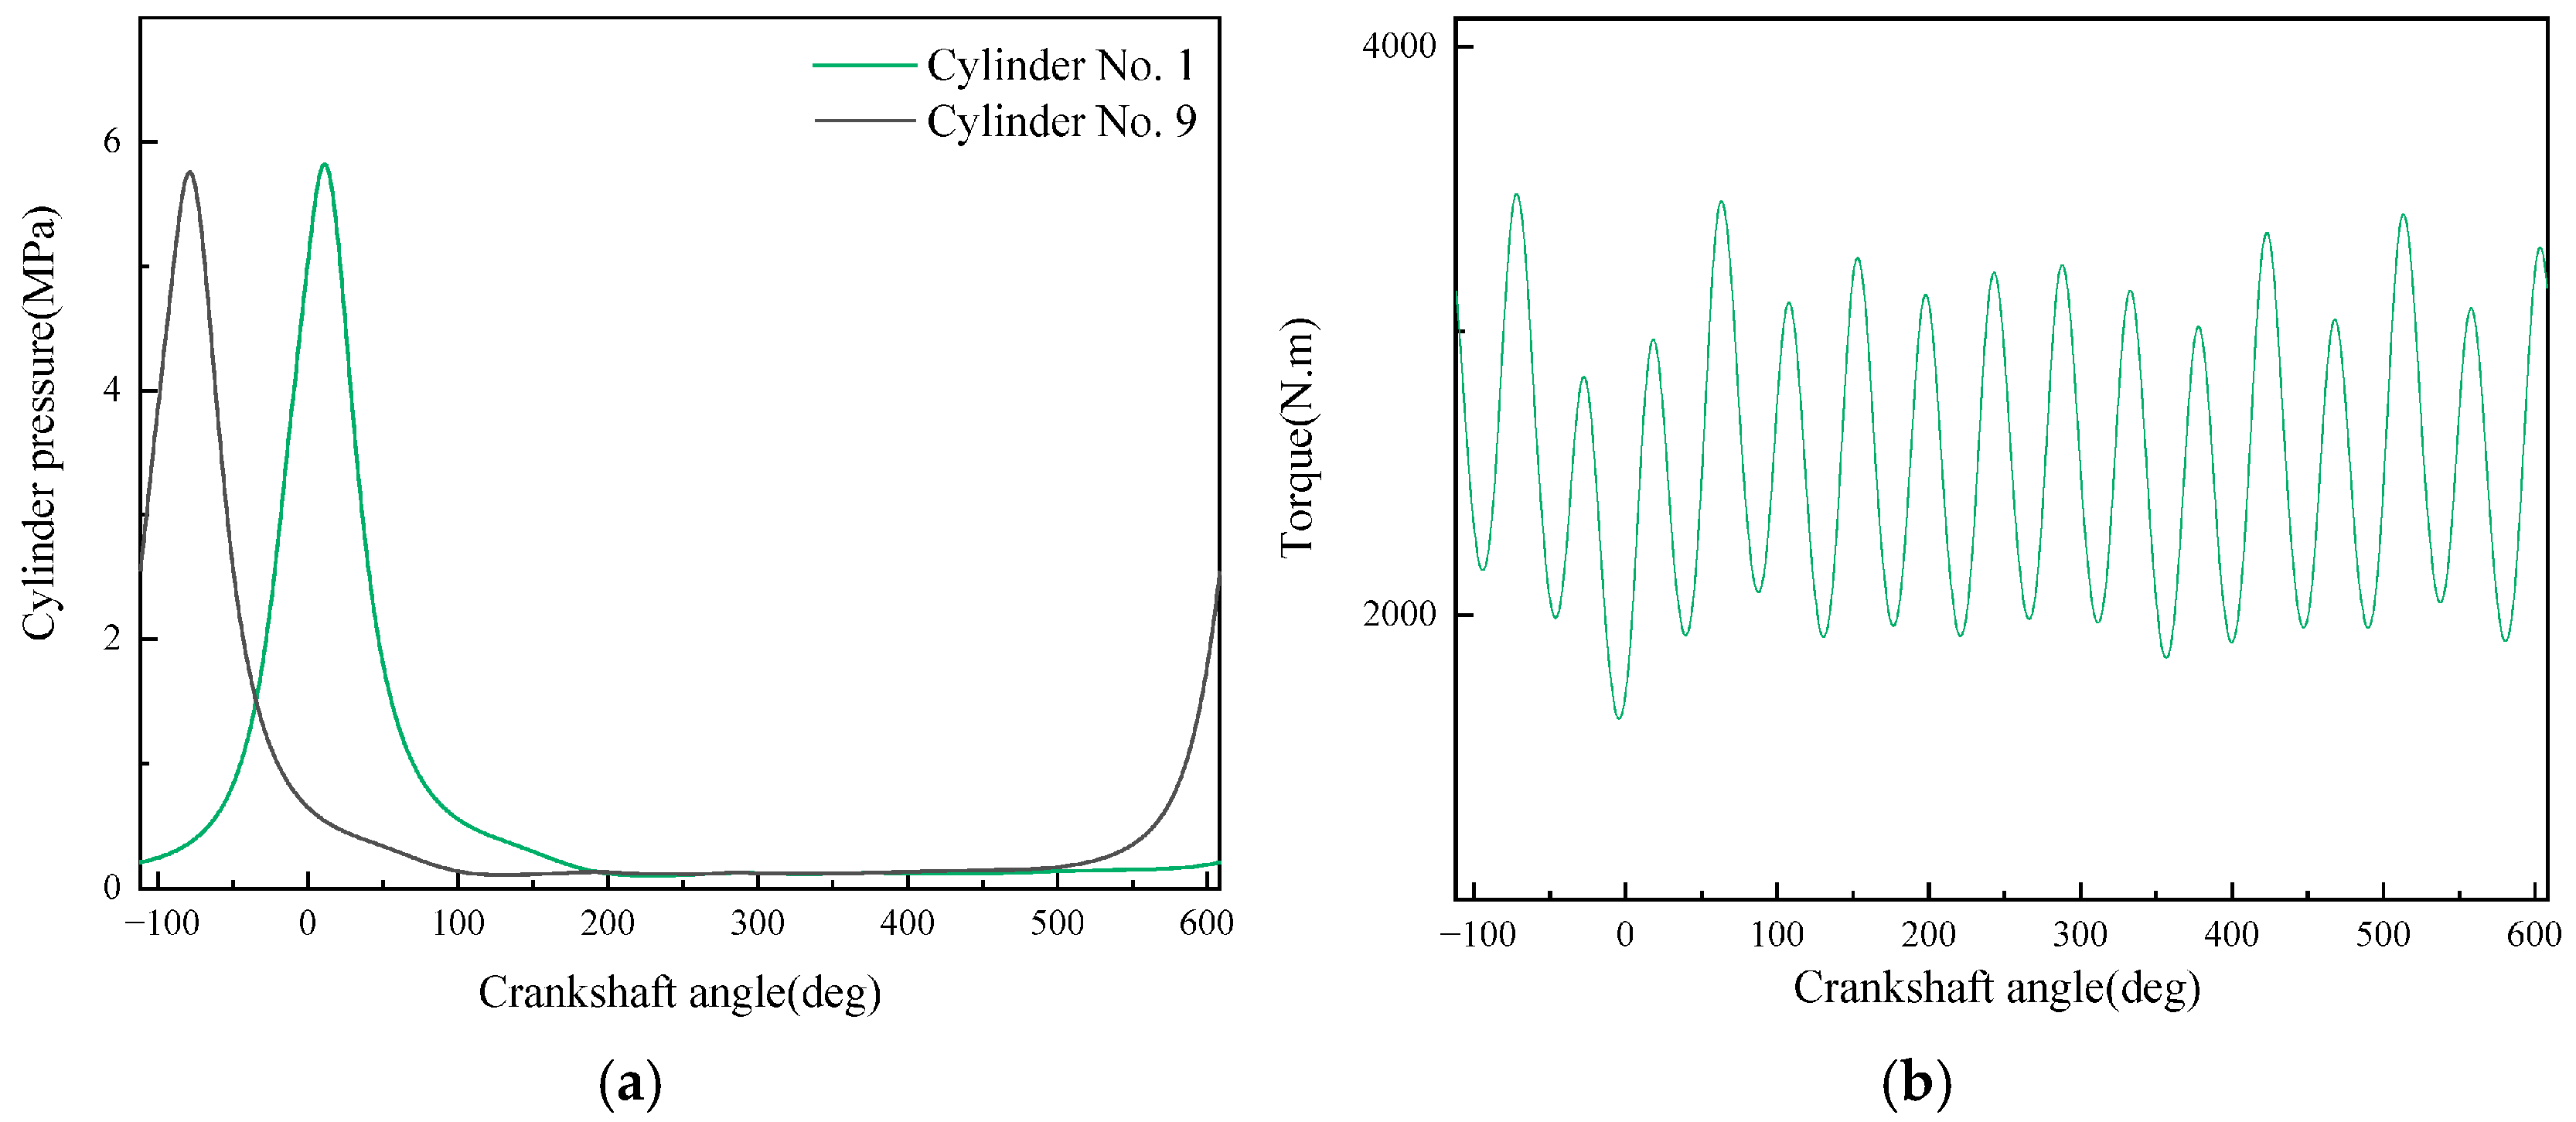
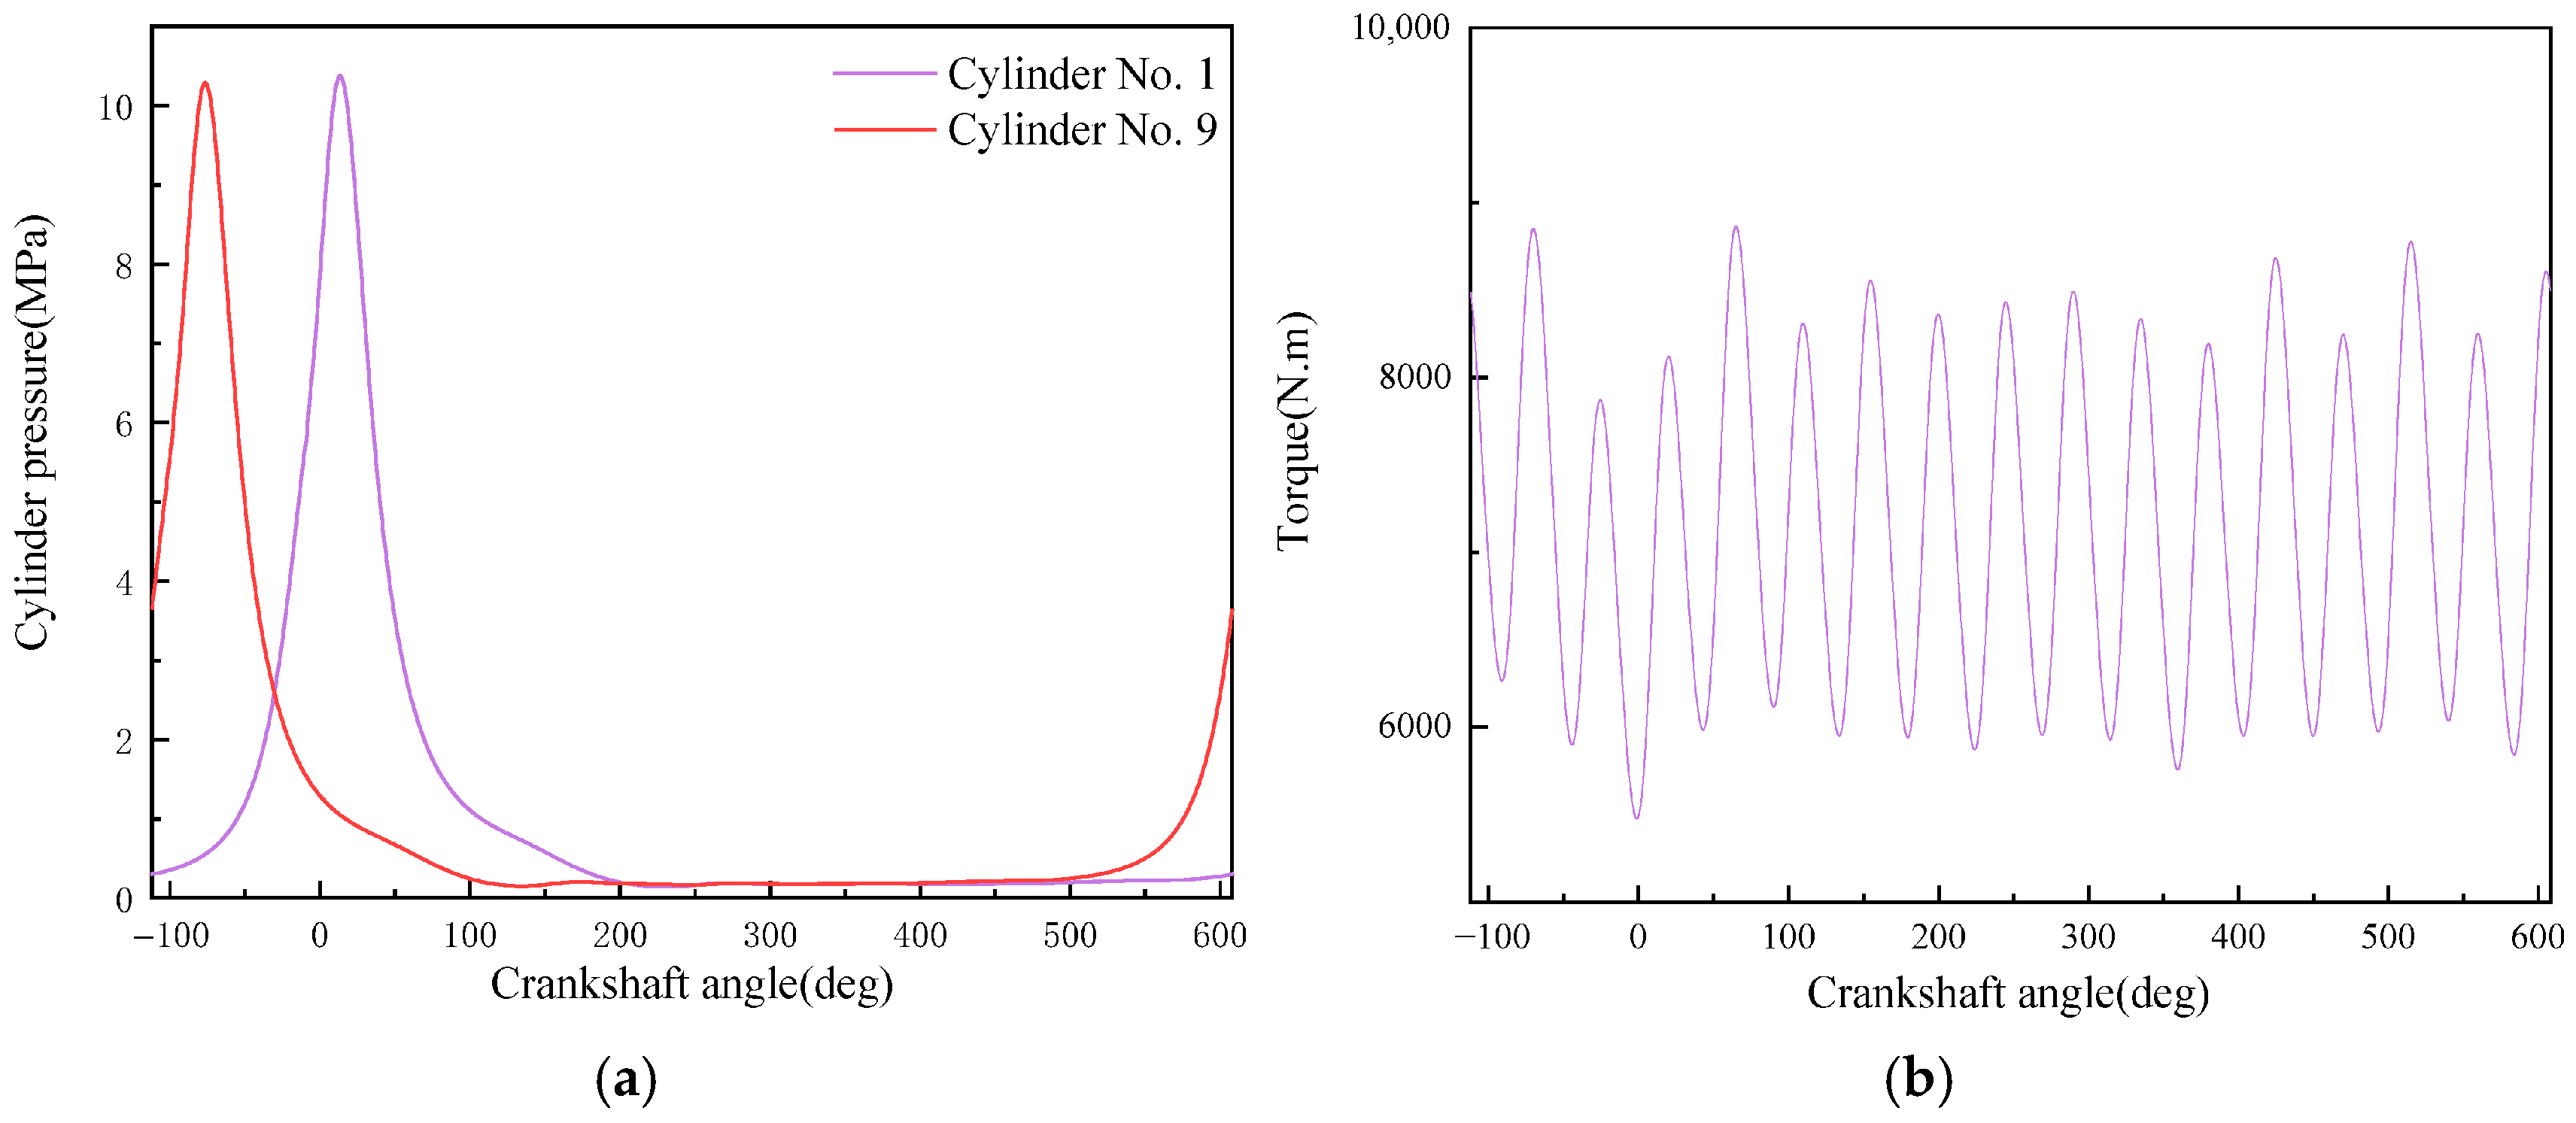
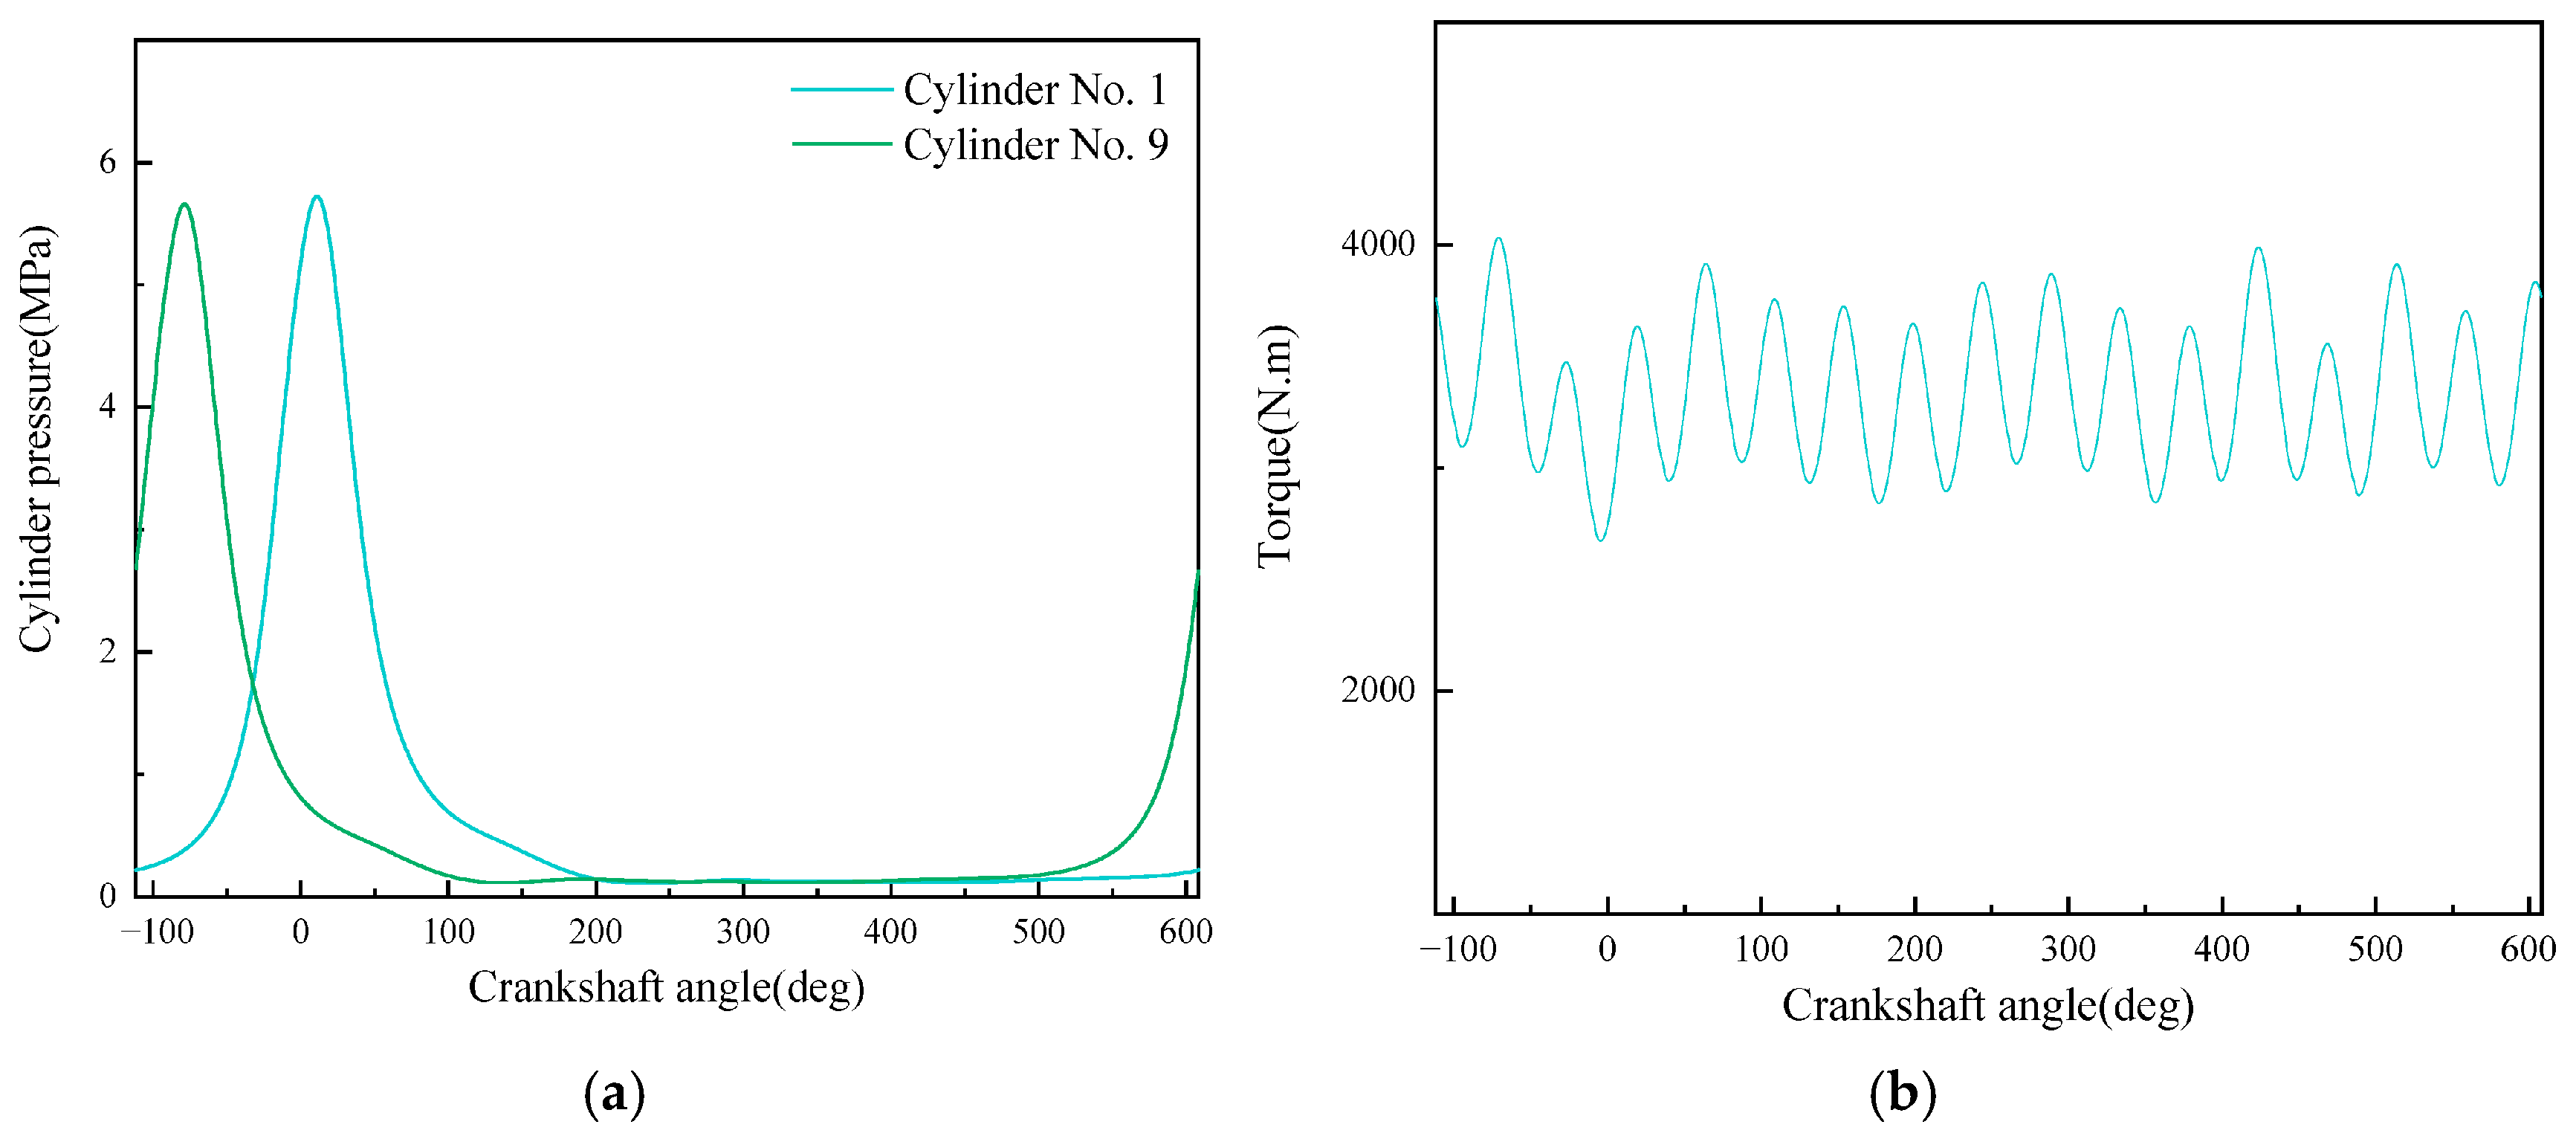
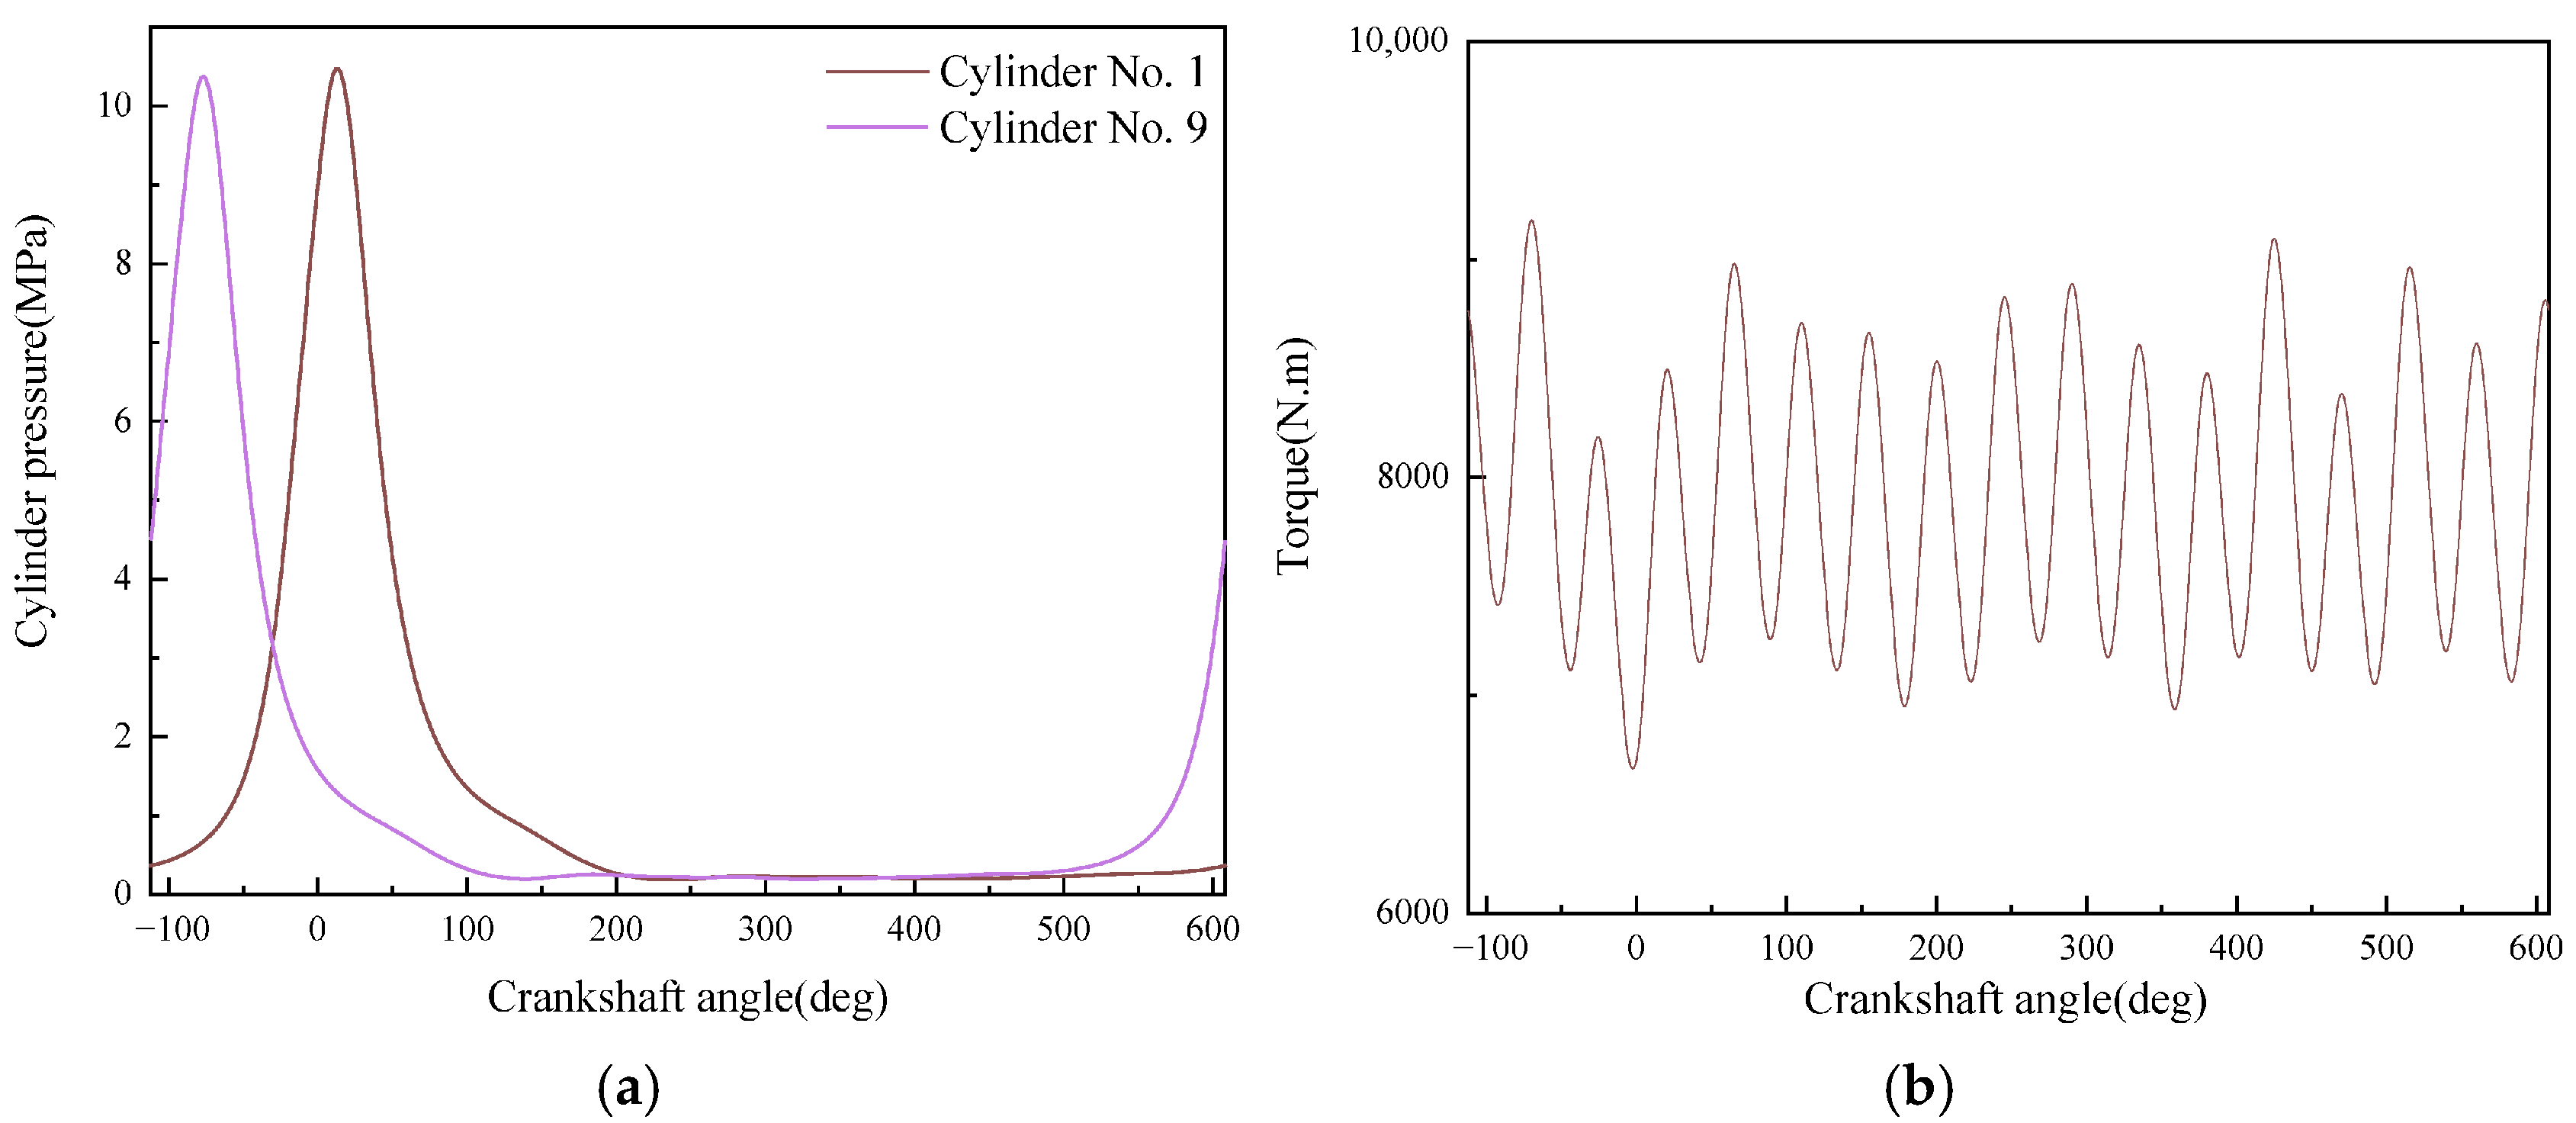
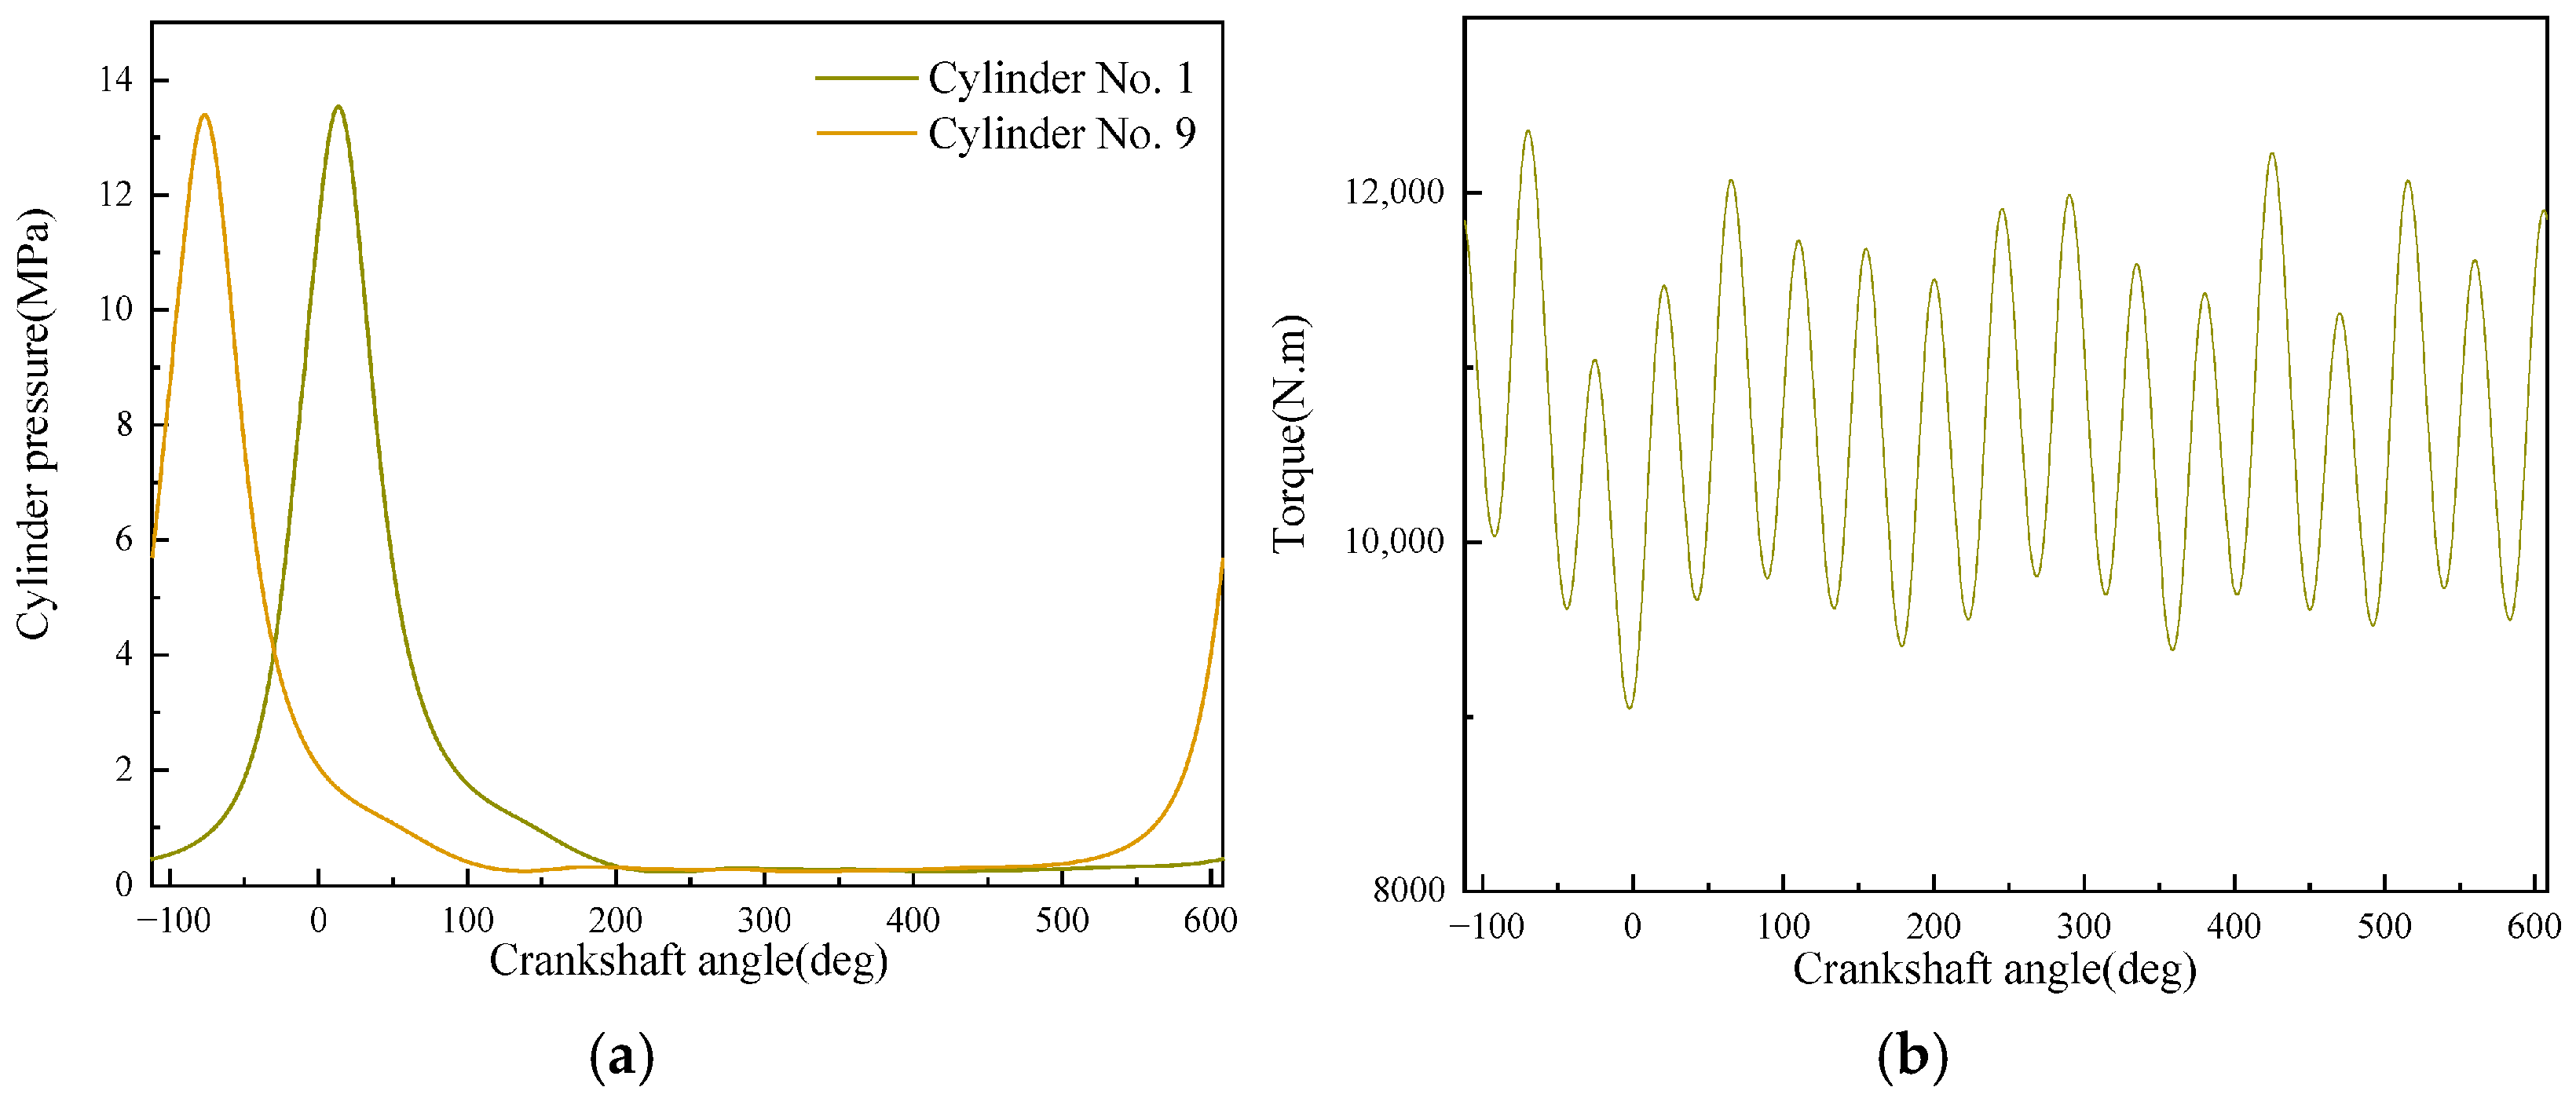
To verify the correctness and accuracy of the proposed monitoring model under different operating conditions, the in-cylinder pressure curve, crankshaft torque, crankshaft angle, displacement of each cylinder, and other related data of the diesel engine are collected under nine operating conditions (three speeds: 1600 rpm, 1800 rpm, 2000 rpm; three loads: 25%, 75%, 100% for each speed). The above nine operating conditions are named Condition 1 to Condition 9, respectively. Table 2 shows the load characteristics under different operating conditions. Shown in Figure 2, Figure 3, Figure 4, Figure 5, Figure 6, Figure 7, Figure 8, Figure 9 and Figure 10 are the in-cylinder pressure and crankshaft torque of Cylinder 1 and Cylinder 9 under different operating conditions, after interpolation, filtering, and smoothing processing, where the abscissa is converted to crankshaft angle. The numbering sequence of each cylinder is from the output end to the free end: the left row (Row A) is Cylinder 1 to Cylinder 8 in sequence, and the right row (Row B) is Cylinder 9 to Cylinder 16 in sequence.
Table 2. Load characteristics under different operating conditions.
Figure 2. In-cylinder pressure and crankshaft torque under Condition 1. (a) In-cylinder pressure of Cylinder 1 and Cylinder 9; (b) crankshaft torque.
Figure 3. In-cylinder pressure and crankshaft torque under Condition 2. (a) In-cylinder pressure of Cylinder 1 and Cylinder 9; (b) crankshaft torque.
Figure 4. In-cylinder pressure and crankshaft torque under Condition 3. (a) In-cylinder pressure of Cylinder 1 and Cylinder 9; (b) crankshaft torque.
Figure 5. In-cylinder pressure and crankshaft torque under Condition 4. (a) In-cylinder pressure of Cylinder 1 and Cylinder; (b) crankshaft torque.
Figure 6. In-cylinder pressure and crankshaft torque under Condition 5. (a) In-cylinder pressure of Cylinder 1 and Cylinder 9; (b) crankshaft torque.
Figure 7. In-cylinder pressure and crankshaft torque under Condition 6. (a) In-cylinder pressure of Cylinder 1 and Cylinder 9; (b) crankshaft torque.
Figure 8. In-cylinder pressure and crankshaft torque under Condition 7. (a) In-cylinder pressure of Cylinder 1 and Cylinder 9; (b) crankshaft torque.
Figure 9. In-cylinder pressure and crankshaft torque under Condition 8. (a) In-cylinder pressure of Cylinder 1 and Cylinder 9; (b) crankshaft torque.
Figure 10. In-cylinder pressure and crankshaft torque under Condition 9. (a) In-cylinder pressure of Cylinder 1 and Cylinder 9; (b) crankshaft torque.
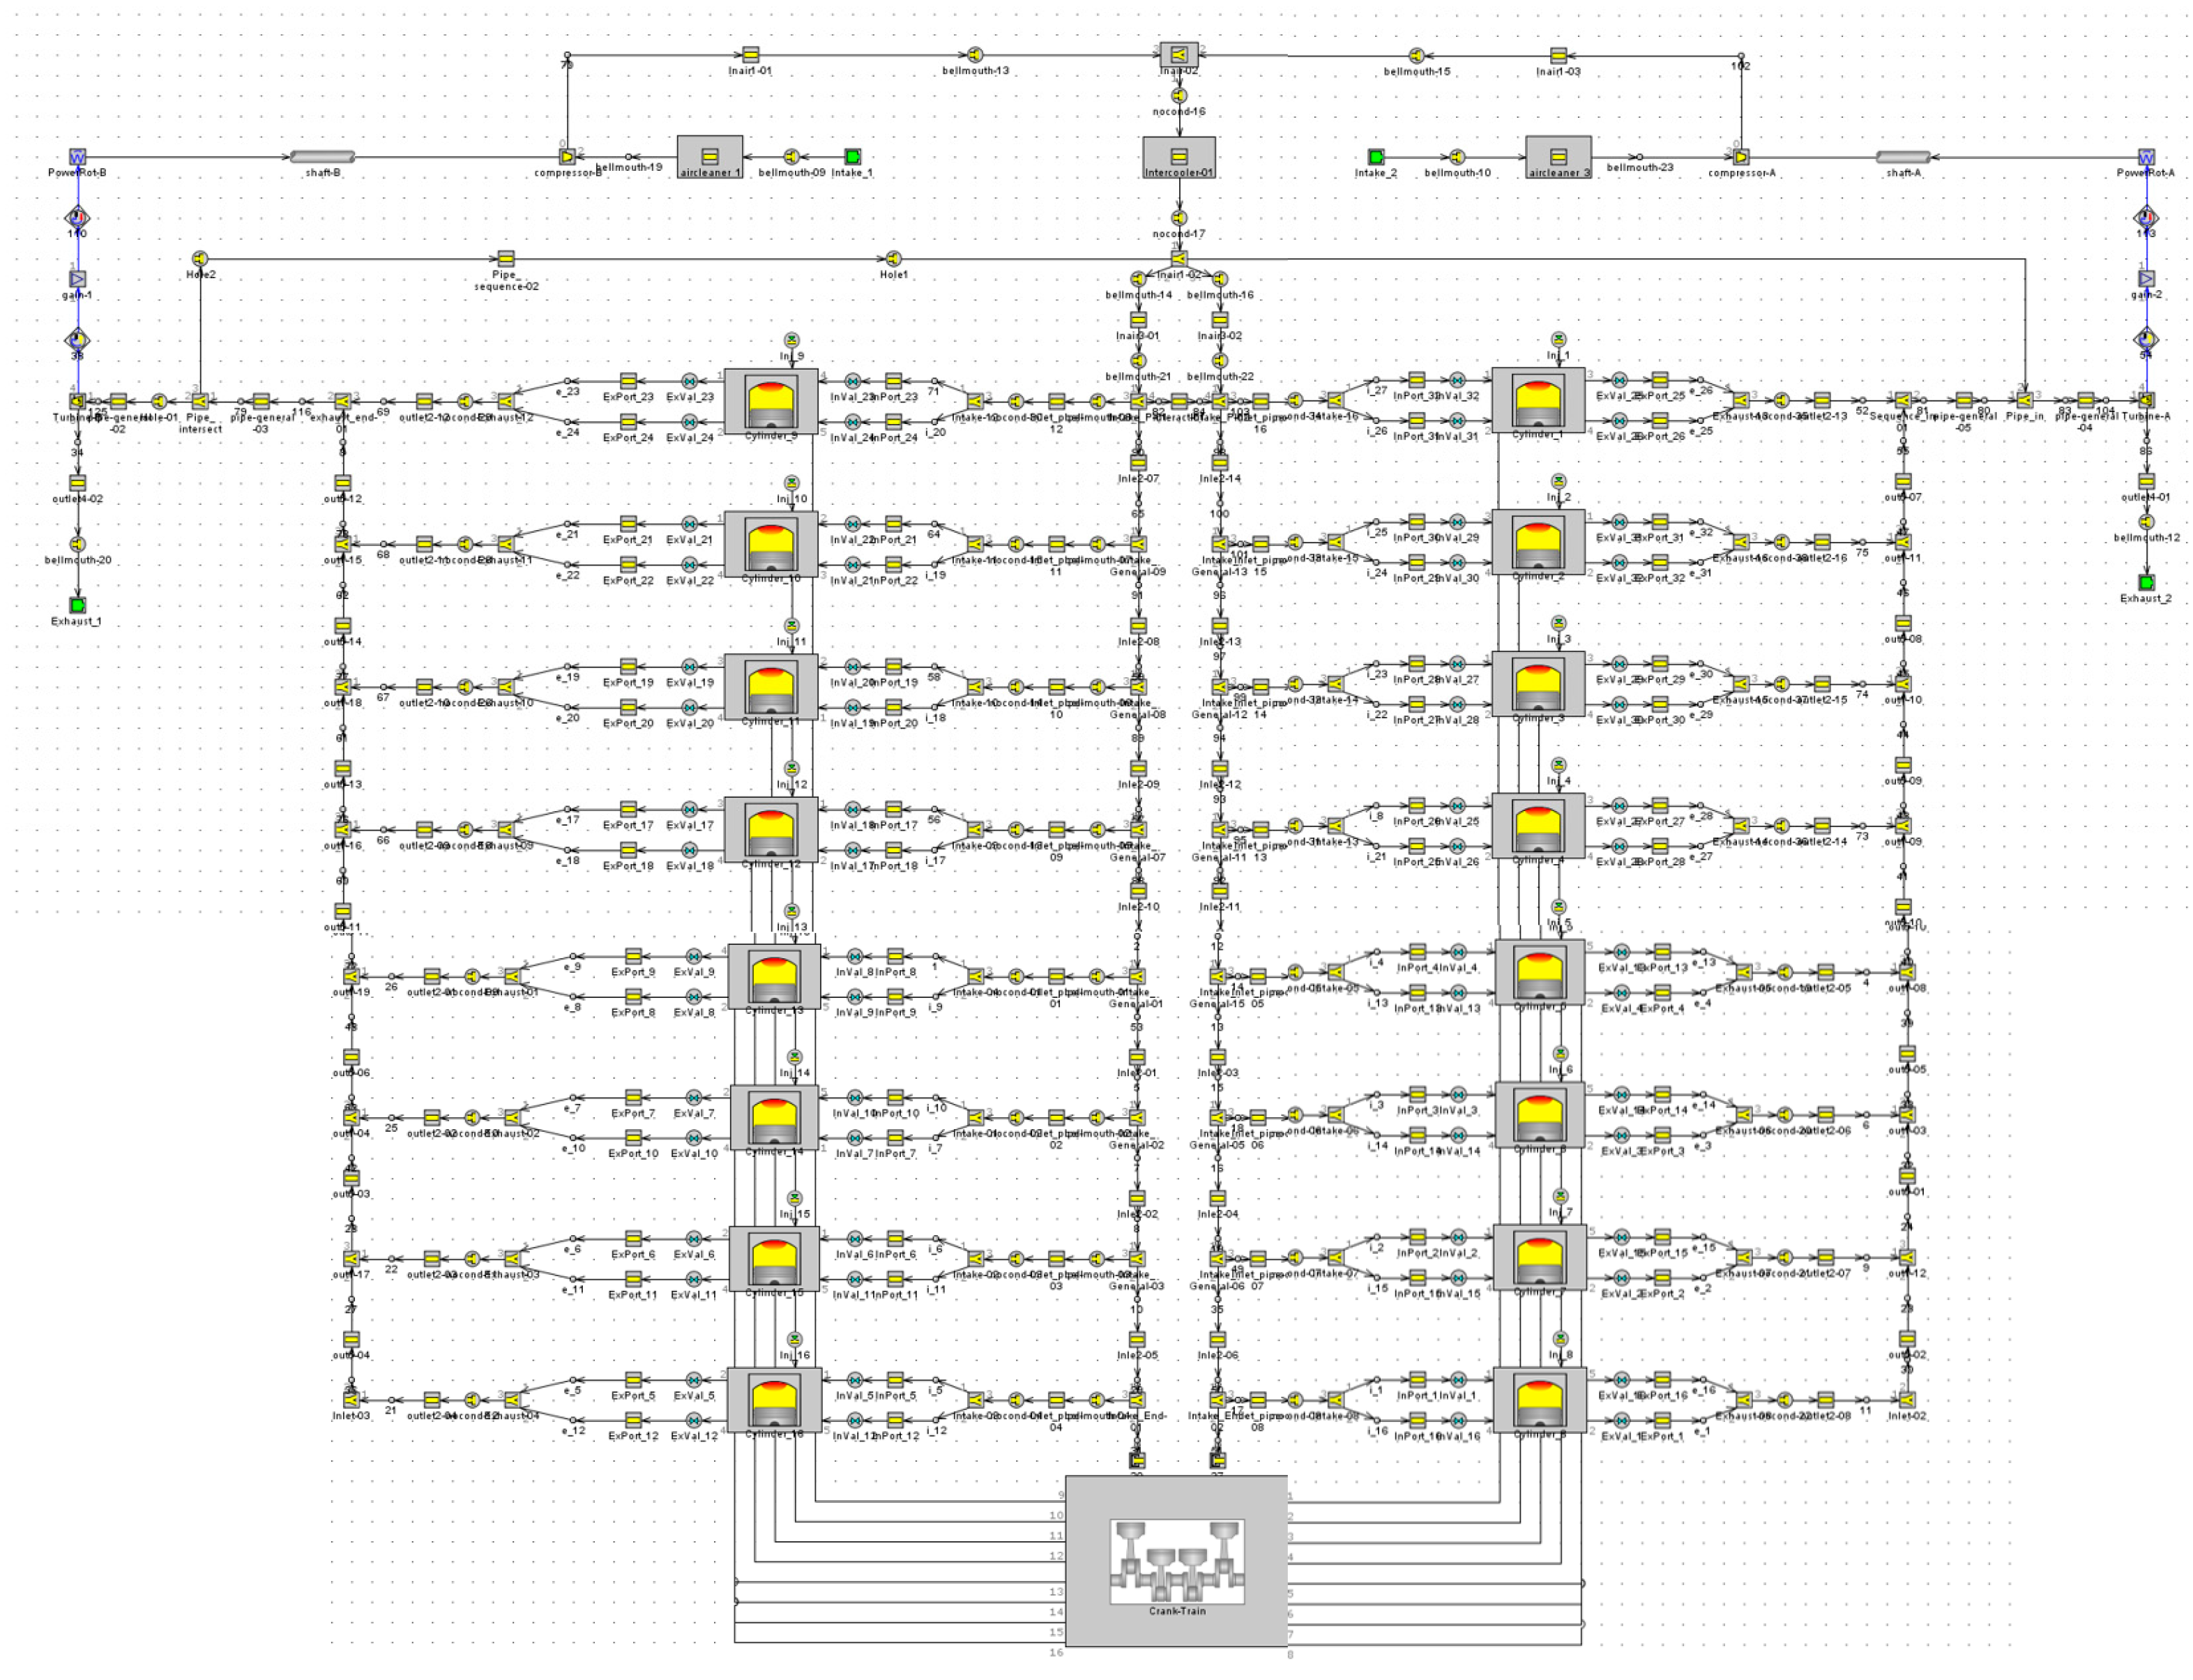
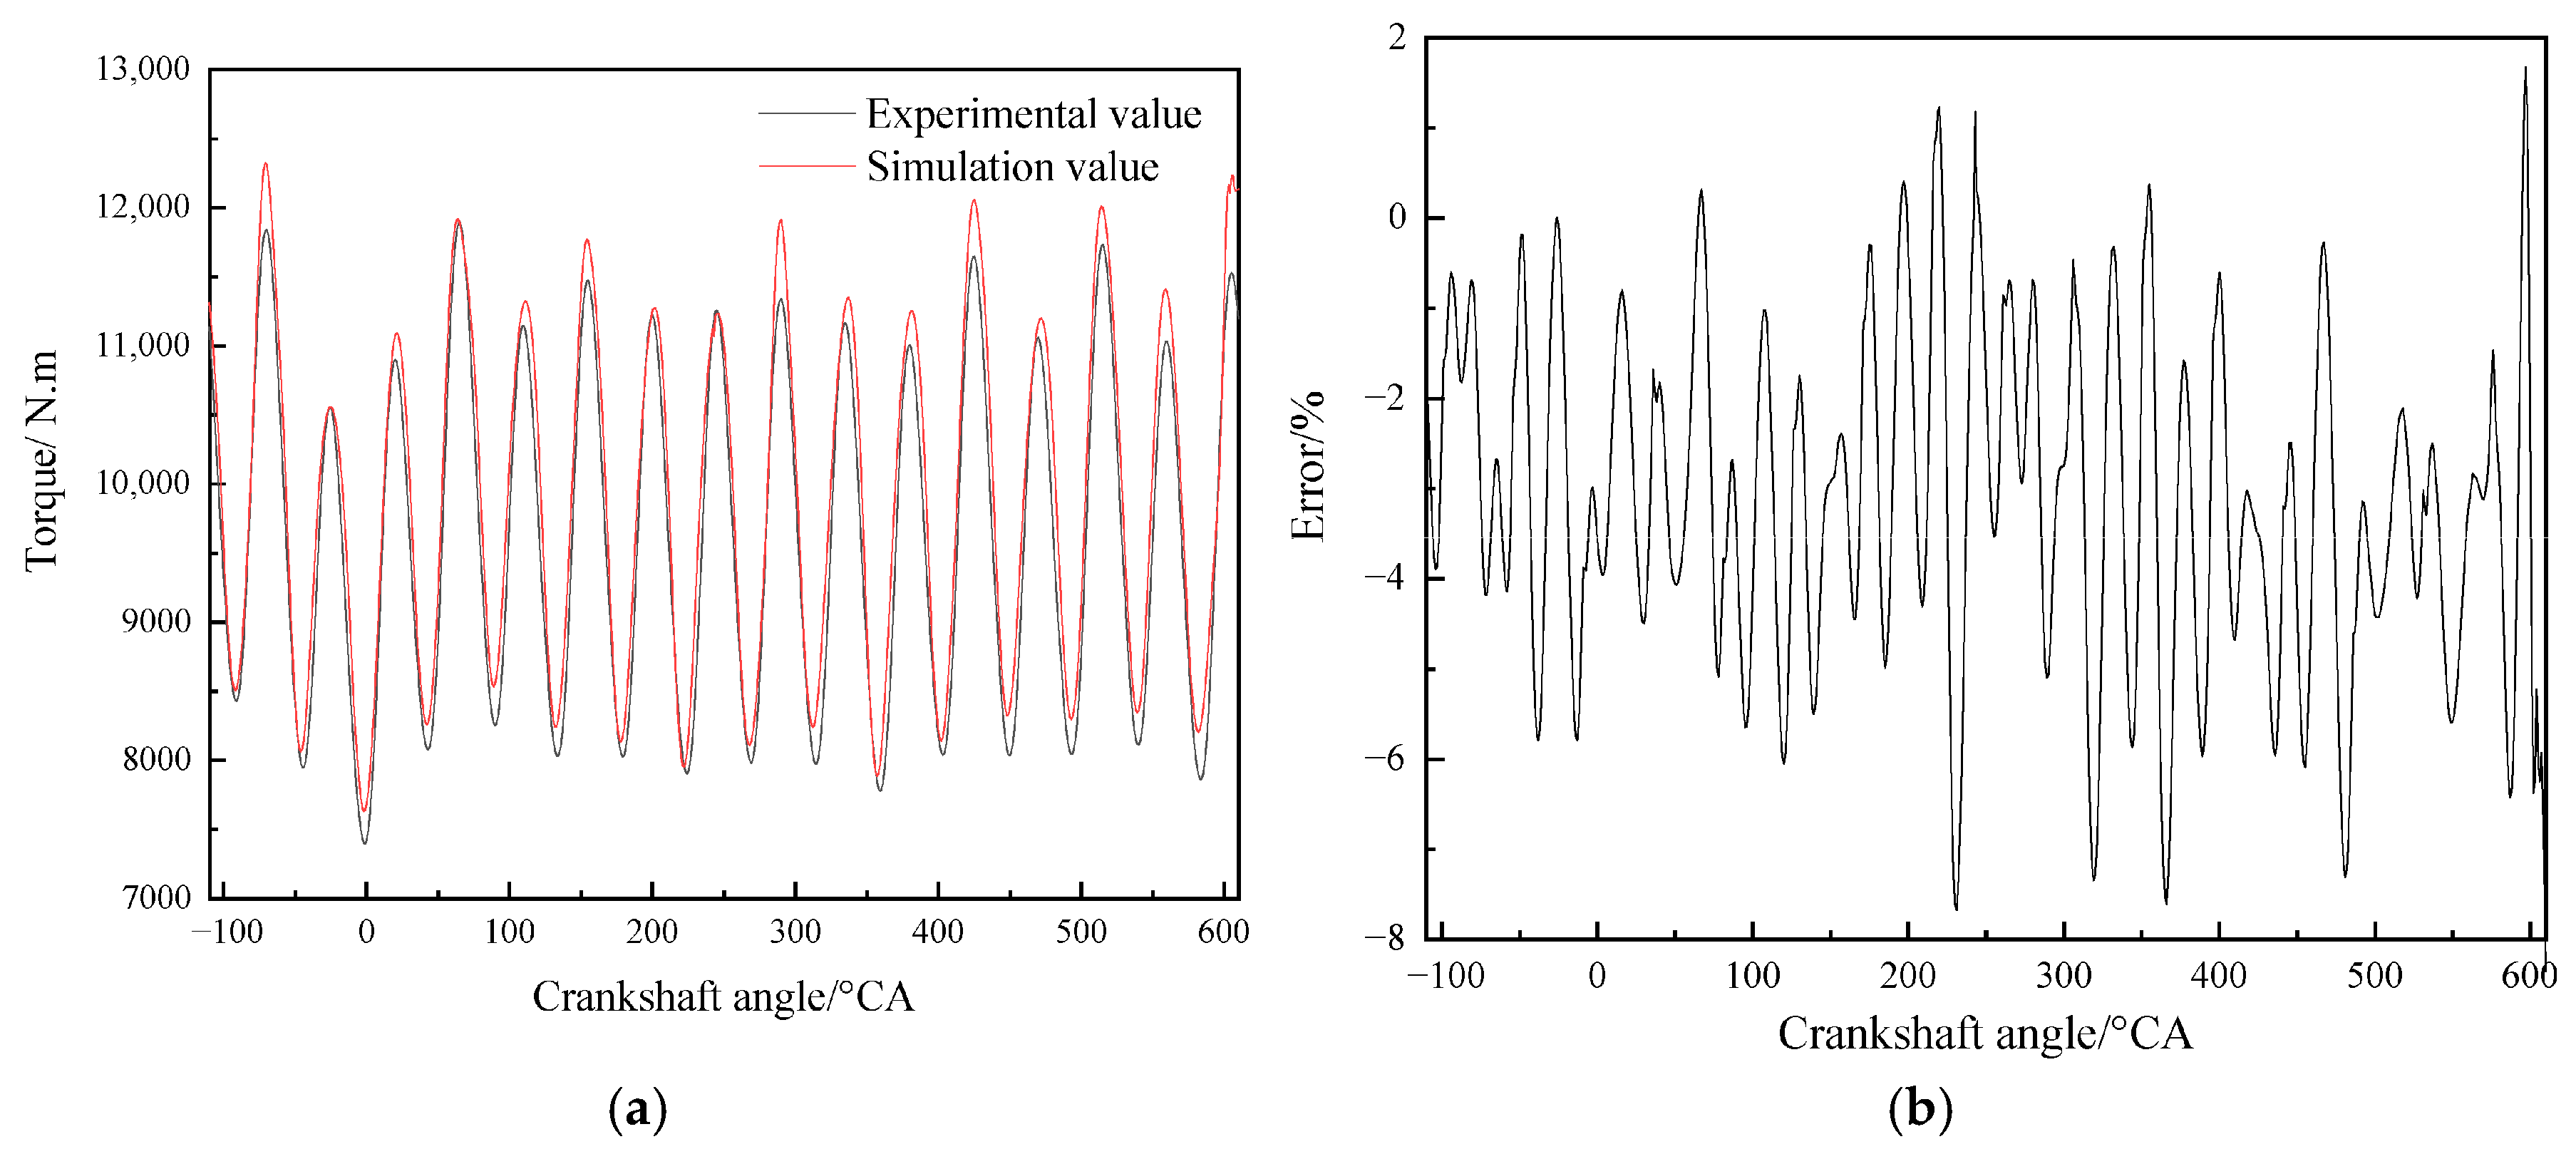
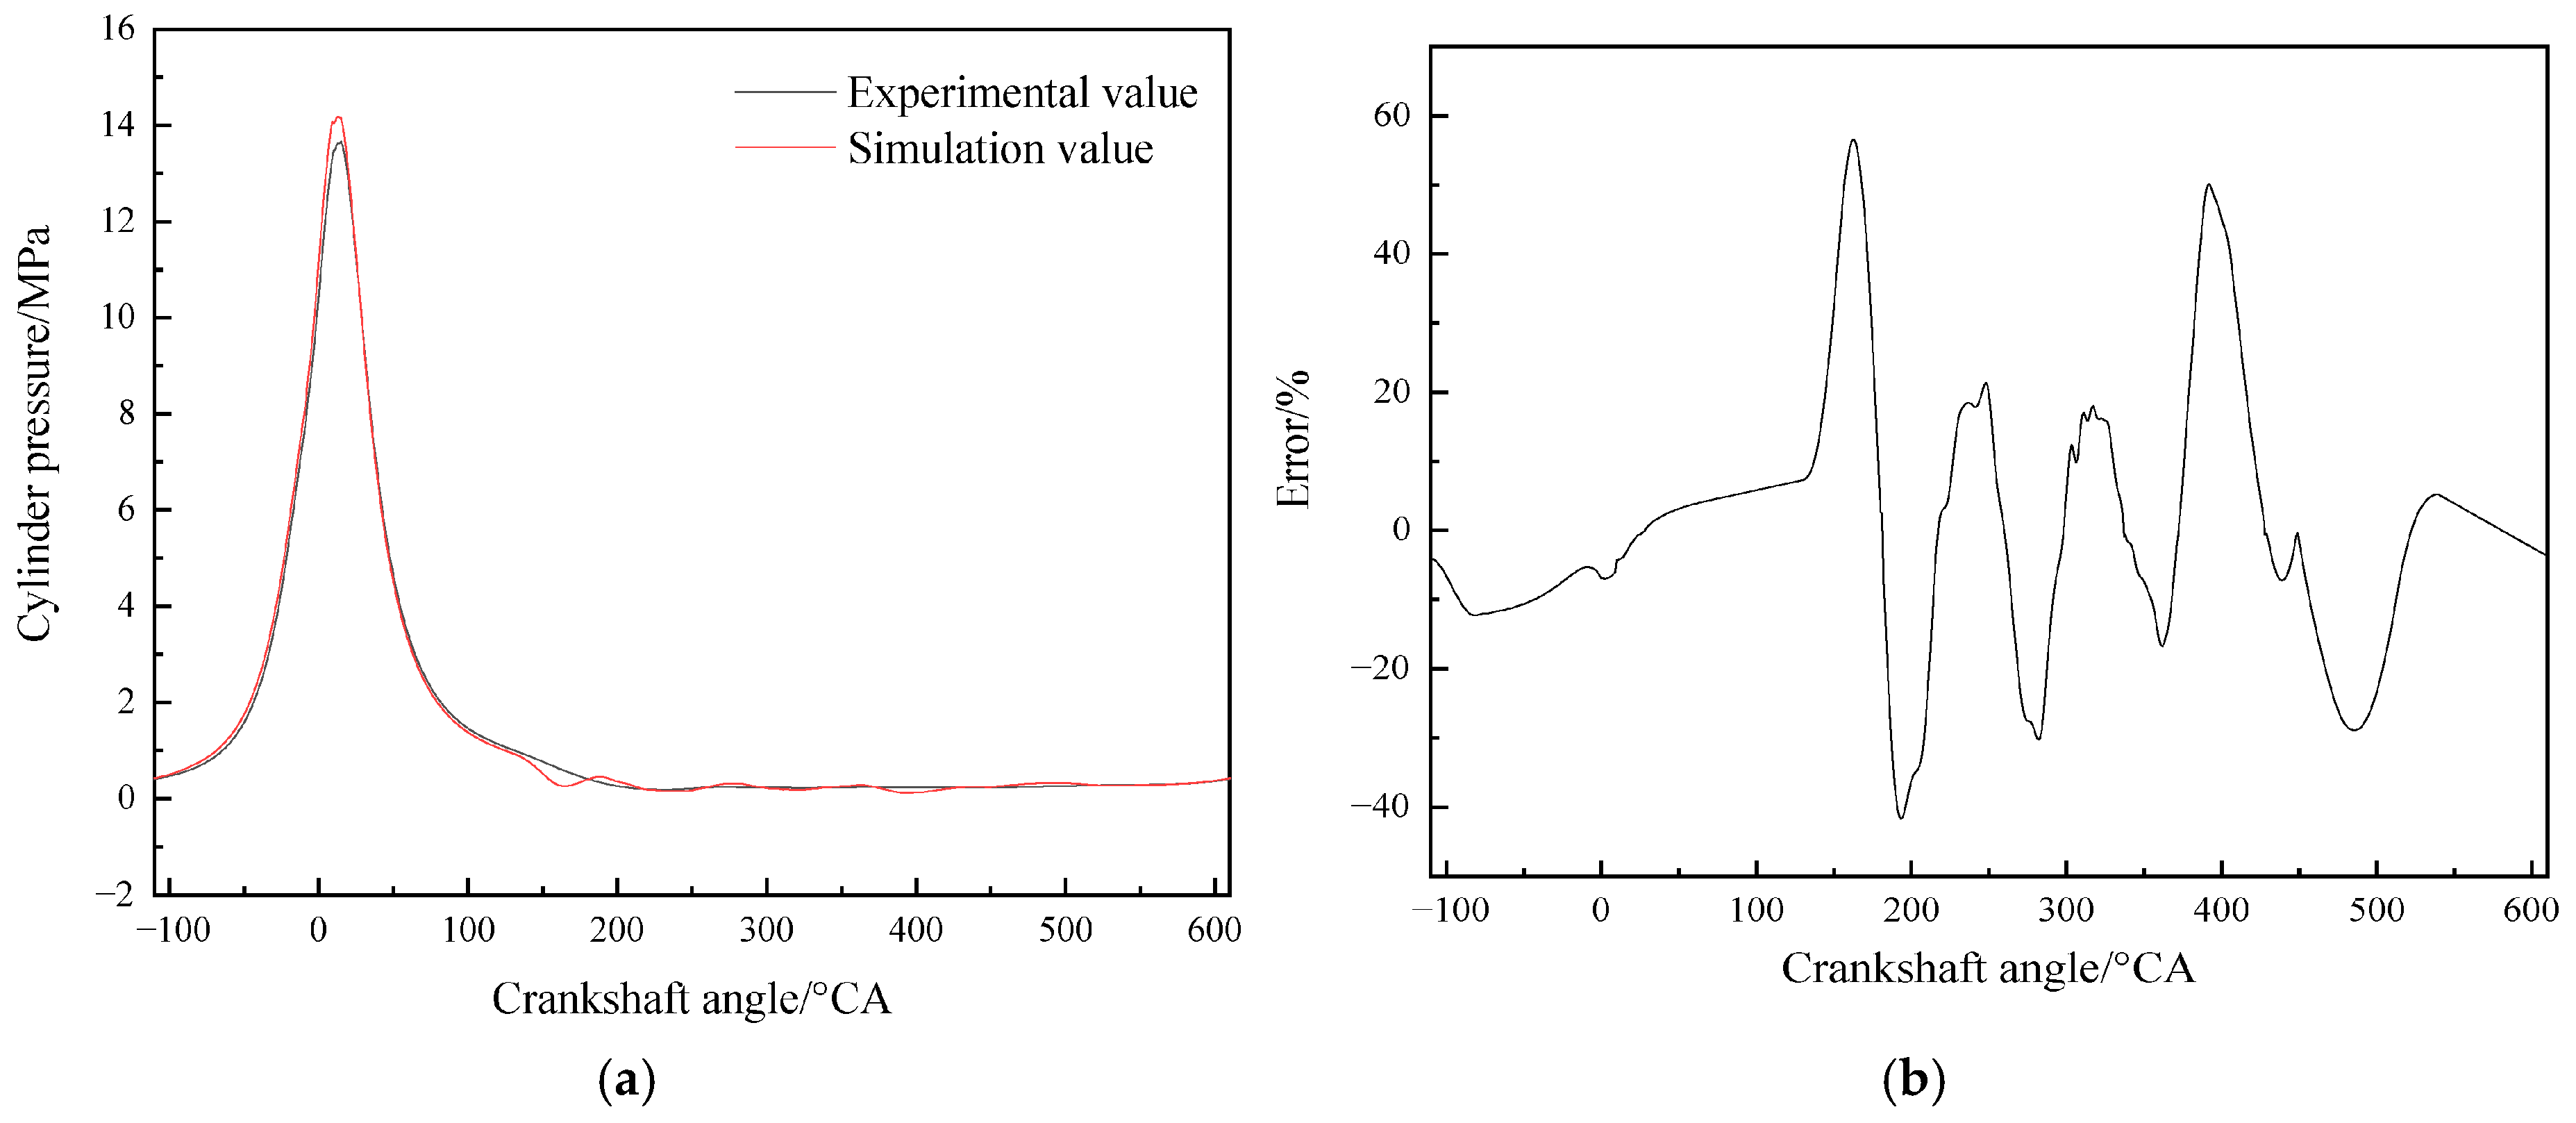
To compare the monitoring method used in this paper, GT-power V7.5 is employed to establish a one-dimensional simulation model of the diesel engine, as shown in Figure 11, with the parameters set for its establishment provided in Appendix A. To verify the accuracy of the above-established calculation model, the model is used to perform performance simulation calculations for the 396 series diesel engines, and the simulated calculation data are compared with the experimental data, as shown in Table 3. Figure 12 shows the comparison between the simulated torque and experimental torque for Cylinder 1 at 100% load and 1800 r/min. Figure 13 presents the cylinder pressure comparison.
Figure 11. One-dimensional simulation model of diesel engine.
Table 3. Comparison of calculated values and experimental values under different operating conditions.
Figure 12. Comparison of simulation models and experimental torque. (a) Cylinder pressure comparison; (b) error curve.
Figure 13. Comparison of simulation models and experimental cylinder pressure. (a) Cylinder pressure comparison; (b) error curve.
As can be seen from the above figures and tables, the simulation results of the diesel engine studied in this paper are basically consistent with the experimental results. The errors mainly occur in the intake and exhaust phases (135° to 540°), while the errors in the main working phase (−35° to 135°) are small, with the maximum relative error below 10%. This indicates that the calculation model is consistent with the actual situation, and the performance calculation and analysis based on it have reliability. The above errors may be attributed to the following factors: first, there are no experimental data for the flow coefficients of the intake and exhaust valves and mechanical losses during data input, which are estimated based on experience; second, there are errors in the conversion of the effective flow area of the intake and exhaust pipelines; third, the selection of the turbocharger calculation model (including simplified and full simulation models, and the data measurement is not accurate enough when the full simulation model is adopted), the combustion model (Vibe model is selected), and the heat transfer model (Woschni 1978 model is selected) leads to slight differences between the simulation results and the experimental results.

3. Establishment of Diesel Engine In-Cylinder Pressure Monitoring Model

The gas pressure generated in the engine combustion chamber acts on the piston top, pushing the piston to move downward and driving the crankshaft to rotate through the connecting rod to generate torque []. The total crankshaft torque of the engine can be expressed as
T e = i = 0 16 T e i
In the formula, i   is the number of cylinders, and T e i i = 1.2 . 3 16   is the torque generated by a single cylinder, which can be expressed as
T e i = α × R × ( B y .   × s a B x .   × c a ) s a = sin a n g c a = cos a n g
In the formula, α is the mechanical efficiency []; R is the crank radius, and is the crank angle corresponding to the cylinder, which is a one-dimensional array;   B y   ang   B x   are the forces on the crank pin in the y and x directions, respectively, which can be expressed as
B x = F I P F p + l b × F I y l .   × tan b e t a l a × F I x l T I G l .   × 1 cos b e t a   B y = F p + F I P F I y b e t a = a r c s i n ( R 1 × s a ) R 1 = R l l a = l l b
In the formula, F p   is the pressure force on the piston [], which is a one-dimensional array corresponding to the crank angle   a n g one by one; F I P is the inertia force; TIG is the inertia torque; F I x and F I y are the inertia forces of the connecting rod in the x and y directions, respectively; l b is the length from the connecting rod pin to the center of gravity; l is the length of the connecting rod; R is the crank radius. Among them, F I P , FIG, F I x , and F I y can be expressed as follows:
F I P   =   m p   ×   R   ×   o m e g 2   ×   ( c a   +   R 1   ×   c o s ( 2   ×   a n g ) . 1 cos b e t a   +   R 1 3 ×   ( s i n ( 2 × a n g ) ) 2 . 1 cos b e t a 0.75 ) T I G   =   I c   ×   R 1   ×   o m e g 2   ×   s a . 1 cos b e t a F I x   =   m c   ×   ( R   ×   o m e g 2   ×   l a   ×   s a l ) F I y   =   m c   ×   ( R   ×   o m e g 2   ×   ( c a   +   R 1   ×   l b   ×   cos 2   ×   a n g . 1 cos b e t a   ×   l ) ) o m e g = s p e e d   ×   π 30
In the formula, m p is the piston mass; m c is the connecting rod mass; s p e e d is the rotational speed; and I c is the connecting rod inertia. It can be found from the above formula that F I P , FIG, F I x , and F I y are only related to the cylinder structure parameters and rotational speed, and have nothing to do with the variation in in-cylinder pressure []. F p in Formula (3) can be expressed as
F p = p r × A g
In the formula, p r is the in-cylinder pressure, which is a one-dimensional array corresponding to the crank angle a n g one by one; A is the piston force-bearing area; g is the gravitational acceleration.
It can be found from Formulas (1)–(5) that except for the structural parameters of the engine itself, the crankshaft torque is only related to the engine speed, mechanical efficiency α , and in-cylinder pressure p r . This indicates that the crankshaft torque is closely related to the in-cylinder pressure [], which provides theoretical support for the method of calculating in-cylinder pressure using crankshaft torque in this paper.
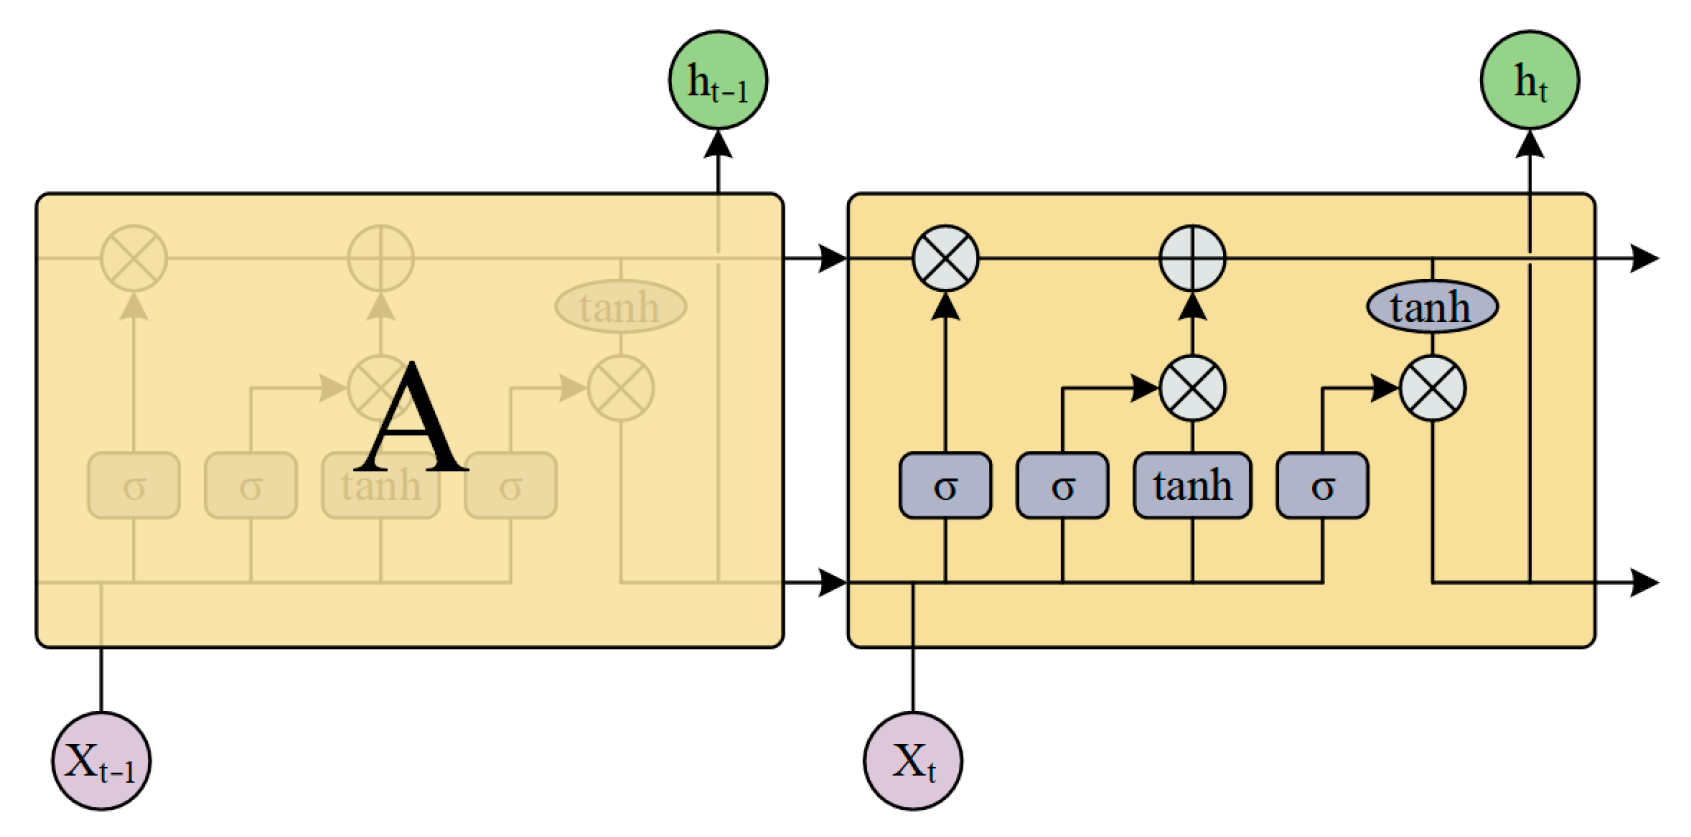
The Long Short-Term Memory Neural Network improves the Recurrent Neural Network by changing the neural network structure to alleviate gradient disappearance and solve the long-term dependence problem, which solves the long-term dependence problem through a deliberately designed network structure. Figure 14 shows a typical Long Short-Term Memory Neural Network [,].
Figure 14. Typical Long Short-Term Memory Neural Network.
In the figure, the black lines represent the data flow direction, the pink circles represent bitwise operations, the yellow rectangles represent the learned neural network layers, the converging lines represent data connections, and the diverging lines represent that data are copied and flow to different directions. It can be seen from the figure that the Long Short-Term Memory Neural Network can be divided into five main processes, as shown in Figure 15: forget gate, input gate, update gate, output gate, and memory gate.
Figure 15. Typical LSTM working process. (a) Circulation state; (b) determining discarded state; (c) determining updated state; (d) updating state; (e) output state.
The forget gate determines [] how much information from the previous moment can be used in the next moment and how much is discarded. After reading h t 1 and x t , this structure generates a number between 0 and 1 to mark each piece of information in C t 1 , where 0 means complete discarding and 1 means complete retention. Its expression is shown in Formula (6):
f t = σ W f · h t 1 , x t + b f
The input gate [] is used to control how much of the newly generated information from the current input can be added to this unit. The input gate is composed of a sigmoid layer and a ranh layer. The former determines the value to be updated, and the latter creates a new candidate value vector   ~ C t   to be added to the state. Its expression is shown in Formula (7):
i t = σ W i · h t 1 , x t + b i ~ C t = t a n h W C · h t 1 , x t + b C
In the update gate, C t 1 will be replaced by C t , and its expression is shown in Formula (8):
C t = f t · C t 1 + i t · ~ C t
The output gate [] is composed of a sigmoid layer and a ranh layer. The former determines which part will be output, and the latter obtains a value between −1 and 1 and multiplies it by the output of the gate. Its expression is shown in Formula (9):
o t = σ W o h t 1 , x t + b o h t = o t · t a n h C t
The circulation gate is parallel to each Long Short-Term Memory Neural Network unit and is only responsible for transmitting information between each unit. Therefore, it only consists of several linear operations, which enable the transmitted information to remain unchanged.
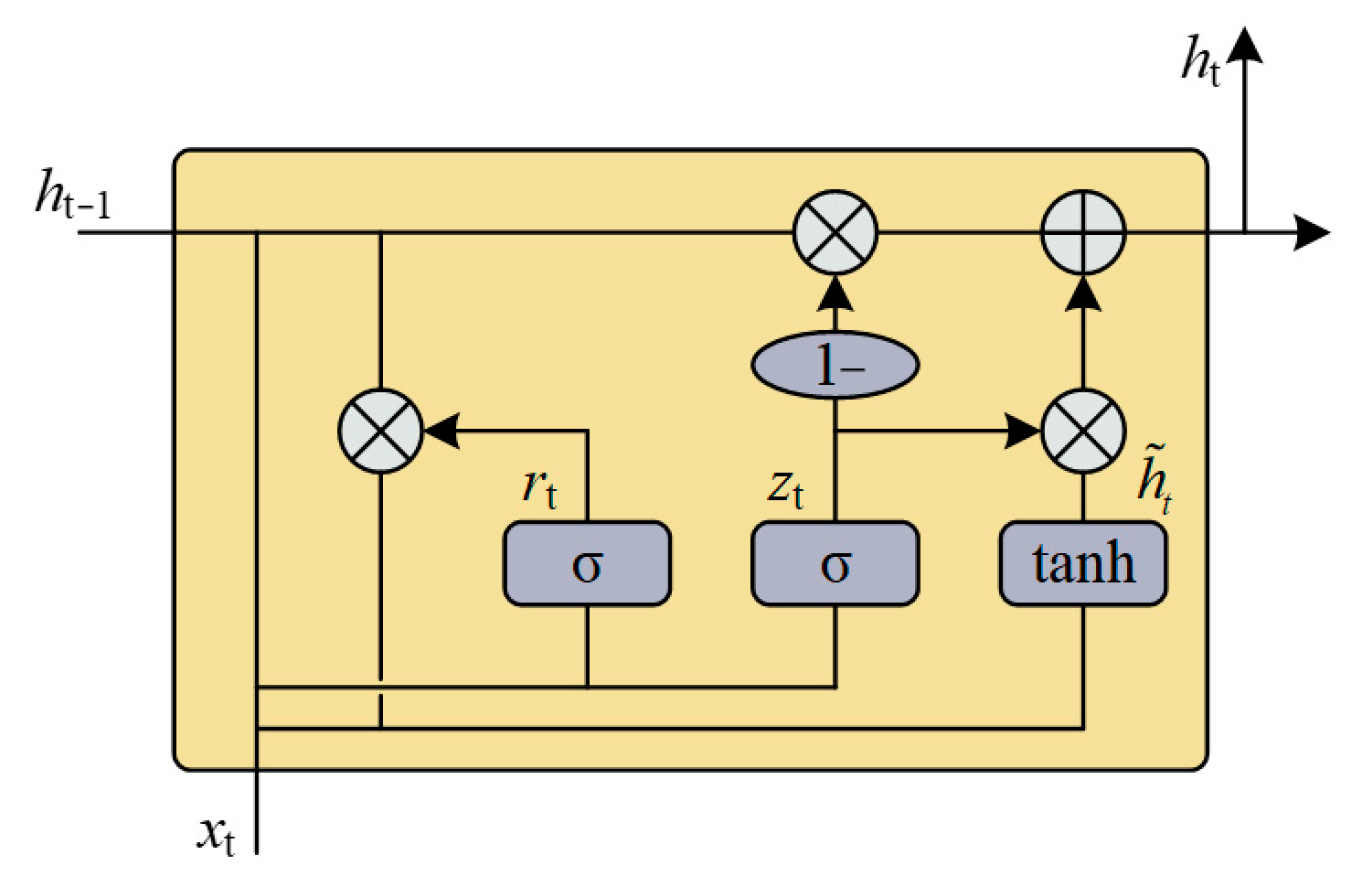
Based on practical considerations, this paper adopts GRU (Gated Recurrent Unit), a variant of LSTM, to construct the fuel injection pressure monitoring model. It combines the forget gate and the input gate into a single update gate. It also combines the cell state and the hidden state, and makes other modifications. The final model is simpler than the standard LSTM model. In many cases, GRU and LSTM show little difference in actual performance, but GRU is easier to train by comparison. This can greatly improve training efficiency and facilitate the future establishment of the in-cylinder pressure monitoring system. Figure 16 shows the schematic diagram of GRU.
Figure 16. Schematic diagram of GRU.
The working process of GRU is shown in Formula (10):
z t   =   σ W z h t 1 , x t   r t   =   σ W r h t 1 , x t ~ h t   =   t a n h W · r t · h t 1 , x t h t   =   1     z · h t 1   +   z t · ~ h t
To improve the prediction accuracy, this paper uses the cross-entropy loss function instead of the original gradient loss function. This is a commonly used loss function in machine learning, which can make the predicted probability distribution close to the distribution of the observed data, that is, the predicted distribution is close to the actual distribution. The calculation formula of the cross-entropy loss function is shown in Formula (11):
m i n D V L S G A N D = 1 2 E x ~ p d a t a x D x b 2 + 1 2 E x ~ p z z z D G z a 2 m i n G V L S G A N G = 1 2 E x ~ p z z x D G z c 2

4. Experiment and Result Analysis

This paper takes nine operating conditions under normal operation as examples (Operating Condition 1 to 9) to train and validate the diesel engine in-cylinder pressure monitoring model. In total, 20 working cycles are selected for each operating condition, totaling 180 sets of torque signals and 2880 sets of in-cylinder pressure and piston motion signals to form the training set, where the torque and piston motion signals are the input signals of the monitoring model, and the in-cylinder pressure signal is the target signal. A total of 10 working cycles are selected for each operating condition, totaling 90 sets of torque signals and 1440 sets of in-cylinder pressure and piston motion signals to form the test set, which are numbered in sequence. For the convenience of training, Newton interpolation method is used to reconstruct the signals of the above nine operating conditions into a form with one data point every 2 degrees, that is, data are collected once every 2 degrees of crankshaft rotation. The reconstructed torque, in-cylinder pressure, and piston motion signals have 360 data points in one working cycle.
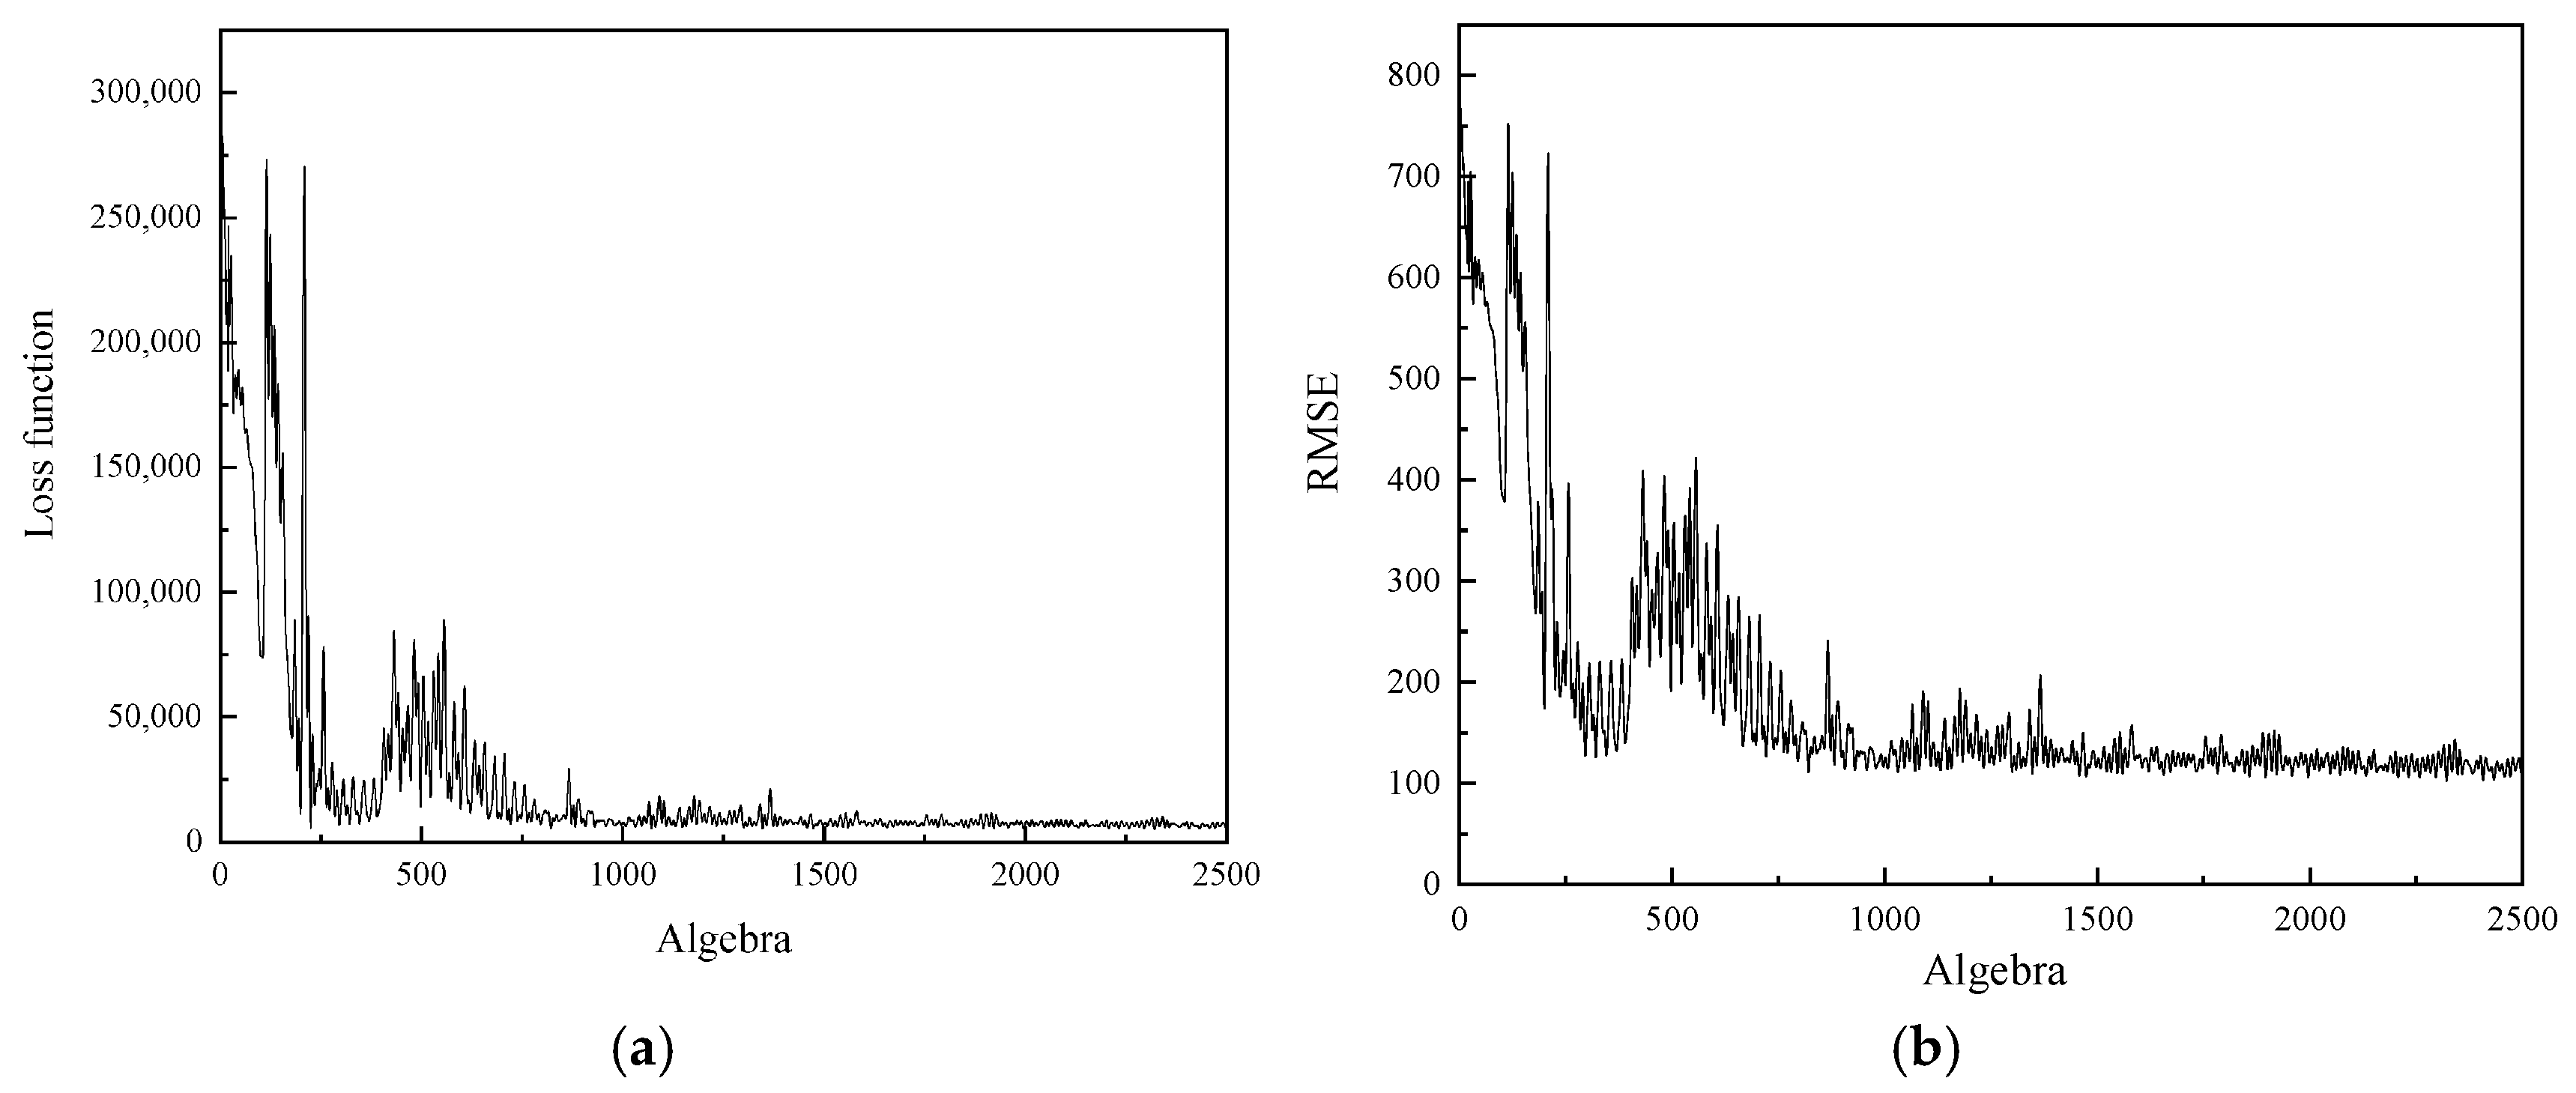
The GRU is constructed as described in Chapter 3, with 1 hidden layer, 600 hidden layer nodes, 32 iterations per round, a maximum of 2500 iterations, an initial learning rate of 0.012, a discrete descent method to change the learning rate, and Adam optimization. The variation curves of the loss function and RMSE with the number of iterations during training are shown in Figure 17. The average training time for 100 times is 71 s, and the test time is negligible.
Figure 17. Loss function and RMSE. (a) Loss function; (b) RMSE.
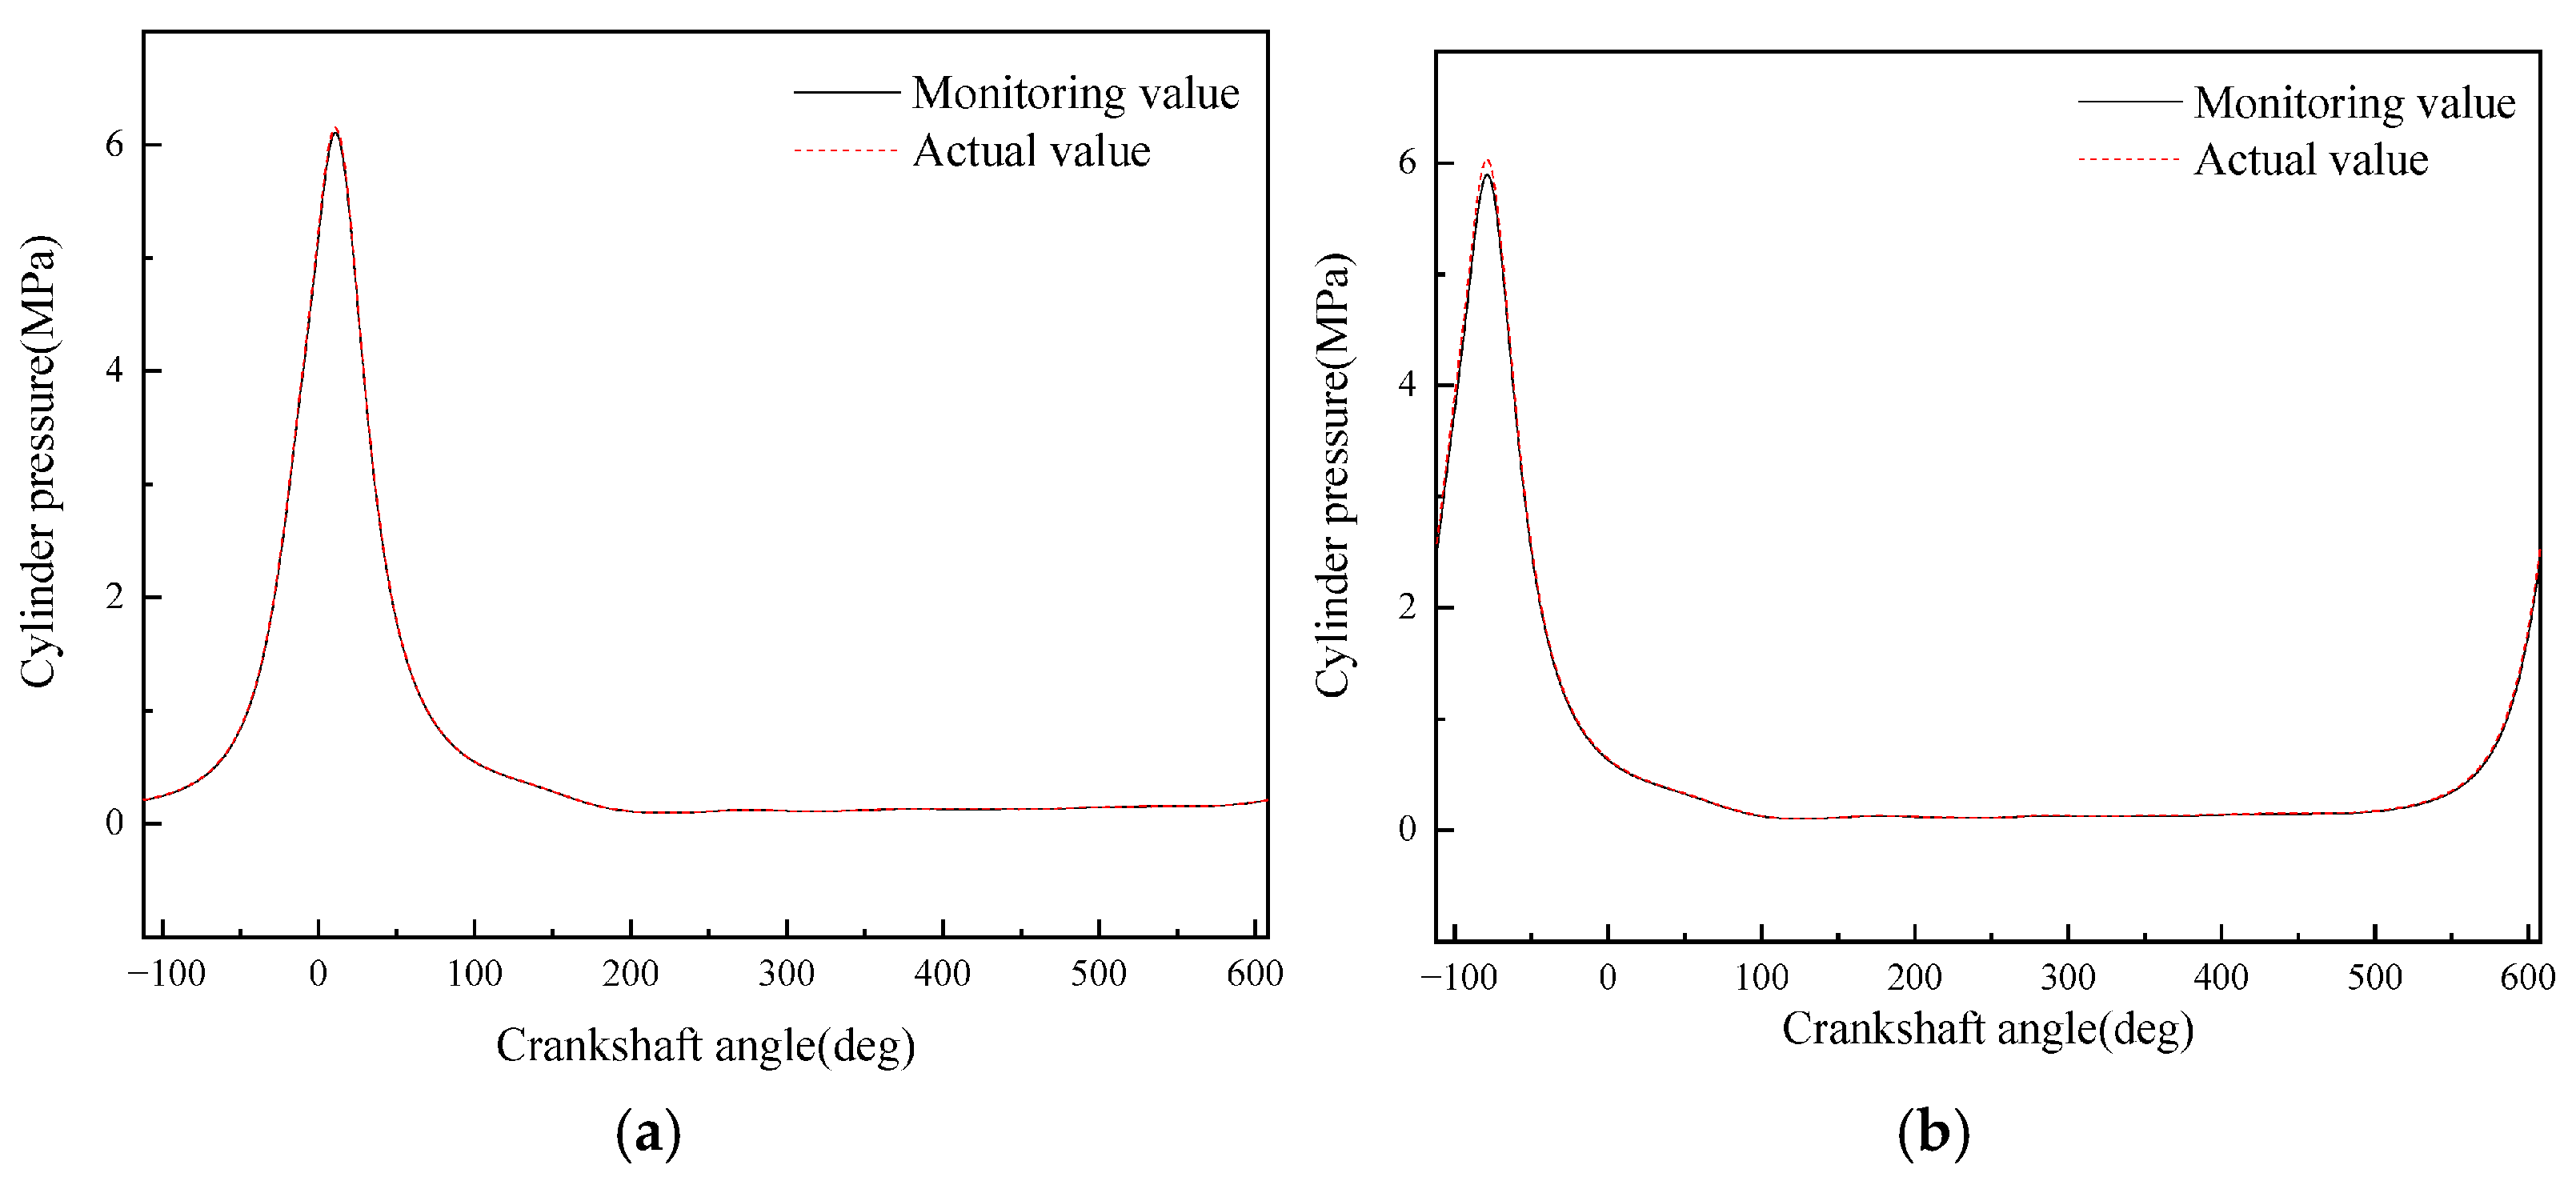
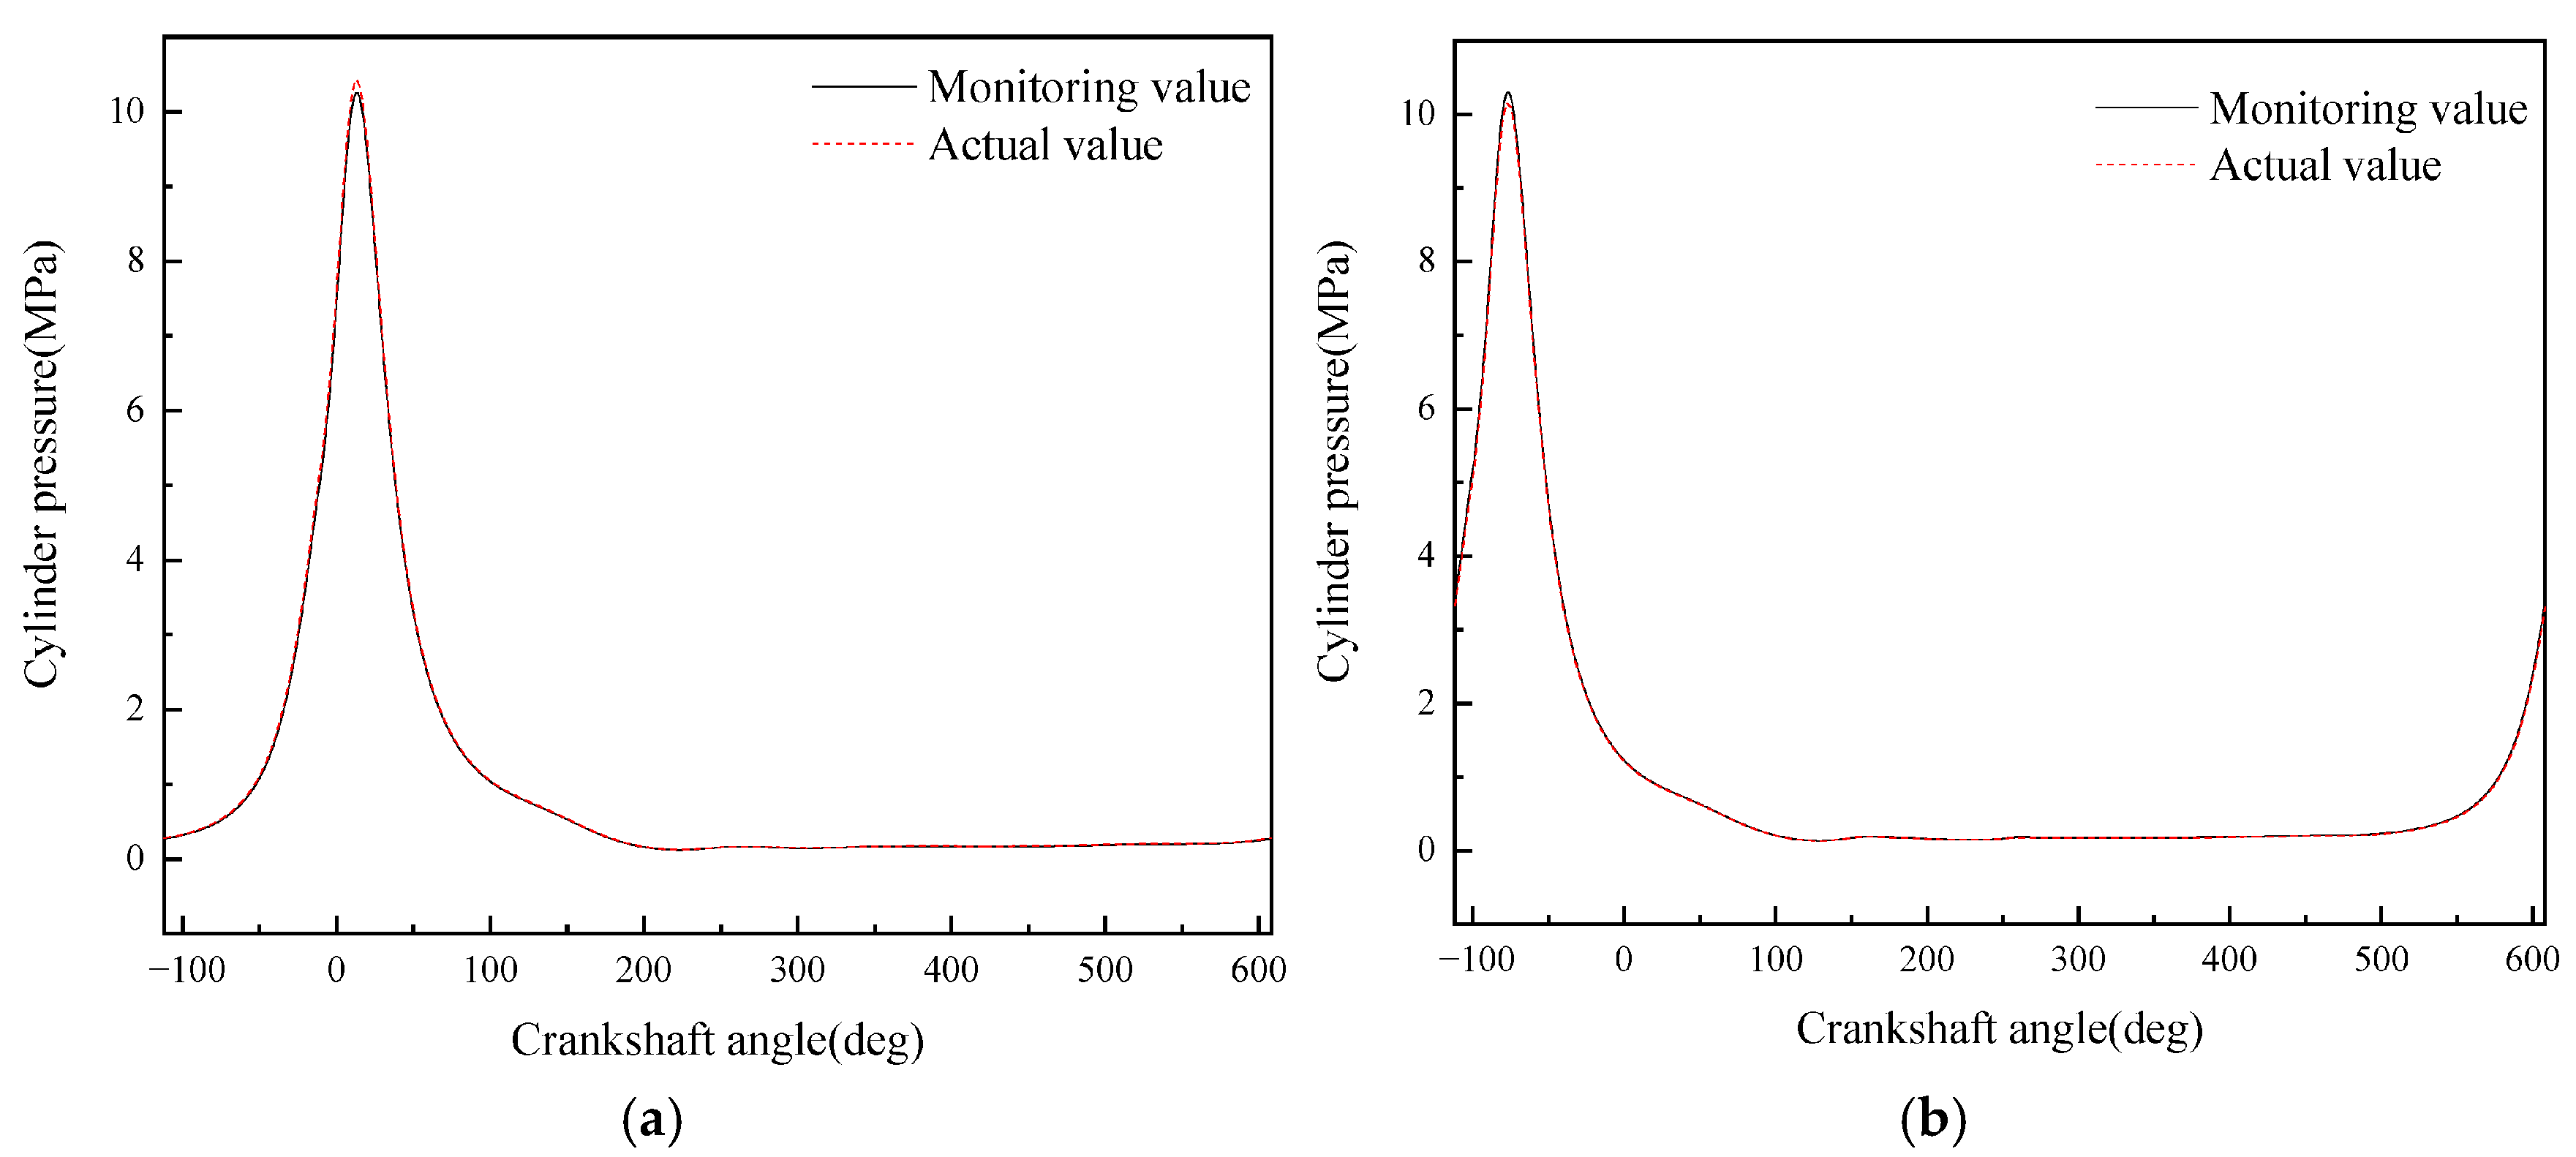
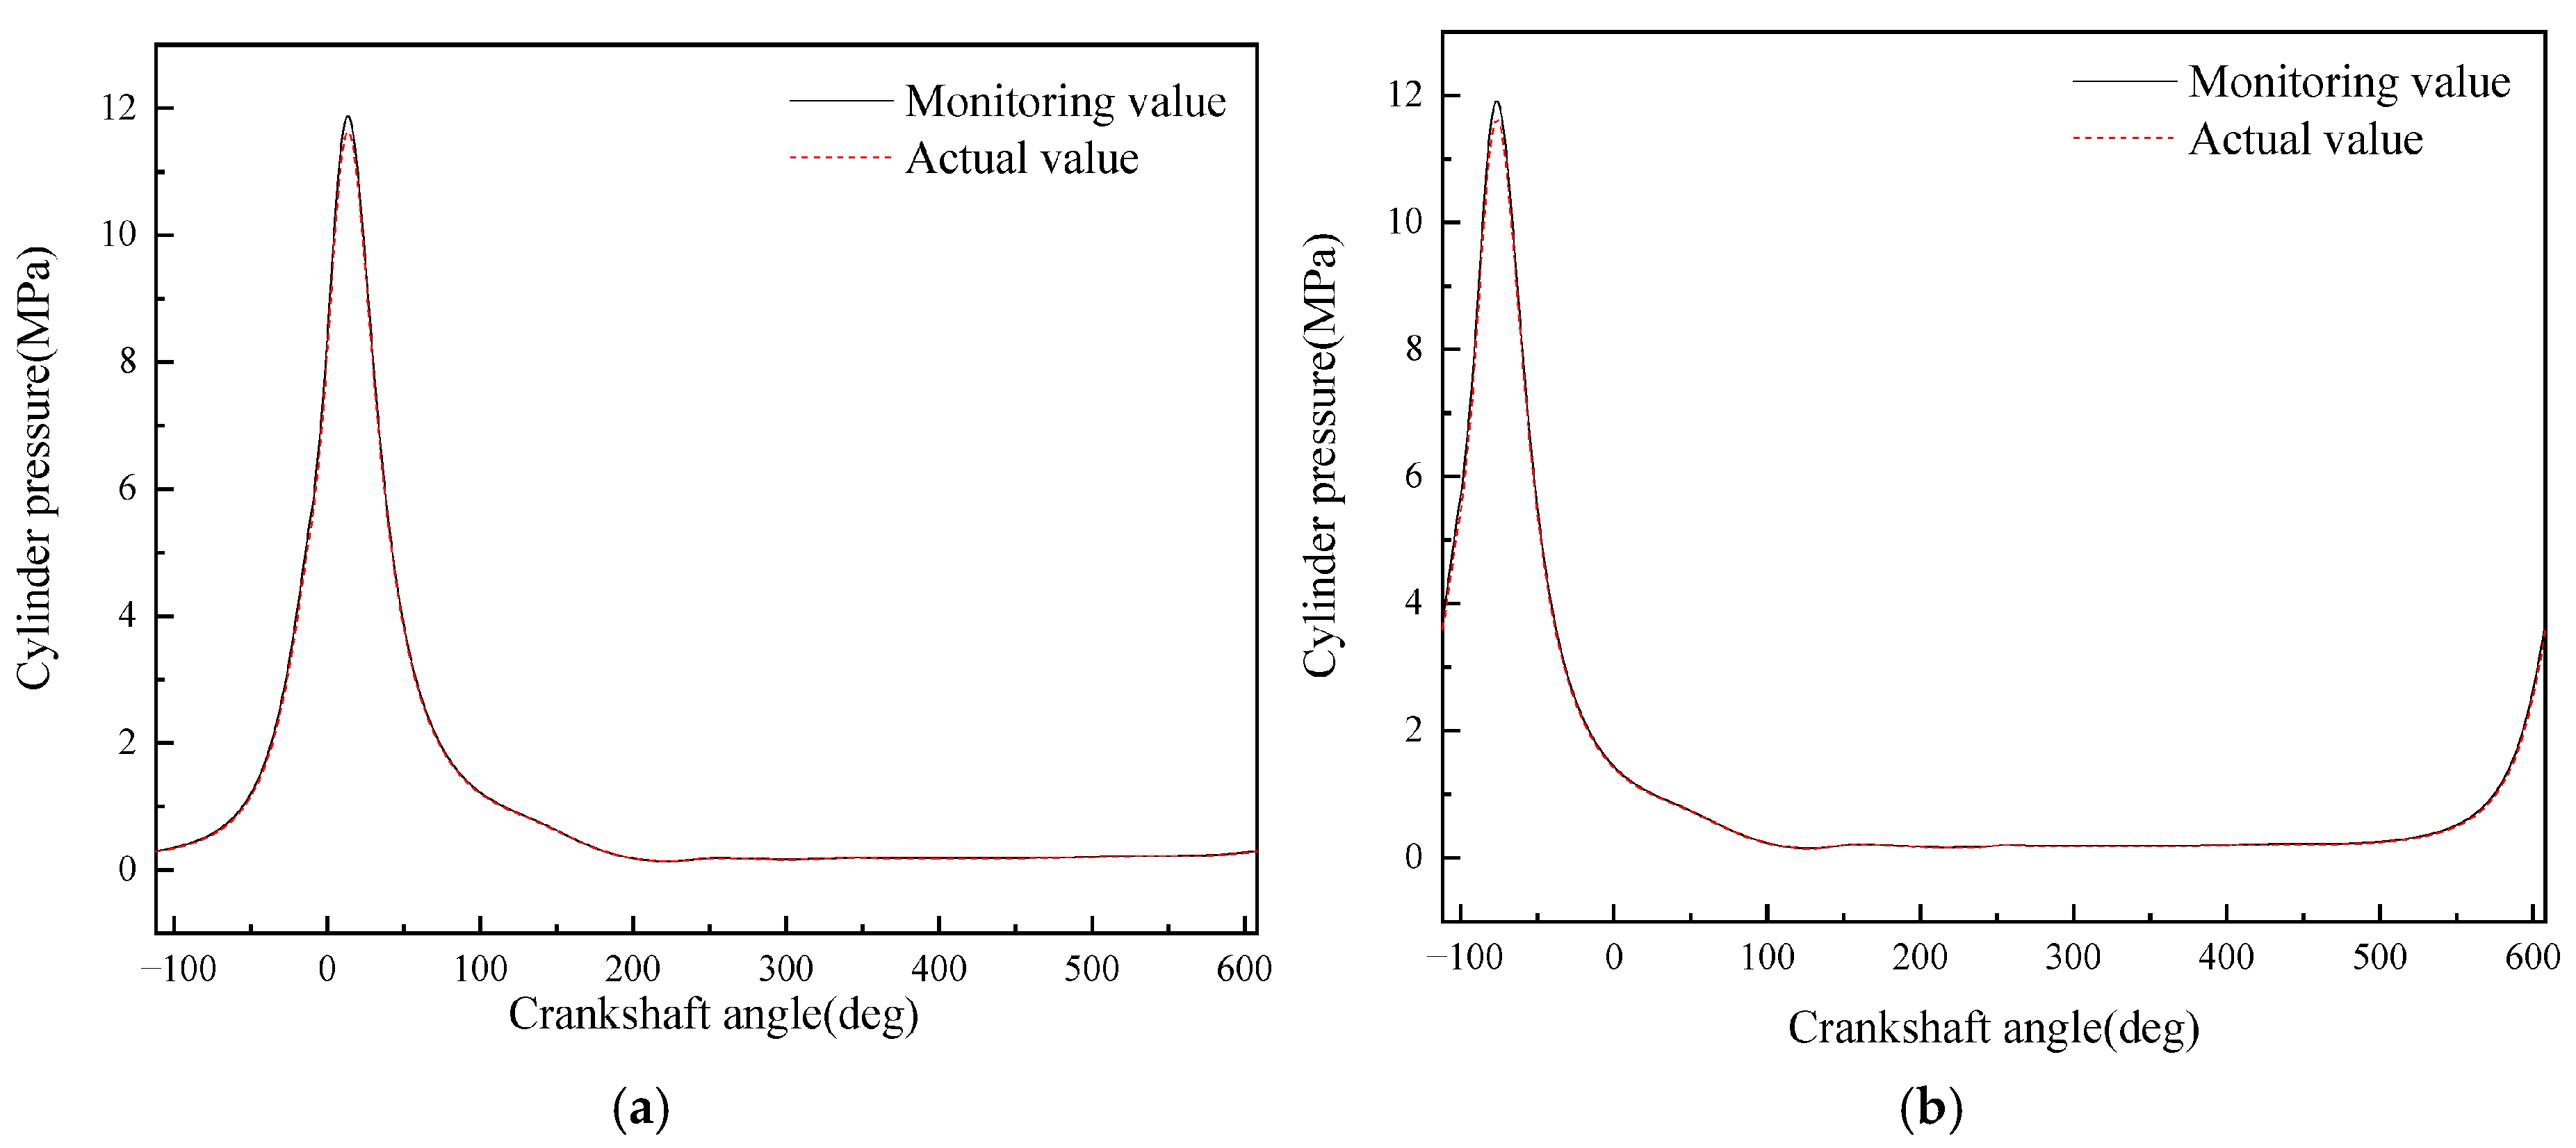
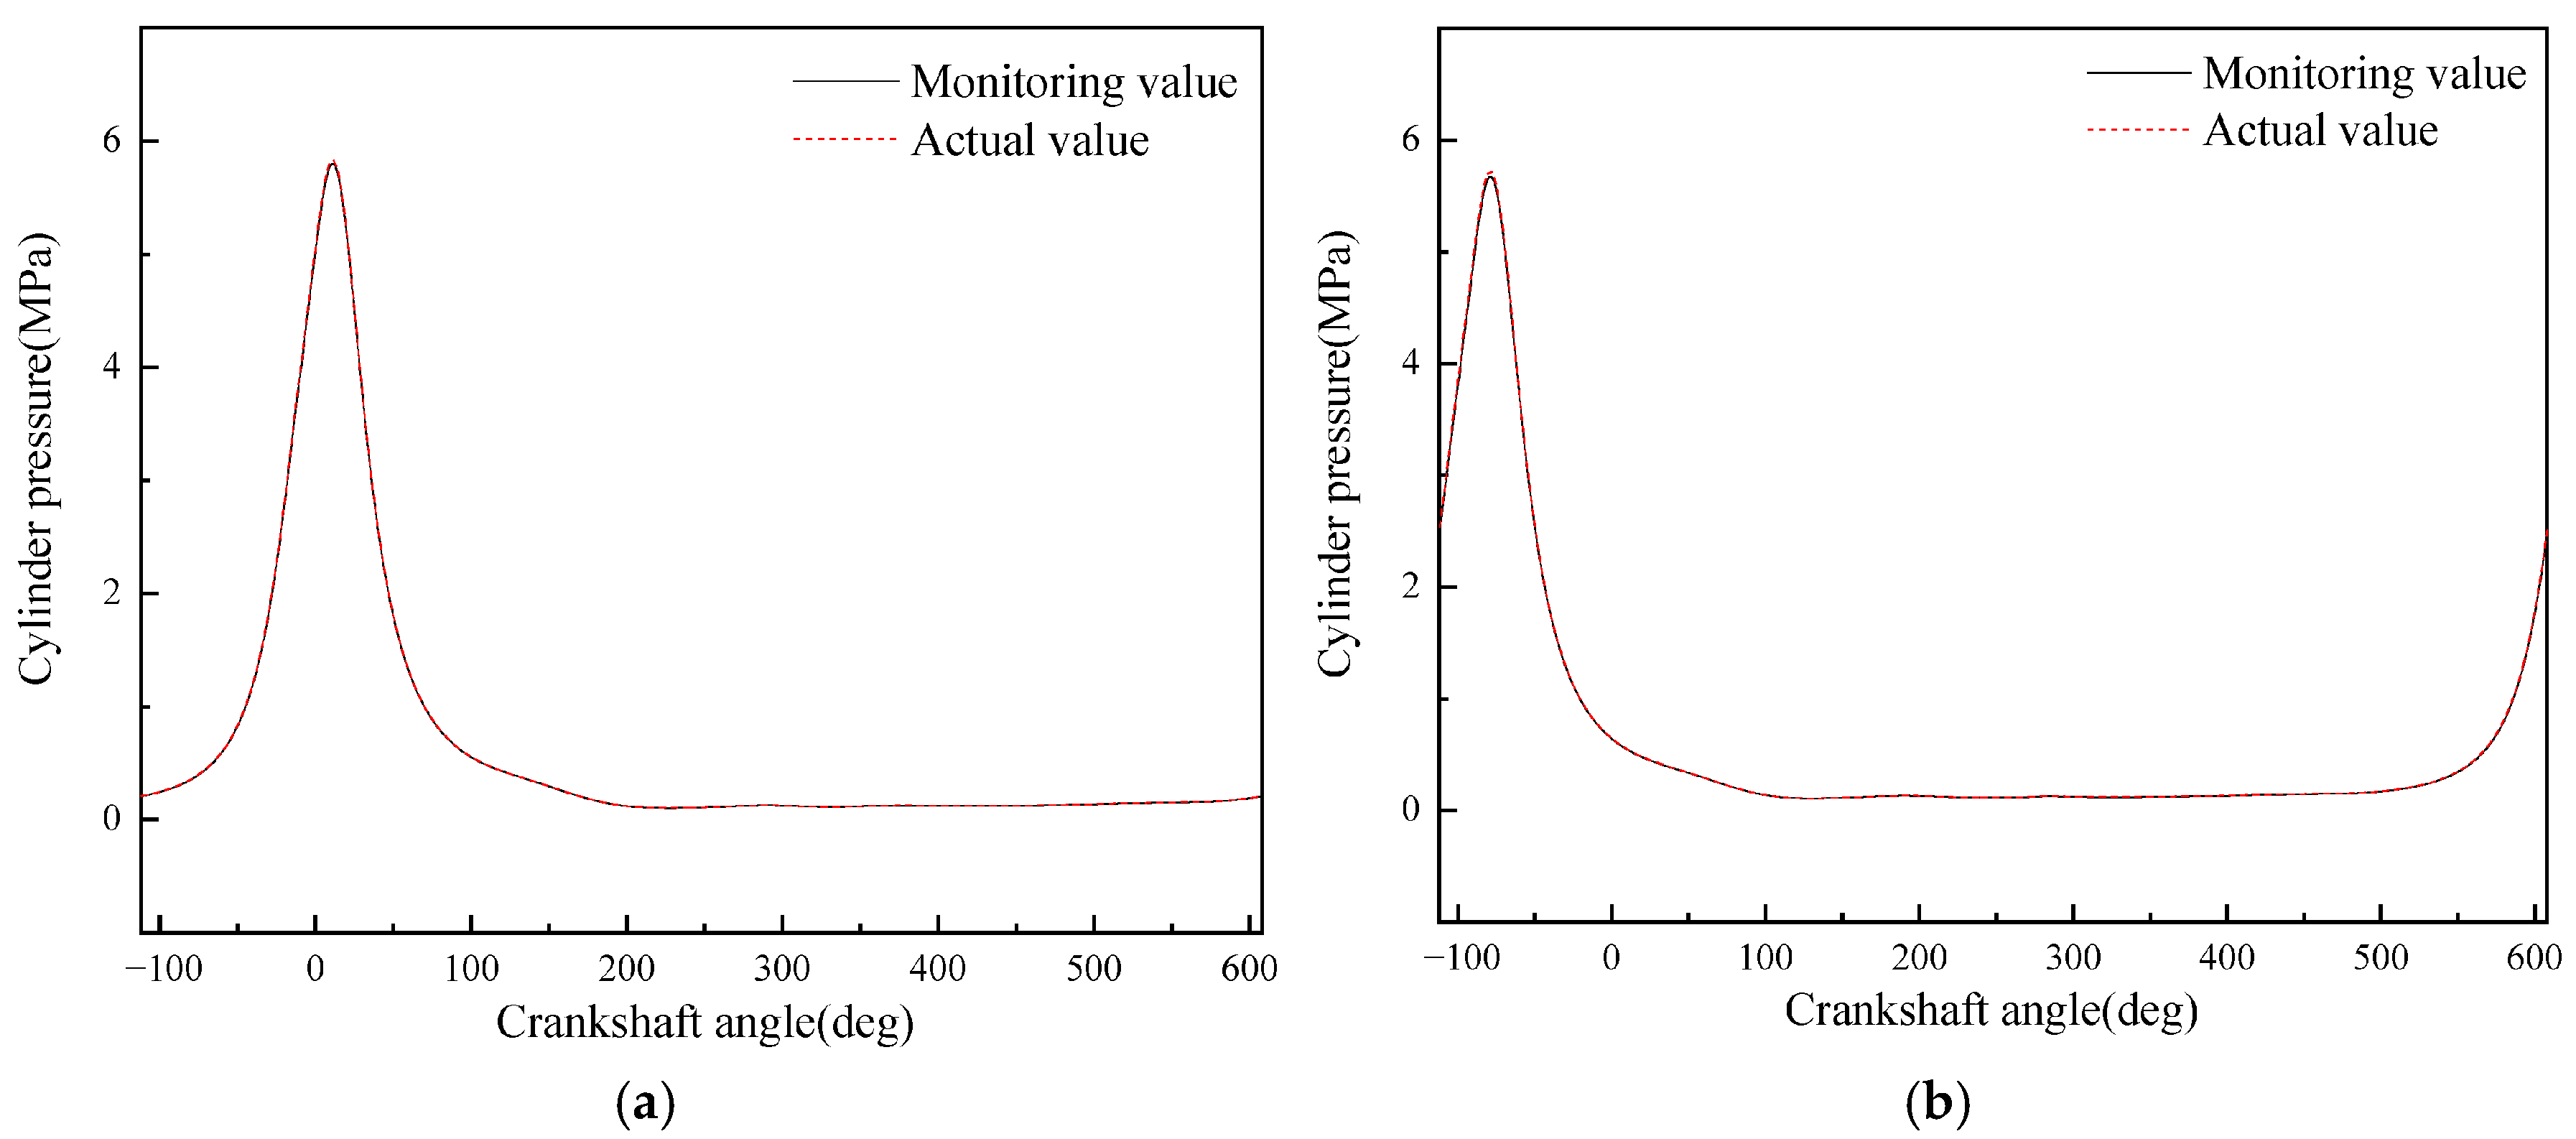
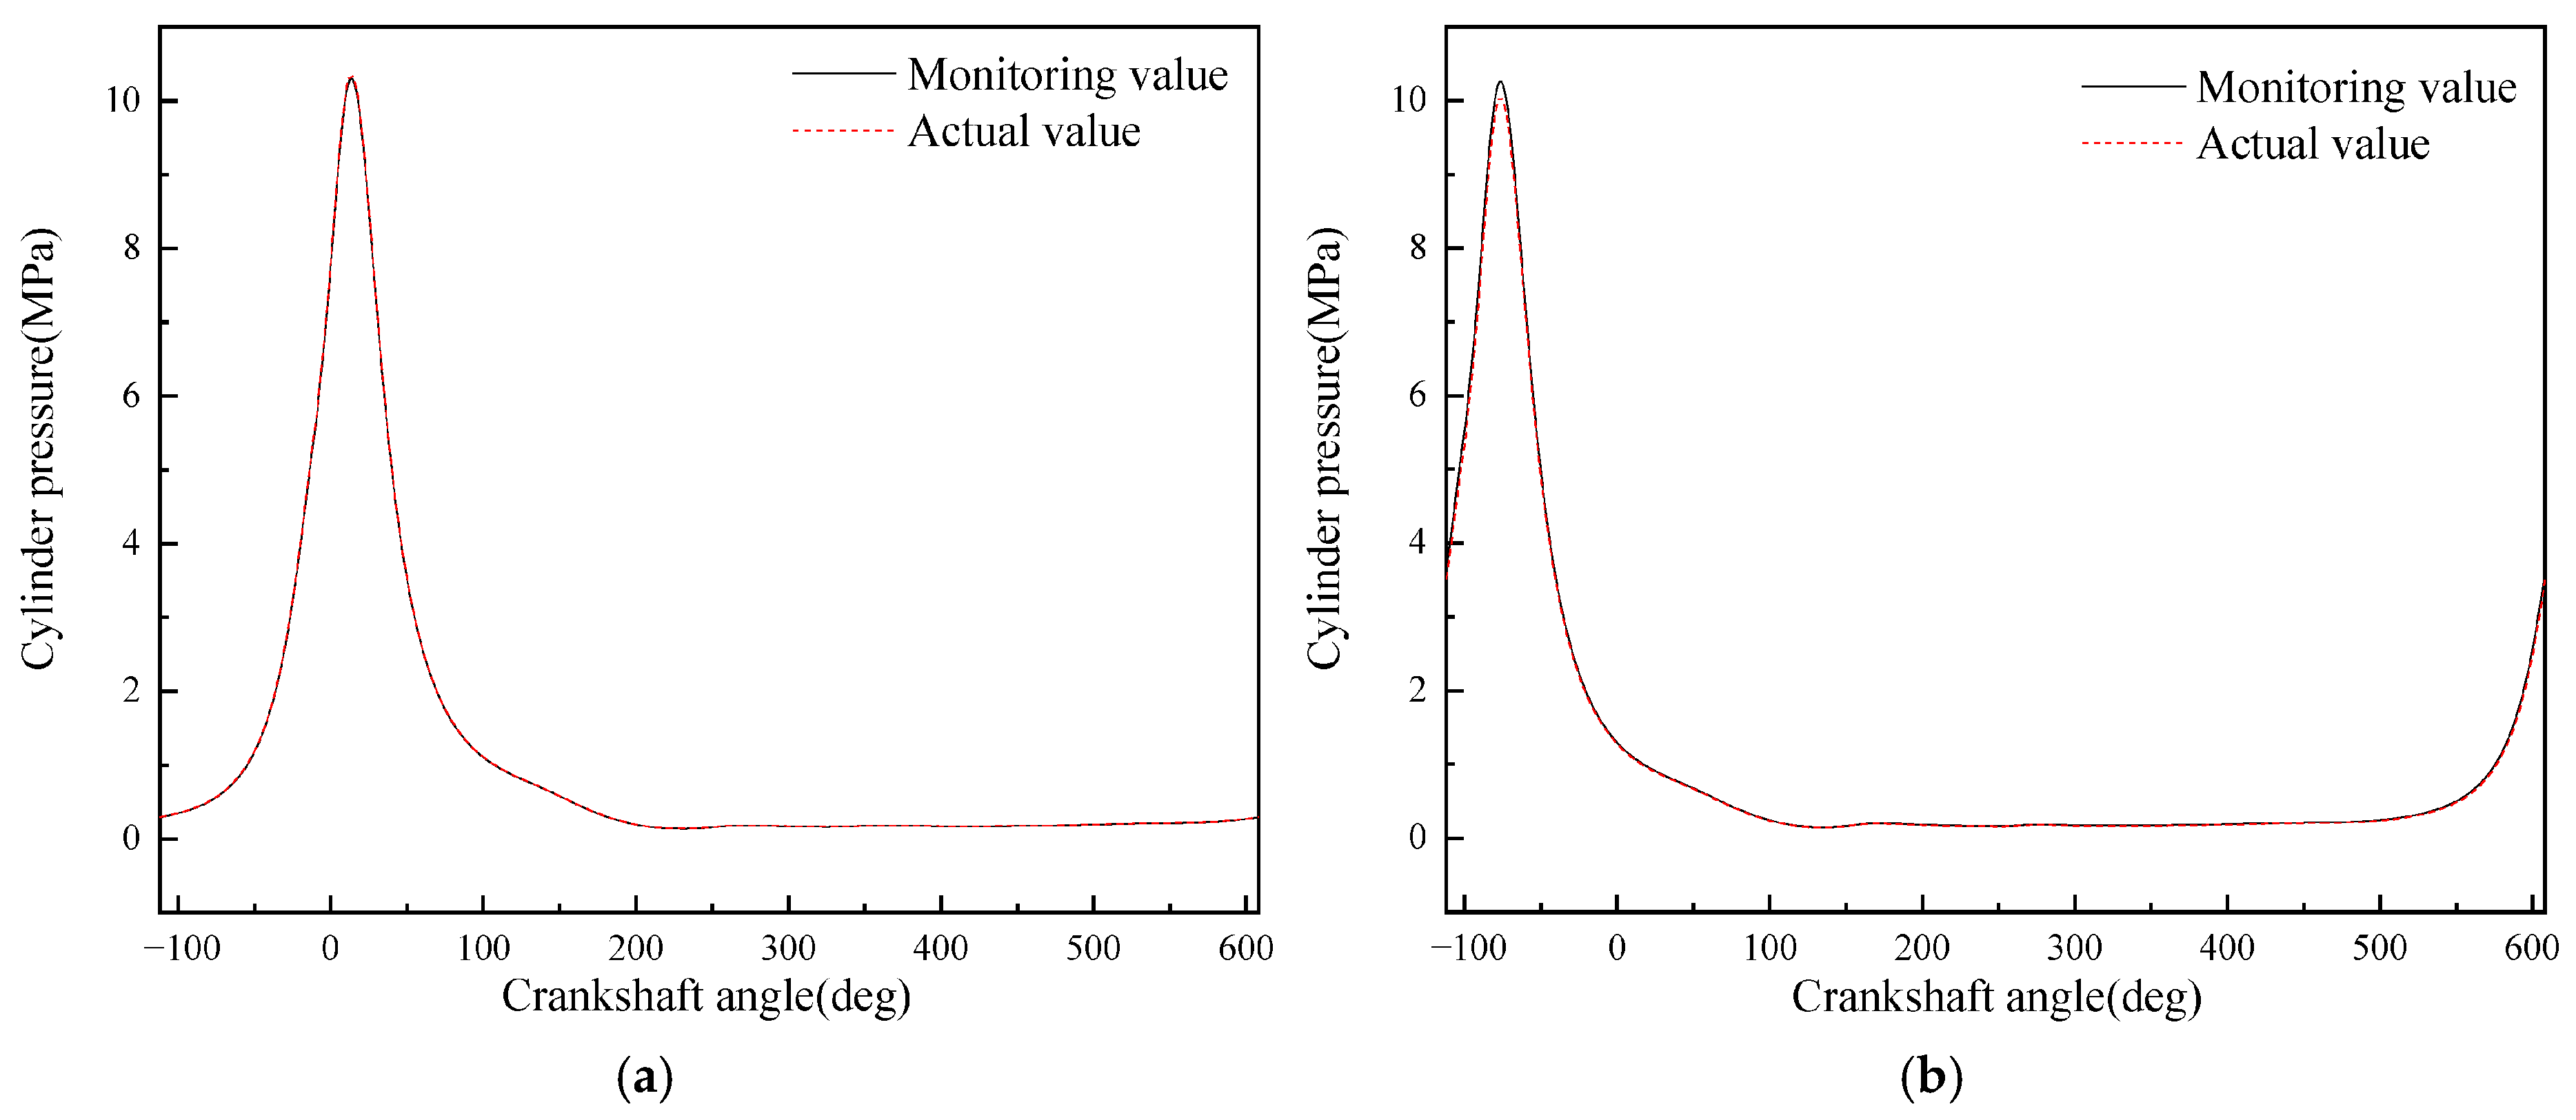
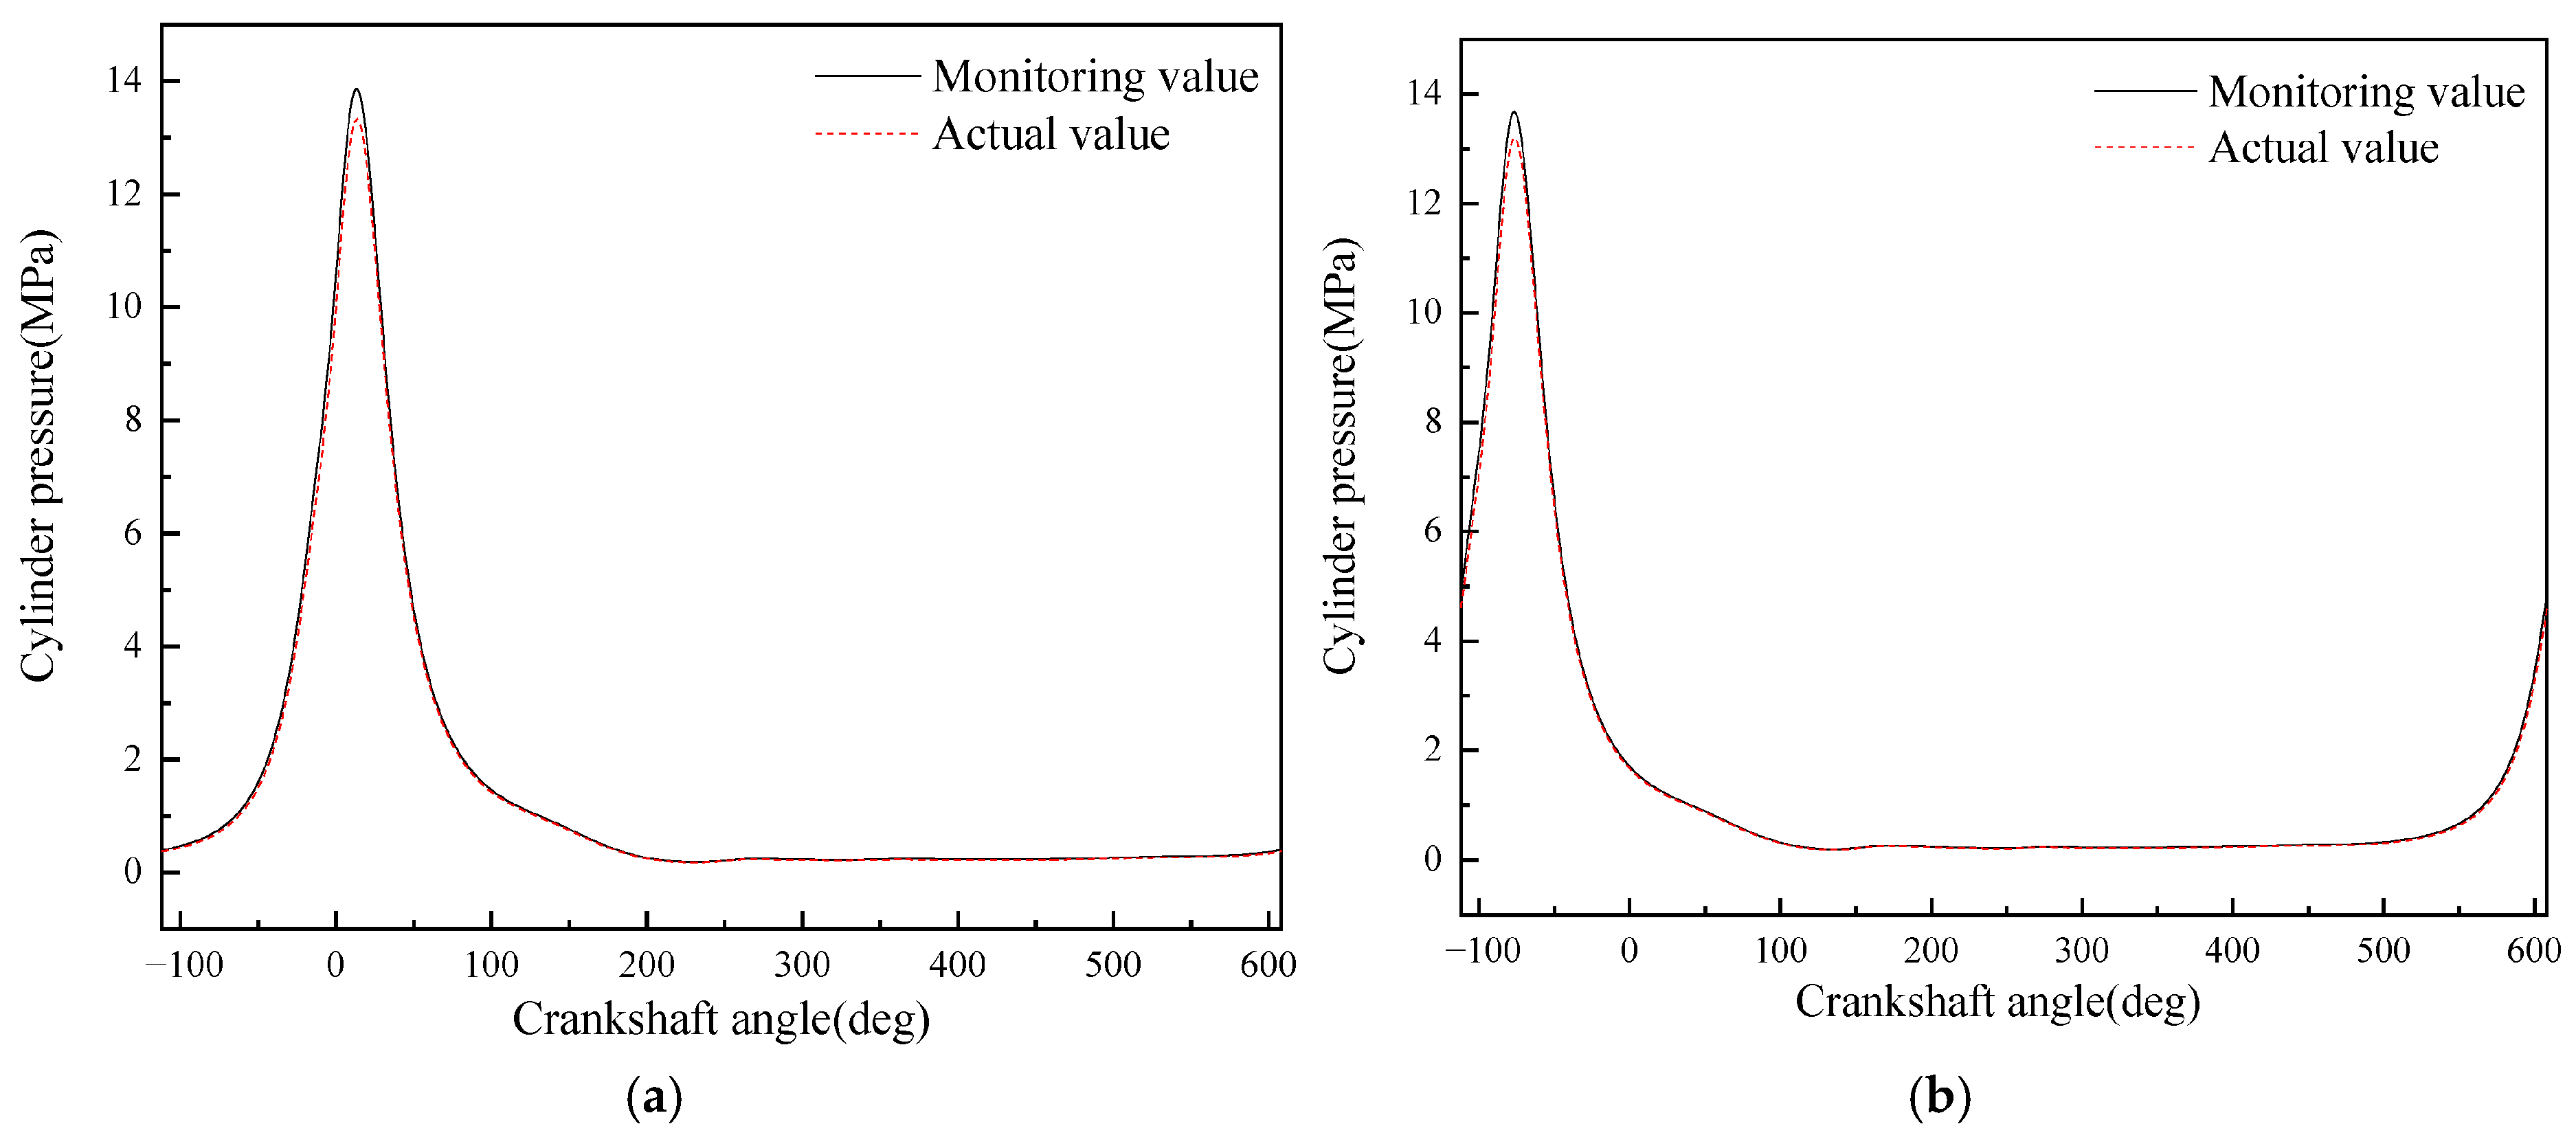
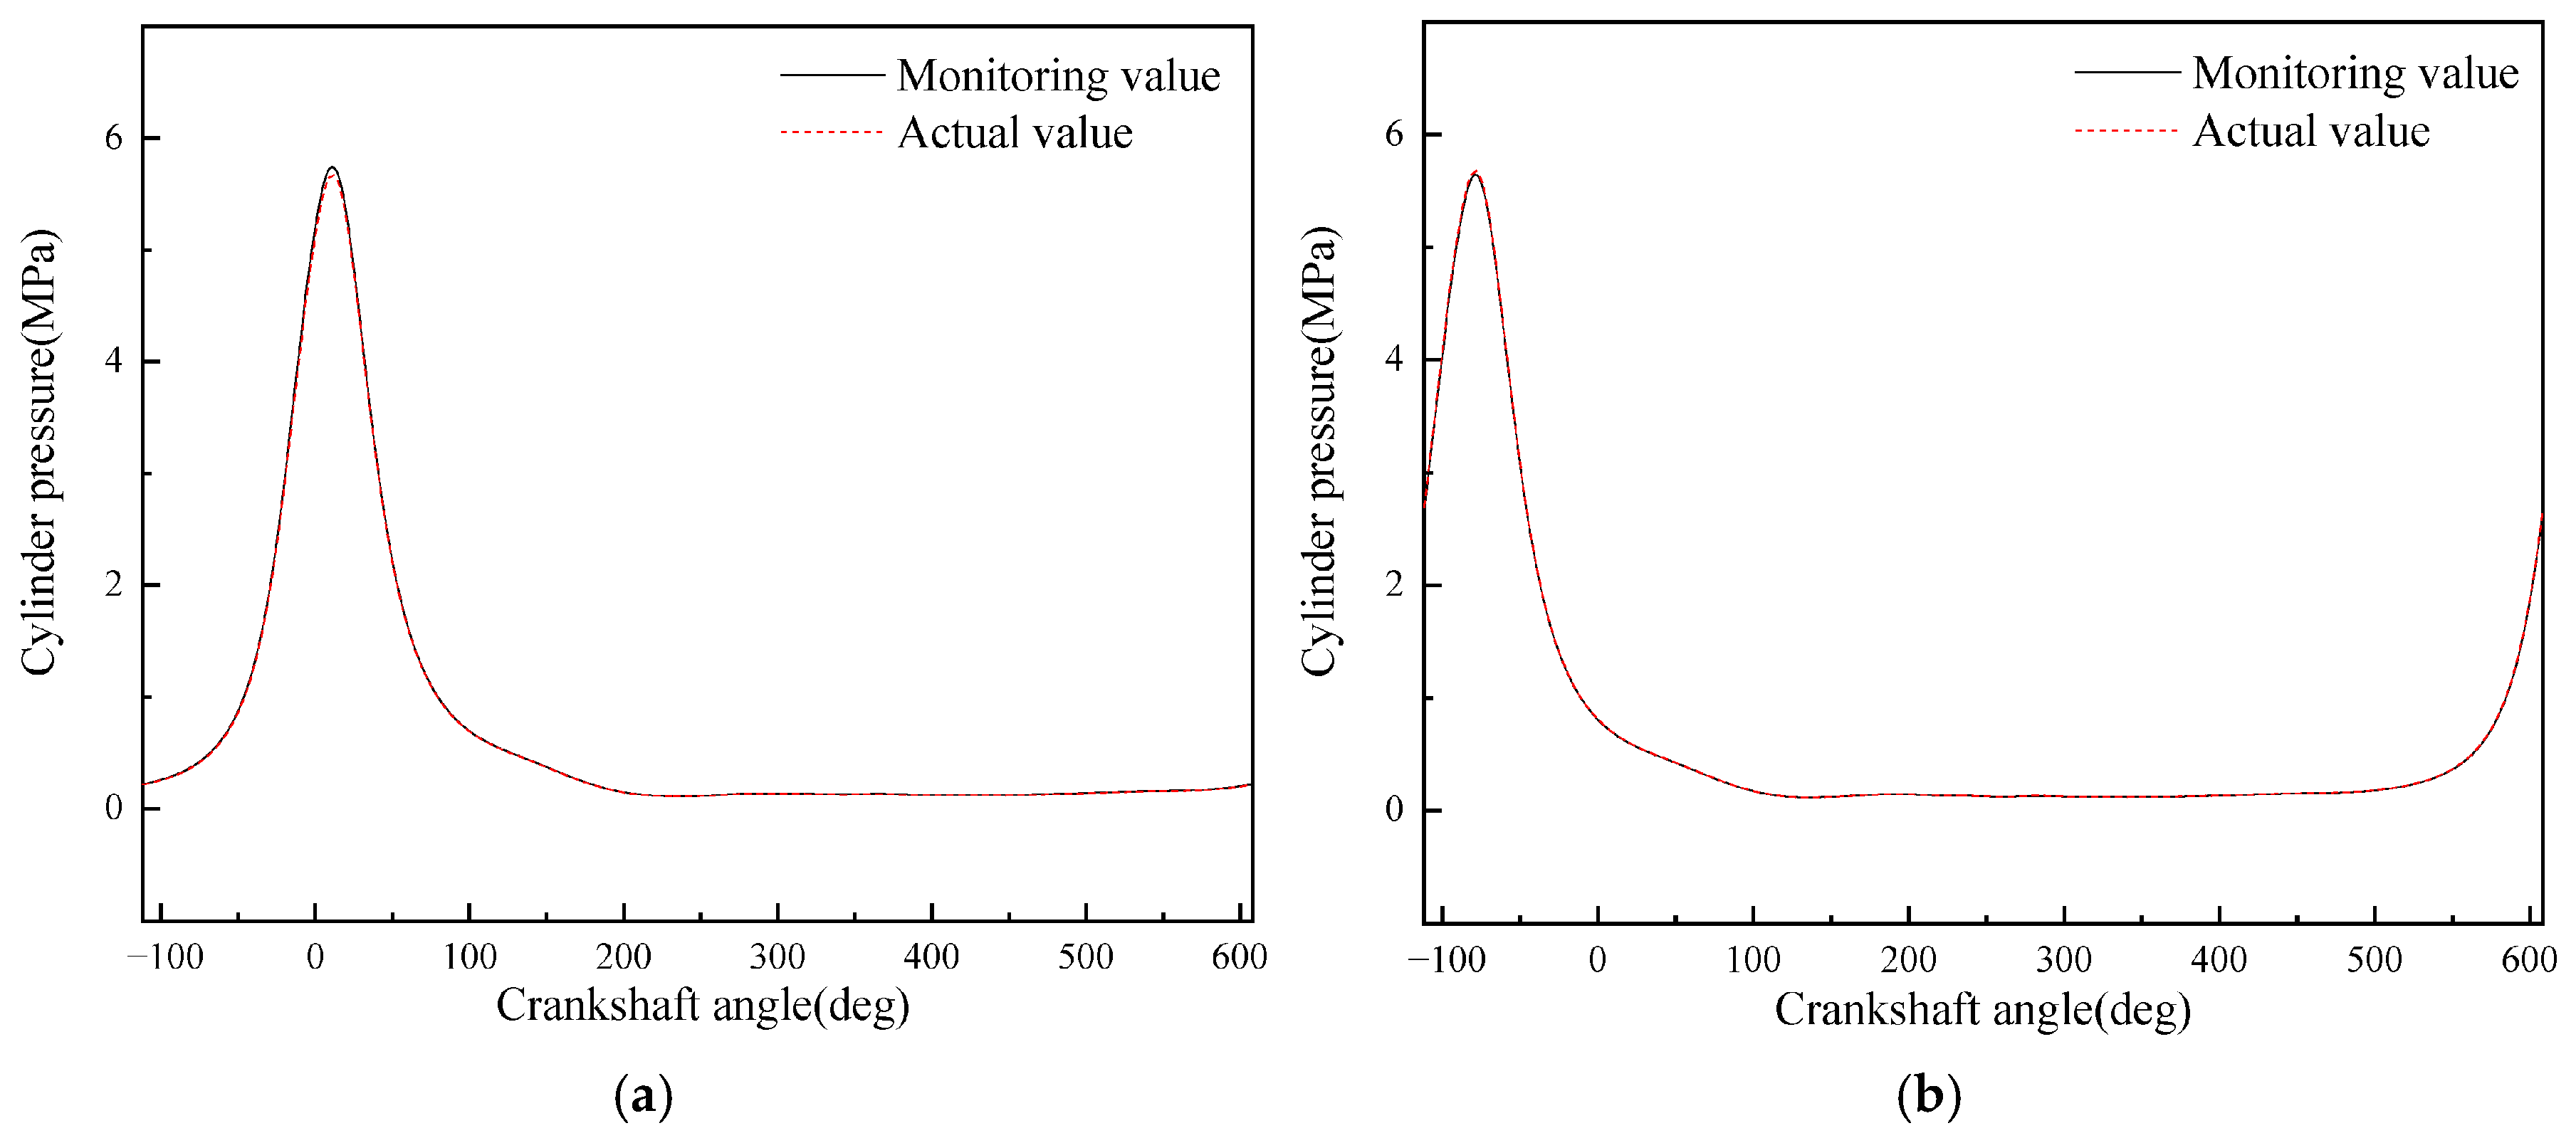
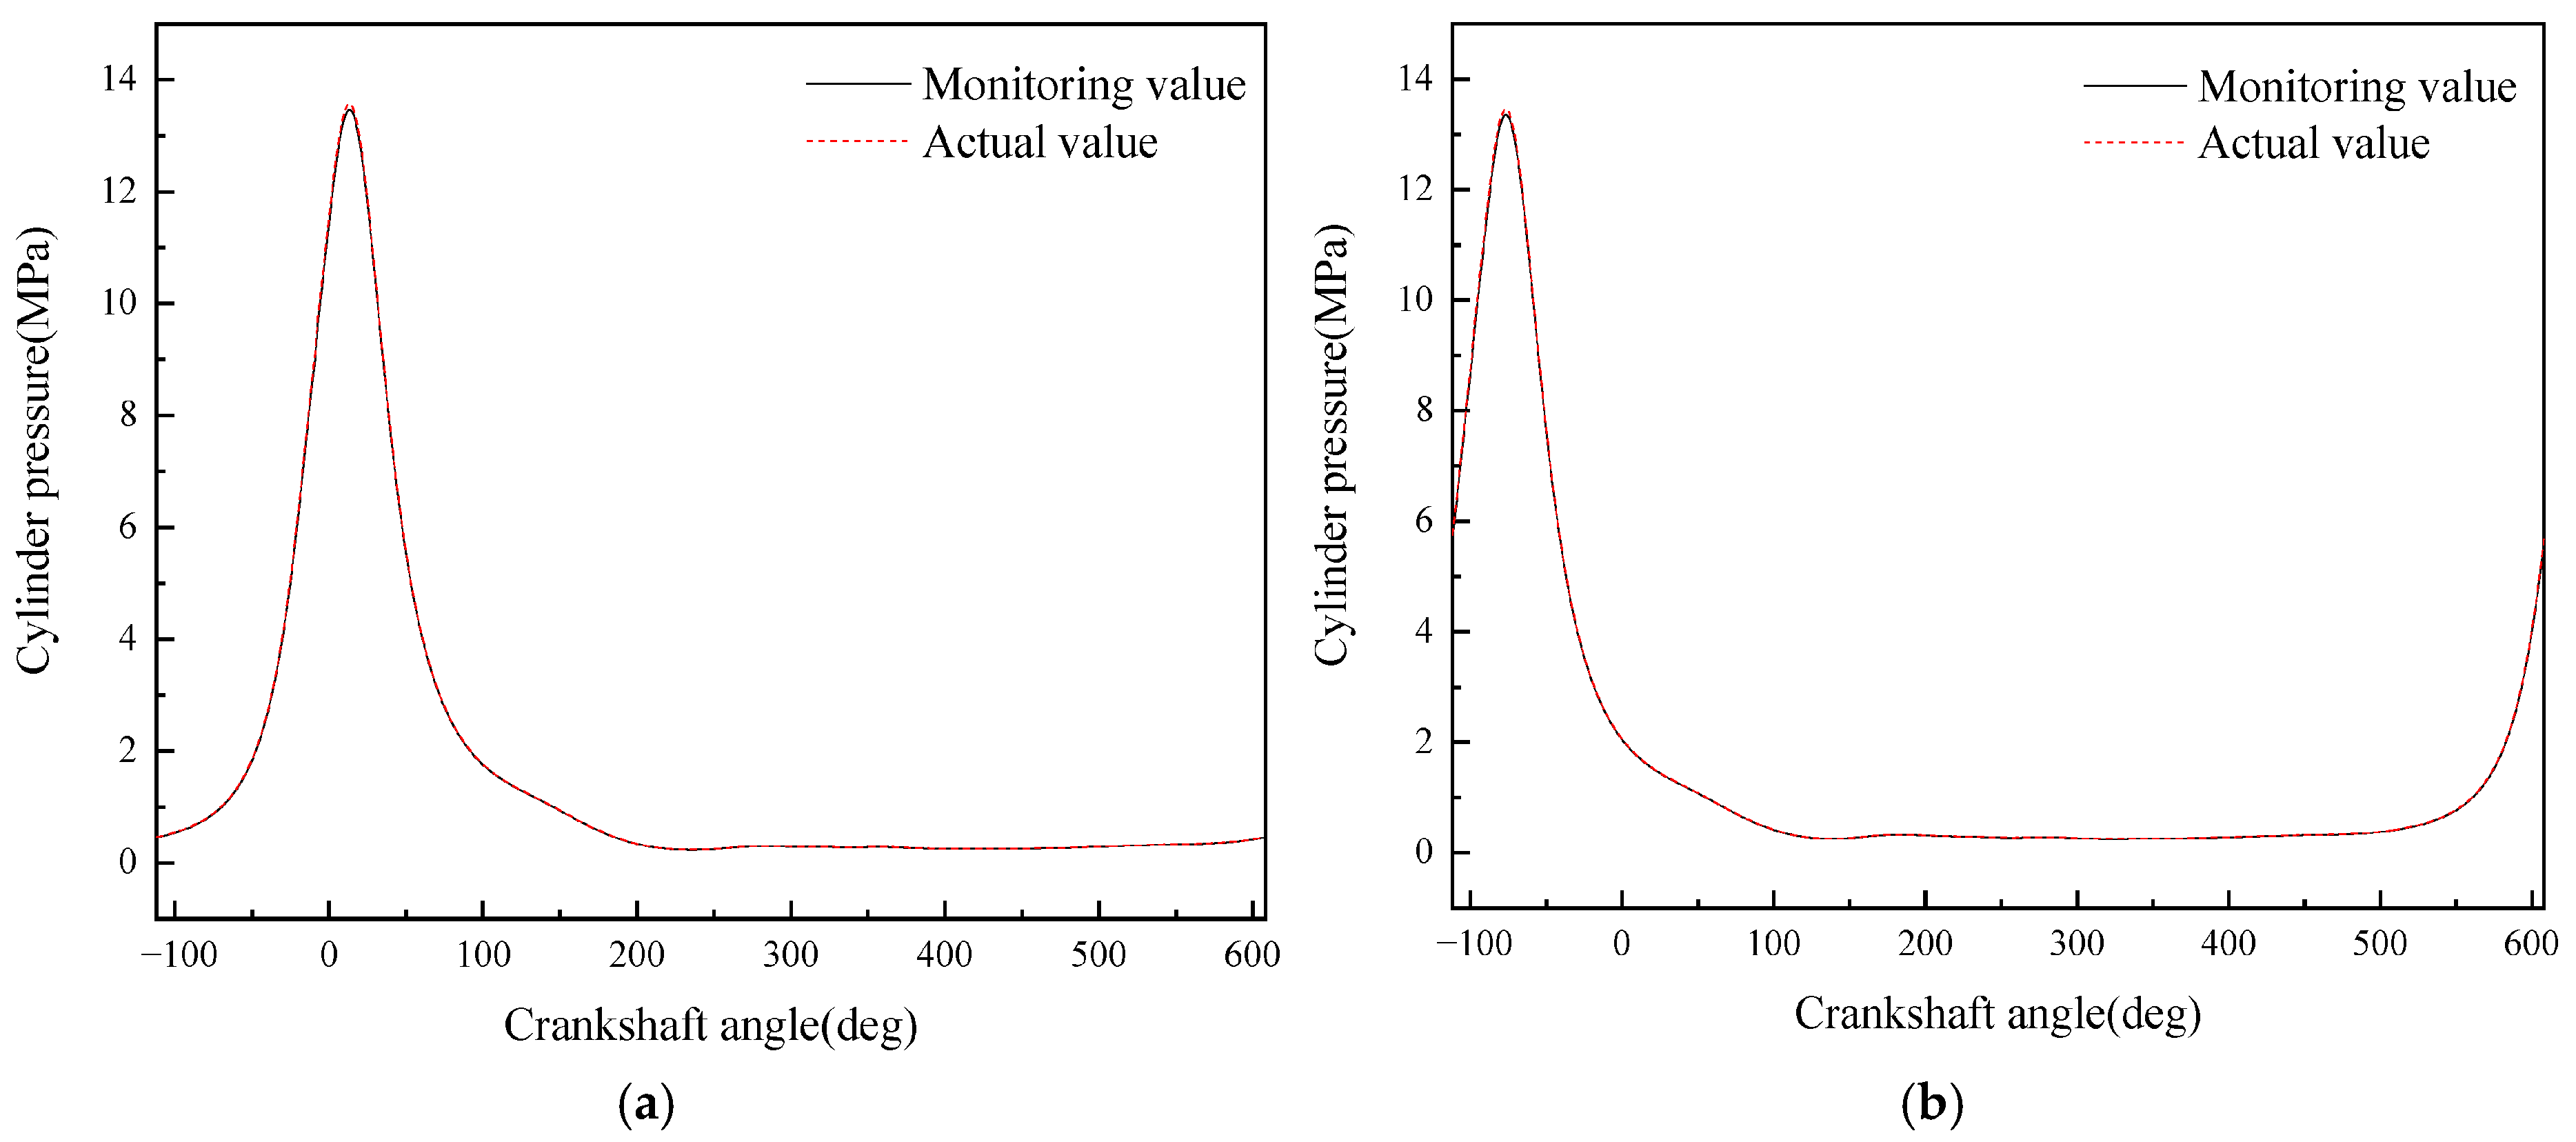
The test set is input into the trained monitoring model. For each operating condition, the monitored in-cylinder pressure curves of Cylinder 1 and Cylinder 9 in any one set of data are selected. A total of 18 sets of comparison diagrams between the monitored in-cylinder pressure curves and the actual in-cylinder pressure curves are shown in Figure 18, Figure 19, Figure 20, Figure 21, Figure 22, Figure 23, Figure 24, Figure 25 and Figure 26. It can be seen from the figures that the monitored values are in good agreement with the actual values, but there will be deviations near the maximum value.
Figure 18. Comparison between monitored and actual in-cylinder pressure under Condition 1. (a) Monitored and actual in-cylinder pressure of Cylinder 1; (b) monitored and actual in-cylinder pressure of Cylinder 9.
Figure 19. Comparison between monitored and actual in-cylinder pressure under Condition 2. (a) Monitored and actual in-cylinder pressure of Cylinder 1; (b) monitored and actual in-cylinder pressure of Cylinder 9.
Figure 20. Comparison between monitored and actual in-cylinder pressure under Condition 3. (a) Monitored and actual in-cylinder pressure of Cylinder 1; (b) monitored and actual in-cylinder pressure of Cylinder 9.
Figure 21. Comparison between monitored and actual in-cylinder pressure under Condition 4. (a) Monitored and actual in-cylinder pressure of Cylinder 1; (b) monitored and actual in-cylinder pressure of Cylinder 9.
Figure 22. Comparison between monitored and actual in-cylinder pressure under Condition 5. (a) Monitored and actual in-cylinder pressure of Cylinder 1; (b) monitored and actual in-cylinder pressure of Cylinder 9.
Figure 23. Comparison between monitored and actual in-cylinder pressure under Condition 6. (a) Monitored and actual in-cylinder pressure of Cylinder 1; (b) monitored and actual in-cylinder pressure of Cylinder 9.
Figure 24. Comparison between monitored and actual in-cylinder pressure under Condition 7. (a) Monitored and actual in-cylinder pressure of Cylinder 1; (b) monitored and actual in-cylinder pressure of Cylinder 9.
Figure 25. Comparison between monitored and actual in-cylinder pressure under Condition 8. (a) Monitored and actual in-cylinder pressure of Cylinder 1; (b) monitored and actual in-cylinder pressure of Cylinder 9.
Figure 26. Comparison between monitored and actual in-cylinder pressure under Condition 9. (a) Monitored and actual in-cylinder pressure of Cylinder 1; (b) monitored and actual in-cylinder pressure of Cylinder 9.
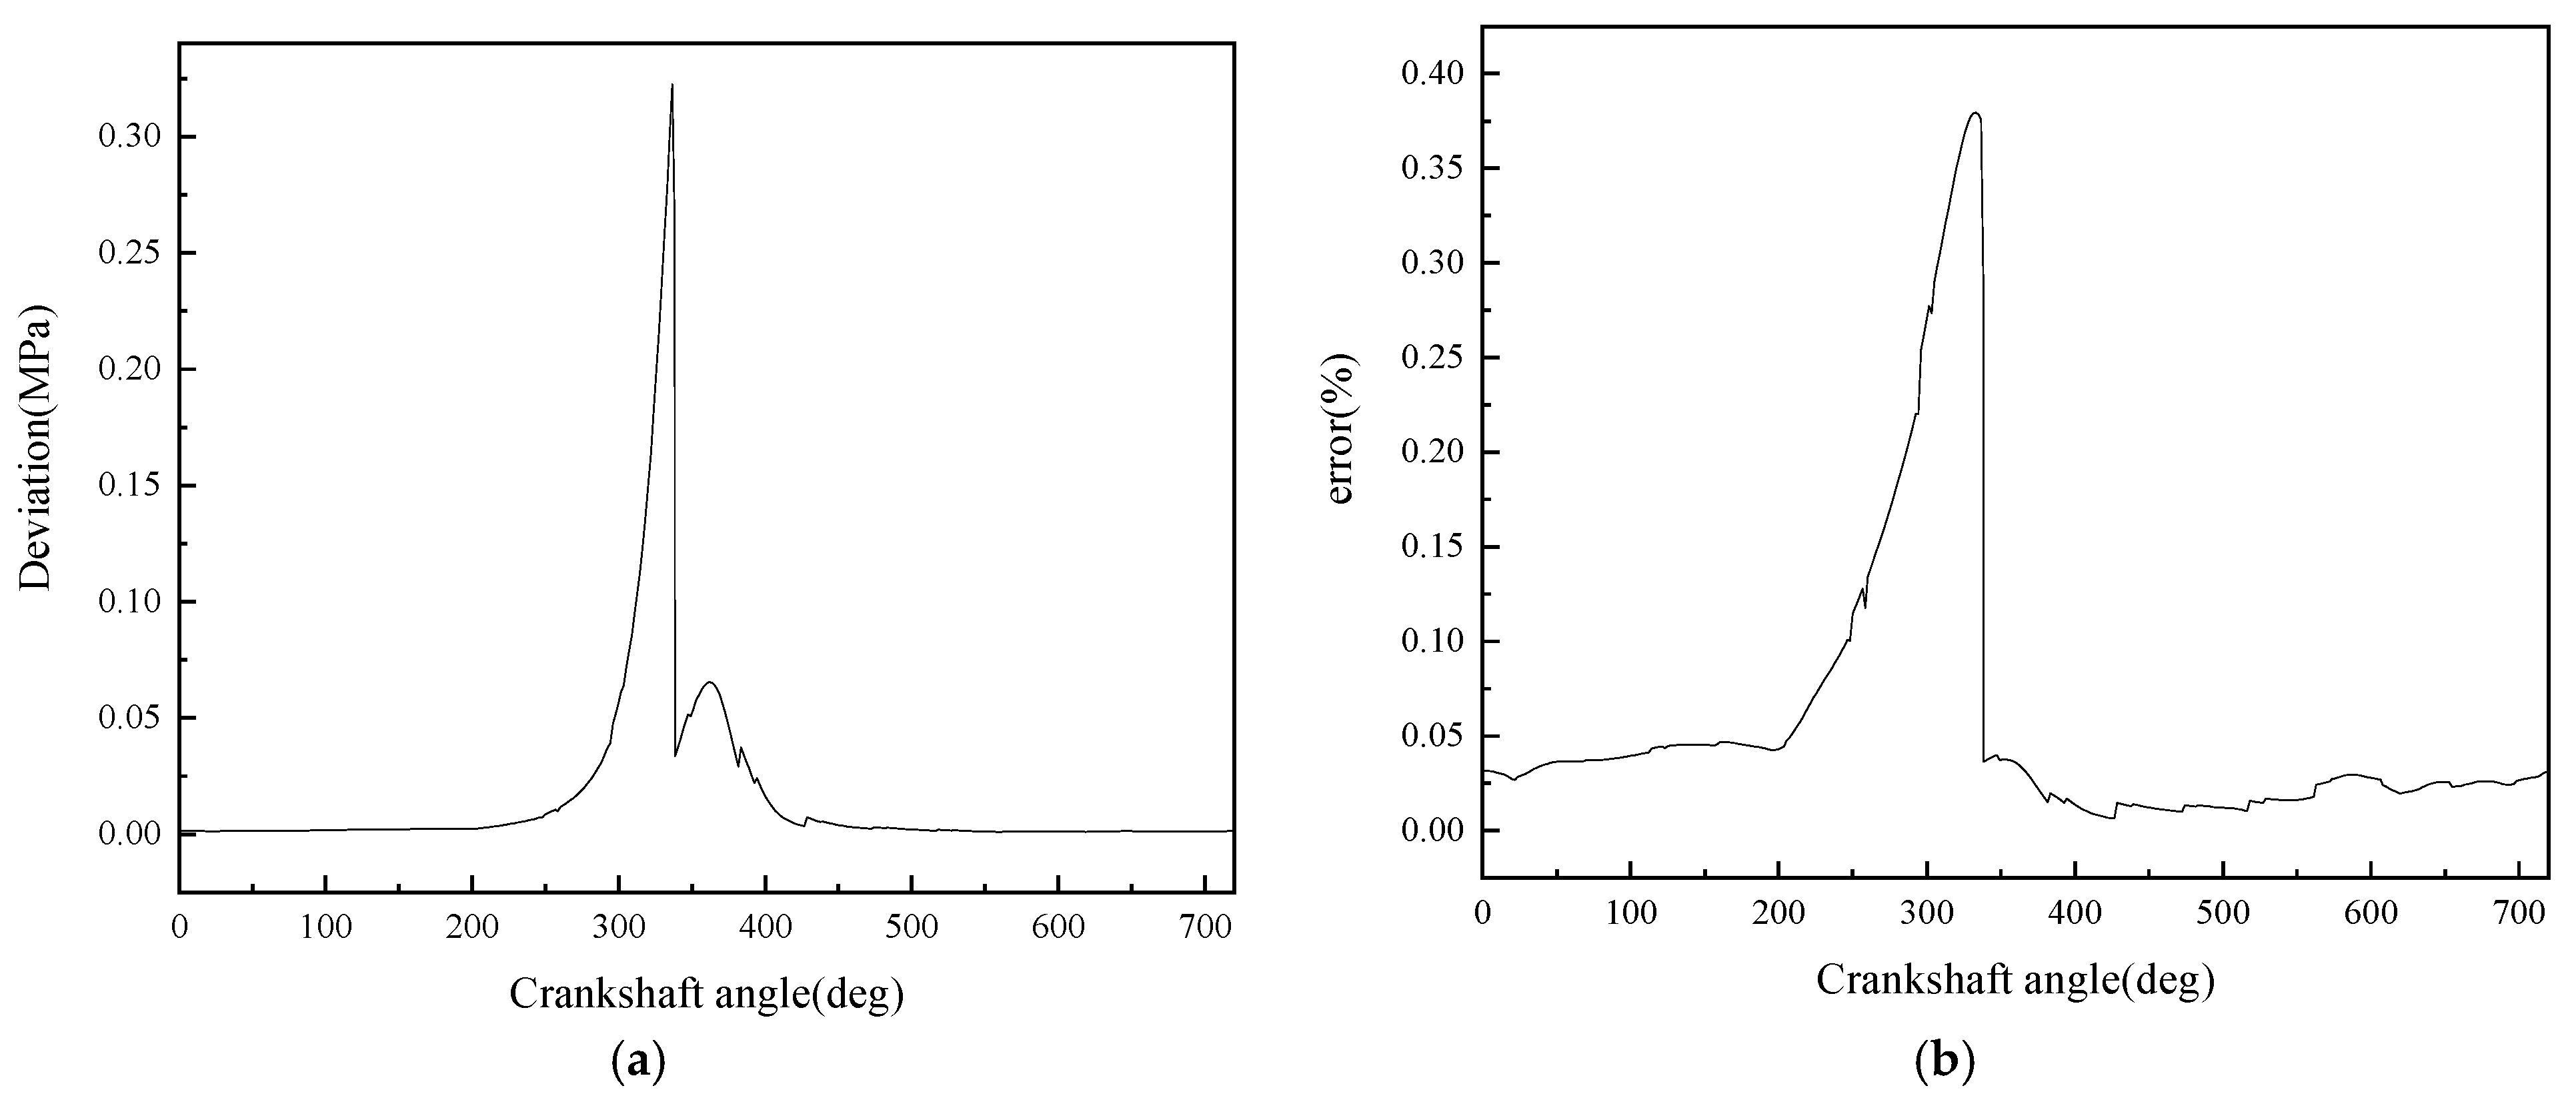
To study the error between the monitored in-cylinder pressure and the actual in-cylinder pressure, this paper calculates the deviation and percentage error between the monitored in-cylinder pressure and the actual in-cylinder pressure. Figure 27 shows the deviation and percentage error between the monitored in-cylinder pressure and the actual in-cylinder pressure. When the crankshaft angle is 360°, the piston is at the top dead center (TDC) of the compression stroke. Table 4 shows the difference in the moment of maximum in-cylinder pressure, the difference in maximum in-cylinder pressure, and the average in-cylinder pressure error between the in-cylinder pressure monitoring curves and the actual in-cylinder pressure curves of 1440 sets of test data.
Figure 27. Deviation and error distribution between monitored and actual in-cylinder pressure. (a) Deviation distribution; (b) error distribution.
Table 4. Error comparison between in-cylinder pressure monitoring curve and actual in-cylinder pressure curve.
It can be seen from the above figures and tables that the in-cylinder pressure monitoring model established in this paper has high accuracy. Under nine operating conditions, the average error in the moment when the in-cylinder pressure reaches the maximum value is 0 degrees, the maximum difference in the maximum in-cylinder pressure is 0.4826 MPa, and the maximum average in-cylinder pressure error in one working cycle is 8.05%. The comprehensive error is small, which can accurately monitor the in-cylinder pressure of the diesel engine under different operating conditions. It is worth noting that in one working cycle, as the maximum in-cylinder pressure increases, the average in-cylinder pressure error increases, but the error of the maximum in-cylinder pressure does not change significantly. It can also be seen from Figure 27 that the error mainly occurs when the crankshaft angle is 290° to 340°, and then the error decreases sharply. When the crankshaft angle is in the range of 360° to 450°, i.e., the power stroke, the error is small.
Table 5 shows the comparison between the in-cylinder pressure monitoring method based on crankshaft torque used in this paper, the in-cylinder pressure monitoring method based on simulation model, and the in-cylinder pressure monitoring method based on vibration signals [,,,,,,,,,,,]. Among them, the relevant data of the in-cylinder pressure monitoring method based on simulation model are obtained using the GT-power model established in Chapter 2, and the data of the in-cylinder pressure monitoring method based on vibration signals are obtained by consulting the relevant literature. It can be seen from the table that compared with the in-cylinder pressure monitoring method based on vibration signals, the diesel engine in-cylinder pressure monitoring method proposed in this paper has absolute advantages in average in-cylinder pressure error, maximum in-cylinder pressure error, and difference in moment of maximum in-cylinder pressure. Compared with the in-cylinder pressure monitoring method based on simulation model, the maximum in-cylinder pressure error is reduced by 40.9% to 3.02%, and as mentioned in Chapter 1, it has a great advantage in calculation speed.
Table 5. Error comparison between different in-cylinder pressure monitoring methods.

5. Conclusions

To solve the problem of diesel engine in-cylinder pressure monitoring, this paper establishes, trains, and verifies a diesel engine in-cylinder pressure monitoring model based on LSTM and crankshaft torque signals. Firstly, an in-cylinder pressure curve monitoring model is established based on the improved LSTM, and training is carried out using crankshaft torque signals, piston motion signals, and in-cylinder pressure signals. The monitoring results of in-cylinder pressure under different operating conditions are obtained, and the deviation between the monitoring results and the actual in-cylinder pressure curve is analyzed. A comparison is made with the other two in-cylinder pressure monitoring methods: the in-cylinder pressure monitoring method based on simulation model and the in-cylinder pressure monitoring method based on vibration signals. Finally, the correctness and accuracy of the diesel engine in-cylinder pressure monitoring model proposed in this paper are verified. The following conclusions can be drawn from this paper:
  • A diesel engine in-cylinder pressure monitoring model based on GRU is established in this paper. With sufficient training data, the observation accuracy of the in-cylinder pressure curve under different operating conditions is high. After verification under nine operating conditions (three speeds: 1600 rpm, 1800 rpm, 2000 rpm; three loads: 25%, 75%, 100% for each speed), it is found that the average error in the moment when the in-cylinder pressure reaches the maximum value of the monitoring model proposed in this paper is 0 degrees, the maximum difference in the maximum in-cylinder pressure is 0.4826 MPa, and the maximum average in-cylinder pressure error in one working cycle is 8.05%. Moreover, the error is mainly concentrated in the compression process rather than the combustion process. In summary, the in-cylinder pressure monitoring model proposed in this paper has good accuracy.
  • Although the average in-cylinder pressure error of the monitoring model proposed in this paper increases with the increase in the maximum in-cylinder pressure, the error of the maximum in-cylinder pressure does not change significantly. This is because the error mainly occurs in the range of crankshaft angle from 290° to 340°, i.e., the compression stroke; while when the crankshaft angle is in the range of 360° to 450°, i.e., the power stroke, the error is small.
  • It can be seen from the comparison in this paper that the combined use of artificial neural network and torque signal to monitor engine in-cylinder pressure changes has two advantages over other methods: good timeliness and high monitoring accuracy. In terms of timeliness, on the same computing platform, compared with traditional monitoring methods using simulation models, the average computation time of the monitoring model established in this paper is only 0.0109 s, while the average computation time using simulation models is 3271.11 s. This greatly improves monitoring efficiency and makes real-time monitoring of the overall operating state of the engine possible. In terms of monitoring accuracy, compared with using vibration signals as the data source, the monitoring model using torque signals has absolute advantages in average in-cylinder pressure error and maximum in-cylinder pressure error, which are reduced by 82.1% and 59.4%, respectively. Moreover, it can even achieve zero error in monitoring the difference in the occurrence time of the maximum in-cylinder pressure.
In summary, this study uses crankshaft torque signals and piston motion signals as inputs, with in-cylinder pressure signals as outputs, to establish and train a diesel engine in-cylinder pressure monitoring model based on LSTM and crankshaft torque signals. Through comparison with simulation models and monitoring methods based on vibration signals, the good timeliness and monitoring accuracy of this method are verified. However, at present, our team’s research on engine in-cylinder pressure monitoring is limited to various operating conditions under normal operation, and has not been verified under fault conditions. In the next stage, our team will build on previous research by team members on engine fault diagnosis [] to conduct research and verification on diesel engine in-cylinder pressure monitoring methods under fault conditions, aiming to improve the robustness of this method, expand its application range, and further promote its application in engineering practice.

Author Contributions

The first author Y.Z. is responsible for determining the research topic, designing research methods, collecting and analyzing data, and ultimately writing the complete paper. Corresponding author L.L. is responsible for reviewing and evaluating, providing feedback and suggestions, and helping to revise and improve the paper. Authors Y.L., R.Z. and S.Y. are responsible for reviewing relevant books, journals, and research reports, collecting literature materials related to the topic of the paper, and summarizing and analyzing these materials. All authors have read and agreed to the published version of the manuscript.

Funding

This work was supported by the Applied Basic Research Programs of Shanxi Province in China (Grant No. 202203021222045).

Data Availability Statement

The original contributions presented in this study are included in the article. Further inquiries can be directed to the corresponding authors.

Conflicts of Interest

Ting Hou was employed by Shanxi Diesel Engine Industry Co. Ltd. The remaining author declares that the research was conducted in the absence of any commercial or financial relationships that could be construed as potential conflicts of interest.

Appendix A

Table A1. Parameter table for diesel engine performance simulation and experimental calculation.
TypeParameter InputParameter UnitData Value
Overall ParametersDiesel Engine Type——Four-stroke diesel engine
Rated Speedr/min2000
Cylinder Arrangement——V-type 90°
Cylinder Numbering Sequence——Flywheel end, left (Bank A) and right (Bank B) in sequence
Crankshaft Rotation Direction (viewed from power output end)——Counterclockwise
Cylinder Firing Order——A1B5A3A5B2B8A2A8B3A7B4B6A4A6B1B7
Interval Angle°CA45
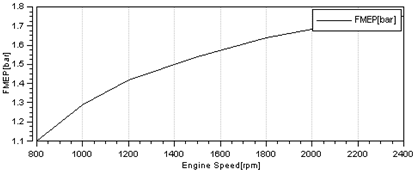
Average Mechanical Loss Pressure——Applsci 15 11979 i001
CylinderCombustion Chamber Type——ω
Average Crankcase PressureMPa0.1
Combustion Heat Release Model——Vibe model
Combustion Duration (adjusted result)°CA72
Vibe Parameter a——6.9 (complete combustion)
Combustion Quality Index m (adjusted result)——0.925
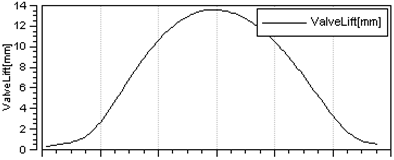
Intake Valve Lift Curve——Applsci 15 11979 i002
Exhaust Valve Lift Curve——Applsci 15 11979 i003
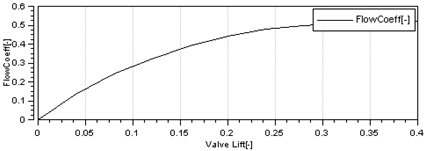
Intake Valve Flow Coefficient Curve——Applsci 15 11979 i004
Exhaust Valve Flow Coefficient Curve——Applsci 15 11979 i005
Air Filter CL1Total VolumeL100
Inlet VolumeL52
Outlet VolumeL30
Mass Volume Flow Ratem3/s2.91
Pressure Dropbar0.02
Inlet Pressurebar1
Inlet Temperature°C24.85
Intercooler CO1Cooling Water Flow Ratekg/s2.17
Pressure Dropbar0.035
Outlet Temperature°C53
Inlet Temperature°C160
Intake Manifold (Main)Total VolumeL16
Initial Temperature°C25
Initial Pressurebar1
Intake Manifold (Branch)Pipe Lengthmm200
Pipe DiametermmApplsci 15 11979 i006
Radius of Curvaturemm1,000,000
Friction Coefficient (empirical value)——0.038
Heat Transfer Factor (empirical value)——1
Wall Temperature (initial boundary)°C25
Exhaust Manifold (Branch)Pipe Lengthmm220
Pipe Diametermm78
Radius of Curvaturemm1,000,000
Friction Coefficient (empirical value)——0.038
Heat Transfer Factor (empirical value)——1.1
Wall Temperature (initial boundary)°C25
Exhaust Manifold (Main)Pipe Lengthmm228
Pipe Diametermm110
Radius of Curvaturemm1,000,000
Friction Coefficient (empirical value)——0.03
Heat Transfer Factor (empirical value)——1.8
Wall Temperature (initial boundary)°C25

References

  1. Milojević, S.; Savić, S.; Marić, D.; Stopka, O.; Krstić, B.; Stojanović, B. Correlation between Emission and Combustion Characteristics with the Compression Ratio and Fuel Injection Timing in Tribologically Optimized Diesel Engine. Teh. Vjesn. 2022, 29, 1210–1219. [Google Scholar] [CrossRef]
  2. Chang, C.; Mei, J.M.; Zhao, H.M.; Shen, H.; Li, X.H. Cylinder Pressure Identification Based on Local Tangent Space Alignment and Least Squares Support Vector Machine. J. Vib. Shock. 2020, 39, 16–21+63. [Google Scholar]
  3. Liu, J.M.; Li, X.L.; Qiao, X.Y.; Zhang, J. Research on Cylinder Pressure Identification Method of Diesel Engine Under Multiple Operating Conditions Based on Cylinder Head Vibration Signal. Automot. Eng. 2015, 37, 875–880+979. [Google Scholar]
  4. Liu, J.M.; Li, H.Y.; Qiao, X.Y.; Li, X.L.; Shi, Y.P. Research on Cylinder Pressure Identification Method Based on Cylinder Head Vibration Signal. Intern. Combust. Engine Eng. 2013, 34, 32–37. [Google Scholar]
  5. Liu, S.X.R. Research on Diesel Engine In-Cylinder Pressure Identification Method Based on Cylinder Head Vibration Signal. Master’s Thesis, Harbin Engineering University, Harbin, China, 2013. [Google Scholar]
  6. Ji, S.B.; Cheng, Y.; Tang, J.; Lan, X.; Yang, B. Research on Cylinder Pressure Identification Based on Time-domain Characteristics of Cylinder Head Vibration Signal. Intern. Combust. Engine Eng. 2008, 29, 76–80. [Google Scholar]
  7. Chen, B. Research on Gas Pressure Reconstruction Method Based on Cyclostationary Characteristics of Diesel Engine. Master’s Thesis, Wuhan University of Technology, Wuhan, China, 2009. [Google Scholar]
  8. Yang, Y.F. Research on Prediction of Vibration and Noise of Diesel Engine Considering the Influence of Component Joint Surface Connection Characteristics. Master’s Thesis, Harbin Engineering University, Harbin, China, 2022. [Google Scholar]
  9. Yao, J.J.; Xiang, Y.; Wang, Z.H. Diesel Engine Cylinder Pressure Identification Based on Transfer Function Method. J. Wuhan Univ. Technol. (Transp. Sci. Eng. Ed.) 2006, 30, 70–72. [Google Scholar]
  10. Yao, J.J.; Xiang, Y.; Zhou, Y. Diesel Engine Cylinder Pressure Identification Based on Cepstrum Method. Shipp. Eng. 2006, 37–39. [Google Scholar]
  11. Zhang, Z.R.; Shi, L.S.; Wang, C.D. Diesel Engine Cylinder Pressure Identification Based on Wavelet Analysis and Time Series Analysis. Trans. Chin. Soc. Intern. Combust. Engines 1999, 17, 136–139. [Google Scholar]
  12. Chen, G.J.; Zhang, Y.D. Gas Pressure Identification Based on Wavelet Analysis and ARMA Model. J. Vib. Eng. 2002, 15, 484–487. [Google Scholar]
  13. Gao, H.B.; Ouyang, G.Y.; Zhang, P. Diesel Engine Cylinder Pressure Reconstruction Based on BP Neural Network. Intern. Combust. Engine Eng. 2005, 26, 68–70. [Google Scholar]
  14. Saimurugan, M.; Ramachandran, K.I.; Sugumaran, V.; Sakthivel, N.R. Multicomponent fault diagnosis of rotational mechanical system based on decision tree and support vector machine. Expert Syst. Appl. 2011, 38, 3819–3826. [Google Scholar] [CrossRef]
  15. Zhang, H.R.; Han, Z.Z.; Li, C.G. Nonlinear System Identification Based on Support Vector Machine. J. Syst. Simul. 2003, 18, 89–91. [Google Scholar]
  16. Shen, Z.J.; Chen, X.F.; He, Z.J. Remaining Life Prediction of Rolling Bearings Based on Relative Features and Multivariate Support Vector Machine. J. Mech. Eng. 2013, 42, 183–189. [Google Scholar] [CrossRef]
  17. Zhang, Z.Y.; Zha, H.Y. Principal manifolds and nonlinear dimensionality reduction via tangent space alignment. SIAM J. Sci. Comput. 2004, 26, 313–338. [Google Scholar] [CrossRef]
  18. Suykens, K.; Gestel, V.; Brabanter, D.; Moor, D.; Vandewalle, J. Least Squares Support Vector Machines; World Scientific Publishing Company: Singapore, 2002. [Google Scholar]
  19. Wang, L. Research on Several Methods of Rolling Bearing Fault Diagnosis Based on Manifold Learning. Ph.D. Thesis, Dalian University of Technology, Dalian, China, 2013. [Google Scholar]
  20. Ranaee, V.; Ebrahimzadeh, A.; Ghaderi, R. Application of the PSO-SVM model for recognition of control chart patterns. ISA Trans. 2010, 49, 577–586. [Google Scholar] [CrossRef] [PubMed]
  21. D’Ambrosio, S.; Ferrari, A. Diesel Injector Coking: Optical-Chemical Analysis of Deposits and Influence on Injected Flow-Rate, Fuel Spray and Engine Performance. J. Eng. Gas Turbines Power 2012, 134, 062801.1–062801.14. [Google Scholar] [CrossRef]
  22. Gao, Y.X.; Feng, Y.M.; Wang, Y.S.; Zhu, Y.Q. Effects of Partial Pre-Decomposition of Ammonia Fuel on Combustion and Greenhouse Gas Emissions in a Pre-Chamber Jet Ignition Ammonia Engine. Chin. Intern. Combust. Engine Eng. 2025, 46, 55–68. [Google Scholar] [CrossRef]
  23. Li, W.; Li, G.; Bai, S.; Sang, W.; Sun, J.; Liu, Y.; Zhang, X.; Han, F. The Influence of Lightweight Bearings on the Mechanical Efficiency of Turbochargers and the Acceleration Performance of Engines. Intern. Combust. Engines Power Plants 2021, 38, 35–41. [Google Scholar] [CrossRef]
  24. Liu, K.; Liu, X. Study on Mechanical Fatigue Damage and Reliability of Internal Combustion Engine Piston. Intern. Combust. Engine Parts 2023, 44–46. [Google Scholar] [CrossRef]
  25. Zhang, N. Analysis of Causes and Prevention of Internal Combustion Engine Cylinder Wear. Intern. Combust. Engine Parts 2020, 48–50. [Google Scholar] [CrossRef]
  26. Cong, J.; Ni, P.; Sun, J.; Lv, S. Experimental Study and Analysis on Torsional Fatigue Strength of Internal Combustion Engine Crankshaft. China Mech. Eng. 2022, 33, 2197–2204. [Google Scholar]
  27. Catania, A.E.; Ferrari, A.; Spessa, E. Numerical-experimental study and solutions to reduce the dwell-time threshold for fusion-free consecutive injection in a multijet solenoid-type CR system. J. Eng. Gas Turbines Power 2009, 131, 317–332. [Google Scholar] [CrossRef]
  28. Lino, P.; Maione, B.; Rizzo, A. Nonlinear modelling and control of a common rail injection system for diesel. Appl. Math. Model. 2007, 31, 1770–1784. [Google Scholar] [CrossRef]
  29. Wang, J.; Zhang, T.; Zhang, J.; Sun, H. Study on Drying Moisture Content Prediction Based on LSTM Neural Network. Liaoning Chem. Ind. 2023, 52, 1722–1726+1730. [Google Scholar] [CrossRef]
  30. Chen, Y.D.; Chen, S.; Chen, Y.R.; Geng, Y.D.; Shu, H. Dynamic Prediction of COVID-19 with the Extended SEIR-LSTM Model: A Case Study of Tokyo in 2022. Chin. J. Comput. Phys. 2025, 42, 631–636. [Google Scholar] [CrossRef]
  31. Li, L.; Su, T. Research on a small sample fault diagnosis method for a high-pressure common rail system. Adv. Mech. Eng. 2021, 13. [Google Scholar] [CrossRef]
Disclaimer/Publisher’s Note: The statements, opinions and data contained in all publications are solely those of the individual author(s) and contributor(s) and not of MDPI and/or the editor(s). MDPI and/or the editor(s) disclaim responsibility for any injury to people or property resulting from any ideas, methods, instructions or products referred to in the content.

Article Metrics

Citations

Article Access Statistics

Multiple requests from the same IP address are counted as one view.