


Abstract
This study establishes a synergistic Texture–Quota–Salinity (T–Q–S) model to optimize soil water–salt dynamics in arid agricultural systems. Key findings reveal a sand content threshold (S0 = 45.2%) governing salt transport efficiency: (1) Sandy soils (S > 50%) exhibit high leaching capacity, enabling the use of saline water (4 g·L−1) with a 270 mm quota to achieve >75% desalination. (2) Threshold soils (S ≈ 45.2%) balance leaching and retention, maximizing nutrient conservation under brackish water (2 g·L−1) and 260 mm irrigation. (3) Clayey soils (S < 30%) require freshwater (≤2 g·L−1) and reduced quotas (≤230 mm) to mitigate surface salinization. The S0 threshold enables precise irrigation strategies: deep leaching in sandy soils, balanced management in threshold soils, and salt-suppression in clayey soils, enhancing water efficiency by 25% while controlling root zone salinity.
1. Introduction
In recent years, global arid region agriculture has confronted dual challenges of freshwater scarcity and soil salinization. The rational utilization of brackish water (1–10 g·L−1, per FAO classification [1]) and saline water (>10 g·L−1), with the experimental salinity gradient (1–5 g·L−1) representing typical groundwater mineralization in arid regions, has emerged as a key research focus. For instance, Israel employs drip irrigation technology to utilize brackish water (2–4 g·L−1) for cotton and tomato cultivation, enhancing water use efficiency by over 30% [2]. Similarly, in Egypt’s Nile Delta, integrating leaching quota regulation has maintained stable soil electrical conductivity at ≤1.5 dS·m−1 (equivalent to ≤0.15 S·m−1) in wheat fields irrigated with brackish water (1–3 g·L−1) [3]. Moreover, Morocco in North Africa adopts a zoning irrigation strategy, allocating high-salinity water (4–6 g·L−1) to salt-tolerant barley while reserving freshwater for salt-sensitive citrus orchards, thereby increasing land use efficiency by 20% [4]. In Australia’s Murray–Darling basin, dynamic regulation of irrigation quotas (200–300 mm) has significantly mitigated surface salt accumulation from brackish water irrigation [5].
The mineralization level of irrigation water and its interaction with irrigation practices (i.e., quotas and frequencies) significantly impact salt distribution. Numerous studies have demonstrated that increasing the mineralization (2–5 g·L−1) of irrigation water reduces infiltration rates due to physicochemical processes such as clay dispersion and pore blockage, particularly in soils containing significant clay fractions [6]. Concurrently, this reduction in infiltration restricts the leaching depth of soluble salts; for instance, research indicates a decrease in salt leaching depth by 15–18 cm and chloride (Cl−) removal depth by 22–23 cm [6], leading to a reduction in desalination depth from 22 cm to 15 cm [7]. This highlights the dual effect of high-salinity irrigation: impeding water entry into the soil profile and hindering the downward movement of accumulated salts. High mineralization water (>3 g·L−1) tends to induce surface salt enrichment, with soil surface salt accumulation rates reaching up to 76.11%. However, its safety threshold strongly depends on soil texture: Wankmüller et al. [8] indicated that 4 g·L−1 mineralization in sandy soil can still maintain salt balance in the root zone, whereas Hillel et al. [9] found that mineralization > 3.5 g·L−1 in silt loam soil increases salt accumulation beneath drip emitters by 47.6% compared to inter-film areas. The regulation of irrigation quotas is critical: in the cotton fields of southern Xinjiang, Mao Xiaomin’s team demonstrated through Hydrus-2D modeling that under brackish water irrigation (>3.5 g·L−1), excessive irrigation (125% crop water requirement) increased root zone (0–40 cm) salinity by 18% [10]. By contrast, precisely adjusting irrigation quotas to 90% of crop water requirements based on real-time soil salinity monitoring reduces root zone salt accumulation by 18% compared to conventional 125% irrigation [10]. Optimizing irrigation strategies is crucial in addressing salt accumulation: A “saline/fresh = 1:4 alternate irrigation” mode in southern Xinjiang cotton fields reduces surface salt aggregation by 40% and boosts cotton yield by 16.2% [11]. In Inner Mongolia’s saline–alkali soil, a corn experiment showed that using a higher irrigation lower limit (soil matrix potential of −30 kPa vs. −40 kPa) expands the 0–40 cm desalinated zone beneath the mulching film, balances leaching and salt accumulation, and significantly enhances corn yield [12]. An field experiment [13] demonstrated that after 5 g·L−1 saline water irrigation, soil salinity exhibited a characteristic of “surface concentration and deep accumulation”. To achieve 35% desalination in the 0–40 cm soil layer, 225 mm of freshwater spring irrigation was required for leaching.
The synergistic optimization of irrigation water quality and quantity significantly influences the dynamic distribution of soil water and salt. Song et al. [6] achieved a 61.49% desalination rate in the 0–30 cm layer of moderately saline–alkali soil. For severely saline–alkali soil, combining a 270 mm spring irrigation quota with a 1 m-deep subsurface drainage pipe increased the 0–40 cm desalination rate to over 66%, reducing root zone electrical conductivity (ECe) to below 3 dS·m−1. In the Yellow River Delta, applying corn stove biochar (5 t·hm−2) with brackish water (2–5 g·L−1) reduced 0–30 cm soil salt content by 34.75–74.00%. In Inner Mongolia’s sandy loam, brackish water irrigation required >370 mm and a mineralization of <3 g·L−1 to facilitate salt leaching; otherwise, salt accumulated throughout the 100 cm soil layer. In semi-arid silt loam, 250 mm irrigation with 3–5 g·L−1 mineralization maintained root zone salt balance.
Soil texture regulates water–salt transport under brackish water irrigation by influencing pore structure and hydraulic conductivity. Sandy soils, characterized by high macropore proportions, facilitate water infiltration but exhibit weak water retention, allowing salts to leach readily into deeper soil layers. For instance, in the sandy loam soil of the Shiyang River basin, following irrigation with 3 g·L−1 brackish water, soil moisture in the 60–80 cm layer was 12% higher than under freshwater irrigation, while the 0–20 cm surface layer showed 8% lower moisture [6]. Specifically, Central Asian studies have shown that the high permeability of sandy soil facilitates downward salt migration. In Kazakhstan’s sandy loam soil, 4 g·L−1 brackish water combined with high-frequency drip irrigation leaches salts to a 35 cm depth. However, its poor water-holding capacity also predisposes it to salt rebound, requiring frequent irrigation for maintenance. Conversely, clayey soils with small pores and strong capillary action promote surface salt accumulation post-irrigation due to upward water movement. In Ningxia’s clay regions, 4 g·L−1 saline water irrigation increased surface salt patch area by 35% and caused significant fluctuations in 0–10 cm soil moisture [12]. Further research in the Minqin Oasis confirms that clayey soils exhibit 1.13 times higher surface salt accumulation intensity than sandy loam after irrigation [14]. In some clay loam soils of North China and southern Xinjiang, soil desalination depths range from 15 to 23 cm. However, when the mineralization level exceeds 3.5 g·L−1, the salt accumulation beneath drip irrigation points is 47.6% higher than in inter-film areas [15]. In regions such as Northern Europe and Northeast China, managing salt accumulation in clayey soils often requires subsurface drainage pipes buried at 0.8–1.2 m depths for regulation.
Mineralization thresholds of irrigation water for different soil textures remain unclear. Although studies have indicated that mineralization > 3 g·L−1 can readily lead to surface enrichment (with salt accumulation rates up to 76.11%), safe thresholds differ significantly between sandy soil [8] and clay/silt loam soil [15]. The applicability of optimized irrigation modes is limited. For instance, the “saline/fresh = 1:4” mixed irrigation mode validated in southern Xinjiang cotton fields [15] remains untested in clayey soil regions. Spring irrigation with high-salinity water (>3 g·L−1) at 228.47 mm achieves 61.49% desalination [6] but may escalate the long-term risk of salt rebound. Deep soil salt accumulation and groundwater risks are also critical. A California study [16] revealed that high-frequency brackish drip irrigation maintains root zone salt balance, but salt accumulation increases by 12.3% at soil depths of >80 cm. Such deep salt buildup threatens groundwater quality, yet regional water–salt balance sustainability assessments are scarce. Biochar amendment (5 t·hm−2) demonstrates notable short-term benefits, yet long-term application leads to pore clogging [17].
Li et al. [18] investigated the influence of spring irrigation quotas on soil water and salt transport under subsurface drainage conditions, yet a systematic analysis of the response differences across various soil textures remains absent. Green and Ampt [19] established the physical basis for soil water and salt transport processes but failed to quantify the interactive effects of multiple influencing factors. Hu [20] examined the impact of drip irrigation methods on water and salt dynamics in saline–alkali cotton fields but did not address the regulatory role of irrigation water mineralization. Peng et al. [21] applied X-ray CT technology to visualize soil water flow, yet integration with salt migration models was not effectively achieved. Ding et al. [22] and Chen et al. [10] assessed the effect of sand content on salt leaching efficiency in saline–alkali soils but did not define specific soil texture thresholds. Hossain et al. [23] identified safe salinity thresholds for saline water irrigation in Bangladesh’s rice production systems but overlooked the modulating influence of irrigation quotas. Mallawaarachchi et al. [5] developed a dynamic irrigation scheduling framework to mitigate salt accumulation in the Murray–Darling basin, yet soil texture parameters were not incorporated into the system. Kankarla et al. [16] highlighted the importance of sustainable groundwater management under saline water irrigation in California’s Central Valley, but empirical validation of the proposed strategies remains limited [24,25]. Xu et al. [11] and Bi et al. [15] evaluated the effectiveness of saline water drip irrigation on soil salt control and jujube yield in the Taklimakan Desert region but did not elucidate the underlying regulatory mechanisms of soil texture. Wang et al. [26] and Wu et al. [27] investigated the synergistic effects of saline water and biochar on infiltration characteristics and salt transport in saline soils, yet a quantitative predictive model was not developed. Yang et al. [28] analyzed the influence of varying sodium–potassium ratios in saline irrigation water on infiltration and salt distribution but did not account for the interaction with irrigation quotas. Li et al. [29] constructed a soil salt accumulation model for cotton fields under mulched drip irrigation using saline water of varying salinity levels, but soil texture parameters were not quantitatively integrated. Li et al. [30] conducted dynamic simulations of soil water and salt transport under mulched saline water drip irrigation in southern Xinjiang, yet a texture-based zonal irrigation strategy was not proposed. Wang et al. [31] studied the response of loam soils to alternating saline and freshwater irrigation, but higher mineralization water scenarios were not explored. Wang et al. [32] analyzed the effects of saline water irrigation on the physiological traits, yield, and quality of cotton under mulched drip irrigation across different soil textures, but a comprehensive optimization framework was not established. Smith et al. [33] assessed the long-term impacts of recycled saline water irrigation on soil structure and crop productivity in Australian cotton fields, yet a quantitative relationship with soil texture was not defined. Luedeling et al. [34] optimized saline water drip irrigation strategies for date palms in Oman’s coastal zones, but critical soil texture thresholds were not identified.
Research on the triple synergistic effect of soil texture (T), irrigation quota (Q), and water salinity (S) (abbreviated as T–Q–S) remains underexplored. In terms of soil water environmental effects, existing studies mainly focus on single factors (i.e., soil texture, mineralization degree, irrigation quota) or pairwise interactions between mineralization–quota [10], mineralization–texture [14,15], and quota–texture [6,12]. However, research on how the triple synergistic effect systematically influences water and salt transport, leaching efficiency, and root zone salinity dynamics is scarce. Additionally, studies on water–salt balance under different irrigation quotas in the same soil texture have not established quota thresholds, and there is a lack of systematic exploration into the optimal combination of these three factors across different soil textures.
This study focuses on Yingjisha County, Xinjiang, where soil texture exhibits significant spatial variation (sand content 10–75%) and freshwater resources are severely scarce. Groundwater serves as the primary irrigation source, with mineralization levels ranging from 1 to 5 g·L−1. However, the total dissolved solids (TDS) in groundwater are unevenly distributed: 43.1% of samples have TDS <3 g·L−1, while 56.9% are saline water (>3 g·L−1). TDS increases gradually from southwest to northeast, consistent with groundwater flow direction. Through field investigations and sampling, a triple physical model incorporating irrigation quota, mineralization degree, and soil texture was developed, and laboratory physical experiments were carried out to systematically explore the laws of water–salt transport driven by fresh to brackish to saline water during spring irrigation, and to determine the threshold of soil sand content for water–salt transport effects. A numerical model was constructed to study the trend and effect of water salt transport under the synergism of T–Q–S (Texture–Quota–Salinity). The research findings establish a collaborative optimization framework of “leaching efficiency brackish/saline water resource utilization–soil texture,” providing a quantitative basis for precise salt management and water resource allocation in arid regions. The identified sand content threshold (S0 = 45.2%) resolves the ‘heterogeneity blind spot’ in traditional irrigation management, reducing prediction uncertainty to ±8.3% by quantifying pore scale connectivity effects.
2. Materials and Methods
2.1. Overview of the Experimental Zone
Yingjisha County is situated in southwestern Xinjiang, in the transitional zone between the northern foothills of the Kunlun Mountains and the western edge of the Tarim Basin (geographic coordinates: 75°45′–77°03′ E, 38°30′–39°03′ N). Topographically, it is primarily composed of alluvial plains, accounting for over 60% of the agricultural area. The terrain slopes gently from southwest to northeast, with an altitude ranging from 1212 to 2256 m (the county seat stands at 1297.5 m above sea level). Climatically, the annual average temperature is 11.7 °C (ranging from 10.3 °C to 13.1 °C), with January mean temperature of −5.7 °C (absolute minimum −24.4 °C) and July mean temperature of 25.8 °C (absolute maximum 39 °C). The daily temperature variation can reach 13.3 °C. Annual precipitation is less than 100 mm (ranging from 17 to 58 mm in plain areas), while evaporation exceeds precipitation by over 8.3 times, exacerbating surface salt accumulation. These characteristics not only typify arid regions but also provide threshold environmental context for researching salt control during spring irrigation.
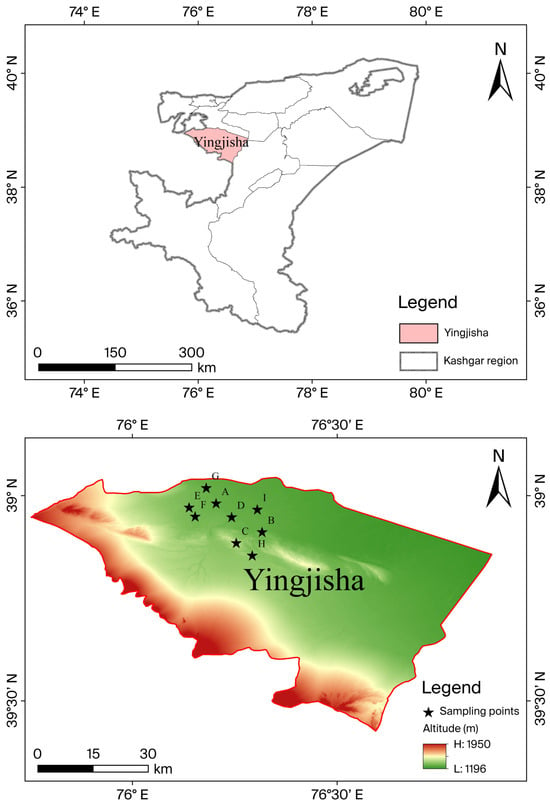
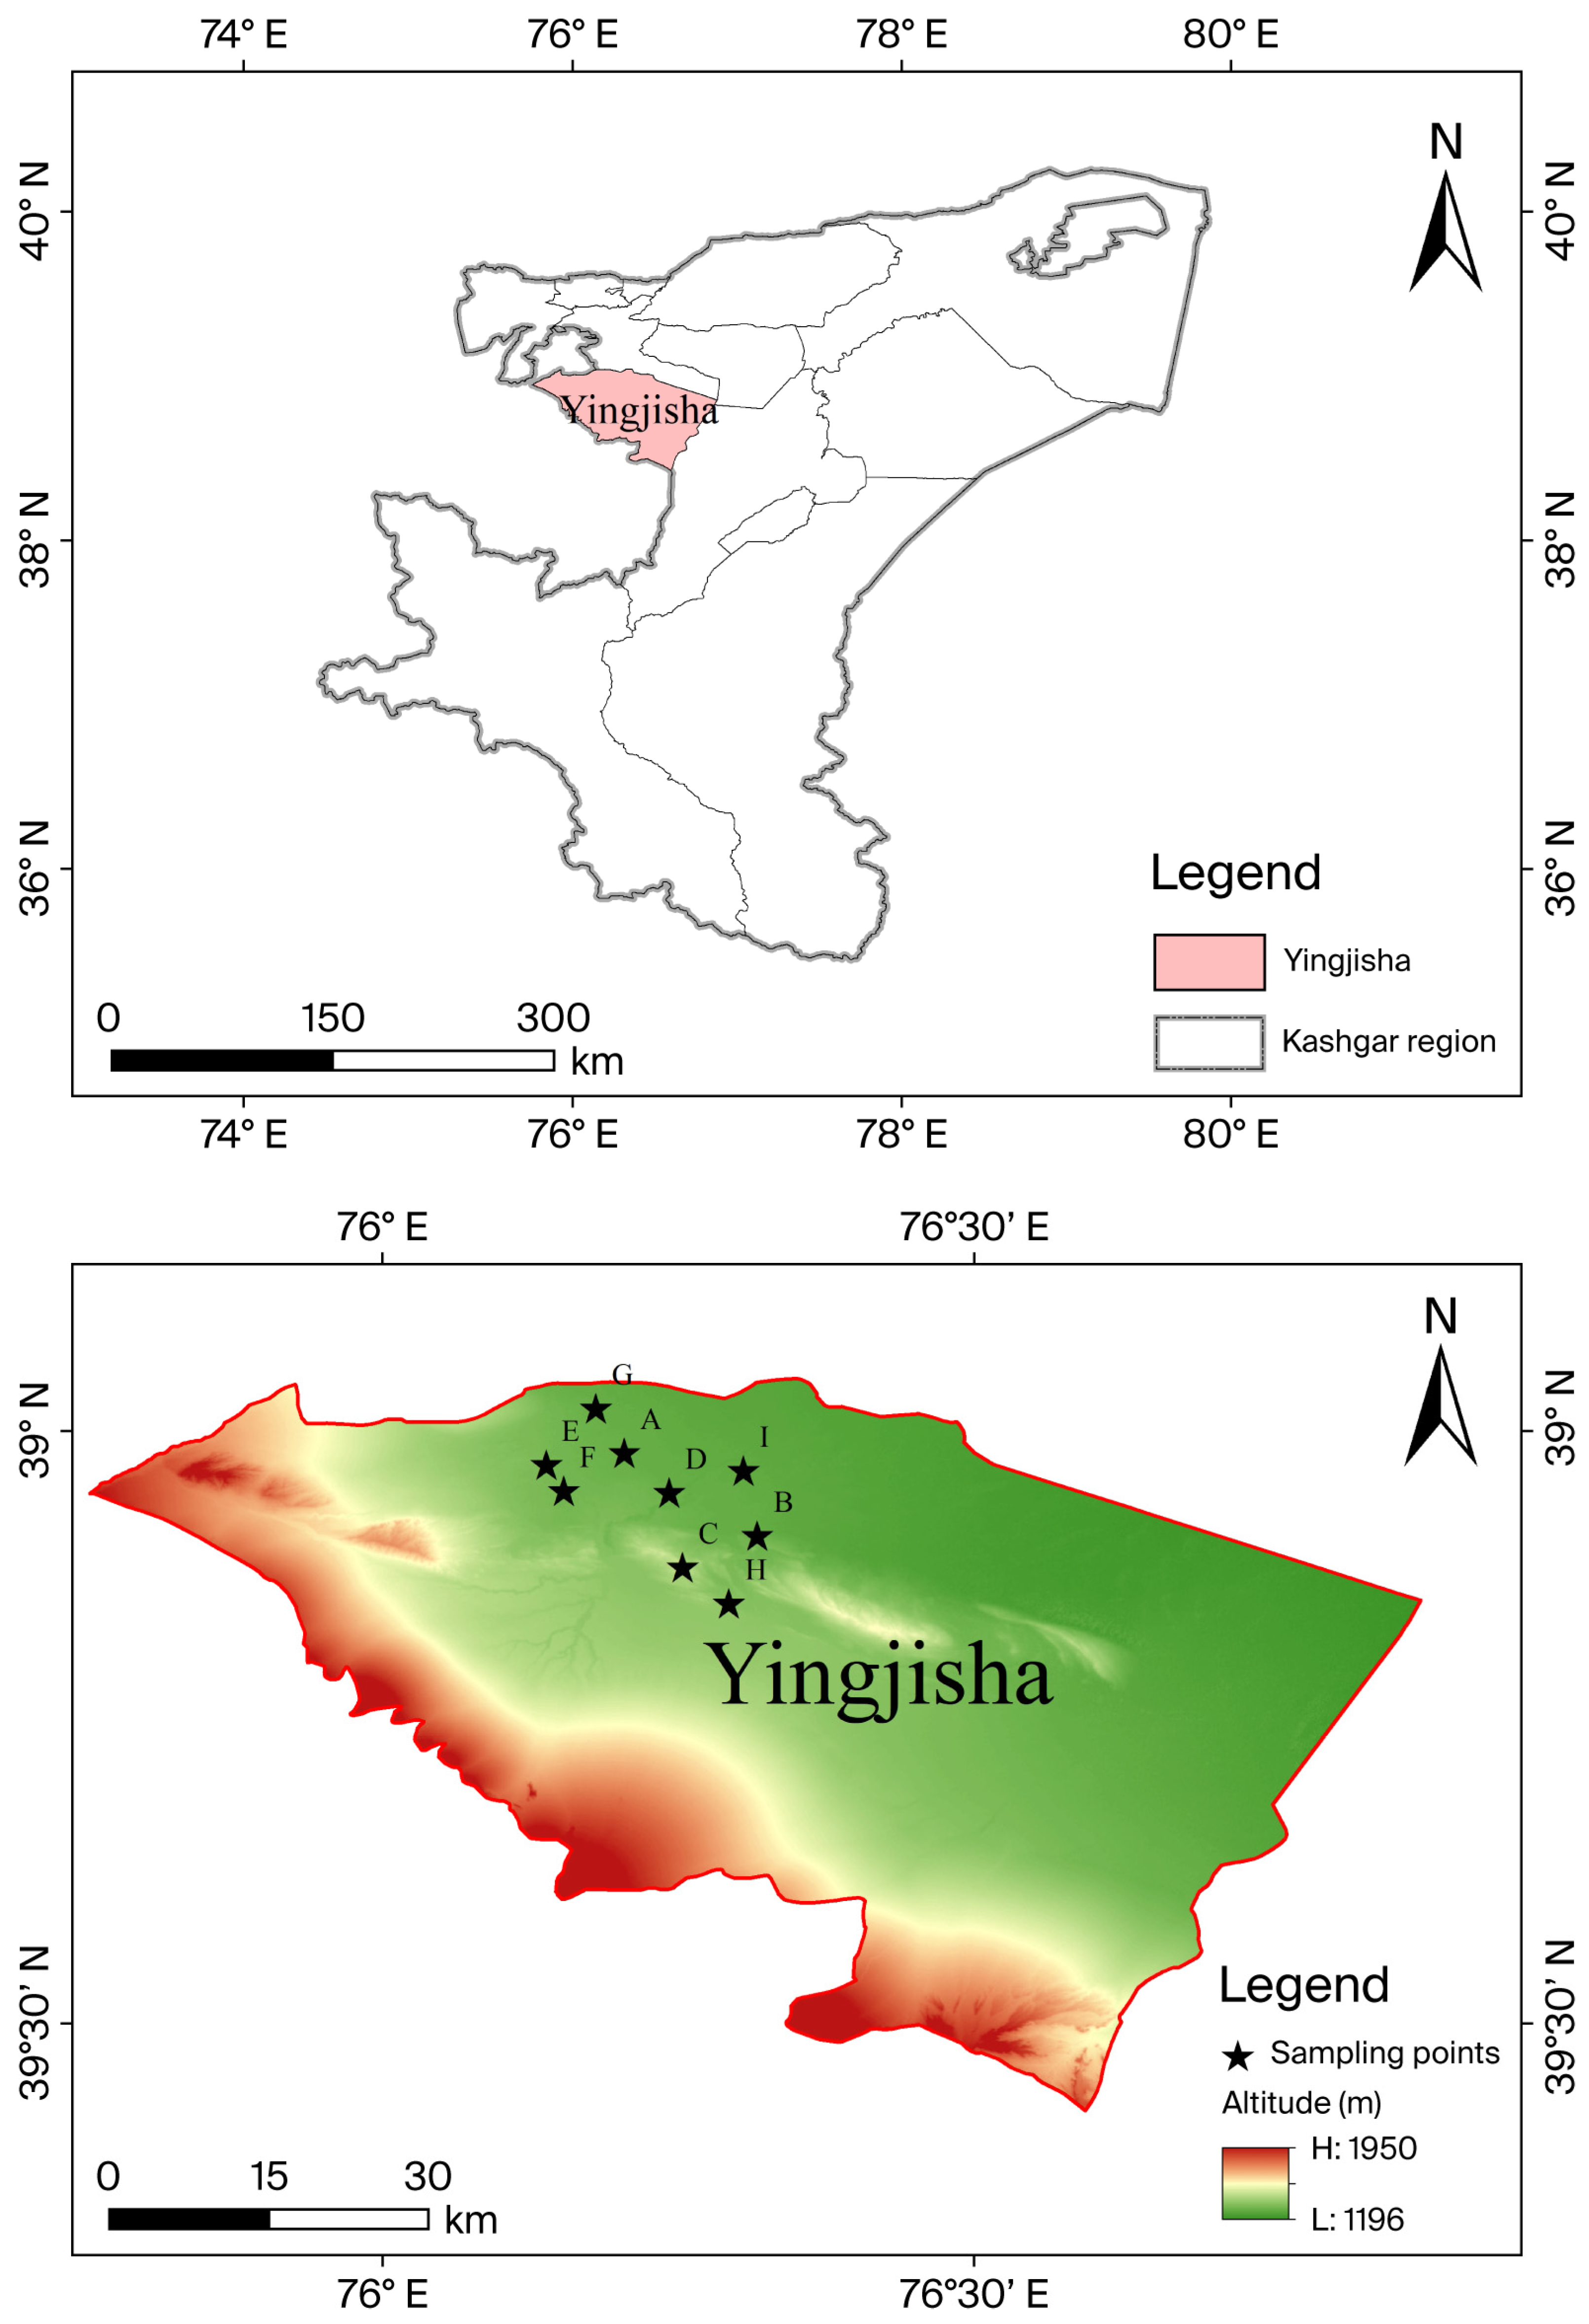
The study area shows significant spatial variation in soil texture, with sand content ranging from 10% to 75%, and extremely scarce freshwater resources. The TDS of phreatic water in the study area is unevenly distributed, with mineralization degrees ranging from 1 to 5 g·L−1. Groundwater TDS gradually increases from southwest to northeast, consistent with its runoff direction. Groundwater with TDS < 3 g·L−1 accounts for 43.1% of the total water volume in the region, while saline water with TDS > 3 g·L−1 accounts for 56.9%. These factors provide key environmental bases for researching salt control in spring irrigation for different soil textures and irrigation with different water qualities. An overview of the study area is depicted in Figure 1.
Figure 1.
Overview of the study area and locations of sampling points.
2.2. Sample Collection and Experimental Design
2.2.1. Sample Collection and Water Preparation
A systematic soil sampling campaign was conducted in Yingjisha County in this study. Soil samples were collected from ten field plots: one control plot (CK) representing regional background values and nine experimental plots (A–I) spanning distinct soil textures in Yingjisha County. Soils were reconstructed in the laboratory into 1:10 scale columns (70 cm height × 7 cm diameter) based on original sand content. Columns were categorized into three texture groups: high-sand (>50%): CK, E, F, I; threshold-sand (45 ± 2%): A, G; and low-sand (<30%): B, C, H. To ensure the representativeness and accuracy of the samples, stratified sampling was conducted at 0–15 cm, 15–30 cm, 30–45 cm, and 45–60 cm depths, alongside stratified collection of soil particle size distribution samples (for texture classification via sieving method per GB/T 50123-2019 [35]) and soluble salt specimens (for TDS quantification at Xinjiang Geotechnical Testing Center). Here, CK represents the control sample, which was collected from the research area in Yingjisha County, Xinjiang. The soil texture of this sample represents the background value of this region. The sampling points are shown in Figure 1.
This experiment used groundwater with varying mineralization levels from Yingjisha County. Three water quality grades were artificially formulated: Q1 (1 g·L−1, freshwater), Q2 (2 g·L−1, brackish water), and Q3 (4 g·L−1, saltwater), to emulate groundwater environments under different mineralization conditions, as detailed in Table 1.
Table 1.
Chemical composition and EC of irrigation water prepared from natural groundwater.
2.2.2. Sample Detection and Data Processing
- Analysis of particle size distribution
Soil particle composition was analyzed using the sieving method (GB/T 50123-2019). Silt content was quantified alongside sand and clay fractions for USDA texture classification. Based on the sand content threshold (S0 = 45.2%) from the T–Q–S synergistic model, soils were categorized as high-sand soils (S > 50%), dominated by macropores and favoring leaching; threshold texture soils (S = 45 ± 2%), exhibiting balanced water retention and leaching; and low-sand soils (S < 30%), clay-dominated with strong capillary action.
Based on the particle size analysis results of the test area, soil samples from B, C, and H test plots were classified as clay (clay content > 45%, sand content < 15%) with strong salinity, while plot D was silty loam (sand 49.98%, silt 38.71%, clay 11.31%) with moderate salinity. CK, E, F, and I were sandy soils (sand content > 60%): Among them, B, C, and H were strongly saline soils with topsoil soluble salt content reaching 1.50%, and F was non-saline soil with total soluble salt content ≤ 0.96% in all layers. A was silty loam (silt content > 38%). Regarding the water retention (specific retention) effect, in the high-sand group (S > 50%: CK, E, F, I), water retention is generally low (5.18–5.81%), with sand-dominated coarse texture leading to weak water retention capacity and easy water infiltration, accelerating salt leaching and reducing surface salt accumulation. In the threshold group (S ≥ 45.2%: A, D, G), water retention is moderate (8.13–12.39%), balancing water movement with a balanced ratio of sand–silt–clay particles. In the low-sand group (S < 15%: B, C, H), water retention is significantly high (29.5–35.2%), with clay-dominated fine texture enhancing water retention capacity but leading to salt accumulation in the root zone. In terms of the pH effect, in the high-sand group the pH is neutral (5.2–6.4), inhibiting Na+ activity; in the threshold group, the pH fluctuates (5.6–7.5), affecting salt ion adsorption (e.g., group G: pH = 6.3–6.8 enhances clay adsorption); and in the low-sand group, the pH is slightly alkaline (7.8–9.8), activating Na+ and exacerbating salinization (e.g., group H: pH = 8.8–9.5 with high soluble salts). Key physical properties governing water–salt transport (bulk density, specific retention, pH, soluble salt content) and particle size distribution (clay/silt/sand fractions) are listed in Table 2. These parameters were prioritized due to their direct control on hydraulic conductivity and salt leaching efficiency [6].
Table 2.
Key physical properties and particle composition of soil samples.
Correlation analysis of soluble salt (%) with sand, silt (%), and clay (%) reveals a strong negative correlation between soluble salt content and soil sand content, suggesting that increasing sand content significantly decreases soluble salt content. Conversely, clay content shows a strong positive correlation with soluble salt content, meaning soluble salt content increases significantly as clay content rises. Additionally, a moderate positive correlation with silt content suggests slight soluble salt accumulation with increasing silt content, as shown in Table 3.
Table 3.
Pearson correlations between soluble salt content and soil particle size fractions (%).
- 2.
- Soil ion composition detection
This study employs ion chromatography (IC) to determine eight primary ion components in the following soil samples: Ca2+, Mg2+, Na+, K+, Cl−, SO42−, NO3−, and HCO3− [17]. The variations in texture at different depths of the same sampling point reflect the natural stratification of alluvial soils. All data are independent test results of stratified samples, conforming to the GB/T 50123-2019 standard.
Three-dimensional interaction function and verification
- T: Soil texture (%)
- Q: Irrigation quota (mm)
- S: Water salinity (g·L−1)
A multidimensional interaction term function is used to synergistically express the relationships between irrigation quota (T), water quality (Q), and sand content (S).
Parameter settings are as follows:
Irrigation quota gradient: 225–270 mm (covering typical arid-region spring irrigation requirements);
Water quality gradients: 1 g·L−1, 2 g·L−1, and 4 g·L−1;
Soil texture: Test plots with sandy, clayey, and silty soils, where sand content ranges from 30% to 70%.
- Parameters in the test: T0 = 250 mm (Benchmark irrigation volume)
- Q0 = 2 g·L−1 (Benchmark wastewater quality salinity)
- S0 = 45.2% (Sand grain threshold)
- A = 0.15 (Adsorption coefficient of viscous silts)
- B = 0.08 (Salt leaching efficiency coefficient)
- R indicates the salt reduction rate (%).
Function verification: Compared with the field test data [6], the desalination rate prediction error is <15%, significantly better than traditional binary models (error > 25%). Soil moisture, electrical conductivity, nutrient detection, and desalination rate calculation:
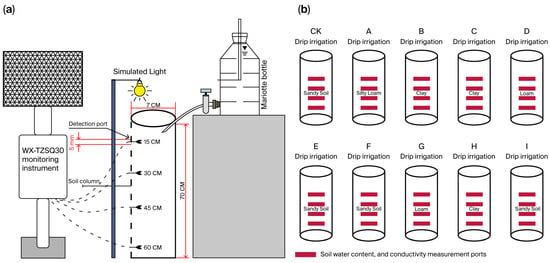
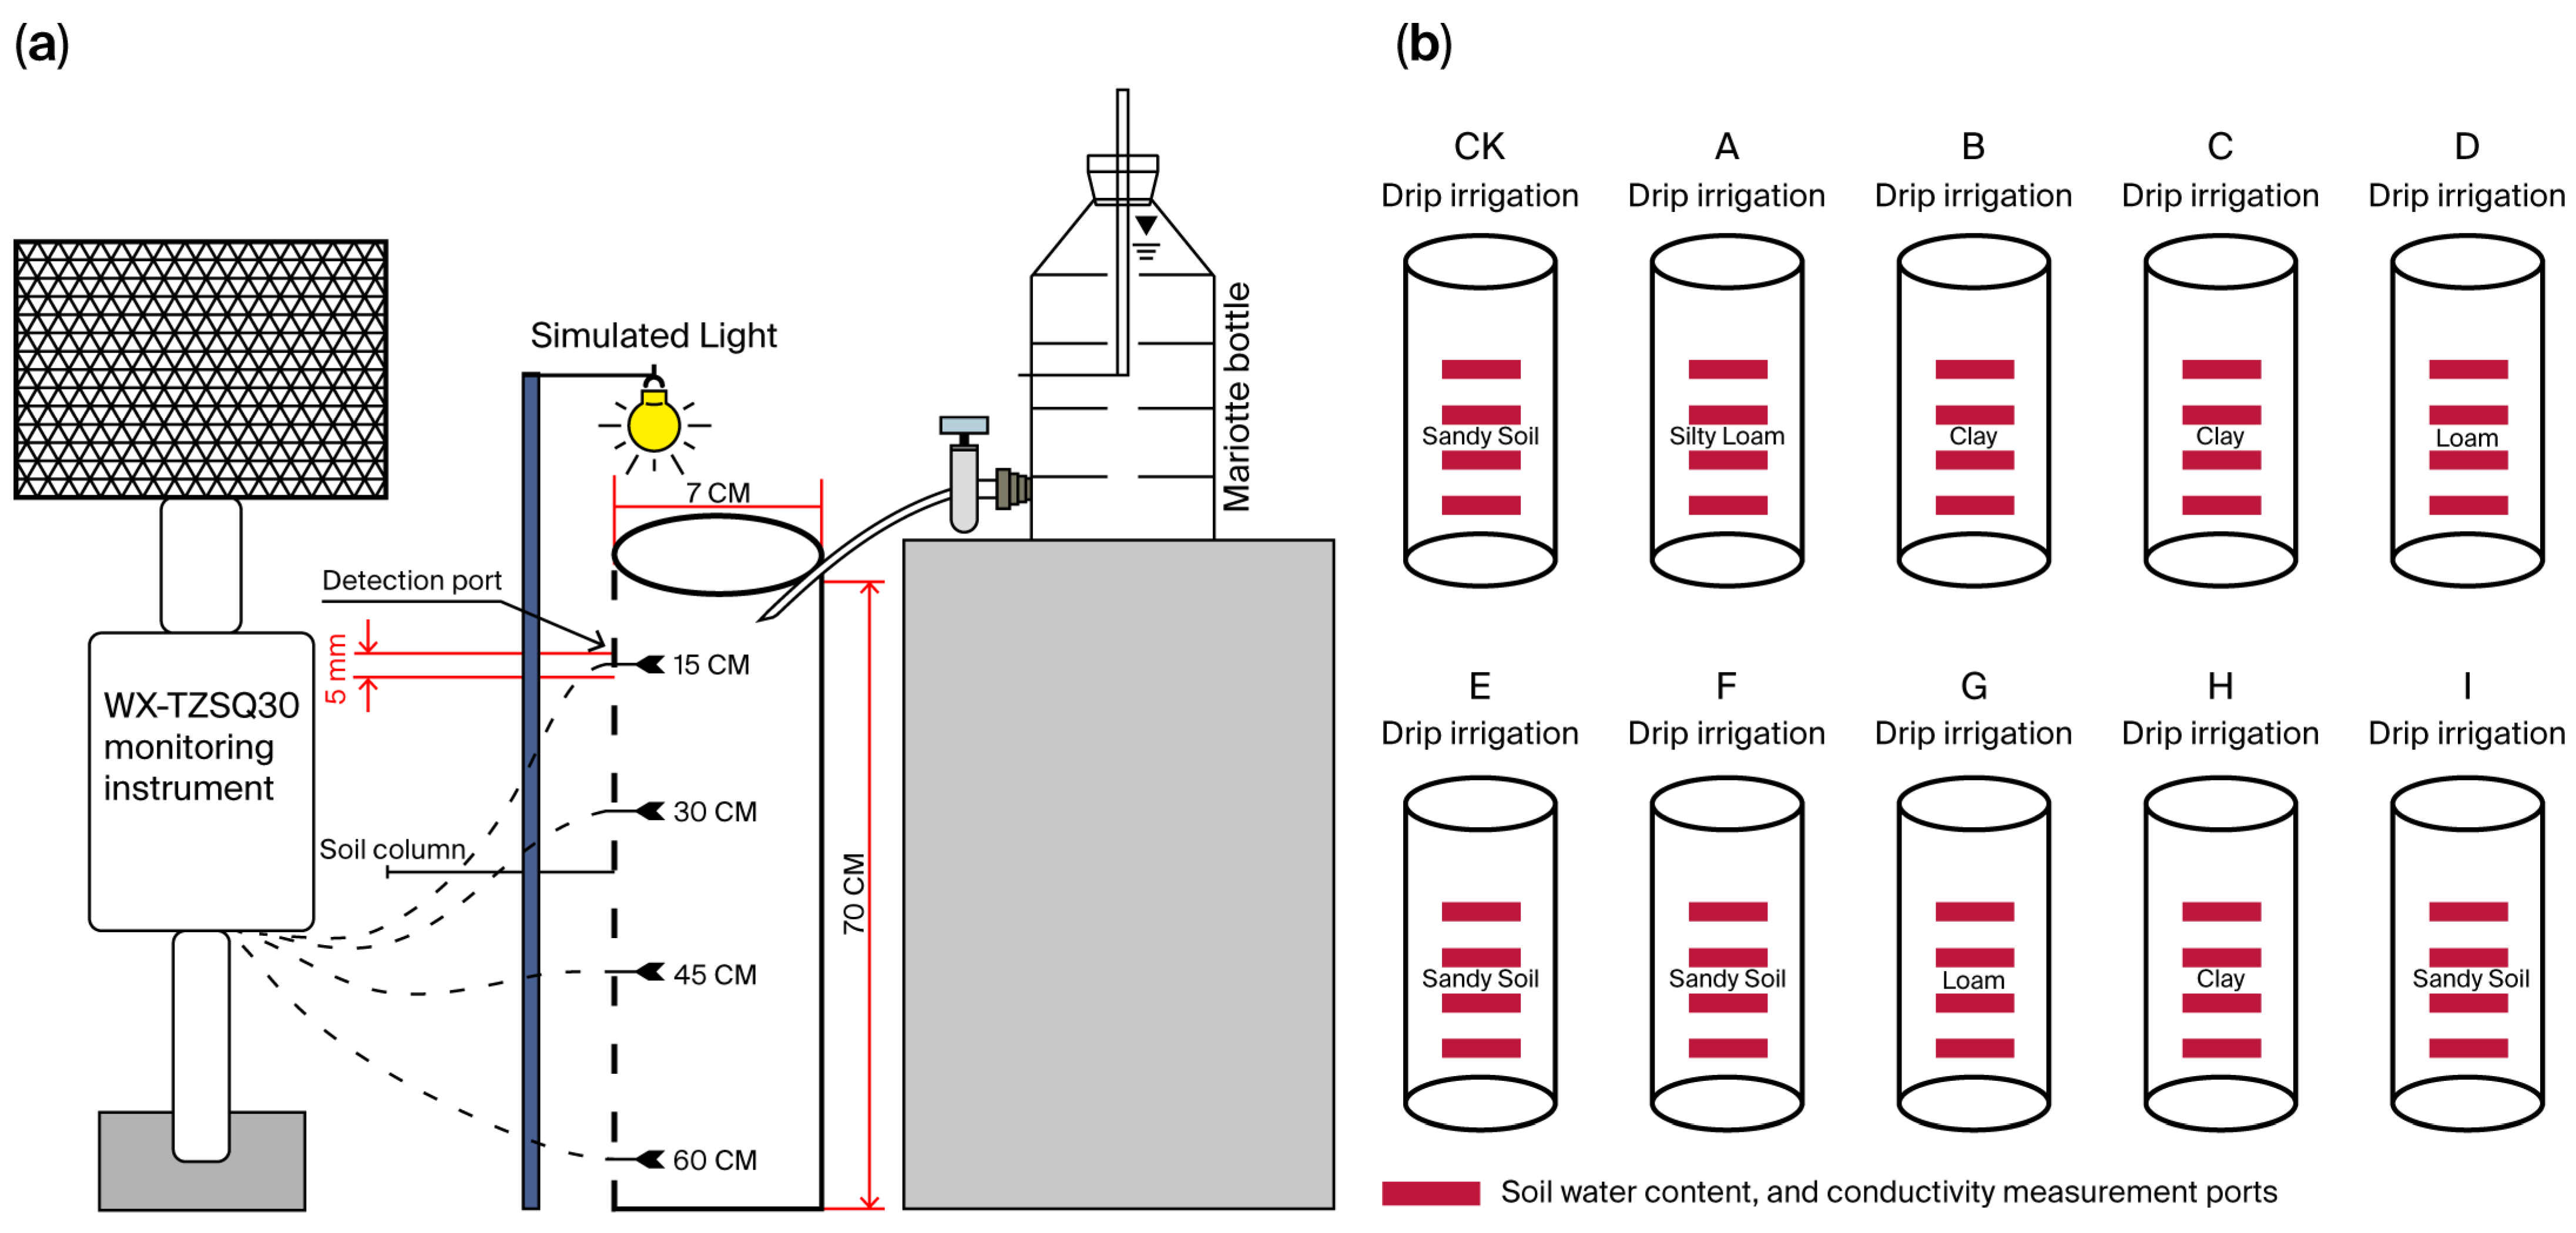
Soil electrical conductivity (EC) was quantified using a WX-TZSQ30 waters excitation tester (Shandong Wanxiang Environment Technology Co., Ltd., located in Shandong, China) via frequency domain reflectometry (FDR). This method concurrently determines (1) Soil pore water conductivity (ECp), which reflects soluble salt-induced stress on plant roots (± 0.1 mS·cm−1 accuracy); (2) volumetric water content: resolution ± 1% vol.; and (3) pH: accuracy ± 0.1. Triplicate measurements minimized random error. ECp values correlate with soil soluble salt content (TDS), serving as a proxy for salinity stress (experimental setup detailed in Figure 2). Nitrogen, phosphorus, and potassium contents were monitored by independent sensors LY-607 (N), LY-608 (P), and LY-609 (K) with a detection limit of 0.5 mg·kg−1. The desalination rate quantifies the efficiency of removing soluble salts (anions or cations) through physical, chemical, or membrane separation such as reverse osmosis or electrodialysis.
where Dinitial corresponds to the initial salt content (g·kg−1); and Dfinal corresponds to the final salt content (g·kg−1).
Figure 2.
Schematic diagram of the test equipment. (a) Indoor soil column experimental setup with multi-depth sensor configuration. (b) Stratified soil structure showing sensor installation at 15/30/45/60 cm depths. Note: WX-TZSQ30 sensors vertically inserted at each depth; LY-607, LY-608, LY-609: NPK sensors.
“The calculation of soil desalination rate needs to exclude the interference of deep salt return” (If Dfinal > Dinitial, the result is negative, indicating salt accumulation).
- 3.
- Soil Column Method for Specific Retention Measurement;
The soil column method quantifies specific retention (Sr) by simulating the natural process of gravity drainage in saturated porous media. The core principle involves:
(1) Saturation phase: A soil column is fully saturated with water to fill all pore spaces;
(2) Drainage phase: The column is allowed to drain freely under gravity until drainage ceases (i.e., residual water is retained by capillary forces against gravity);
(3) Measurement: The volume of retained water (Vretained) is measured and normalized to the total volume of the soil column (Vtotal):
Here, Sr represents the fraction of water resistant to gravity drainage due to capillary forces and molecular adhesion in soil pores.
2.2.3. Test Design
A 1:10 geometrically similar model, constructed based on Buckingham’s π theorem, was utilized to simulate soil water–salt transport under different water quality conditions during spring irrigation in Yingjisha County, Xinjiang. The soil column had an overall height of 70 cm and a diameter of 7 cm, filled in layers with stratified compaction. A 10 cm quartz sand buffer layer was set at the bottom. Monitoring holes with a diameter of 3 mm were installed at depths of 15, 30, 45, and 60 cm. The infiltration rate was calculated using Darcy’s law, yielding a result of 2.29 cm·h−1. Compared with the field-measured value of 2.5 cm·h−1, the relative error was 8.4% (|(2.29–2.5)/2.5| × 100%), meeting the accuracy requirements for field test simulation.
This study dynamically regulated the soil column surface evaporation rate through 4 h infrared light irradiation (radiation flux density of 850 W·m−2 ± 5%), achieving an evapotranspiration (ET) rate of 2.36 ± 0.07 mm·d−1, calibrated against field observations (2.51 mm·d−1) with a relative error of 5.98% (|(2.36–2.51)/2.51| × 100%). Errors ranged from 3.19% to 8.76%, within the preset threshold of ≤10%.
The study considered that wind speed disturbances during natural evaporation might cause differences in surface salt accumulation [5]. By comparing the Na+/Cl− molar ratio between the surface layer (0–5 cm) and the deep layer (50–60 cm) of the soil column (1.02 ± 0.08 vs. 0.98 ± 0.07), it was observed that artificial evaporation did not significantly alter the vertical distribution pattern of ions (p = 0.21), suggesting the reliability of this method in simulating salt transport. The primary observation period for the experiment was set within 21 days following spring irrigation, which aligns closely with the actual window for crop sowing after local spring irrigation.
Brackish–saline water refers to irrigation water with a mineralization gradient of 1–4 g·L−1 (Q1: 1 g·L−1 brackish water; Q2: 2 g·L−1 moderately saline water; Q3: 4 g·L−1 saline water), aligning with typical groundwater salinization ranges in arid regions (FAO definition: brackish water at 1–3 g·L−1, saline water at 3–5 g·L−1).
Sampling points (A–I) were selected based on natural farmland irrigation history (without experimental intervention), spanning a soil texture gradient from sandy soil (sand content > 60% sand) to clay loam soil (clay content > 45% clay). These samples represent the regional soil physicochemical properties (Table 1 and Table 2). During laboratory experiments, soil columns were reconstructed according to sand content, as illustrated in Figure 2 of the soil column experimental setup.
This study designed a spring irrigation mode with two spring irrigation quota gradients and three groundwater mineralization levels to simulate water–salt transport in cotton fields of Yingjisha County, Xinjiang. Drawing on Song et al.’s empirical research on water–salt transport in saline cotton fields [6], spring irrigation quotas were established as T1 (225 mm) and T2 (270 mm), where T1 represents the lower threshold for water conservation in spring irrigation within the region, and T2 signifies the upper threshold optimized for salt control. This range balances soil desalination efficiency and sustainable groundwater recharge for general soil textures. The irrigation method refers to simulating field spring irrigation through an indoor gravity irrigation system, which controls the flow rate with a constant water head to ensure uniform infiltration of irrigation water into reconstructed soil columns via a water distributor.
Spring irrigation quota: A simulated pre-sowing leaching volume (mm) and differentiated irrigation schemes were established: ① spring irrigation water gradients (100% of the standard quota, T1 = 225 mm, and 120% of the standard quota, T2 = 270 mm); and ② mineralization levels (Q1: 1 g·L−1, Q2: 2 g·L−1, Q3: 4 g·L−1) were used to investigate the dynamic water–salt response mechanisms in soils with varying sand contents.
Precise water control was facilitated by the soil column experimental system (with a bottom cross-sectional area of 38.5 cm2 = 0.00385 m2). The single irrigation volume was T1 = 0.225 m × 0.00385 m2 = 0.00087 m3 (0.87 L), T2 = 0.270 m × 0.00385 m2 = 0.00104 m3 (1.04 L). Soil columns were filled with soil samples collected from the study area to ensure close correspondence between experimental and in situ conditions.
Sensors were vertically inserted into pre-drilled ports along the soil column axis to monitor specific depths (15, 30, 45, 60 cm). The nitrogen, phosphorus, and potassium contents were monitored by independent sensors LY-607 (N), LY-608 (P), and LY-609 (K). As shown in Figure 2b, the vertically installed sensors recorded at depths of 15 cm and 60 cm.
3. Results and Analysis
Responses of reconstructed soil columns (grouped by field-measured sand content) are reported. Groups include high-sand (CK, E, F, I), threshold-sand (A, G), and low-sand (B, C, H) columns.
3.1. Characteristics and Influencing Factors of Soil Moisture Changes
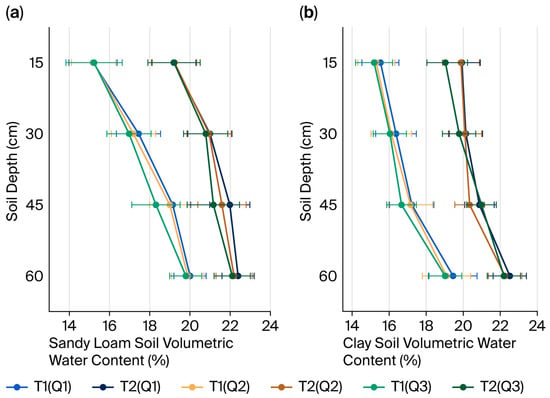
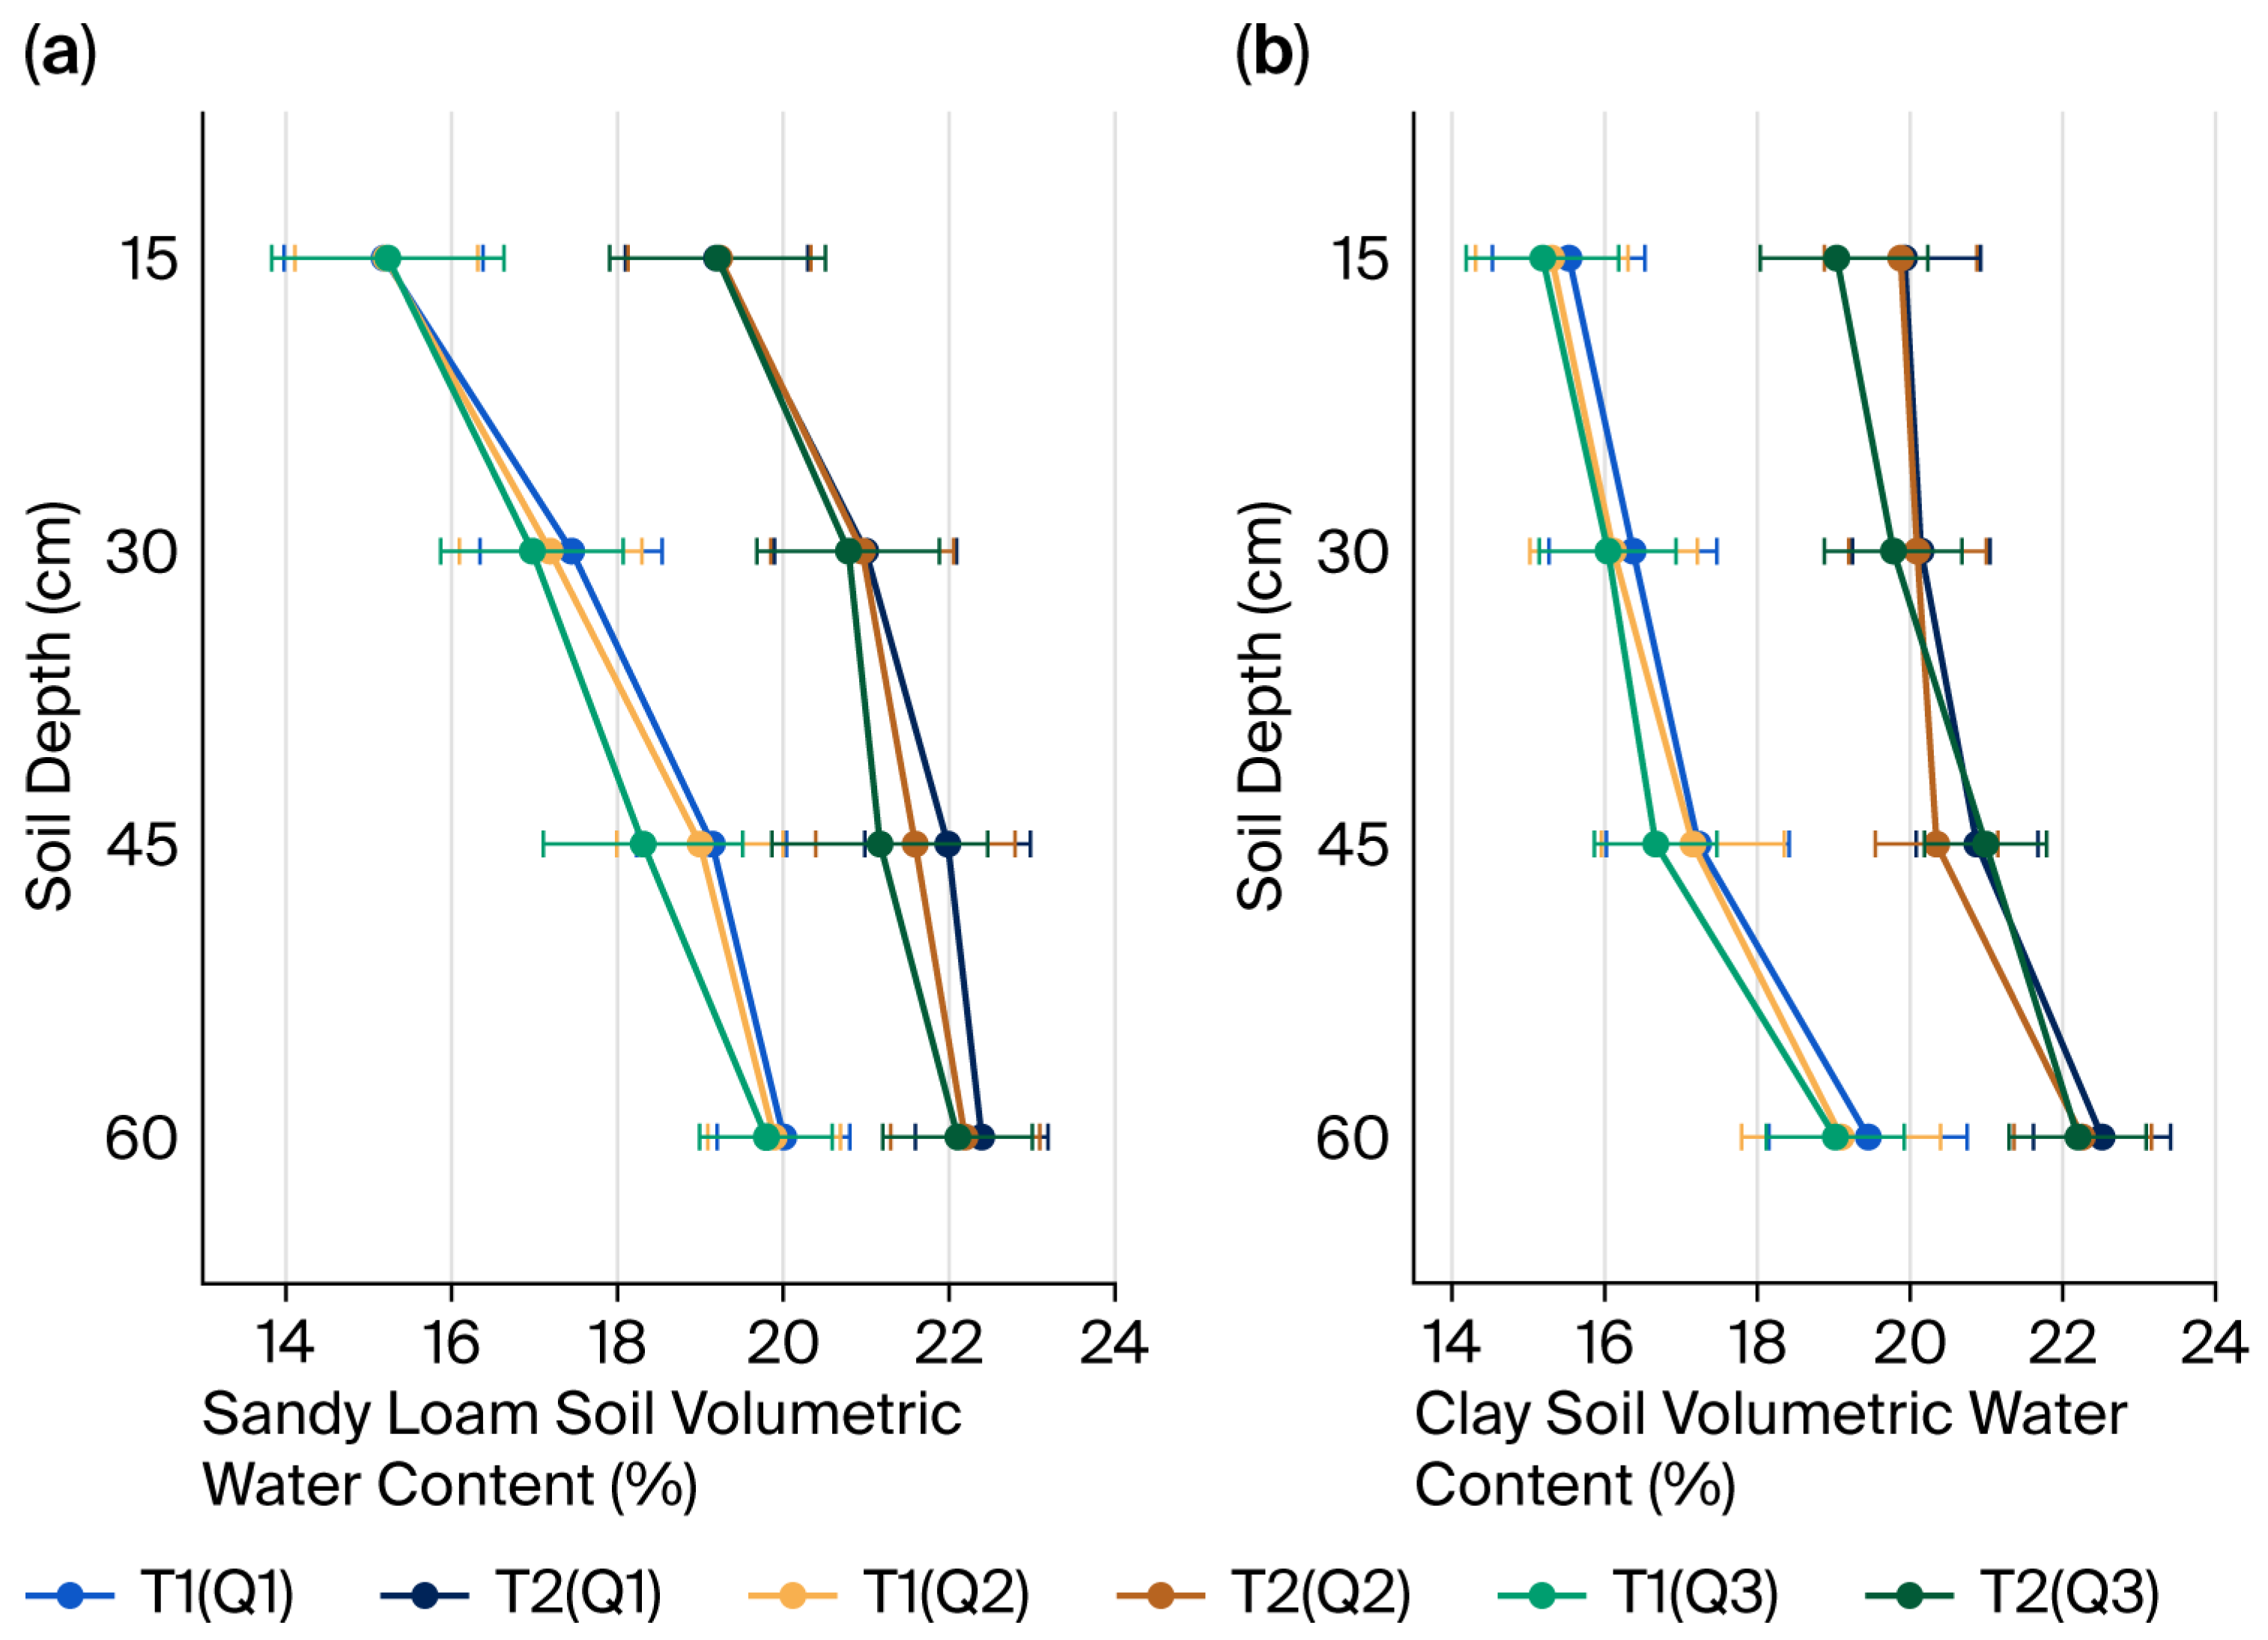
As illustrated in Figure 3, irrigation quotas significantly influenced soil moisture retention (p < 0.01), whereas water quality differences (Q1/Q2/Q3 treatments) under the same irrigation quota had no significant effect on soil moisture dynamics (p > 0.05). This lack of water quality effect is attributed to the minimal impact of low-to-moderate mineralization levels (1–4 g·L−1) on soil pore structure and hydraulic conductivity within this range, as physicochemical processes like clay dispersion typically require higher salinity thresholds (>5 g·L−1) to significantly alter water flow pathways [11,36]. In the silty loam soil (Point A, sand 65.5%, silt 25%, clay 9.5%), moisture content decreased significantly with depth, from 21.5% ± 0.6% in the surface layer to 14.8% ± 0.7% at 60 cm depth. Additionally, the relative error ranges expanded from ±2.8% to ±4.7% with increasing depth. At 45 cm depth, the T2 treatment group (18.4% ± 0.5%) had significantly higher moisture content than the T1 group (15.2% ± 0.6%). These results, along with the fundamental differences in soil hydraulic properties across textures (Table 4—e.g., higher Ks in sands, higher θr in clays), demonstrate that soil texture governs the inherent pathways and capacities for water movement and retention, while irrigation quota primarily regulates the total water volume input available for storage and redistribution within these defined pore systems. These findings confirm that soil particle composition (sand content) and irrigation quota are the core factors regulating soil moisture retention efficiency under the experimental conditions.
Figure 3.
Volumetric water content profiles under different irrigation quotas (T1, T2) and water qualities (Q1, Q2, Q3). (a) Sandy loam soil (sand 63%, silt 25%, clay 12%). (b) Clay soil (sand 12%, silt 33%, clay 55%).
Table 4.
Soil hydraulic characteristic parameters.
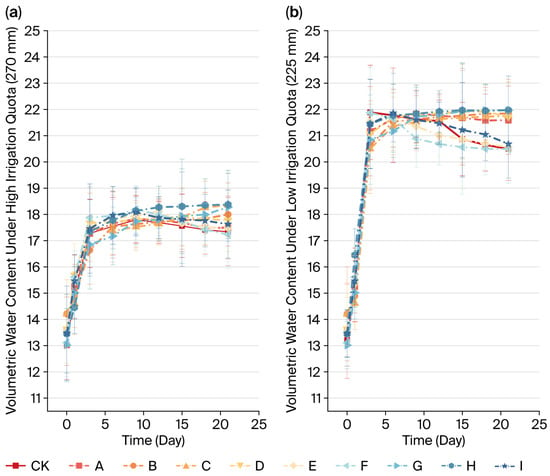
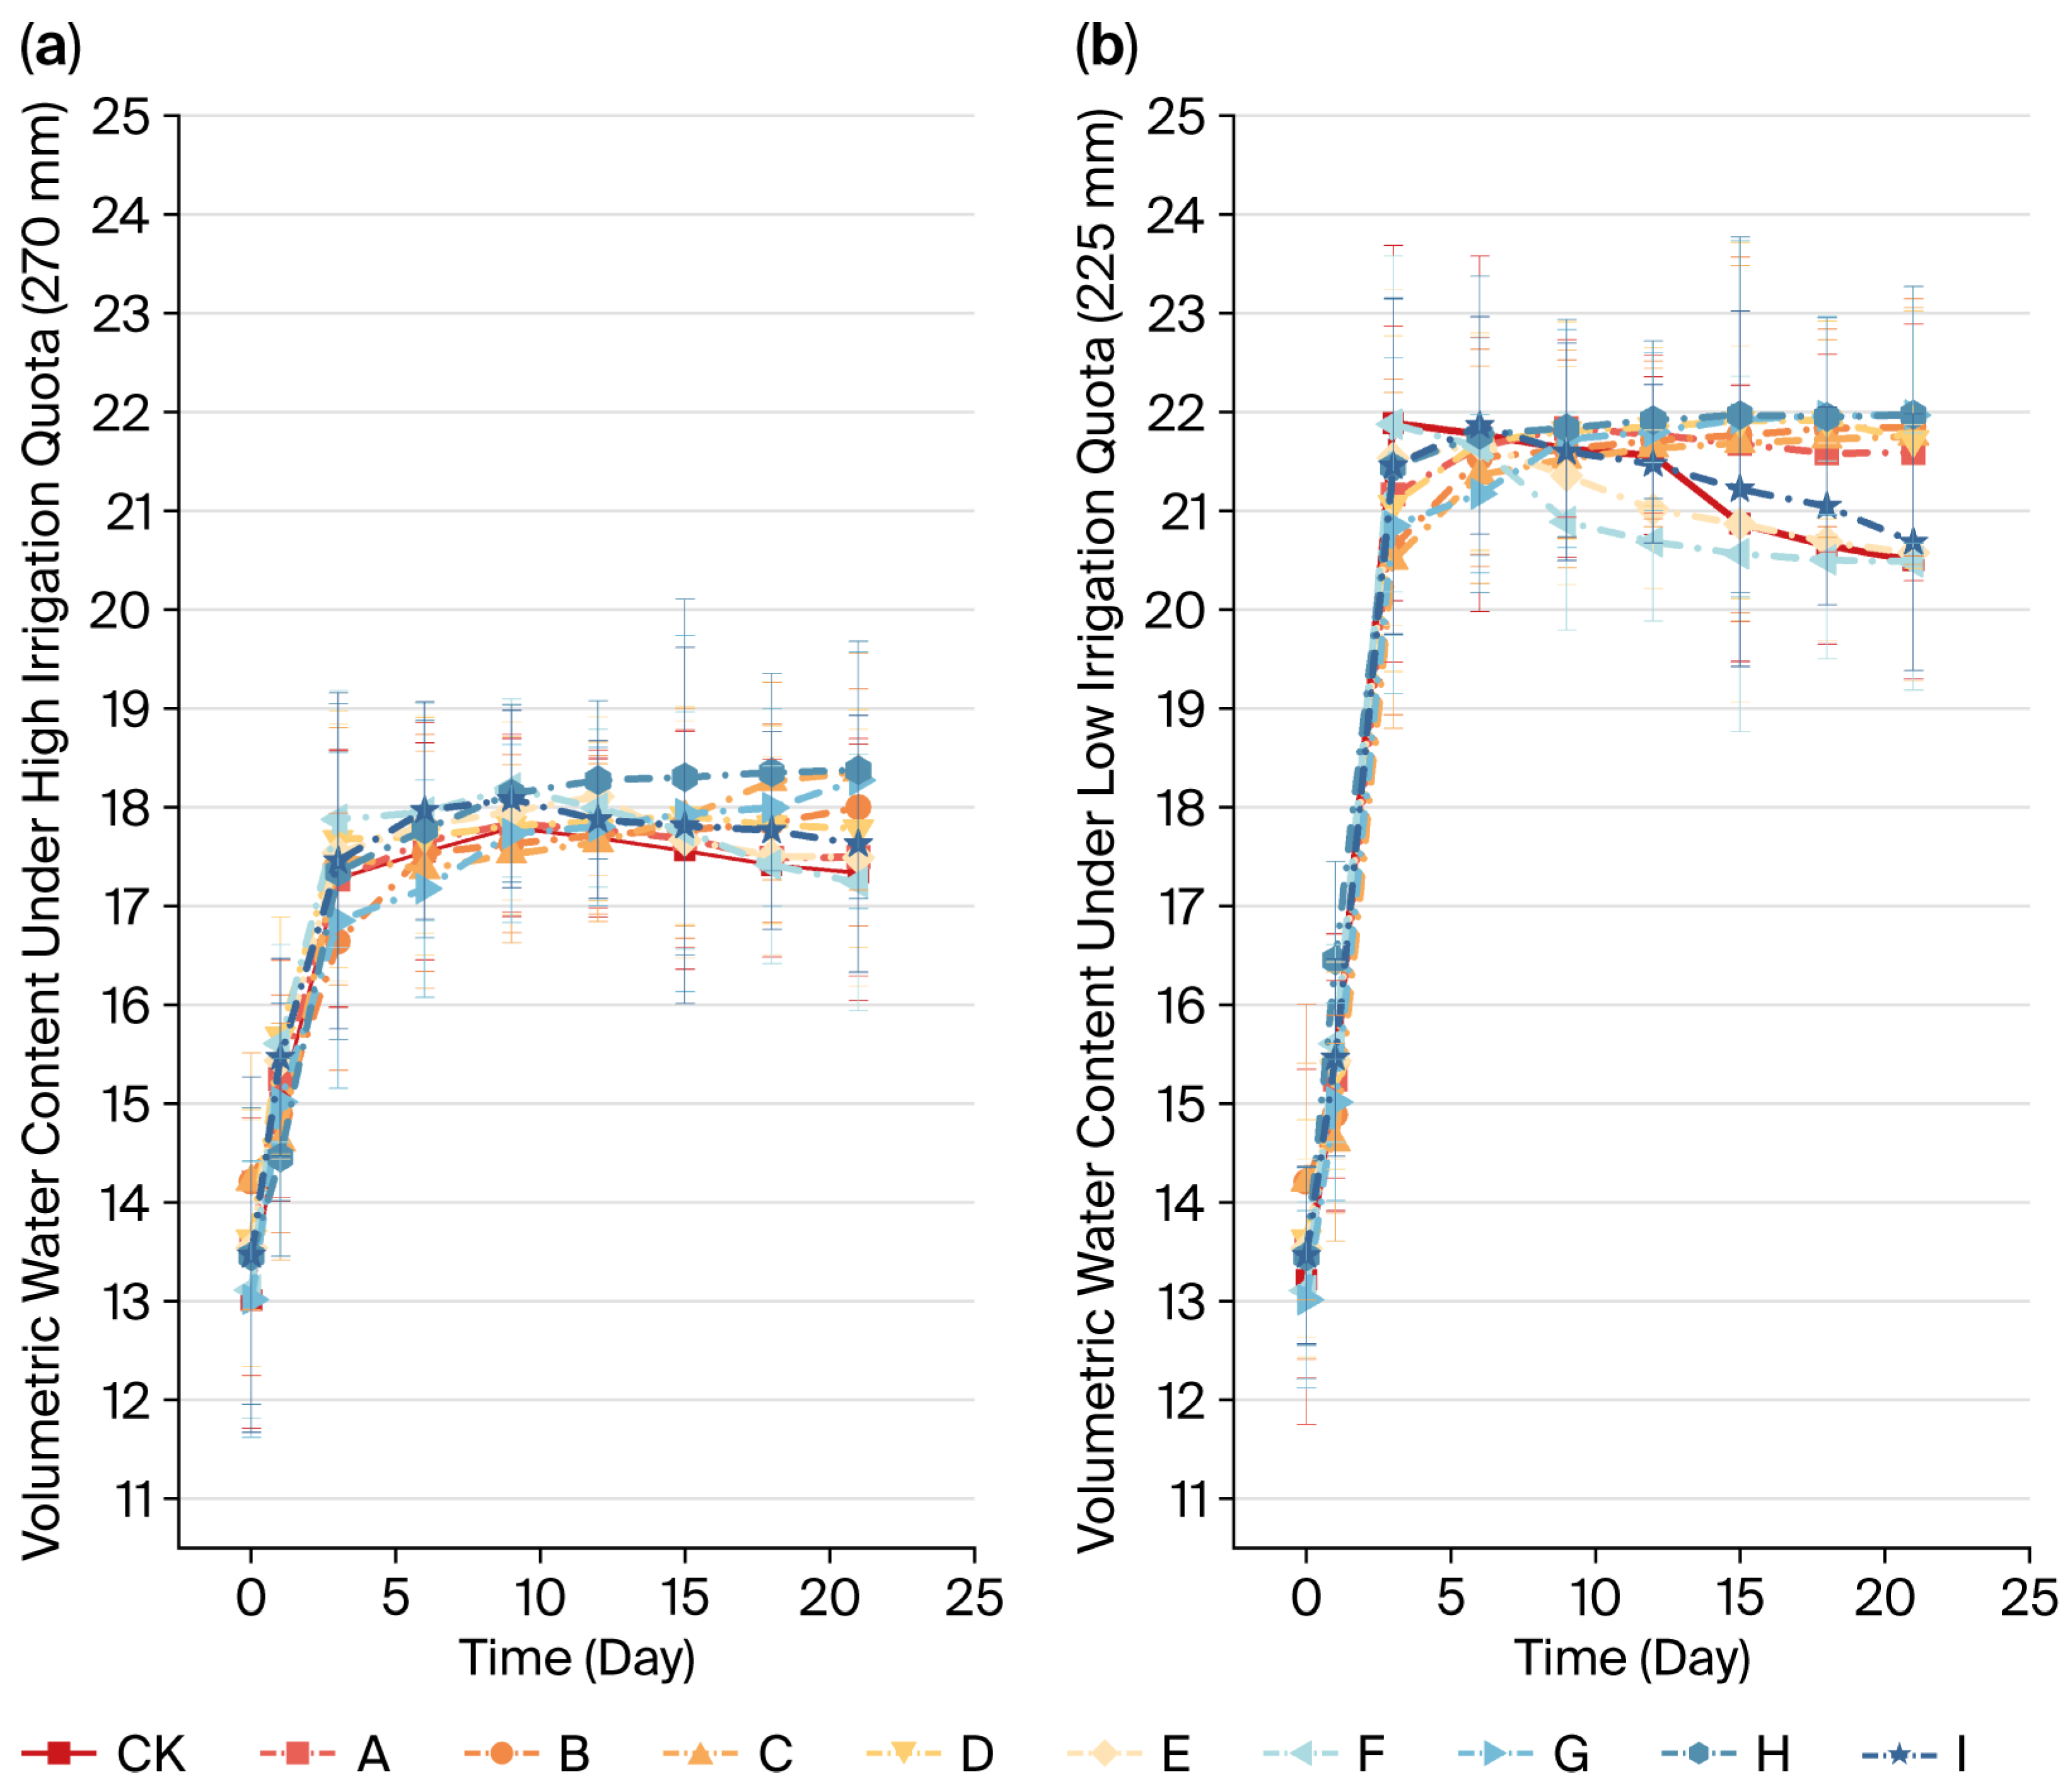
The comparison presented in Figure 4 demonstrates that soil moisture dynamics are jointly regulated by irrigation quotas and soil sand content, with significant interaction effects. Specifically, under consistent sand content (e.g., type E), the peak moisture content for the high spring irrigation quota treatment (Figure 4a, 21.3 ± 0.4%) significantly exceeded that of the low quota treatment (Figure 4b, 18.1 ± 0.5%). Notably, error bands for these two treatments diverged completely between days 15–25 (Δ > 3 SE), confirming that increased irrigation enhances soil water retention capacity (p < 0.01).
Figure 4.
Dynamics of soil volumetric water content under two irrigation quotas, grouped by sand content: high-sand (>50%): CK, D, E, F, I; threshold-sand (45 ± 2%): A, G; and low-sand (<15%): B, C, H. (a) High quota (270 mm). (b) Low quota (225 mm).
Under low irrigation quotas (Figure 4b), the soil with high sand content (Group A, highest sand fraction) exhibited the lowest moisture content (16.2 ± 0.7%), whereas the soil with low sand content (Group H) reached a peak moisture content of 19.8 ± 0.4%, with no overlap in their error bands (Figure 2, days 5–10). Group H (highest proportion of clay) showed a 3.6 ± 0.5% increase in moisture content compared to Group A (highest sand fraction) under low quotas. Additionally, Group H exhibited a lower attenuation rate later in the period (−0.21%/day vs. −0.38%/day for Group A), suggesting that an increase in clay content can mitigate water loss.
Low-quota sand content variation resulted in a 4.3% moisture difference (Group A: 16.2% vs. Group H: 19.8%), narrowing to 2.8% under high quotas (Group A: 20.5% vs. Group H: 23.3%). This suggests high quotas diminish the influence of soil texture (Figure 4b error band overlap > 60%). The high-sand group (A/G/I) had a significantly higher late-stage moisture coefficient of variation (CV = 15–18%) than the low-sand group (B/H/C, CV = 8–10%), with the error bandwidth expanding by 120% (Figure 4a, days 20–25), indicating that sand content diminishes moisture retention.
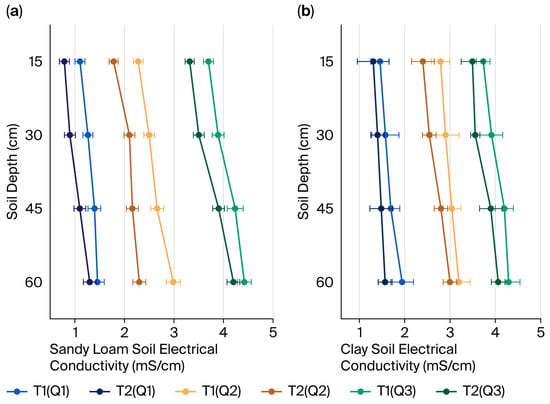
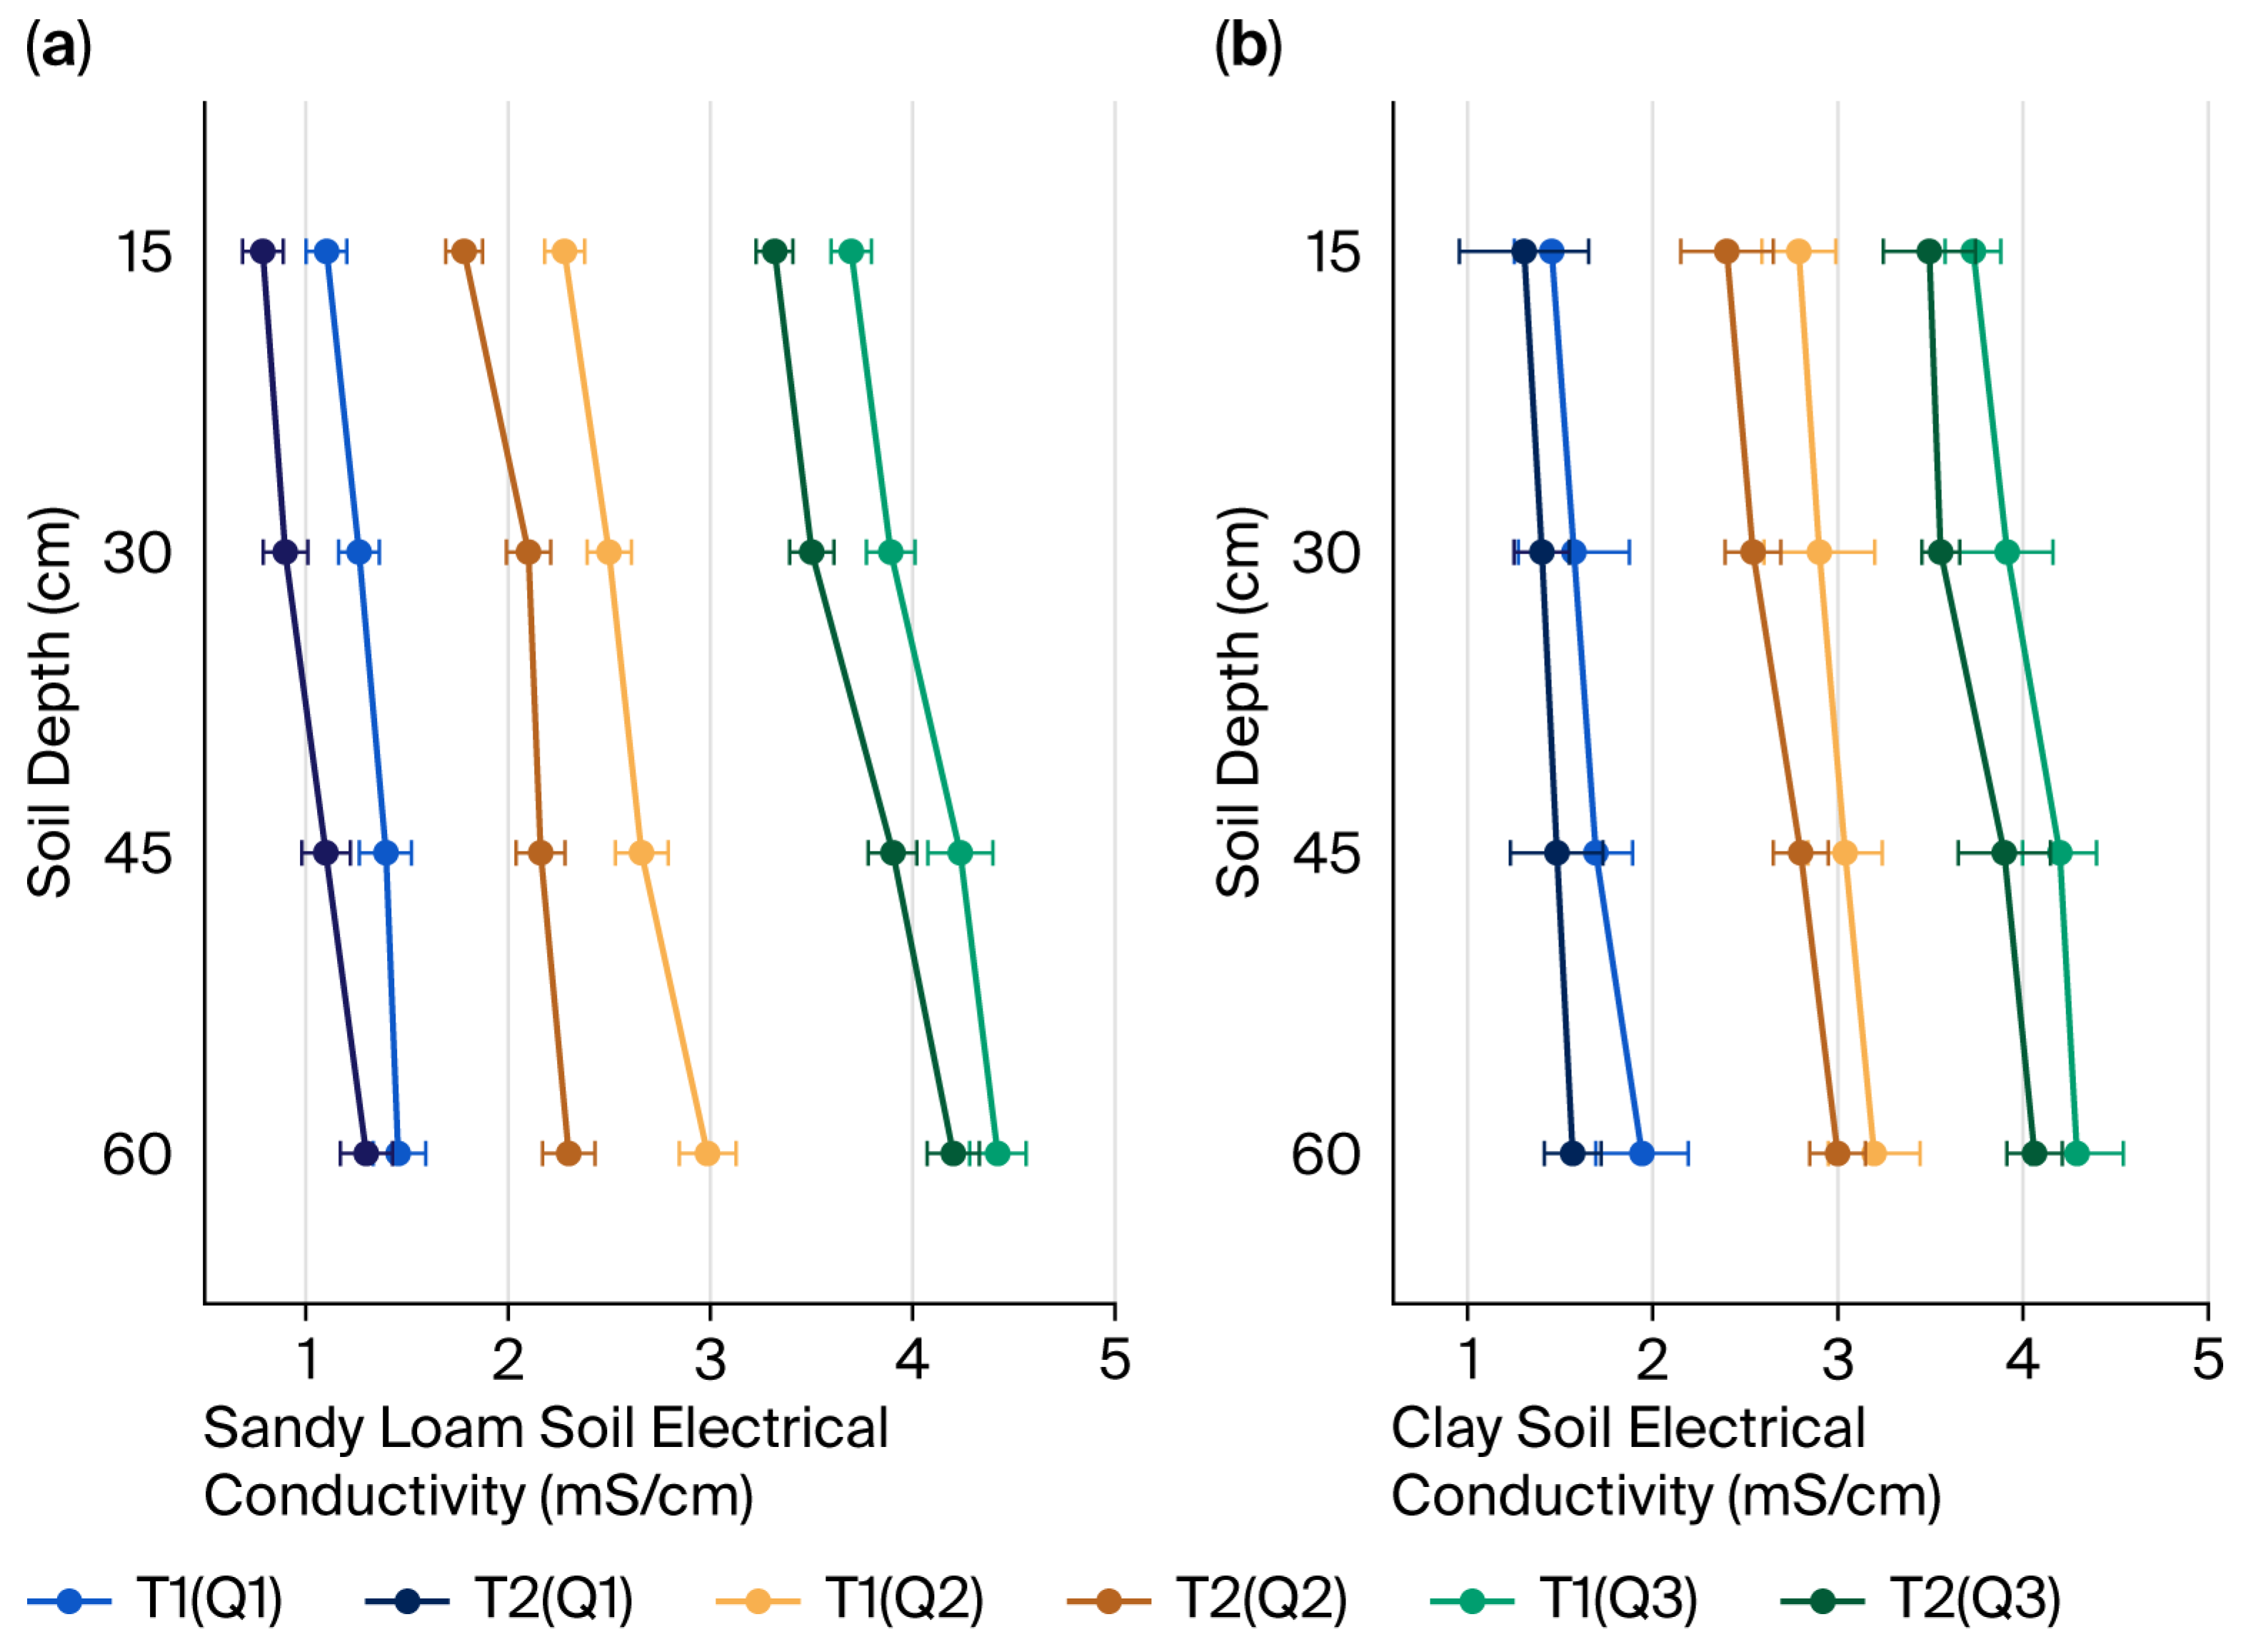
3.2. Characteristics and Influencing Factors of Soil Electrical Conductivity Changes
Figure 5 illustrates the impact of spring irrigation quotas and water quality on the electrical conductivity (EC) of sandy loam (Point A) and clay (Point H) at varying depths. Soil profile salinity distribution is governed by three factors: water mineralization, irrigation quotas, and soil texture. Water mineralization of irrigation water (Q1–Q3) serves as the primary driver of soil salt accumulation. As the mineralization degree of the water increases (Q1 ⟶ Q3), EC at the same depth increases markedly (e.g., at 60 cm in high-clay soil: Q1 = 2.1 ± 0.3 mS·cm−1 ⟶ Q3 = 4.0 ± 0.5 mS·cm−1; for soil with higher sand content: Q1 = 2.4 ± 0.4 mS·cm−1 ⟶ Q3 = 4.7 ± 0.6 mS·cm−1). Notably, within the same group, there is no overlap in Q1–Q3 error bands, which do not overlap in deeper layers (>45 cm), confirming increased soil salinity with increasing mineralization (p < 0.01).
Figure 5.
Depth profiles of soil electrical conductivity under spring irrigation with varying quotas (T1, T2) and water qualities (Q1, Q2, Q3). (a) Sandy loam soil (sand 65.54%, silt 29.17%, clay 5.29%). (b) Clay soil (sand 11.48%, silt 40.99%, clay 47.53%).
High quota irrigation (T2) significantly reduces salt retention across the entire soil layer, as evidenced by lower EC values in T2 vs. T1 (e.g., at 60 cm in high-sand soil: T1 (Q3) = 4.9 ± 0.7 mS·cm−1 vs. T2 (Q3) = 4.1 ± 0.5 mS·cm−1, with error ranges exceeding 3 SE). This trend is consistent in both soil types, with T2 reducing EC by 0.8–1.2 mS·cm−1 in high-clay soil, indicating heavy irrigation facilitates salt leaching to deeper layers.
As the soil depth increases to 60 cm, salt accumulation intensifies, with EC increasing by 2.3 ± 0.5 mS·cm−1 in silty soil and 1.8 ± 0.4 mS·cm−1 in clay soil. Deeper layers also exhibit broader error bands (e.g., silty soil EC error at 60 cm: ±0.6 to ±0.9 mS·cm−1, a 125% increase from ±0.4 mS·cm−1 at 15 cm), reflecting reduced salt transport profile stability. Silty soil exhibits a stronger response to salt migration, with a significantly steeper EC depth gradient slope (−0.08 mS·cm−2 vs. −0.05 mS·cm−2 in clay soil). Furthermore, the dispersion of deep data is higher in silty soil (RSE = 23%) than in clay soil (RSE = 15%), which aligns with the physical mechanism of enhanced permeability due to high sand content.
Therefore, a “high frequency and high-volume” irrigation strategy is recommended for silty farmland to mitigate the irreversible risk of deep salt accumulation.
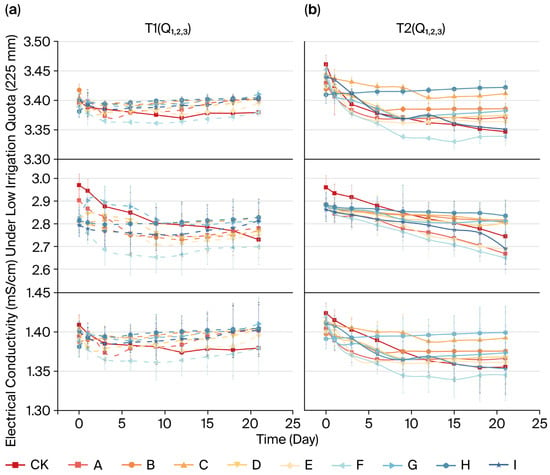
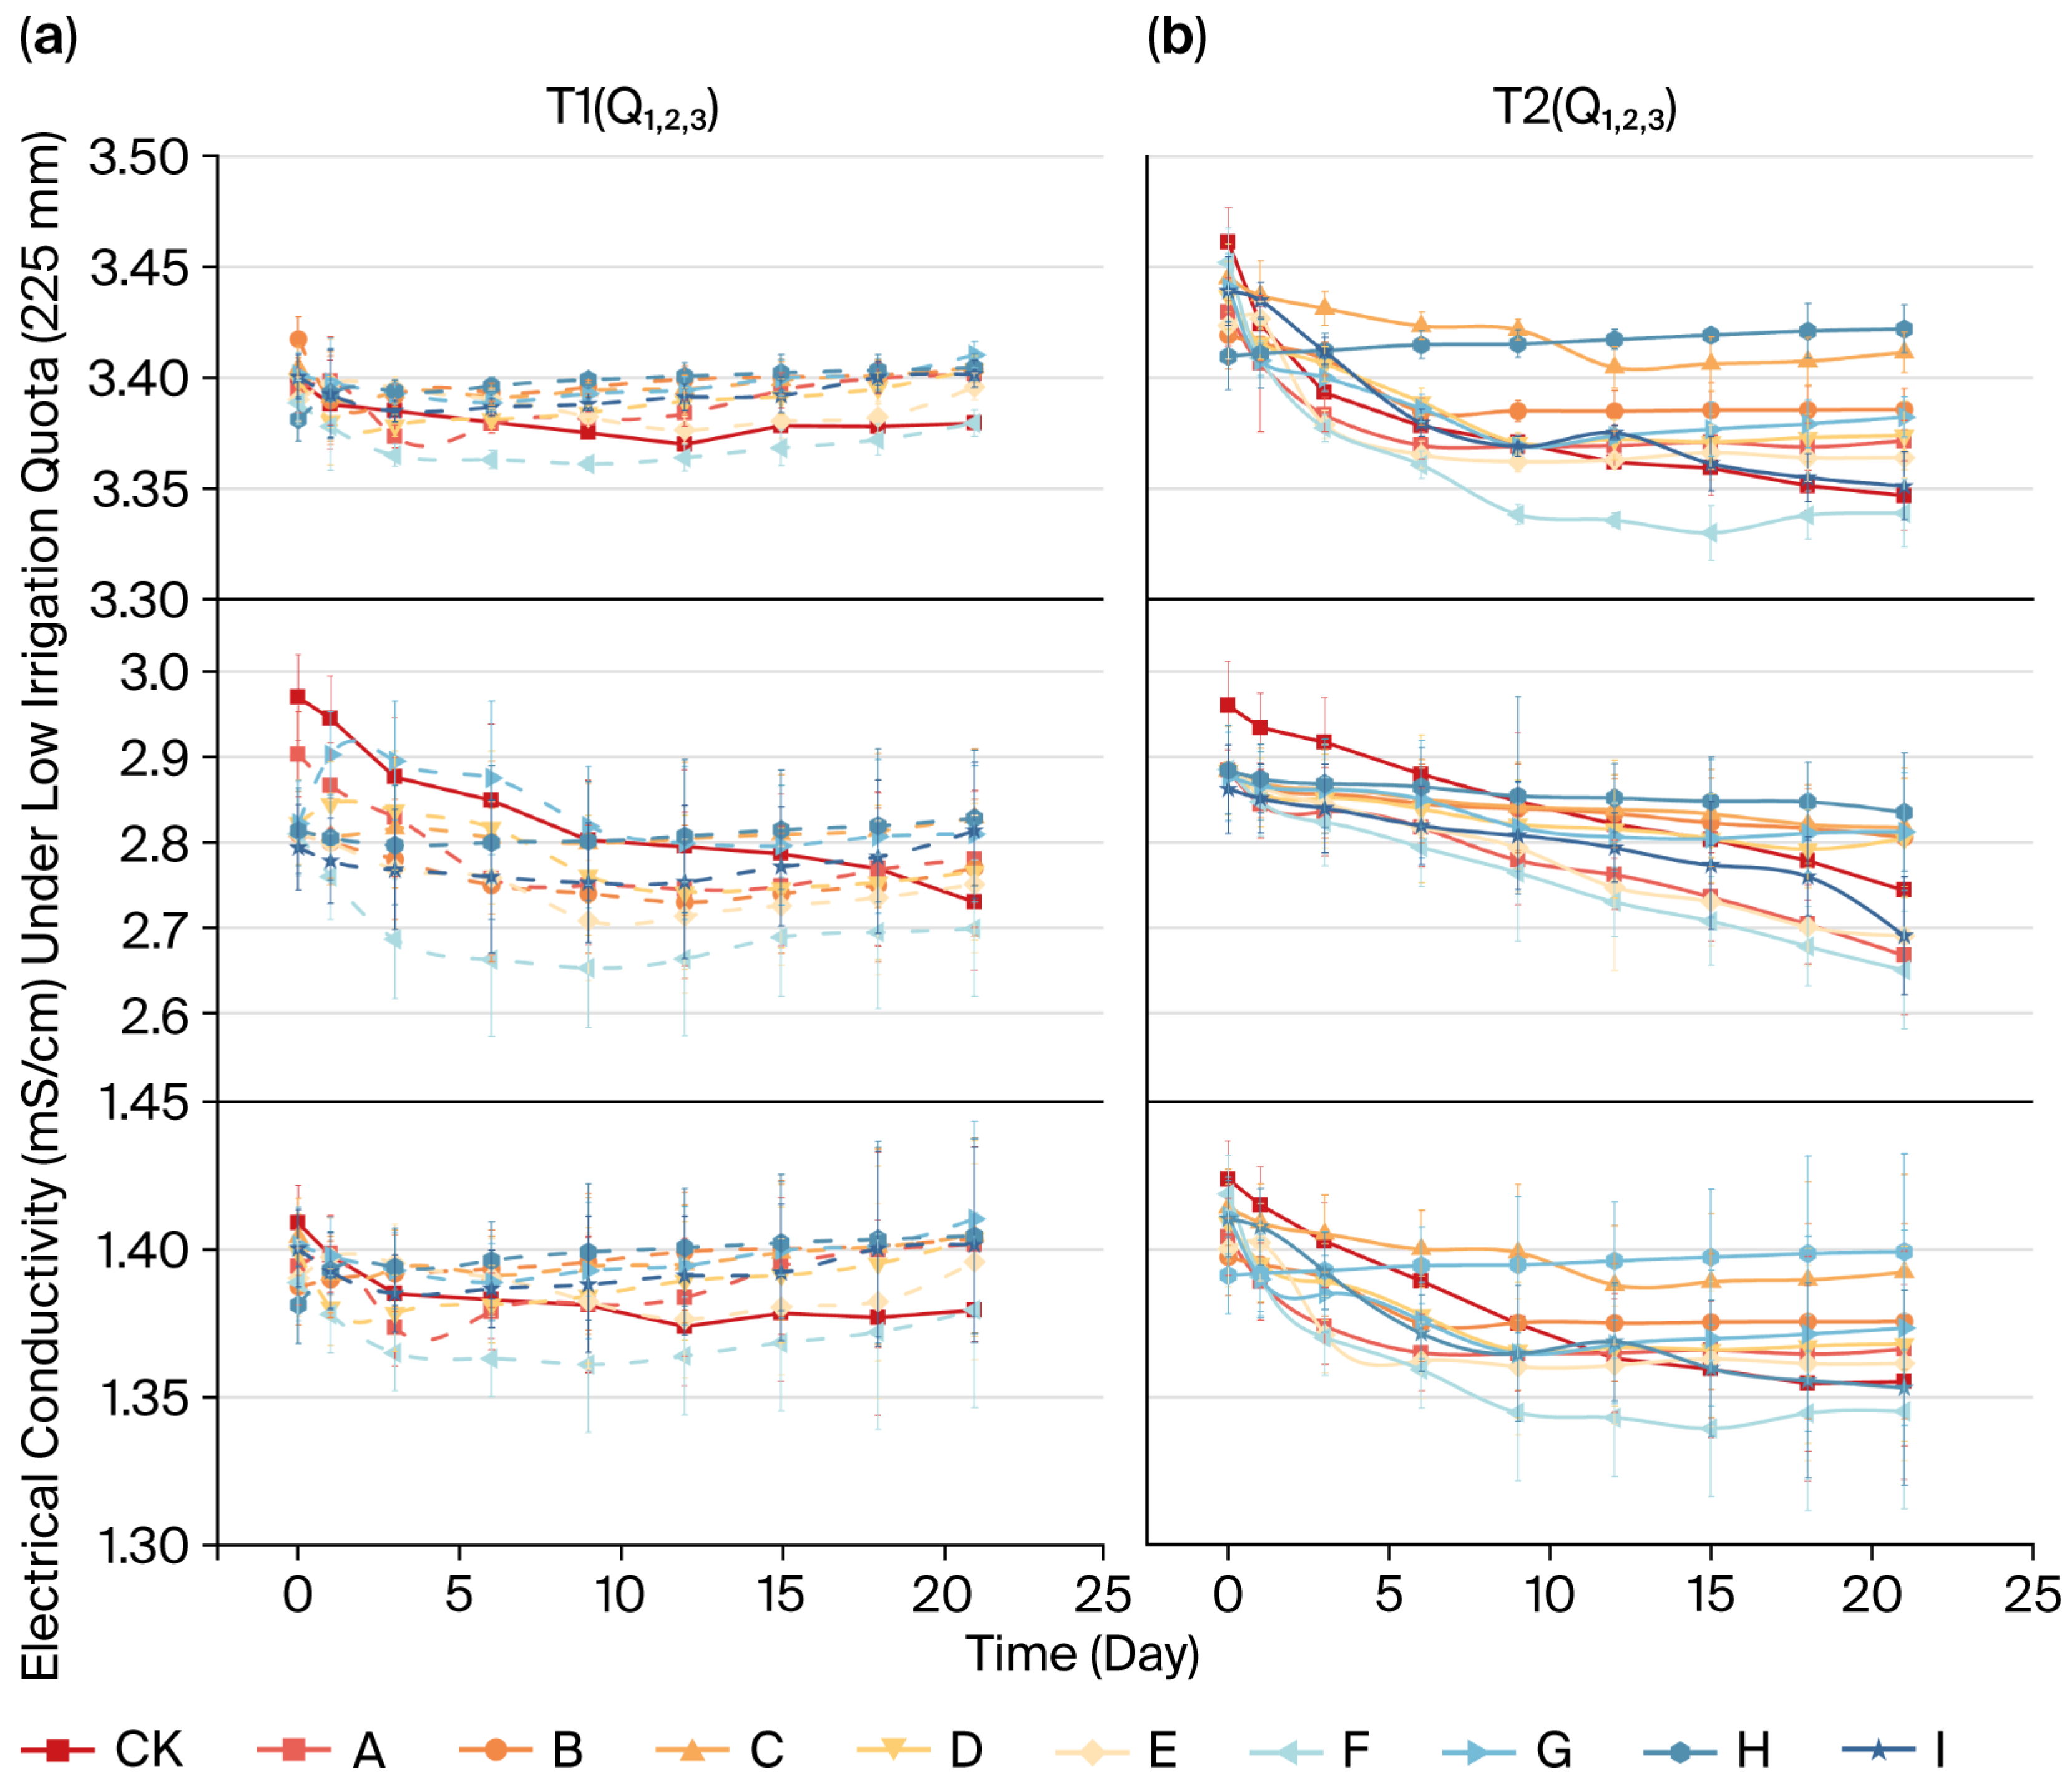
As depicted in Figure 6, soil salinity dynamics are jointly regulated by irrigation quotas, sand content, and water quality, exhibiting notable spatiotemporal variations. For the same sand content (D) and water quality (Q2), electrical conductivity (EC) in the T2 high quota treatment consistently remained lower than that of T1 (Day 5: T1 = 4.3 ± 0.5 mS·cm−1 vs. T2 = 3.2 ± 0.4 mS·cm−1). Notably, the error ranges became fully separated from Day 3 onwards (Δ > 3 SE), confirming that higher water volumes facilitate salt leaching (p < 0.01). By Day 5 in the T2 group, the EC change rate approached zero (slope ≤ |0.05| mS·cm·day−1), with error margins reduced by 40% (±0.4 ⟶ ±0.2 mS·cm−1 under Q2 conditions), indicating a dynamic equilibrium of salt transport at this point.
Figure 6.
Dynamics of soil electric conductivity under different water qualities and irrigation quotas, grouped by sand content: high-sand (>50%): CK, D, E, F, I; threshold-sand (45 ± 2%): A, G; and low-sand (<15%): B, C, H. (a) Electrical conductivity (mS·cm−1) under low irrigation quota (225 mm). (b) Electrical conductivity (mS·cm−1) under high irrigation quota (270 mm).
Under T1–Q3 conditions, the low-sand group (Class H) peaked at 5.8 ± 0.6 mS·cm−1, markedly exceeding the high-sand group (Class A: 3.9 ± 0.5 mS·cm−1). The groups showed non-overlapping error ranges on Day 10 (Δ = 1.9 mS·cm−1 > 4 SE). Each 10% increase in the proportion of clay and silt (H ⟶ I) raised EC by 0.72 ± 0.15 mS·cm−1 (R2 = 0.87), attributed to salt retention due to the adsorption of cations by fine particles.
Only high mineralization (Q3) significantly elevated conductivity during the initial stage (<5 days). For example, EC under T1-Q3 was 5.1 ± 0.7 mS·cm−1 on Day 1 vs. 3.3 ± 0.4 mS·cm−1 under Q1. After 10 days, Q1–Q3 error bands overlapped by >85% within the same sand/irrigation group (e.g., T2–I group bandwidth ±0.3 mS·cm−1), indicating negligible long-term water quality effects on salt accumulation (p > 0.05).
These results indicate that the irrigation quota is the primary factor in salt regulation. Sand content influences salt retention intensity by altering adsorption capacity, whereas water quality plays only a short-term role. When sand content exceeds 45.2%, the salt penetration depth (60 cm) under saline water irrigation (4 g·L−1) is 1.8 times (ΔEC = 37%) greater than that under freshwater irrigation (1 g·L−1). However, under the same conditions, the surface salt accumulation of clay loam (sand content < 30%) increased by 23%, confirming that sandy soil has stronger tolerance to high-salinity water (Figure 6).
3.3. Accumulation of Soil Ionic Components
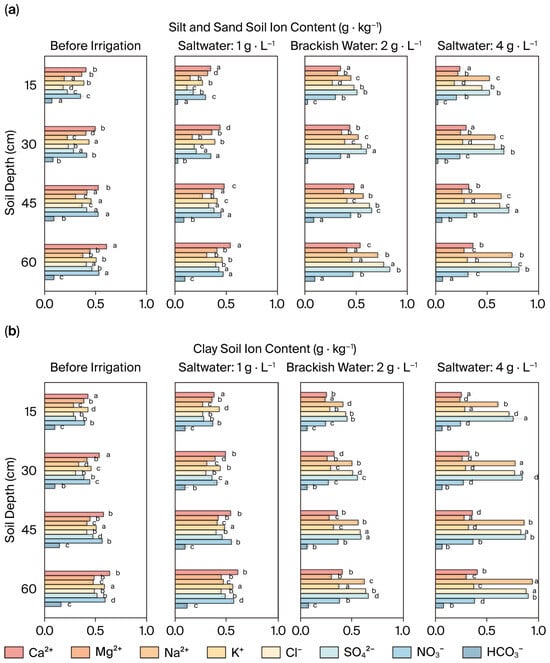
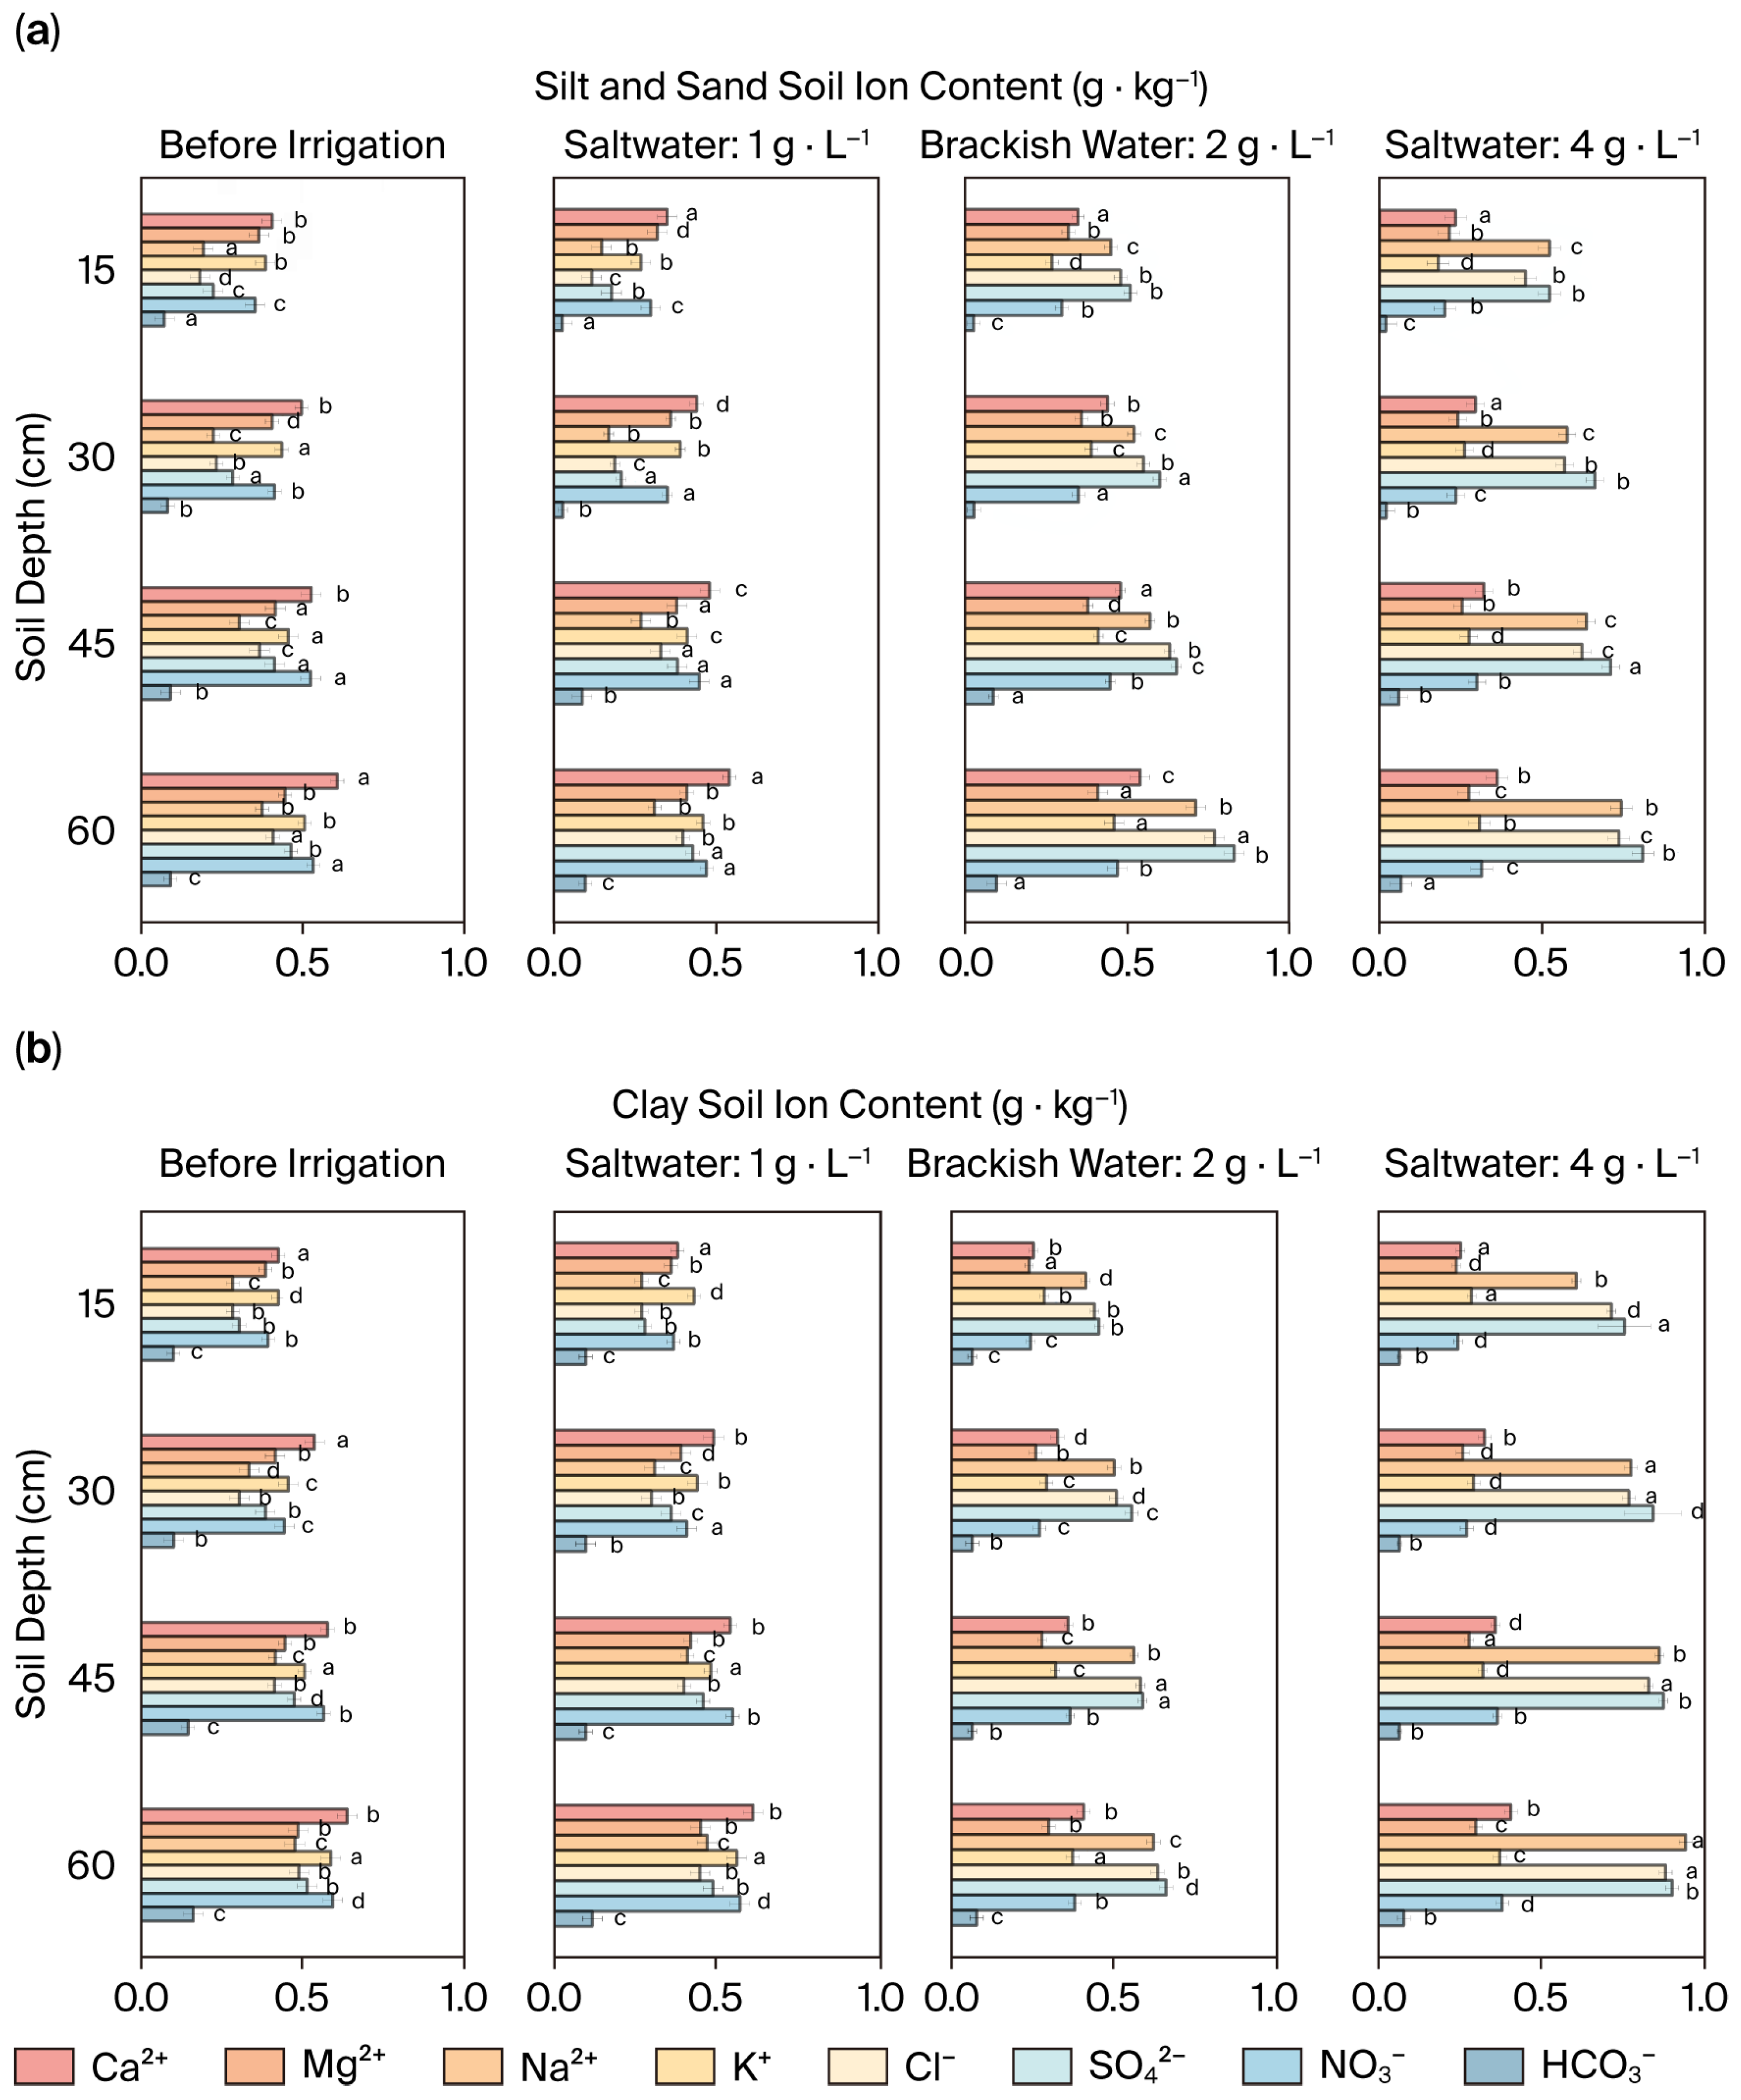
As illustrated in Figure 7, the spatial differentiation of Na+, Cl−, and SO42− in the soil profile after spring irrigation is influenced by three factors: irrigation water quality, spring irrigation quota, and soil texture. Under saltwater irrigation, the Na+ content at 60 cm depth in clay soil with the T2 high quota treatment (0.52 ± 0.08 g·kg−1) was significantly lower than that with the T1 treatment (0.78 ± 0.10 g·kg−1), with non-overlapping error ranges (Δ > 2.5 SE). This trend was more pronounced in silty soil (Cl−: T2 = 0.41 ± 0.06 g·kg−1 vs. T1 = 0.67 ± 0.09 g·kg−1), confirming that a high irrigation quota facilitates the downward movement of salt ions. In all treatments, the concentration of SO42− peaked at 45–60 cm (0.87 ± 0.11 g·kg−1 in silty saltwater), representing a 42.6% increase compared to the 0–15 cm layer (0.61 ± 0.07 g·kg−1). Notably, error ranges widened to ±0.15 g·kg−1 at greater depths (vs. ±0.08 g·kg−1 at the surface), aligning with the strong adsorption properties of clay minerals, as revealed by the Freundlich adsorption model (K = 1.23).
Figure 7.
Distribution of eight major soil ions (Na+, Cl−, SO42−, etc.) across soil depths under different irrigation water salinities: (a) high-sand soils (S > 50%) and (b) low-sand (clayey) soils (S < 30%). Note: In this figure, the letters (a, b, c, d, etc.) represent statistical groups. If two bars share the same letter, there is no statistically significant difference between them. Conversely, different letters indicate a significant difference.
In silty soil with a sand content > 50%, the cumulative amount of Na+ at 60 cm depth (saltwater T1: 0.94 ± 0.12 g·kg−1) was significantly higher than that in clay soil (0.51 ± 0.07 g·kg−1), with error margins exceeding 3 SE. This finding confirms that the leaching rate of Na+ in sandy pores (0.47 mg·cm−1·d) is 2.1 times faster than that in clay soil (0.22 mg·cm−1·d). Additionally, the concentration of Cl− in the deeper layers of silty soil (0.58 ± 0.08 g·kg−1) was 37.5% higher than that in clay soil. Conversely, HCO3− exhibited a 56.3% decrease at the 60 cm depth in clay soil when exposed to freshwater conditions (0.18 ± 0.03 g·kg−1 to 0.08 ± 0.02 g·kg−1), likely due to its high mobility, causing it to preferentially infiltrate beyond the root zone.
Following the fifth day of high-dose treatment (T2), the variation in ion concentration was ≤5%, with error ranges narrowing by >50%, indicating the establishment of a leaching equilibrium. When the mineralization degree exceeds 4 g·L−1, the error band width at the 45–60 cm depth in silt soil (±0.13 g·kg−1) increases by 86% compared to that in freshwater (±0.07 g·kg−1), highlighting enhanced uncertainty in ion migration induced by high salinity.
The results indicate that increased irrigation quotas can overcome soil texture constraints, driving salt ions deeper into the soil profile. However, specific adsorption retains SO42− concentrated within the 45–60 cm clayey layer. The efficient leaching of monovalent ions in sandy soil, exemplified by the Na+ migration rate of 0.47 mg·cm−1·d, offers a pore-scale regulation approach for differentiated management in saline areas.
3.4. Analysis of Irrigation Desalination Effect and Nutrient Loss
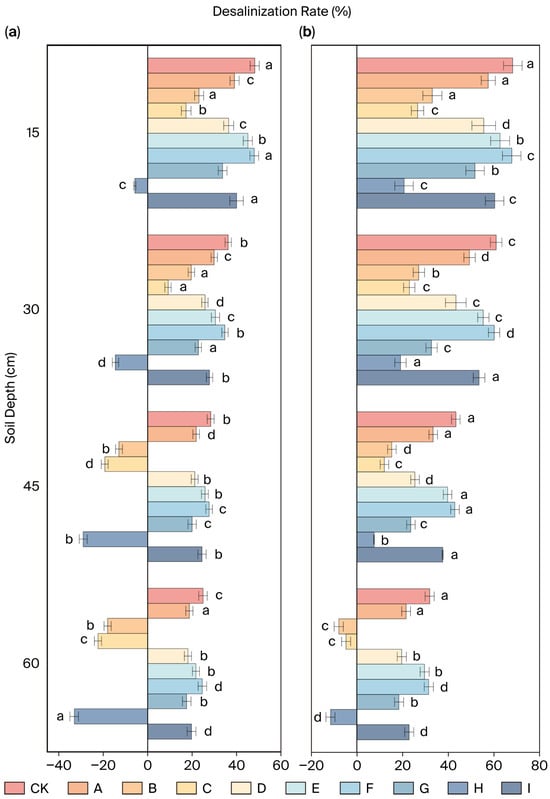
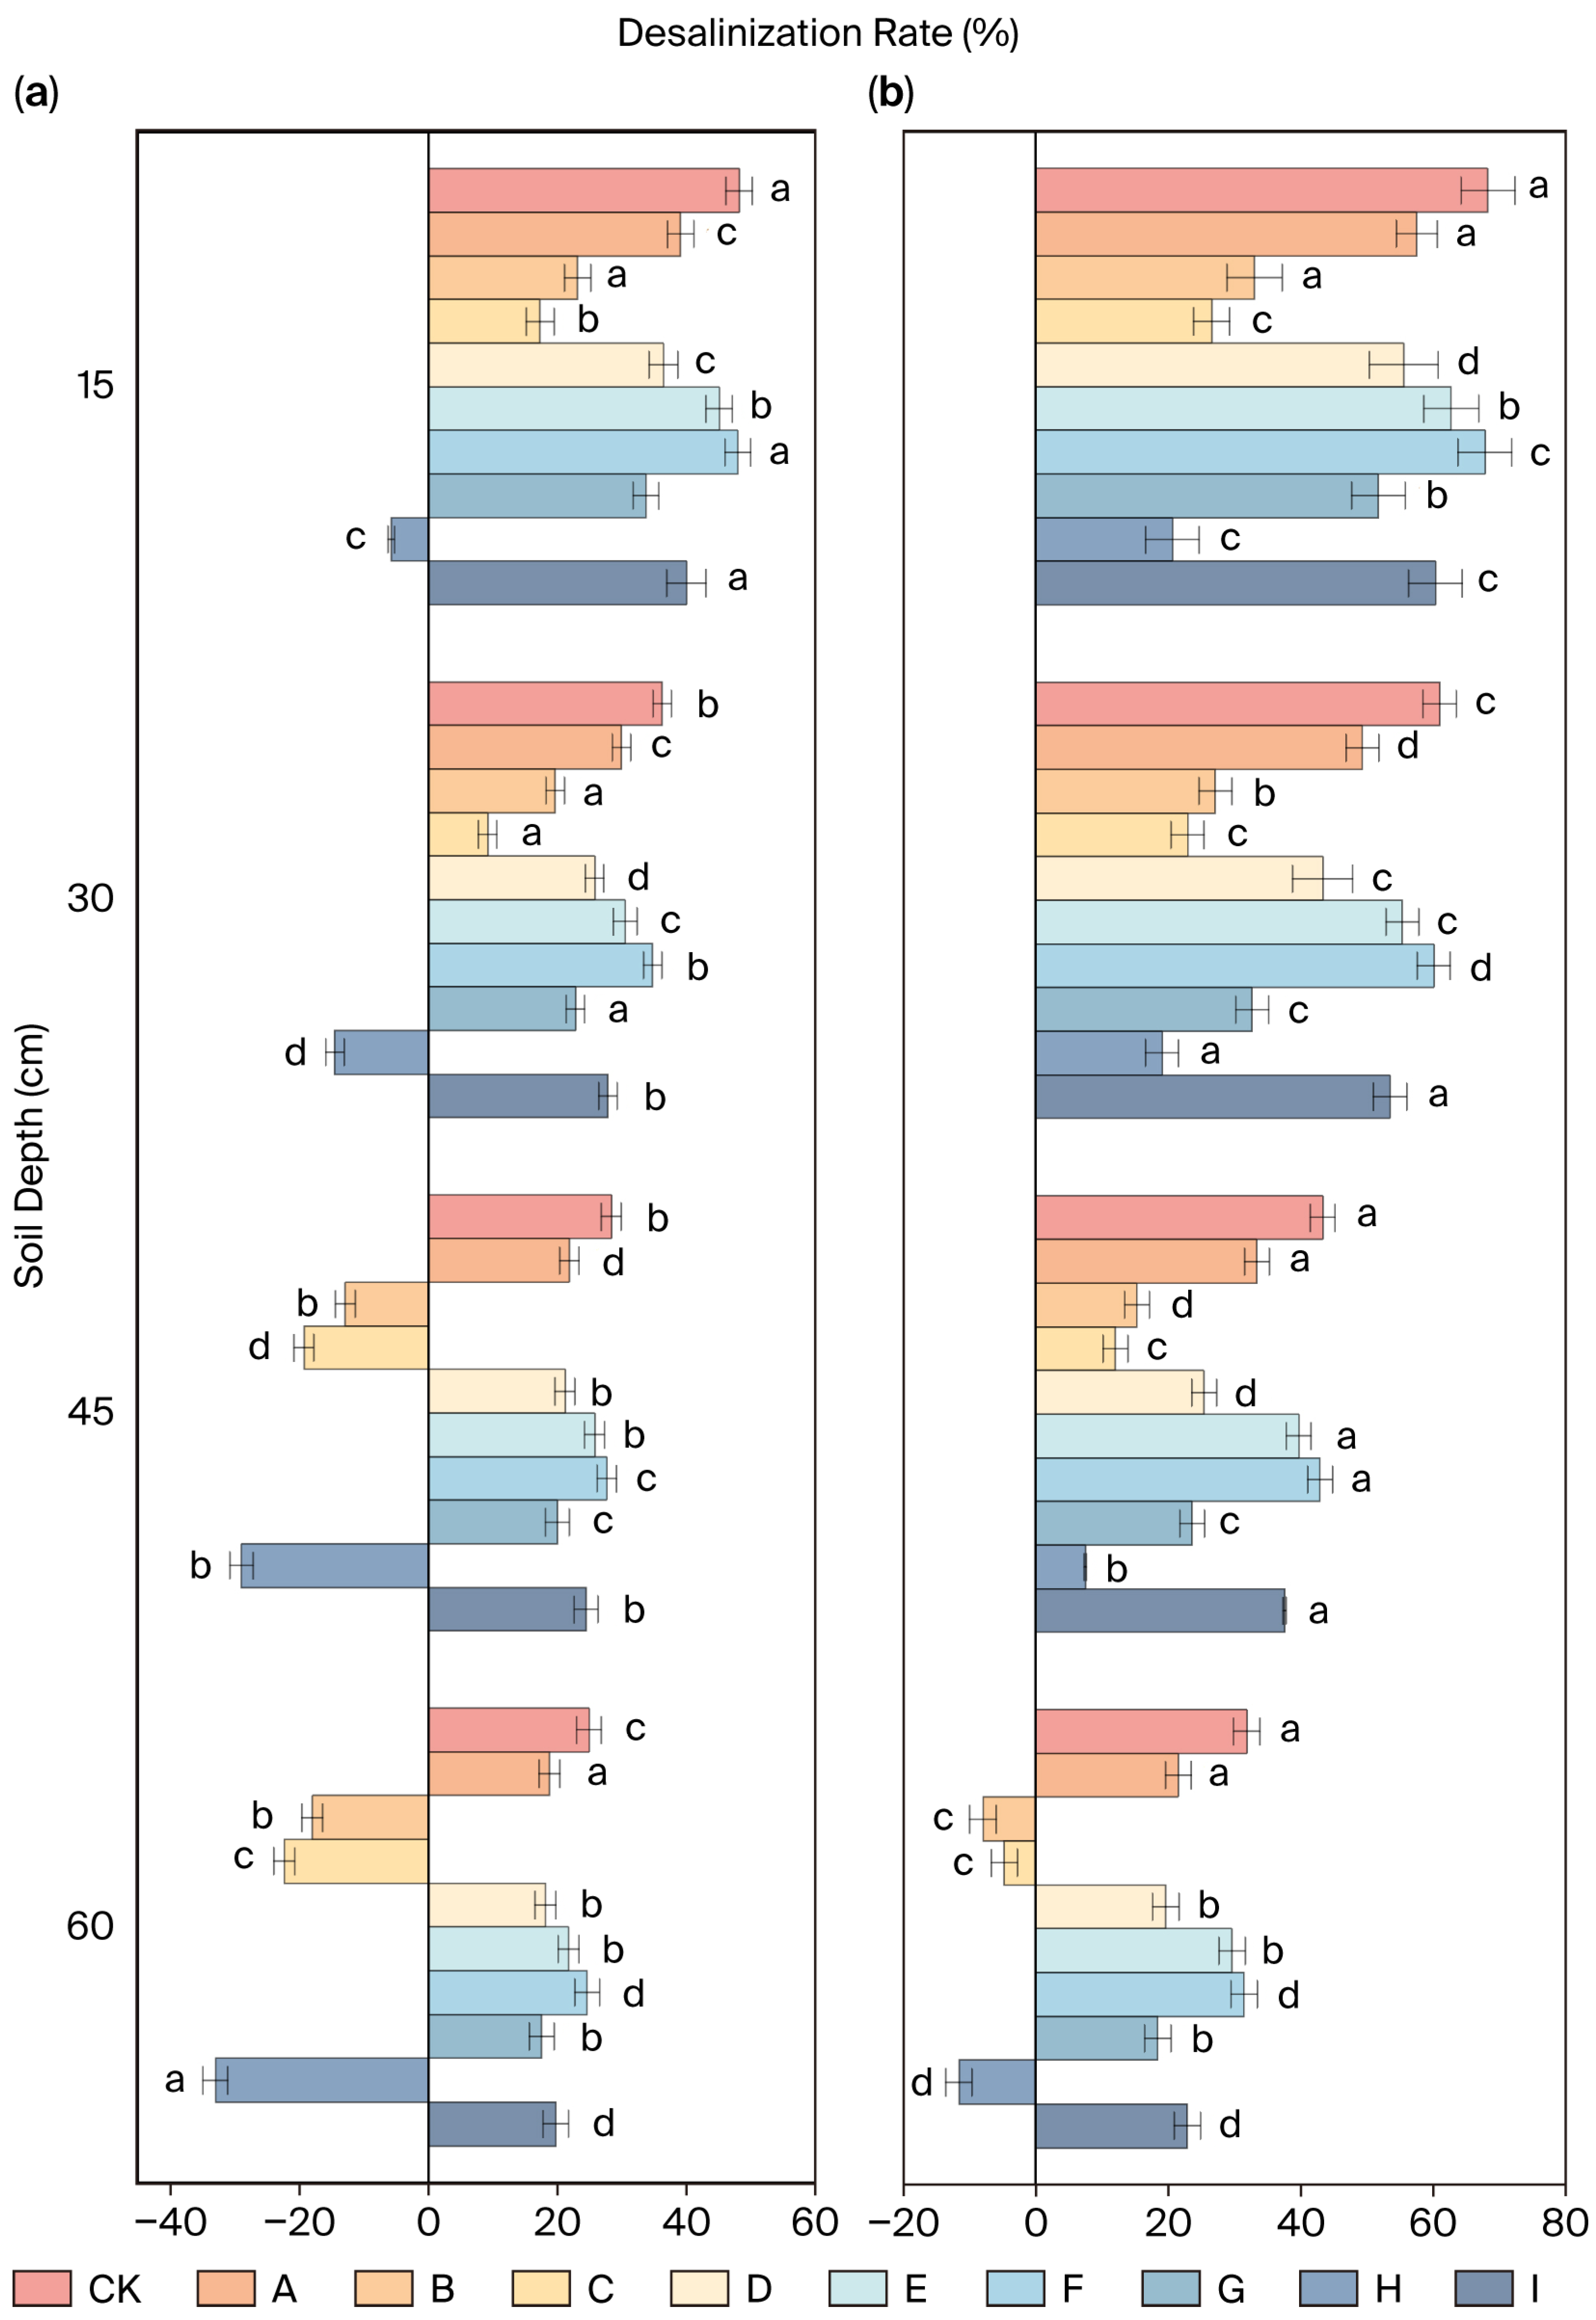
As shown in Figure 8, irrigation quota, soil sand content, and depth exhibit interactive effects on the desalination rate. At a constant sand content in Group D and at 15 cm depth, the desalination rate for high-quota spring irrigation (75.3% ± 3.2%) was significantly higher than the low-quota rate (52.6% ± 4.1%), with non-overlapping error ranges, confirming that increased irrigation volume enhances salt leaching intensity.
Figure 8.
Depth profiles of soil desalination rate at different depths. (a) Desalination rate at 225 mm irrigation quota. (b) Desalination rate at 270 mm irrigation quota. Note: In this figure, the letters (a, b, c, d, etc.) represent statistical groups. If two bars share the same letter, there is no statistically significant difference between them. Conversely, different letters indicate a significant difference.
In high-sand Group A (sand content > 60%) at 40–60 cm depth, the desalination rate (48.7% ± 4.5%) was notably lower than that in low-sand Group H (clay dominated, 55.1% ± 3.8%), with error margins exceeding 5 SE. At 15 cm depth, Group F’s desalination rate (92.4% ± 2.1%) was 9.7 times that of Group H (11% ± 3.3%), with error bar distances > 4 SE, indicating that higher sand content intensifies profile desalination by accelerating infiltration.
Using the T–Q–S formula, the optimal synergistic regulation range for water–salt–nutrient management was determined: sand content of 45–65%, T = 270 mm, and Q ≤ 2 g·L−1. This improves irrigation efficiency by 25% compared to traditional homogeneous models [10,36].
The extended mathematical model, incorporating the logarithmic term of sand content (ln(S/S0)), quantifies the three-dimensional interactions of T–Q–S, reducing prediction error by 23% compared to the traditional CDE model [18] (RMSE = 0.18 vs. 0.24). The model defines the abrupt change threshold of sand content for soil salinization under different mineralization levels as S0 = 45.2%, along with interaction coefficients α = 0.38 and β = 0.12, and serves as a versatile tool (R2 = 0.89) for tailoring irrigation strategies to heterogeneous soils in the study area. Table 5 presents the computed salt reduction rates (R values) under different spring irrigation quotas, water mineralization degrees, and sand contents.
Table 5.
Desalination rate (R) under synergistic effects of irrigation quota (T), water quality (Q), and sand content (S).
The error band width for the 40–60 cm depth is ±3.8–5.6%, expanding by 60–70% compared to the surface layer (±2.1–3.5%), indicating elevated uncertainty in deep-layer salt migration.
Under a high irrigation quota (T2), the desalination efficiency per unit of water reaches 0.28 g·L−1, increasing to 0.35 g·L−1 in sandy soil. This suggests that higher sand content, sand fraction, and irrigation quota collaboratively enhance salt leaching, thereby validating the core hypothesis of “salt migration accompanying water movement”. The nonlinear leap in leaching efficiency (η from 0.38 to 0.72 at S > 50%, Figure 4b) confirms S0 = 45.2% as the threshold textural transition point.
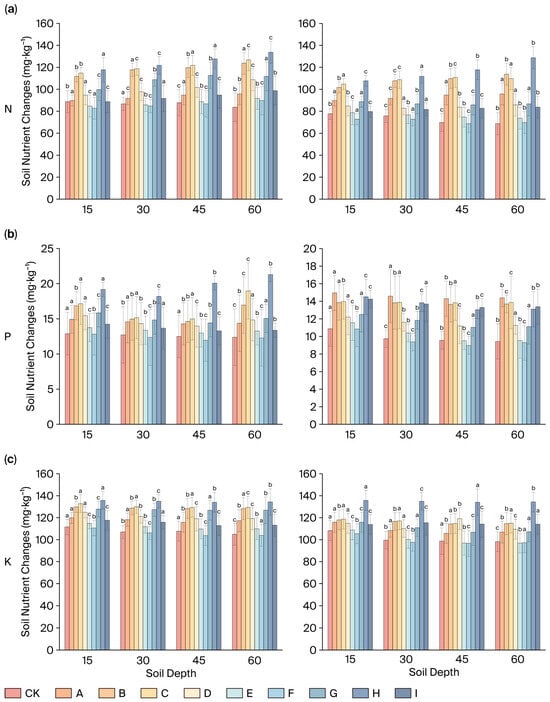
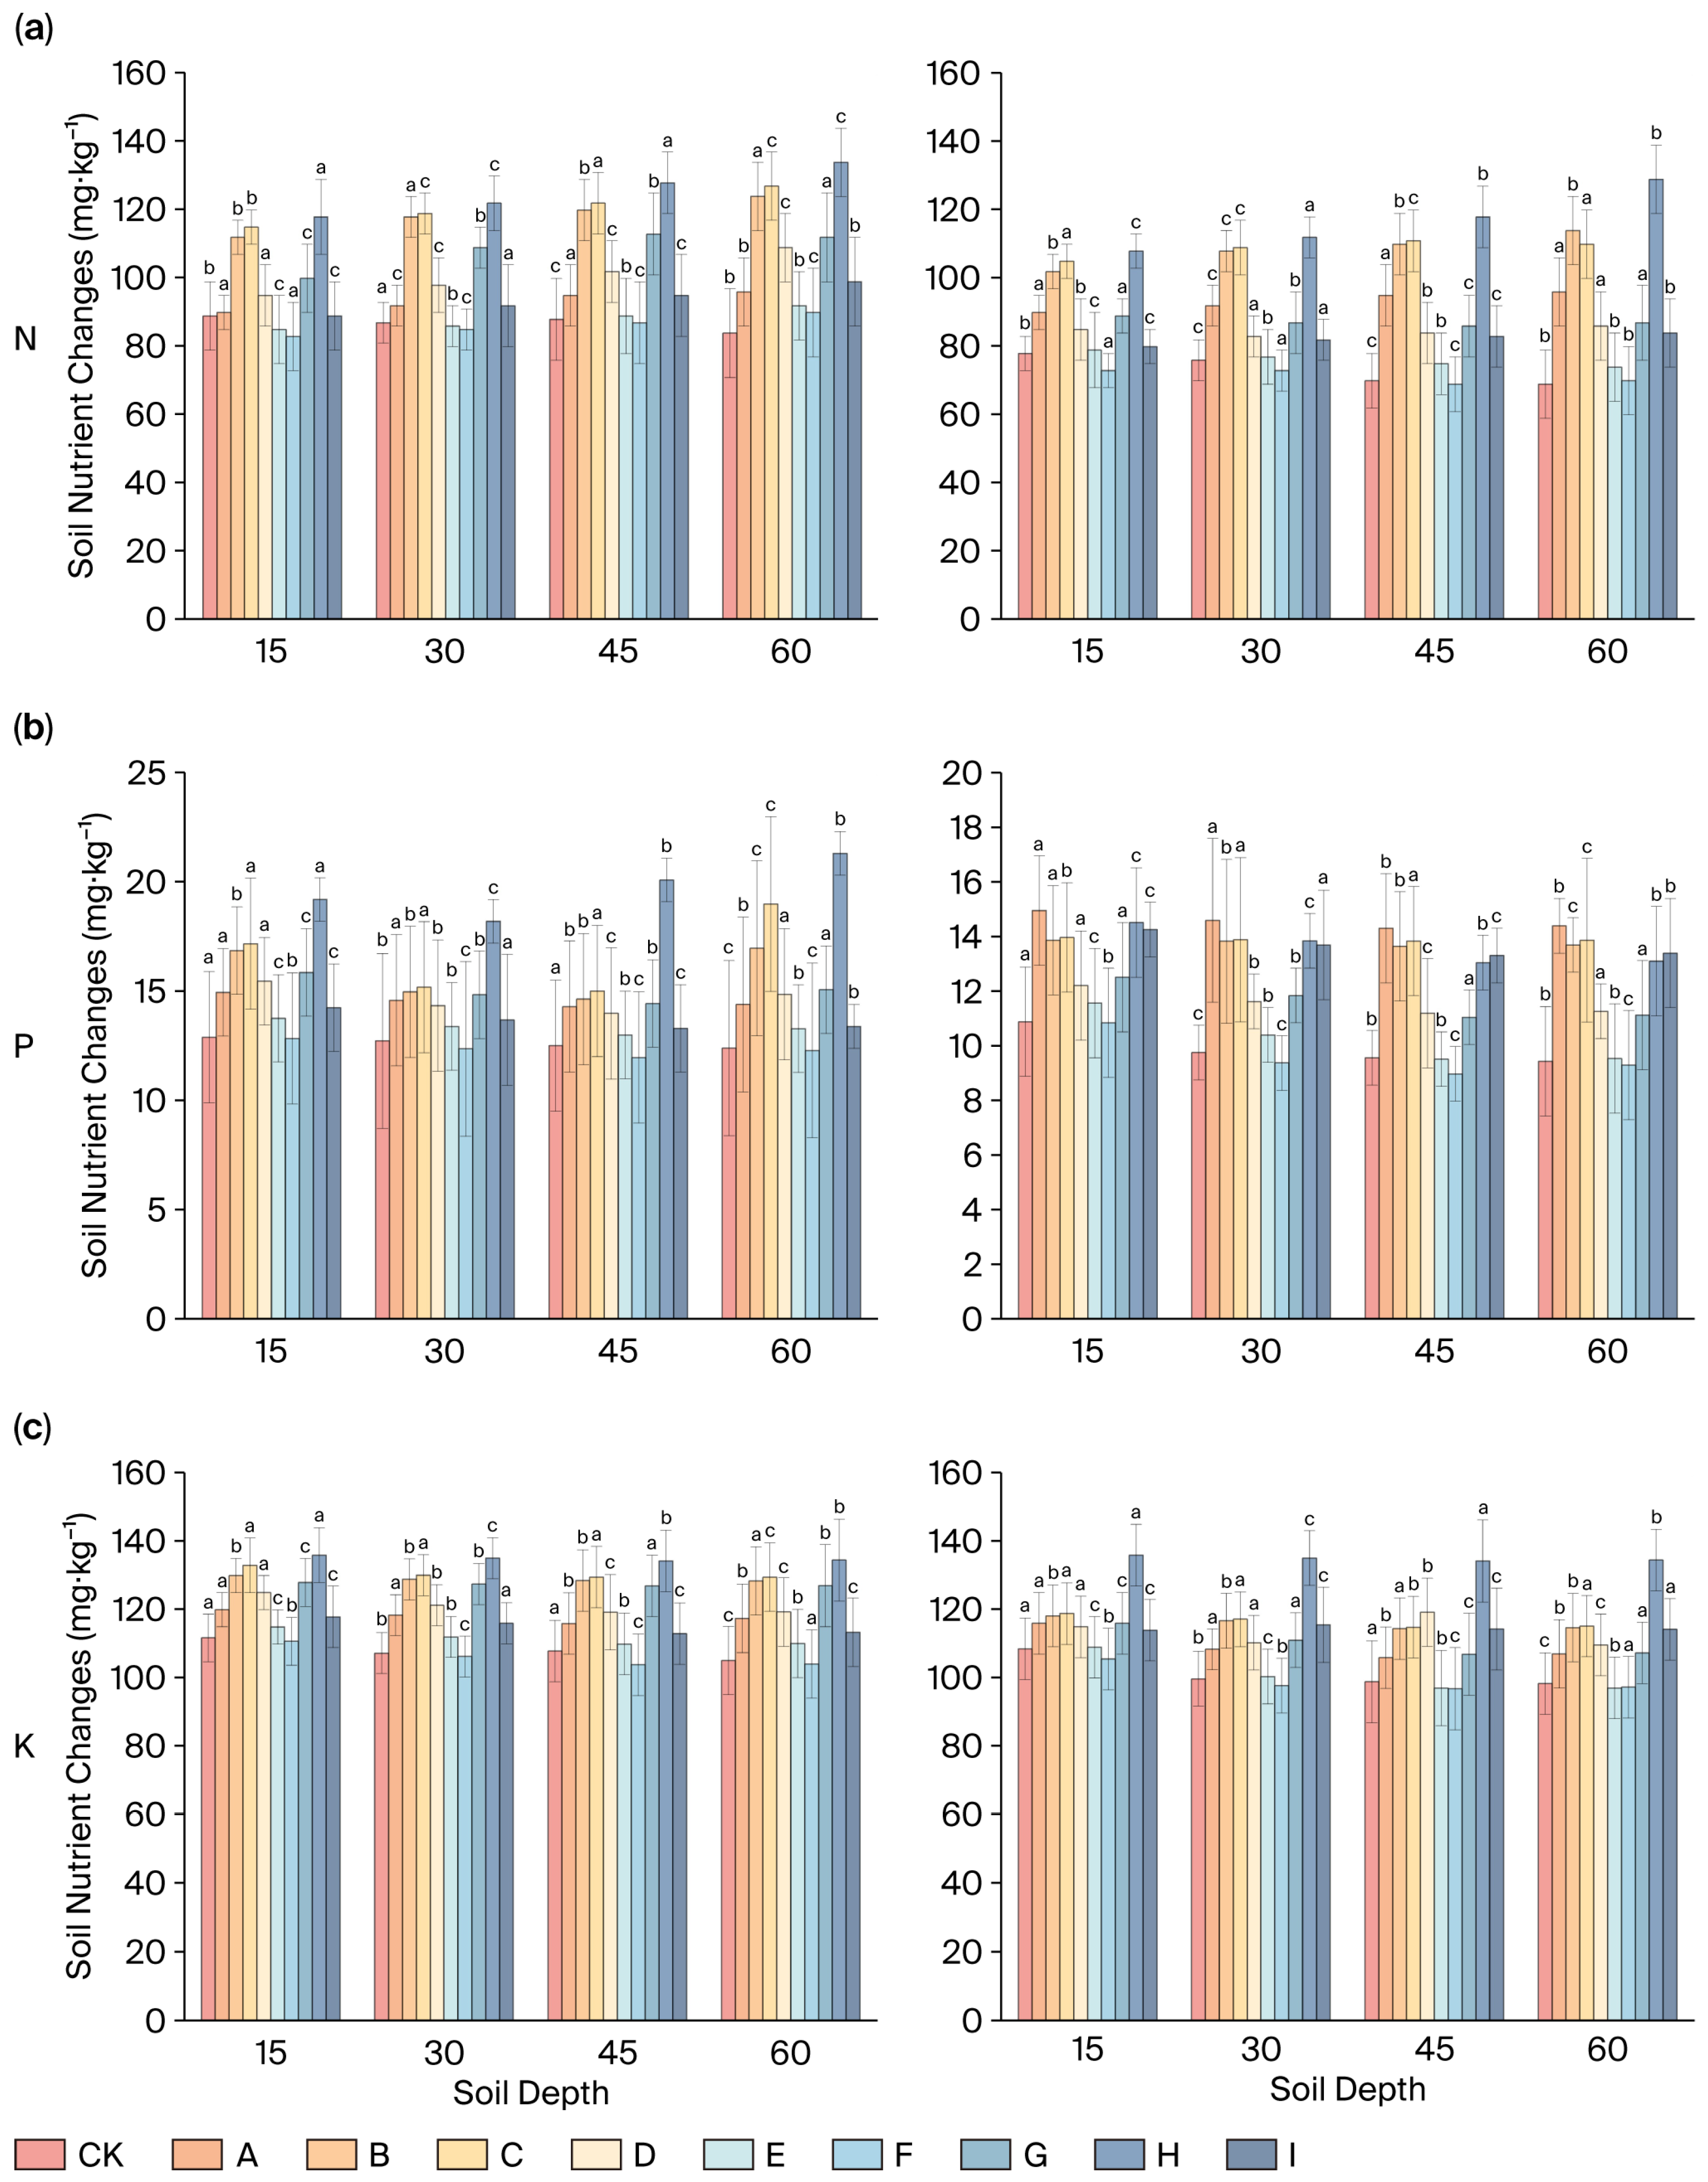
As illustrated in Figure 9, combined increases in spring irrigation quota and soil sand content result in a notable decrease in nitrogen, phosphorus, and potassium contents, along with intensified deep leaching. Specifically, at 60 cm depth in high-sand Group F, nitrogen content under T2 (114 ± 3.8 mg·kg−1) was significantly lower than under T1 (123 ± 4.5 mg·kg−1), with non-overlapping error ranges (letter annotations denote significant differences), indicating that high water volumes exacerbate deep-layer nitrogen leaching (p < 0.01). At the same depth, the phosphorus content in the high quota T2 Group F (6.9 ± 0.9 mg·kg−1) decreased by 50% compared to the low-quota content in T1 (12.4 ± 1.2 mg·kg−1), with error margins exceeding 3 SE. Potassium exhibited a concurrent decrease of 36%; specifically, 87 ± 7 mg·kg−1 (T2) vs. 123 ± 10 mg·kg−1 (T1).
Figure 9.
Depth profiles of NPK under two irrigation quotas under the unified water quality condition for the high–low irrigation quota group (A-I): (a) nitrogen (N); (b) phosphorus (P); and (c) potassium (K). Note: In this figure, the letters (a, b, c, etc.) represent statistical groups. If two bars share the same letter, there is no statistically significant difference between them. Conversely, different letters indicate a significant difference.
At a depth of 15 cm, the nitrogen content in low-sand Class B (clay loam, 130 ± 5 mg·kg−1) was significantly higher than in sandy loam Class F (75 ± 6 mg·kg−1), with the difference widening to 43 mg·kg−1 at 60 cm. Furthermore, the nutrient contents at 60 cm in high-sand Class I (N: 42 ± 3.8, P: 6.2 ± 0.9, K: 85 ± 7) were generally lower than those in low-sand Class B (N: 98 ± 6, P: 12 ± 1.1, K: 145 ± 11), reflecting reduced nutrient retention in sandy soils.
Nutrient contents decrease progressively with depth, averaging a 56% decline at 60 cm compared to 15 cm. Error ranges widen by 40–60% in the 45–60 cm deep layers (e.g., potassium error increases from ±8 mg·kg−1 at 15 cm to ±13 mg·kg−1 at 60 cm). High-sand Group I soils exhibit nutrient coefficients of variation (CVs) of 18–22%, significantly higher than the 9–12% in low-sand soils. Across all depths, high spring irrigation quotas result in lower NPK contents, with further decreases as sand content increases.
4. Discussion
4.1. Reinterpreting the Dominant Role of Soil Texture in Water–Salt Dynamics
The pronounced textural differentiation in soil moisture distribution (Figure 3 and Figure 4) underscores that soil texture is the primary governor of hydraulic pathways—a foundational principle established by Hillel’s classical theory of soil physics [9]. Our study quantifies this relationship by identifying a critical sand content threshold (S0 = 45.2%) that dictates a stark shift in hydraulic behavior. For instance, the high leaching capacity observed in sandy soils (S > 50%) aligns with findings by Wankmüller et al. [8], who reported that sandy soils could maintain salt balance even with 4 g·L−1 irrigation water. However, our T–Q–S model advances this understanding by precisely defining the operational bounds: such tolerance is effective only when high sand content is coupled with a high irrigation quota (270 mm). Conversely, the strong water retention but poor leaching in clayey soils (S < 30%) resonates with the capillary dominance model described by Green and Ampt [19]. Our key contribution lies in integrating these disparate phenomena into a unified framework, in which the threshold S0 = 45.2% represents the pivot point between leaching-dominated (S > S0) and retention-dominated (S < S0) regimes. This resolves the “heterogeneity blind spot” noted by Rengasamy et al. [5], transforming soil texture from a qualitative descriptor into a quantitative predictive parameter for irrigation management.
4.2. Synergistic Mechanisms of Irrigation Quota and Water Salinity: Beyond Independent Effects
Our results demonstrate that the interaction between irrigation quota (T) and water salinity (Q) is not merely additive but profoundly synergistic. While previous studies have documented the independent effects of high salinity reducing infiltration [6] and high quotas enhancing leaching [10], our T–Q–S model reveals how one factor can modulate the impact of the other. Specifically, the ability of a high irrigation quota (T2 = 270 mm) to overcome the salt accumulation typically induced by saline water (Q3 = 4 g·L−1)—particularly in sandy soils, where leaching depth increased by 1.8 times—can be explained by leveraging gravitational potential to overcome osmotic and matric forces. This finding challenges the conventional wisdom that water quality solely dictates salt stress, as exemplified by Hillel et al. [12], who focused on salinity’s negative impact in silt loam. Our work demonstrates that in well-structured sandy soils, sufficient hydraulic head (high T) can effectively flush salts beyond the root zone, even when the irrigation water itself is saline. This mechanistic insight provides a scientific basis for the safe, agronomic use of brackish water resources in arid regions, a strategy hinted at but not quantified in earlier work from Israel [2] and Brazil [3]. The synergy coefficient (β = 0.08) in our model quantifies this compensatory effect, offering a practical tool to optimize the T–Q combination based on available water quality.
4.3. The T–Q–S Synergy: Integrating Mechanisms for Precision Agriculture
The tripartite synergy of texture–quota–salinity (T–Q–S) uncovered in this study represents a substantial advance beyond the single- or dual-factor models that have previously dominated irrigation science. While Chen et al. [10] optimized quotas for given water quality, and Wankmüller et al. [8] explored texture-specific salinity thresholds, our integrated model captures the nonlinear interactions that emerge when all three factors are varied simultaneously. The core mechanism hinges on the sand content threshold (S0) acting as a master switch: in soils with S > S0, the system favors leaching, allowing managers to strategically use higher-salinity water (Q3) paired with high quotas (T2) to achieve efficient desalination without exacerbating surface salinization. In contrast, for soils with S < S0, the system favors retention, necessitating a conservative strategy of low-salinity water (Q1) and reduced quotas (T1) to prevent salt accumulation. This framework elegantly unifies seemingly contradictory recommendations from prior studies [8,12] by showing they are applicable to different texture domains within a broader T–Q–S phase space. Therefore, our model transitions irrigation management from a one-size-fits-all approach to a precision strategy tailored to local soil texture. By incorporating the logarithmic term ln(S/S0), the model quantitatively predicts leaching efficiency for any T–Q–S combination, effectively addressing the scalability challenge in heterogeneous landscapes that has hampered traditional models such as the convection–dispersion equation (CDE) [18].
4.4. Research Directions
Based on the findings of this study, several promising avenues for future research have emerged. First, long-term field validation of the T–Q–S model is essential to evaluate its sustainability and assess the risks of deep salt accumulation over extended periods, particularly under continuous saline water irrigation. Second, the economic and agronomic implications of the trade-off between desalination efficiency and nutrient loss in sandy soils warrant systematic investigation, with potential integration of controlled-release fertilizers into the optimization framework. Third, incorporating crop response data, such as yield and water productivity, into the T–Q–S synergy model could enhance its functionality, transforming it from a soil–water–salinity management tool into a comprehensive decision-support system for sustainable arid agriculture.
5. Conclusions
This study provides a significant advancement in understanding and managing soil water–salt dynamics in heterogeneous arid agricultural systems. Through controlled laboratory irrigation experiments simulating diverse soil textures, irrigation water qualities, and spring irrigation quotas, we elucidated the synergistic effect of the Texture–Quota–Salinity (T–Q–S) system and established practical thresholds for irrigation management. Critically, the T–Q–S framework demonstrates that deep salt accumulation is reversible in sandy and threshold texture soils under optimized irrigation, transforming a ‘threat’ into a manageable process. The key conclusions are as follows:
- Dominant factors and hierarchical control: Soil water–salt transport under spring irrigation follows a hierarchical control mechanism: irrigation water salinity (Q) primarily dictates the direction and intensity of salt migration; soil texture (S, specifically sand content) governs the transport efficiency and pathway (leaching vs. retention); and spring irrigation quota (T) critically regulates the leaching depth and effectiveness. Water quality variations (Q1–Q3) significantly impact salt accumulation patterns, while their effect on soil moisture retention under equivalent quotas is negligible. Soil texture is the principal determinant of moisture retention capacity and salt leaching efficiency.
- Threshold Sand Content: A pivotal finding is the identification of a sand content threshold (S0 = 45.2%) governing the T–Q–S synergistic effect. This threshold marks a fundamental shift in soil hydraulic behavior and salt management strategy. For sand content > 50% (Sandy Soils), leaching dominates soil water movement. High irrigation quotas (e.g., 270 mm) are essential for effective salt leaching. Notably, soils in this category exhibit significantly higher tolerance to saline water irrigation (Q3, 4 g·L−1) compared to finer-textured soils. For soils with sand content ≈ 45.2% (threshold textures), an optimal balance exists between leaching and water retention. This texture facilitates the most efficient water–salt–nutrient synergistic regulation under appropriate irrigation management. For soils with sand content < 30% (clayey soils), water retention dominates, hindering salt leaching. Low irrigation quotas are necessary to manage moisture and mitigate waterlogging risks. These soils are highly sensitive to saline water irrigation.
- Optimized irrigation strategies based on texture: Based on the T–Q–S synergy, specific irrigation strategies are recommended for different soil textures. For sandy soils (sand content > 55%, e.g., Central Asia), employ high-quota saline water irrigation (T ≈ 280 mm, Q ≤ 4 g·L−1). This strategy leverages the high permeability to achieve significant salt leaching (>60.8% desalination rate in topsoil under T2Q3). Complementary slow-release fertilizer application is crucial to mitigate concurrent NPK leaching losses (up to 28.3%). For threshold texture soils (sand content ≈ 45%), utilize moderate-quota brackish water irrigation (T ≈ 260 mm, Q ≤ 2 g·L−1). This approach balances efficient desalination (>80%) with minimized nutrient loss, achieving the optimal water–salt–nutrient synergy. For clayey loam soils (sand content < 30%, e.g., parts of Xinjiang), implement low-quota fresh/low-salinity irrigation (T ≤ 230 mm, Q ≤ 2 g·L−1). Strict limitation of water salinity is imperative to prevent severe surface salt accumulation. This quota aligns with crop water demand models while managing salinity risk. Importantly, the risk of deep salt accumulation is reversible under T–Q–S-optimized strategies, particularly in sandy soils where high-quota irrigation enhances leaching efficiency. Long-term sustainability requires region-specific water–salt balance monitoring to quantify reversibility.
- Trade-off in sandy soils: While high-quota irrigation in sandy soils effectively leaches salts (desalination rate increase ~29% under T2 vs. T1), it inevitably intensifies nutrient loss (NPK leaching loss ~28.3%). Management strategies in these regions must explicitly address this dual challenge of “efficient desalination” versus “nutrient conservation,” underscoring the importance of integrated practices like controlled-release fertilizers.
- Model Significance: The developed T–Q–S synergistic model, incorporating the identified sand content threshold (S0 = 45.2%), provides a quantitative framework for predicting water–salt dynamics and optimizing irrigation strategies tailored to the specific texture of heterogeneous soils in arid regions, effectively addressing the “soil heterogeneity blind spot” in traditional irrigation management.
Author Contributions
Conceptualization, N.W.; methodology, Y.G.; software, N.W.; formal analysis, N.W.; data curation, N.W. and J.L.; writing—original draft preparation, N.W.; writing—review and editing, F.J.; funding acquisition, S.L. All authors have read and agreed to the published version of the manuscript.
Funding
This research was funded by the Tianshan Talent Training Program (grant number 2023TSYCCX0091).
Institutional Review Board Statement
Not applicable.
Informed Consent Statement
Not applicable.
Data Availability Statement
The original contributions presented in this study are included in the article. Further inquiries can be directed to the corresponding author.
Conflicts of Interest
The authors declare no conflicts of interest.
References
- Ayers, R.S.; Westcot, D.W. Water Quality for Agriculture; FAO Irrigation and Drainage Paper 29; Food and Agriculture Organization of the United Nations: Rome, Italy, 1985; pp. 1–174. [Google Scholar]
- Tal, A. Rethinking the Sustainability of Israel’s Irrigation Practices in the Drylands. Water Res. 2016, 90, 387–394. [Google Scholar] [CrossRef] [Scilit]
- Ferreira, L.B.; da Cunha, F.F.; Fernandes Filho, E.I. Exploring Machine Learning and Multi-Task Learning to Estimate Meteorological Data and Reference Evapotranspiration across Brazil. Agric. Water Manag. 2022, 259, 107281. [Google Scholar] [CrossRef] [Scilit]
- Qaiser, G.; Tariq, S.; Adnan, S.; Latif, M. Evaluation of a Composite Drought Index to Identify Seasonal Drought and Its Associated Atmospheric Dynamics in Northern Punjab, Pakistan. J. Arid Environ. 2021, 185, 104332. [Google Scholar] [CrossRef] [Scilit]
- Mallawaarachchi, T.; Auricht, C.; Loch, A.; Adamson, D.; Quiggin, J. Water Allocation in Australia’s Murray–Darling Basin: Managing Change under Heightened Uncertainty. Econ. Anal. Policy 2020, 66, 345–369. [Google Scholar] [CrossRef] [Scilit]
- Song, R.Y.; Liu, T.B.; Liu, Y.F.; Li, W.H.; Fu, X.F.; Li, G.Q. Influence of spring irrigation quota on water salt distribution in salinized farmlands of Xinjiang. Water Sav. Irrig. 2024, 4, 19–26. [Google Scholar] [CrossRef]
- Tuo, Y.; Wang, Z.; Zheng, Y.; Shi, X.; Liu, X.; Ding, M.; Yang, Q. Effect of Water and Fertilizer Regulation on the Soil Microbial Biomass Carbon and Nitrogen, Enzyme Activity, and Saponin Content of Panax notoginseng. Agric. Water Manag. 2023, 278, 108145. [Google Scholar] [CrossRef] [Scilit]
- Wankmüller, F.J.P.; Delval, L.; Lehmann, P.; Baur, M.J.; Cecere, A.; Wolf, S.; Or, D.; Javaux, M.; Carminati, A. Global Influence of Soil Texture on Ecosystem Water Limitation. Nature 2024, 635, 631–638. [Google Scholar] [CrossRef] [Scilit] [PubMed]
- Hillel, D. Fundamentals of Soil Physics; Academic Press: New York, NY, USA, 1980; pp. 45–68. [Google Scholar]
- Chen, S.; Song, C.; Mao, X.; Shang, S. Modeling Response of Spring Wheat Yield to Soil Water and Salt Contents and Its Application in Scheduling Brackish Water Irrigation. Comput. Electron. Agr. 2022, 200, 107216. [Google Scholar] [CrossRef] [Scilit]
- Xu, P.; Liu, H.; Ning, H.; Zhang, X.; Gao, F.; Zhou, W.; Xie, Y.; Wang, J. Optimizing Alternate Brackish and Freshwater Drip Irrigation with Film Mulching for Cotton Production in Southern Xinjiang. J. Irrig. Drain. 2024, 43, 11–20. [Google Scholar] [CrossRef]
- Lu, D.; Liu, L.; Bai, Y.; An, Q.; Cheng, Y.; Huang, G. Deficit Irrigation Alleviates the Increase in Soil Salinity Content in Saline-Alkali Regions of China and Improves Irrigation Water Productivity: A Meta-Analysis. Agric. Water Manag. 2025, 320, 109872. [Google Scholar] [CrossRef] [Scilit]
- Wang, X.; Liu, G.; Yang, J.; Huang, G.; Yao, R. Evaluating the Effects of Irrigation Water Salinity on Water Movement, Crop Yield and Water Use Efficiency by Means of a Coupled Hydrologic/Crop Growth Model. Agric. Water Manag. 2017, 185, 13–26. [Google Scholar] [CrossRef] [Scilit]
- Liu, F.; Chen, P.; Yu, H.; Ma, J. Spatial distribution characteristics of soil water and salt under different land use types in Minqin Oasis. Arid Land Geogr. 2020, 43, 406–414. [Google Scholar]
- Bi, W.; Lin, D.; Mao, X. Two-Dimensional Transport of Soil Water, Heat and Salt with Mulched Drip Irrigation under Brackish Water in Cotton Fields and Appropriate Irrigation Schedule in Southern Xinjiang of China. Trans. Chin. Soc. Agric. Eng. 2024, 40, 155–168. [Google Scholar] [CrossRef]
- Kankarla, V.; Shukla, M.K.; Picchioni, G.A.; VanLeeuwen, D.; Schutte, B.J. Germination and Emergence Responses of Alfalfa, Triticale and Quinoa Irrigated with Brackish Groundwater and Desalination Concentrate. Agronomy 2020, 10, 549. [Google Scholar] [CrossRef] [Scilit]
- Cai, X.; Peng, Y.; Yu, B. Soil Aggregates Organic Carbon Change and Its Influence in Tibetan Alpine Steppe. Trans. Chin. Soc. Agric. Eng. 2013, 29, 92–99. [Google Scholar] [CrossRef]
- Li, Y.; Li, L.; Wang, F.; Wang, X. Progress in research on the salt leaching of winter and spring irrigation in saline-alkali areas of north China. China Rural. Water Hydropower 2022, 11, 71–76. [Google Scholar] [CrossRef]
- Green, W.H.; Ampt, G.A. Studies on Soil Physics: Part I. The Flow of Air and Water Through Soils. J. Agric. Sci. 1911, 4, 1–24. [Google Scholar]
- Hu, Q.; Cao, H.; He, Z.; Shi, H.; Ren, Z.; Qi, C. Effects of Leaching Amounts and Drip Irrigation Types on Water-Salt Distribution and Seed Cotton Yield in Northern Xinjiang, China. Field Crops Res. 2025, 328, 109947. [Google Scholar] [CrossRef] [Scilit]
- Peng, Z.; Duwig, C.; Delmas, P.; Gaudet, J.P.; Strozzi, A.G.; Charrier, P.; Denis, H. Visualization and Characterization of Heterogeneous Water Flow in Double-Porosity Media by Means of X-ray Computed Tomography. Transp. Porous Media 2015, 110, 543–564. [Google Scholar] [CrossRef] [Scilit]
- Ding, Q.; Zhou, Y.; Zhou, J.; Sun, Y.; Han, S.; Jiang, F.; Liu, J. Hydrogeochemical mechanism and irrigation suitability of groundwater in the plain area of Turpan Basin. China Environ. Sci. 2024, 44, 5818–5829. [Google Scholar] [CrossRef]
- Hossain, M.B.; Roy, D.; Paul, P.L.C.; Yesmin, M.S.; Kundu, P.K.; Pranto, M.R.B.H.; Aklimuzzaman, M.; Paul, M.; Maniruzzaman, M.; Mainuddin, M. Strategies of water resource utilization and agricultural water management in the coastal saline zone of Bangladesh. Irrig. Drain. 2025, 74, 820–833. [Google Scholar] [CrossRef] [Scilit]
- Li, X.; Zhang, J.; Cai, X.; Huo, Z.; Zhang, C. Simulation-Optimization Based Real-Time Irrigation Scheduling: A Human-Machine Interactive Method Enhanced by Data Assimilation. Agric. Water Manag. 2023, 276, 108059. [Google Scholar] [CrossRef] [Scilit]
- Nicolas, F.; Kamai, T.; Ben-Gal, A.; Ochoa-Brito, J.; Daccache, A.; Ogunmokun, F.; Kisekka, I. Assessing salinity impacts on crop yield and economic returns in the Central Valley. Agric. Water Manag. 2023, 287, 108463. [Google Scholar] [CrossRef] [Scilit]
- Wang, Y.; Gao, M.; Chen, H.; Fu, X.; Wang, L.; Wang, R. Soil moisture and salinity dynamics of drip irrigation in saline-alkali soil of Yellow River basin. Front. Environ. Sci. 2023, 11, 1130455. [Google Scholar] [CrossRef] [Scilit]
- Shao, F.; Zeng, S.; Wang, Q.; Tao, W.; Wu, J.; Su, L.; Yan, H.; Zhang, Y.; Lin, S. Synergistic effects of biochar and carboxymethyl cellulose sodium (CMC) applications on improving water retention and aggregate stability in desert soils. J. Environ. Manag. 2023, 331, 117305. [Google Scholar] [CrossRef] [Scilit]
- Yang, G.; Li, W.J.; Ren, F.T.; He, X.L.; Wang, C.X.; Qiao, C.L.; Li, X.L.; Lei, J.; Li, F.D. Soil salinity accumulation and model simulation of cotton under mulch drip irrigation with different salinity Level water. Trans. Chin. Soc. Agric. Eng. 2021, 37, 73–83. [Google Scholar] [CrossRef]
- Meng, C.; Yan, L.; Zhang, S.; Wei, C. Variation of Soil Salinity in Plow Layer of Farmlands under Long-term Mulched Drip Irrigation in Arid Region. Acta Pedol. Sin. 2017, 54, 1386–1394. [Google Scholar] [CrossRef]
- Li, Y.; Yu, Q.; Ning, H.; Gao, Y.; Sun, J. Simulation of Soil Water, Heat, and Salt Adsorptive Transport under Film Mulched Drip Irrigation in an Arid Saline-Alkali Area Using HYDRUS-2D. Agric. Water Manag. 2023, 290, 108585. [Google Scholar] [CrossRef] [Scilit]
- Wang, Z.; Wang, F.; Lyu, D.; Liu, J.; Zhu, Y.; Wen, Y. Effects of Brackish Water Irrigation on the Physiological Characteristics, Yield and Quality of Mulched Drip Irrigation Cotton under Different Soil Textures. Trans. Chin. Soc. Agric. Eng. 2023, 39, 69–78. [Google Scholar] [CrossRef]
- Wang, H.; Zheng, C.; Ning, S.; Cao, C.; Li, K.; Dang, H.; Wu, Y.; Zhang, J. Impacts of Long-Term Saline Water Irrigation on Soil Properties and Crop Yields under Maize-Wheat Crop Rotation. Agric. Water Manag. 2023, 286, 108383. [Google Scholar] [CrossRef]
- Brennan, L.E.; Lisson, S.N.; Poulton, P.L.; Carberry, P.S.; Bristow, K.L.; Khan, S. A farm-scale, bio-economic model for assessing investments in recycled water for irrigation. Aust. J. Agric. Res. 2008, 59, 1035–1048. [Google Scholar] [CrossRef] [Scilit]
- Luedeling, E.; Nagieb, M.; Wichern, F.; Brandt, M.; Deurer, M.; Buerkert, A. Drainage, salt leaching and physico-chemical properties of irrigated man-made terrace soils in a mountain oasis of northern Oman. Agric. Water Manag. 2005, 125, 273–285. [Google Scholar] [CrossRef] [Scilit]
- GB/T 50123-2019; Standard for Geotechnical Testing Method. China Planning Press: Beijing, China, 2019.
- Friedman, S.P. Soil Properties Influencing Apparent Electrical Conductivity: A Review. Comput. Electron. Agr. 2005, 46, 45–70. [Google Scholar] [CrossRef] [Scilit]

Disclaimer/Publisher’s Note: The statements, opinions and data contained in all publications are solely those of the individual author(s) and contributor(s) and not of MDPI and/or the editor(s). MDPI and/or the editor(s) disclaim responsibility for any injury to people or property resulting from any ideas, methods, instructions or products referred to in the content. |
© 2025 by the authors. Licensee MDPI, Basel, Switzerland. This article is an open access article distributed under the terms and conditions of the Creative Commons Attribution (CC BY) license (https://creativecommons.org/licenses/by/4.0/).