


Abstract
The Shunbei 42X well group belongs to fractured-vuggy carbonate condensate gas reservoirs. This type of reservoir exhibits extreme heterogeneity, differing significantly from conventional reservoirs and posing considerable challenges for exploitation. Research on fractured-vuggy carbonate condensate gas reservoirs can begin with modeling and numerical simulation. By using historical data fitting to refine parameters such as pressure, production, and reserves, we can deepen our understanding of the reservoir and the movement patterns of water and oil. Combined with a geological and reservoir engineering analysis of residual oil distribution, this approach enables the evaluation of steady-state production technology feasibility. This study employs numerical simulation to conduct single-well injection production modeling for well SHB42X. First, a numerical model was created in simulation software, defining parameters such as grid spatial location and reservoir temperature. Second, the numerical model was established, and historical production dynamics were fitted using the software’s PVT module. Finally, after successful fitting, subsequent production parameters were set. By summarizing previous studies on gas injection huff-and-puff mechanisms and analyzing changes in parameters like recovery rates after actual injection, the simulation results for natural gas, nitrogen, water, and depleted reservoir development were compared. Further comparisons are made on the throughput effects of nitrogen under varying injection rates, production rates, injection volumes, and well-killing durations. Optimal parameters are selected to provide reference for enhancing subsequent development efficiency.
1. Introduction
Fractured-vuggy carbonate condensate gas reservoirs exhibit more complex media types and flow characteristics than conventional sandstone or clastic reservoirs [1,2,3,4,5]. The main development challenge is retrograde condensation. This causes phase changes throughout the production life [6,7,8,9]. Selecting the appropriate development approach is crucial for the efficient exploitation of condensate reservoirs. Current research indicates that conventional development methods predominantly involve depletion-based extraction or pressure maintenance techniques using gas injection. Depletion development represents a relatively straightforward approach, offering advantages such as low cost, minimal technical requirements, and ease of management [10,11]. However, this method risks trapping condensate oil within pores, hindering reservoir development. For reservoirs with high condensate oil content, maintaining formation pressure above the dew point pressure is essential. This necessitates replenishing reservoir energy through pressure maintenance methods, which are categorized into nitrogen injection, water injection, and dry gas injection. While water injected rounds can alleviate insufficient reservoir pressure, their long-term implementation raises concerns regarding crude recovery efficiency and water consumption [12,13,14,15]. Currently, gas injection huff-and-puff effectively addresses the limitations of water injection huff-and-puff. During cyclic production, high-pressure gas can efficiently increase formation energy [16,17,18]. Among these, nitrogen expansion and gravitational separation effects are more pronounced, enabling the efficient replenishment of formation energy while facilitating multiphase flow and reducing interfacial tension, thereby enhancing condensate migration. Nitrogen is readily available, and current nitrogen injection equipment and costs remain relatively low. For developing condensate reservoirs with limited dry gas sources, nitrogen injection proves more convenient and economically advantageous [19]. Carbon dioxide exhibits superior crude oil solubilization and viscosity reduction properties, but its application costs significantly exceed those of nitrogen when no local gas source is available [20]. Natural gas possesses strong solubility and holds potential for cyclic injection thrust development, though safety concerns remain [21,22,23]. Consequently, different gas media exhibit distinct operational characteristics and outcomes [24,25].
For fractured-vuggy carbonate condensate gas reservoirs, Warren J.E. et al. [26] established a theoretical model for studying the flow characteristics of porous media based on seepage theory in 1963, using case studies of natural fracture reservoirs. This marked the first mechanistic model-based investigation of flow characteristics in fracture reservoirs. In 1991, Olarewaju J.S. et al. [27] proposed a mathematical model for reservoirs characterized by radially discontinuous dissolution cavities or natural fractures. Their research indicated that such reservoirs frequently occur in wells subjected to contamination, acidizing, gravel packing, or steam flooding operations. In 2000, O. Gurpinar et al. [28] addressed the coexistence of matrices, karst cavities, and fractures as three distinct porosity media in fissure cavity carbonate reservoirs. They proposed a formula incorporating capillary pressure, the compressibility coefficient, and relative permeability to simulate these three media. In recent years, in 2011, Li Yang et al. [29] summarized the development patterns of Ordovician carbonate fracture-vuggy reservoirs in Tarim through field geological surveys and comparisons with subsurface reservoirs revealed by dynamic and static oilfield data. An analysis of paleogeomorphology and paleokarst belts further revealed the distribution patterns of fracture-vuggy systems in this area. In 2015, Zhao Jian et al. [30] employed estimation methods to calculate bottomhole pressures in fissure cavern carbonate reservoirs. Integrating pressure gradient relationships within blocks with the timing and depth of water encounters in production wells, they conducted a comprehensive analysis of oil–water interface distribution within fissure cavern units. In 2020, Kang Zhijiang et al. [31], after years of research and practice, developed a series of enhanced recovery technologies including geophysical description, geological modeling, water/gas injection, and acid stimulation. In 2021, Lü Xinrui et al. [32] conducted a series of studies on the reservoir structure of fissure karstic carbonate reservoirs. They characterized surface karst distribution using seismic amplitude spectrum gradient attributes combined with sequential indicator simulation, based on wave impedance inversion coupled with gradient structural tensors to depict fault-controlled karst features. Furthermore, they constructed an underground river system model using frequency-separated energy attributes combined with a target-based approach. In 2024, She Zhicheng et al. [33] analyzed and summarized the actual gas injection effects in the Halahatang Oilfield, establishing a set of well selection criteria and supporting gas injection technologies tailored for enhanced oil recovery through gas injection in the carbonate reservoirs of the Halahatang Oilfield. Through the collective research of numerous scholars, a comprehensive suite of nitrogen injection development technologies for fissure cavernous carbonate reservoirs has gradually emerged. This has supported production ramp-up and stable output in the Tarim and Shunbei Oilfields, establishing large-scale oilfields with annual production capacities exceeding 700 × 104 tons. However, for fractured-vuggy carbonate condensate gas reservoirs characterized by ultra-high-temperature and pressure conditions, where reservoir types, fluid distribution, and phase transitions differ significantly from sandstone condensate reservoirs, the corresponding development technologies remain underdeveloped and incomplete. Most are still in the experimental and mechanistic research phase. Based on the above circumstances and background, this research hypothesizes that nitrogen huff-and-puff simulation yields superior results for fractured-vuggy carbonate condensate gas reservoirs compared to other media. To validate this hypothesis, numerical simulation methods were employed to conduct injection production simulations and compare the simulation outcomes across different media. This study also identifies key parameters influencing nitrogen injection and provides recommendations for subsequent development.
2. Geological Overview
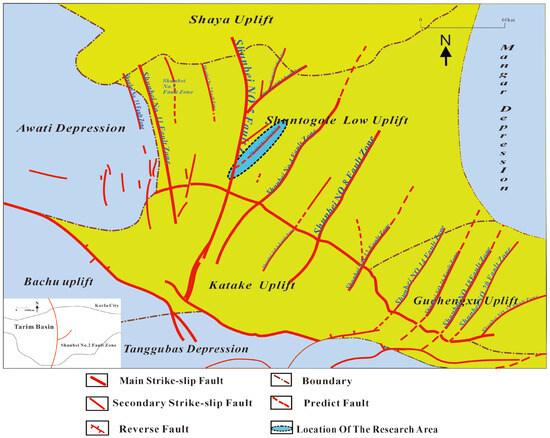
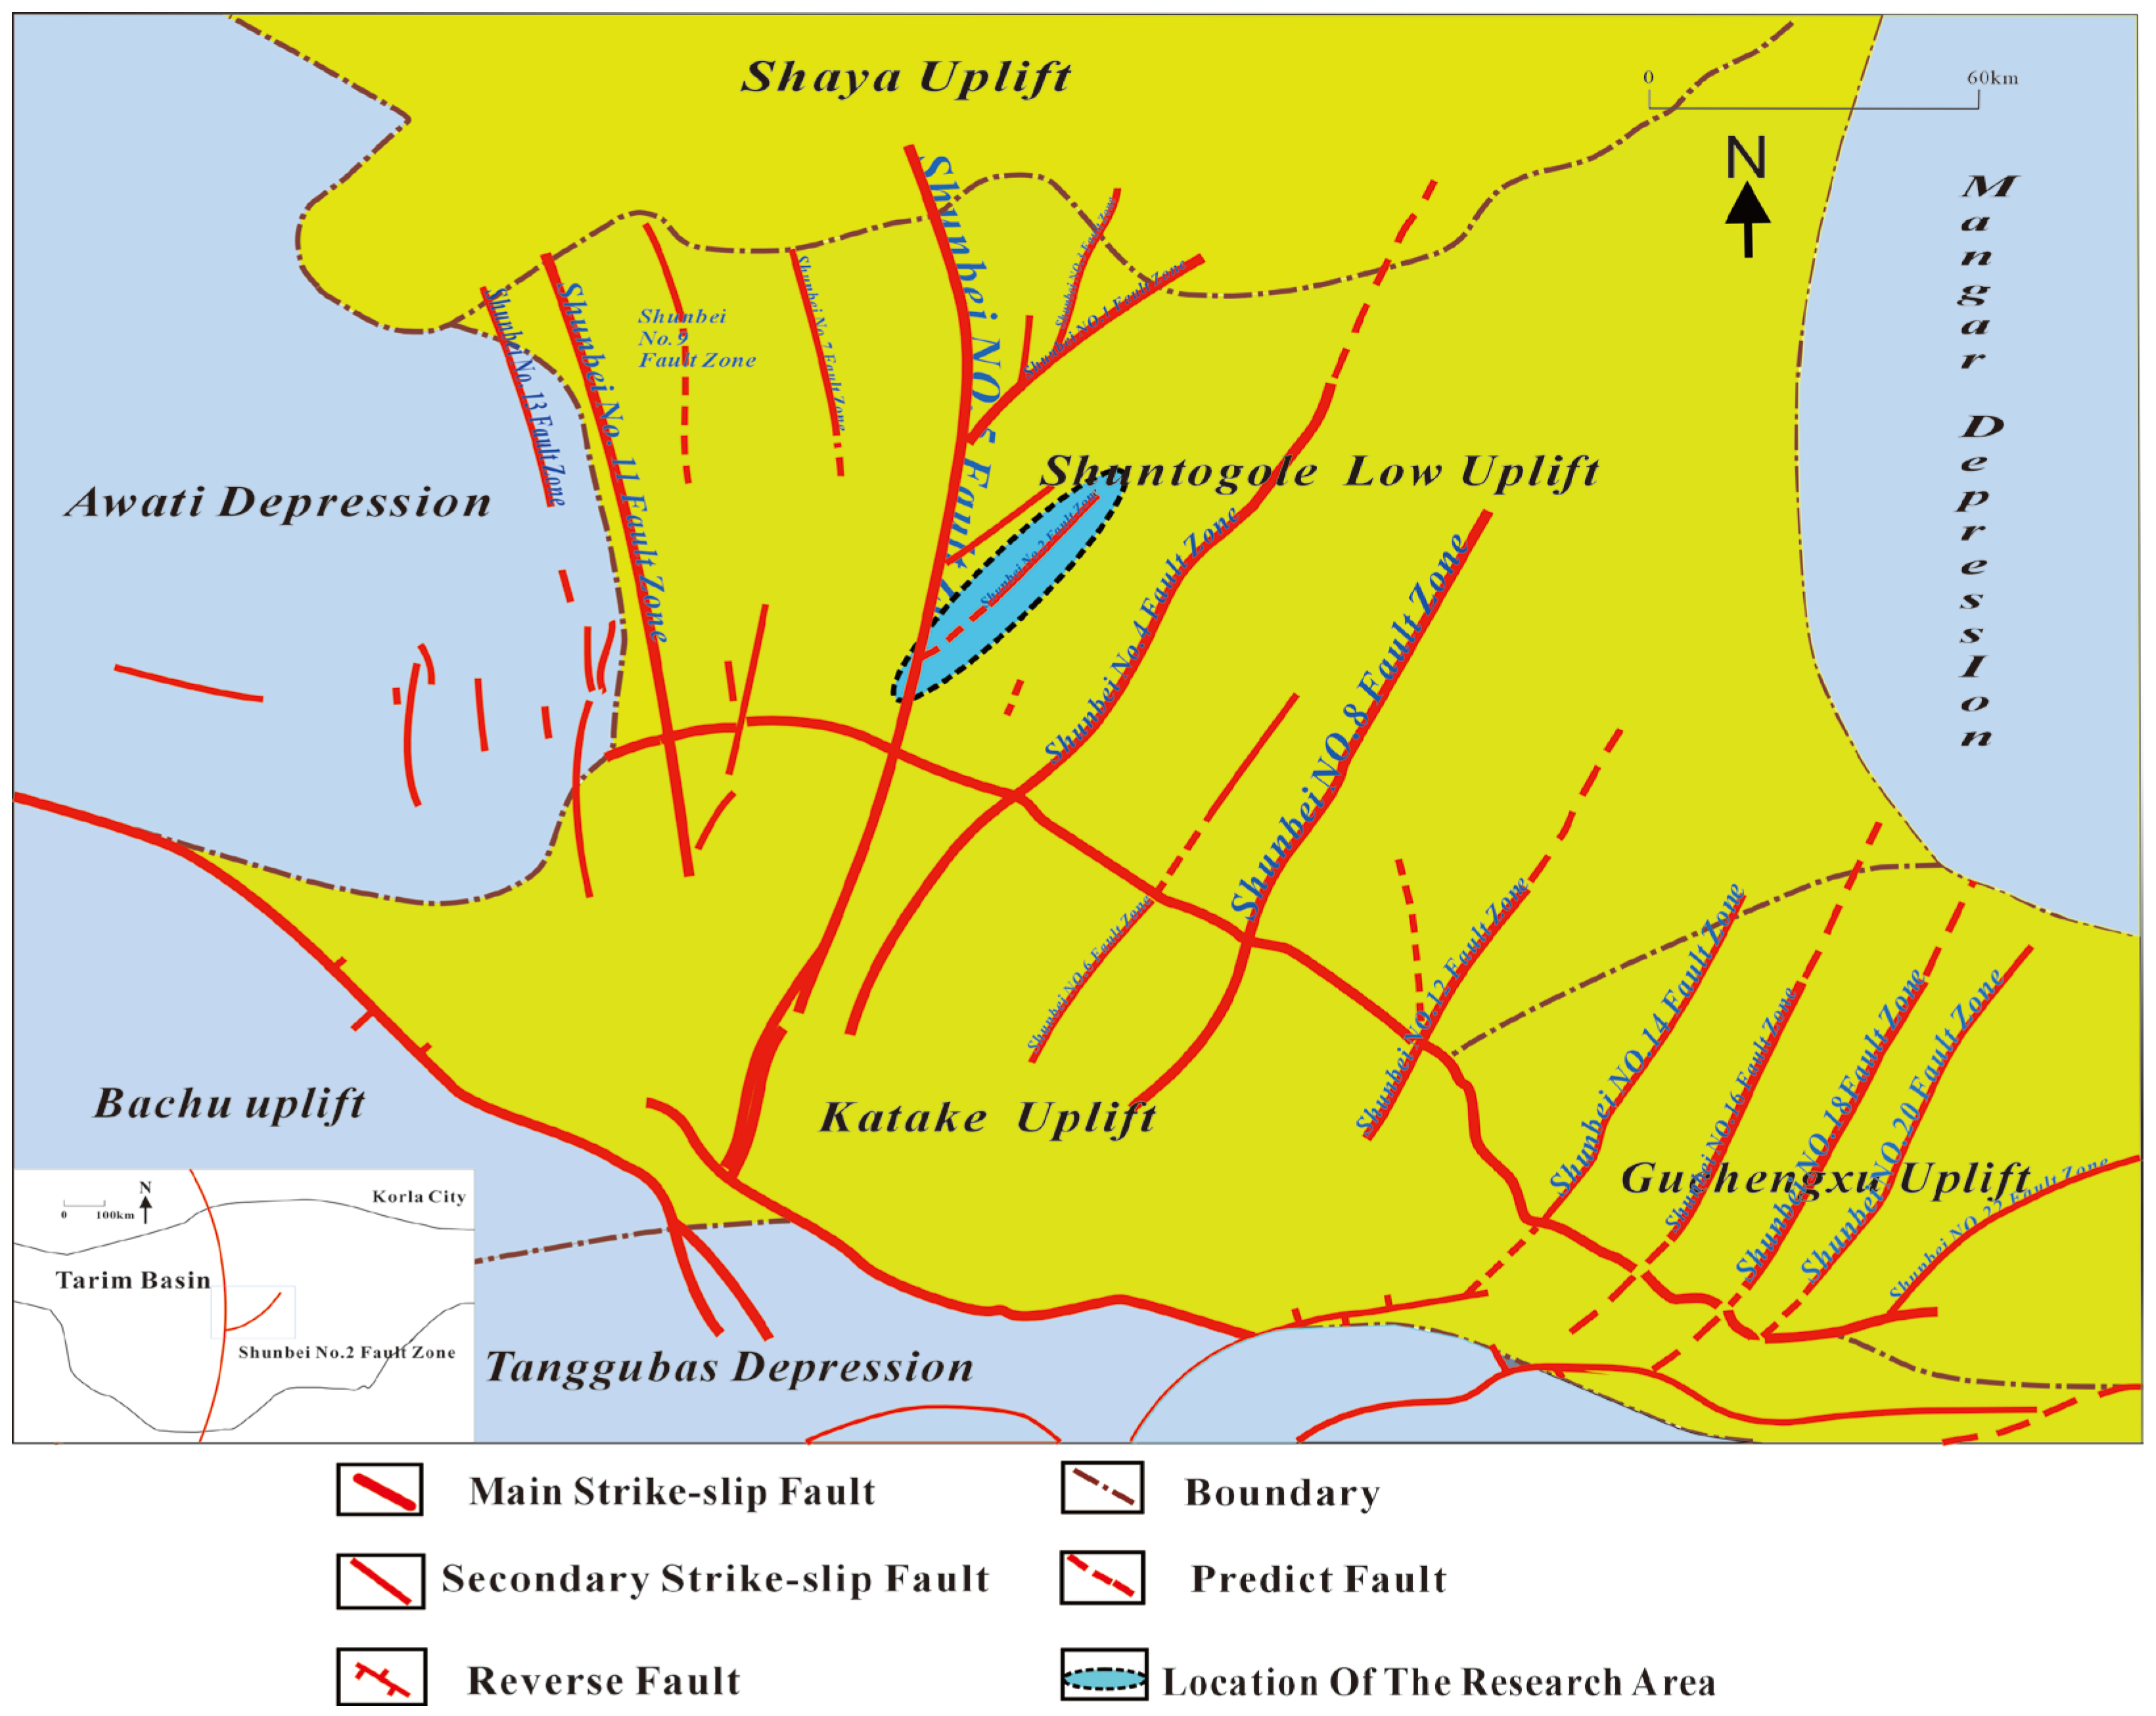
The Shunbei Oilfield is situated in the central–western part of the Tarim Basin, primarily distributed within the Shunto’gule Low Uplift Zone. Its southeastern extension reaches the Shunbei Slope of the Guchengxu Uplift. To the north, it adjoins the Shaya Uplift; to the south, it borders the Katak Uplift; to the east, it neighbors the Mangar Depression; and to the west, it borders the Awati Depression [34] (Figure 1). The Ordovician sequence in the Shunbei area is well-developed, divided from bottom to top into the Penglaiba Formation, Yingshan Formation, Yijianfang Formation, Qiaerbaike Formation, and Santamu Formation [35]. Particularly significant are the middle–lower Ordovician Yingshan and Yijianfang Formations. These deep-to-ultra-deep (generally exceeding 7300 m) carbonate strata have experienced multiple tectonic events and karstification. This formed fault-controlled fractured-vuggy reservoirs as main storage spaces, key for hydrocarbon accumulation. The gas reservoir types in Area II of the Shunbei Oilfield primarily feature karst cavities and slip-fault-associated fracture cavities as main storage spaces, with fractures serving as primary conduits. These unconventional “layered” reservoirs exhibit multi-medium characteristics and strong heterogeneity [36]. The reservoirs lie at depths of 8200–9300 m, with temperatures ranging from 165 to 210 °C, pressure coefficients between 1.10 and 1.74, and gas-to-oil ratios reaching 3000–24,000 [37]. As a relatively unique new type of condensate gas reservoir, the ultra-high-temperature, ultra-high-pressure deep fractured-vuggy condensate gas reservoir in the Shunbei II area lacks mature comprehensive development technologies and has virtually no referenceable international development experience. Its complex phase changes and flow conditions necessitate corresponding development research.
Figure 1.
Geological structure map of the Shunbei fault zone in the Tarim Basin.
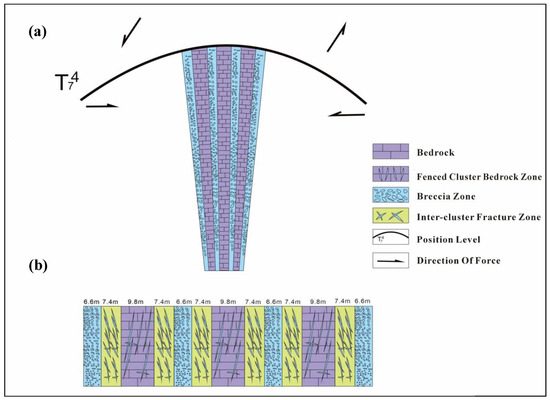
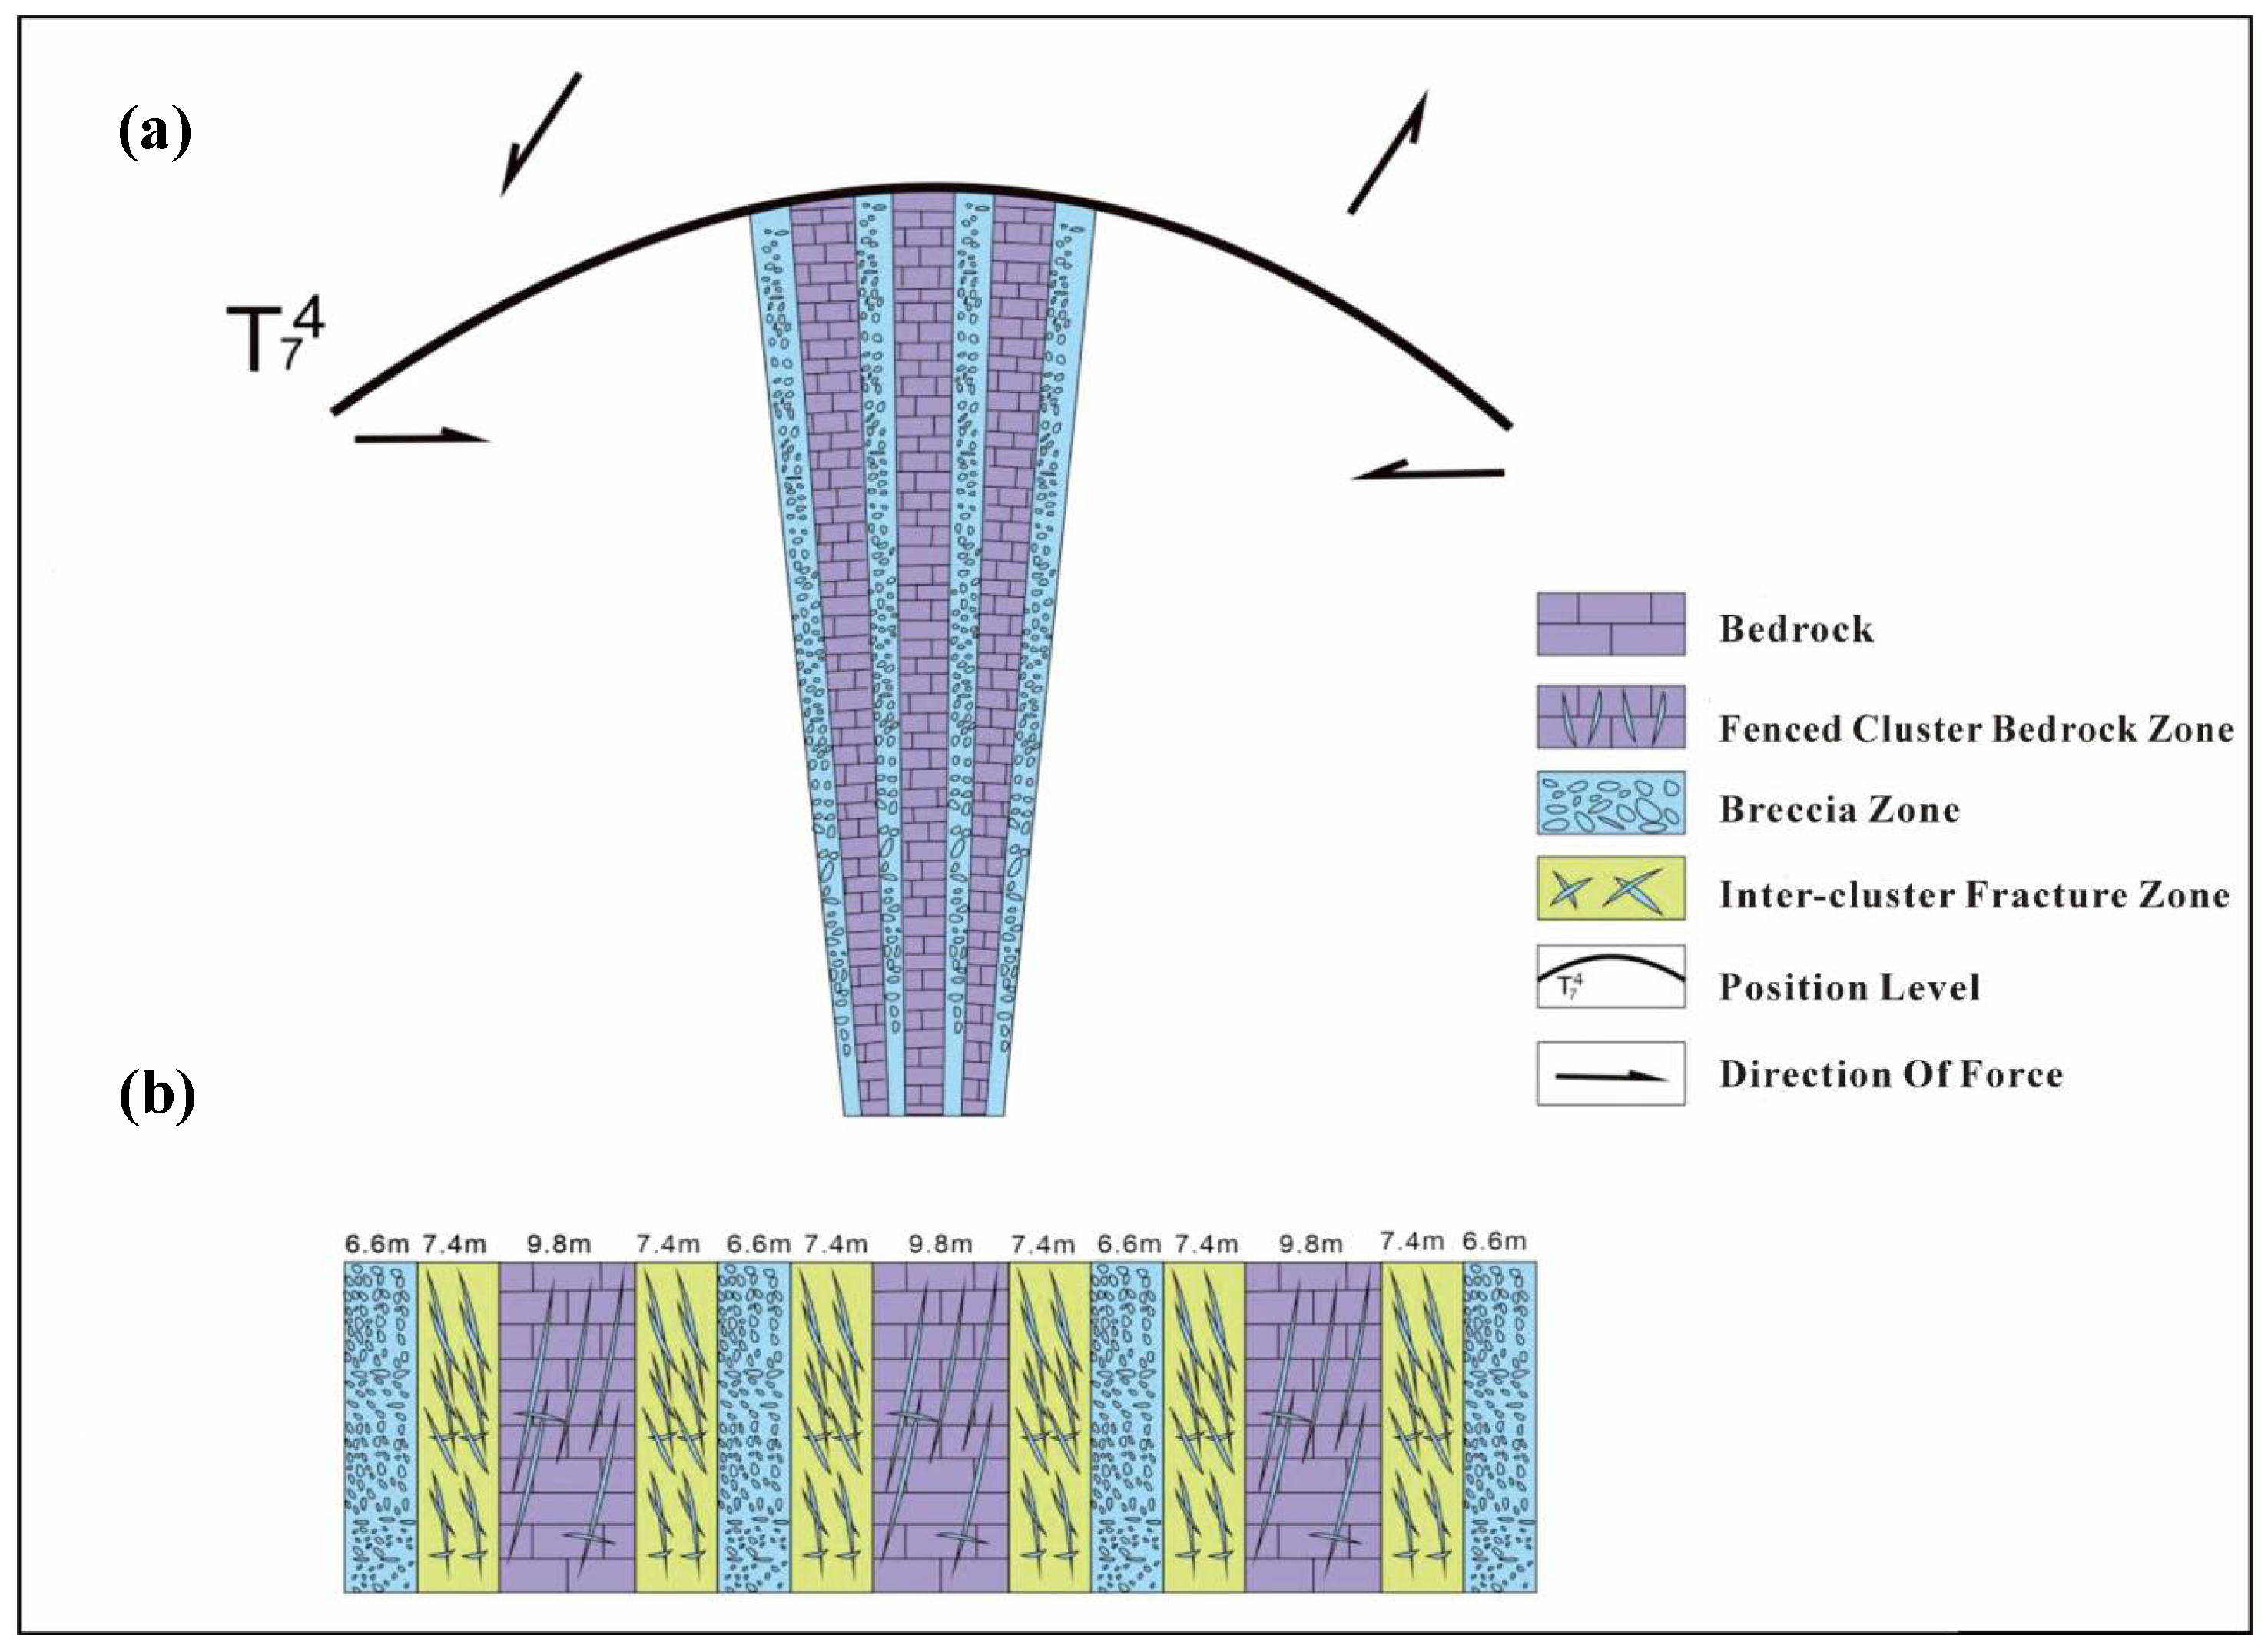
The fracture-vuggy carbonate condensate gas reservoirs hosting the SHB42X well group are subjected to multiaxial compressive stress, resulting in highly heterogeneous horizontal and vertical permeability properties. Their reservoir space consists of fracture surfaces and interconnected fracture zones (Figure 2), with highly developed pores, vugs, and fractures. Based on modern quantitative analysis through numerical simulation, this study summarizes and explores the gas injection recharge mechanism for the SHB42X well. It evaluates the injection medium’s throughput effects in different conventional condensate reservoirs, comparing parameters such as the recovery rate and cumulative gas production to identify the most suitable injection medium for developing condensate reservoirs in this area.
Figure 2.
Schematic diagram of the cave lattice structure in fractured cavernous carbonate rocks of the SHUB42X well group. (a) Schematic diagram of the fracture-blocking mechanism in the compression section of the SHUB42X well group; (b) schematic diagram of fracture development patterns in the SHUB42X well group (modified from [38]).
3. Experiments and Methods
3.1. Development of Single-Well Numerical Simulation Model
Based on geological models, reservoir engineering, and production dynamics data, a three-dimensional spatial model, pressure and fluid distribution model, and production dynamics model for the SHB42X well were established using tNavigator23.4 numerical modeling software. The grid was coarsened using the 42X single-well dynamic reserves to control the well boundary. The grid spacing on the plane was designed as 4 m × 50 m, and geological model parameters such as porosity, permeability, and saturation were also coarsened. Since the mechanism of gas injection huff-and-puff is highly dependent on the complex phase behavior between the injected gas and the formation of crude oil, as well as mass transfer effects between components, the black oil model cannot adequately describe these critical mechanisms, whereas the component model excels at characterizing them. Therefore, the component model was adopted for the experimental PVT scheme, and numerical simulations were conducted based on this model. Production history data was utilized to fit and correct parameters such as reservoir pressure. The effects of different injection media on the well’s throughput performance were simulated.
Numerical Simulation Model Development
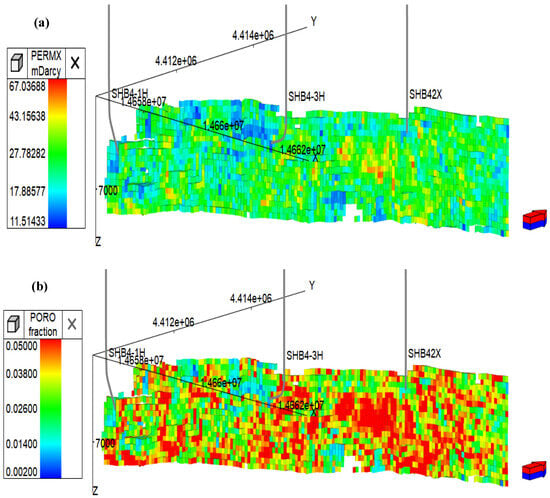
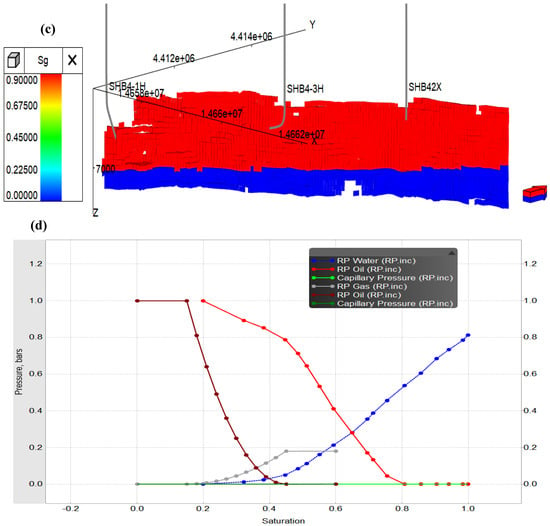
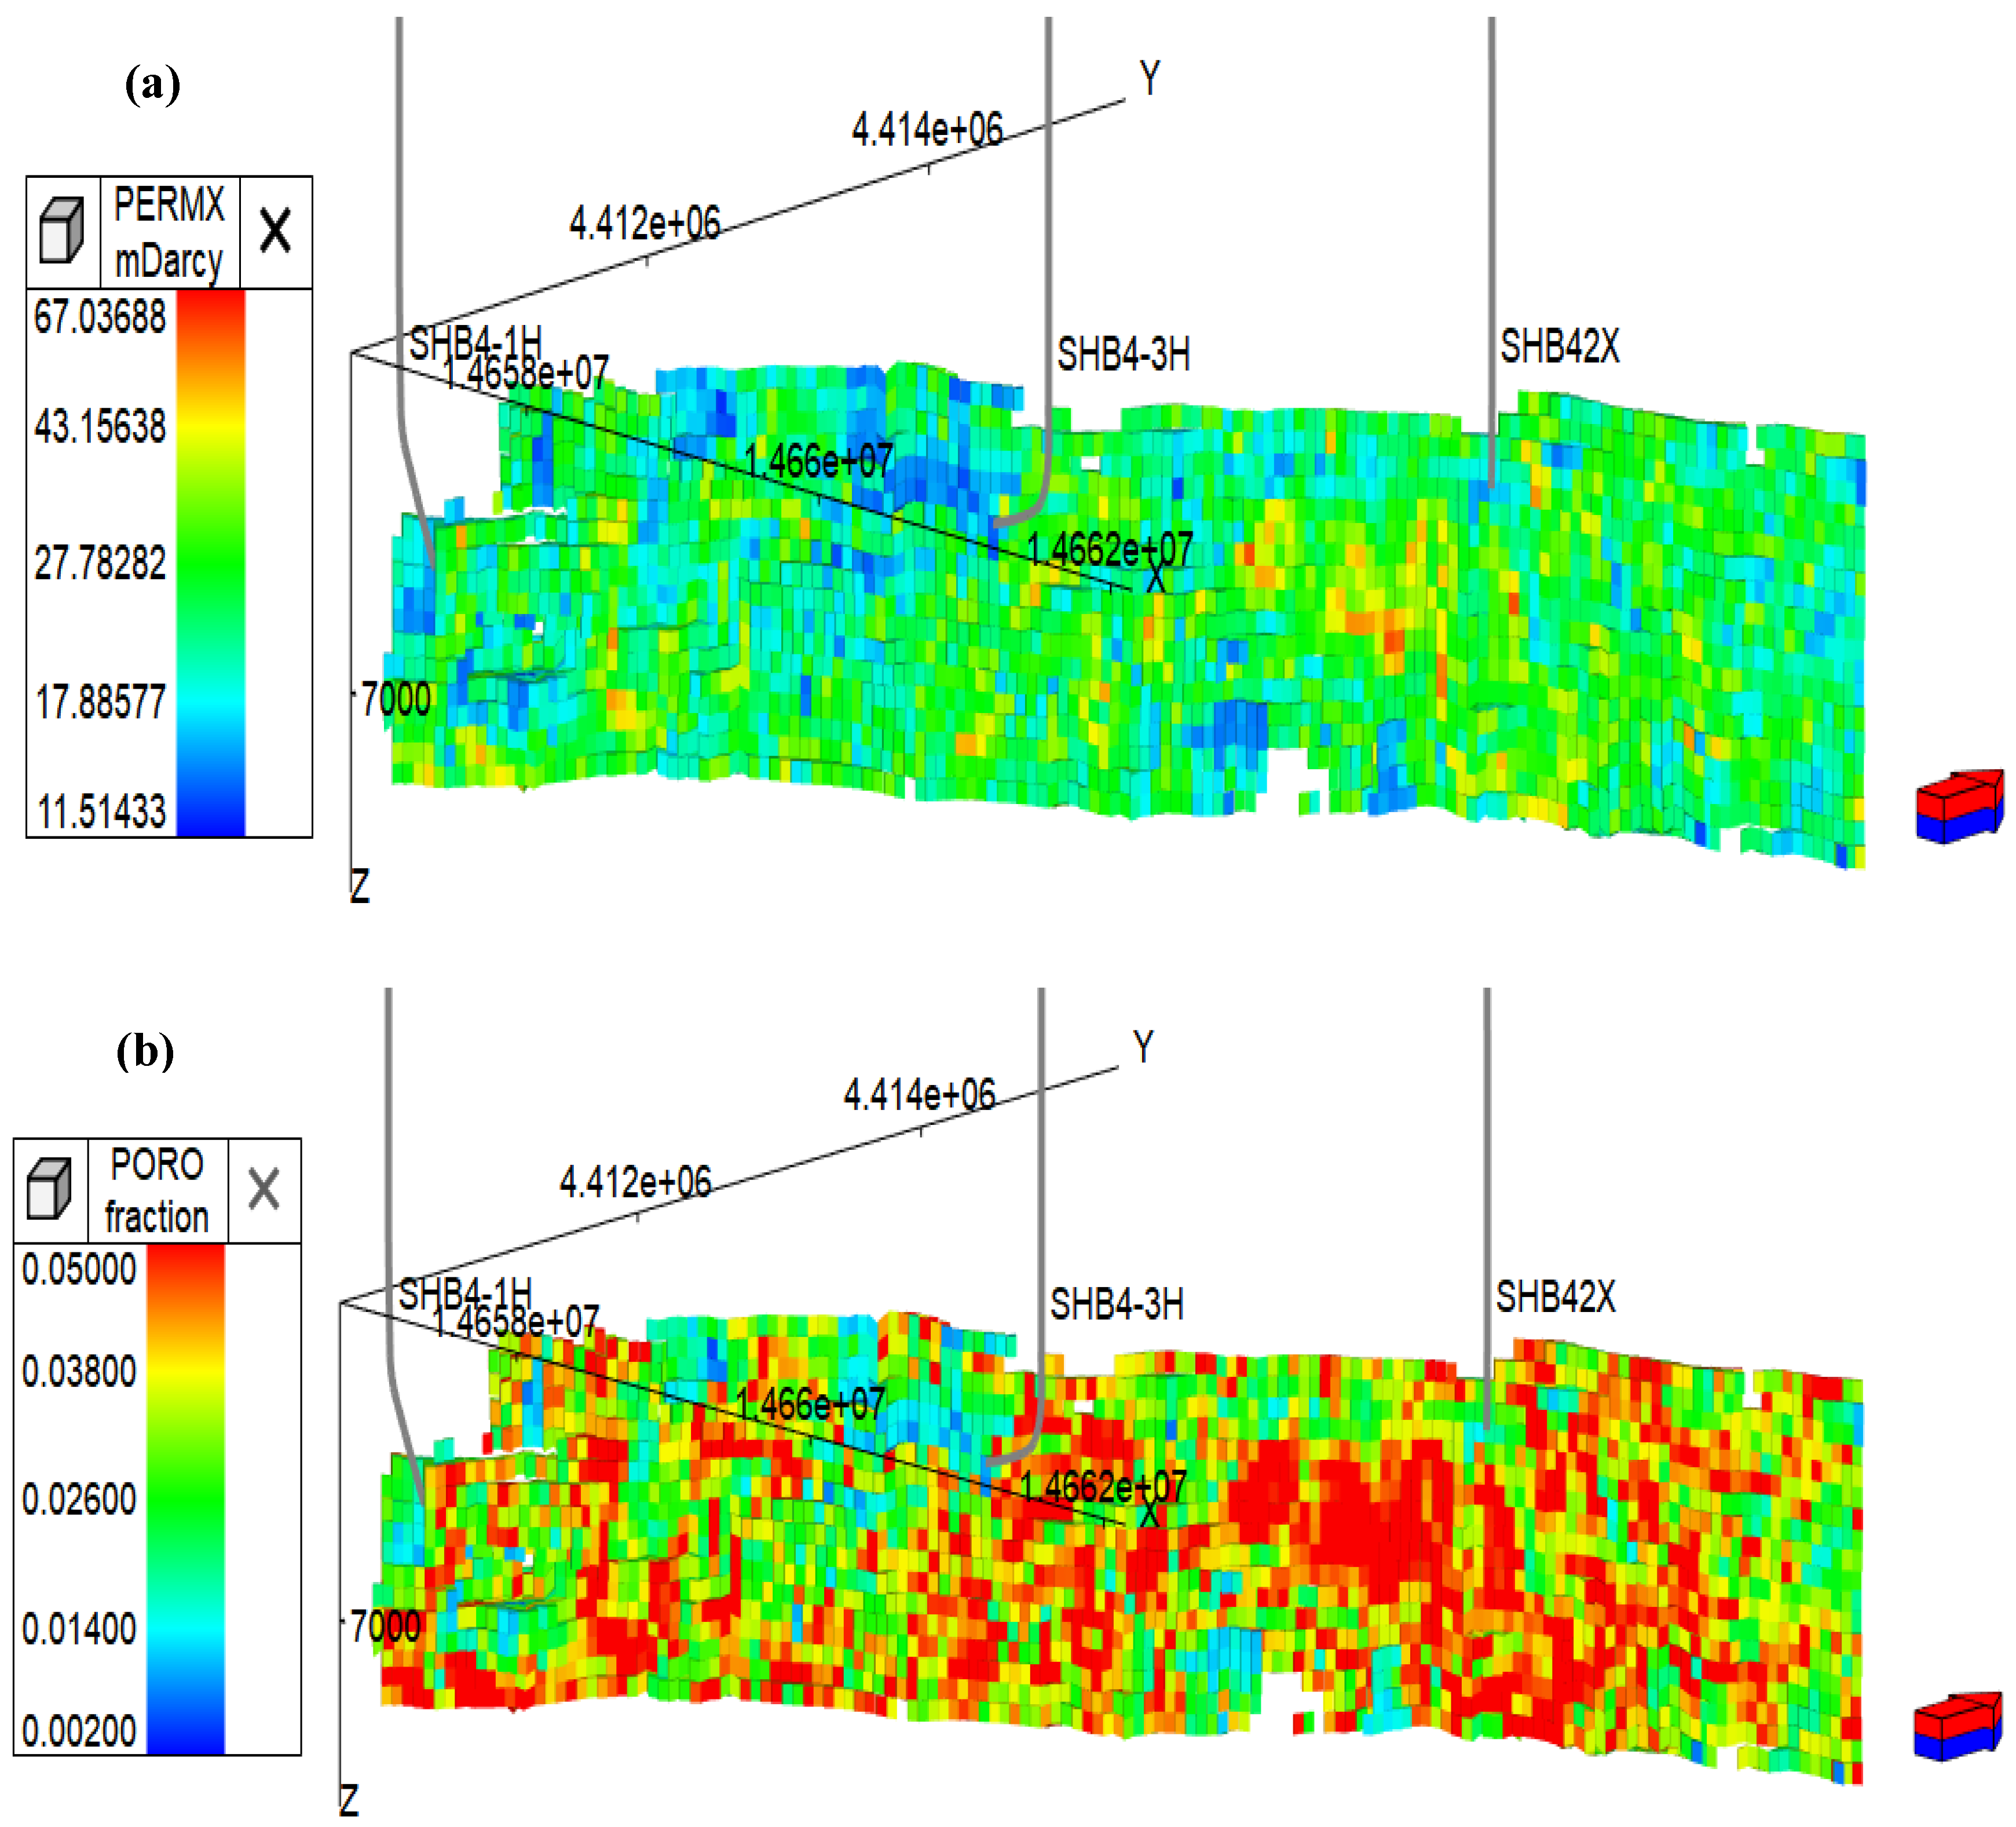
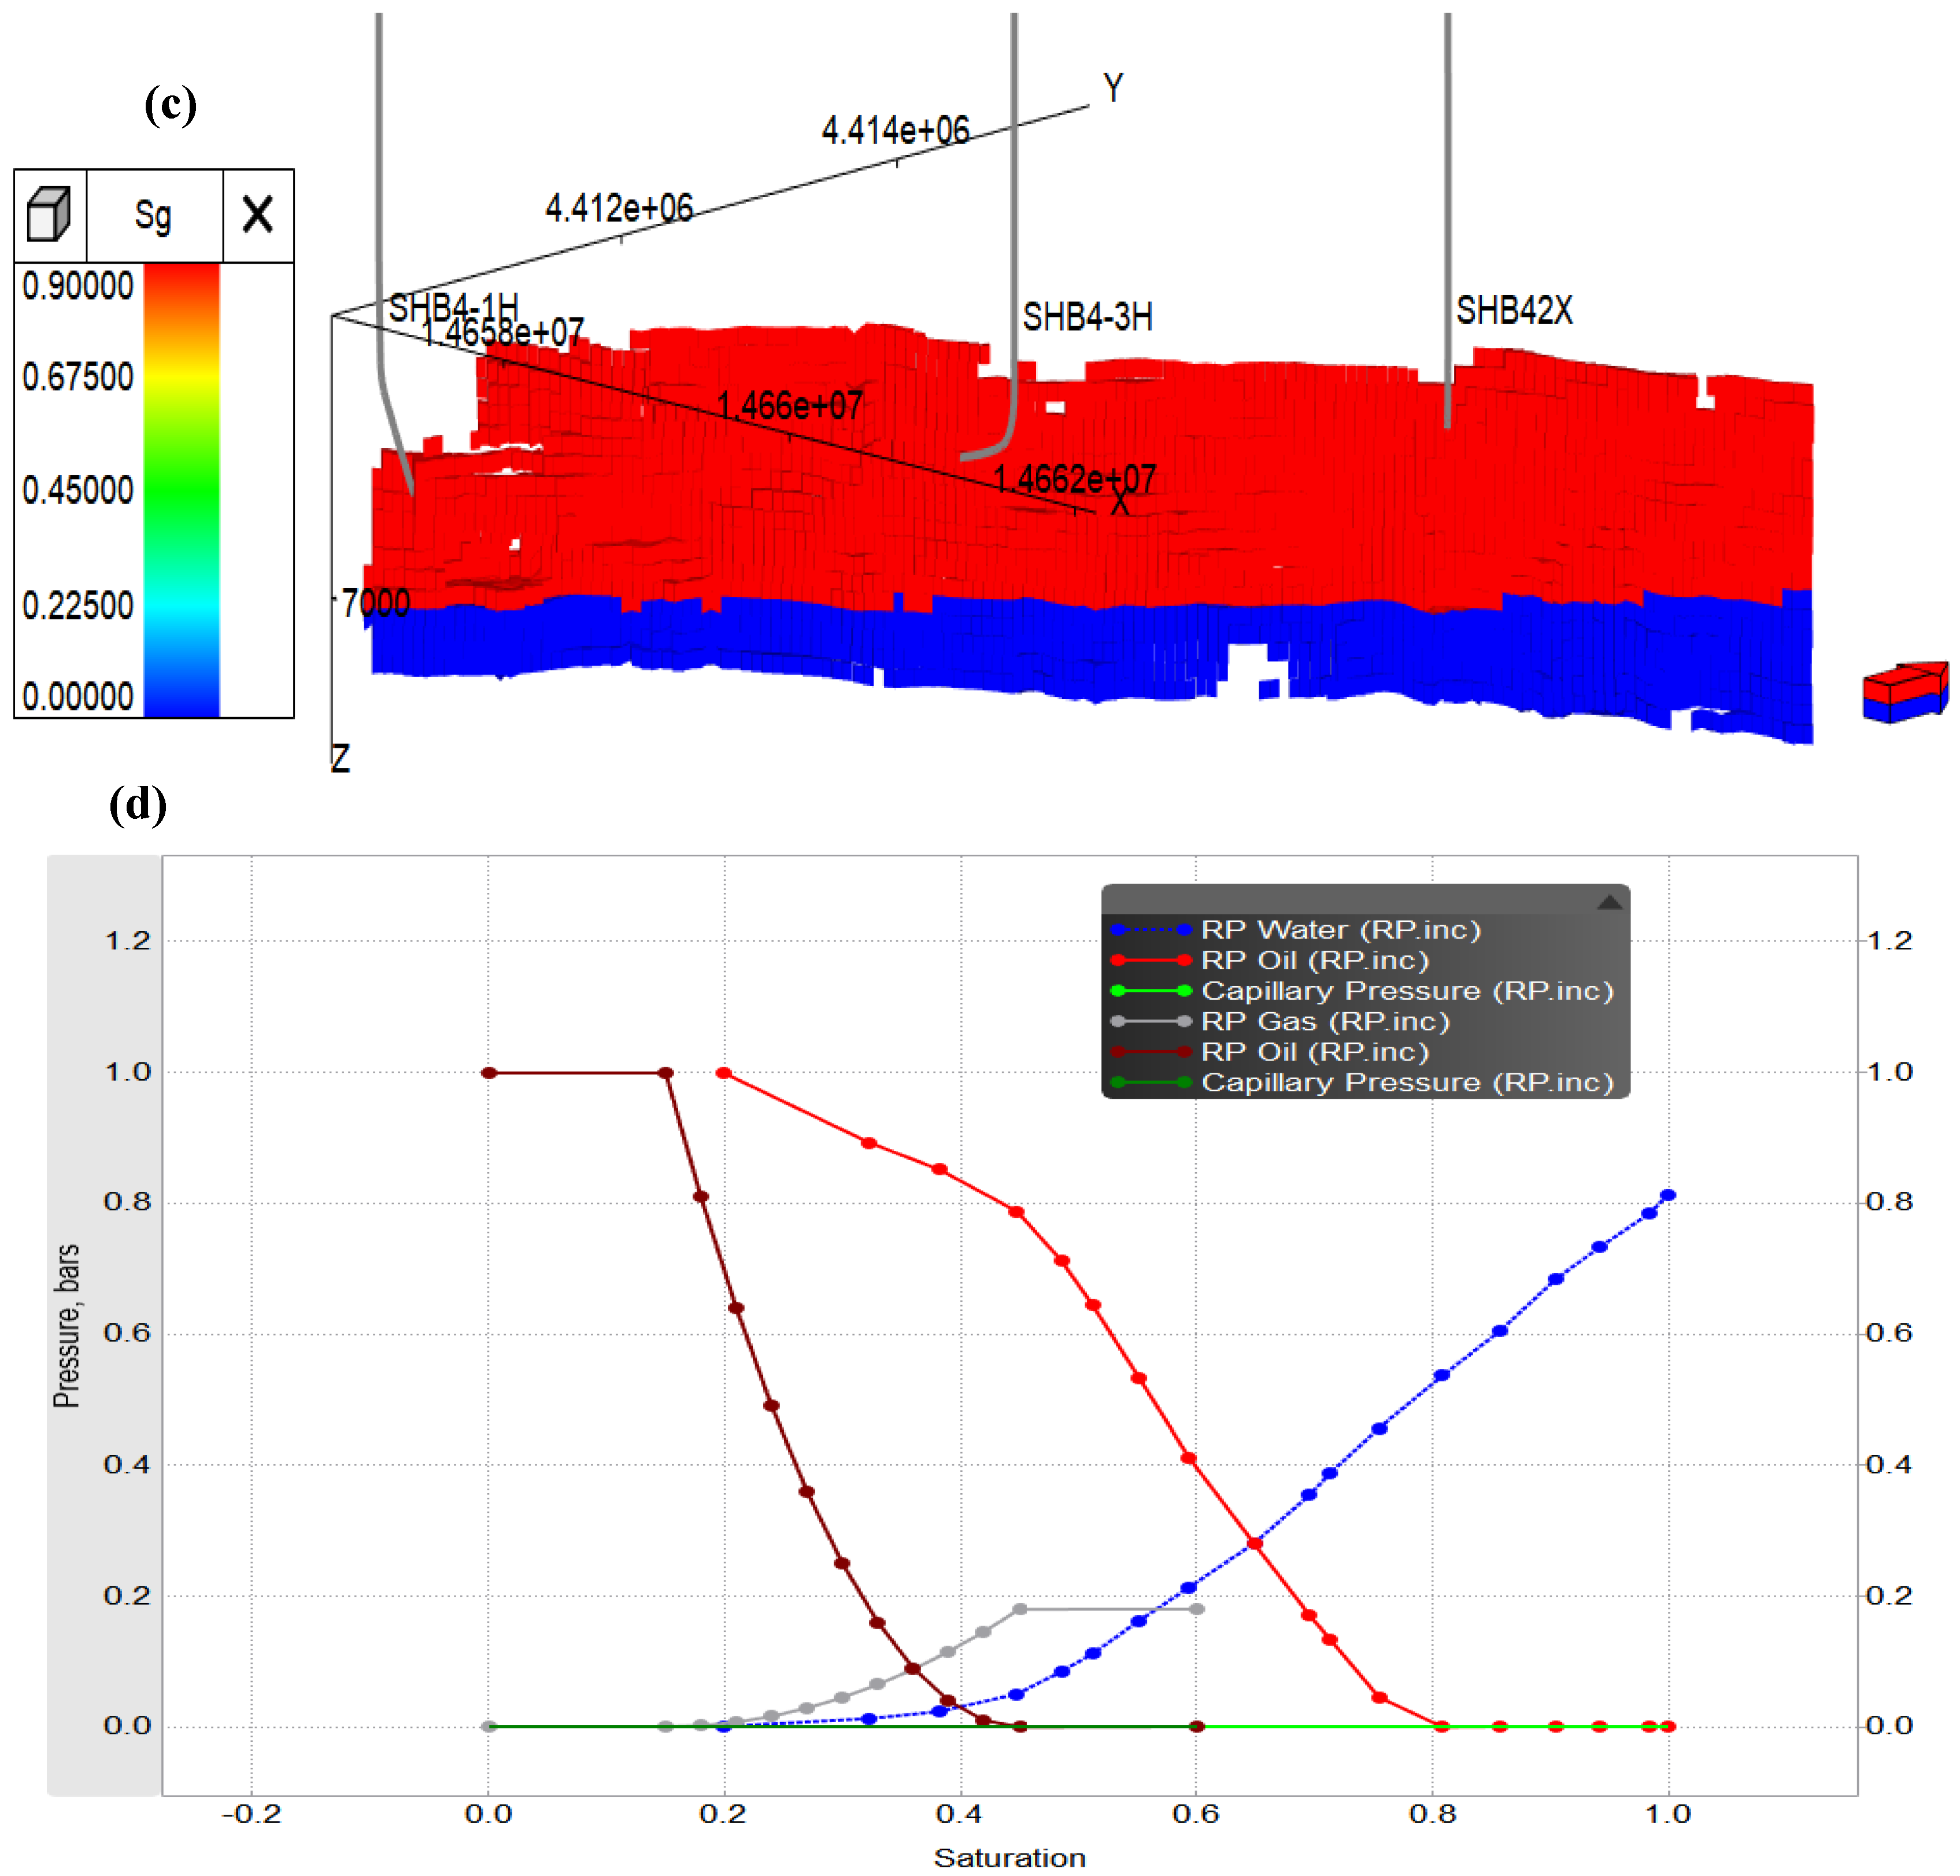
Based on 3D modeling requirements, the permeability (Figure 3a), porosity (Figure 3b), and saturation (Figure 3c) parameters are defined as follows: geological model grid parameter module, fluid model parameter module, relative permeability module (Figure 3d), initialization parameter module, and production data module, to sequentially define the initial parameters of the grid (Table 1). The precision of reservoir properties is crucial for the accuracy of subsequent fluid modeling and historical matching.
Figure 3.
Numerical simulation model of the Shunbei 42X well group. (a) SHB42X well numerical simulation permeability model; (b) SHB42X well numerical simulation porosity model; (c) SHB42X well numerical simulation saturation model; (d) SHB42X well numerical simulation phase permeability curve.
Table 1.
Numerical simulation basic parameters.
The high-pressure physical properties of condensate reservoirs are not only pressure-dependent but also related to the composition and content of hydrocarbons within the reservoir. Therefore, using the PVT module of tNavigator23.4 software, by adjusting the parameters of the EOS state equation, actual PVT experimental data were calculated and fitted to obtain a reasonable EOS state equation for the PVT component of the gas reservoir’s composition model. During the operation of the composition model, based on the provided EOS state equation, flash calculations were performed to obtain corresponding high-pressure physical property data such as oil and gas density and viscosity. Here, experimental data from the Shunbei 42X well were selected for fitting.
Data required for PVT fitting includes fluid composition and experimental data (Table 2). Fluid composition comprises components with their corresponding molar percentages and molar masses of added components. Experimental data primarily consists of dew point pressure measurements, constant-component expansion (CCE) tests, and constant-volume decay (CVD) tests.
Table 2.
Well-flow component composition.
The original experimental data contained 15 components. For model fitting itself, finer component division yields higher fitting accuracy, but this leads to excessively long model computation times. Therefore, components must be appropriately merged before fitting. Based on practical experience, a number of 7–9 components achieve a good balance between model computation speed, accuracy, and fitting precision (Table 3).
Table 3.
Proposed component parameters.
3.2. Production History Matching
Production dynamics data and adjustment measures for the SHB42X well since its commissioning in March 2021 were compiled. Subsequently, history matching of reserves and production dynamics was conducted, primarily focusing on fitting production indicators such as the well’s reserves, cumulative gas production, cumulative oil production, and pressure.
3.2.1. Reserve Matching
The first step in history matching is to match the reserves. To minimize errors, reserve matching was performed for the SHB42X single well. The actual geological reserves for the SHB42X well are 780 million m3 of condensate gas and 228,000 tons of condensate oil. The matched geological reserves are 818 million m3 of condensate gas and 253,000 tons of condensate oil, achieving a matching rate exceeding 90% and demonstrating a high degree of accuracy.
3.2.2. Single-Well Matching
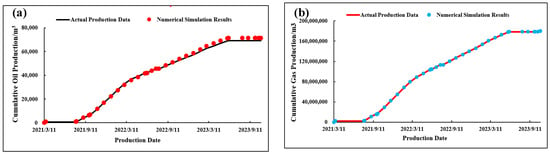
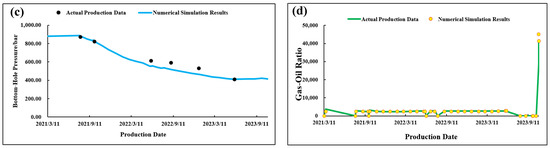
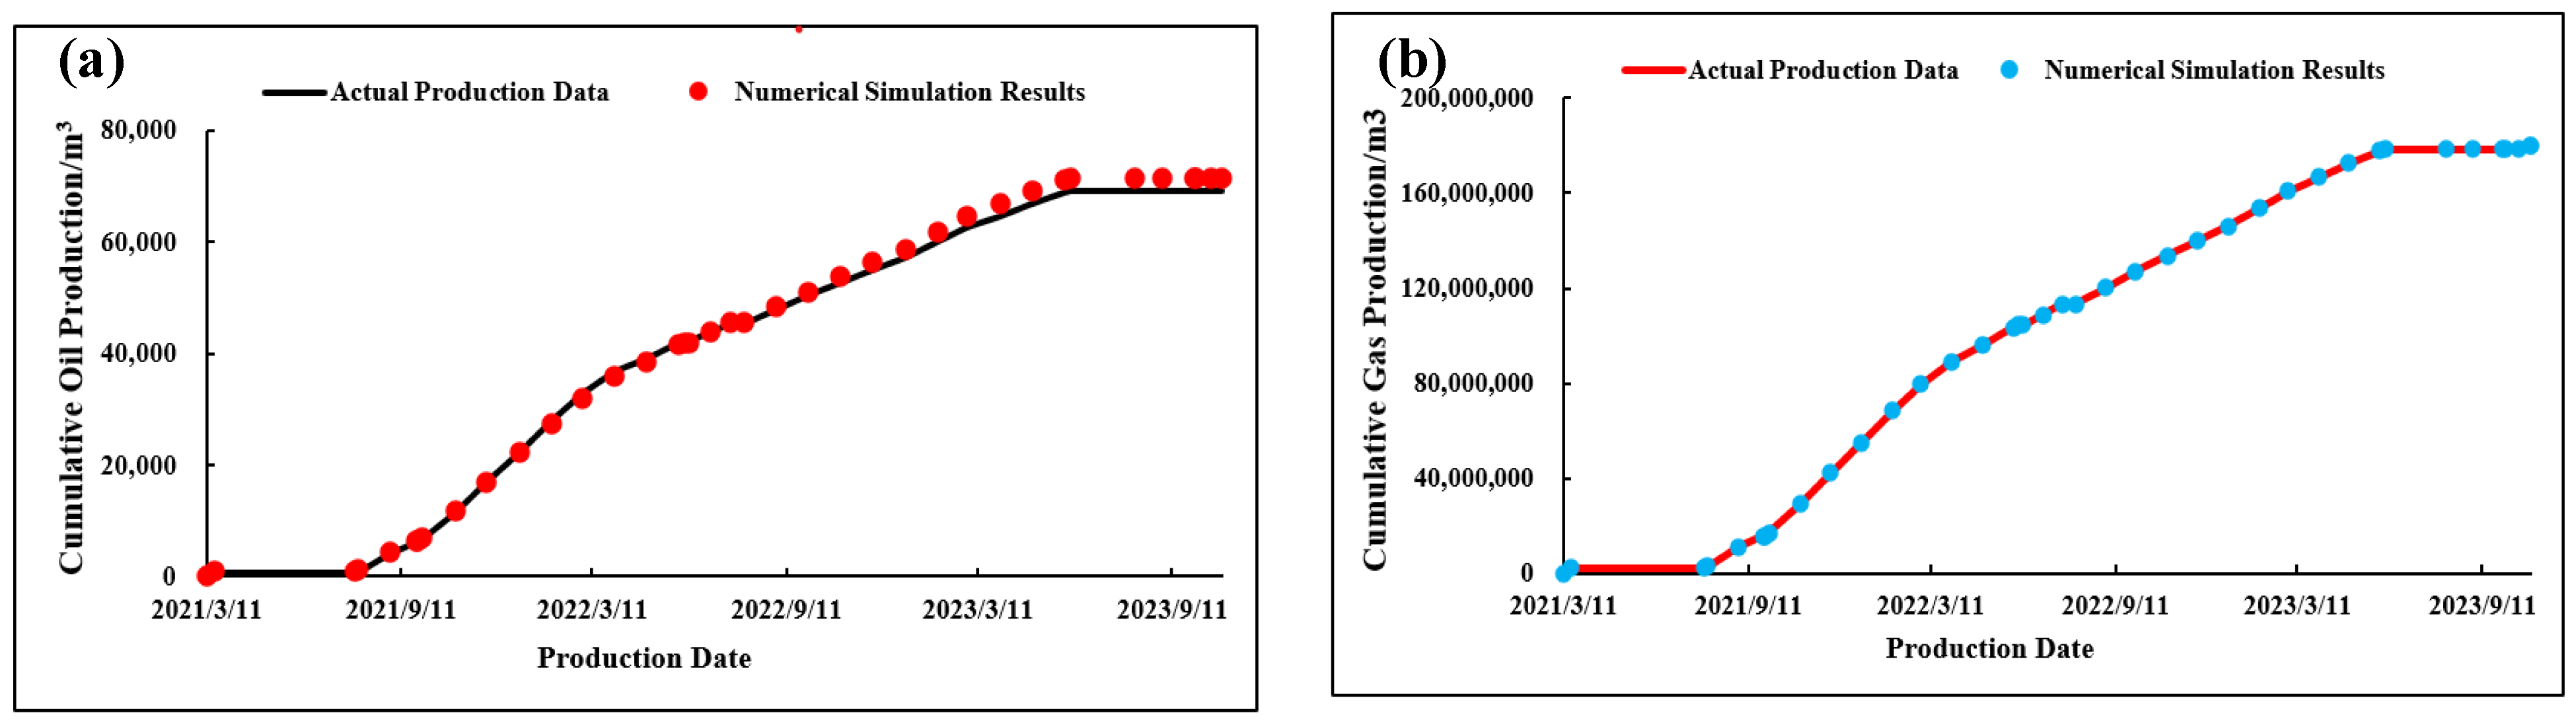
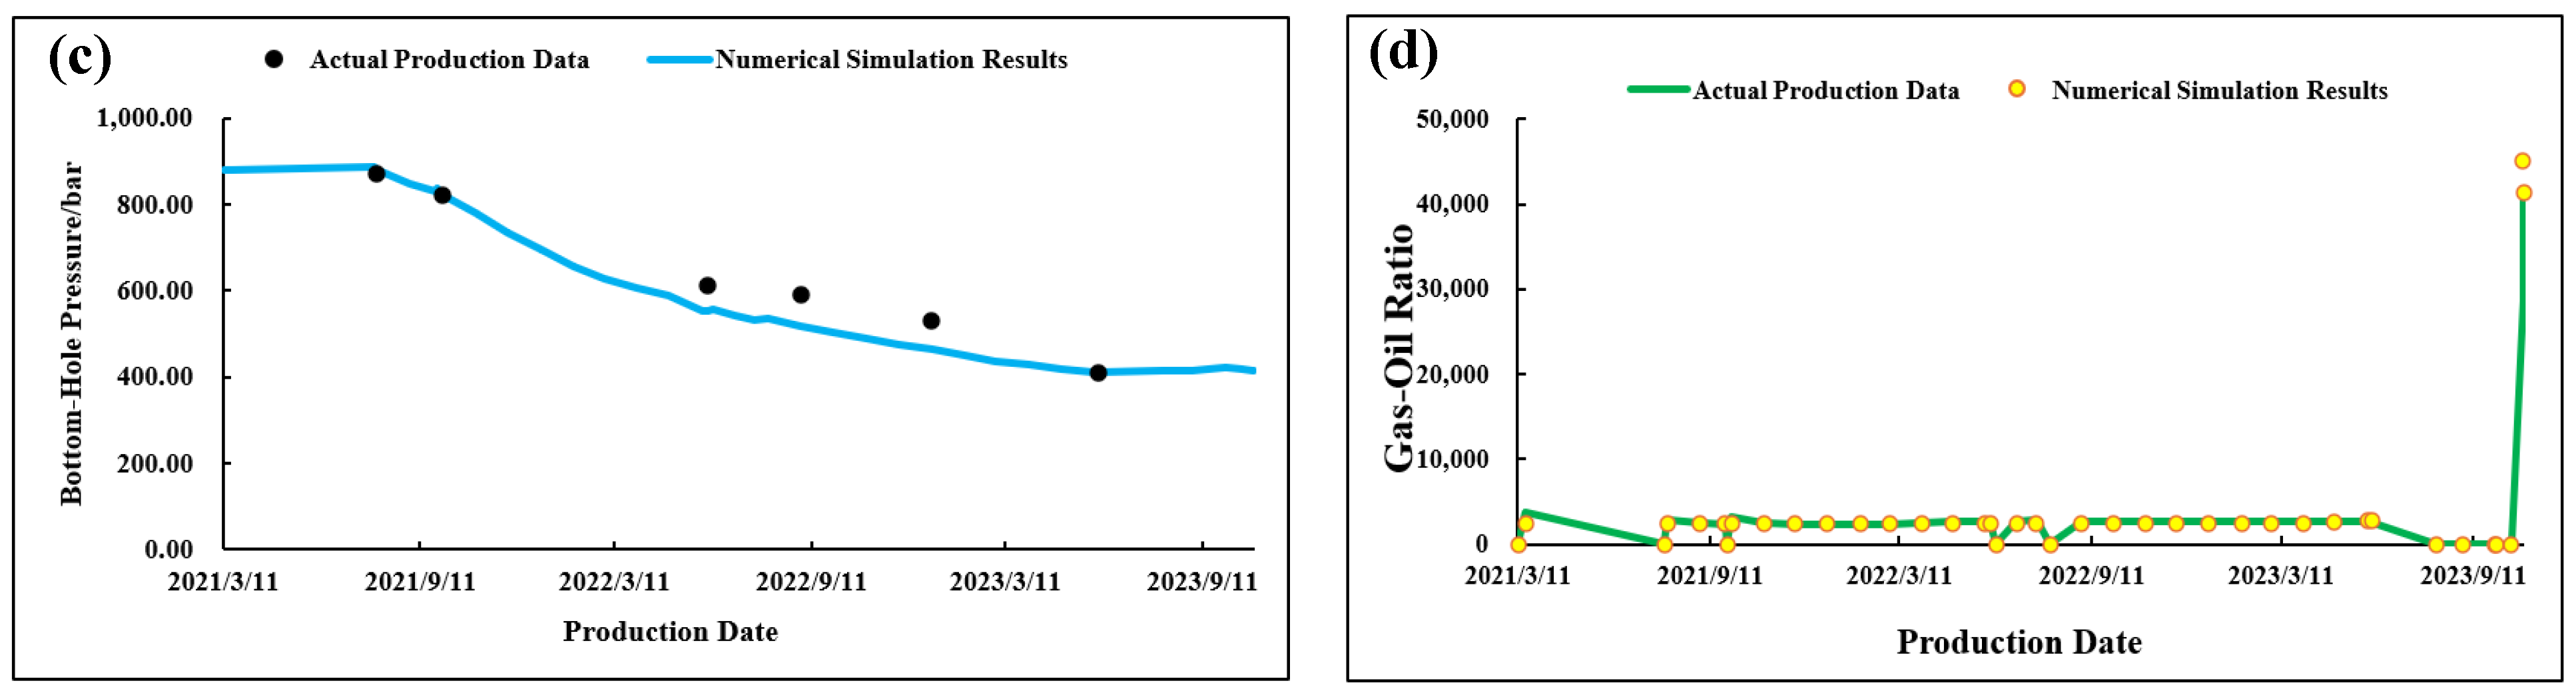
Matching was completed for oil production, gas production, pressure, and the gas–oil ratio for the Shunbei 42X single-well block (Figure 4), with cumulative gas production reaching 179 million m3 and cumulative oil production at 55,600 tons, achieving an overall matching rate of 90%. Initial condensate gas reserves were 818 million m3, with condensate oil reserves of 328,600 m3 (approximately 25.50 tons). As of production cessation on 6 June 2023, remaining gas reserves stood at 616 million m3, with residual oil reserves of 254,500 m3 (approximately 19.75 tons). The condensate oil recovery rate reached 21.86%.
Figure 4.
History matching for the Shunbei 42X single-well block. (a) Cumulative oil production matching; (b) cumulative gas production matching; (c) pressure matching; (d) gas-to-oil ratio matching.
3.3. Inject Different Media
Based on the experimental reports from the Northwest Bureau and injection volumes in other well groups, a suitable single-well gas injection throughput plan was designed. Using the preliminary numerical model, single-well simulations were run for gas injection huff-and-puff, N2 injection, water injection, and depletion. The cumulative oil production from gas injection huff-and-puff was compared with the depletion extraction results. Subsequently, the enhanced recovery capabilities of the three injection media were evaluated to identify the most effective medium for production enhancement. Injection parameters for all three media were set identically. The previously fitted numerical simulation model was employed for gas injection production simulation. Production wells were set to inject gas at dew point pressure (43 MPa) in June 2023, with a production duration of 10 years. (Table 4). Injecting gas near or below the dew point pressure maximizes the dissolution, viscosity reduction, and expansion effects of the gas in crude oil while preventing the formation of gas phase barriers in the near-wellbore zone that impede oil and gas flow.
Table 4.
Evaluation of injected medium design.
Natural gas can dissolve in crude oil, effectively reducing viscosity and swelling the oil matrix [39]. Upon contact with crude oil, natural gas continuously dissolves into the oil or forms a miscible phase until reaching saturation. During this process, crude oil viscosity decreases, reservoir energy is replenished, and fluid mobility improves. Natural gas can reduce recondensation through extraction and gas purification effects, thereby enhancing gas phase permeability, alleviating tubing blockages, and facilitating crude oil extraction. During open-hole production, as pressure gradually declines to the gas bubble point, natural gas gradually separates from crude oil to form foamy oil [40]. Subsequently, dissolved gas drive is achieved, thereby enhancing recovery rates. Early scholars believed that water injection was not feasible for enhancing recovery in condensate reservoirs. It was not until the 1980s that foreign researchers such as Matthews J D et al. [41] investigated the feasibility of waterflooding in condensate reservoirs through experiments and numerical simulations, demonstrating the viability of water injection for developing condensate reservoirs. The exceptional performance of nitrogen stems from its role as an efficient energy carrier and selective mass transfer medium. It delivers powerful, direct force through non-mixing expansion and leverages its high diffusivity and low viscosity to optimize energy transfer pathways and enhance the properties of the displacing phase. This enables rapid, effective crude oil recovery during the displacement round, making it an economical and efficient choice for specific reservoirs.
4. Results and Discussion
4.1. Factors Affecting Different Media
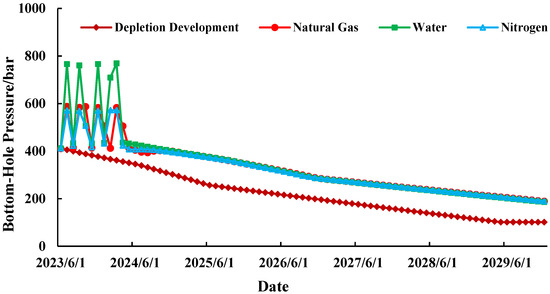
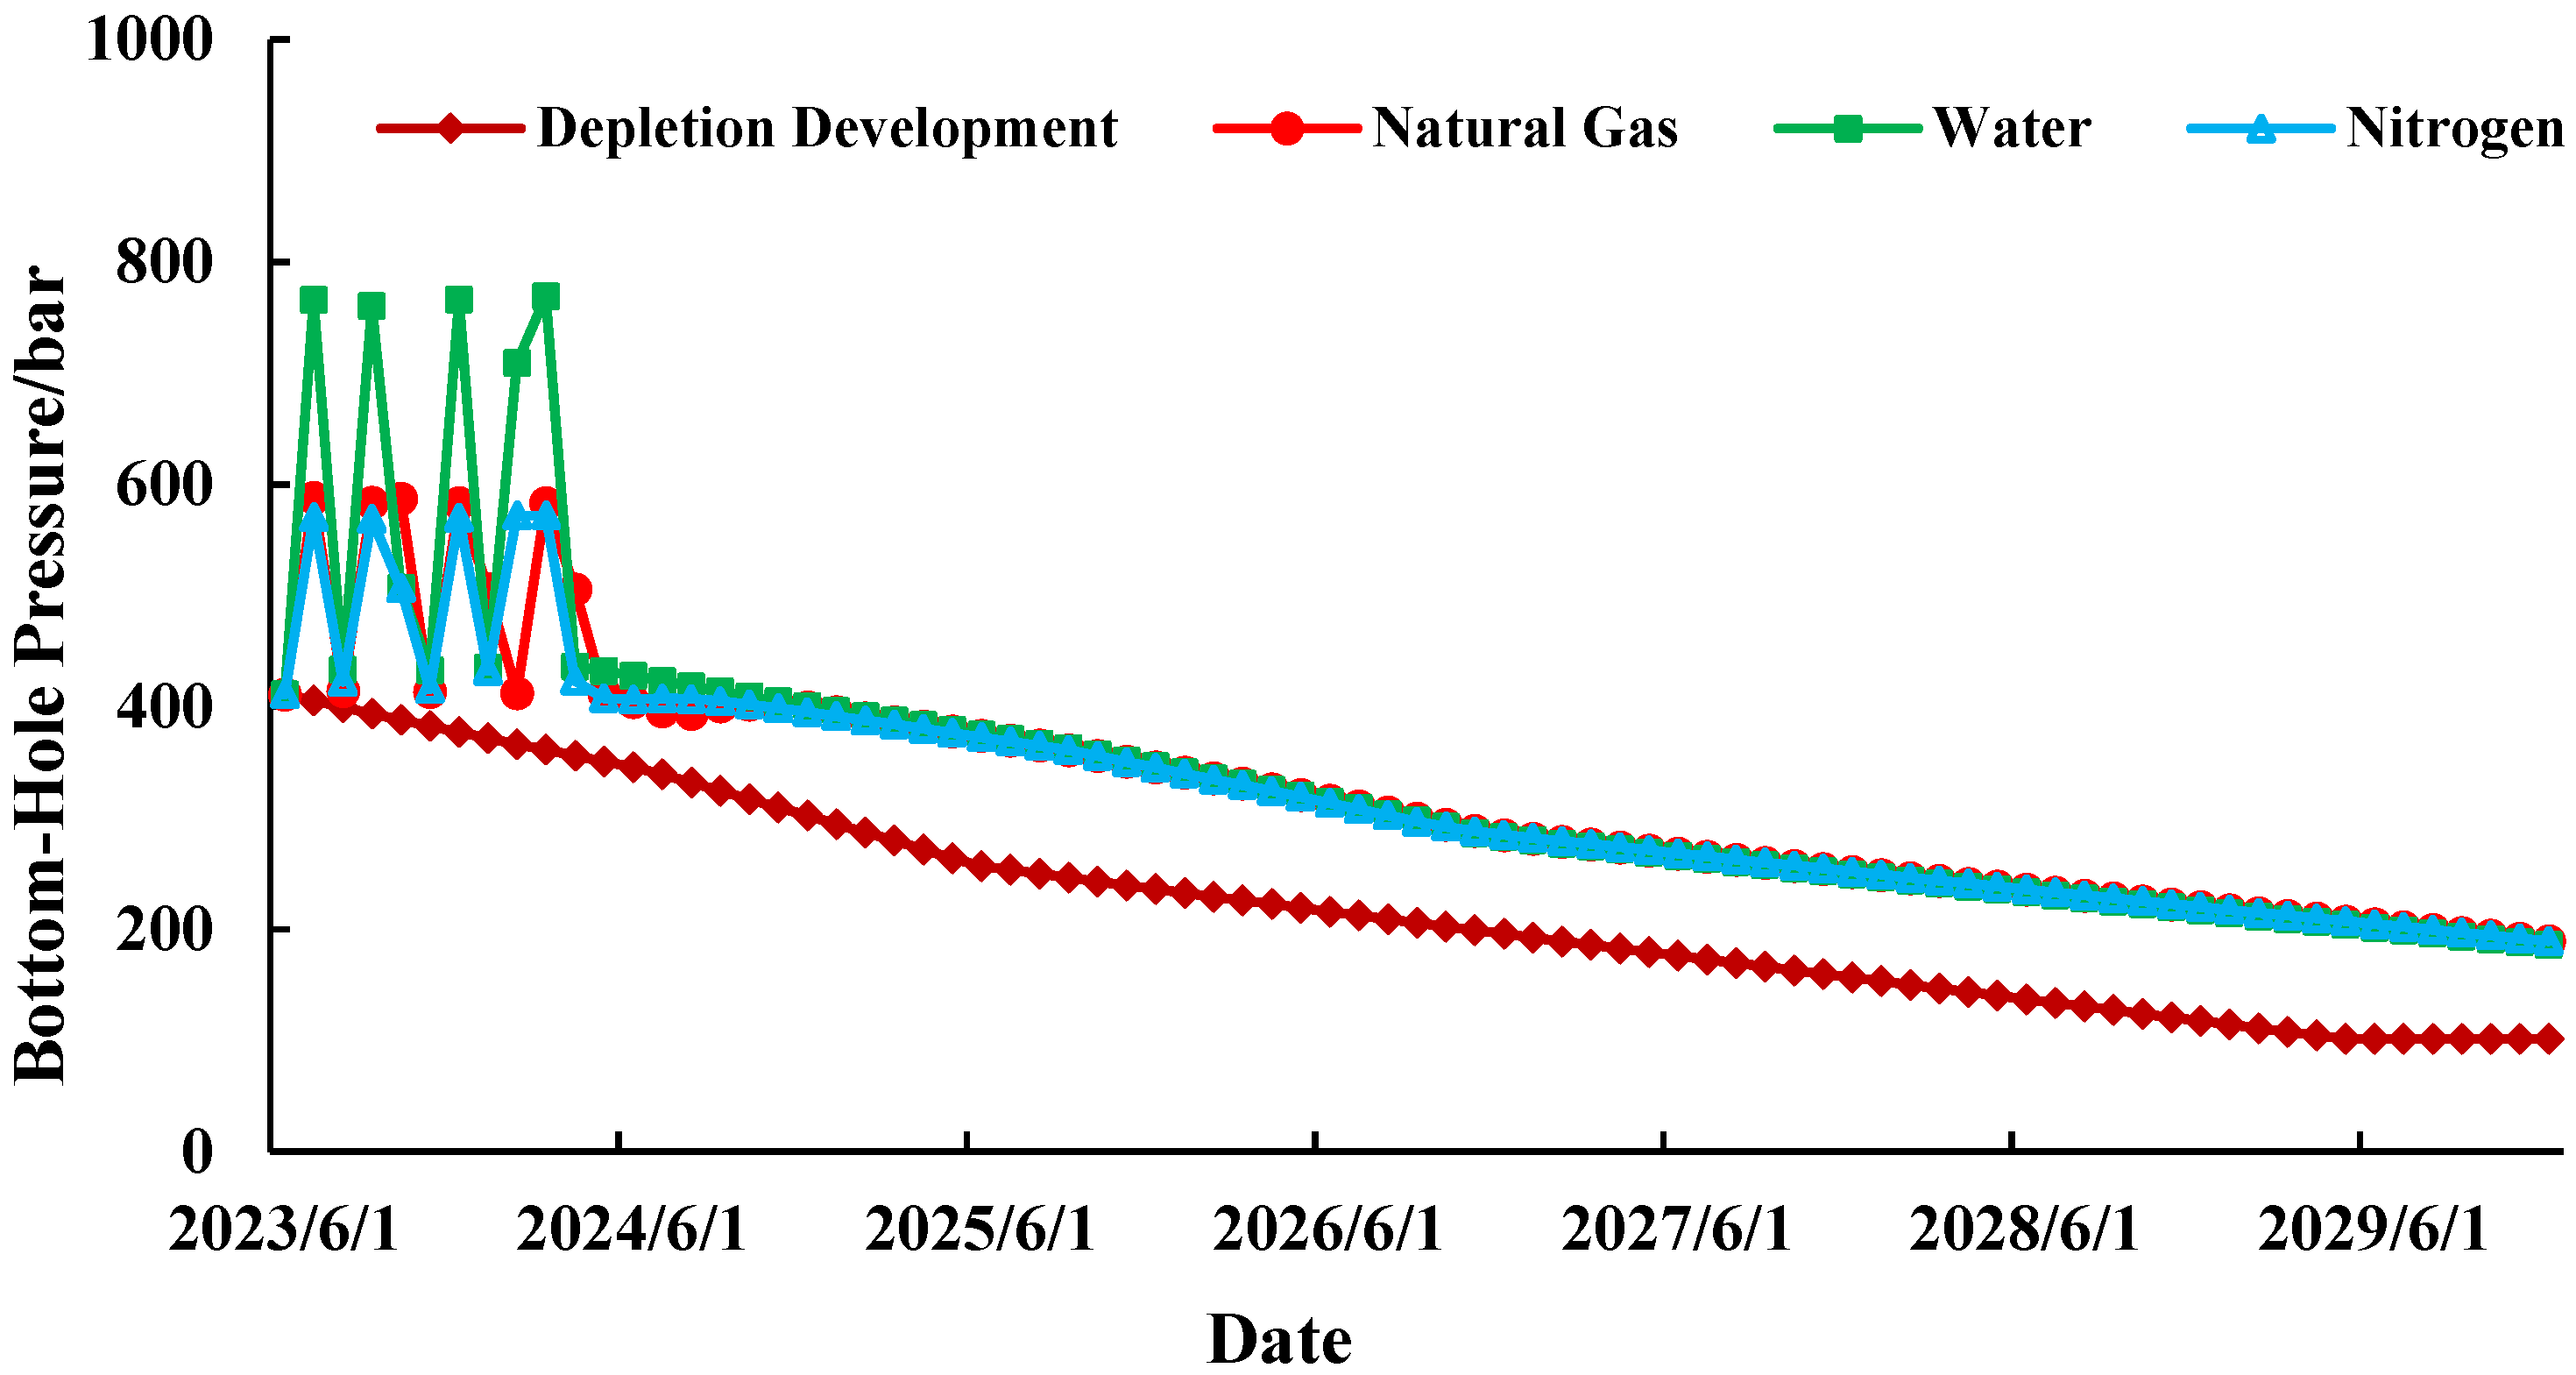
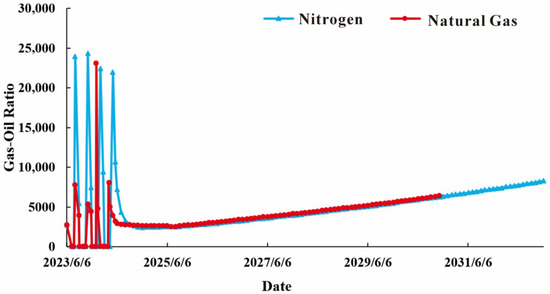
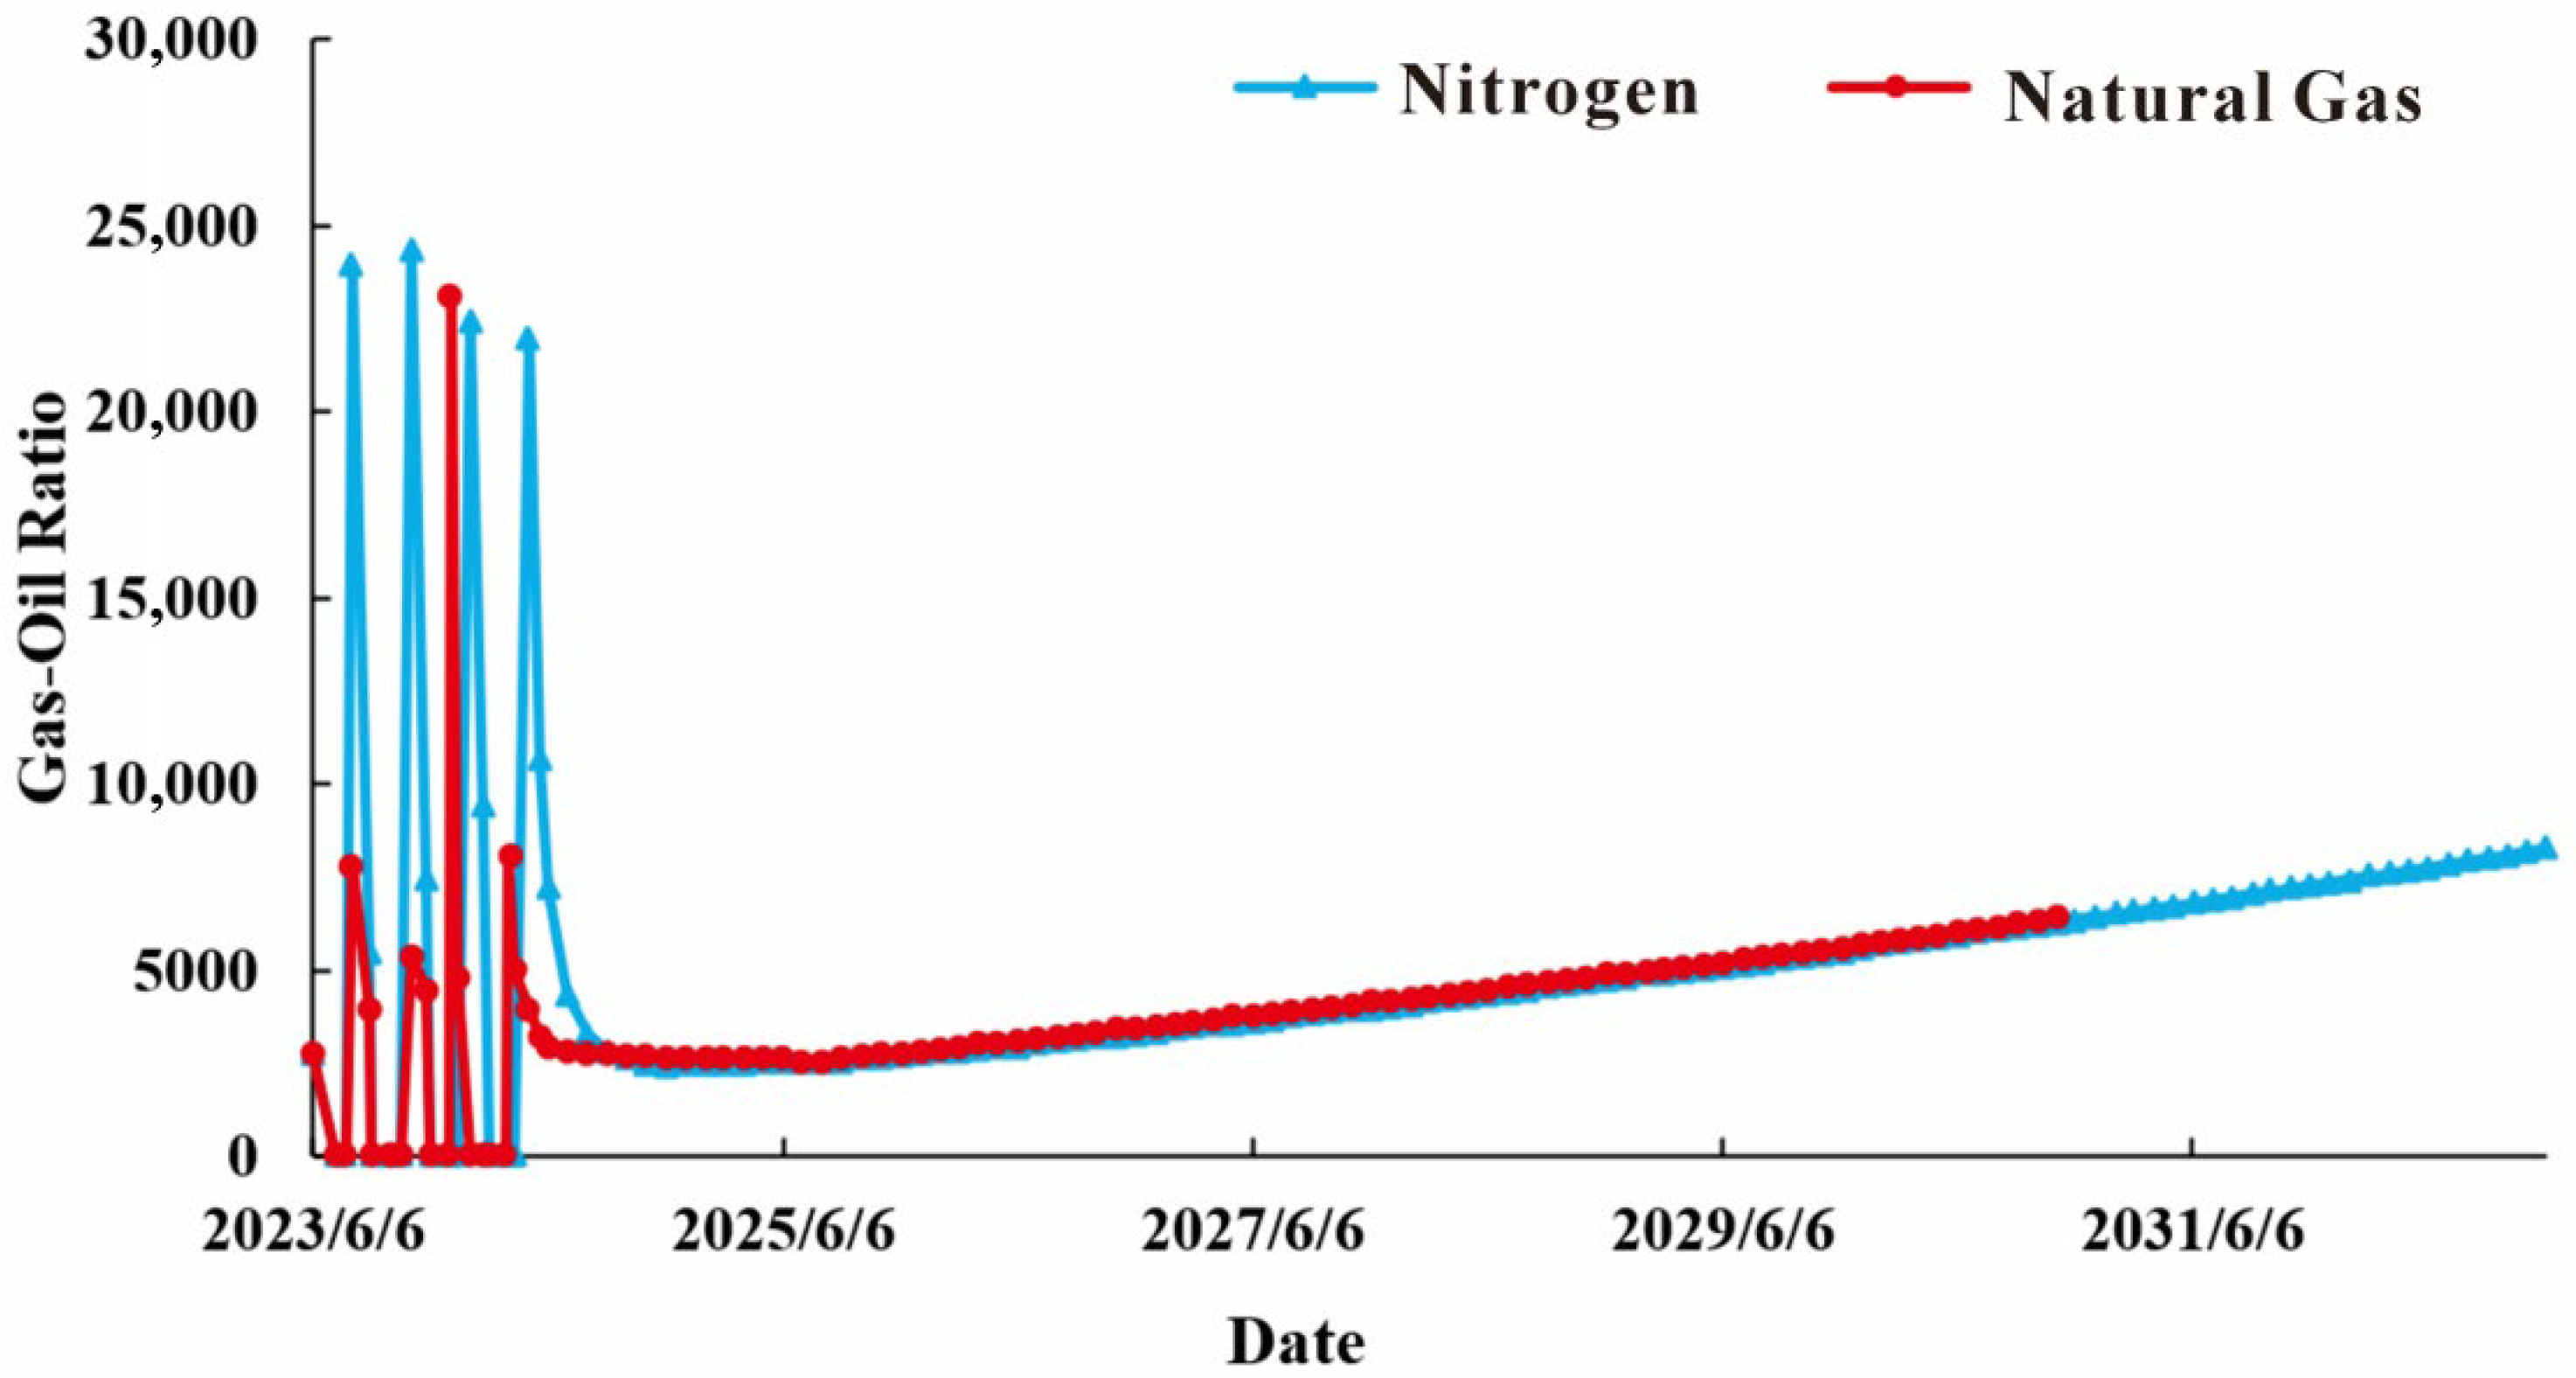
From the perspective of pressure changes (Figure 5), during the mid-to-late depletion phase, formation energy loss accelerates significantly—particularly after reaching the dew point pressure—with pronounced anti-condensation phenomena in the near-wellbore zone. This leads to oil and gas blockage, causing rapid decline in production capacity. Zhou Shengjie [42] found that in fractured-vuggy reservoirs, once reverse condensation occurs, the relative gas permeability does not decline as rapidly as in low-permeability sandstone reservoirs. Initiating gas injection huff-and-puff before reaching the dew point pressure during depleted production can effectively maintain condensate production. The injection of natural gas, water, or nitrogen replenishes formation energy, slowing pressure decline. Not only does it reduce the oil saturation near the wellbore, but it also increases the relative permeability of the gas phase near the wellbore, thereby enhancing the recovery rate of the condensate. Water exhibits the most significant pressure variation because it compensates for volume deficits caused by prior production, restoring formation pressure [43]. The pressure changes for natural gas and nitrogen are similar, with nitrogen exhibiting a slightly greater effect. Both gases replenish formation energy and reduce anti-condensation effects. The key difference lies in their solubility: natural gas dissolves extensively in crude oil, whereas nitrogen requires high pressure to dissolve in crude oil (Figure 6).
Figure 5.
Pressure variations between different injected media.
Figure 6.
Gas-to-oil ratio for different injected media.
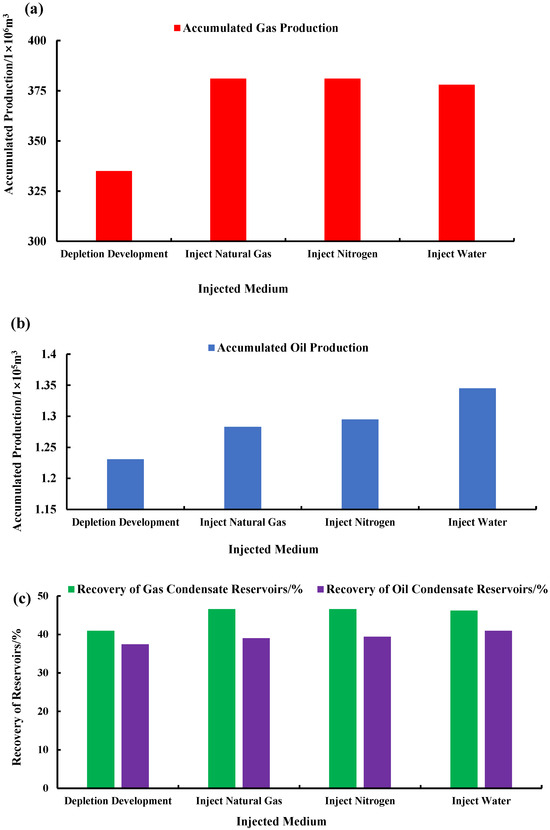
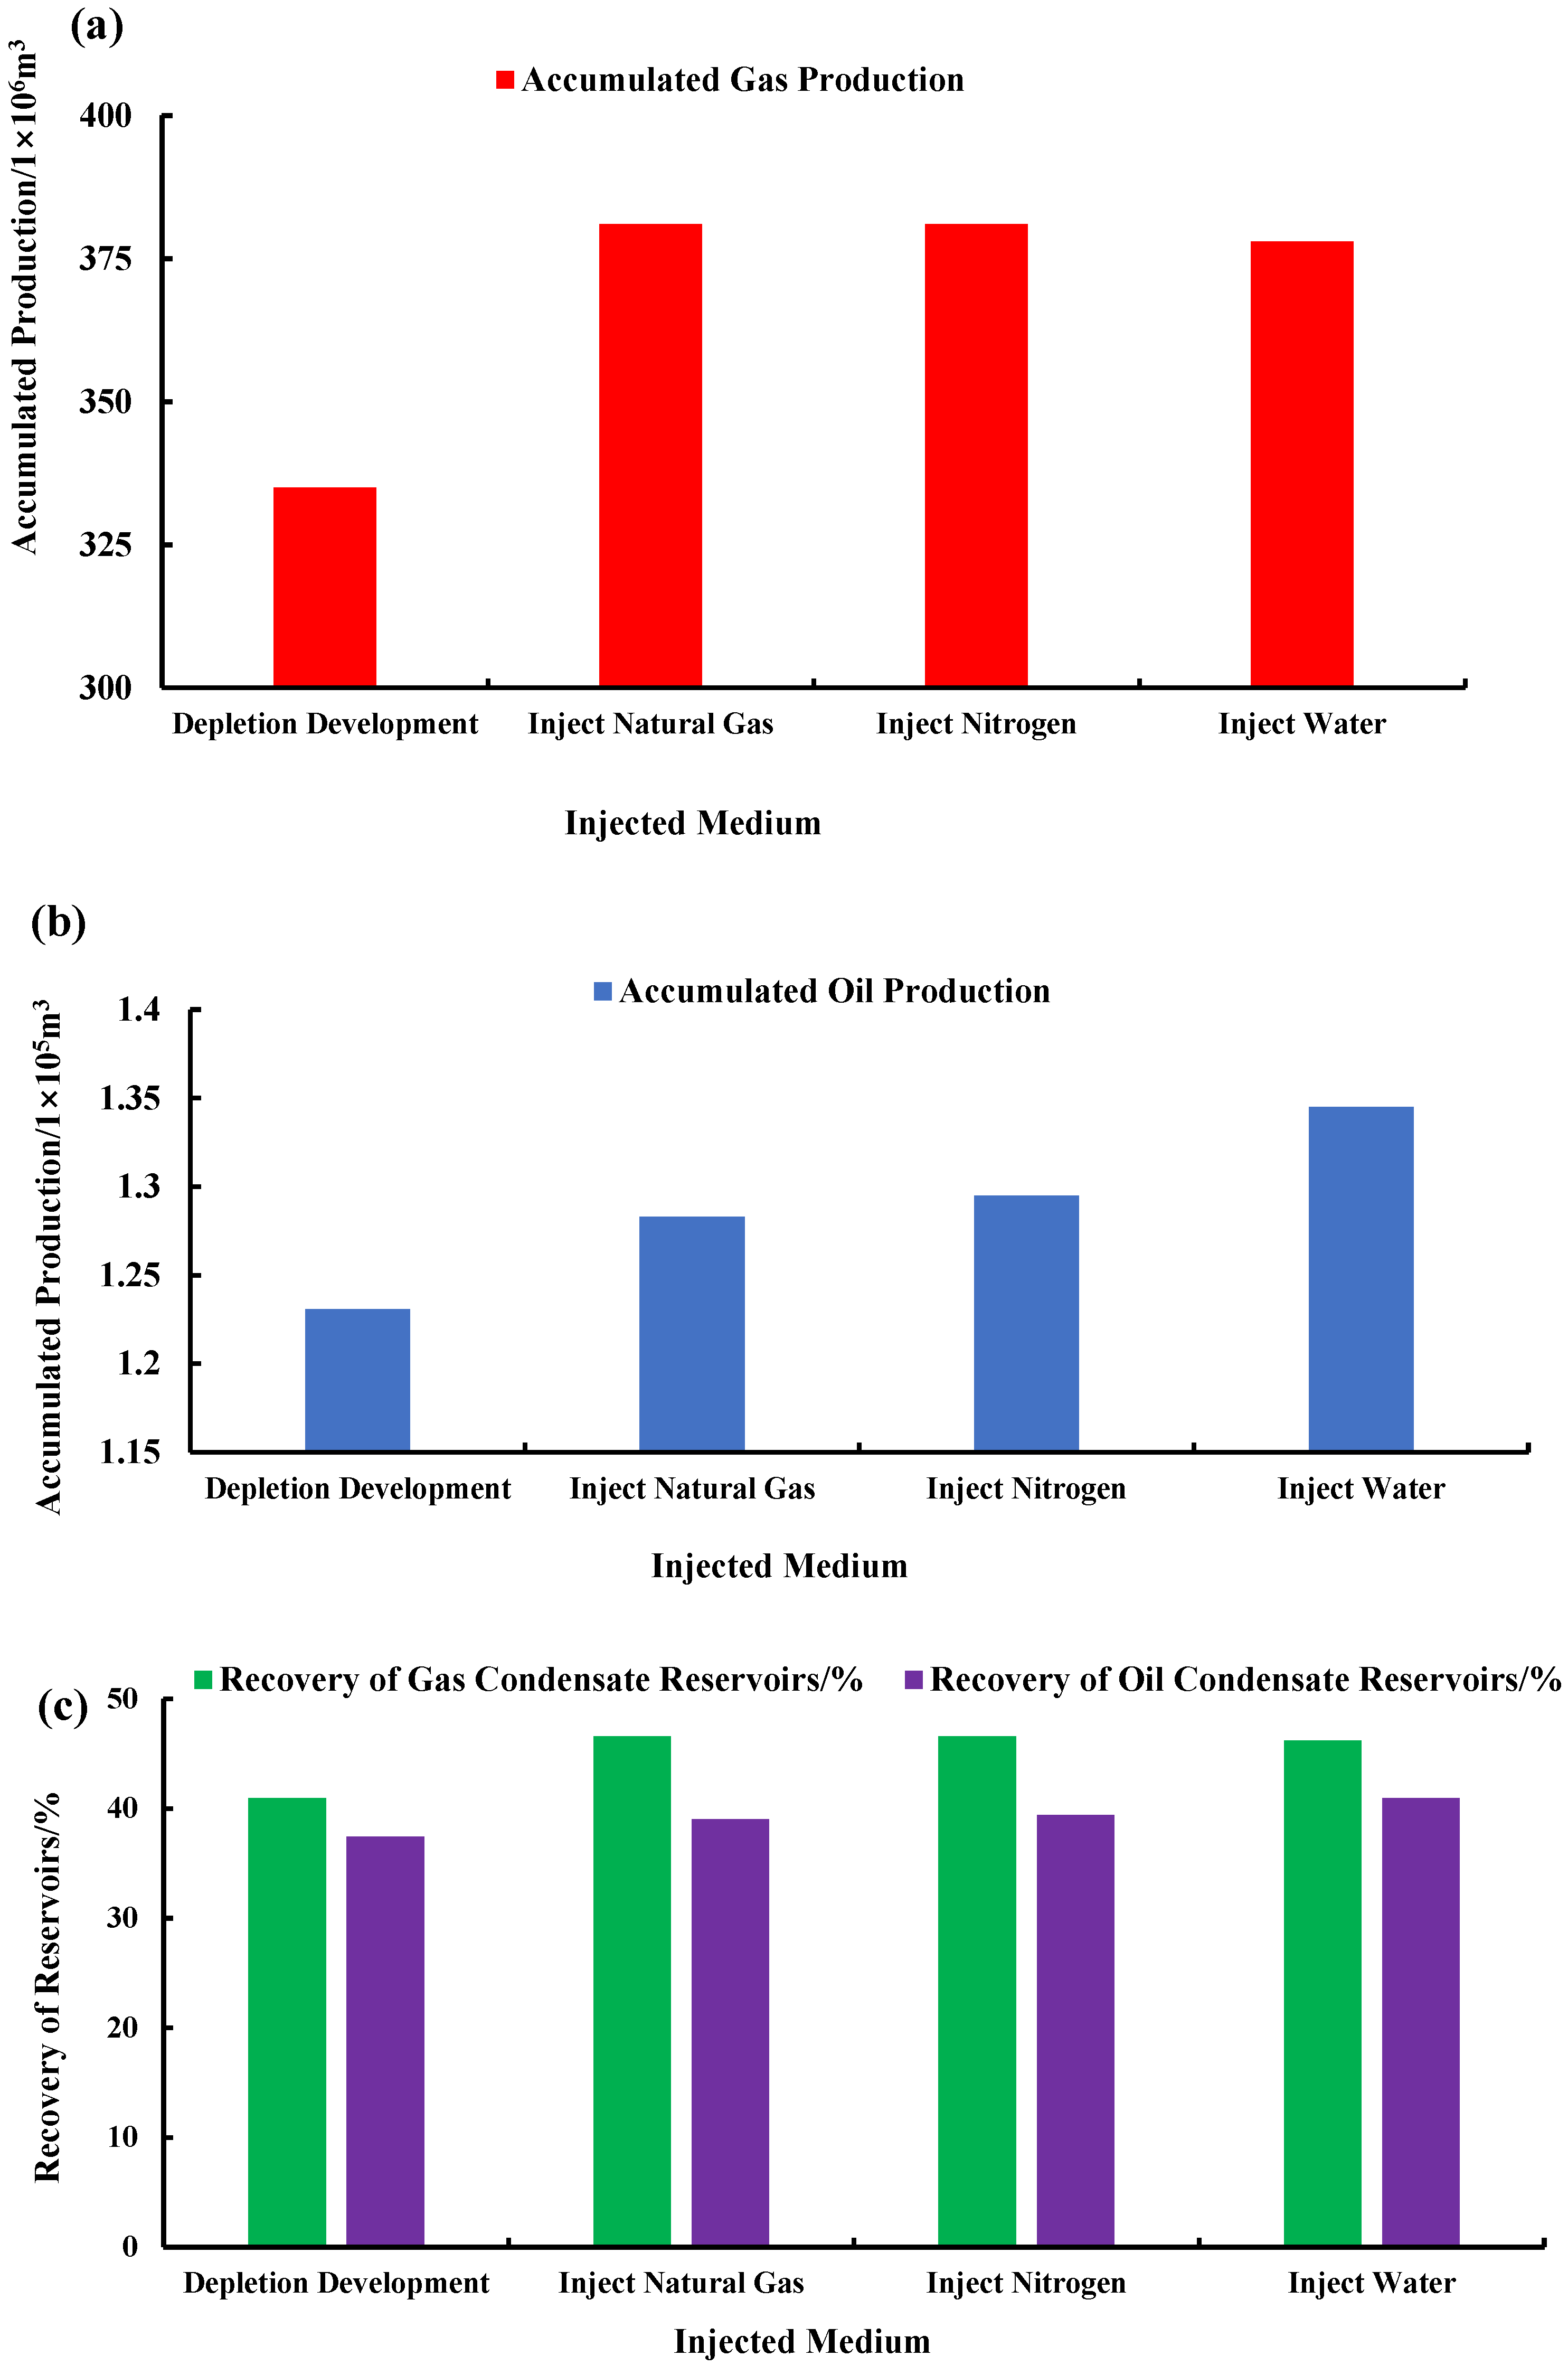
Comparing the condensate recovery rates (Figure 7) and cumulative oil production before the dew point pressure for three different injection media reveals that condensate recovery tends to increase with the injection of all three media. This is because as the media is injected, the formation energy is continuously restored, leading to a steady increase in oil production. Compared to natural gas, under identical injection volumes, nitrogen (N2) demonstrated the most effective throughput, achieving cumulative oil production of 12.95 × 10⁴ m3 and a condensate recovery rate of 39.41%. This is because nitrogen flooding is a non-miscible drive, allowing gravitational separation to function more completely. It is particularly suited for fractured-vuggy reservoirs, effectively extracting residual oil concentrated in the upper portions of the reservoir. Subsequent parameter adjustments will prioritize nitrogen as the optimal injection medium.
Figure 7.
Recovery performance of different injected media. (a) Cumulative gas production by different injected media; (b) cumulative oil production by different injected media; (c) recovery efficiency of different injected media (absolute points).
4.2. N2 Uptake Mechanism and Influencing Factors
4.2.1. Mechanism of Gas Injection Huff-and-Puff
Under reservoir conditions, nitrogen gas (N2) rarely forms a miscible phase with crude oil. Only a minimal fraction of N2 dissolves under high pressure, so it predominantly remains gaseous after injection. Its primary effects are replenishing formation energy and enhancing gravity-driven separation. The vast majority of injected N2 remains undissolved. Due to density differences, N2 gradually displaces crude oil and gas from the reservoir top, forming a gas cap. As injection volume increases, internal pressure rises continuously. This suppresses reverse condensation, alleviates condensate blockage in the wellbore, and provides driving energy for subsequent oil and gas recovery, thereby enhancing recovery rates.
4.2.2. Influencing Factors
Injection Intensity and Injection Huff-and-Puff Rounds
The solubility of N2 in crude oil is extremely low. Therefore, the intensity of a single injected round directly influences the rate of reservoir energy replenishment—that is, the accumulation of N2 at the wellbore bottom. Excessive injection intensity may cause gas migration, while insufficient intensity may result in inadequate energy replenishment per round. Due to nitrogen’s extremely low solubility, the number of injected rounds only affects single-round oil and gas production rates and contributes to the ultimate recovery rate. Therefore, these aspects are discussed collectively.
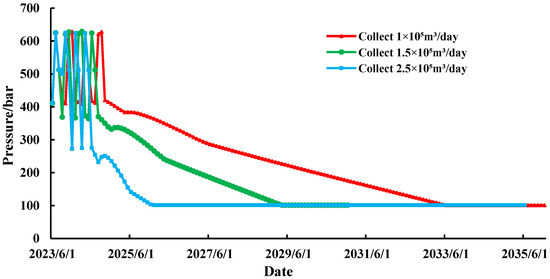
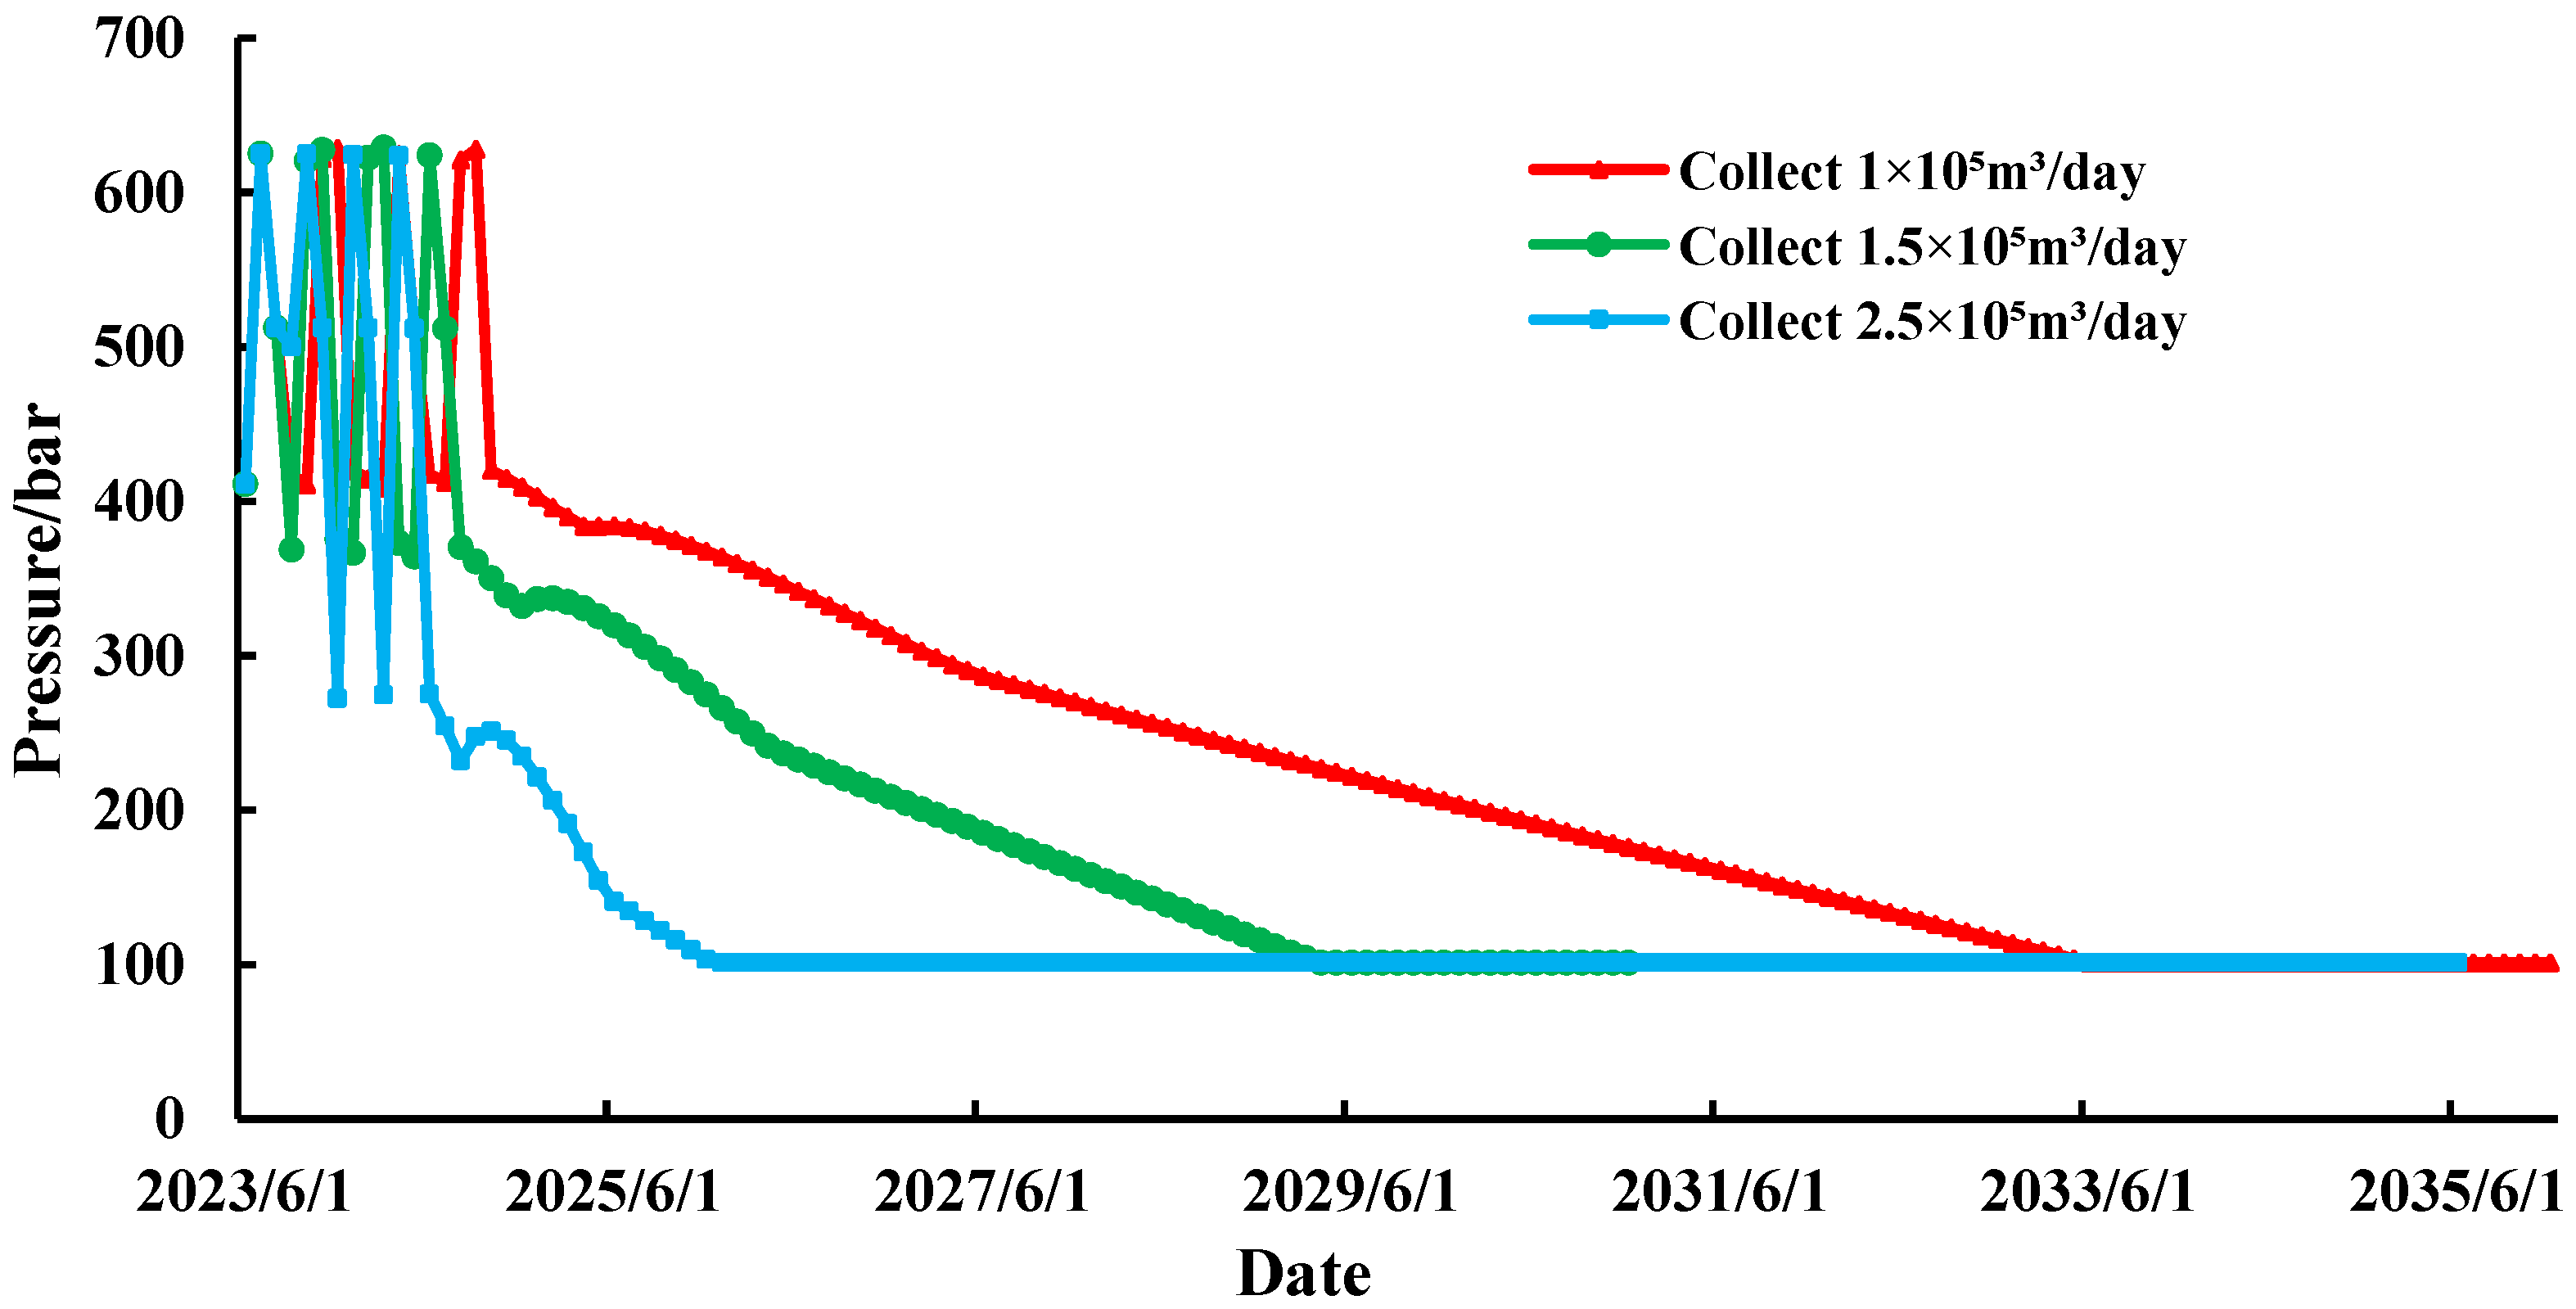
Injection intensity is defined as the daily injection volume per well, which is the injection rate. In the software, modify the injection rate and injection round timing of the established numerical model to ensure consistent injection volume per round. Set parameters such as the injection–production ratio, well-holding time, gas production round duration, gas production round rate, and other parameters to be consistent. With the total N2 injection volume set to 28.8 million m3, injection rates of 100,000 m3/day, 150,000 m3/day, and 200,000 m3/day were configured. Production ceases when pressure reaches 20.2 MPa, indicating a decommissioned state.
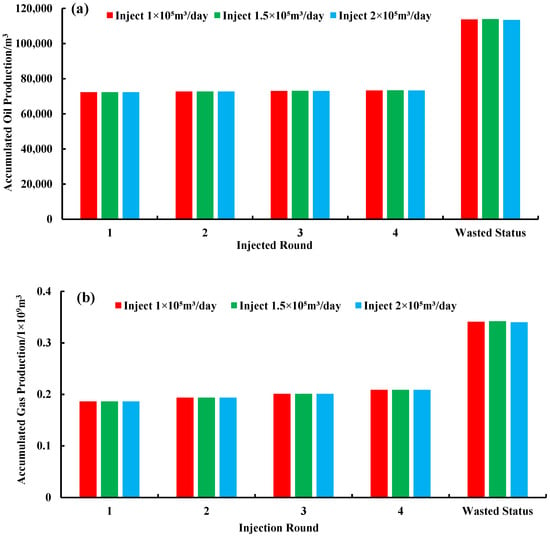
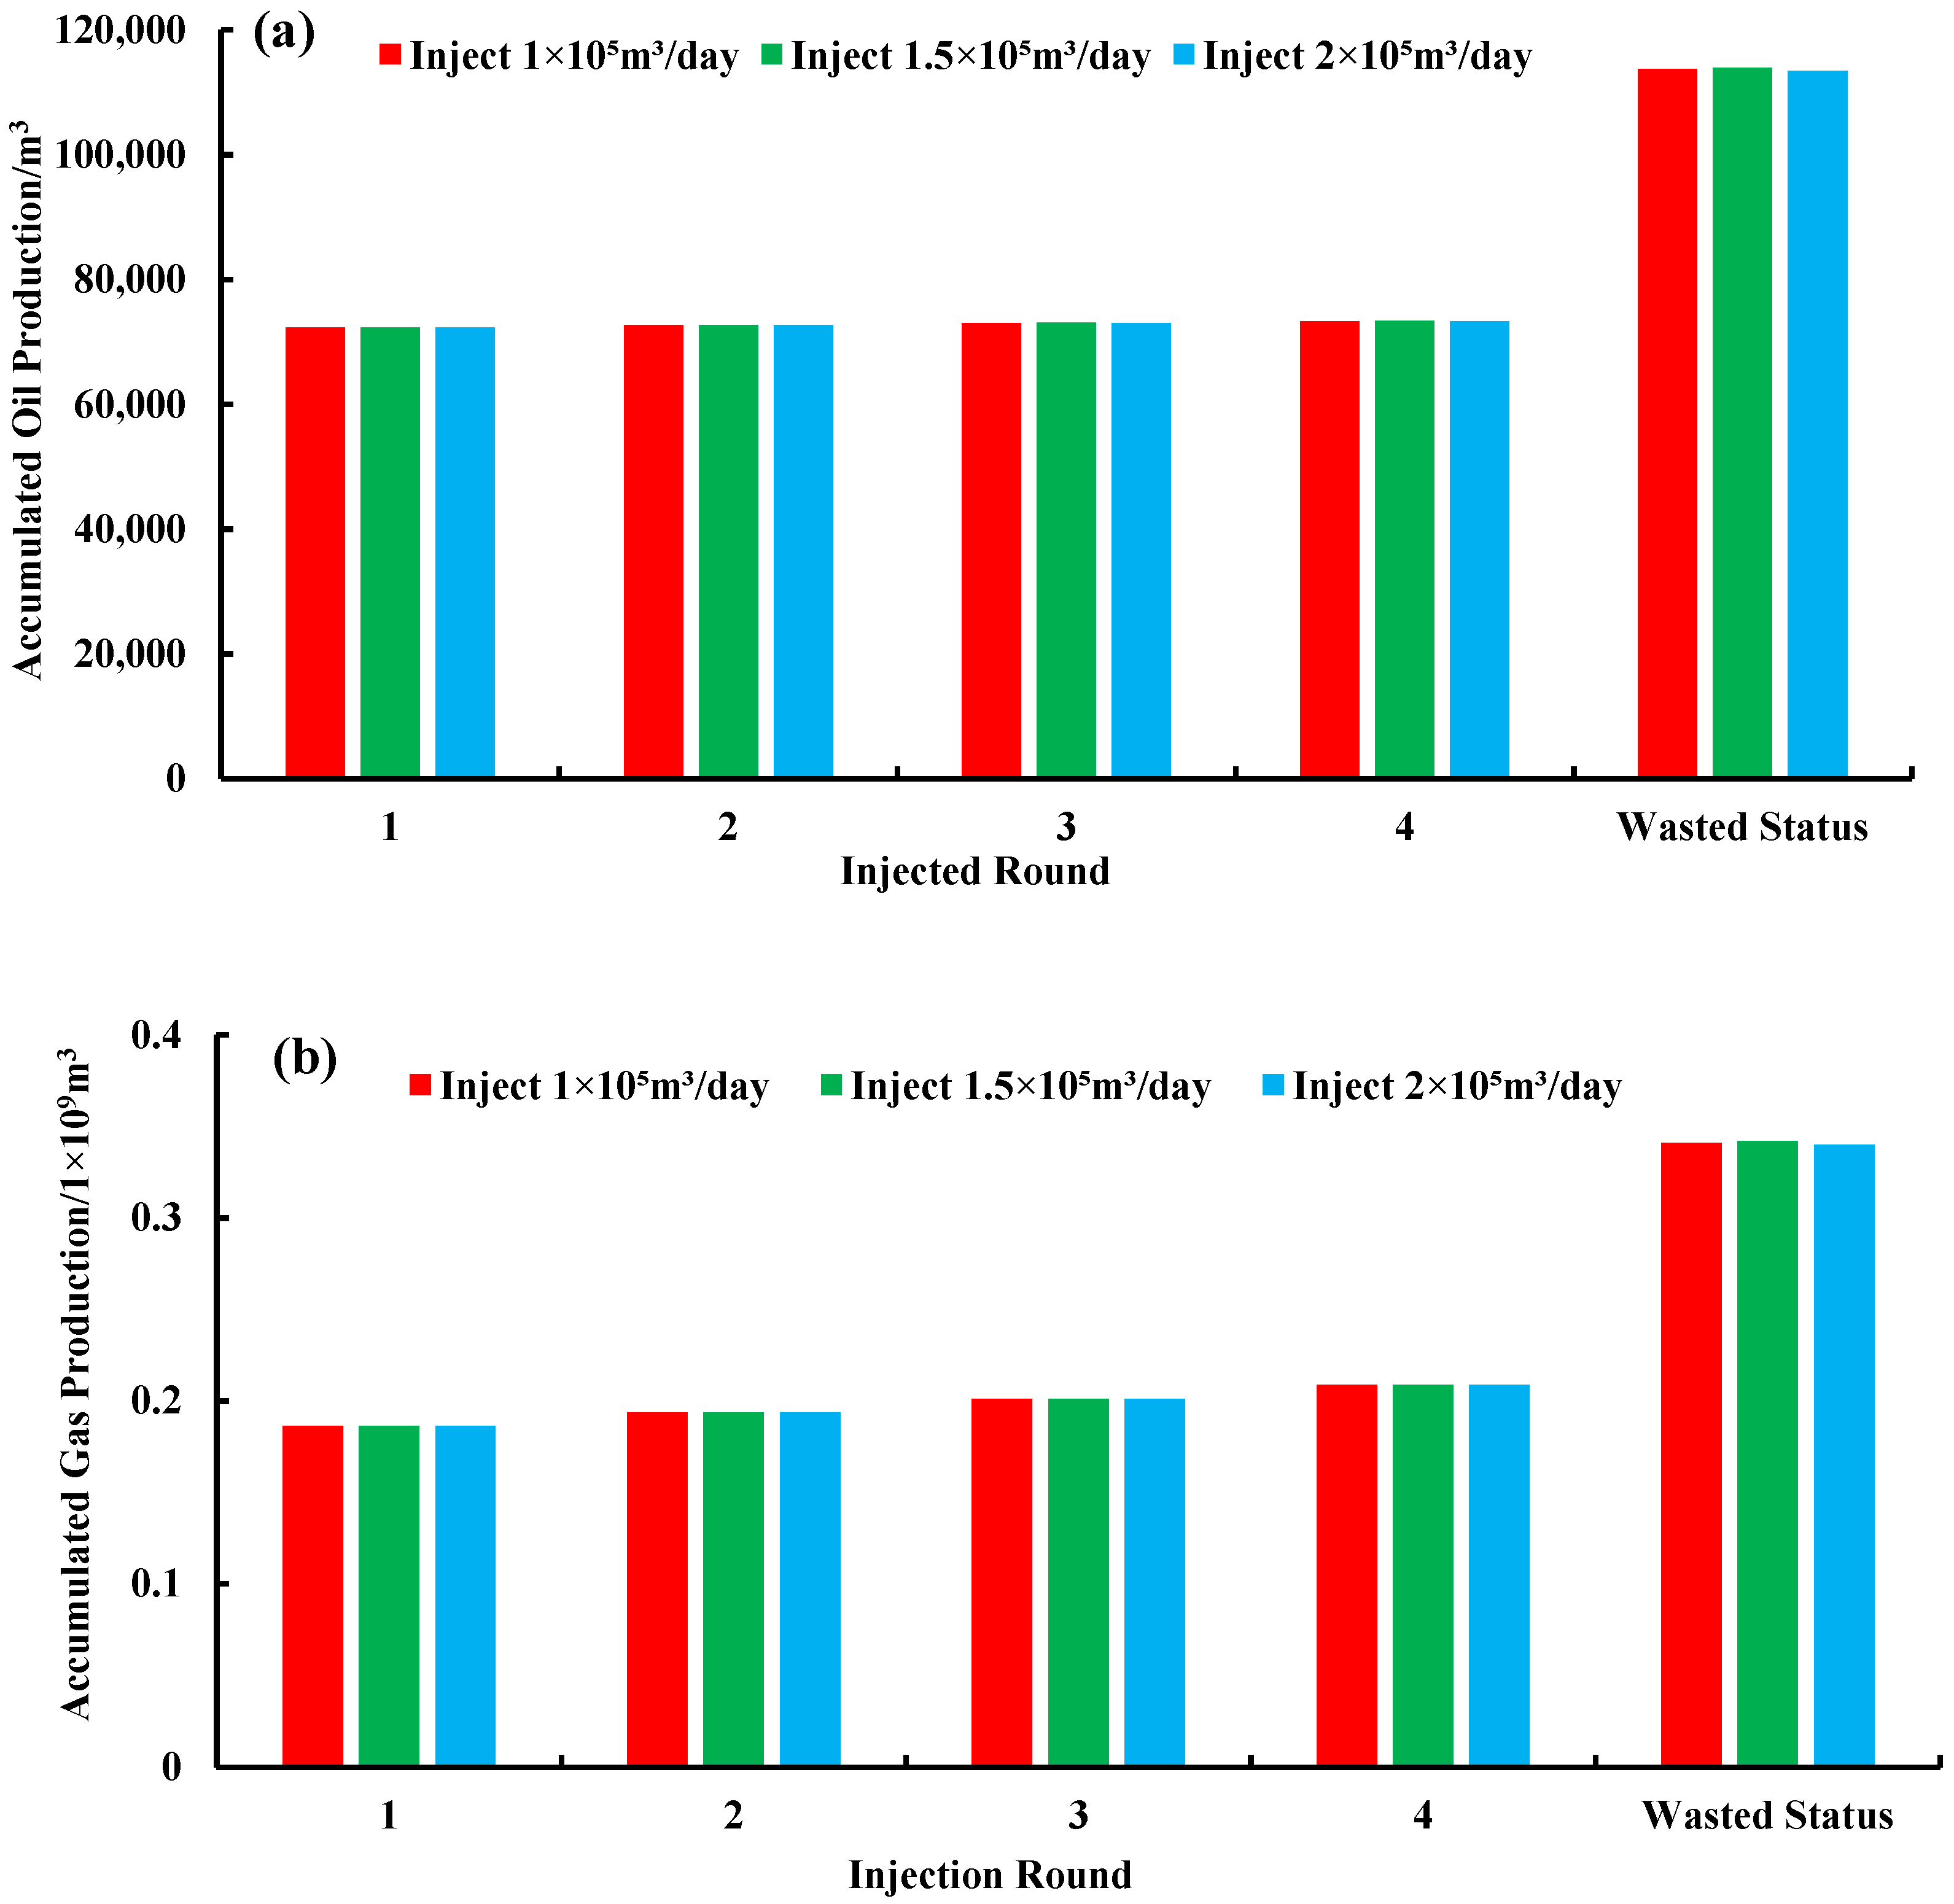
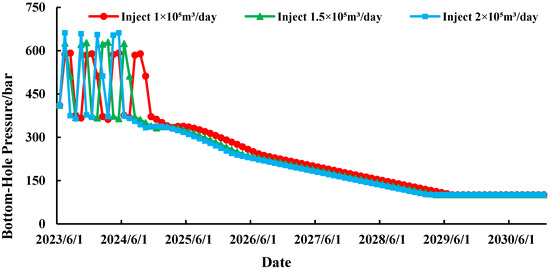
Different injection rates with identical well-holding times result in varying response times for injected gas. After simulation, cumulative oil and gas production volumes across injected rounds were compared under three injection rates (Figure 8). It can be observed that the differences in cumulative oil and gas production across rounds under different injection rates are not significant, with the maximum cumulative oil production difference being only 40 m3. Figure 9 also shows that the bottomhole pressure changes are relatively stable at an injection rate of 100,000 m3/d, while the pressure depletion rate after production decline is fastest at the 200,000 m3/d injection rate. The condensate recovery rate and incremental condensate recovery rate were highest at an injection rate of 150,000 m3/d, reaching 34.65655% and 12.33112%, respectively (Table 5). Overall, the injection rate of 150,000 m3/d demonstrated the most effective gas injection huff-and-puff performance.
Figure 8.
Production per round at different injected rates. (a) Cumulative oil production; (b) cumulative gas production.
Figure 9.
Bottomhole pressure at different injected rates.
Table 5.
Condensate recovery rate (%) and incremental condensate recovery rate (%) for different rounds (absolute points).
Production Rate
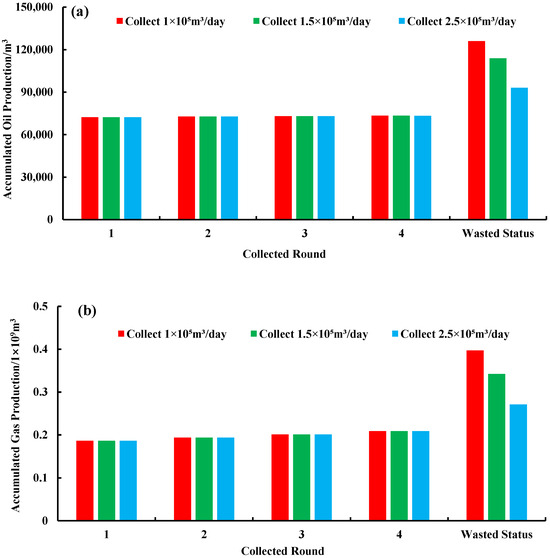
Under the optimized gas injection rate of 150,000 m3/d, gas production rates of 100,000 m3/d, 150,000 m3/d, and 250,000 m3/d were set, respectively. Development proceeded with N2 injection followed by depletion. During a single gas injection huff-and-puff, excessively high production rates can cause rapid decline in later production capacity, undermining stable and safe operations. Higher production rates result in lower terminal oil production. Conversely, excessively low production rates prevent the reinjection of N2 from fully restoring reservoir energy, leading to gas accumulation or even cone penetration that damages the reservoir (Figure 10).
Figure 10.
Production per round at different production rates. (a) Cumulative oil production. (b) Cumulative gas production.
As shown in Figure 11, cumulative oil and gas production per round increases with rising gas production rates. However, higher production rates lead to lower later-stage production, greater corresponding changes in bottomhole pressure, and faster pressure decline once depletion begins. At a production rate of 100,000 m3/day, the cumulative oil and gas production per round at abandonment exceeded those at 150,000 m3/day and 250,000 m3/day by 12,158 m3, 32,950 m3, and 55 million m3 and 126 million m3, respectively. Bottomhole pressure also remained more stable, generally maintaining above dew point pressure to ensure safe and stable production. Table 6 further corroborates this finding: as gas production rates increase, cumulative oil production, cumulative gas production, and the condensate recovery rate all decrease. At a production rate of 100,000 cubic meters per day, the condensate recovery rate also peaks at 38.36%. Overall, a single-round production rate of 100,000 cubic meters per day is optimal.
Figure 11.
Bottomhole pressure at different drilling speeds.
Table 6.
Condensate recovery rate at different extraction speeds for each round (absolute points).
Injected Volume
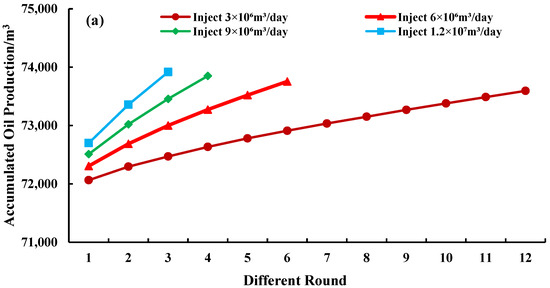
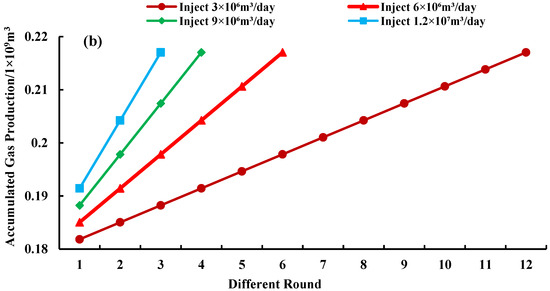
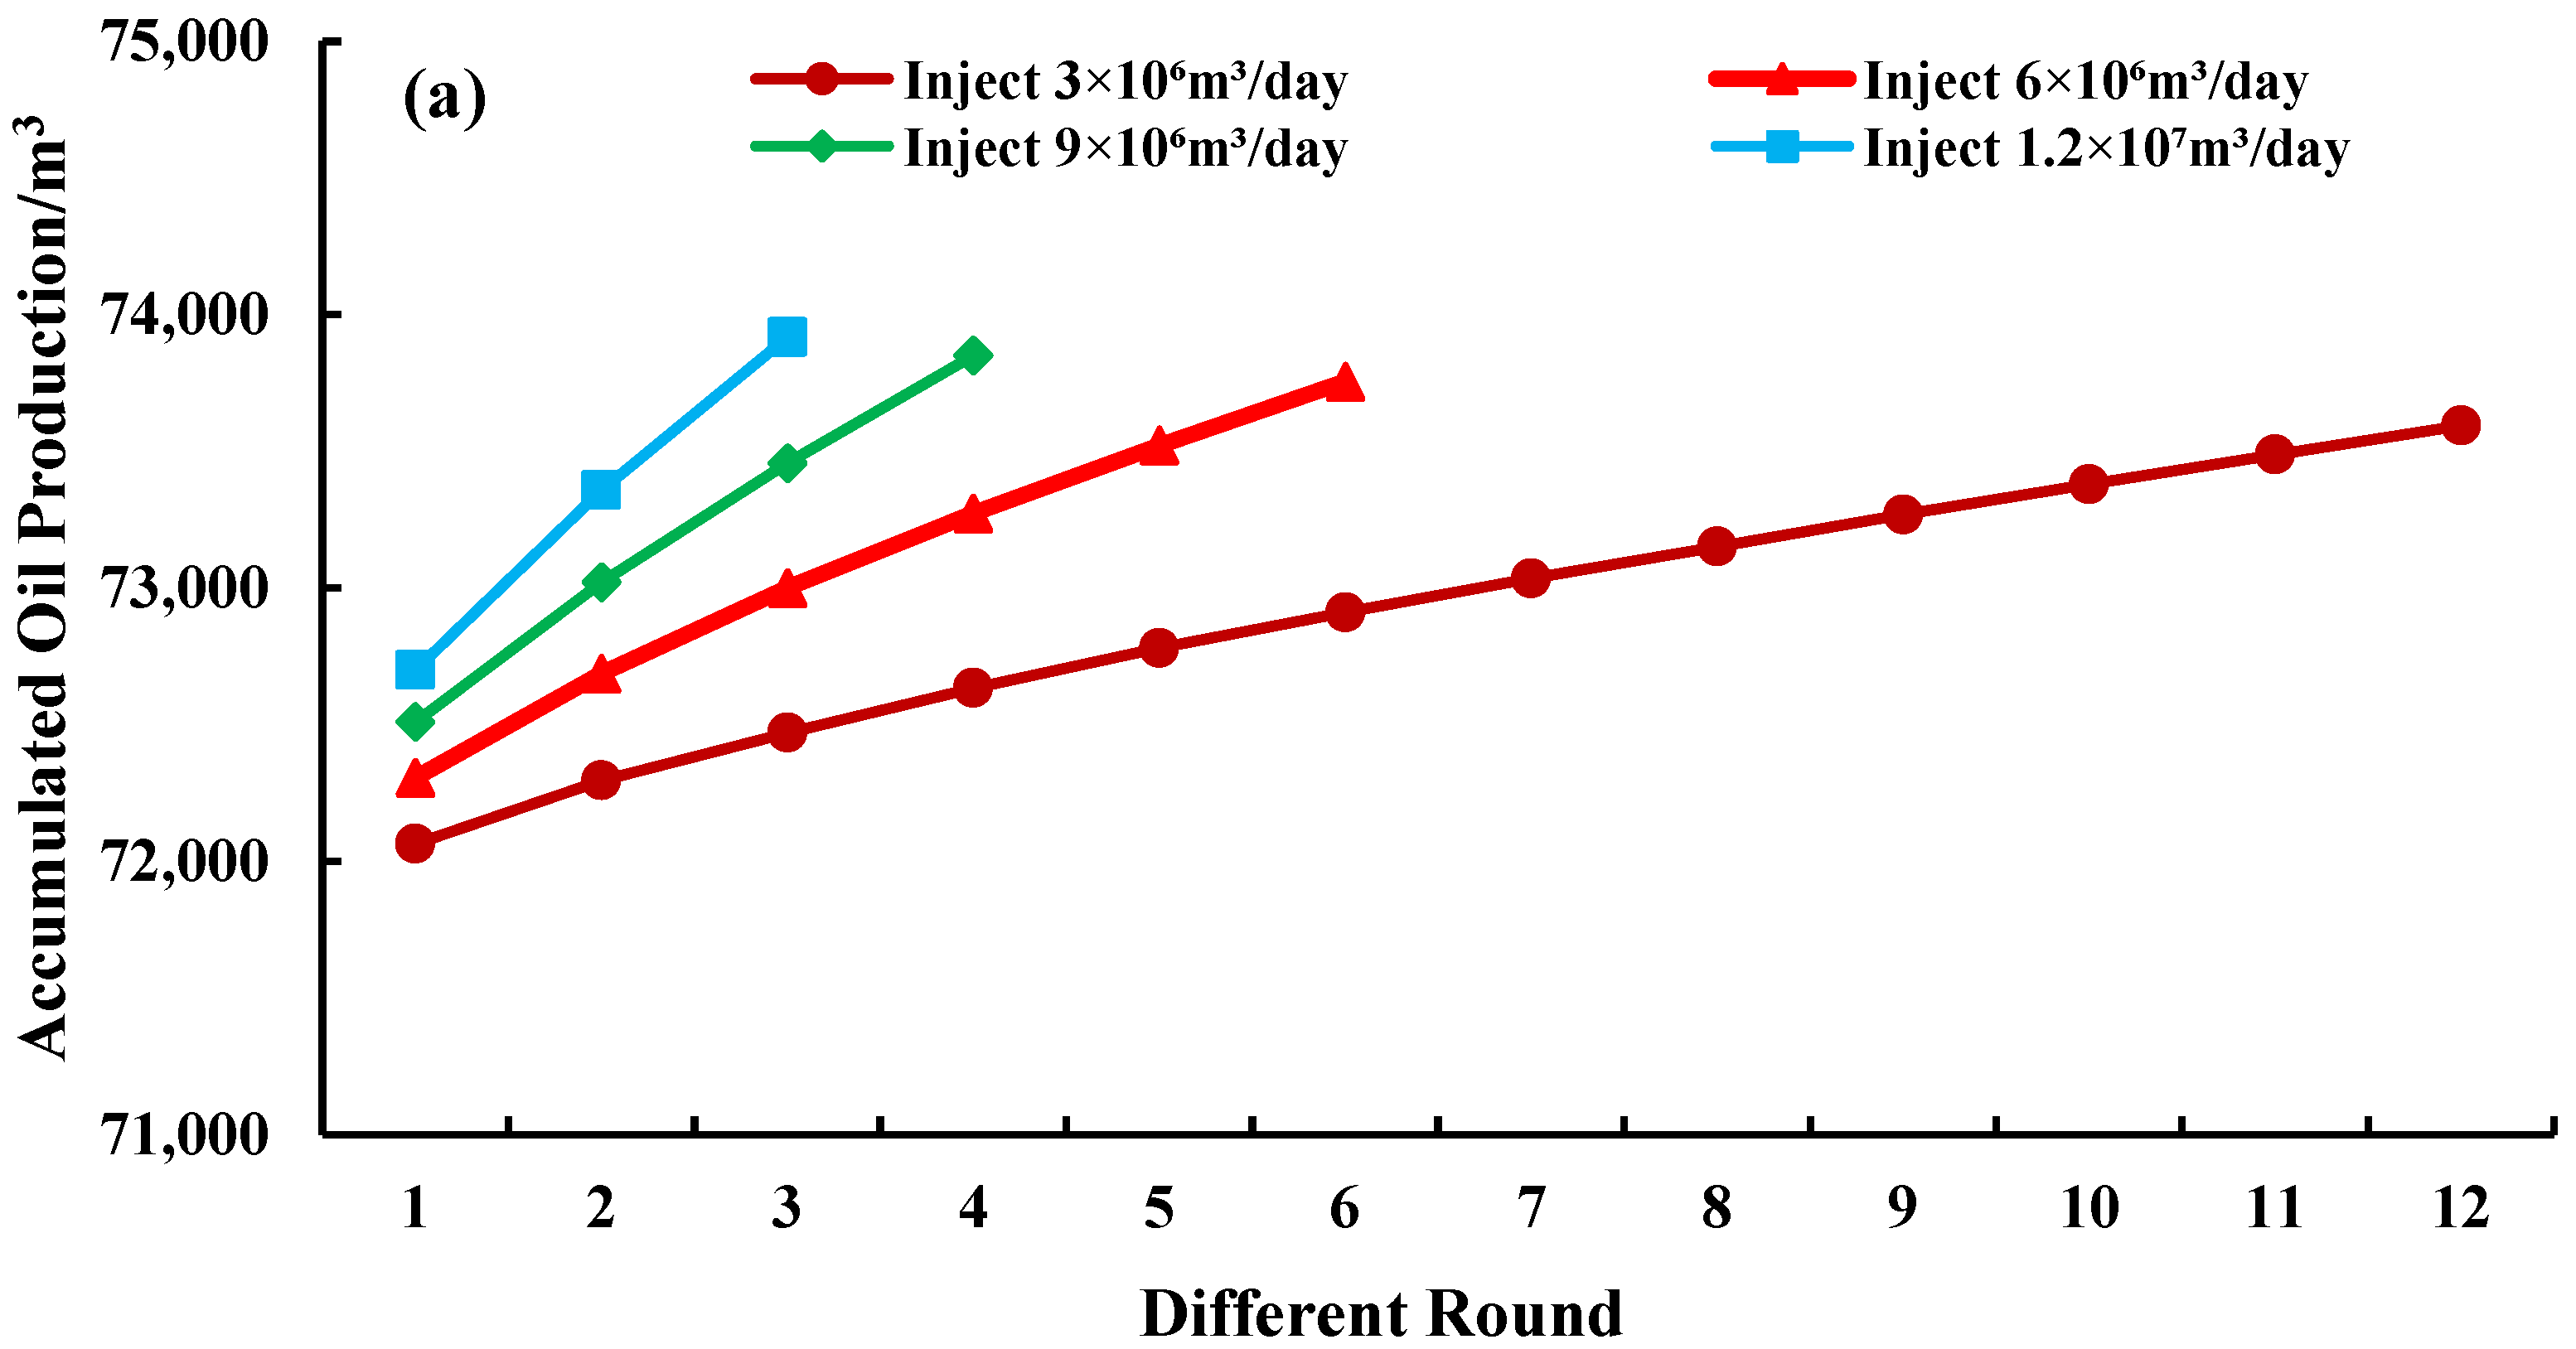
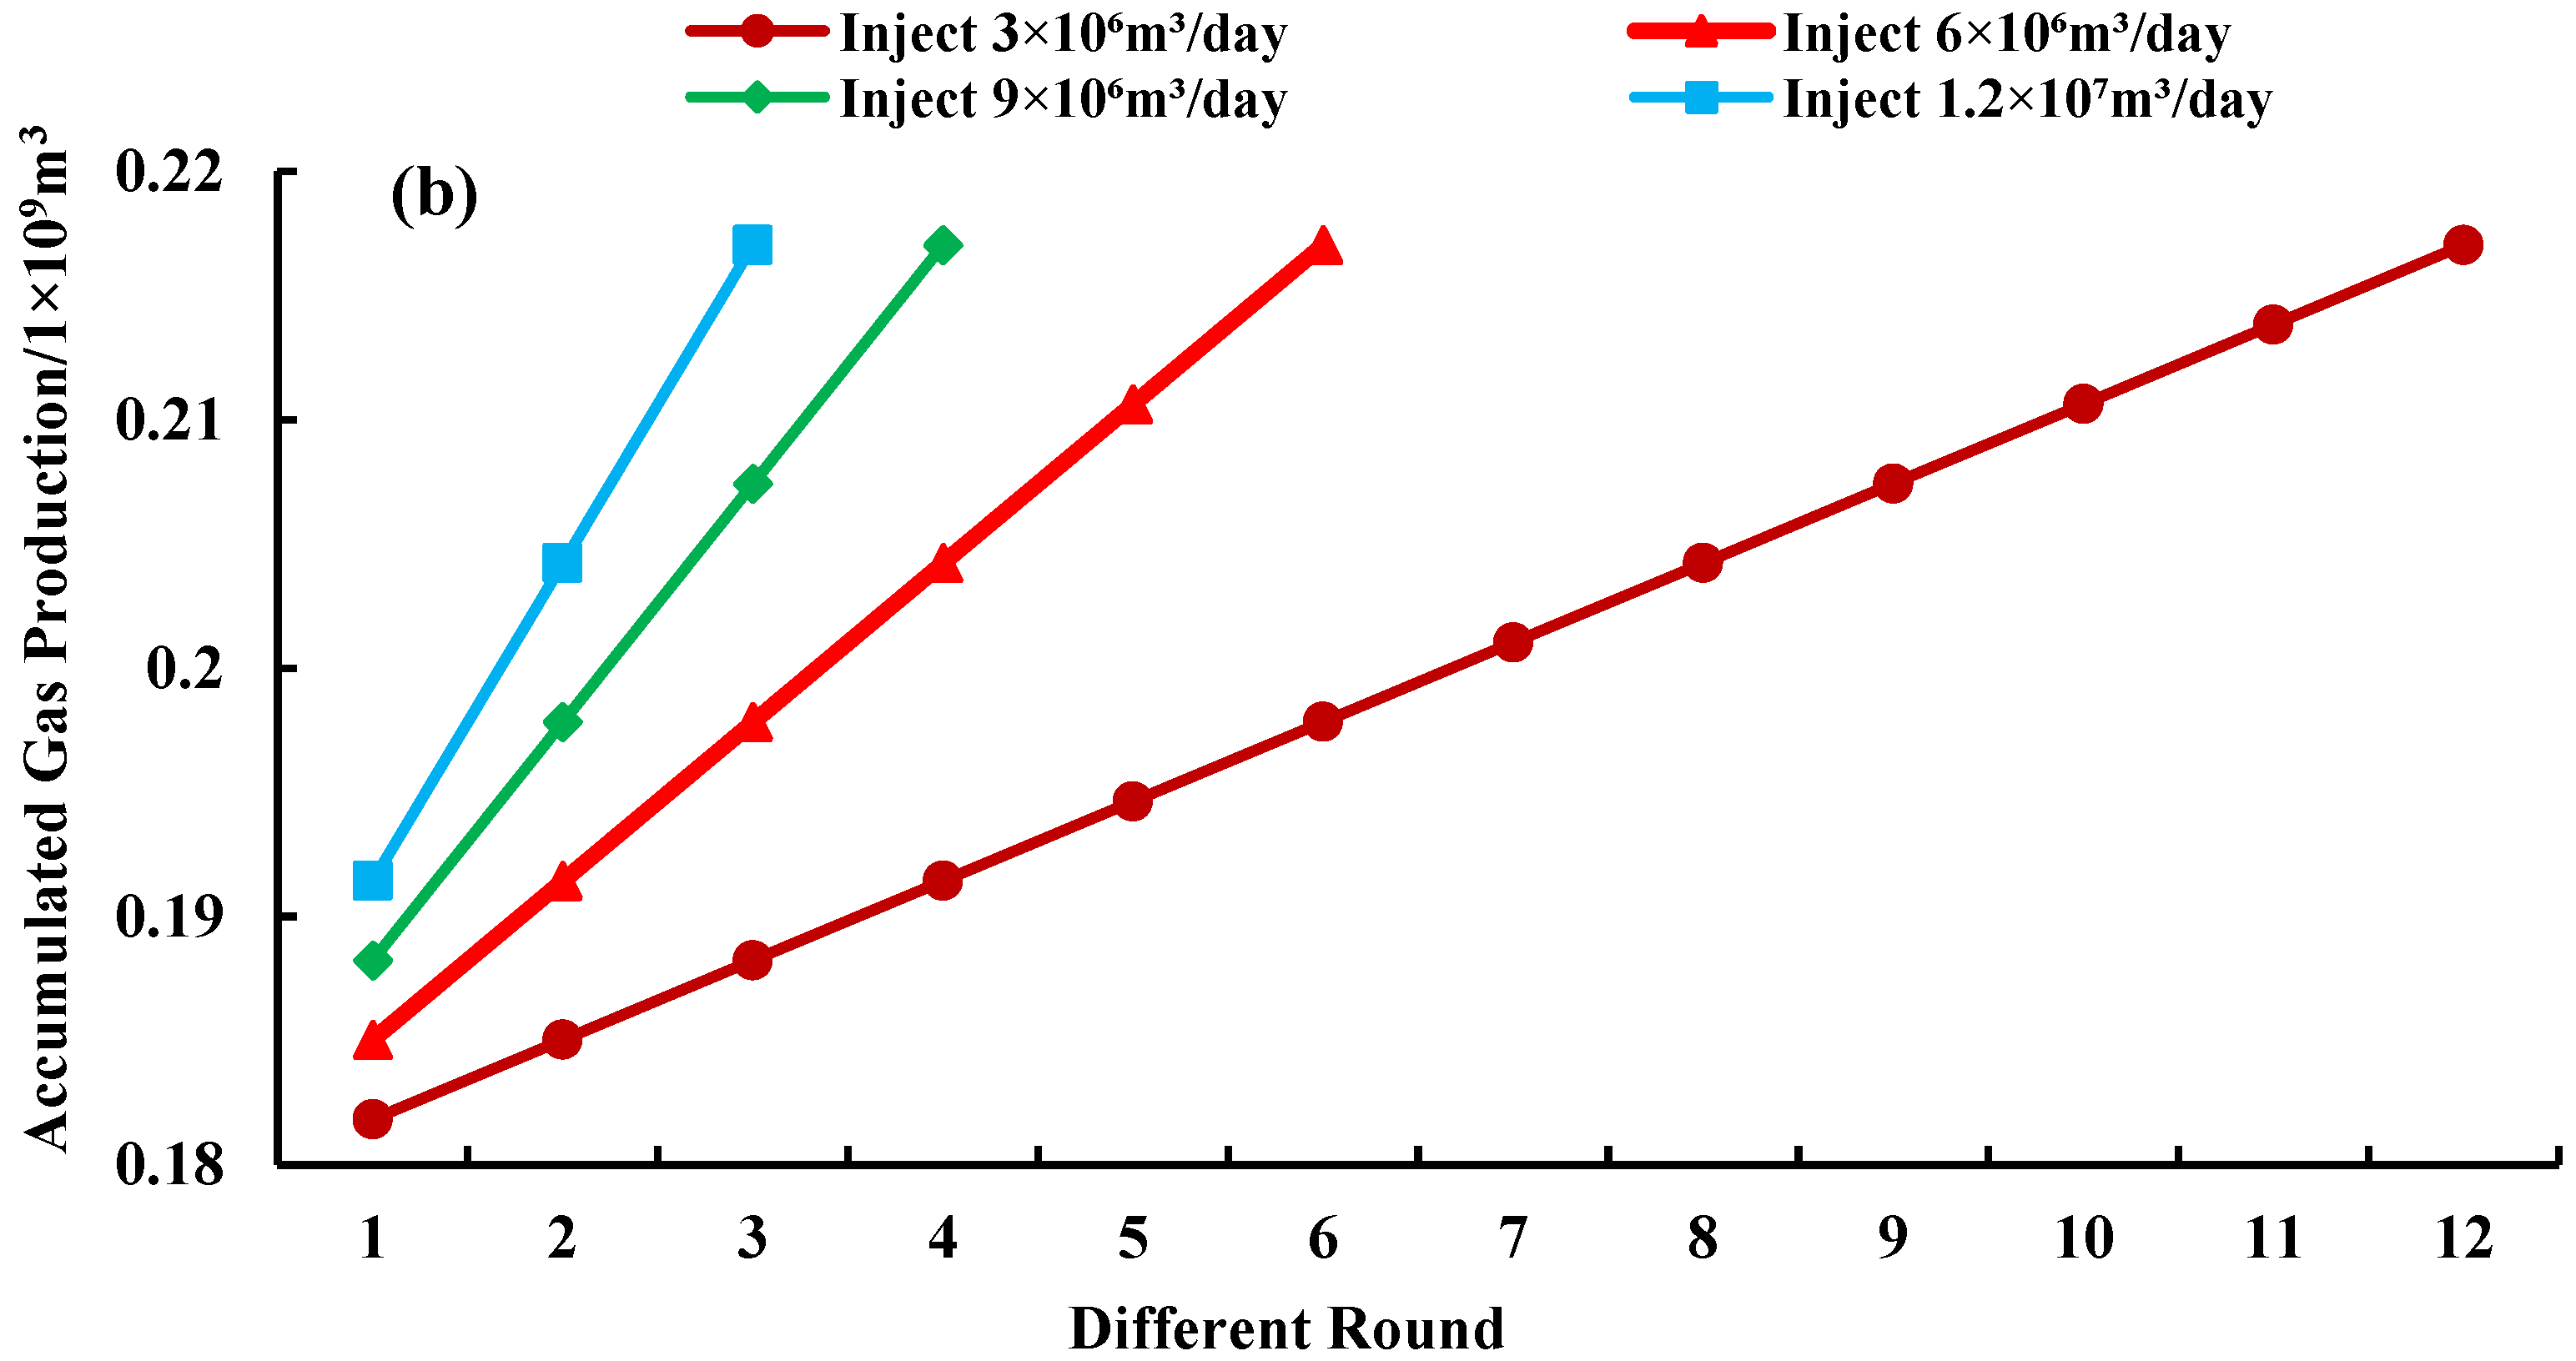
After screening the optimal injection medium and injection rate, the optimal injection volume is further optimized while maintaining the optimal injection rate. By varying the injected round duration, the single-round injection volume differs, while the cumulative injection volume remains constant. The injection volumes are set as follows: 3 × 10⁶ m3, 6 million m3, 9 million m3, and 12 million m3 per round. Fundamentally, single-well N2 throughput is achieved by leveraging N2 to replenish formation pressure, reduce condensate viscosity, mitigate anti-condensate damage, and integrate multi-round gas injection [44]. Excessive injection volumes may trigger gas migration and excessive gas accumulation, leading to cone penetration and increased production costs, or they may even cause production accidents. Conversely, insufficient single-round injection volumes fail to adequately replenish formation energy and suppress anti-condensation phenomena, ultimately preventing optimal recovery rates (Figure 12).
Figure 12.
Cumulative oil and gas production under different injected volumes: (a) oil production; (b) gas production.
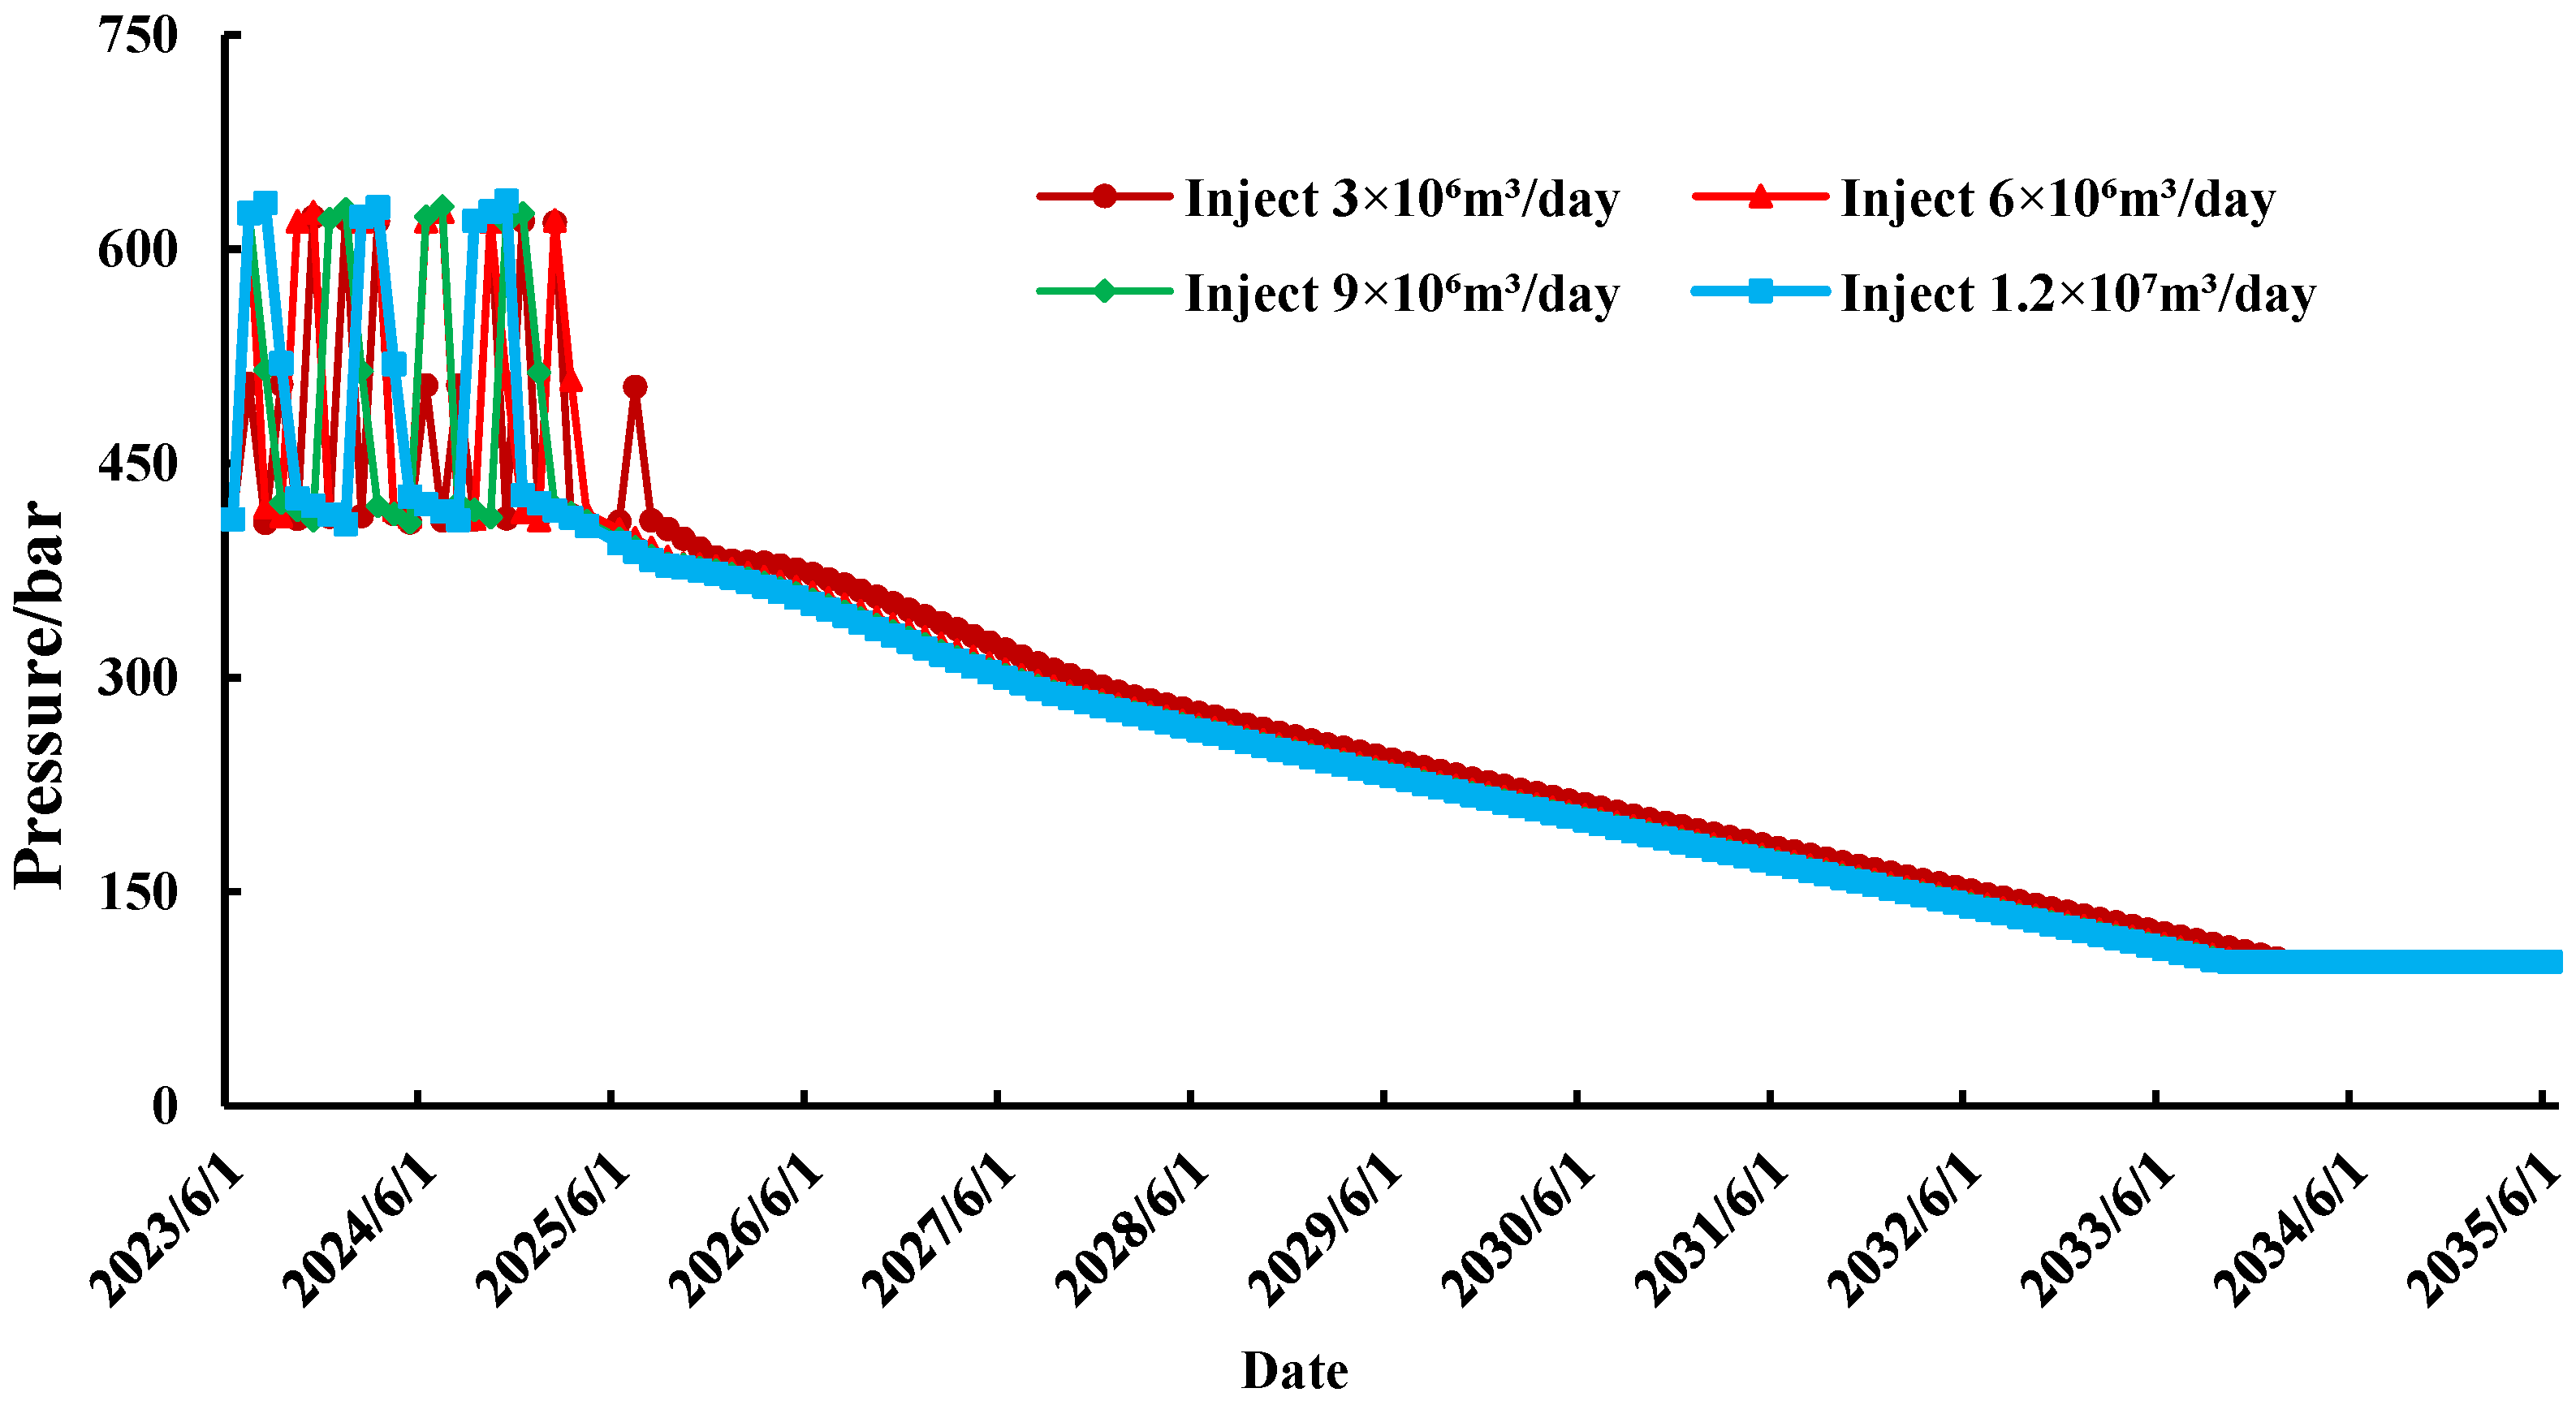
As shown in Figure 12, excluding the final production at abandonment, both oil and gas production per injected round increased with the number of injected rounds across the four different injection volumes. The impact of individual injection volumes on single-round oil and gas production was negligible. It appears that higher injection volumes correlate with higher recovery rates. However, the range of bottomhole pressure variations (Figure 13) remains nearly identical across injection levels, and the maximum difference in condensate recovery at abandonment is only 0.08%. Table 7 reveals that larger single-round injected volumes actually reduce oil production at the final abandonment round, which is the depletion round. After depletion begins, higher injection volumes accelerate pressure depletion. For cumulative oil production curves with identical injection volumes, the slope markedly decreases in later injected rounds. This indicates that despite the same injection volume, the incremental cumulative oil production declines in later rounds. This occurs because increased injection volume leads to excessive accumulated gas at the wellbore bottom, causing gas to disperse into other formations and reducing reservoir drive efficiency; on the other hand, gas injection and production deplete the reservoir’s drivable oil content.
Figure 13.
Pressure at different injected volumes.
Table 7.
Cumulative oil and gas production at abandonment (20.2 MPa) for different injected volumes.
As shown in Figure 12, under identical total injection volumes, a single-round injection rate of 3 million m3 yields 211 m3 more cumulative oil production and 200,000 m3 more cumulative gas production than a 6 million m3 injection rate. This occurs because a smaller single-round injection rate allows for more injected rounds within the same total volume, indicating that an appropriate injection rate can sustain a longer stable production period. Overall, a single-round injection volume of 3 million m3 yields the most effective throughput per well.
Soaking Time
The soaking time refers to the interval between ceasing injection and closing the well after nitrogen injection into the production well and resuming production. Based on the aforementioned optimal conditions, soaking times of 5 days, 10 days, 15 days, and 20 days were set. A reasonable well-sealing period facilitates thorough contact and dissolution of N2 with the formation of crude oil to form stable foamed oil flow. It also allows sufficient time for undissolved N2 to diffuse to the reservoir top, forming a gas cap and expanding the sweep range, thereby enhancing recovery rates.
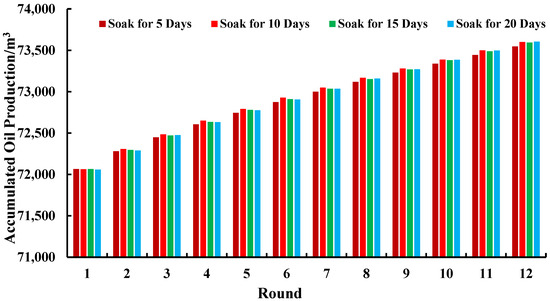
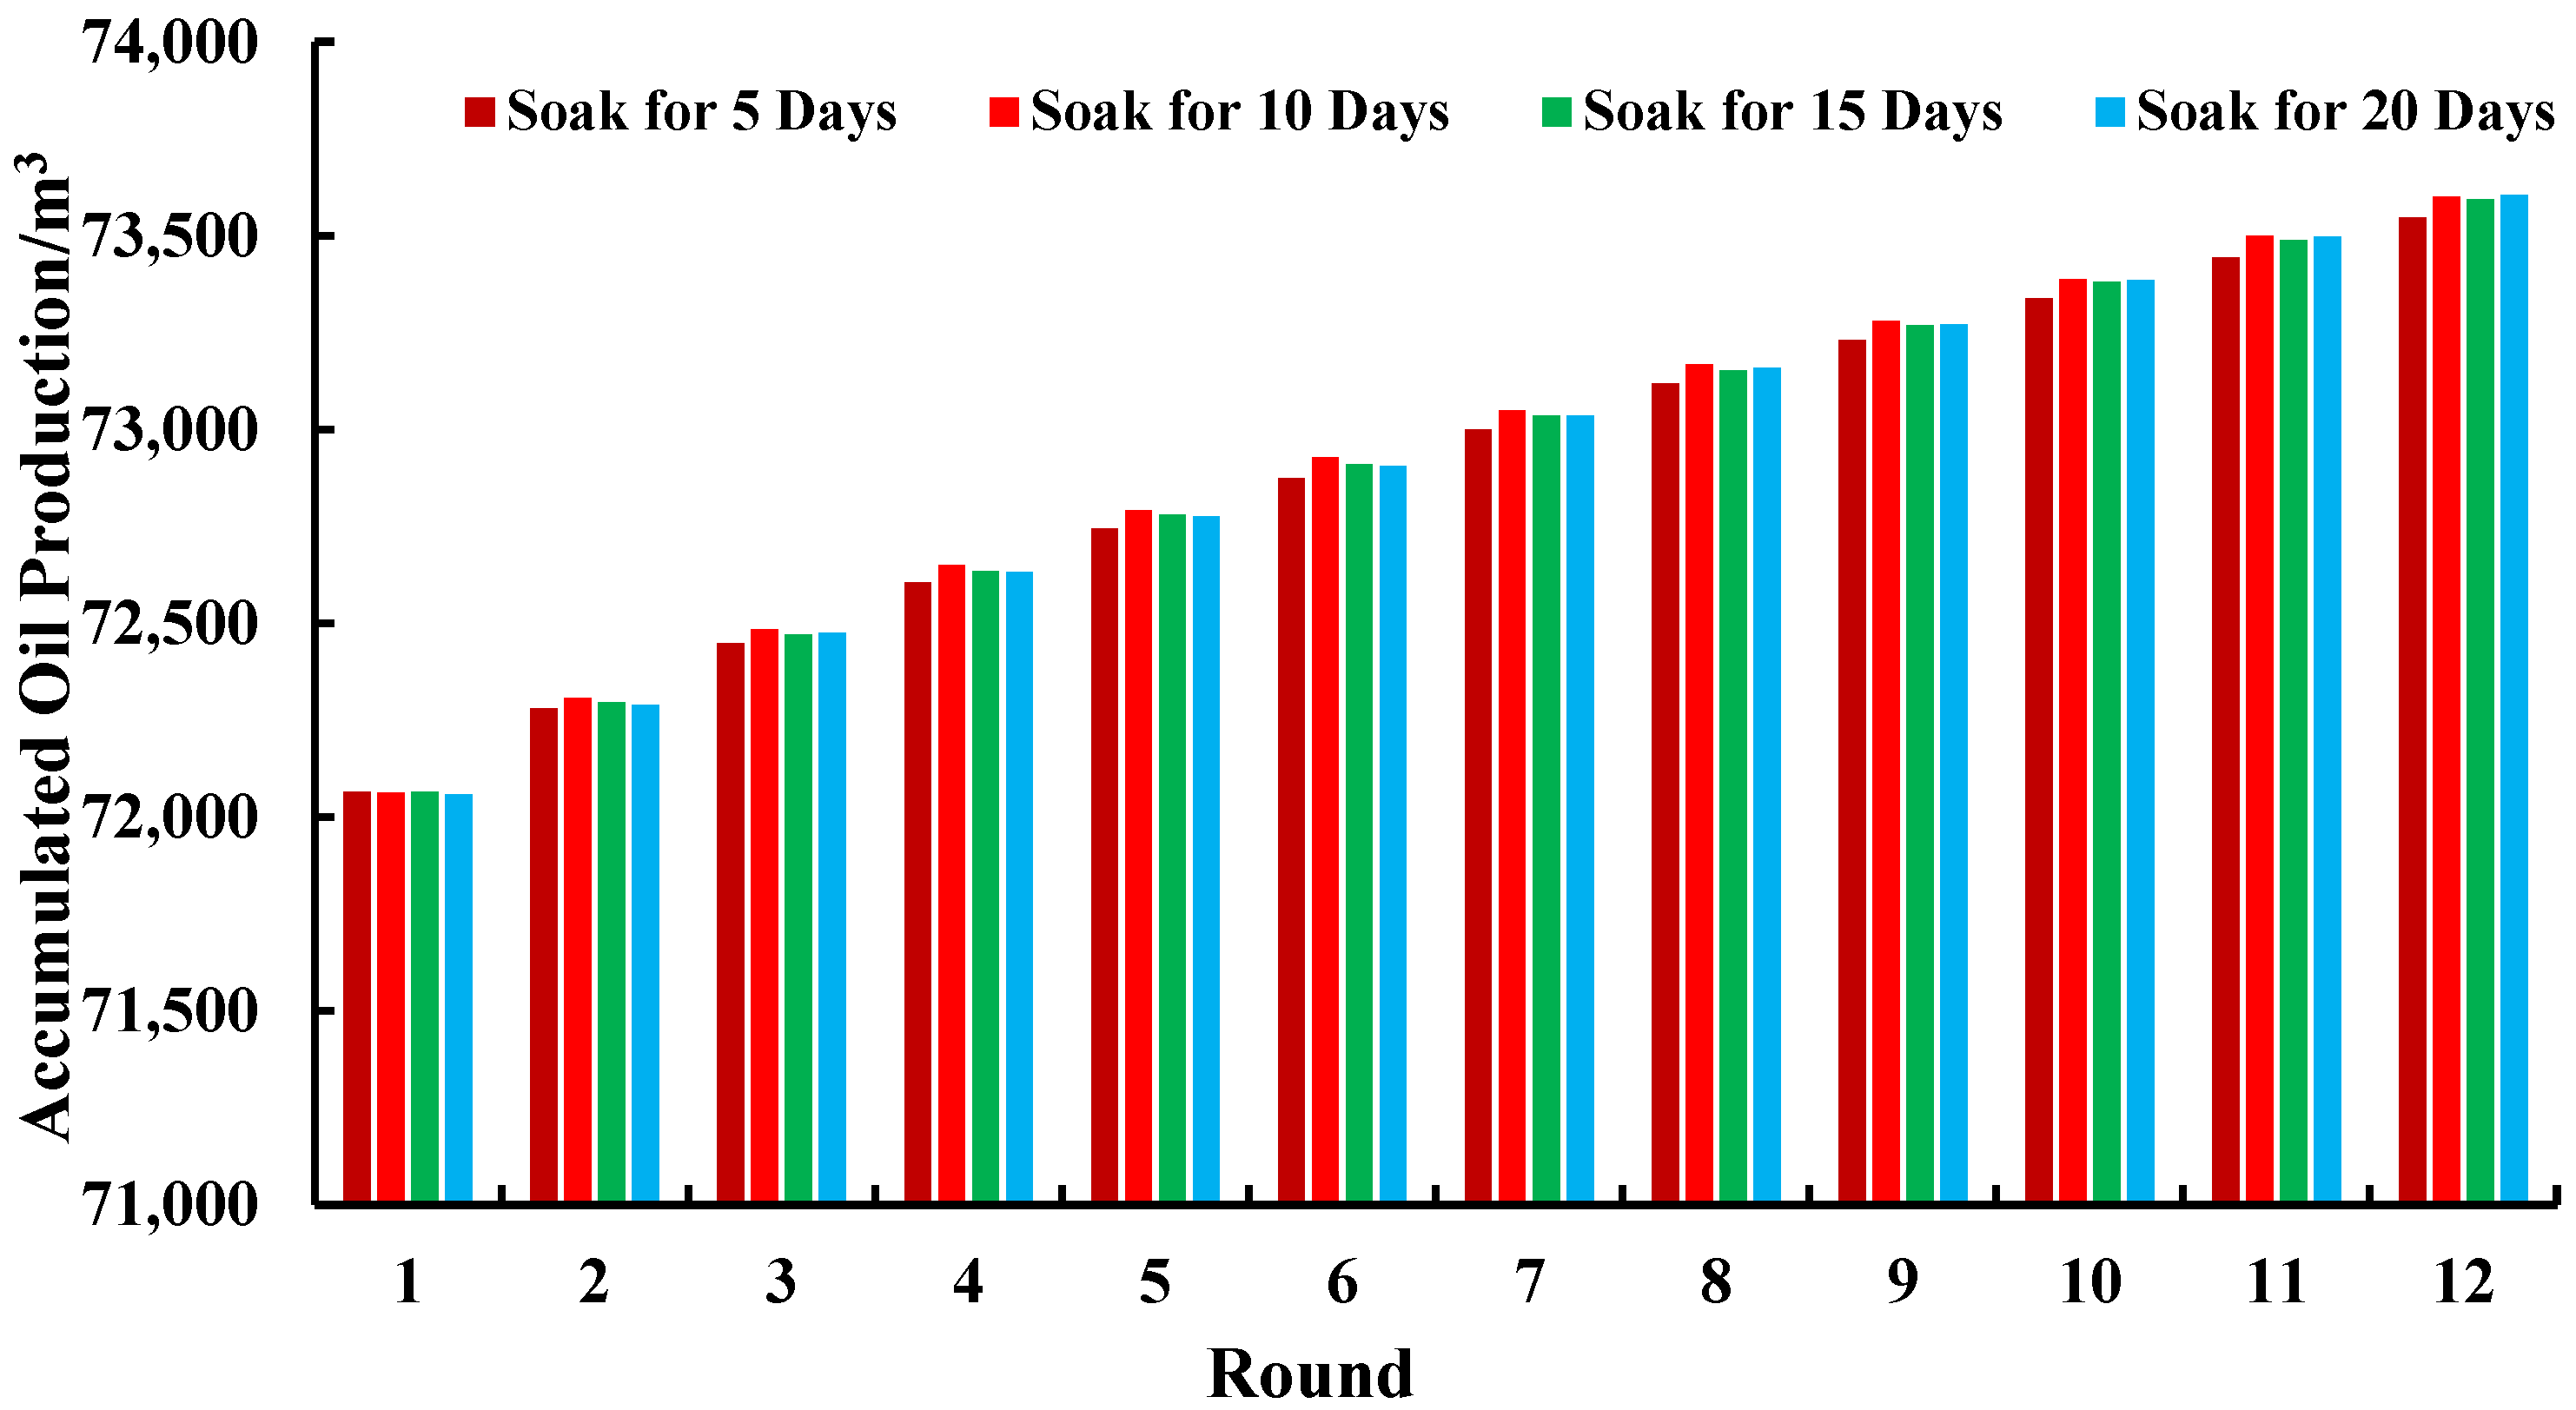
As shown in Figure 14, although the soaking time varied across different injected rounds, the cumulative oil production differences between rounds were not significant. However, cumulative oil production steadily increased with each additional round. It is evident that when the soaking time is 5 days, the cumulative oil production from the third injection round onwards is lower than that of other rounds. This occurs because, compared to the other three shorter soaking times, the injected gas can rapidly replenish part of the reservoir energy. Consequently, oil production remains nearly identical across the first three rounds, with the maximum difference being only 28 m3.
Figure 14.
Cumulative oil production by well round at different soaking durations.
However, the short soaking time during gas injection did not fully leverage the reservoir driving effect or the gravitational separation of oil and gas in the upper and middle sections of the well. Consequently, by the later injected rounds, a significant disparity emerged in oil production when the soaking time reached five days, with the average production variance across rounds reaching 49 cubic meters. As the soak duration increased, the disparity in oil production across rounds became negligible. This occurred because while the gas effectively drove the reservoir and maximized its impact, it also dispersed into other directions within the formation, resulting in minimal further alterations to oil production. The cumulative oil production results for 10-day, 15-day, and 20-day soaking times were 875,204.77 m3, 875,069.23 m3, and 875,089.22 m3, respectively. The maximum total cumulative oil production, including post-gas injection depletion, was achieved with a 10-day soaking time, reaching 1,000,315.29 m3.
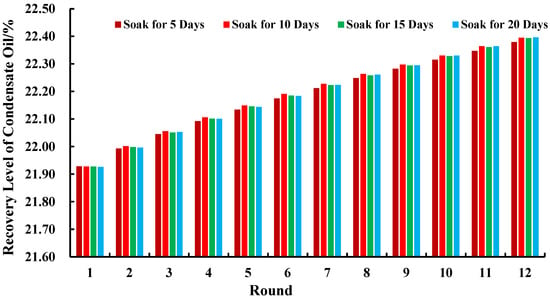
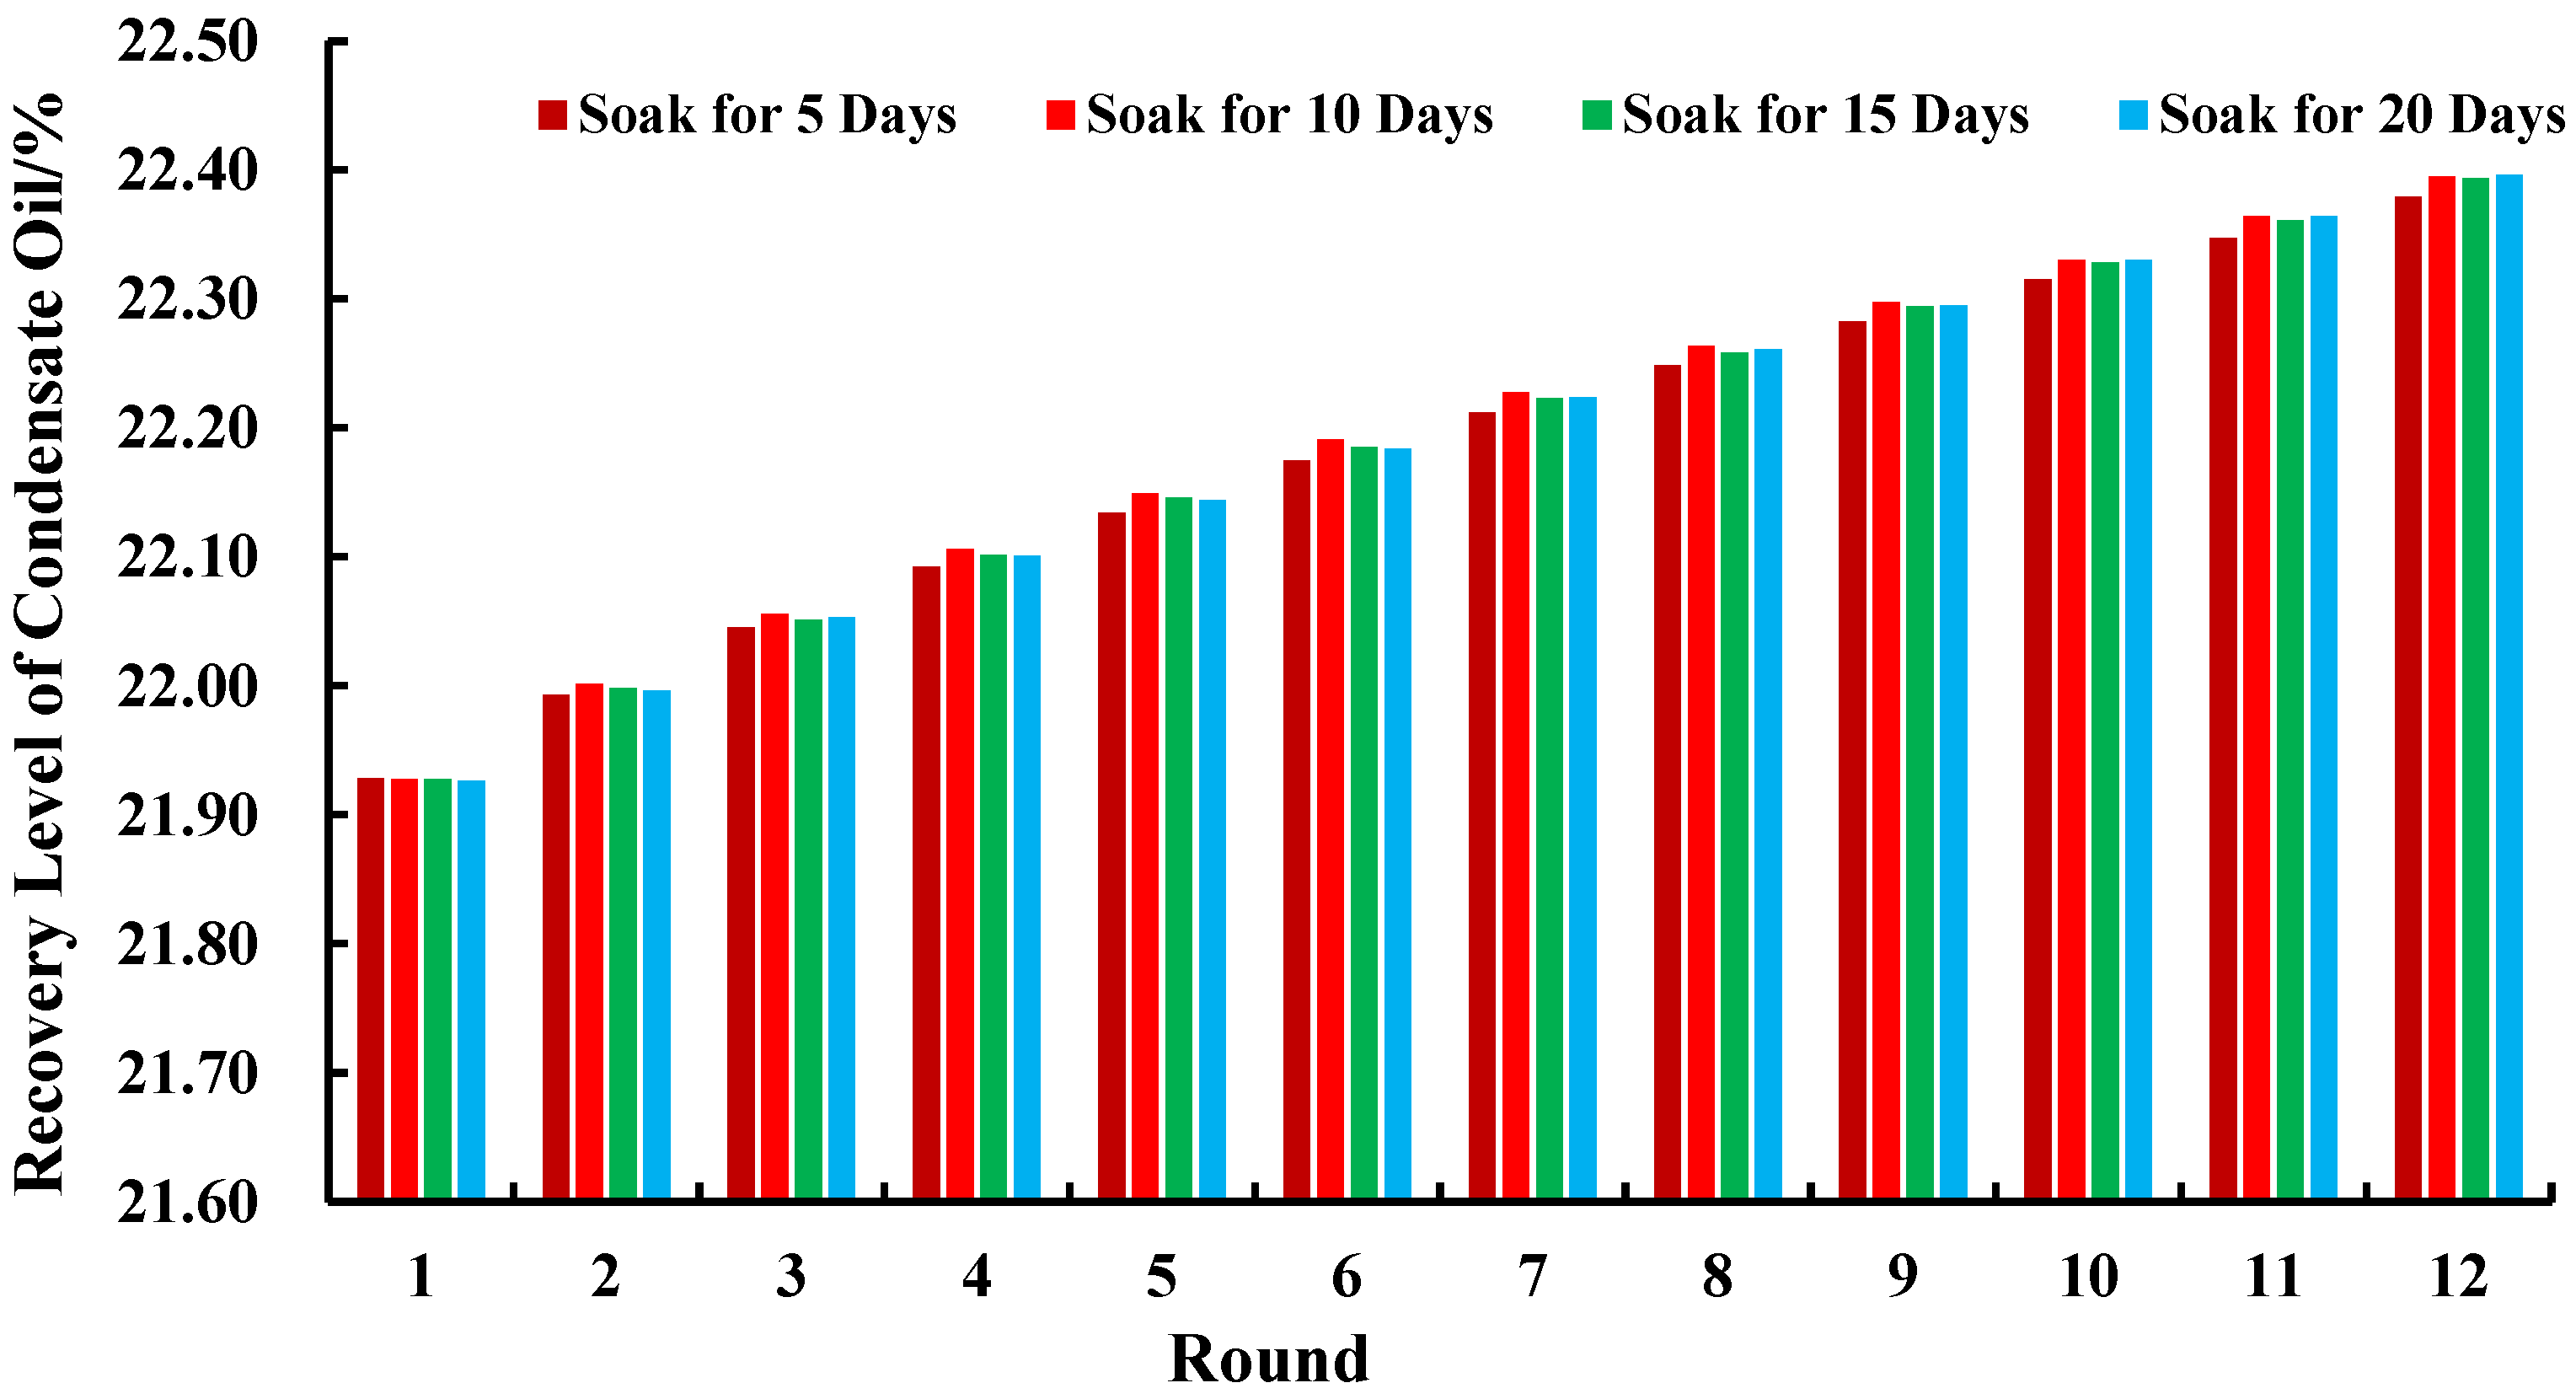
A comparison of condensate recovery rates (Figure 15) further corroborates this finding. The 5-day soaking time showed a significant gap compared to other soaking durations, while the remaining three showed no substantial differences. The average condensate recovery rate for each soaking round was 22.19%. Considering comprehensive economic benefits and other factors, the optimal soaking well duration is determined to be 10 days.
Figure 15.
Condensate recovery efficiency at different soaking durations across multiple rounds.
5. Conclusions
- (1)
- In both natural gas and nitrogen injection scenarios, the mechanism of fractured-vuggy carbonate condensate gas reservoirs involves replenishing rapidly depleted formation energy.
- (2)
- A universal development technology for injecting water into condensate gas reservoirs currently exists domestically [45,46]. Its primary mechanism involves replenishing the reservoir volume deficit caused by earlier depletion operations, restoring formation pressure to mitigate or suppress the reverse condensation phenomenon. However, significant variations exist in water injection techniques across different reservoir types, presenting a considerable challenge.
- (3)
- For the SHB42X single well, optimal injection parameters are nitrogen injection at an injection intensity and production rate of 100,000 m3/day, with an optimal single-round injection volume of 3 million m3 and an optimal soaking time of 10 days.
- (4)
- Following the adoption of nitrogen as the injection medium for the SHB42X well, condensate recovery increased by 39.41%, oil production rose by 5.61%, and cumulative gas production improved by 3.81%.
Author Contributions
Conceptualization, S.J. and T.L.; methodology, T.L.; software, T.L.; validation, Z.C., T.L. and J.S.; formal analysis, J.S.; investigation, Z.C.; resources, J.S.; data curation, Z.C. and Z.Z.; writing—original draft preparation, Z.C.; writing—review and editing, Z.C.; visualization, Z.C. and J.S.; supervision, S.J.; project administration, S.J.; funding acquisition, S.J. All authors have read and agreed to the published version of the manuscript.
Funding
This research received no external funding.
Institutional Review Board Statement
Not applicable.
Informed Consent Statement
Not applicable.
Data Availability Statement
All data and materials are available upon request from the corresponding author. The data are not publicly available due to ongoing studies using a part of the data.
Conflicts of Interest
The authors declare no conflicts of interest.
References
- Bu, X.; Wang, L.; Zhu, L.; Huang, C.; Zhu, X. Characteristics and reservoir accumulation model of Ordovician fault controlled fractured-vuggy reservoirs in Shunbei oil and gas field, Tarim Basin. Lithol. Reserv. 2023, 35, 152–160. [Google Scholar]
- Yun, L.; Deng, S. Structural styles of deep strike slip faults in Tarim Basin and the characteristics of their control on reservoir formation and hydrocarbon accumulation: A case study of Shunbei oil and gas field. Acta Pet. Sin. 2022, 42, 770–787. [Google Scholar]
- Hu, W. Paleokarst fractured-cavity types and their reconstruction in buried hill area, “Tahe oilfield, Tarim Basin. Oil Gas Geol. 2022, 43, 43–53. [Google Scholar] [CrossRef]
- Li, Y.; Kang, Z.; Xue, Z.; Zheng, S. Theories and practices of carbonate reservoirs development in China. Pet. Explor. Dev. 2018, 45, 669–678. [Google Scholar] [CrossRef] [Scilit]
- Su, H.; Guo, Y.; Cao, L.; Yu, C.; Cui, S.; Lu, T.; Zhang, Y.; Li, J. Natural depletion characteristics and pressure maintenance strategies of fault-controlled fracture-cavity condensate gas reservoirs in Shunbei Oilfield. Lithol. Reserv. 2024, 36, 178–188. [Google Scholar]
- Chen, W.; Liao, F.; Lv, B.; Miao, J.; Chang, Z. Retrograde vaporization dynamic phase behaviors in gas injection development of the Yaha condensate gas reservoir. Nat. Gas Ind. 2012, 32, 67–70. [Google Scholar]
- Zhu, Z. Mechanism and phase behavior of retrograde condensation inhibition by secondary gas injection in the Yaha condensate gas reservoir. Nat. Gas Ind. 2015, 5, 60–65. [Google Scholar]
- Xie, X.; Luo, K.; Song, W.; Li, B.; Li, S.; Zheng, X. A new and rigorous equation for modeling gas condensate well deliver ability including an experimental study of revaporization of retrograde condensate. In Proceedings of the SPE Middle East Oil Show, Manama, Bahrain, 17–20 March 2001. [Google Scholar] [CrossRef]
- Dranchuk, P.M.; Abu-Kassem, J.H. Calculation of Z-factors for natural gases using equations-of-state. J. Can. Pet. Technol. 1975, 14. [Google Scholar] [CrossRef] [Scilit]
- Guehria, F.M.; May, R.S.; Baiar, T.E. Simulation of Gas Cycling Using a Beta Model. SPE 1995, 29564, 215–229. [Google Scholar]
- Du, J.; Li, S.; Sun, L. Effect of porous medium adsorption on the percolation law of condensate gas mixture. In Proceedings of the SPE International Oil and Gas Conference and Exhibition in China, Beijing, China, 2–6 November 1998. [Google Scholar] [CrossRef]
- Zhang, L.; Zhao, L.; Tan, X. Research on the mechanism of gas-injection development for buried-hill fractured condensate gas reservoirs. Nat. Gas Geosci. 2024, 35, 357–365. [Google Scholar]
- Guo, P.; Du, Z.; Su, C.; Li, H.; Li, S.; Sun, L. Research on the recovery efficiency of depleted gas reservoirs rich in condensate oil. Nat. Gas Ind. 2004, 11, 94–96+22. [Google Scholar]
- Li, Y.; Li, X.; Li, B.; Li, L.; Zhang, Y. Performance Prediction of Natural Depleting Development of Condensate Reservoir with High Gas Condensate Content with a single well. Well Test. 2011, 20, 8–11+73. [Google Scholar]
- Zhang, G.; He, Z.; Zhu, J.; Zeng, Q.; Wang, P. Experiment on the influencing factors of the natural depletion development for condensate gas reservoirs. Pet. Geol. Oilfield Dev. Daqing 2016, 35, 62–65. [Google Scholar]
- Song, L.; Chen, B.; Wang, J.; Cen, X. Study on the Influence Factors of Depletion Development Effect in Condensate Gas Reservoir. Value Eng. 2017, 36, 117–119. [Google Scholar]
- Shi, M.; Lu, K.; Zhang, C.; Wang, R.; Lu, Y.; Ma, L. New Method for Calibrating Recovery of Gas Condensate Reservoirs Based on PVT Experiments. Tianiin Sci. Technol. 2024, 51, 24–27+31. [Google Scholar]
- Huang, Z.; Li, C.; Wang, B.; Qiao, X.; Fu, Y.; Yan, B. Enhanced recovery in middle and late stages of depletion development of condensate gas reservoirs with oil ring. Xinjiang Pet. Geol. 2024, 45, 470–474. [Google Scholar]
- Hu, S.; Guo, P.; Zhao, C.; Tan, B.; Xu, D. Orthogonal experimental study on the influencing factors of N2 injection throughput effect in fractured oil reservoirs. Sci. Technol. Innov. 2021, 4, 002. [Google Scholar]
- Zheng, C.; Tang, X.; Huang, Y.; Wang, Y.; Yang, K. The Application of CO2 in the Oil Field Development. Oilfield Chem. 2011, 28, 349–354. [Google Scholar]
- Wang, C.; Dan, H.; Liu, Z. Research on Reinjection of Natural Gas and Its Application in Bohai Oilfield Development-Taking LD10-1 oilfield as an example. Tianjin Sci. Technol. 2009, 36, 55–57. [Google Scholar]
- Ma, T.; Wang, Q.; Chen, W.; Nie, J. Technologies of Injecting Natural Gas to Enhance Oil Recovery. Sci. A Technol. Rev. 2014, 32, 7275. [Google Scholar]
- Jia, A.; Yan, H. Problems and countermeasures for various types of typical carbonate gas reservoirs development. Acta Pet. Sin. 2014, 35, 519–527. [Google Scholar]
- Cruz Hernandez, J.; Sorensen, J.A. Improving Oil Recovery by Use of Carbon Dioxide in the Bakken Unconventional System: A Laboratory Investigation. SPE Reserv. Eval. Eng. 2017, 20, 602–612. [Google Scholar]
- Levitan, M.; Wilson, M. Deconvolution of Pressure and Rate Data From Gas Reservoirs With Significant Pressure Depletion. SPE J. 2012, 17, 727–741. [Google Scholar] [CrossRef] [Scilit]
- Warren, J.E.; Root, P.J. The Behavior of Naturally Fractured Reservoirs. Soc. Pet. Eng. J. 1963, 3, 245–255. [Google Scholar] [CrossRef] [Scilit]
- Olarewaju, J.S.; Lee, W.J. Rate Behavior of Composite Dual-Porosity Reservoirs. In Proceedings of the SPE Production Operations Symposium, Oklahoma City, OK, USA, 7–9 April 1991. [Google Scholar] [CrossRef]
- Gurpinar, O.; List, D.F.; Kalbus, J. Numerical modeling of a large, naturally fractured oil complex. In Proceedings of the SPE International Petroleum Conference and Exhibition in Mexico, Villahermosa, Mexico, 1–3 February 2000. [Google Scholar] [CrossRef]
- Li, Y.; Fan, Z. Developmental pattern and distribution rule of the fracture-cavity system of Ordovician carbonate reservoirs in the Tahe Oilfield. Acta Pet. Sin. 2011, 32, 101–106. [Google Scholar]
- Zhao, J.; Ma, H.; Luo, Y. Discussion on the determination method of oil-water interface in fracture cave units of Tahe fracture cave type carbonate reservoirs. West-China Explor. Eng. 2015, 11, 69–71. [Google Scholar]
- Kang, Z.; Li, Y.; Ji, B.; Zhang, Y. Key technologies for EOR in fractured-vuggy carbonate reservoirs. Oil Gas Geol. 2020, 41, 434–441. [Google Scholar]
- Lv, X.; Sun, J.; Wu, X.; Wei, H.; Xiao, F.; Ma, C.; Song, C. Internal architecture characterization of fractured-vuggy carbonate reservoirs: A case study on the Ordovician reservoirs, Tahe Unit S67, Tarim Basin. Oil Gas Geol. 2021, 42, 728–737. [Google Scholar]
- She, Z.; Chen, L.; Xu, S.; Xiao, Y.; Zhang, J. Nitrogen Injection Technology for Improved Oil Recovery in Fractured-vuggy Carbonate Reservoirs. J. Southwest Pet. Univ. Sci. Technol. Ed. 2024, 46, 138–148. [Google Scholar]
- Jiao, F. Significance and prospect of ultra-deep carbonate fault-karst reservoirs in Shunbei area, Tarim Basin. Oil Gas Geol. 2018, 39, 207–216. [Google Scholar]
- Wang, S.; Zhang, X.; Tian, J.; Peng, M.; Zheng, X.; Xia, Y. Sedimentary evolution and sedimentary differentiation model of Kepingtage Formation in Shunbei area, Tarim Basin. Lithol. Reserv. 2021, 33, 81–94. [Google Scholar]
- Peng, J.; Xia, M.; Cao, F.; Xia, J.; Li, F. Sedimentary characteristics of Ordovician Yingshan Formation and Yijianfang Formation in Shunbei-1 area, Tarim Basin. Lithol. Reserv. 2022, 34, 17–30. [Google Scholar]
- Ji, B.; Zheng, S.; Gu, H. On the development technology of fractured-vuggy carbonate reservoirs: A case study on Tahe oilfield and Shunbei oil and gas field. Oil Gas Geol. 2022, 43, 1459–1465. [Google Scholar]
- Shang, J.; Chen, S.; He, Y.; Wang, L.; Yin, Y.; Xie, P. Structural characterization and 3D geological modeling of fault-controlled carbonate reservoirs: A case study of Shunbei No. 4 fault zone. Acta Pet. Sin. 2024, 45, 1662–1679. [Google Scholar]
- Guo, P.; Xu, Q.; Sun, Z.; Du, J.; Wang, Z. Research progress of CO2 flooding and geological storage in gas reservoirs. Lithol. Reserv. 2016, 28, 6–11. [Google Scholar]
- Zheng, T.; Liu, X.; Yang, Z.; Luo, Y.; Zhang, Y.; He, Y.; Xiong, S. Research progress on application of natural gas to enhance oil recovery in tight reservoirs. Appl. Chem. Ind. 2020, 49, 190–195. [Google Scholar]
- Matthews, J.D.; Hawes, R.I.; Hawkyard, I.R.; Fishlock, T.P. Feasibility Studies of Waterflooding Gas-Condensate Reservoirs. Pet Technol 1988, 40, 1049–1056. [Google Scholar] [CrossRef] [Scilit]
- Xiao, Y.; Kang, B.; Deng, X.; Shi, Y.; Guo, P. The Physical simulation research of full diameter core for different development way of fractured-vuggy carbonate gas condensate reservoir. Xinjiang Oil Gas 2012, 8, 58–61. [Google Scholar]
- Wang, Z.; Guo, P.; Sun, L.; Chen, Y. Research of the feasibility of exploiting abandoned condensate gas reservoir by water injection. J. Xi’an Shiyou Univ. Nat. Sci. Ed. 2006, 1, 29–31+89. [Google Scholar]
- Yuan, F.; Wang, H.; Yue, P.; Zhang, S.H.; Fang, Q.Z.; Zeng, H.B. Simulation analysis of influencing factors of single well gas injection in fracture-vuggy carbonate reservoir. Unconv. Oil Gas 2023, 10, 86–94. [Google Scholar]
- Li, B.; Li, X.; Yao, Y.; Chen, Y.; Sun, M. Features and feasibility of waterflooding development of small fault block condensate gas reservoirs. Nat. Gas Ind. 2009, 29, 92–94+143. [Google Scholar]
- Xu, Z.; Lv, P.; Zhang, K.; Yang, X. Practical Experience and Insights from Water Injection Development of the Daolaoba No. 1 Structural Condensate Gas Reservoir. Chem. Eng. Equip. 2015, 9, 103–105. [Google Scholar]

Disclaimer/Publisher’s Note: The statements, opinions and data contained in all publications are solely those of the individual author(s) and contributor(s) and not of MDPI and/or the editor(s). MDPI and/or the editor(s) disclaim responsibility for any injury to people or property resulting from any ideas, methods, instructions or products referred to in the content. |
© 2025 by the authors. Licensee MDPI, Basel, Switzerland. This article is an open access article distributed under the terms and conditions of the Creative Commons Attribution (CC BY) license (https://creativecommons.org/licenses/by/4.0/).