Review

A Review of the Potential Effects of the World Athletics Stack Height Regulation on the Footwear Function and Running Performance

by
Santiago A. Ruiz-Alias
1,2,*,
Diego Jaén-Carrillo
3,
Luis Enrique Roche-Seruendo
4,
Alejandro Pérez-Castilla
5,6,
Víctor M. Soto-Hermoso
1,2 and
Felipe García-Pinillos
1,2,7
1
Department of Physical Education and Sport, University of Granada, Carretera de Alfacar s/n, 18011 Granada, Spain
2
Sport and Health University Research Center (iMUDS), University of Granada, C/. Menéndez Pelayo 32, 18016 Granada, Spain
3
Department of Sport Science, University of Innsbruck, 6020 Innsbruck, Austria
4
Faculty of Health Sciences, Campus Universitario, University of San Jorge, Auotv A23 km 299, 50830 Villanueva de Gállego Zaragoza, Spain
5
Department of Education, Faculty of Education Sciences, University of Almería, 04120 Almería, Spain
6
SPORT Research Group (CTS-1024), CERNEP Research Center, University of Almería, 04120 Almería, Spain
7
Department of Physical Education, Sport and Recreation, Universidad de La Frontera, Temuco 01145, Chile
*
Author to whom correspondence should be addressed.
Appl. Sci. 2023, 13(21), 11721; https://doi.org/10.3390/app132111721
Submission received: 25 August 2023 / Revised: 13 October 2023 / Accepted: 24 October 2023 / Published: 26 October 2023
(This article belongs to the Special Issue Sports Biomechanics Applied to Performance Optimization)

Abstract

:
This review aims to synthesize and discuss the potential effects of a stack height modification on the function of the different footwear features and their effects on running performance. Peer-reviewed studies were identified from electronic databases using a structured keyword search and a screening process. Complementary sources were used to illustrate and discuss the current racing footwear constructions. With regard to the shoe mass, it is suggested that a stack height difference of 20 mm could induce a meaningful effect on performance. With respect to the midsole properties, it seems that reducing the stack height does not alter the energy returned, given that the lower midsole deformation is counteracted with an increased stiffness. However, it should be noted that this might affect the timing of the midsole deformation and restitution, which should be matched with the mid and propulsive stance phases. Lastly, the curved geometry of the forefoot sole needed to create the teeter-totter effect could be affected by the stack height reduction. However, current racing footwear designs have counteracted this modification by proximately placing the rocker axis and increasing the toe spring.

1. Introduction

The 2 h marathon barrier has been one of the greatest challenges in human physiology. Since 1950, the world record has been reduced by more than 16 min, with the improved athlete context as the potential cause of such progression (i.e., training programs, athletes monitoring, and socio-economic aspects) [1]. However, in 2016, the advances in footwear technology implemented for the breaking 2 h attempt marked a turning point in the natural progression of performance seen up to date [2].
Breaking the 2 h marathon barrier required athletes to maintain a metabolic steady-state on a 2:50 min:s pace over 42.195 m. Considering the different performance determinants in long-distance running (e.g., maximum oxygen consumption, running economy, critical velocity) [3,4,5], it seems that an extraordinary combination of them was required to achieve such demand. In this regard, Jones et al. [3] defined the physiology of a group of top elite marathoners, displaying a peak oxygen uptake of 71.0 ± 5.7 mL/kg/min and relative oxygen consumption at 21 km/h of 95 ± 5% of the peak oxygen uptake [3]. The metabolic steady state exhibited by the group was 20.2 ± 0.6 km/h, their lactate turn point (4.6 ± 1.3 mmol/L), where 92 ± 3% of the peak oxygen uptake was required with a cost of running of 188 ± 20 mL/kg/km [3]. Due to the time limit at such running intensity, marathon times predictions from this evaluation were made by dividing the oxygen uptake (mL/kg/min) by the cost of running (mL/kg/km) at 96% of the lactate turn point [3]. A time prediction of 2:08:31 ± 03:48 was found, with the best time being 2:00:01 [3]. At these performance levels, all the possible marginal improvements were contemplated for overpassing the 2 h target. In this regard, the marathon shoes released for this aim captured the attention of the running and scientific community. It was later published that compared to a previous world-record marathon shoe model, the prototype provided by Nike improved by 4% the running economy [6]. Therefore, if an athlete of 2:03:40 displays an oxygen uptake of 65 mL/kg/min and a cost of running of 191 mL/kg/km (i.e., 60 × 65/191 = 20.4 km/h) at his marathon intensity (i.e., the lactate turn point) [3], the 4% improvement would have placed his marathon pace on 21.2 km/h (60 × 65/183.4 = 21.2 km/h) resulting in a final time of 1:59:34. Likewise, other external factors such improvements in the course design [7] and pacing aids (i.e., shifting pacers, pacing car) were contemplated to increase the likelihood of success by improving the cost of running.
After the implementation of these footwear innovations (i.e., lightweight materials, compliant and resilient midsole, increased longitudinal stiffness, curved forefoot geometry) in the athletic community and the proven performance improvements in long-distance road events [2,8], the controversy of “technology doping” emerged, leading the World Athletics to create a shoe regulation for the different events based on limiting the stack height (i.e., the amount of shoe material between the foot and the ground) (Table 1) [9]. This regulation is being widely deliberated in order to ensure that performance is achieved via the primacy of human effort rather than technology in running shoes [10,11,12,13]. On the one hand, Burns and Tam [10] suggested that limiting the stack height might be a solution as it would limit those footwear features that could enhance the running economy. Furthermore, this rule would also limit any future innovation that could jeopardize the integrity of athletics [10]. In response to such a proposal, Frederick [11] stated that there is a lack of evidence and consensus on the measurement of the stack height. Hoogkamer [12] supported these statements and mentioned that increasing the stack height results in no advantage in the running economy due to the increase in mass and instability. It was also added that the resilience property of the midsole (i.e., the capacity to store and to release the mechanical energy applied) of current midsole materials is not compromised by such limitation since the greatest deformations were found to be in 12 mm, needing just a few more mm to avoid the bottom out of the midsole, which could have affected the storing phase [12]. Nigg et al. [13] subsequently contributed to this debate by discussing the potential contribution of each shoe feature to the improvements in the running economy. The authors mentioned that the major effect of contemporary running shoes on running performance comes from the increased longitudinal stiffness and the forefoot rocker (i.e., the upward curvature of the forefoot sole) that generates the so-called “teeter-totter effect” [14].
Despite this stack height limitation, this rule was insufficient to avoid the great improvement in long-distance events that began with the running shoe revolution in 2017 [2,15], which resulted in stricter regulation, being the stack height further reduced (Table 1) [9]. Therefore, in order to clarify the potential effects of reducing the stack height, this scoping review aims to synthesize and discuss the potential effects of a stack height modification on the function of the different footwear features and their effects on running performance.

2. Materials and Methods

The footwear features of potential interest for this review were first identified according to an expert consensus [16]. Subsequently, these were chosen based on their potential impact on running performance [13], with specific attention to their susceptibility to being influenced by a reduction in the stack height (i.e., shoe mass, midsole properties, teeter-totter effect items). The Pubmed and Web of Science electronic databases were used to identify studies from inception to the present. Each footwear feature term was combined with different running footwear and performance terms using “AND” and “OR” commands: (Shoe* OR Footwear OR Racing Flats OR Spikes) AND (Mass OR Midsole OR Longitudinal stiffness) AND (Economy OR Energy Cost OR Time OR Race OR Speed OR Pace). After removing duplicates and irrelevant articles, those with full-text availability were screened to identify if the footwear conditions compared in a running performance outcome (i.e., running economy, time trial, time to exhaustion) were created by a stack height reduction while maintaining the rest of the footwear features similarly. If not, those studies analyzing each footwear feature in isolation while controlling potential confounders on a running performance outcome were selected (Figure 1). The evidence provided by these studies was then discussed using complementary sources (see details in each section).

3. Results

3.1. Effect of the Stack Height on Running Performance

Two studies were identified that analyze the effect of varying the midsole thickness on a running performance outcome while maintaining the rest of the footwear features similarly [17,18]. This was performed by using the same footwear prototype with different midsole thicknesses and adjusting the shoe weight by adding lead beads.

3.2. Effect of the Shoe Mass on Running Performance and Influence of the Stack Height

Three studies were identified that analyze the effect of the shoe mass on a running performance outcome while maintaining the rest of the footwear features similarly [19,20,21]. This was performed by adding lead beads to the same footwear model [19,21] or to the feet [20]. In order to illustrate the effects of reducing the stack height on shoe mass, a linear regression analysis was traced to the shoe mass and stack heights reported by Barrons et al. [17] in Figure 2. In addition, the midsole thickness and shoe mass of 15 common racing footwear models were searched on a specialized running footwear website [22] and reported in Figure 2.

3.3. Effect of the Midsole Properties on Running Performance and Influence of the Stack Height

Four studies were identified that analyze the effect of the midsole properties on a running performance outcome while maintaining the rest of the footwear features similarly [17,18,23,24]. This was performed by using the same footwear prototype with different midsole stack heights [17,18] or materials [24] and by running barefoot on a standard and cushioned surface [23].

3.4. Effect of the Teeter-Totter Effect on Running Performance and Influence of the Stack Height

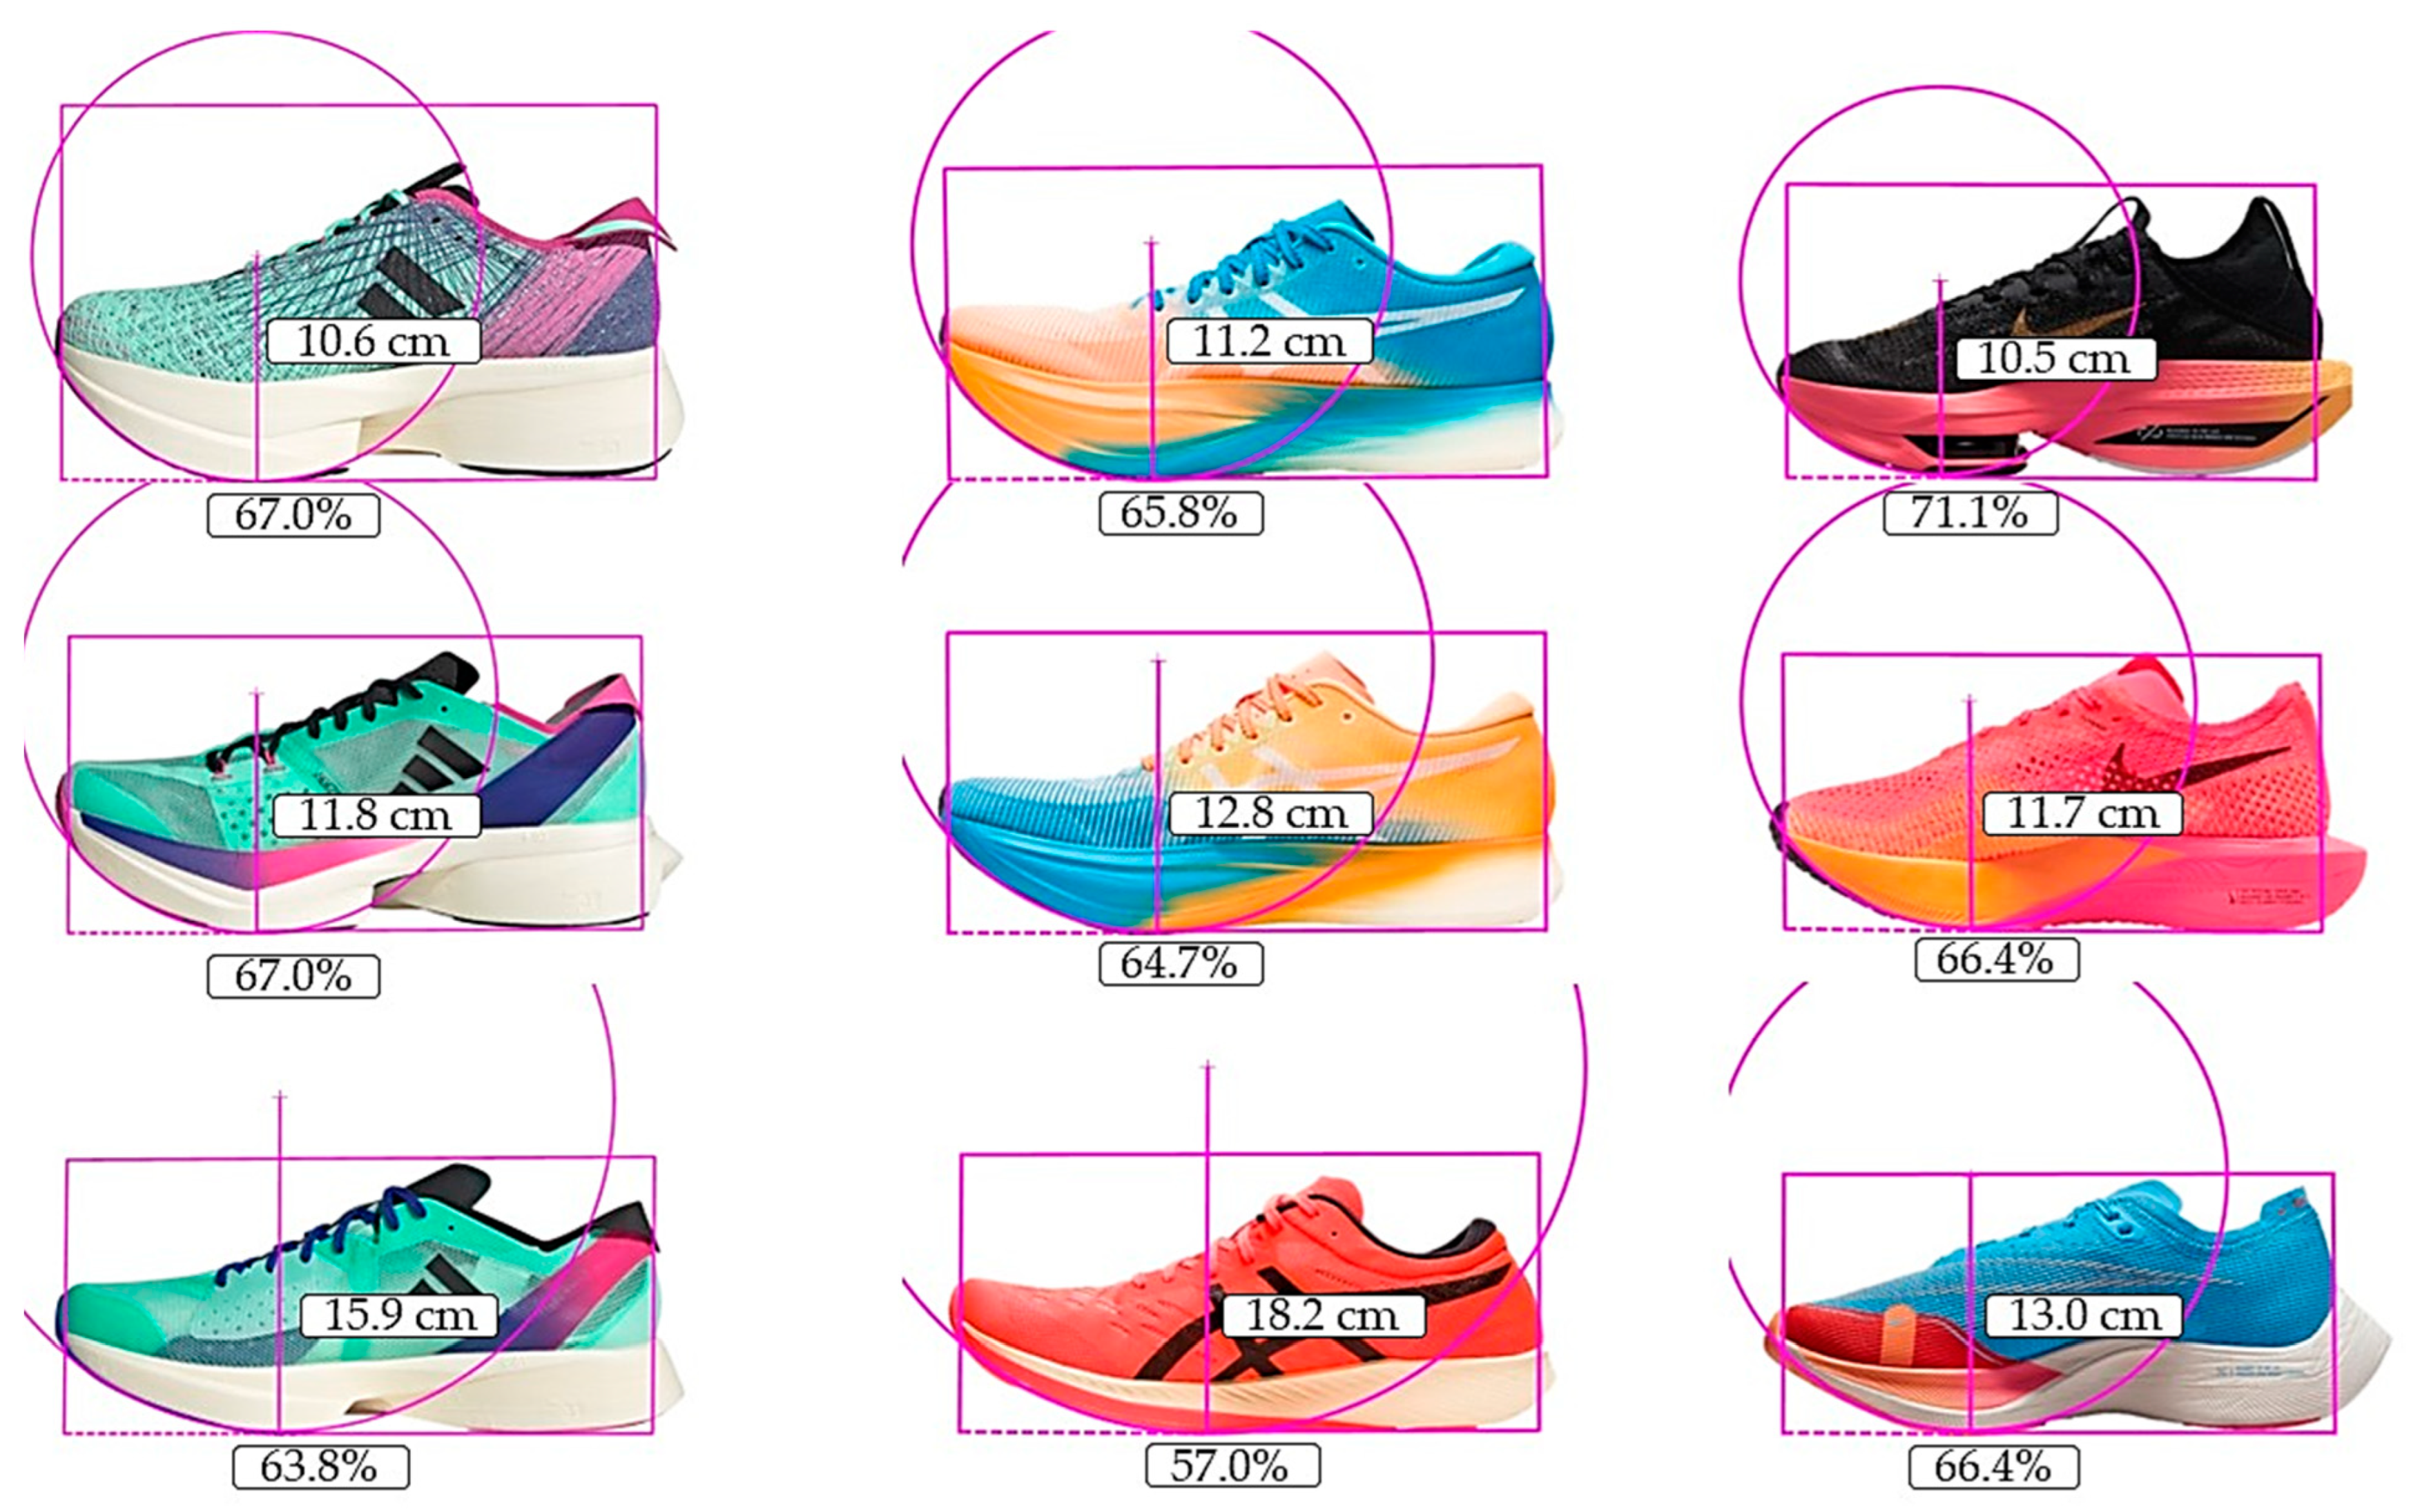
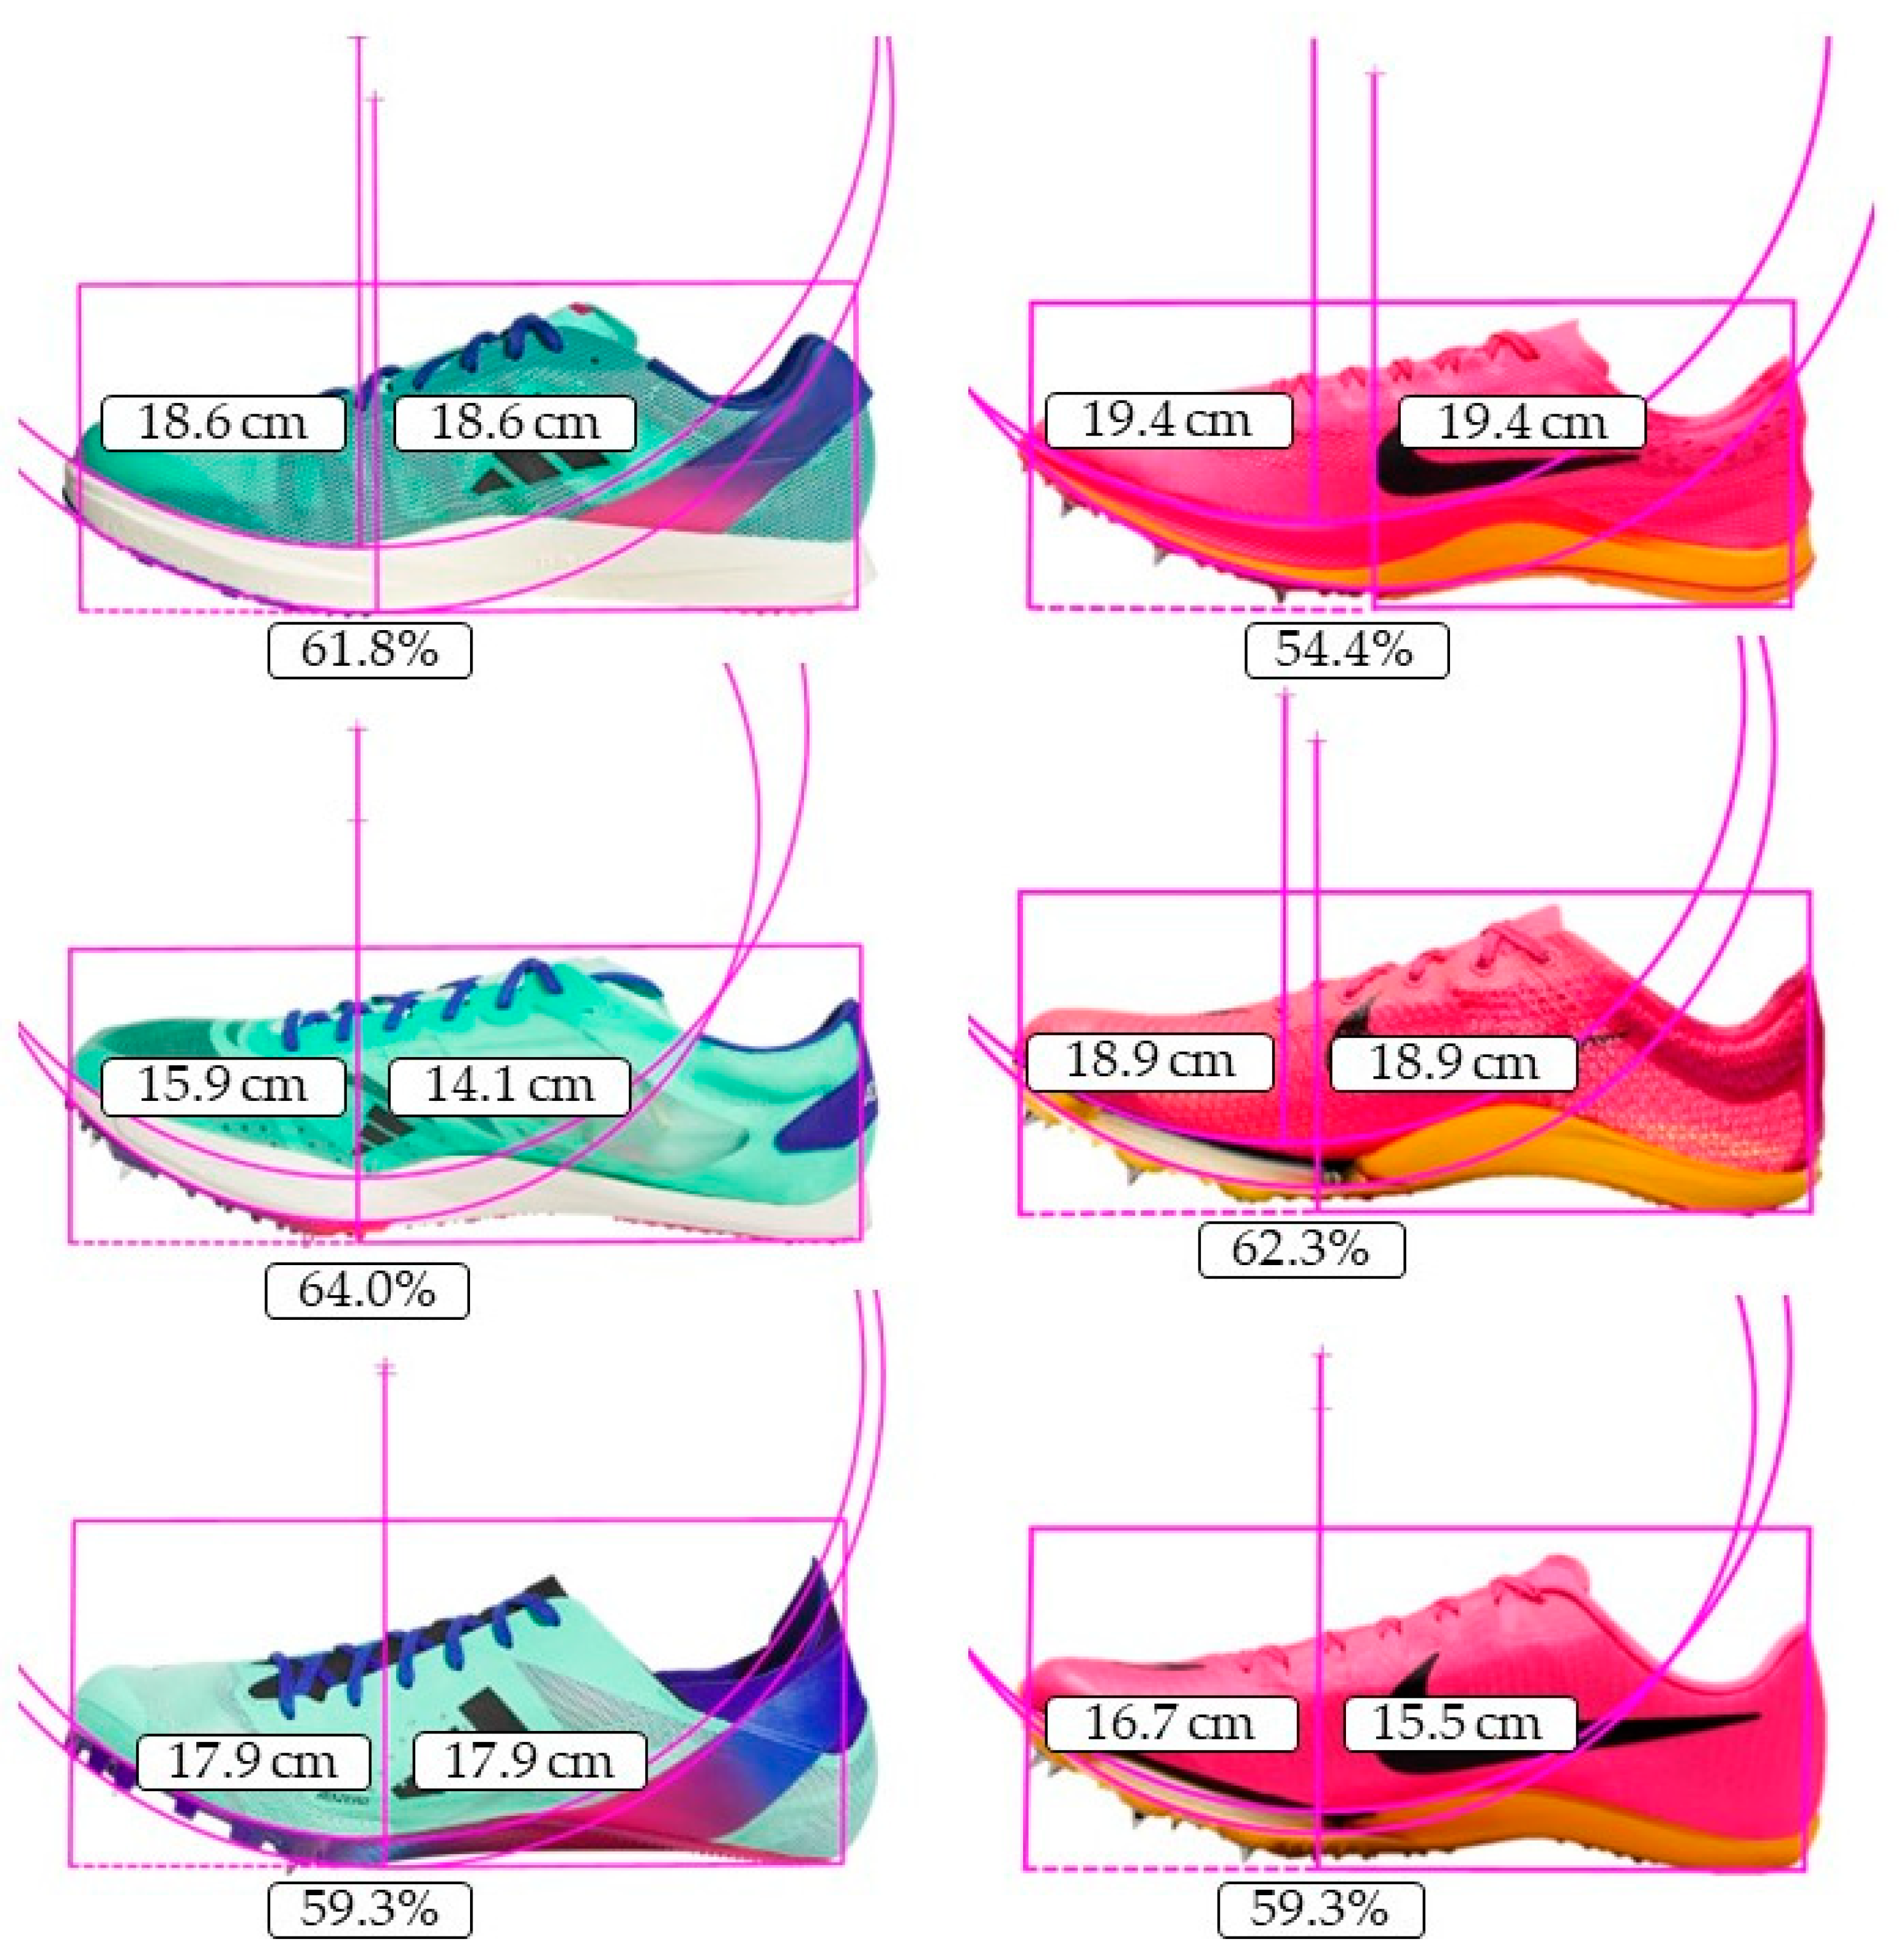
A single study was identified that analyzed the teeter-totter effect on a running performance outcome while maintaining the rest of the footwear features similarly [25]. This was performed by comparing different racing footwear models with increased longitudinal stiffness of similar weights (<30 g) [25]. In order to further illustrate the potential implication of the stack height on the teeter-totter effect, the rocker and toe spring radius, as well as the rocker axis position have been analyzed in different current racing footwear models using the Kinovea free-access software [26] (Figure 3 and Figure 4).

4. Discussion

4.1. Effect of the Stack Height on Running Performance

Despite being a highly debated topic [10,11,12,13], the effect of stack height on running performance has been scarily analyzed. The results provided by Barrons et al. [17] and Bertschy et al. [18] are the unique published data regarding this topic (See references for further details). On the one hand, Barrons et al. [17] compared four identical models differing only in the midsole thickness (i.e., 35, 40, 45, 50 mm). After matching shoe weights, no significant differences in running economy were observed. On the other hand, Bertschy et al. [18] compared three stack height conditions (i.e., 30, 40, and 60 mm) on two footwear prototypes with two different midsole materials (i.e., EVA and NITRO). After matching shoe weights, increasing the stack height in the EVA midsole material resulted in a 0.4% running economy penalty per 10 mm added [18]. On the contrary, the NITRO material improved the running economy by 0.13% per 10 mm added [18].
Two relevant factors of these results should also be noted. On the one hand, the running economy would be impaired if the added shoe mass was considered. According to the 1% rule per 100 g added [20,21], Bertschy et al. [18] reported that the running economy deteriorated by 0.5% per 10 mm for the EVA midsole material tested and by 0.34% per 10 mm for the NITRO midsole material. Likewise, the conditions tested by Barrons et al. [17] impaired 0.33% per 10 mm added. Therefore, according to the largest stack height limitation established (i.e., 20 mm), running on an illegal shoe of 40 mm would result in a 0.7 to 1.0% detriment in running economy from the shoe mass standpoint. On the other hand, the contrasting differences reported between the EVA (i.e., +0.4%/10 mm) and the NITRO material (i.e., −0.13% per 10 mm) when matching weights also revealed an interesting factor of this footwear feature [18]. In this regard, Barrons et al. [17] analyzed the force-deformation profile of the different stack height conditions made with the same midsole material, observing an increased vertical midsole deformation and a decreased midsole stiffness when increasing the stack height, which resulted in similar energy returned. Therefore, the different trends observed on the midsole material used by Bertschy et al. [18] could be caused by other factors, such as the timing of the force-deformation profile with the ground contact time displayed by the athletes at the running speed tested (i.e., 14 km/h) [18]. However, it seems that any potential improvement caused by altering the midsole properties due to an increased stack height would be counteracted by the shoe mass (i.e., −0.13% vs. 0.34% per 10 mm). The potential role of these footwear features on running performance and the effect of the stack height on it is further discussed in the following sections.

4.2. Effect of the Shoe Mass on Running Performance and Influence of the Stack Height

The effect of the shoe mass on running economy has been widely studied, finding a consistent linear increase of 1% per 100 g added [20,21]. Likewise, its effect on a 3000-m final time (10:26 ± 57 s) has been established in a time penalty of ~ 0.8% per 100 g added (~50 s) [21]. In shorter efforts (3:13 ± 41 s), Rodrigo-Carranza et al. [19] reported a mean time penalization of ~ 12 and 22% (24 and 52 s) per 50 and 100 g added. Therefore, it seems that the increased internal work (i.e., the work performed to accelerate the body segments regarding the center of mass) causing this performance detriment is conditioned to the running velocity, taking a prominent role at higher ones [27,28,29]. According to the range of stack heights commonly observed among racing footwear models (From 20 to 40 mm) (Figure 2), a worthwhile change in running economy and performance could be seen between them due to the consequent change in shoe mass. The results provided by Bertschy et al. [18] and Barrons et al. [17] support this notion, finding a 0.33, 0.34%, and 0.5% worsened running economy per 10 mm stack height added to the different midsole materials used, resulting, therefore, in 0.7–1.0% per 20 mm. A stack height change of 20 mm is expected to also reach a worthwhile change in running performance, considering the 50 g of differences reported [17] and its contrasted effect on short efforts [19]. However, its weighted effect on the different long- and mid-distance races, as well as on different athletes’ levels, requires further exploration. Likewise, its interaction with the other footwear features that could enhance running performance due to increasing the stack height (e.g., midsole properties [18], teeter-totter effect” [14]) should be balanced.

4.3. Effect of the Midsole Properties on Running Performance and Influence of the Stack Height

The peak midsole deformation, in conjunction with the material stiffness, determines the energy returned [27], which seems to have an effect on the athletes´ running economy [17,23,24]. Worobets et al. [24] reported that the different properties of the EVA (8 mm peak deformation, 176 N/mm, 69% energy returned) and TPU (10 mm peak deformation, 130 N/mm, 79% energy returned) materials used in the same footwear prototype resulted in a 1% difference on running economy. Using an alternative experimental design that enabled to control the potential influence of the shoe mass, Tung et al. [23] tested the energetic cost of running barefoot on a standard treadmill surface compared to a cushioned surface made with foam slats of 10- and 20 mm thickness of the Nike Free 3.0 footwear midsole material. Running on the 10 mm surface resulted in a 1.6% lower energetic cost compared with the standard surface, but no significant improvements were observed on the 20 mm one [23]. In this regard, Barrons et al. [17] observed that reducing the stack height of the four identical footwear prototypes (i.e., 50, 40, 35, and 30 mm) resulted in a decrease in the peak vertical deformation (i.e., from 5 to 3 mm) in conjunction with an increase in the midsole stiffness (i.e., from 100 to 176 N/mm) which resulted in a similar energy return (i.e., from 86.5 to 83.5%) and running economy.
It was initially proposed that reducing the stack height could bottom out the midsole and, therefore, deteriorate the energy returned and its benefits on running performance [12]. With the example of the force-deformation profile (i.e., 200 N/mm) of the PEBA material used in the Nike footwear models, a midsole of 10 mm thickness would stiffen up before its maximal deformation is reached (i.e., 12 mm) when the mechanical load of an athlete of 68 kg running at 18 km/h is applied (i.e., 2000 N in 185 milliseconds) [12]. Thus, Hoogkamer [12] stated that considering the stack heights and midsole deformation profiles of current shoe models, the midsole properties would not be affected by the current regulation unless the stack height is reduced further than the maximum deformation capacity of the midsole. In this regard, it is worth noting that, according to the aforementioned results reported by Barrons et al. [17], reducing the stack height does not seem to alter the energy returned, given that the midsole deformation and stiffness decreased and increased, respectively. However, it should be noted that the midsole deformation and restitution should be synchronized with the mid and propulsive stance phases in order to facilitate the cushioning in conjunction with the vertical and forward propulsion [14]. Therefore, this fact is specific to the running speed to which the midsole properties should be matched.

4.4. Effect of the Teeter-Totter Effect on Running Performance and Influence of the Stack Height

A reduction in the stack height could alter what has been termed the “teeter-totter” effect [14]. This effect aims to passively enhance the propulsive stance for which different footwear features require to be combined: an increased longitudinal stiffness, typically reached using a carbon fiber plate, an increased rocker angle (i.e., the upward curvature of the forefoot sole), and a proximal position of the rocker axis (i.e., the starting point of the rocker angle). In this manner, when the ground reaction force travels forward during the end of the stance phase, the rocker axis acts as a fulcrum, and a heel upwards direction force is created during the push-off phase, reducing the muscle force required at the ankle plantar flexors [14]. This mechanism requires a certain midsole thickness in order to reach a sufficient rocker angle to roll by (Figure 3).
It has been suggested that this mechanism improves running performance by 2 to 6% [14]. However, to date, no studies have addressed which rocker axis and angle combination enhances this mechanism. Joubert and Jones [25] have recently compared the effect of different racing footwear models with the aforementioned characteristics on the running economy. To limit the effect of shoe mass, none of the tested shoes differed by more than 30 g. The running economy was improved by 0 to 3%, which indicates that the different shoe constructions could determine the benefits reported.
The rocker angle needed to create this effect could be limited in track spikes where the major stack height limitation has been established (i.e., 20 mm). However, the track spikes construction has been modified accordingly, and this teeter-totter effect has been implemented through the increase in the toe spring angle (i.e., the upward curvature of the forefoot insole), adopting a similar angle to the one established at the rocker (Figure 4), or by approximating the rocker axis (Figure 3). It is worth mentioning that this construction could passively dorsiflex the metatarsophalangeal joint, inhibiting the negative work that the dorsiflexion involves during the push-off phase [30,31] and activating the windlass mechanism (i.e., an increased tightness of the plantar aponeurosis) which could also contribute to enhancing running performance [31,32].

5. Conclusions

Reducing the stack height could modify the different footwear features and, therefore, the running performance. With regard to shoe mass, a worthwhile change in running economy and performance could be seen when altering 20 mm the stack height. With respect to the midsole properties, it seems that reducing the stack height does not alter the energy returned, given that the lower midsole deformation is counteracted by an increased stiffness. However, it should be noted that this might affect the timing of the midsole deformation and restitution, which should be matched with the mid and propulsive stance phases. Lastly, the curved geometry of the forefoot sole needed to create the teeter-totter effect could be affected by the stack height reduction. However, current racing footwear designs have counteracted this modification by proximately placing the rocker axis and increasing the toe spring.

6. Future Directions

In 2015, Fuller et al. [33] determined after performing a systematic review of the effect of footwear on running performance and running economy that the former had not been investigated yet. In 2022, although a growing interest emerged, Ruiz-Alias et al. [34] highlighted that the lack of studies was still present. Although different limitations are inherent to performance measures (e.g., athlete involvement) [35], meaningful changes in performance derived from footwear can be discerned through the appropriate methodology and statistical analysis. Likewise, performance measures would enable testing footwear in an actual context (i.e., racing pace, fatigue evolution) compared to the running economy requirements seen to date, where running paces are limited to intensities under the lactate threshold or first ventilatory threshold and running times avoid any onset of fatigue [36]. This is of particular interest given that the different footwear features are expected to significantly change their effects according to the running pace established. Therefore, future studies should consider testing the effect of footwear on running performance through its direct measurement in the competitive context faced by athletes. This should also be extended to sprint and jump events, where the discussed footwear features could also influence performance [37,38]. Likewise, to clearly attribute any performance change to a certain footwear feature, any potential confounders with respect to the footwear design should be controlled, as well as clearly define its specifications (i.e., shoe mass, midsole properties, forefoot geometry).
Lastly, the individual response to this type of footwear trend should also be mentioned. Knopp et al. [39] have recently determined that either Kenyan word-class or European amateur-male runners present a wide response to this type of racing footwear compared to a traditional racing flat with no stiff elements. Specifically, the Kenyan cohort displayed an 11.3% drawback to an 11.4% benefit, and the European cohort displayed a 1.1% drawback to a 9.7% benefit. A potential theory that could explain this variability is the so-called “footwear comfort filter” [40]. Nigg et al. [40] proposed that athletes tend to maintain a certain movement path as this is the most efficient way that the neuromuscular system has to develop it. Accordingly, if an external factor such as running footwear interferes with this preferred path, muscle activity will be increased to preserve this pattern, and therefore, the running economy will be altered. Related to this paradigm, Madden et al. [41] specified that those non-responders to this kind of footwear with an increased longitudinal stiffness maintained their ankle angular velocity, resulting probably in increased muscle activity. Therefore, while there is a common pattern to this new trend in running shoes (i.e., increased longitudinal stiffness, increased rocker angles, and toe springs), the individual nature response should be explored.

Funding

This work is related to the dissertation of Santiago A. Ruiz-Alias, which is funded by the Spanish Ministry of Universities under the grant FPU19/00542.

Conflicts of Interest

The authors declare no conflict of interest.

References

  1. Joyner, M.J.; Ruiz, J.R.; Lucia, A. The two-hour marathon: Who and when? J. Appl. Physiol. 2011, 110, 275–277. [Google Scholar] [CrossRef] [PubMed]
  2. Bermon, S.; Garrandes, F.; Szabo, A.; Berkovics, I.; Adami, P.E. Effect of advanced shoe technology on the evolution of road race times in male and female elite runners. Front. Sports Act. Living 2021, 3, 653173. [Google Scholar] [CrossRef] [PubMed]
  3. Jones, A.M.; Kirby, B.S.; Clark, I.E.; Rice, H.M.; Fulkerson, E.; Wylie, L.J.; Wilkerson, D.P.; Vanhatalo, A.; Wilkins, B.W. Physiological demands of running at 2-hour marathon race pace. J. Appl. Physiol. 2021, 130, 369–379. [Google Scholar] [CrossRef]
  4. Lundby, C.; Robach, P. Performance enhancement: What are the physiological limits? Physiology 2015, 30, 282–292. [Google Scholar] [CrossRef] [PubMed]
  5. Poole, D.C.; Burnley, M.; Vanhatalo, A.; Rossiter, H.B.; Jones, A.M. Critical power: An important fatigue threshold in exercise physiology. Med. Sci. Sports Exerc. 2016, 48, 2320–2334. [Google Scholar] [CrossRef] [PubMed]
  6. Hoogkamer, W.; Kipp, S.; Frank, J.H.; Farina, E.M.; Luo, G.; Kram, R. A comparison of the energetic cost of running in marathon racing shoes. Sports Med. 2018, 48, 1009–1019. [Google Scholar] [CrossRef]
  7. Snyder, K.L.; Hoogkamer, W.; Triska, C.; Taboga, P.; Arellano, C.J.; Kram, R. Effects of course design (curves and elevation undulations) on marathon running performance: A comparison of Breaking 2 in Monza and the INEOS 1:59 Challenge in Vienna. J. Sports Sci. 2021, 39, 754–759. [Google Scholar] [CrossRef]
  8. Rodrigo-Carranza, V.; González-Mohíno, F.; Santos-Concejero, J.; González-Ravé, J.M. Impact of advanced footwear technology on elite men’s in the evolution of road race performance. J. Sports Sci. 2022, 40, 2661–2668. [Google Scholar] [CrossRef]
  9. World Athletics. Technical Rules. Available online: https://www.worldathletics.org/about-iaaf/documents/book-of-rules (accessed on 1 September 2023).
  10. Burns, G.T.; Tam, N. Is it the shoes? A simple proposal for regulating footwear in road running. Br. J. Sports Med. 2020, 54, 439–440. [Google Scholar] [CrossRef]
  11. Frederick, E.C. No evidence of a performance advantage attributable to midsole thickness. Footwear Sci. 2020, 12, 1–2. [Google Scholar] [CrossRef]
  12. Hoogkamer, W. More isn’t always better. Footwear Sci. 2020, 12, 75–77. [Google Scholar] [CrossRef]
  13. Nigg, B.M.; Cigoja, S.; Nigg, S.R. Effects of running shoe construction on performance in long distance running. Footwear Sci. 2020, 12, 133–138. [Google Scholar] [CrossRef]
  14. Nigg, B.M.; Cigoja, S.; Nigg, S.R. Teeter-totter effect: A new mechanism to understand shoe-related improvements in long-distance running. Br. J. Sports Med. 2021, 55, 462–463. [Google Scholar] [CrossRef]
  15. Rodrigo-Carranza, V.; González-Mohíno, F.; Santos del Cerro, J.; Santos-Concejero, J.; González-Ravé, J.M. Influence of advanced shoe technology on the top 100 annual performances in men’s marathon from 2015 to 2019. Sci. Rep. 2021, 11, 22458. [Google Scholar] [CrossRef] [PubMed]
  16. Honert, E.C.; Mohr, M.; Lam, W.K.; Nigg, S. Shoe feature recommendations for different running levels: A Delphi study. PLoS ONE 2020, 15, e0236047. [Google Scholar] [CrossRef]
  17. Barrons, Z.B.; Wannop, J.W.; Stefanyshyn, D.J. The influence of footwear midsole thickness on running biomechanics and running economy in female and male runners. Footwear Sci. 2023, 15, 155–160. [Google Scholar] [CrossRef]
  18. Bertschy, M.; Lino, H.; Healey, L.; Hoogkamer, W. Effects of midsole stack height and foam on the metabolic cost of running. Footwear Sci. 2023, 15, S180–S181. [Google Scholar] [CrossRef]
  19. Rodrigo-Carranza, V.; González-Mohíno, F.; Santos-Concejero, J.; González-Ravé, J.M. Influence of shoe mass on performance and running economy in trained runners. Front. Physiol. 2020, 11, 573660. [Google Scholar] [CrossRef]
  20. Franz, J.R.; Wierzbinski, C.M.; Kram, R. Metabolic cost of running barefoot versus shod: Is lighter better? Med. Sci. Sports Exerc. 2012, 44, 1519–1525. [Google Scholar] [CrossRef]
  21. Hoogkamer, W.; Kipp, S.; Spiering, B.A.; Kram, R. Altered running economy directly translates to altered distance-running performance. Med. Sci. Sports Exerc. 2016, 48, 2175–2180. [Google Scholar] [CrossRef]
  22. Jakob-Andersen, J. Runrepeat. Available online: https://runrepeat.com/ (accessed on 24 August 2023).
  23. Tung, K.D.; Franz, J.R.; Kram, R. A test of the metabolic cost of cushioning hypothesis during unshod and shod running. Med. Sci. Sports Exerc. 2014, 46, 324–329. [Google Scholar] [CrossRef] [PubMed]
  24. Worobets, J.; Tomaras, E.; William Wannop, J.; Stefanyshyn, D. Running shoe cushioning properties can influence oxygen consumption. Footwear Sci. 2013, 5, S75–S76. [Google Scholar] [CrossRef]
  25. Joubert, D.P.; Jones, G.P. A comparison of running economy across seven highly cushioned racing shoes with carbon-fibre plates. Footwear Sci. 2022, 14, 71–83. [Google Scholar] [CrossRef]
  26. Puig-Diví, A.; Escalona-Marfil, C.; Padullés-Riu, J.M.; Busquets, A.; Padullés-Chando, X.; Marcos-Ruiz, D. Validity and reliability of the Kinovea program in obtaining angles and distances using coordinates in 4 perspectives. PLoS ONE 2019, 14, e0216448. [Google Scholar] [CrossRef]
  27. Nigg, B.M.; Segesser, B. Biomechanical and orthopedic concepts in sport shoe construction. Med. Sci. Sports Exerc. 1992, 24, 595–602. [Google Scholar] [CrossRef] [PubMed]
  28. Stefanyshyn, D.J.; Nigg, B.M. Energy aspects associated with sport shoes. Sportverletz. Sportschaden 2000, 14, 82–89. [Google Scholar] [CrossRef] [PubMed]
  29. Gray, A.; Andrews, M.; Waldron, M.; Jenkins, D. A model for calculating the mechanical demands of overground running. Sports Biomech. 2020; Online ahead of print. [Google Scholar] [CrossRef]
  30. Farina, E.M.; Haigh, D.; Luo, G. Creating footwear for performance running. Science 2019, 10, 179–187. [Google Scholar] [CrossRef]
  31. Sichting, F.; Holowka, N.B.; Hansen, O.B.; Lieberman, D.E. Effect of the upward curvature of toe springs on walking biomechanics in humans. Sci. Rep. 2020, 10, 14643. [Google Scholar] [CrossRef]
  32. Stearne, S.M.; McDonald, K.A.; Alderson, J.A.; North, I.; Oxnard, C.E.; Rubenson, J. The foot’s arch and the energetics of human locomotion. Sci. Rep. 2016, 6, 19403. [Google Scholar] [CrossRef]
  33. Fuller, J.T.; Bellenger, C.R.; Thewlis, D.; Tsiros, M.D.; Buckley, J.D. The effect of footwear on running performance and running economy in distance runners. Sports Med. 2015, 45, 411–422. [Google Scholar] [CrossRef]
  34. Ruiz-Alias, S.A.; Molina-Molina, A.; Soto-Hermoso, V.M.; García-Pinillos, F. A systematic review of the effect of running shoes on running economy, performance and biomechanics: Analysis by brand and model. Sports Biomech. 2023, 22, 388–409. [Google Scholar] [CrossRef]
  35. Healey, L.; Bertschy, M.; Kipp, S.; Hoogkamer, W. Can we quantify the benefits of “super spikes” in track running? Sports Med. 2022, 52, 1211–1218. [Google Scholar] [CrossRef] [PubMed]
  36. Barnes, K.R.; Kilding, A.E. Running economy: Measurement, norms, and determining factors. Sports Med. Open 2015, 1, 1–15. [Google Scholar] [CrossRef] [PubMed]
  37. Stefanyshyn, D.J.; Nigg, B.M. Influence of midsole bending stiffness on joint energy and jump height performance. Med. Sci. Sports Exerc. 2000, 32, 471. [Google Scholar] [CrossRef] [PubMed]
  38. Stefanyshyn, D.; Fusco, C. Athletics: Increased shoe bending stiffness increases sprint performance. Sports Biomech. 2004, 3, 55–66. [Google Scholar] [CrossRef] [PubMed]
  39. Knopp, M.; Muñiz-Pardos, B.; Wackerhage, H.; Schönfelder, M.; Guppy, F.; Pitsiladis, Y.; Ruiz, D. Variability in Running Economy of Kenyan World-Class and European Amateur Male Runners with Advanced Footwear Running Technology: Experimental and Meta-analysis Results. Sports Med. 2023, 6, 1255–1271. [Google Scholar] [CrossRef]
  40. Nigg, B.M.; Baltich, J.; Hoerzer, S.; Enders, H. Running shoes and running injuries: Myth busting and a proposal for two new paradigms: ‘Preferred movement path’ and ‘comfort filter’. Br. J. Sports Med. 2015, 49, 1290–1294. [Google Scholar] [CrossRef]
  41. Madden, R.; Sakaguchi, M.; Tomaras, E.K.; Wannop, J.W.; Stefanyshyn, D. Forefoot bending stiffness, running economy and kinematics during overground running. Footwear Sci. 2016, 8, 91–98. [Google Scholar] [CrossRef]
Figure 1. Flow diagram of study selection.
Applsci 13 11721 g001
Figure 2. Rearfoot stack height and shoe mass relationship of the same footwear prototype [17] (Black dots: 35 mm, 214.5 g; 40 mm, 229.5 g; 45 mm, 241.5 g; 50 mm, 260.5 g) and from different racing footwear models retrieved from a specialized running footwear website [22]. White dots: Reebok Floatride Run Fast Pro (100 g, 16 mm), Nike Flyknit Racer (160 g, 24 mm), Saucony Fastwitch 9 (170 g, 19 mm), Adidas Adizero Takumi Sen 7 (170 g, 24 mm), Adidas Adizero Takumi Sen 9 (181 g, 33 mm), Nike Zoom Vaporfly 4% (184 g, 39 mm), Nike ZoomX Vaporfly Next% (187 g, 40 mm), PUMA Deviate Nitro Elite (190 g, 36 mm), ASICS MetaRacer (190 g, 24 mm), ASICS Metaspeed Edge (190 g, 29 mm), Adidas Adizero Takumi Sen 8 (193 g, 33 mm), Saucony Endorphin Pro+ (196 g, 35 mm), Nike ZoomX Vaporfly NEXT% 2 (196 g, 39 mm), ASICS Metaspeed Sky (198 g, 33 mm) and PUMA Fast FWD Nitro Elite (198 g, 38 mm).
Applsci 13 11721 g002
Figure 3. Rocker axis position (i.e., the starting point of the forefoot upward curvature) and rocker radius of current footwear models of different brands with different stack heights. The measures were performed with the Kinovea free-access software using a sagittal image of each model placed in the same position. The rocker axis was placed at the center of the rocker radius circle and calculated by the relative position to the total length (i.e., 28 cm for all models). The rocker radius indicates the degree of the upward forefoot curvature of the sole (i.e., a greater rocker radius indicates a lower upward curvature). (TOP): Adidas Adizero Prime X Strung (50 mm, 67%, 10.6 cm), (MIDDLE): Adidas Adizero Pro 3.0 (40 mm, 67%, 11.8 cm), (BOTTOM): Adidas Adizero Takumi Sen 9 (33 mm, 63.8%, 15.9 cm), (TOP): Asics Metaspeed Sky+ (39 mm, 65.8%, 11.2 cm), (MIDDLE): Asics Metaspeed Edge+ (39 mm, 64.7%, 12.8 cm), (BOTTOM): Asics Metaracer Tokyo (24 mm, 57%, 18.2 cm), (TOP): Nike Air Zoom Aplhafly Next% (39 mm, 71.1%, 10.5 cm), (MIDDLE): Nike ZoomX Vaporfly Next% 3 (40 mm, 66.4%, 11.7 cm), (BOTTOM): Nike ZoomX Vaporfly NEXT% 2 (39 mm, 66.4%, 13.0 cm). Note that the rocker radius is an approximation.
Applsci 13 11721 g003
Figure 4. Toe spring (left) and rocker radius (right) values, as well as rocker axis position of current track spikes of different brands for long, mid, and sprint events. (TOP): Adidas Adizero Avanti TYO (18.6 cm, 18.6 cm, 61.8%), (MIDDLE): Adidas Adizero Ambition (15.9 cm, 14.1 cm, 64%), (BOTTOM): Adidas Adizero Finesse (17.9 cm, 17.9 cm, 59.3%), (TOP): Nike ZoomX Dragonfly (19.4 cm, 19.4 cm, 54.4%), (MIDDLE): Nike Air Zoom Victory (18.9 cm, 18.9 cm, 62.3%), (BOTTOM): Nike Air Zoom MaxFly (16.7 cm, 15.5 cm, 59.3%). Note that the rocker and toe springs radius are an approximation.
Applsci 13 11721 g004
Table 1. Maximum stack height established by the World Athletics from 2019 to 2024 for the different running events.
Event2019–20222022–20242024
<800 m20 mm20 mm20 mm
≥800 m25 mm25 mm20 mm
Road40 mm40 mm40 mm
Cross
Country
25 mm spike shoe or
non-spike shoe
20 mm spike shoe or
40 mm non-spike shoe
20 mm spike shoe or
40 mm non-spike shoe
Disclaimer/Publisher’s Note: The statements, opinions and data contained in all publications are solely those of the individual author(s) and contributor(s) and not of MDPI and/or the editor(s). MDPI and/or the editor(s) disclaim responsibility for any injury to people or property resulting from any ideas, methods, instructions or products referred to in the content.