


Abstract
The rapid development of solar energy technology has led to significant progress in recent years, but the daily maintenance of solar panels faces significant challenges. The diagnosis of solar panel failures by infrared detection devices can improve the efficiency of maintenance personnel. Currently, due to the scarcity of infrared solar panel failure samples and the problem of unclear image effective features, traditional deep neural network models can easily encounter overfitting and poor generalization performance under small sample conditions. To address these problems, this paper proposes a solar panel failure diagnosis method based on an improved Siamese network. Firstly, two types of solar panel samples of the same category are constructed. Secondly, the images of the samples are input into the feature model combining convolution, adaptive coordinate attention (ACA), and the feature fusion module (FFM) to extract features, learning the similarities between different types of solar panel samples. Finally, the trained model is used to determine the similarity of the input solar image, obtaining the failure diagnosis results. In this case, adaptive coordinate attention can effectively obtain interested effective feature information, and the feature fusion module can integrate the different effective information obtained, further enriching the feature information. The ACA-FFM Siamese network method can alleviate the problem of insufficient sample quantity and effectively improve the classification accuracy, achieving a classification accuracy rate of 83.9% on an open-accessed infrared failure dataset with high similarity.
1. Introduction
Currently, thermal infrared detection technology and deep learning are being integrated in various image processing fields, which can effectively achieve device failure detection classification, and this process has received much attention and research from scholars [1,2]. Convolutional neural networks (CNNs) are the closest biological visual neural networks and have been widely used in visual recognition tasks [3]. However, in the solar power generation field, there are few thermal infrared images with failures. In recent years, unsupervised learning methods such as clustering and sparse automatic encoders have not required such large training samples. Unsupervised feature learning methods such as clustering and sparse automatic encoder-based convolutional networks have not needed to perform overall fine-tuning [4]. Using unsupervised feature learning convolutional models for visual recognition has good application prospects and research value. Thermal infrared images contain rich diagnostic information, and the infrared failure diagnosis method consists of three steps: data collection, failure feature extraction, and failure mode recognition. In these steps, effective feature representations are crucial for improving classification performance.
In recent years, classification of and research on abnormal faults of solar power modules have been conducted. The existing research can be divided into two categories: the use of electrical measurements to detect faults [5] and the visual inspection of thermal imaging images [6]. There are various methods based on electrical measurements, among which the most popular are model-based analysis and data-driven methods [7]. However, some faults that may occur in solar power modules can cause changes in the I–V curve, which are almost impossible to detect. Although this makes fault classification difficult, it also increases the time and installation costs of fault detection systems. Using visual fault classification makes the system monitoring and maintenance simpler, with lower operating costs. With the development of artificial intelligence, the automatic detection and classification of abnormal thermal imaging PV images based on deep learning have become more efficient and accurate [8]. Unlike machine learning techniques, deep learning has higher feature extraction and learning capabilities, allowing for more accurate and robust classification performance. Moreover, deep learning models can provide nonlinear representations and generalization capabilities for big data.
In this study, an ACA-FFM Siamese convolutional neural network model was proposed. The model performs feature extraction followed by similarity logical regression. The key objective of this technology is to reduce the dependence on large-scale datasets. The similarity comparison of images is used to classify equipment heat image faults. The main contributions of this paper include the following three aspects:
- (1)
- A novel feature extraction method based on adaptive coordinate attention (ACA) is proposed, which dynamically adjusts the scope of module attention based on input images, thereby enhancing the ability of multi-scale feature extraction.
- (2)
- A novel feature fusion module (FFM) is designed to enhance feature learning ability and improve the accuracy of fault detection.
- (3)
- Advancements in terms of the average correct classification rate on an open-accessed infrared failure dataset. Experimental results show that the ACA-FFM Siamese network, compared to existing methods, demonstrates higher recognition rates in scenarios of high similarity.
The remainder of this paper is structured as follows: In Section 2, the related technologies are summarized. In Section 3, the proposed network is described in detail. The experimental results are stated in Section 4. Finally, in Section 5, the results of this study are summarized and future work is discussed.
2. Related Work
Currently, the large-scale promotion of thermal infrared detection technology to construct intelligent solar power generation systems is a widely concerned research direction. Intelligent failure classification of solar panel components by thermal infrared detection and electrical characteristic analysis is currently the main method [9]. Thermal infrared detection is the method of taking thermal images of solar panels using infrared cameras and then detecting different types of failures based on the characteristics of the images [10]. Electrical characteristic analysis is the method of collecting the output characteristics of solar panel components and then using these characteristics to detect failures [11].
Due to the ability to identify failures without affecting the normal operation of the solar power generation system, thermal infrared detection is adapted to the detection direction of failure identification. In recent years, with the application of deep learning and other technologies, it has become possible to identify failure characteristics with greater accuracy, and in this way, improve the accuracy of failure detection while reducing the cost of maintenance. Therefore, this method has been widely applied in the field of failure detection. With the continuous development of image feature extraction technology, the failure detection method based on thermal infrared images has received widespread attention [12]. Phan et al. [13] propose a two-stage neural network single-step solar power prediction method that is applicable to small samples, solving the difficulty of applying conventional short-term solar power prediction methods. Manoharan et al. [14] present a simple and enhanced perturb and observation method, which is enhanced by including the change in current, in addition to the changes in output voltage and output power of the PV module. In [15], a single sensor-based economical charging adapter is presented for electric vehicles to provide pillar top solar panels on remote locations, and the logic-tuned deterministic optimization algorithm is proposed to accomplish maximum power point tracking operation and battery charging management.
On the other hand, deep learning models represented by Siamese networks have effectively solved the small sample problem in photovoltaic thermal fault detection. Jiang and Kim [16] propose a health representation learning method based on a Siamese network to prevent overfitting by which the differences between samples in the embedding space of the Siamese network should follow the differences in the remaining useful life values via the introduction of a multitask learning scheme. Tan et al. [17] propose an IoU-aware matching-adaptive Siamese network for visual tracking, which integrates multiple types of encoded feature maps and adaptive sample matching information to simultaneously perform target classification and bounding box regression. Chen et al. [18] propose a simple and effective spatio-temporal attention-based Siamese method, which performs reliable local searching and wide-range re-detection alternatively for robustly tracking drones in the wild. In [19], a high-frequency attention-guided Siamese network is proposed to enhance the high-frequency information of buildings, in which a built-in high-frequency attention block is applied. Guo et al. [20] propose a smart contract vulnerability detection system based on the Siamese network, which improves the original Siamese network model to perform smart contract vulnerability detection by comparing the similarity of two subnetworks with the same structure and shared parameters. In [21], a Siamese network tracker is proposed, which combines shallow–middle–deep feature fusion with a clustering-based adaptive rectangular window filter. Hu et al. [22] propose an object tracking algorithm combining attention mechanism and correlation filter theory based on the framework of full convolutional Siamese neural networks to solve the problem of tracking drift during movement.
3. Methodology
The Siamese network (SN) is a supervised small-sample learning algorithm [23]. Compared to traditional deep learning algorithms, SN can not only learn the features of samples but also learn the differences between similarities and differences between similar and nonsimilar samples [24]. Therefore, with a small number of samples, SN can obtain strong generalization ability and reduce overfitting. Therefore, SN is suitable for the field of solar power diagnosis problems.
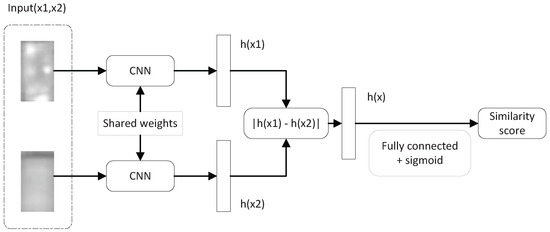
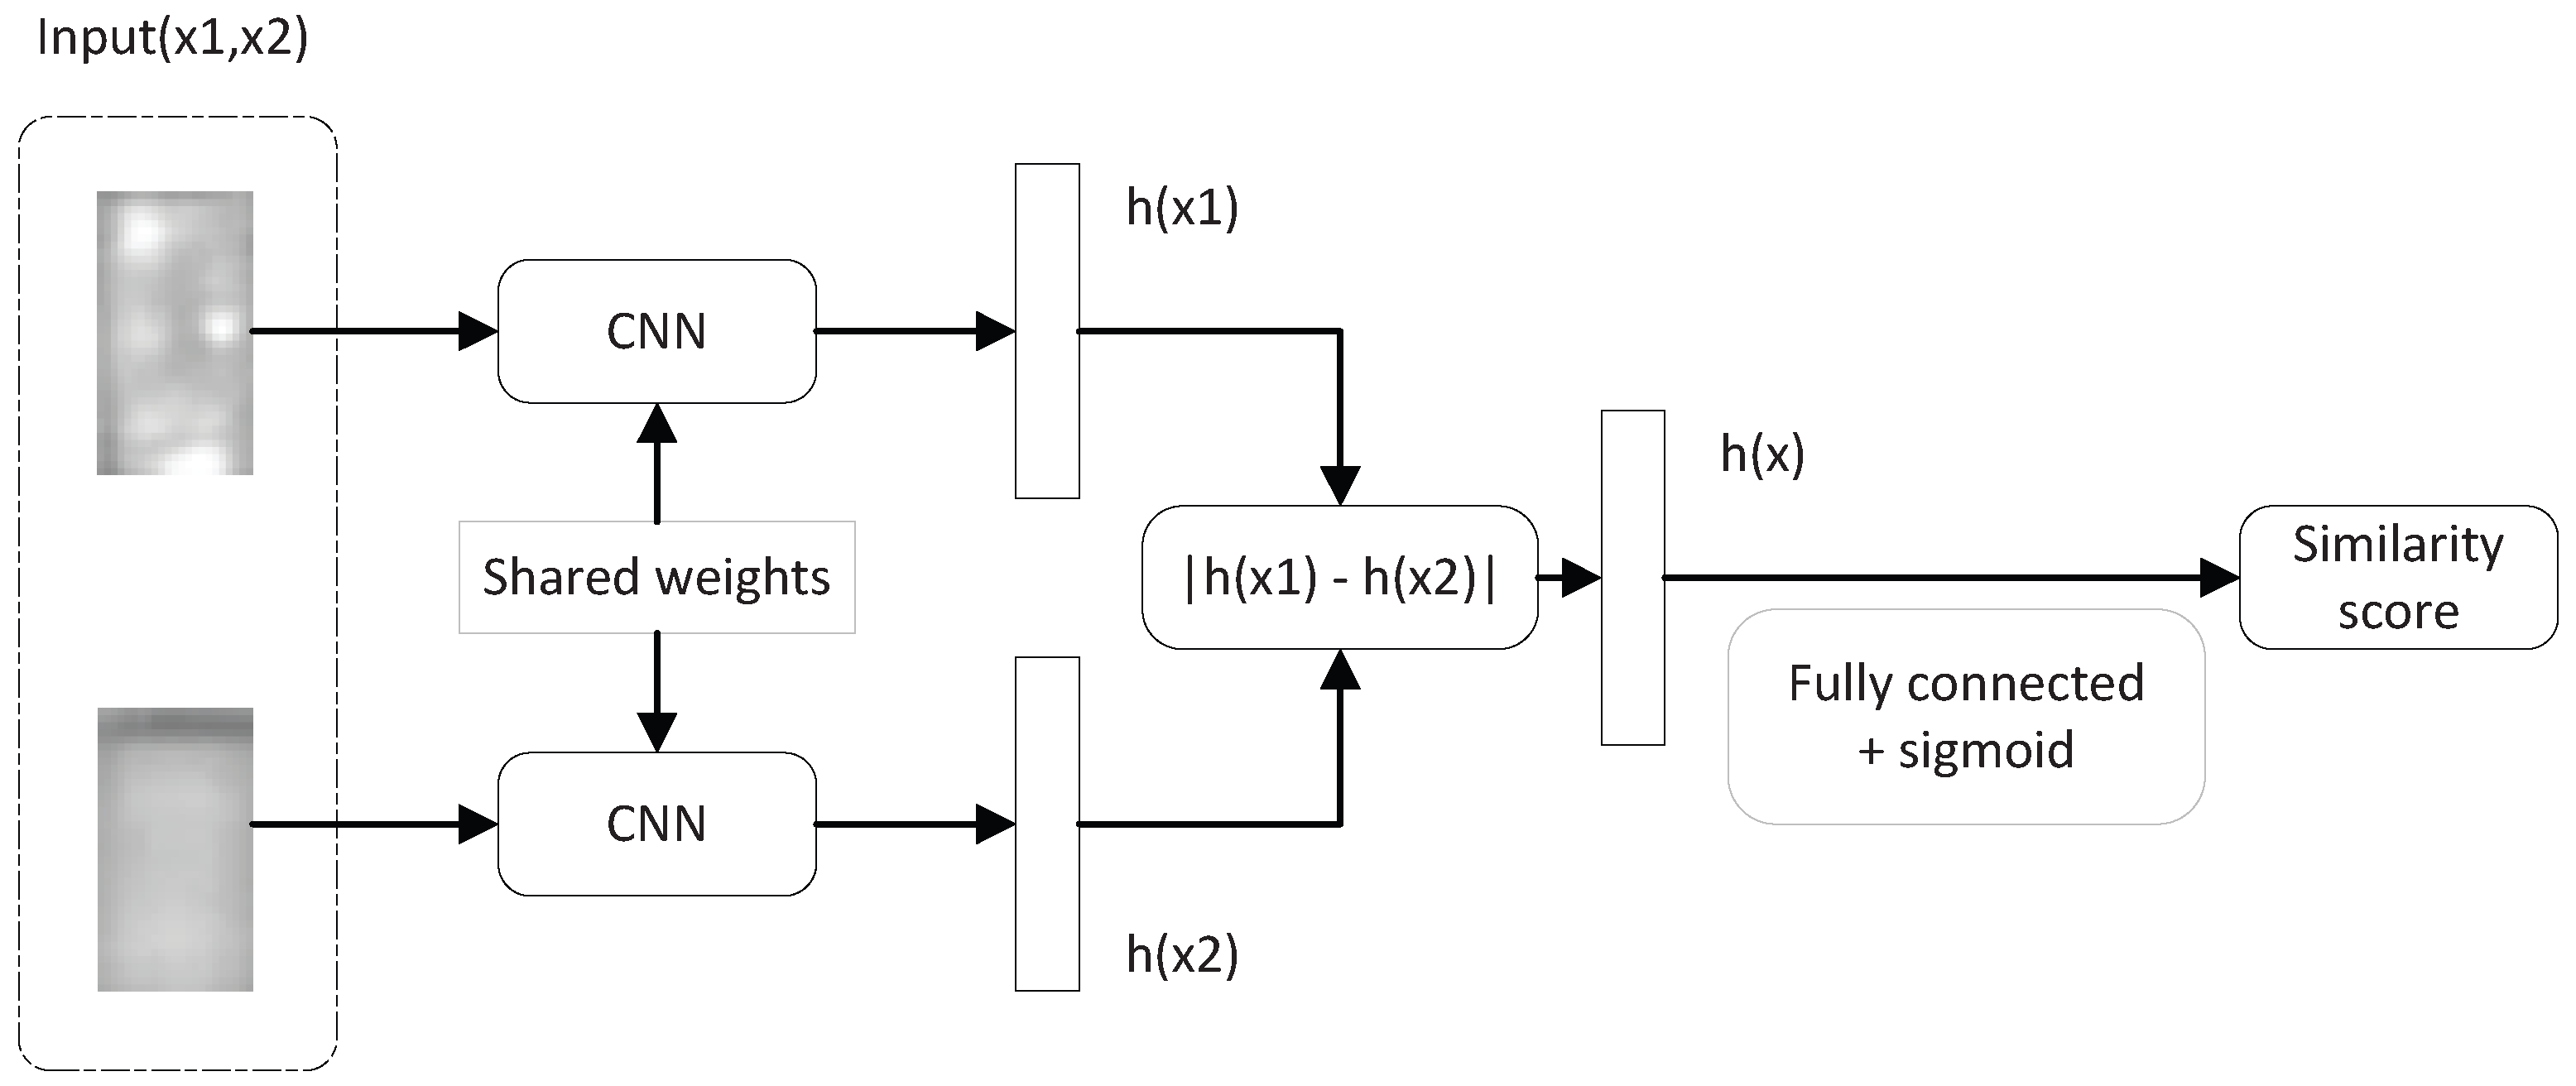
A typical Siamese network is shown in Figure 1. Two sample images form sample pairs as input to the Siamese network. When the two inputs are of the same class, their labels are 1; when the two inputs are of different classes, their labels are 0. The two samples are, respectively, assigned to the two main CNN models of the same structure, and their feature vectors are mapped. The weights of the two core CNN networks are shared. Then, the Euclidean distance between these two feature vectors is calculated, and the similarity between the two samples is obtained through the fully connected layer and sigmoid function, leading to classification results.
Figure 1.
Architecture of a typical Siamese network.
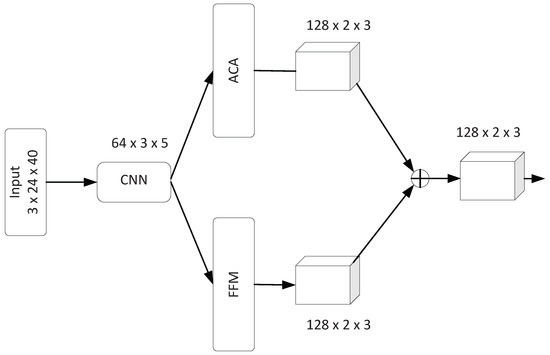
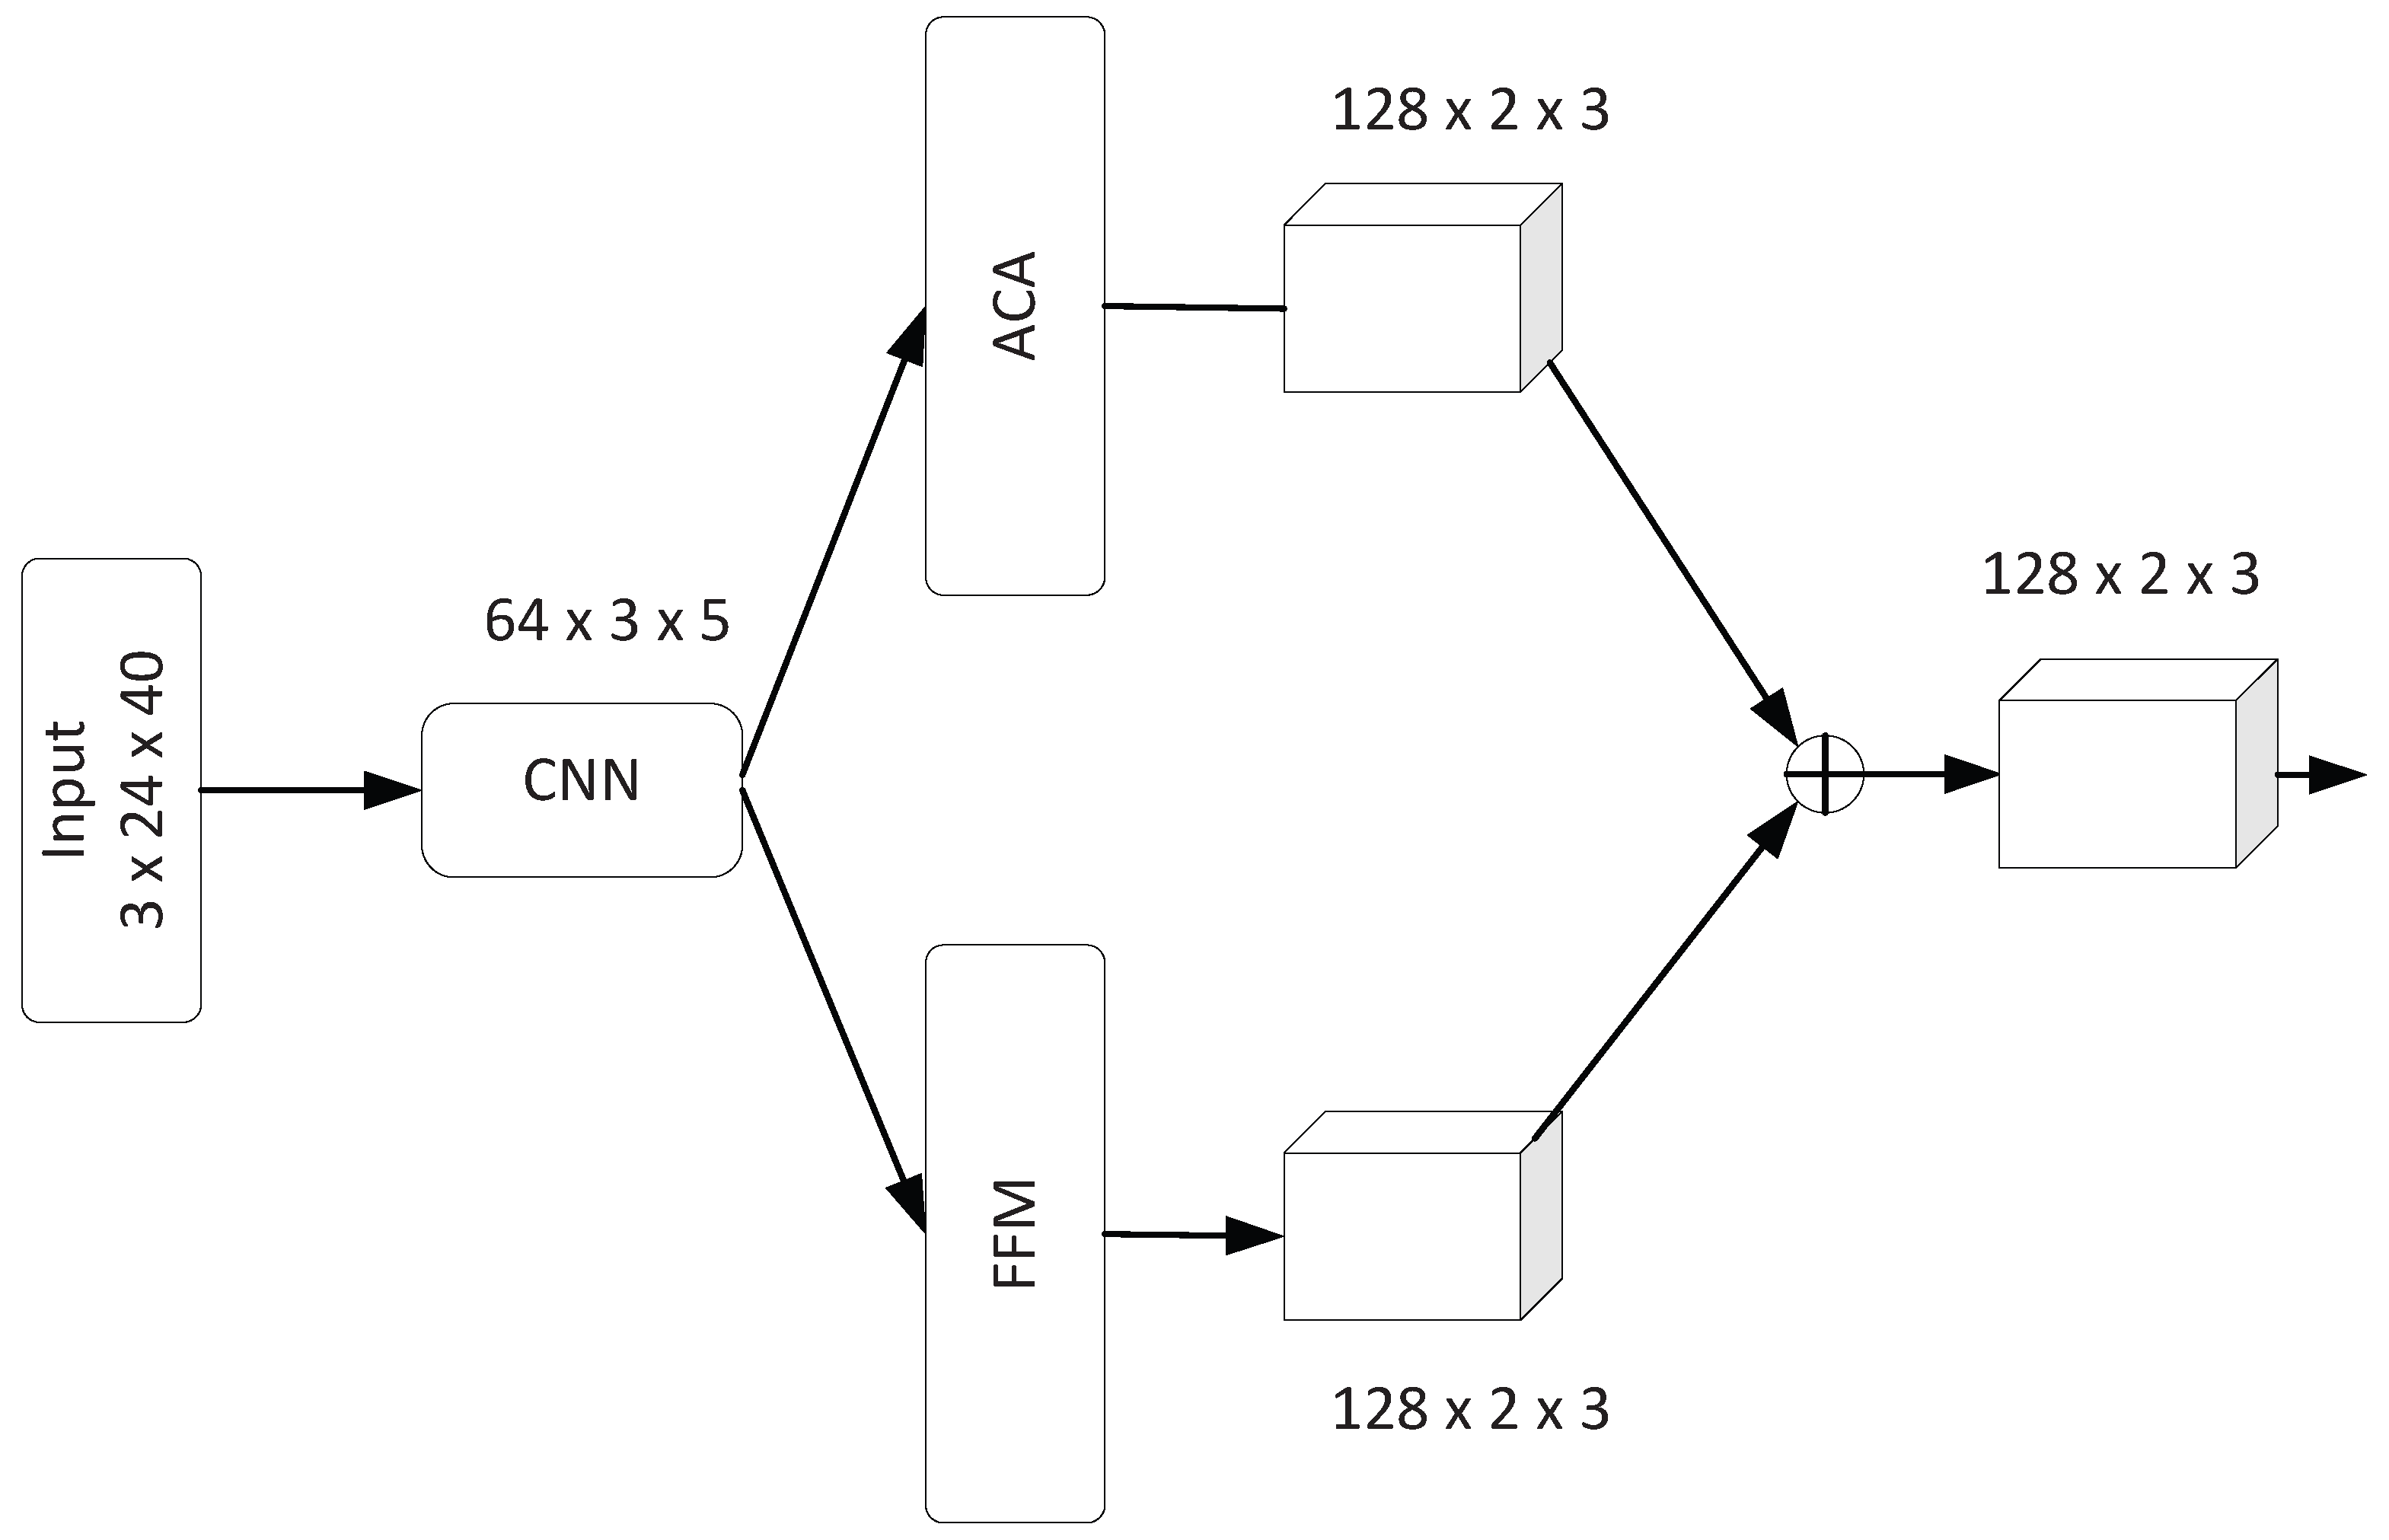
In the classification of solar panel infrared images, considering the small dataset and high similarity, to prevent overfitting, obtains good classification results. Firstly, input C HW = 32440 solar power images into the CNN, and output a 64 × 3 × 5 feature map. The CNN is composed of 3 3 convolution, batch normalization (BN), and ReLU, followed by 3 × 3 convolution, BN, ReLU, and Max-pooling. Then, the output is divided into two parts: the adaptive attention module and the feature fusion module, and a 128 × 2 × 3 feature map is obtained. The adaptive coordinate attention module through the separation and selection mechanism achieves the dynamic adjustment of the module experience field size of the input feature map, enhancing the multi-scale feature extraction ability. The feature fusion module can improve the performance of the network model from both the depth and width aspects, and improve the accuracy of model classification. The overall structure of the proposed ACA-FFM Siamese network is shown in Figure 2.
Figure 2.
Architecture of the proposed ACA-FFM Siamese network.
3.1. Adaptive Coordinate Attention
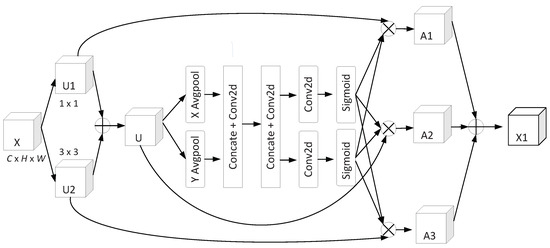
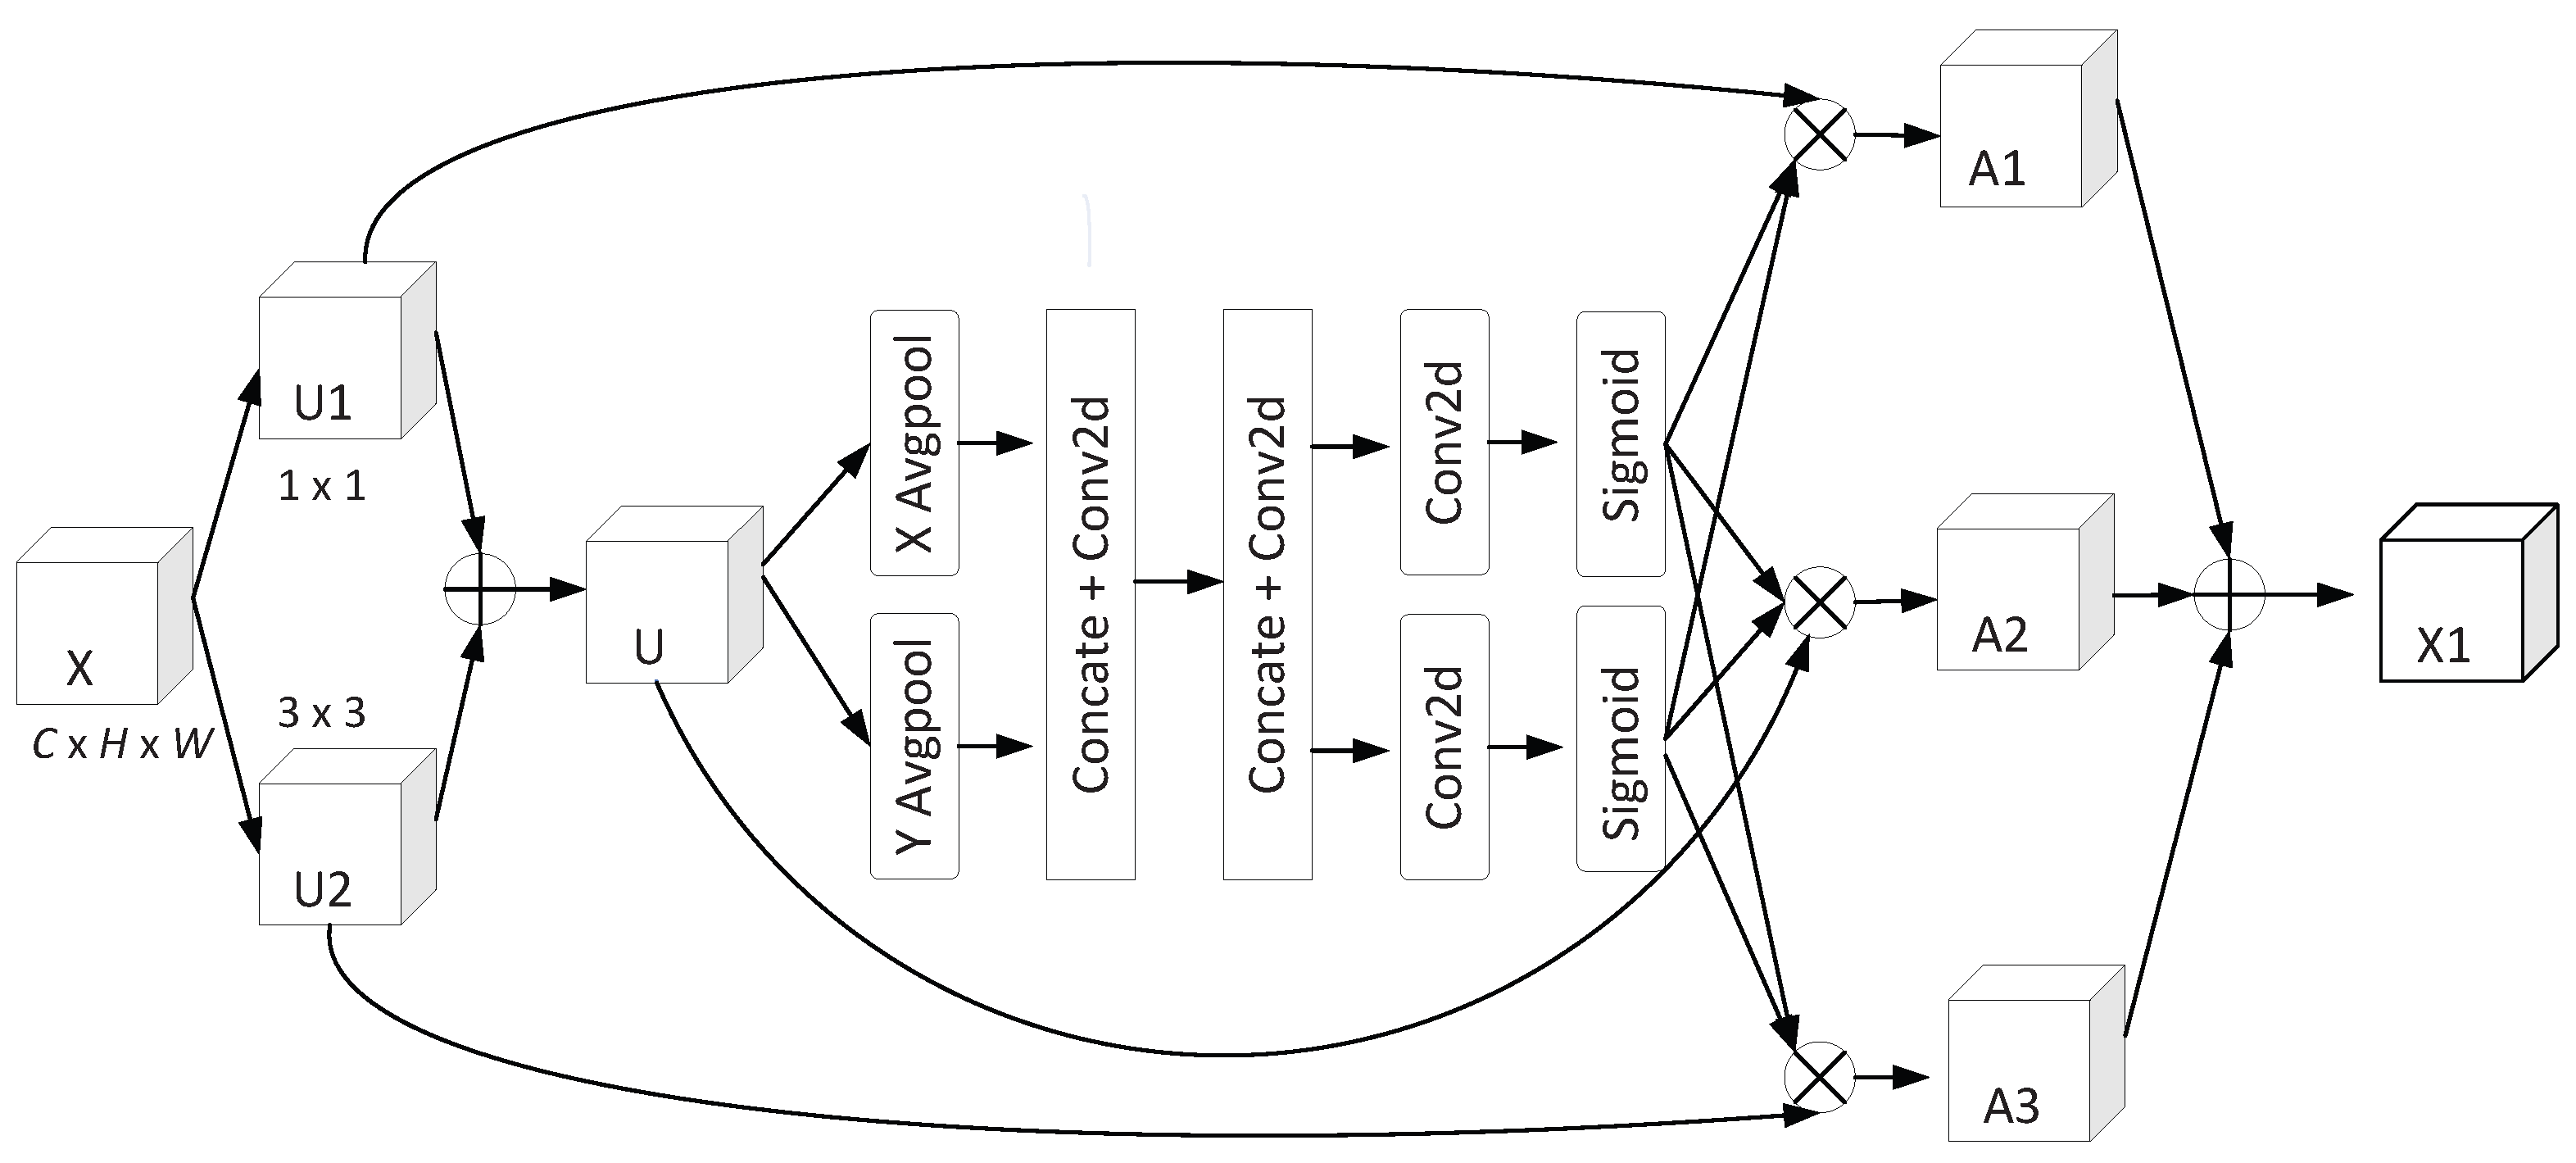
In response to the high similarity between images, it is necessary to effectively learn the effective areas of different failures, and this improvement introduces the coordinate attention mechanism. The coordinate attention mechanism not only considers channel information but also position information related to the direction, providing it with sufficient flexibility and robustness. The illustration of the improved coordinate attention mechanism is shown in Figure 3.
Figure 3.
The proposed adaptive coordinate attention.
First, input the feature maps using 1 × 1 and 3 × 3 convolutional layers, and then concatenate the output of these layers using a concatenate layer with a size of (C, H, W) to obtain a total of C features. Next, apply a 3 × 3 convolutional layer with a stride of 2 to obtain higher-level features with C × 3 × 3 dimensions. Use a convolutional layer with a kernel size of (H, 1) and (1, W) to pool the feature maps, resulting in C × 1 × W and C × H × 1 feature maps, each with a size of C × 1 × W and C × H × 1, respectively. Finally, use a pool layer with a size of (C, H, 1) to pool the output of the last convolutional layer, resulting in C × 1 × W feature maps with a size of C × H × 1. The output of the C-th channel in the height dimension is defined as:
and the output of the C-th channel in the width dimension can be represented as:
After the above transformation, the features extracted from the two directions are concatenated and convolutionally transformed, and a nonlinear activation function, as shown in Equation (3), is used for activation.
where denotes the assembly process, and the step involves convolution translation, with being a nonlinear activation function. Building upon this foundation, the output values of function f are processed by high-level and low-level convolution operations with Sigmoid functions, resulting in two output locations, as shown in Equation (4).
After obtaining and , the features maps , , and are obtained by multiplying , , and U with and , respectively. These maps, essentially, represent the information output by convolutions with different receptive fields. Finally, these three feature maps are merged to obtain the final output feature map .
Compared to the traditional attention module, the ACA module can dynamically adjust the sensitivity field of the module, enhancing the capability of multi-scale feature extraction. In the coordinate attention part, spatial feature clusters are formed along two directions, generating two feature graphs with direction sensitivity. While storing location information in one direction, the network captures the long-term dependencies of the other direction, assisting in obtaining more precise effective feature information.
3.2. Feature Fusion Module
Inception is the process of assembled multiple convolution or pooling operations into one network module, for the purpose of designing neural networks. When designing neural networks, modules of a certain size are grouped together to form the overall network structure. The design of Inception establishes a sparse network structure that enables the generation of dense data, increasing both the feature extraction and encoding capabilities of the neural network while ensuring efficient utilization of computational resources.
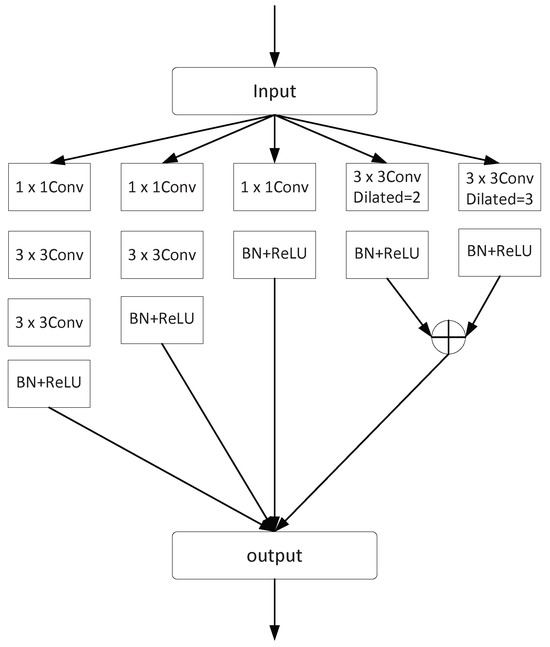
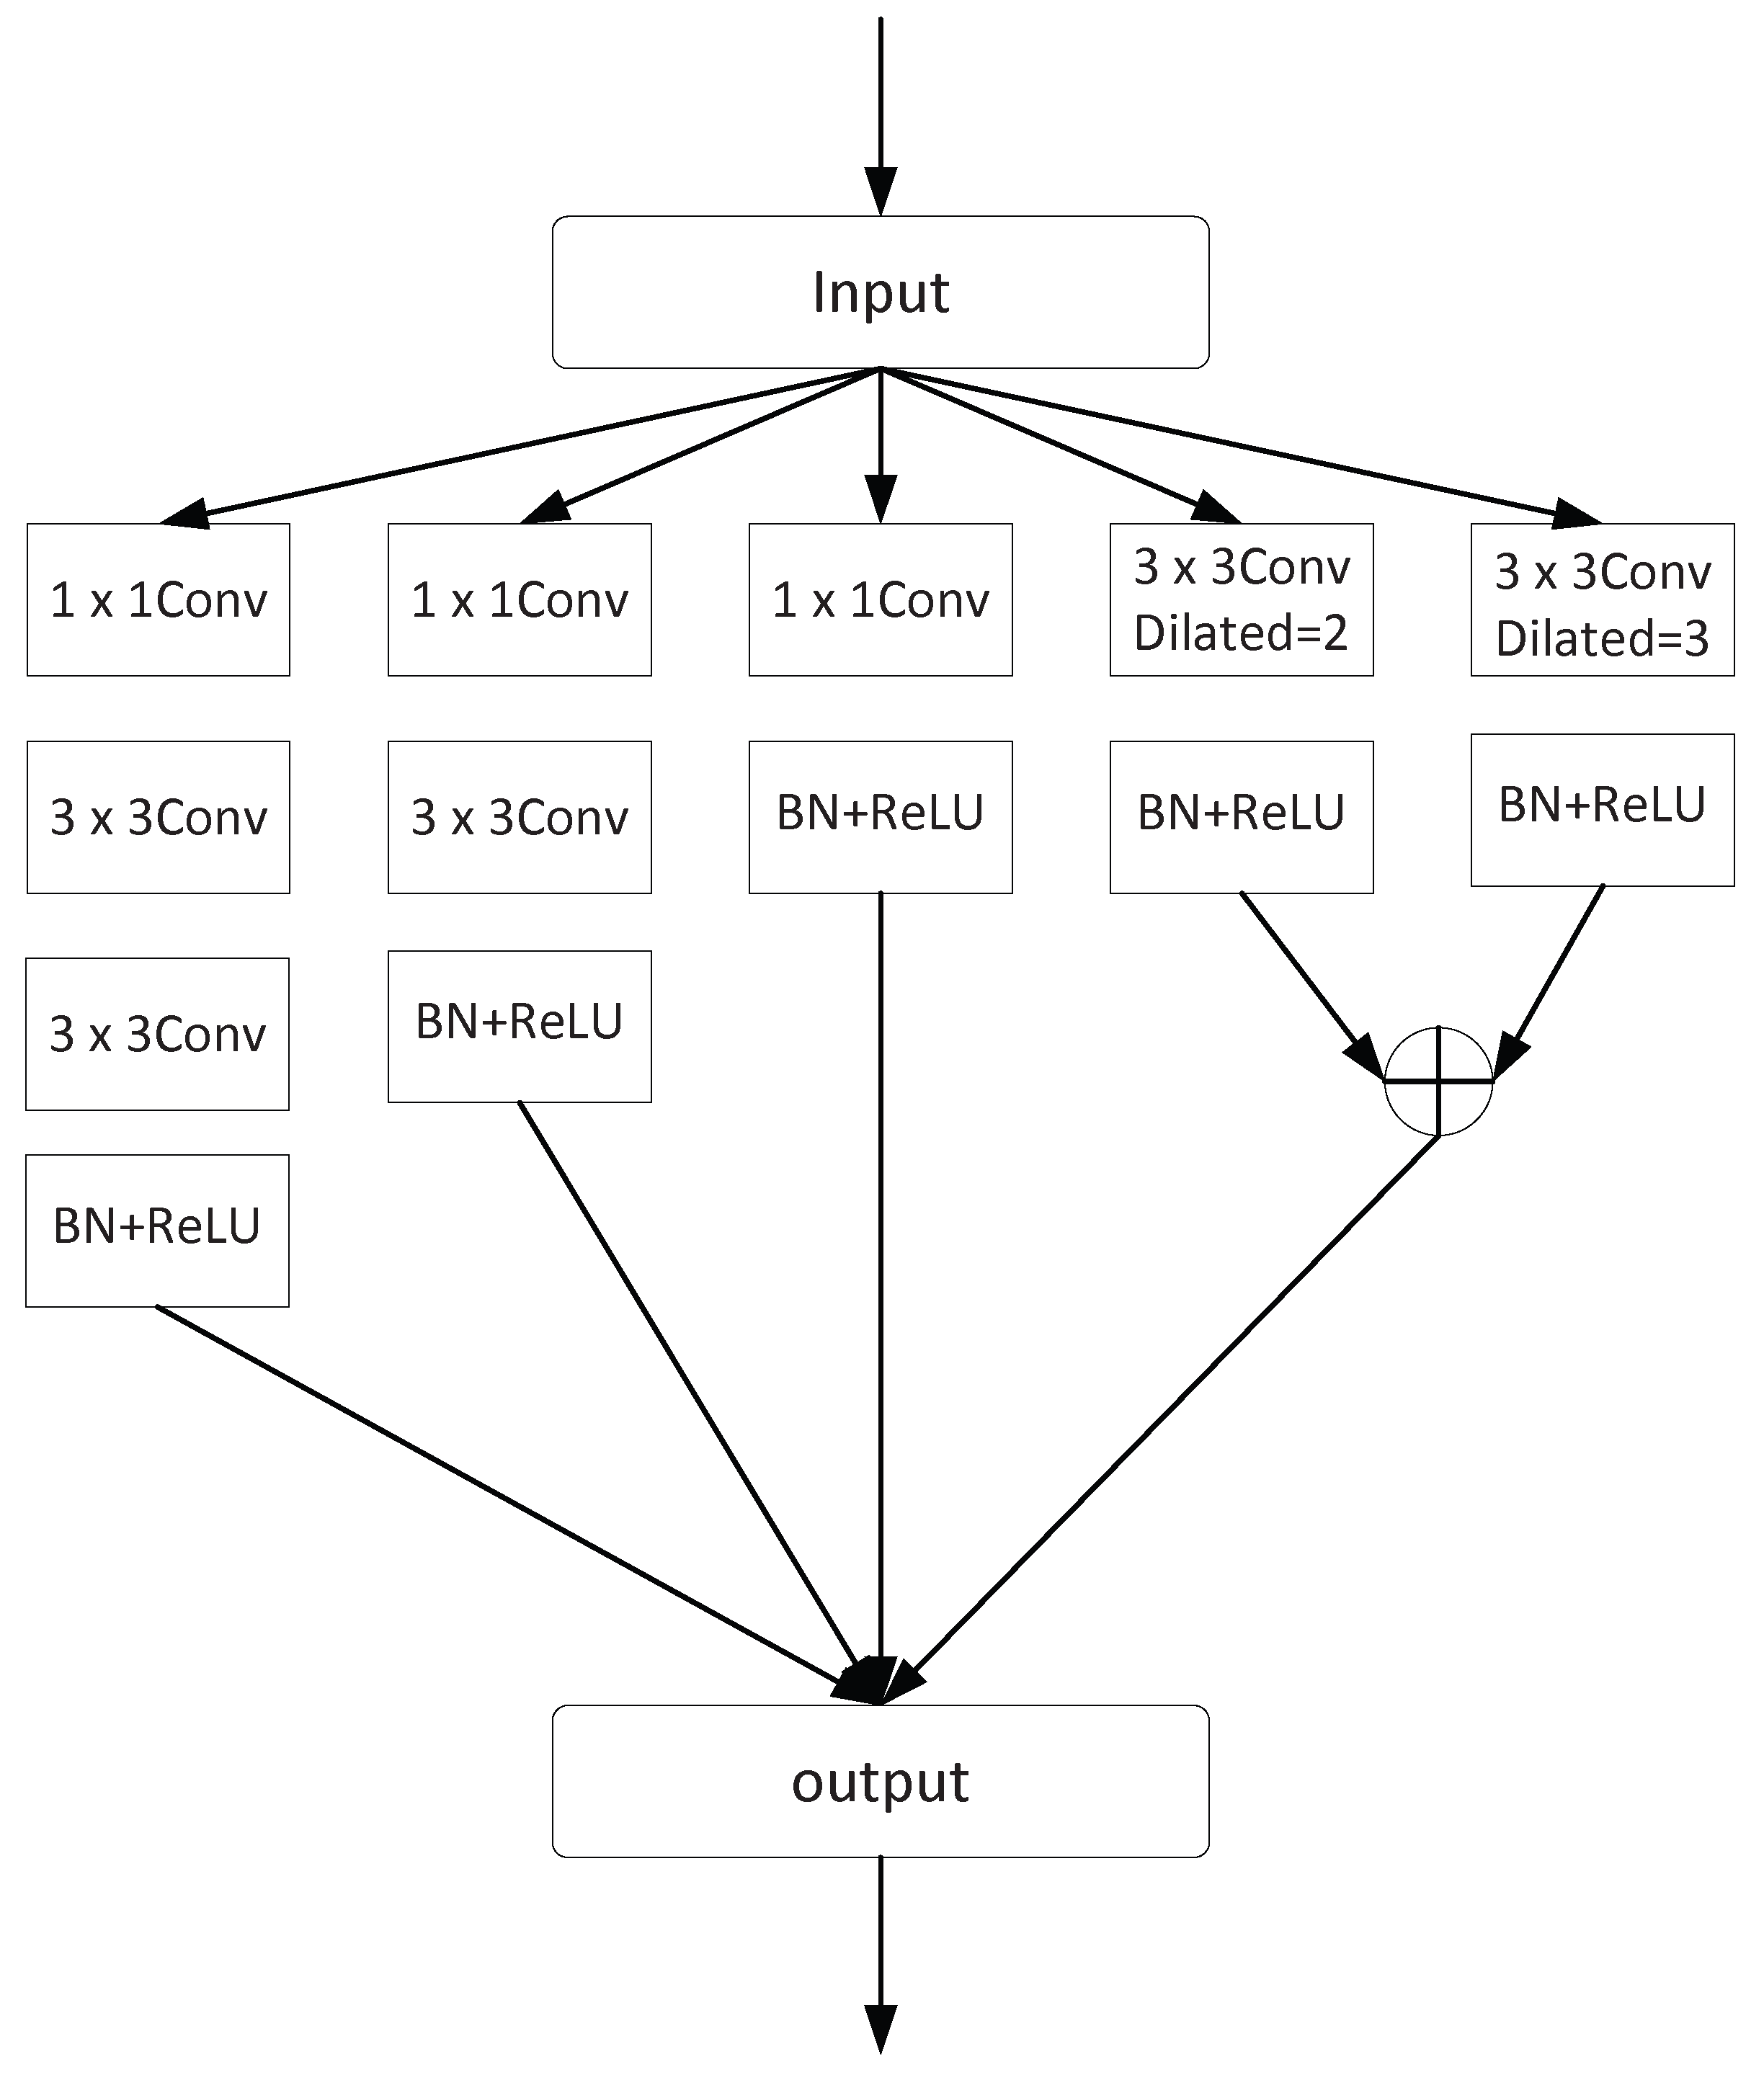
Inspired by the Inception structure, the proposed FFM module utilized a network structure as shown in Figure 4. The convolution operation of the Inception module mainly aims at feature compression and data compression, but will often omit a large amount of feature information. This greatly enhances the difficulty of extracting effective solar power features. Therefore, in the FFM structure, two box-containing convolutions with different cavity rates were replaced by box-containing convolutions with different cavity rates to reduce the probability of overfitting. Box-containing convolution can combine different spreading rates to obtain feature field ranges at different scales without the loss of resolution [25,26]. The feature information acquired through the combination of different spreading rate convolutions is added finally to obtain more robust feature information.
Figure 4.
The proposed feature fusion module.
Firstly, the input feature map is passed through four branches, each composed of 1 × 1 convolutions and 3 × 3 convolutions with different kernel sizes. After each convolution, batch normalization (BN) and ReLU activation are executed. Batch normalization can accelerate model training, while activation operations can enhance feature representation ability. After obtaining the feature information of the four branches, the original features are concatenated through the concatenation operation without losing feature information and increasing the network’s nonlinearity. This work improved the efficiency of feature extraction to some degree.
3.3. Loss Function
The loss function is one of the two essential elements required to compile a neural network model. This paper first classifies the required data, with two images of the same category assigned a label of 1 and two images of different categories assigned a label of 0. After these two images enter the common weight CNN feature and , the similarity measure is sent to the loss function for training and the optimization of network parameters. Comparative disadvantage can effectively handle pair data in the Siamese network. The comparison loss function is shown in Equation (5).
where D represents the Euclidean distance between two samples, while Y serves as the label of the sample pair. If two samples belong to the same class, Y is set to 1, indicating that both samples belong to the same category. N represents the number of sample pairs, and m is a threshold, which means only considering sample pairs with Euclidean distances between 0 and m, and when the distance exceeds m, their losses are considered to be zero.
Our objective is to minimize the similarity loss of paired samples. When two samples belong to the same class, i.e., , the loss can be calculated by:
When two samples fall into different classes, i.e., Y = 0, the loss can be expressed as:
This study aims to minimize the Euclidean distance within the feature space between similar classes while maximizing the distance between different classes. This comparative loss function effectively communicates the semantic relationship between samples. The BCELoss is employed in this paper to effectively classify solar panel infrared images.
4. Experiments
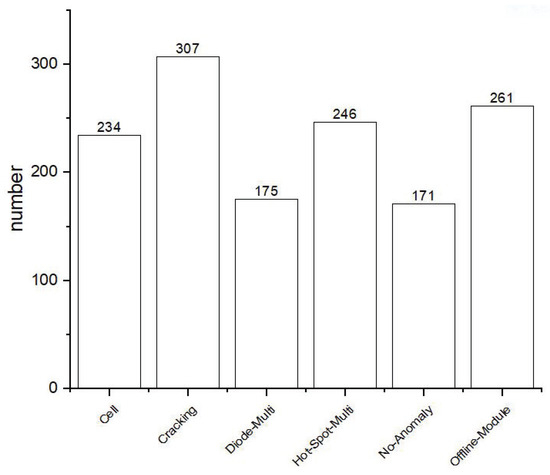
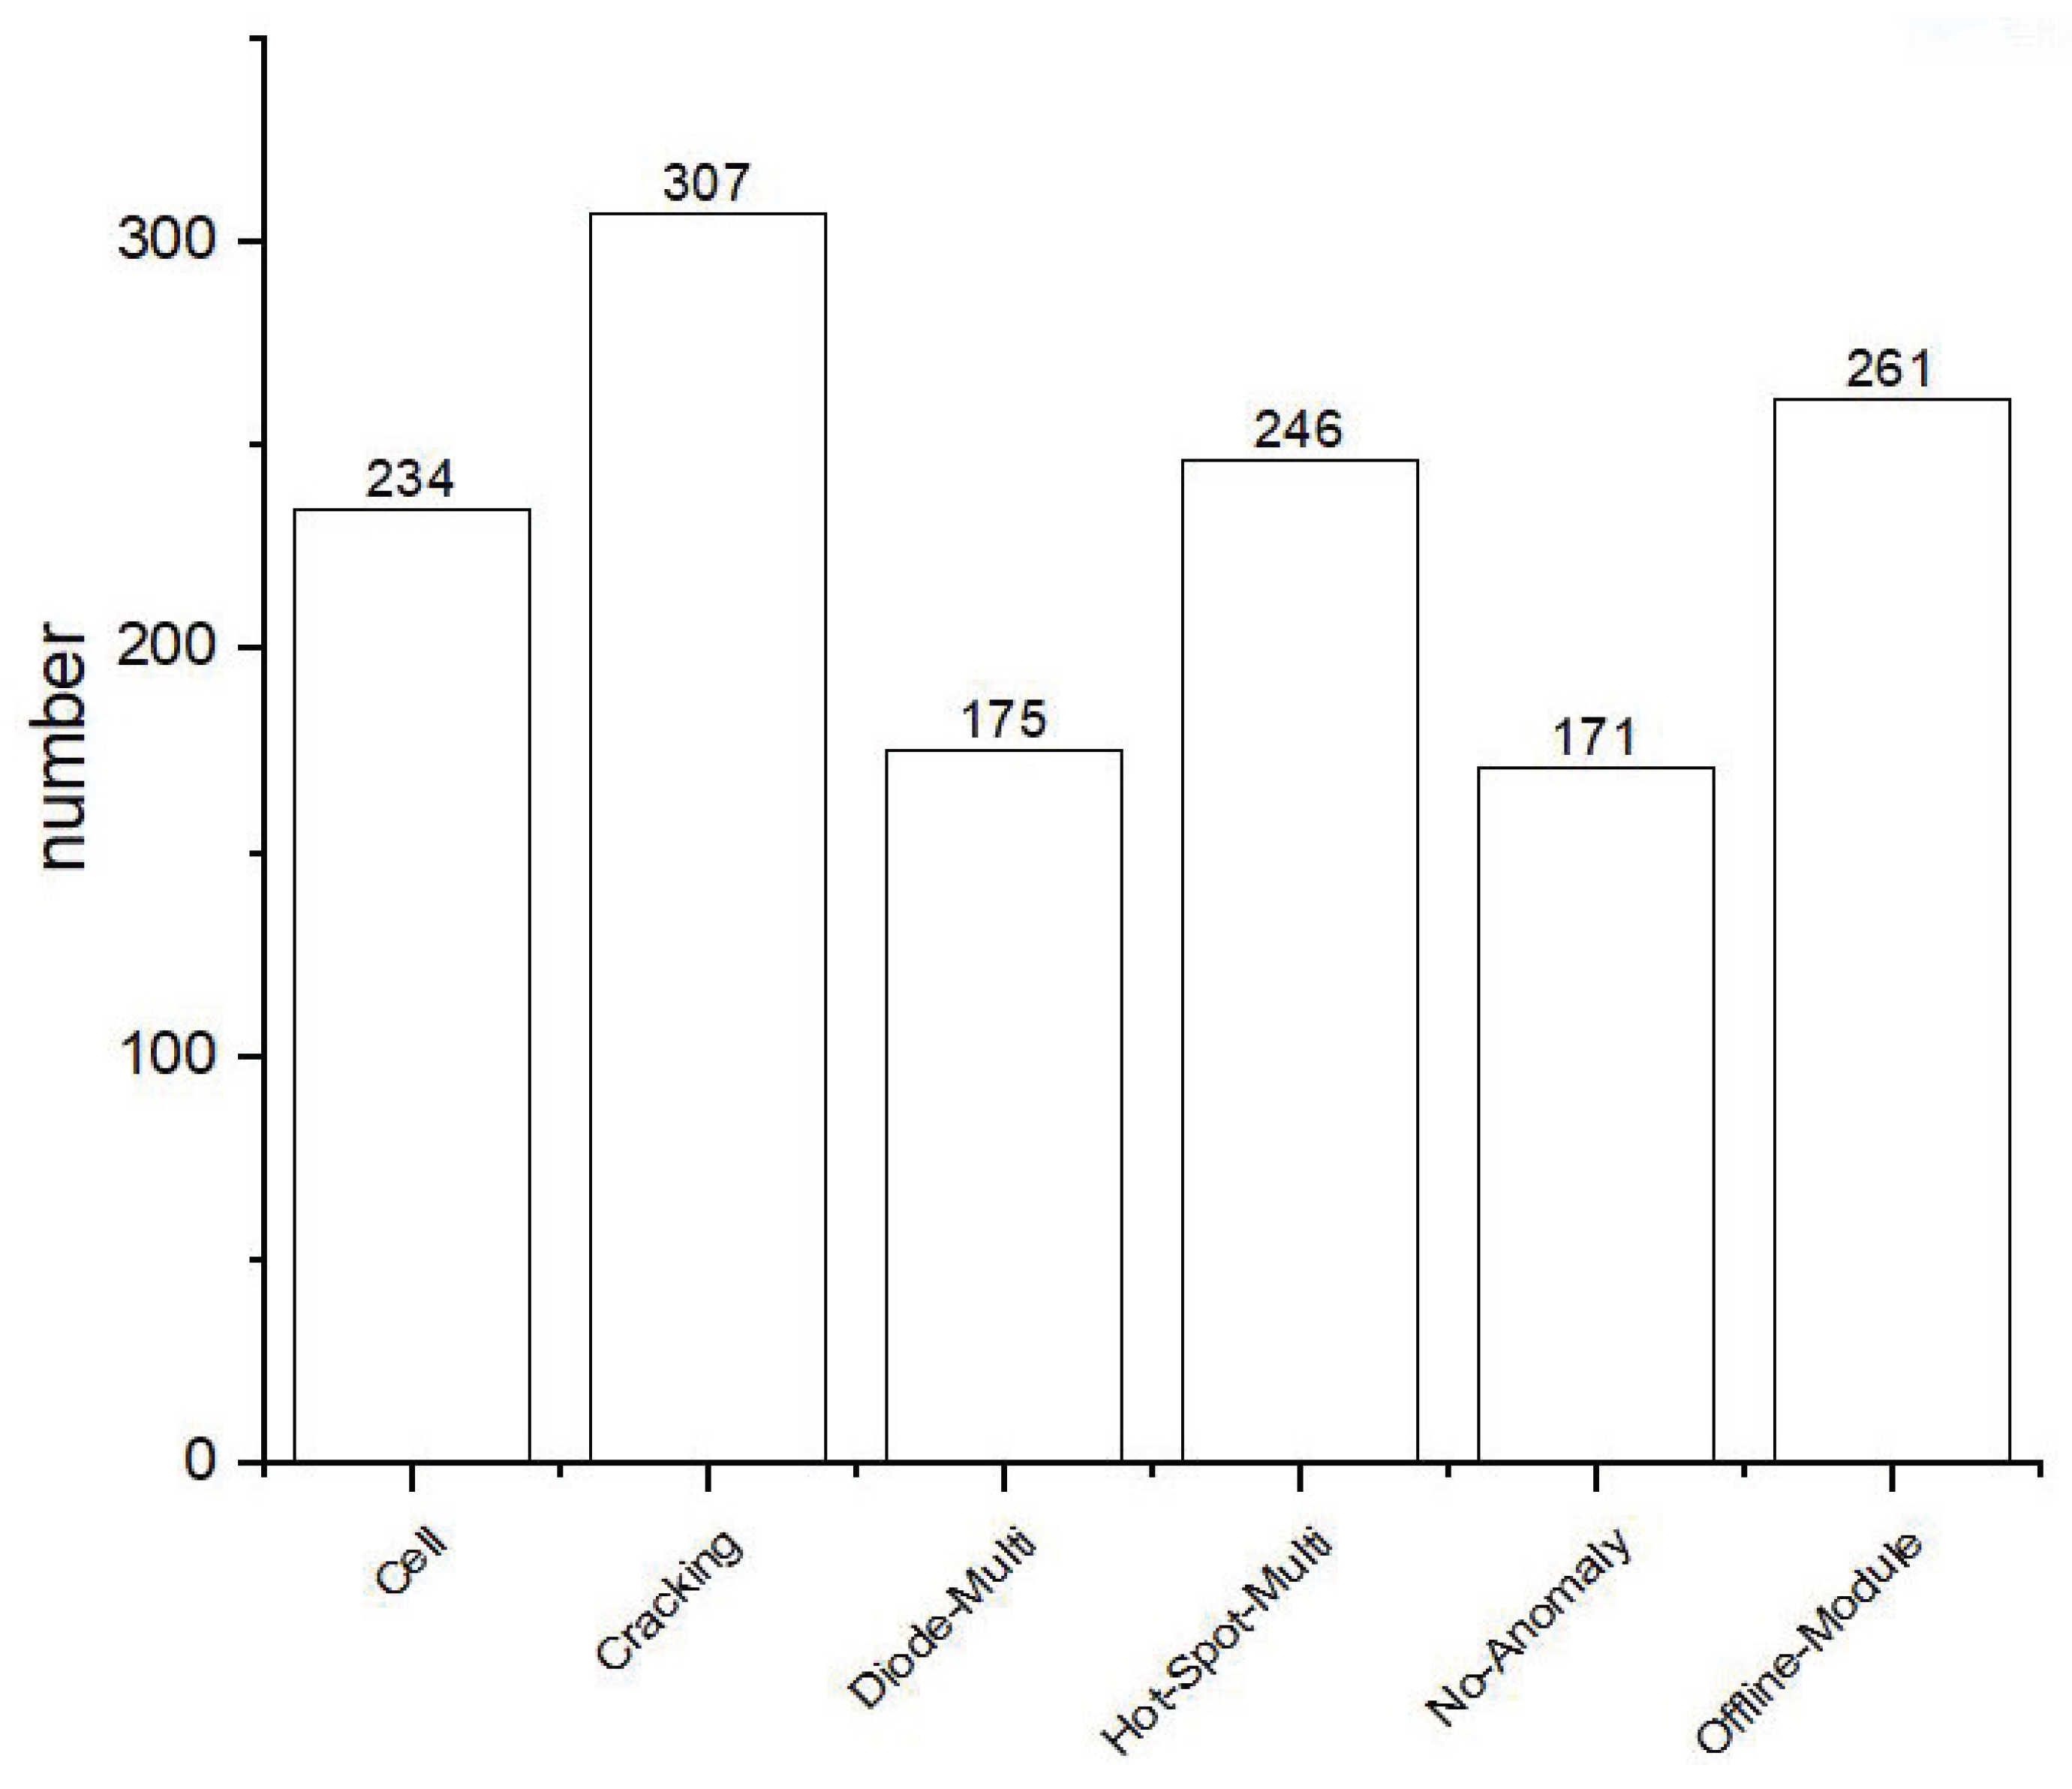
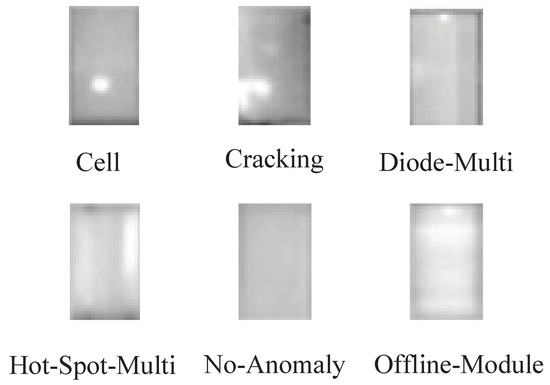
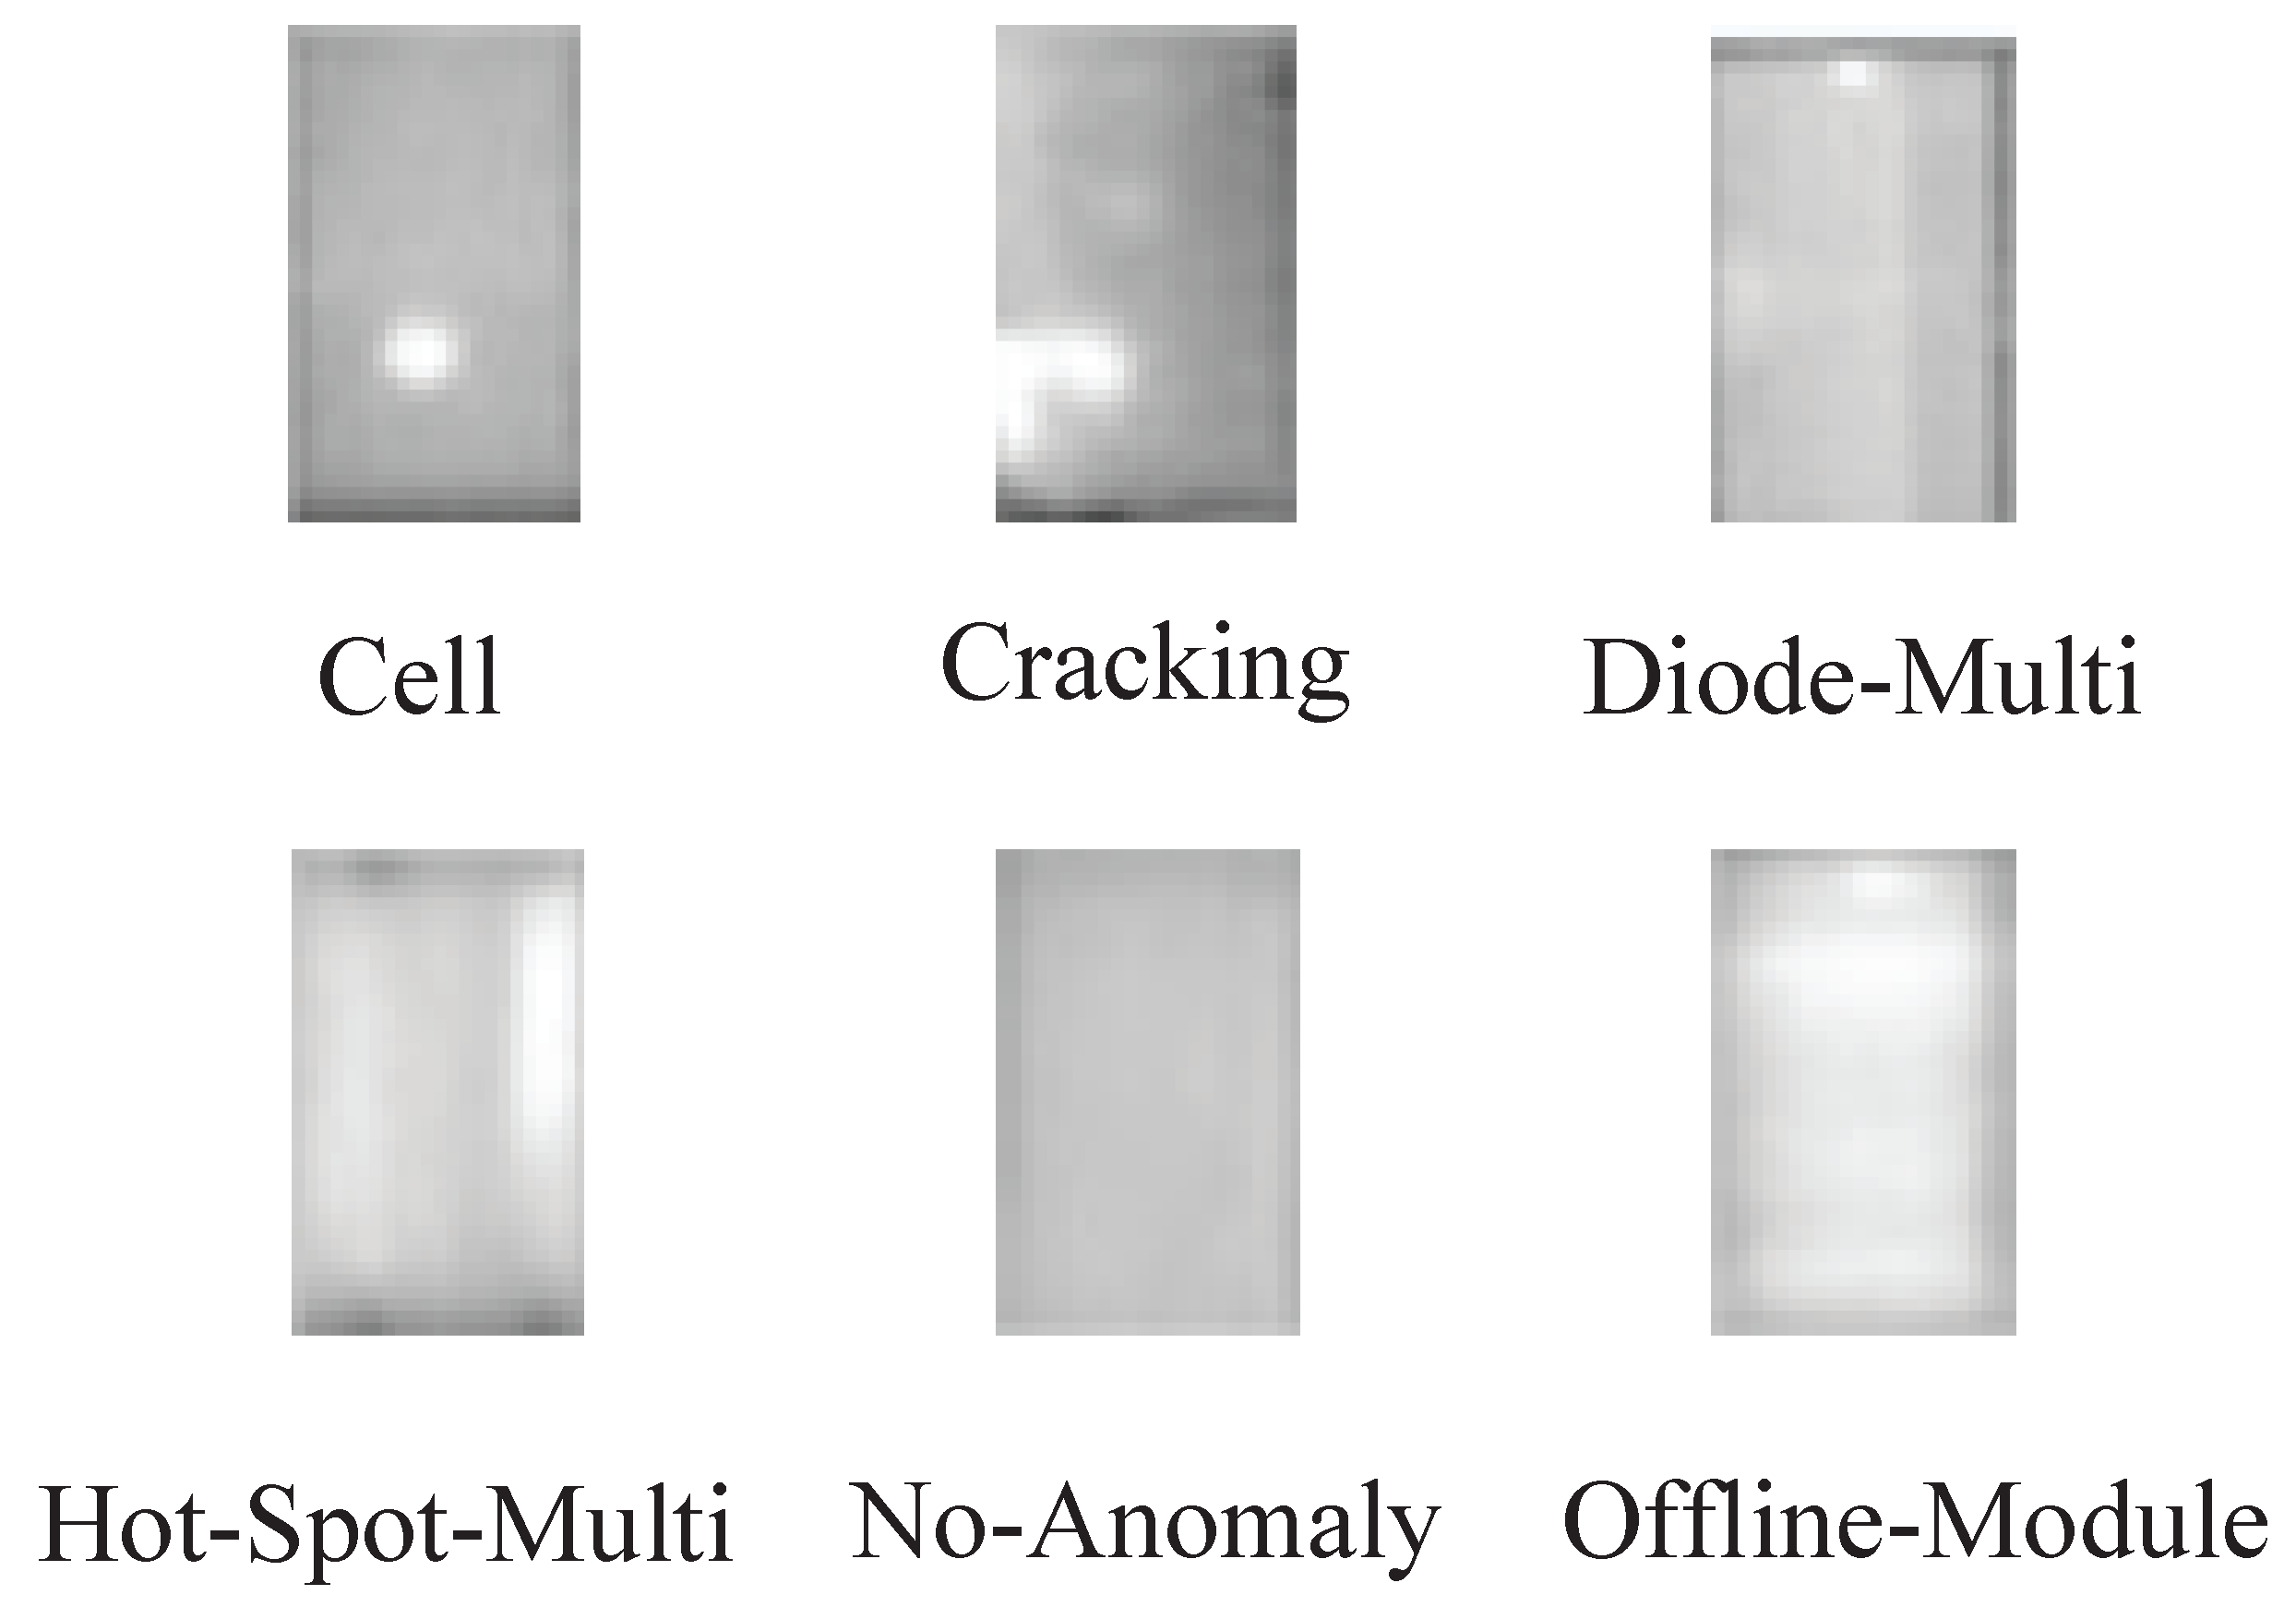
This section validates the proposed method in this article on an infrared monitoring dataset (IMD) of solar panel farms. The dataset contains a total of 1394 infrared images of solar panels, divided into categories. The names and quantities of each category are shown in Figure 5. This dataset contains authentic infrared thermographic images of anomalies found in the solar system, including cell, cracking, diode-multi, hot-spot-multi, and offline-module anomalies, as shown in Figure 6. Each class consists of images corresponding to different anomalies.
Figure 5.
The names and quantities of each category in the IMD dataset.
Figure 6.
Typical examples from the IMD dataset.
The experimental environment for this study is Anaconda 4.12.0 and PyTorch 1.10.2. The experimental platform is operating system Centos®7.9.2009, with a CPU of Intel® Xeon® CPU E5-2630 v4 (10 core, 2.4 GHz), and a GPU of NIVIDA® GeForce® RTX 2080 Ti. The input image size is 24 × 40, with a single batch training quantity of 8, maximum iteration number of 75, and an initial learning rate of 0.01, using the Adam optimization algorithm.
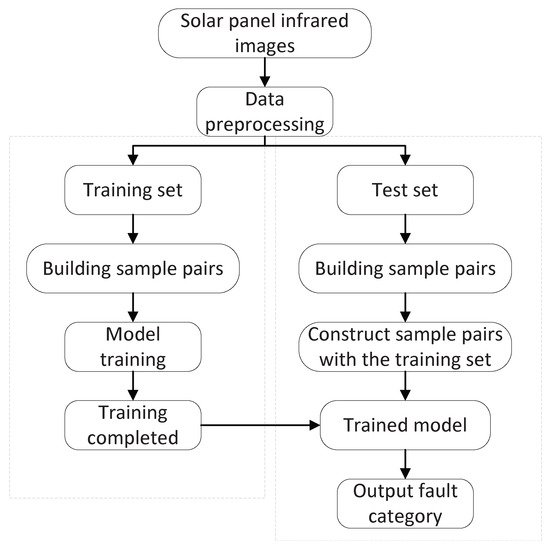
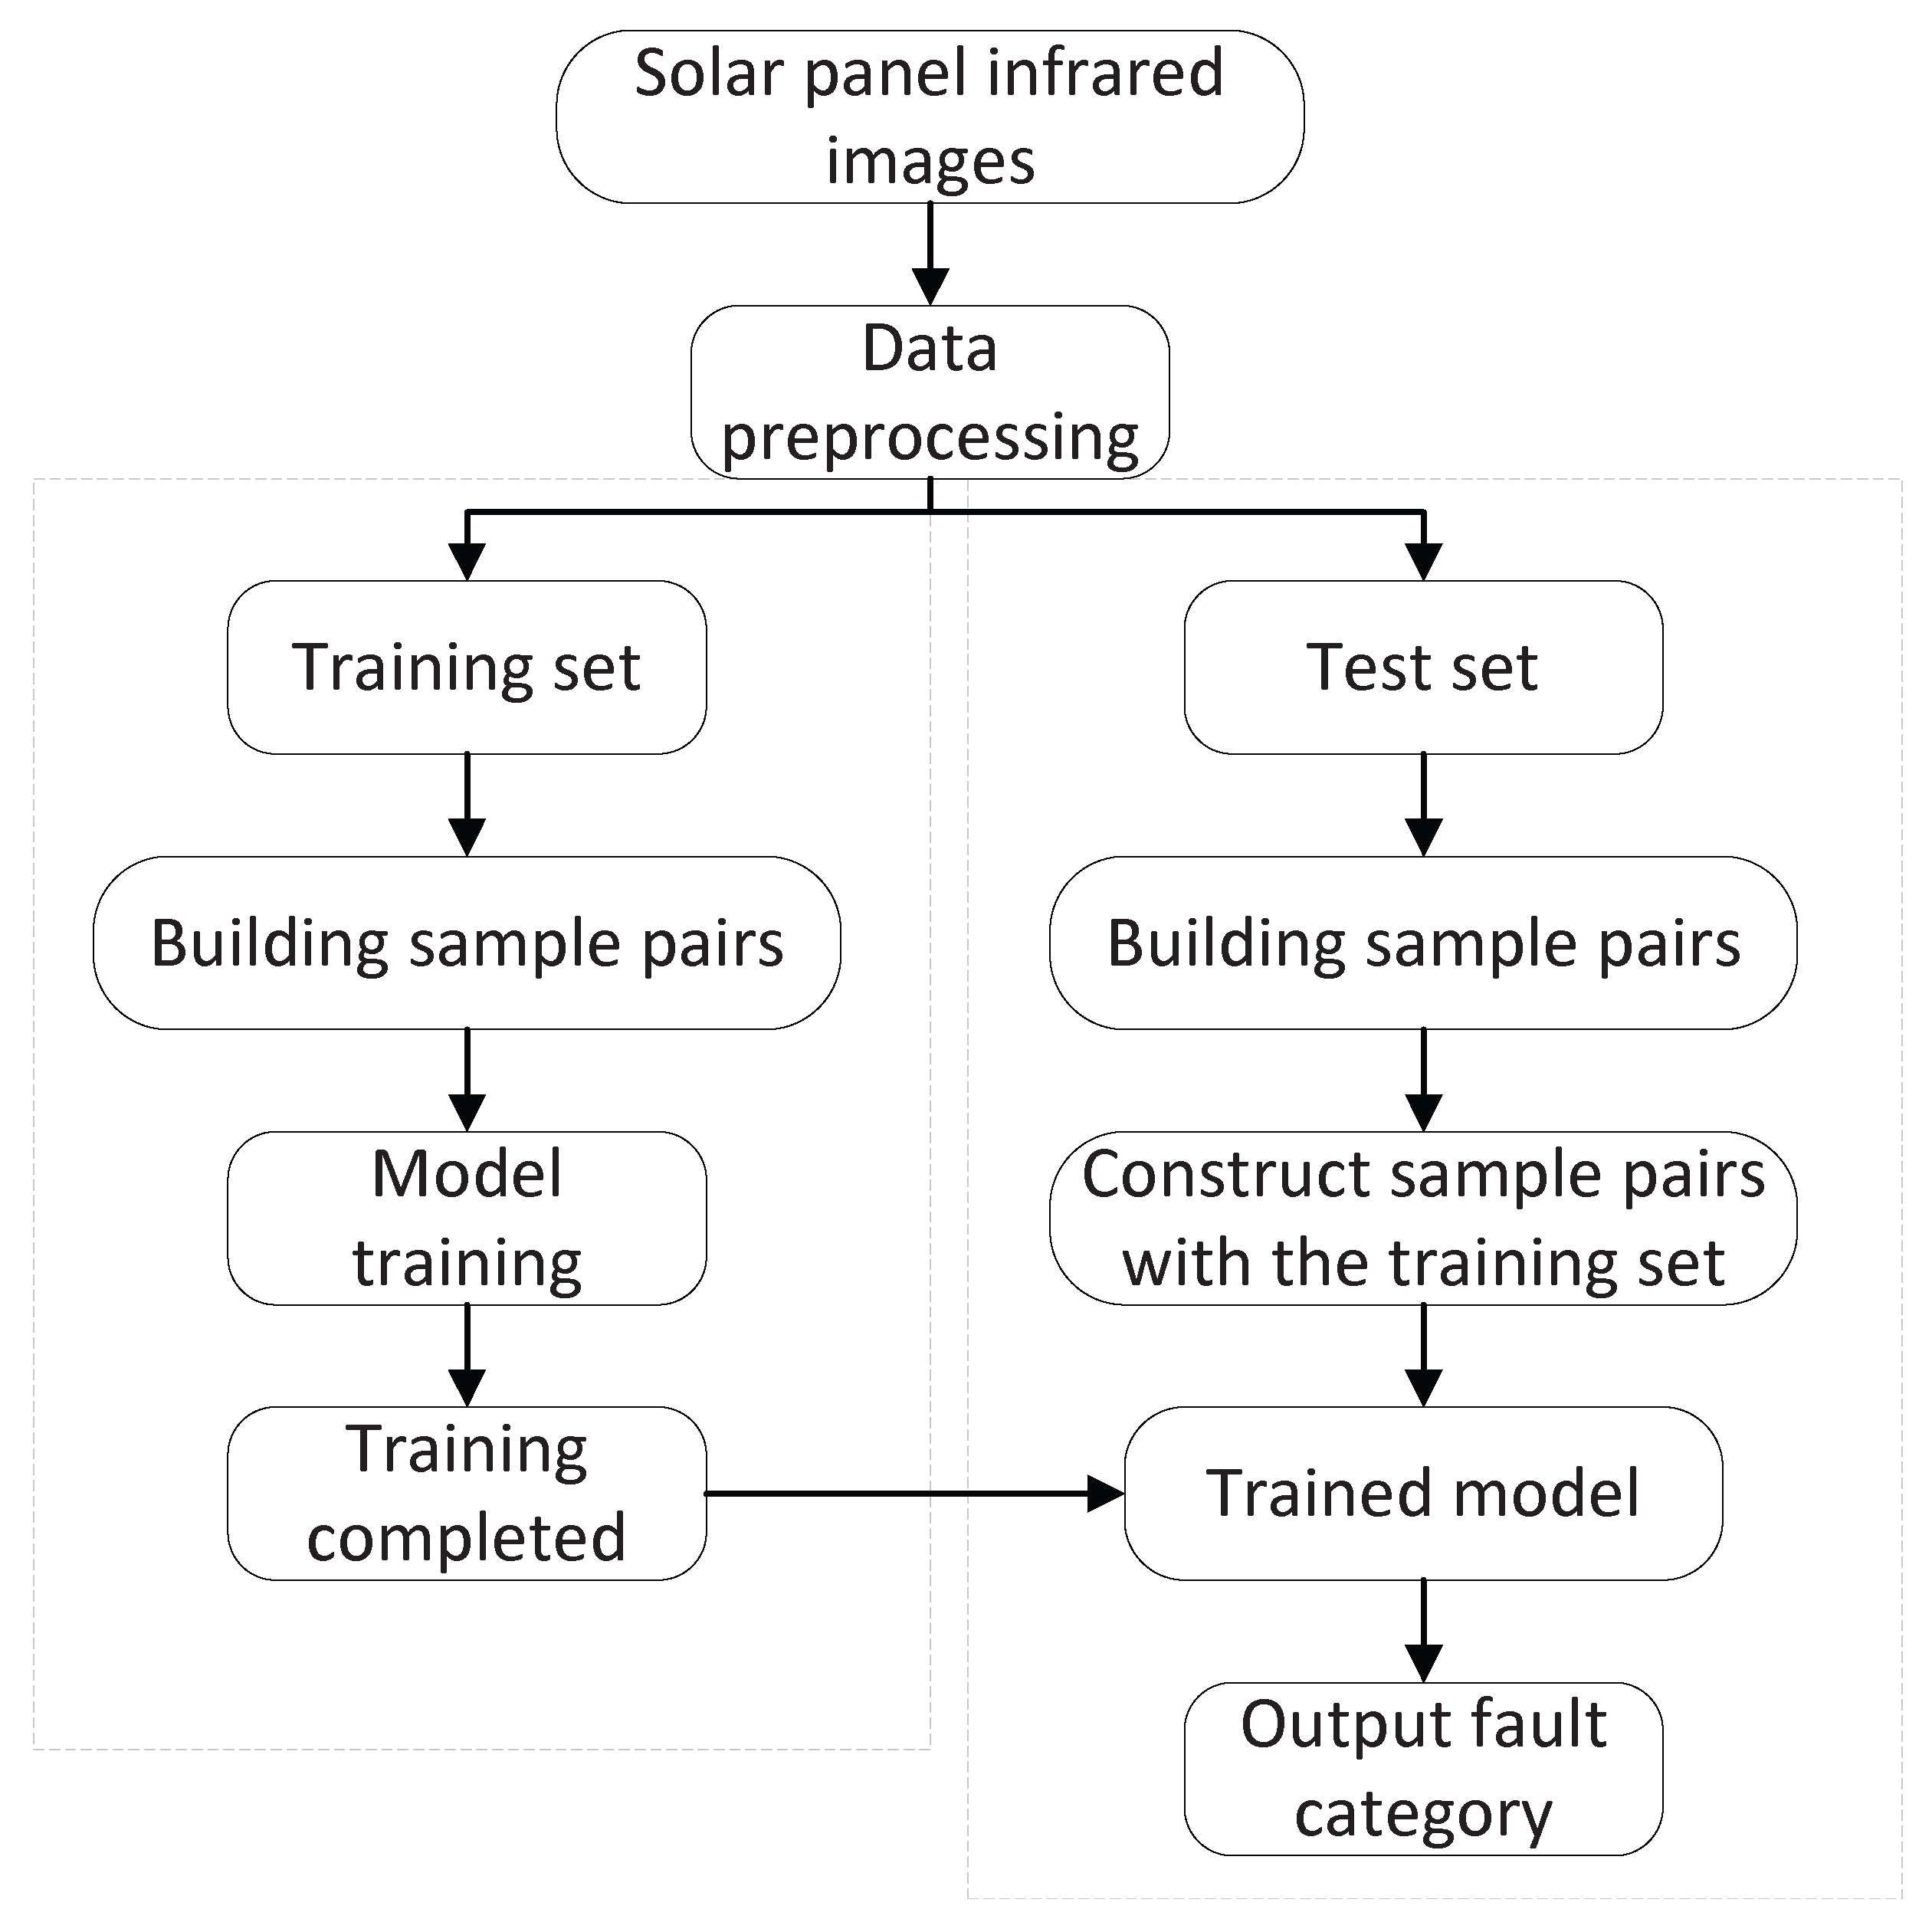
The training and testing procedures of this experiment are shown in Figure 7. The dataset is divided into the training set and the testing set in a ratio of 9:1. During the training phase, two randomly selected samples are used for building sample pairs. The labels for two samples of the same class are set to 1, and the labels for two samples of different classes are set to 0. After building sample pairs, the model is trained using the cross-entropy loss function and the Adam optimization algorithm. Training is finished after the best model weights are generated. In the testing phase, the failures form the diagnosis. To determine the failure cases, one example from the six types of training samples is randomly selected and bound with different class labels. Then, the two target samples are formed into sample pairs by dividing corresponding images from the selected examples. Adding the sample pairs to the trained model causes it to obtain corresponding similarity values. The label of the sample pair corresponding to the maximum similarity value is the class of the target sample.
Figure 7.
Training and testing processes.
4.1. Various Attention Comparison Experiments
The experimental results of the proposed network using different attention mechanisms are shown in Table 1.
Table 1.
Experimental results of various attention mechanisms.
The squeeze-and-excitation (SE) strategy considers information about channels in terms of their duration, and is suitable for scenarios with a relatively high number of channels. This approach was adopted in the current study, achieving an accuracy of 74.3%. Efficient channel attention (ECA) requires only a few parameters and delivers significant performance gains. The training accuracy reached 75.6%. The convolutional block attention module (CBAM) pays attention to both the spatial and channel aspects of an image, enabling the model to achieve even higher accuracy. After training, the accuracy reached 76.3%. The proposed ACA attention system combines and improves upon the ECA theme; it selects diverse convolutional feature maps for adaptive learning, further enhancing the efficiency of the model and achieving the highest training accuracy, at 83.9%.
4.2. Comparative Experiments on Backbone Networks
When training the Siamese network, the structure of the backbone can be changed, which leads to different training outcomes. Deeper models tend to have a higher capacity for learning complex features, which can lead to overfitting. Experimental results corresponding to different backbone networks are shown in Table 2.
Table 2.
Experimental results of different backbone networks.
The parameter quantity of Mobilenetv2 is 1.9 M. After training for 75 epochs, the accuracy reaches 70.1% when no overfitting occurs. EfficientNetV2_s has a parameter quantity of 22.3 M and an accuracy of 72.9%, but it is overfitting. Resnet18 and Resnet34 are both constructed by stacking, with model parameters of 11.1 M and 21.2 M, respectively. After training for 75 epochs, the accuracies reach 78.8% and 80.5%, but both overfitting phenomena are observed. The CNN-AF model used in this paper has a parameter quantity of only 0.9 M. After training, an accuracy of 83.9% is obtained, which is free of overfitting. Overfitting occurs when a model becomes too specialized to some portion of the training data and fails to generalize well to new, unseen data.
4.3. Ablation Experiment
The results of the ablation experiment of the proposed ACA-FFM Siamese network are presented in Table 3. In the case of only the CNN backbone, the accuracy during model training can only reach 67.7%. Adding ACA after that can achieve a 75.3% accuracy. When combining CNN and FFM, the accuracy during model training reaches 79.3%. Adding CNN, ACA, and FFM together can achieve the highest accuracy of 83.9%. It was found through the calligraphy experiment that all the modules designed in this study have significant effects on photovoltaic failure detection.
Table 3.
Results of ablation experiments.
4.4. Classifying and Verifying Experiments
In order to verify the effectiveness of the model, 20 images of each category were used for validation, and the average accuracy of each category was obtained through the model. The experimental results are shown in Table 4. It can be seen that the average accuracies of cracking, hot-spot-multi, no anomaly, and offline-module were, respectively, reached at 86.7%, 98.2%, 91.3%, and 93.1%, showing good classification performance for each category. In the cell category, the average accuracy reached 76.6. The average accuracy of diode-multi was lower compared to other categories, reaching 72.8%. Overall, the proposed model has a certain applicability for classification of solar power components.
Table 4.
Class-based experimental results.
5. Conclusions
To address the issue of a limited dataset of photovoltaic failure images, an ACA-FFM Siamese convolutional neural network model was proposed. The model performs feature extraction followed by similarity logical regression. The key objective of this technology is to reduce the dependence on large-scale datasets. Firstly, a novel feature extraction method based on adaptive coordinate attention (ACA) is proposed. This method dynamically adjusts the scope of module attention based on input images, thereby enhancing the ability of multi-scale feature extraction. Then, a new feature fusion module (FFM) is designed to enhance feature learning ability and improve the accuracy of fault detection. The FFM utilizes ACA to dynamically adjust the attention scope, allowing for more accurate and robust feature extraction. This technology has the potential to significantly improve the accuracy and efficiency of photovoltaic failure image analysis, and has the potential to be applied in a wide range of photovoltaic applications.
However, although the method achieved improved results, there are still classification errors for similar solar power failure images. Further research will focus on image classification for similar images to improve classification among similar samples.
Author Contributions
Conceptualization, X.W., X.L., Y.W. and B.J.; methodology, X.W. and L.Z.; software, Y.W. and L.Z.; validation, Y.W. and X.L.; formal analysis, X.W. and B.J.; investigation, B.J., Y.W. and Q.B.; resources, Y.W. and Q.B.; data curation, Y.W. and L.Z.; writing—draft, L.Z.; writing, X.W. and L.Z.; visualization, X.L.; supervision, Q.B.; project administration, Q.B. and X.W.; funding acquisition, Q.B., Y.W. and X.W. All authors have read and agreed to the published version of the manuscript.
Funding
This research was funded by Key Research and Development Projects in Zhejiang Province grant number No. 2021C03151 and Zhejiang Provincial Public Welfare Research Program grant number No. LGG21G010001.
Institutional Review Board Statement
Not applicable.
Informed Consent Statement
Not applicable.
Data Availability Statement
Not applicable.
Acknowledgments
The authors thank Shangyu XinHeCheng Chemical Co., Ltd. for providing the experimental data in this paper.
Conflicts of Interest
The authors declare no conflict of interest.
References
- Nebili, B.; Khellal, A.; Nemra, A.; Mascarilla, L. Augmented Convolutional Neural Network Models with Relative Multi-Head Attention for Target Recognition in Infrared Images. Unmanned Syst. 2023, 11, 221–230. [Google Scholar] [CrossRef] [Scilit]
- Ma, T.; Yang, Z.; Ren, X.; Wang, J.; Ku, Y. Infrared Small Target Detection Based on Smoothness Measure and Thermal Diffusion Flowmetry. IEEE Geosci. Remote. Sens. Lett. 2022, 19, 7002505. [Google Scholar] [CrossRef] [Scilit]
- Lee, H.; Lee, K.S.; Kim, J.; Na, Y.; Hwang, J.Y.Y. Local Similarity Siamese Network for Urban Land Change Detection on Remote Sensing Images. IEEE J. Sel. Top. Appl. Earth Obs. Remote Sens. 2021, 14, 4139–4149. [Google Scholar] [CrossRef] [Scilit]
- Xie, T.; Zhang, H.; Liu, R.; Xiao, H. Accelerated sparse nonnegative matrix factorization for unsupervised feature learning. Pattern Recognit. Lett. 2022, 156, 46–52. [Google Scholar] [CrossRef] [Scilit]
- Aziz, F.; Ul Haq, A.; Ahmad, S.; Mahmoud, Y.; Jalal, M.; Ali, U. A Novel Convolutional Neural Network Based Approach for Fault Classification in Photovoltaic Arrays. IEEE Access 2020, 8, 41889–41904. [Google Scholar] [CrossRef] [Scilit]
- Huerta, A.; Pliego Marugán, A.; García Márquez, F.P. Photovoltaic plant condition monitoring using thermal images analysis by convolutional neural network-based structure. Renew. Energy 2020, 153, 334–348. [Google Scholar] [CrossRef] [Scilit]
- Alla Eddine, T.M.; Mouloudj, H.; Helaimi, M.; Rachid, T. Artificial Neural Network for Detection and Classification of Solar Panel Faults. In Proceedings of the First National Conference on Industrial Engineering and Sustainable Development (ICESD’23), Relizane, Algeria, 16 May 2023. [Google Scholar]
- Manno, D.; Cipriani, G.; Di Dio, V.; Giuseppina, C.; Guarino, S.; Lo Brano, V. Deep learning strategies for automatic fault diagnosis in photovoltaic systems by thermographic images. Energy Convers. Manag. 2021, 241, 114315. [Google Scholar] [CrossRef] [Scilit]
- Choudhary, A.; Goyal, D.; Letha, S.S. Infrared Thermography-Based Fault Diagnosis of Induction Motor Bearings Using Machine Learning. IEEE Sens. J. 2021, 21, 1727–1734. [Google Scholar] [CrossRef] [Scilit]
- Yousefi, B.; Castanedo, C.I.; Maldague, X.P.V. Measuring Heterogeneous Thermal Patterns in Infrared-Based Diagnostic Systems Using Sparse Low-Rank Matrix Approximation: Comparative Study. IEEE Trans. Instrum. Meas. 2021, 70, 4501209. [Google Scholar] [CrossRef] [Scilit]
- Yuan, D.; Shu, X.; Liu, Q.; He, Z. Aligned Spatial-Temporal Memory Network for Thermal Infrared Target Tracking. IEEE Trans. Circuits Syst. II Express Briefs 2023, 70, 1224–1228. [Google Scholar] [CrossRef] [Scilit]
- Sadiqbatcha, S.; Zhang, J.; Zhao, H.; Amrouch, H.; Henkel, J.; Tan, S.X.D. Post-Silicon Heat-Source Identification and Machine-Learning-Based Thermal Modeling Using Infrared Thermal Imaging. IEEE Trans. Comput.-Aided Des. Integr. Circuits Syst. 2021, 40, 694–707. [Google Scholar] [CrossRef] [Scilit]
- Phan, Q.T.; Wu, Y.K.; Phan, Q.D. Short-term Solar Power Forecasting Using XGBoost with Numerical Weather Prediction. In Proceedings of the 2021 IEEE International Future Energy Electronics Conference (IFEEC), Taipei, Taiwan, 16–19 November 2021; pp. 1–6. [Google Scholar] [CrossRef] [Scilit]
- Manoharan, P.; Subramaniam, U.; Babu, T.S.; Padmanaban, S.; Holm-Nielsen, J.B.; Mitolo, M.; Ravichandran, S. Improved Perturb and Observation Maximum Power Point Tracking Technique for Solar Photovoltaic Power Generation Systems. IEEE Syst. J. 2021, 15, 3024–3035. [Google Scholar] [CrossRef] [Scilit]
- Kumar, N.; Singh, H.K.; Niwareeba, R. Adaptive Control Technique for Portable Solar Powered EV Charging Adapter to Operate in Remote Location. IEEE Open J. Circuits Syst. 2023, 4, 115–125. [Google Scholar] [CrossRef] [Scilit]
- Jang, J.; Kim, C.O. Siamese Network-Based Health Representation Learning and Robust Reference-Based Remaining Useful Life Prediction. IEEE Trans. Ind. Inform. 2022, 18, 5264–5274. [Google Scholar] [CrossRef] [Scilit]
- Tan, K.; Xu, T.B.; Wei, Z. IMSiam: IoU-aware Matching-adaptive Siamese network for object tracking. Neurocomputing 2022, 492, 222–233. [Google Scholar] [CrossRef] [Scilit]
- Chen, J.; Huang, B.; Li, J.; Wang, Y.; Ren, M.; Xu, T. Learning Spatio-Temporal Attention Based Siamese Network for Tracking UAVs in the Wild. Remote. Sens. 2022, 14, 1797. [Google Scholar] [CrossRef] [Scilit]
- Zheng, H.; Gong, M.; Liu, T.; Jiang, F.; Zhan, T.; Lu, D.; Zhang, M. HFA-Net: High frequency attention siamese network for building change detection in VHR remote sensing images. Pattern Recognit. 2022, 129, 108717. [Google Scholar] [CrossRef] [Scilit]
- Chen, H. Smart Contract Vulnerability Detection Model Based on Siamese Network (SCVSN): A Case Study of Reentrancy Vulnerability. Energies 2022, 15, 9642. [Google Scholar] [CrossRef] [Scilit]
- Luo, Y.; Xiao, H.; Ou, J.; Chen, X. SiamSMDFFF: Siamese network tracker based on shallow-middle-deep three-level feature fusion and clustering-based adaptive rectangular window filtering. Neurocomputing 2022, 483, 160–170. [Google Scholar] [CrossRef] [Scilit]
- Hu, X.; Liu, H.; Chen, Y.; Hui, Y.; Liang, Y.; Wu, X. Siamese Network Object Tracking Algorithm Combining Attention Mechanism and Correlation Filter Theory. Int. J. Pattern Recognit. Artif. Intell. 2022, 36, 2250003. [Google Scholar] [CrossRef] [Scilit]
- Chicco, D. Siamese Neural Networks: An Overview. Artif. Neural Netw. 2021, 2190, 73–94. [Google Scholar]
- Li, Y.; Du, X.; Wan, F.; Wang, X.; Yu, H. Rotating machinery fault diagnosis based on convolutional neural network and infrared thermal imaging. Chin. J. Aeronaut. 2020, 33, 42–53. [Google Scholar] [CrossRef] [Scilit]
- V, H.E.; Ghanekar, S. An Efficient Method for Generic Dsp Implementation of Dilated Convolution. In Proceedings of the ICASSP 2022–2022 IEEE International Conference on Acoustics, Speech and Signal Processing, Singapore, 23–27 May 2022; pp. 51–55. [Google Scholar] [CrossRef] [Scilit]
- Song, A.; Zhao, Z.; Xiong, Q.; Guo, J. Lightweight the Focus module in YOLOv5 by Dilated Convolution. In Proceedings of the 2022 3rd International Conference on Computer Vision, Image and Deep Learning & International Conference on Computer Engineering and Applications, Changchun, China, 20–22 May 2022; pp. 111–114. [Google Scholar] [CrossRef] [Scilit]

Disclaimer/Publisher’s Note: The statements, opinions and data contained in all publications are solely those of the individual author(s) and contributor(s) and not of MDPI and/or the editor(s). MDPI and/or the editor(s) disclaim responsibility for any injury to people or property resulting from any ideas, methods, instructions or products referred to in the content. |
© 2023 by the authors. Licensee MDPI, Basel, Switzerland. This article is an open access article distributed under the terms and conditions of the Creative Commons Attribution (CC BY) license (https://creativecommons.org/licenses/by/4.0/).