


Abstract
Whether China’s carbon trading pilots stimulate firm-level innovation remains contested. This study investigates the conditional effect of carbon pricing on green invention patents, moderated by firms’ digital transformation capability. Using an unbalanced panel of 31,048 firm-year observations from A-share listed companies (2011–2022) and a two-way fixed-effects difference-in-differences estimator, we find no significant unconditional average treatment effect, consistent with attenuated price signals in China’s pilots. However, digital capability substantially amplifies the innovation response: a one-standard-deviation increase in within-year digital capability is associated with a 4.6% rise in expected green invention patents among treated firms. The moderating effect is exclusive to examination-intensive invention patents rather than utility model registrations, consistent with a strong-form Porter mechanism. Sub-dimension analysis identifies strategic leadership and digital achievement as the operative channels. The results are robust to alternative estimators, cohort decomposition, and sample restrictions. Together, the findings reframe digital transformation as a policy-contingent complementary asset and extend the Porter hypothesis to an organizational-capabilities dimension.
1. Introduction
The transition toward a low-carbon economy has placed market-based environmental instruments at the center of both academic inquiry and regulatory design. Among available tools, emission trading schemes are theoretically preferred because they generate a price signal that simultaneously allocates abatement effort according to marginal cost and redirects private R&D investment toward carbon-reducing technologies (Acemoglu et al., 2012; Calel & Dechezleprêtre, 2016). China’s decision to launch seven regional carbon trading pilots between 2013 and 2016, later consolidated into a national ETS in 2021, represents the largest carbon-pricing experiment outside the European Union (Qi et al., 2021; Wu et al., 2021). Whether these programs have translated compliance pressure into firm-level green innovation, however, remains empirically contested. China’s pilots differ institutionally from the EU ETS in ways that attenuate the carbon price signal and reduce the likelihood of a uniform innovation response (W. Zhang et al., 2020; Wu et al., 2021).
Firm-level evidence on China’s carbon trading pilots is mixed: while some studies report positive average treatment effects, others find null or marginally negative outcomes, indicating substantial heterogeneity across regulated firms. A meta-analysis of 79 primary studies confirms that the innovation response to environmental regulation is statistically significant in aggregate but highly heterogeneous (Dechezleprêtre & Sato, 2017; Tang et al., 2020). This heterogeneity aligns with theoretical expectations: innovation responses to carbon pricing concentrate among firms with sufficient absorptive capacity and organizational readiness to translate diffuse regulatory signals into sustained R&D investment (Cohen & Levinthal, 1990). Identifying such conditioning factors is essential for both mechanism understanding and policy calibration. This study focuses on one factor that has received little systematic attention—firm-level digital transformation capability.
Digital transformation, understood as the organizational integration of big data analytics, cloud computing, artificial intelligence, and internet-of-things technologies into core production and strategic processes, has been established as a direct driver of green innovation in panel-data studies of Chinese listed firms (Lv et al., 2021; Fang et al., 2023; Tao et al., 2024). These studies consistently find a positive link between digital capability indices and green patent output, but they treat digital transformation as an independent predictor rather than as an organizational asset whose returns vary with the presence of an active carbon price signal. This treatment is consequential for two reasons. First, if digital transformation functions as a policy-contingent complementary asset, then the innovation dividend attributable to joint exposure to carbon pricing and digital capability will be systematically underestimated by additive specifications that assess each instrument in isolation. Second, the Porter hypothesis holds that well-designed environmental regulation can stimulate innovation by revealing productive inefficiencies and expanding the technological opportunity set (Porter & van der Linde, 1995; Ambec et al., 2013), but the firm-level organizational conditions under which this mechanism operates remain largely unspecified. This study argues that digital transformation may constitute one such condition. Firms with stronger digital capability are likely to be better able to process information, recombine knowledge, and convert carbon price signals into green invention output.
This paper addresses these gaps by examining the moderating role of digital transformation in the relationship between China’s ETS pilots and firm-level green invention patents. The study advances two contributions. First, it provides firm-level evidence that digital transformation capability constitutes a binding organizational condition under which carbon pricing generates green invention output, extending the Porter hypothesis to an organizational-capabilities dimension. Second, it reframes digital transformation from an independent driver of green patent activity into a policy-contingent complementary asset, with implications for the interpretation of both carbon pricing and digital transformation policies when evaluated in isolation.
The empirical strategy pairs a TWFE-DID baseline with a moderation specification that interacts ETS pilot status with the within-year standardized Digital Transformation Index of Wu et al. (2021). Identification is supported by event-study pre-trend tests, cohort-specific ATT estimates, and permutation placebo analysis. Main results are reported in Section 4; robustness and heterogeneity analyses appear in Section 5.
2. Literature Review and Hypotheses
2.1. Carbon Trading and Green Innovation
The relationship between emission trading and green innovation is commonly explained by induced innovation theory and the Porter hypothesis. The induced innovation hypothesis holds that changes in relative factor prices shift the direction of private R&D investment toward technologies that economize on increasingly costly inputs (Hicks, 1932; Popp, 2002); the directed technical change framework formalizes this logic in general equilibrium, demonstrating that a credible carbon price can redirect aggregate technical progress from dirty to clean technologies when market-size effects and knowledge spillovers are internalized (Acemoglu et al., 2012). The Porter hypothesis offers a complementary firm-level argument: well-designed environmental regulation triggers innovation offsets by revealing productive inefficiencies and expanding the technological opportunity set (Porter & van der Linde, 1995; Ambec et al., 2013). Meta-analytic evidence suggests the Porter hypothesis across regulatory types and national contexts, though with significant heterogeneity in effect sizes across industries and institutional settings (Dechezleprêtre & Sato, 2017).
China’s seven pilot programs feature administratively guided price ceilings, generous initial allocations, and persistent secondary-market illiquidity that attenuate the price signal received by regulated firms (Wu et al., 2021). This institutional divergence implies that the weaker and more volatile signals under China’s pilots are unlikely to generate uniform innovation incentives; precisely because the signal is attenuated, firm-level organizational capacity becomes the primary determinant of whether compliance pressure is converted into green invention output. Recent firm-level evidence reflects this conditional structure: Chen et al. (2021) and Qi et al. (2021) document positive average effects on green patent counts, while Z. Zhang et al. (2022) and H. Zhang et al. (2023) find null or negative effects in broader samples where allowance over-allocation dampens compliance incentives. A more recent study using a comparative pilot-versus-national ETS framework confirms that innovation effects are heterogeneous across sectors and time periods, with the pilot-phase effect concentrated in early-adopting, technology-intensive firms (Zhao et al., 2025). These contradictory findings are consistent with a conditional innovation structure in which absorptive capacity and organizational readiness mediate the relationship between carbon price signals and green patent output (Cohen & Levinthal, 1990; Tang et al., 2020). This conditional structure motivates the moderation specification developed in Section 2.3.
Based on this institutional assessment, the prior expectation is that the unconditional average treatment effect of ETS pilot status on green invention patents is not statistically distinguishable from zero across the full listed-firm sample, given the heterogeneous distribution of organizational capability and the attenuated price signal of China’s pilots. This expectation guides interpretation of the null baseline result reported in Section 4.1, and frames the moderation specification as the primary estimand of interest.
2.2. Digital Transformation as Policy Complement
Digital transformation has been established as a direct driver of green innovation in firm-level studies using Chinese panel data. Lv et al. (2021) document a positive association between digital financial development and green technology innovation. Fang et al. (2023) show that enterprise digitalization enhances ESG performance through improved information processing and stakeholder engagement. Tao et al. (2024) find that firms’ digital transformation promotes environmental innovation by lowering knowledge search costs and expanding combinatorial opportunities across R&D domains. A growing strand of the literature further documents that the innovation effect of digitalization varies with the regulatory environment, consistent with the view that digital capability amplifies the returns to external innovation incentives rather than generating them autonomously (X. Wang & Zhong, 2024). A key limitation of existing studies is that they treat digital transformation as an independent predictor of green innovation without examining whether the returns to digital capability systematically differ depending on whether carbon pricing is active or absent.
This limitation is consequential for measurement and policy. If innovation returns to digital capability are concentrated among firms simultaneously exposed to a carbon price signal, then regressions that omit the interaction will yield upward-biased estimates of the unconditional digital effect and downward-biased estimates of the carbon pricing effect, producing misleading assessments of both instruments when evaluated in isolation. The within-year standardization of the Digital Transformation Index used in the present study removes the monotonically increasing cross-sectional trend in the raw DTI that reflects secular economy-wide digitization; this prevents the trend from being absorbed into the interaction term and from confounding the placebo permutation distribution, an identification requirement noted but not implemented in prior moderation analyses (X. Wang & Zhong, 2024). The within-year standardization of the digital transformation index reduces the influence of the economy-wide upward trend in digital disclosure. This study examines whether the returns to digital capability differ depending on whether carbon pricing is active or absent.
2.3. Theoretical Mechanism and Hypotheses
The core theoretical argument proceeds as follows. China’s carbon trading pilots create compliance pressure and a latent financial incentive to reduce emissions per unit of output. Because the price signal is weak and intermittent, converting this incentive into green invention requires firm-level organizational prerequisites that are not uniformly distributed across the treated population. Digital transformation provides these prerequisites through three complementary channels.
The first channel is environmental information processing capacity. Green invention in response to carbon pricing requires firms to identify, rank, and evaluate carbon-reduction opportunities across production stages, supply chains, and product configurations, an inherently information-intensive process. Digitally advanced firms possess real-time monitoring systems, integrated enterprise data platforms, and analytical capabilities that substantially lower the cost of this search (Hao et al., 2023). The carbon price signal defines the financial valuation of emissions reductions and thus the ROI threshold against which carbon-reduction R&D projects are evaluated; digitally capable firms can perform this evaluation systematically and at scale, while others cannot. This channel is primarily reflected in the digital achievement sub-dimension of the DTI, which captures measurable operational improvements including verifiable energy monitoring and data-driven decision outcomes, rather than nominal technology adoption.
The second channel is knowledge recombination and absorptive capacity. Green invention typically requires the integration of domain-specific environmental knowledge with existing expertise in materials, process engineering, and product design, a cross-boundary knowledge-recombination task (Cohen & Levinthal, 1990). Digital platforms systematize inter-functional knowledge flows and reduce the cognitive costs of cross-departmental R&D coordination, expanding the feasible set of green innovation combinations (Wen et al., 2022). Critically, this channel is conceptually distinct from the organizational empowerment sub-dimension of the DTI, which captures surface-level structural adjustments and role realignment rather than the deep knowledge integration processes that underlie multi-domain invention. The possible absence of a significant effect for the organizational empowerment dimension is therefore theoretically anticipated: if the DTI sub-dimension captures nominal restructuring without verifiable integration outcomes, its interaction with carbon pricing need not be positive.
The third channel is strategic green R&D commitment. Upper echelon theory holds that the direction of firm-level resource allocation reflects the cognitive orientations of senior management (Hambrick & Mason, 1984). The strategic leadership sub-dimension captures top managers’ attention to digital strategy and may reflect the extent to which digital transformation is embedded in firm-level decision-making. The digital achievement sub-dimension captures observable operational outcomes and is therefore more closely aligned with realized capability. When a carbon price signal creates a commercial opportunity in green technology, firms whose senior managers are already oriented toward strategic digital investment are more likely to recognize and pursue that opportunity as a coherent extension of existing R&D priorities, consistent with the finding that deep, outcome-oriented digital transformation rather than surface-level technology adoption drives environmental innovation complementarities (Tao et al., 2024; X. Wang & Zhong, 2024).
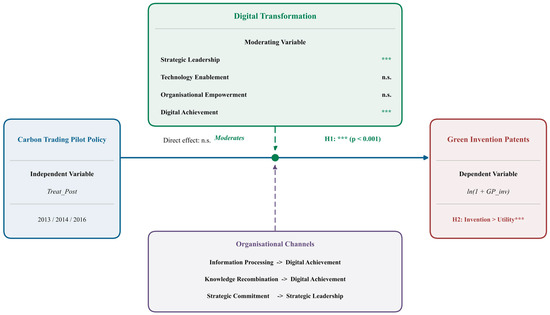
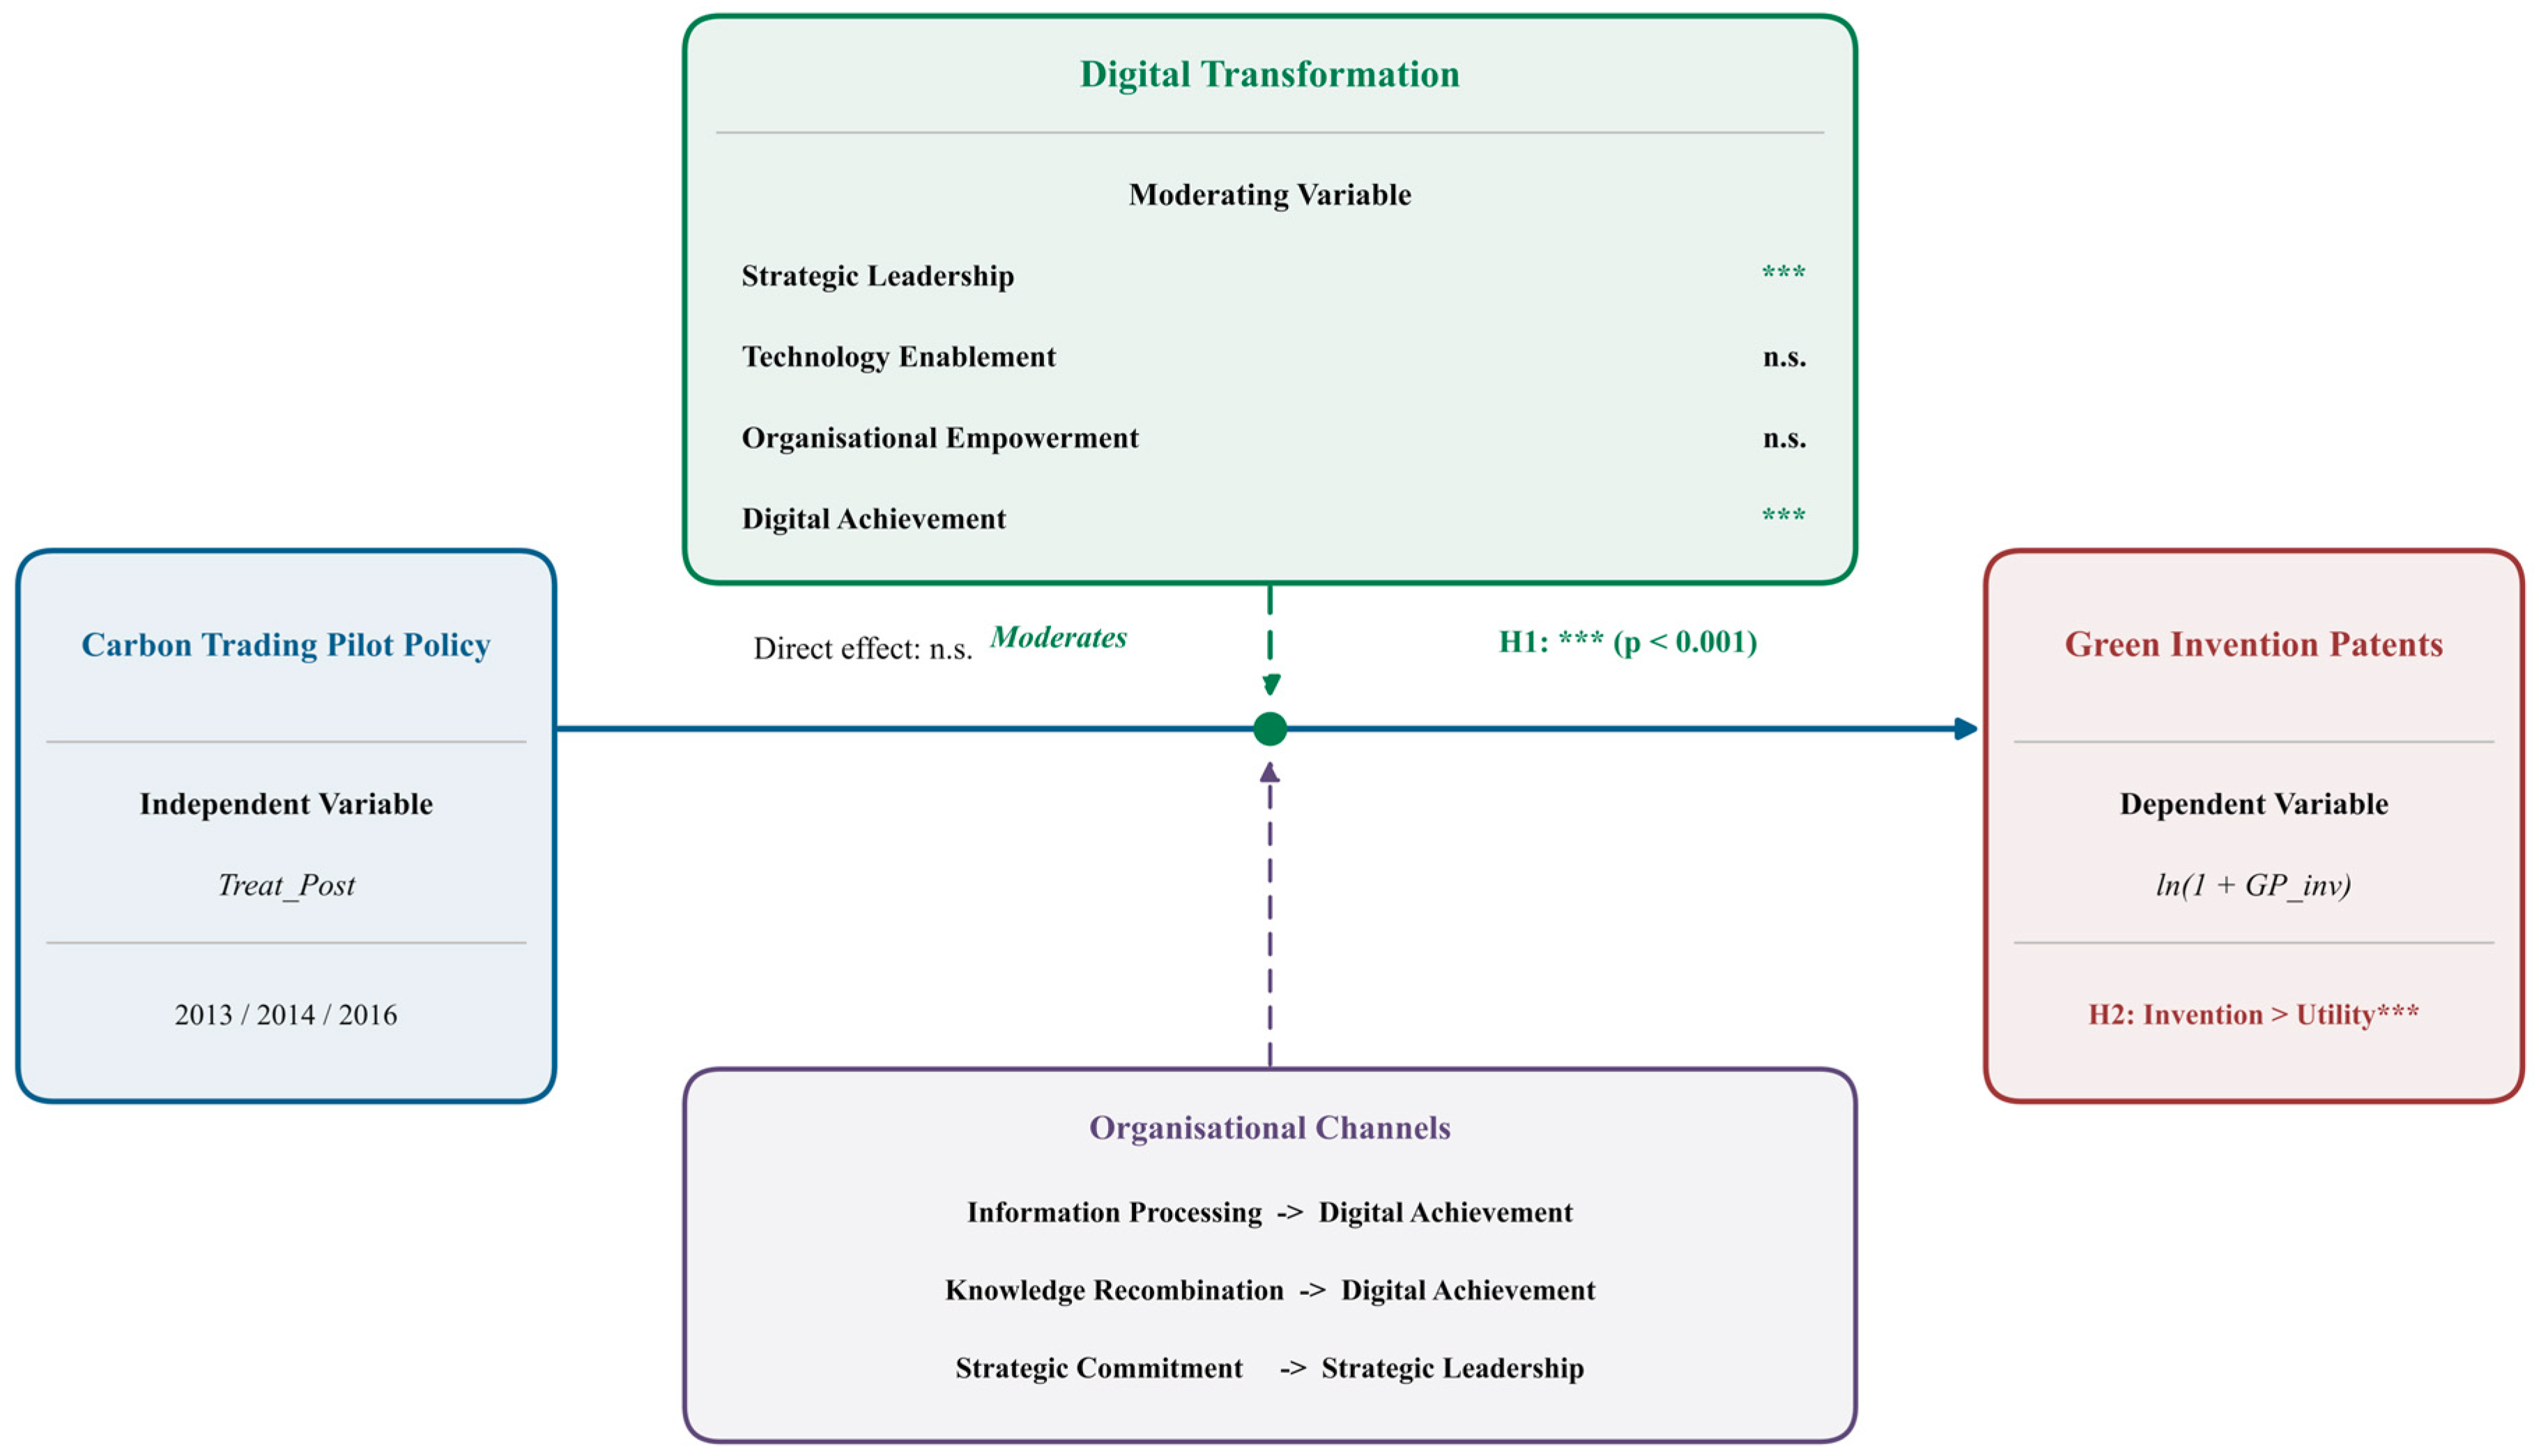
Taken together, these channels suggest that the moderating effect of digital transformation may be more visible in strategic leadership and digital achievement than in the other sub-dimensions. Figure 1 summarizes the conceptual framework linking carbon pricing, digital transformation, and green innovation. The theoretical mechanism further predicts that the complementarity will be stronger for green invention patents than for utility model registrations: invention patents require sustained, multi-period R&D investment and formal examination, making them more sensitive to the organizational capabilities that digital transformation provides, whereas utility model patents can be filed without substantive examination and may reflect defensive or incremental behavior that is insensitive to the digital-policy interaction. Based on the theoretical argument, two formal hypotheses are advanced.
Figure 1.
Conceptual Framework. Notes: * p < 0.1; ** p < 0.05; *** p < 0.01; n.s. = not statistically significant.
H1:
Digital transformation capability positively moderates the effect of carbon trading pilot policy on firm-level green invention patent activity.
H2:
The moderating effect of digital transformation on the carbon trading policy-innovation relationship is statistically stronger for green invention patents than for green utility model patents.
H1 is tested via the interaction term Treat_Post x DT_std. H2 is examined by replacing the dependent variable with ln(1 + GP_util) and comparing the two interaction coefficients through a cross-equation Wald test.
3. Data and Variables
3.1. Data Sources and Sample Construction
The empirical analysis uses an unbalanced panel of A-share listed firms traded on the Shanghai and Shenzhen Stock Exchanges over 2011–2022. The terminal year is 2022 because the Digital Transformation Index (DTI) of Wu et al. (2021) is only available through that year; the estimation window is therefore determined by the common temporal support of all core variables. This twelve-year span covers the pre-pilot baseline period (2011–2012), the staggered ETS pilot launches (2013–2016), and the subsequent policy consolidation stage culminating in the launch of the national ETS in 2021.
Green patent records are drawn from the InCoPat database using the Cooperative Patent Classification (CPC) Y02 taxonomy, the internationally recognized standard for climate-change mitigation technologies (Calel & Dechezleprêtre, 2016). Firm-level financial and governance variables are sourced from the China Stock Market and Accounting Research (CSMAR) database. Treatment status is assigned on the basis of each firm’s registered province and primary two-digit CSRC industry code, following the sectoral and geographic coverage criteria of the seven ETS pilot programs designated by the NDRC between 2011 and 2013 (Tang et al., 2020; Qi et al., 2021).
Sample construction proceeds in five documented steps. Financial firms are excluded due to their structurally distinct balance sheets and the absence of direct emissions obligations. Real-estate developers are removed because building-sector carbon emissions are regulated through energy-efficiency standards for construction rather than quota trading. Firms incorporated in offshore jurisdictions are dropped. All continuous variables are winsorized at the 1st and 99th percentiles. Observations with missing values in any regression variable are removed, and firms with fewer than three valid observations are excluded to ensure adequate within-unit variation for fixed-effects estimation (Bertrand et al., 2004).
The resulting baseline sample comprises 31,048 firm-year observations from 3287 unique firms, of which 1359 firms are located in pilot provinces and operate in ETS-covered industries (the treated group), and 1928 firms constitute the never-treated control group. The moderation specification, which additionally requires non-missing DTI records, yields 29,482 observations from 3068 firms, with 1285 treated firms. The reduction of 1566 observations (5.0 percent of the baseline) is entirely attributable to missing DTI records. Excluded firms are predominantly newly listed companies whose annual-report text is insufficient for DTI scoring; attrition is concentrated among newly listed firms whose annual-report text is insufficient for DTI scoring. This pattern suggests that the moderation sample is positively selected toward larger and more digitally capable firms, which may limit external validity. Appendix A Table A1 reports the full attrition comparison.
3.2. Variable Definitions
The primary outcome is ln(1 + GP_inv), the logarithm of one plus green invention patent applications filed under the CPC Y02 classification. The log-plus-one transformation accommodates the high proportion of zero counts (87.9 percent of firm-year observations in the moderation sample) without discarding them (Popp, 2002; Aghion et al., 2016). Supplementary outcomes are ln(1 + GP_util) for green utility model patents and ln(1 + GP) for all Y02 patents.
Treat_Post equals one if firm i is registered in a pilot province, operates in an ETS-covered industry, and is observed in or after the formal launch year of that province’s pilot (2013 for Beijing, Shanghai, Tianjin, Guangdong, and Shenzhen; 2014 for Hubei and Chongqing; 2016 for Fujian). This produces three treatment cohorts (gvar in {2013, 2014, 2016}). Assignment is implemented at the firm-year level using each province’s actual launch year, avoiding the misclassification that arises when a common post-treatment threshold is imposed across cohorts (Goodman-Bacon, 2021; Sun & Abraham, 2021).
The digital transformation index is constructed from annual report text following the method of Wu et al. (2021). The index is based on the frequency and thematic coverage of digitalization-related terms in firms’ annual reports, reflecting disclosures about digital strategy, digital infrastructure, and digital applications rather than a direct accounting measure of digital investment. Because keyword-based textual indicators may capture both substantive capability and rhetorical emphasis, the index should be interpreted as a proxy for disclosed digital capability, not as a perfect measure of realized digital transformation. Within-year standardization removes the monotonically increasing cross-sectional trend in the raw DTI that reflects secular economy-wide digitization; this prevents the trend from being absorbed into the interaction term and distorting the placebo permutation distribution (X. Wang & Zhong, 2024).
A pre-determined version lagged by one fiscal year (DT_lag1_wy) is constructed for robustness. Six time-varying firm characteristics are included as controls, each lagged by one fiscal year: log total assets (Size), leverage (LEV), return on assets (ROA), cash holdings (CashHolding), firm age (FirmAge), and revenue growth (Revenue_Growth). Table 1 reports the descriptive statistics for the main variables.
Table 1.
Descriptive statistics.
3.3. Empirical Strategy
The baseline estimator is a two-way fixed-effects difference-in-differences (TWFE-DID) regression. Firm fixed effects absorb time-invariant unobservables, and year fixed effects control for aggregate trends.
Baseline specification (Equation (1)):
where denotes the vector of time-varying controls. A positive and significant α1 would indicate an unconditional ETS innovation effect. The moderation specification (Equation (2)) introduces the interaction between Treat_Post and DT_std:
The coefficient β3 captures the moderating effect of digital transformation. A positive and significant β3 constitutes evidence for H1. To test H2, Equation (2) is re-estimated with ln(1 + GP_util), and the two interaction coefficients are compared via a Wald test. The pre-treatment coefficients should be interpreted cautiously because the figure shows some fluctuation around t = −3 and t = −2. The baseline estimator is estimated with firm fixed effects and year fixed effects, and standard errors are clustered at the firm level throughout (Bertrand et al., 2004).
4. Empirical Results
4.1. Baseline DID Results
As shown in Table 2, the coefficient on Treat_Post is statistically indistinguishable from zero across all three dependent variables. The null average effect is consistent with a weak and heterogeneous carbon price signal. It should not be interpreted as definitive evidence of policy ineffectiveness, because it may also reflect delayed adjustment, limited statistical power, treatment misclassification, or attenuation from measurement error. This null unconditional effect is consistent with a literature documenting that China’s pilot programs, characterized by administratively guided price ceilings and persistent trading illiquidity, have not generated uniform innovation incentives across regulated firms (Li et al., 2022; Zhao et al., 2025).
Table 2.
Baseline Difference-in-Differences Estimates.
4.2. Moderation Effect of Digital Transformation
Table 3 reports moderation estimates from Equation (2) using 29,482 observations. For green invention patents, the interaction term is positive and statistically significant, indicating that digital transformation strengthens the innovation response to carbon pricing among treated firms. For green utility model patents, the interaction is not statistically significant. The cross-equation test indicates that the interaction is stronger for invention patents than for utility models.
Table 3.
Moderation Effect of Digital Transformation.
4.3. Mechanism Analysis: Digital Sub-Dimensions
Table 4 decomposes the composite DTI into four sub-dimensions to identify the organizational channels through which digital capability amplifies the ETS innovation response. Each sub-dimension enters in its original scale (not re-standardized) so that coefficients are numerically small but internally comparable. Strategic leadership yields a positive and highly significant interaction (β3 = 0.0016, SE = 0.0004, p < 0.001), as does digital achievement (β3 = 0.0040, SE = 0.0014, p = 0.0040). By contrast, technology enablement (p = 0.4690) and organizational empowerment (p = 0.5260) do not attain significance.
Table 4.
Mechanism Analysis by Digital Sub-dimension.
These results suggest that the complementarity is concentrated in strategic leadership and digital achievement, rather than in technology enablement or organizational empowerment. Specifically, the digital achievement dimension aligns with an environmental information-processing mechanism: firms whose annual reports reflect concrete operational outcomes from digital investments are more likely to possess real-time monitoring infrastructure, which enables the identification and prioritization of carbon-reduction R&D opportunities (Hao et al., 2023). However, the strategic leadership dimension should be interpreted more cautiously, as it may merely reflect managerial attention to digitalization rather than a substantive reorientation of R&D priorities (X. Wang & Zhong, 2024). Furthermore, because all four sub-dimensions are derived from the same text-based source, they may partially capture a firm’s rhetorical commitment; therefore, common-method variance cannot be ruled out completely.
5. Robustness and Identification Checks
5.1. Event Study and Parallel Trends
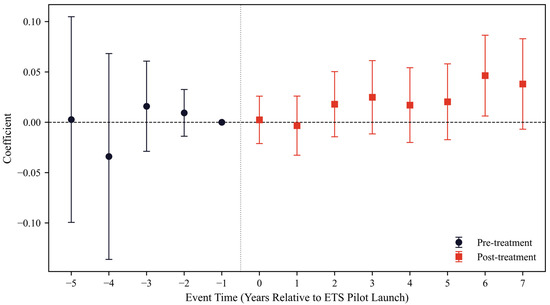
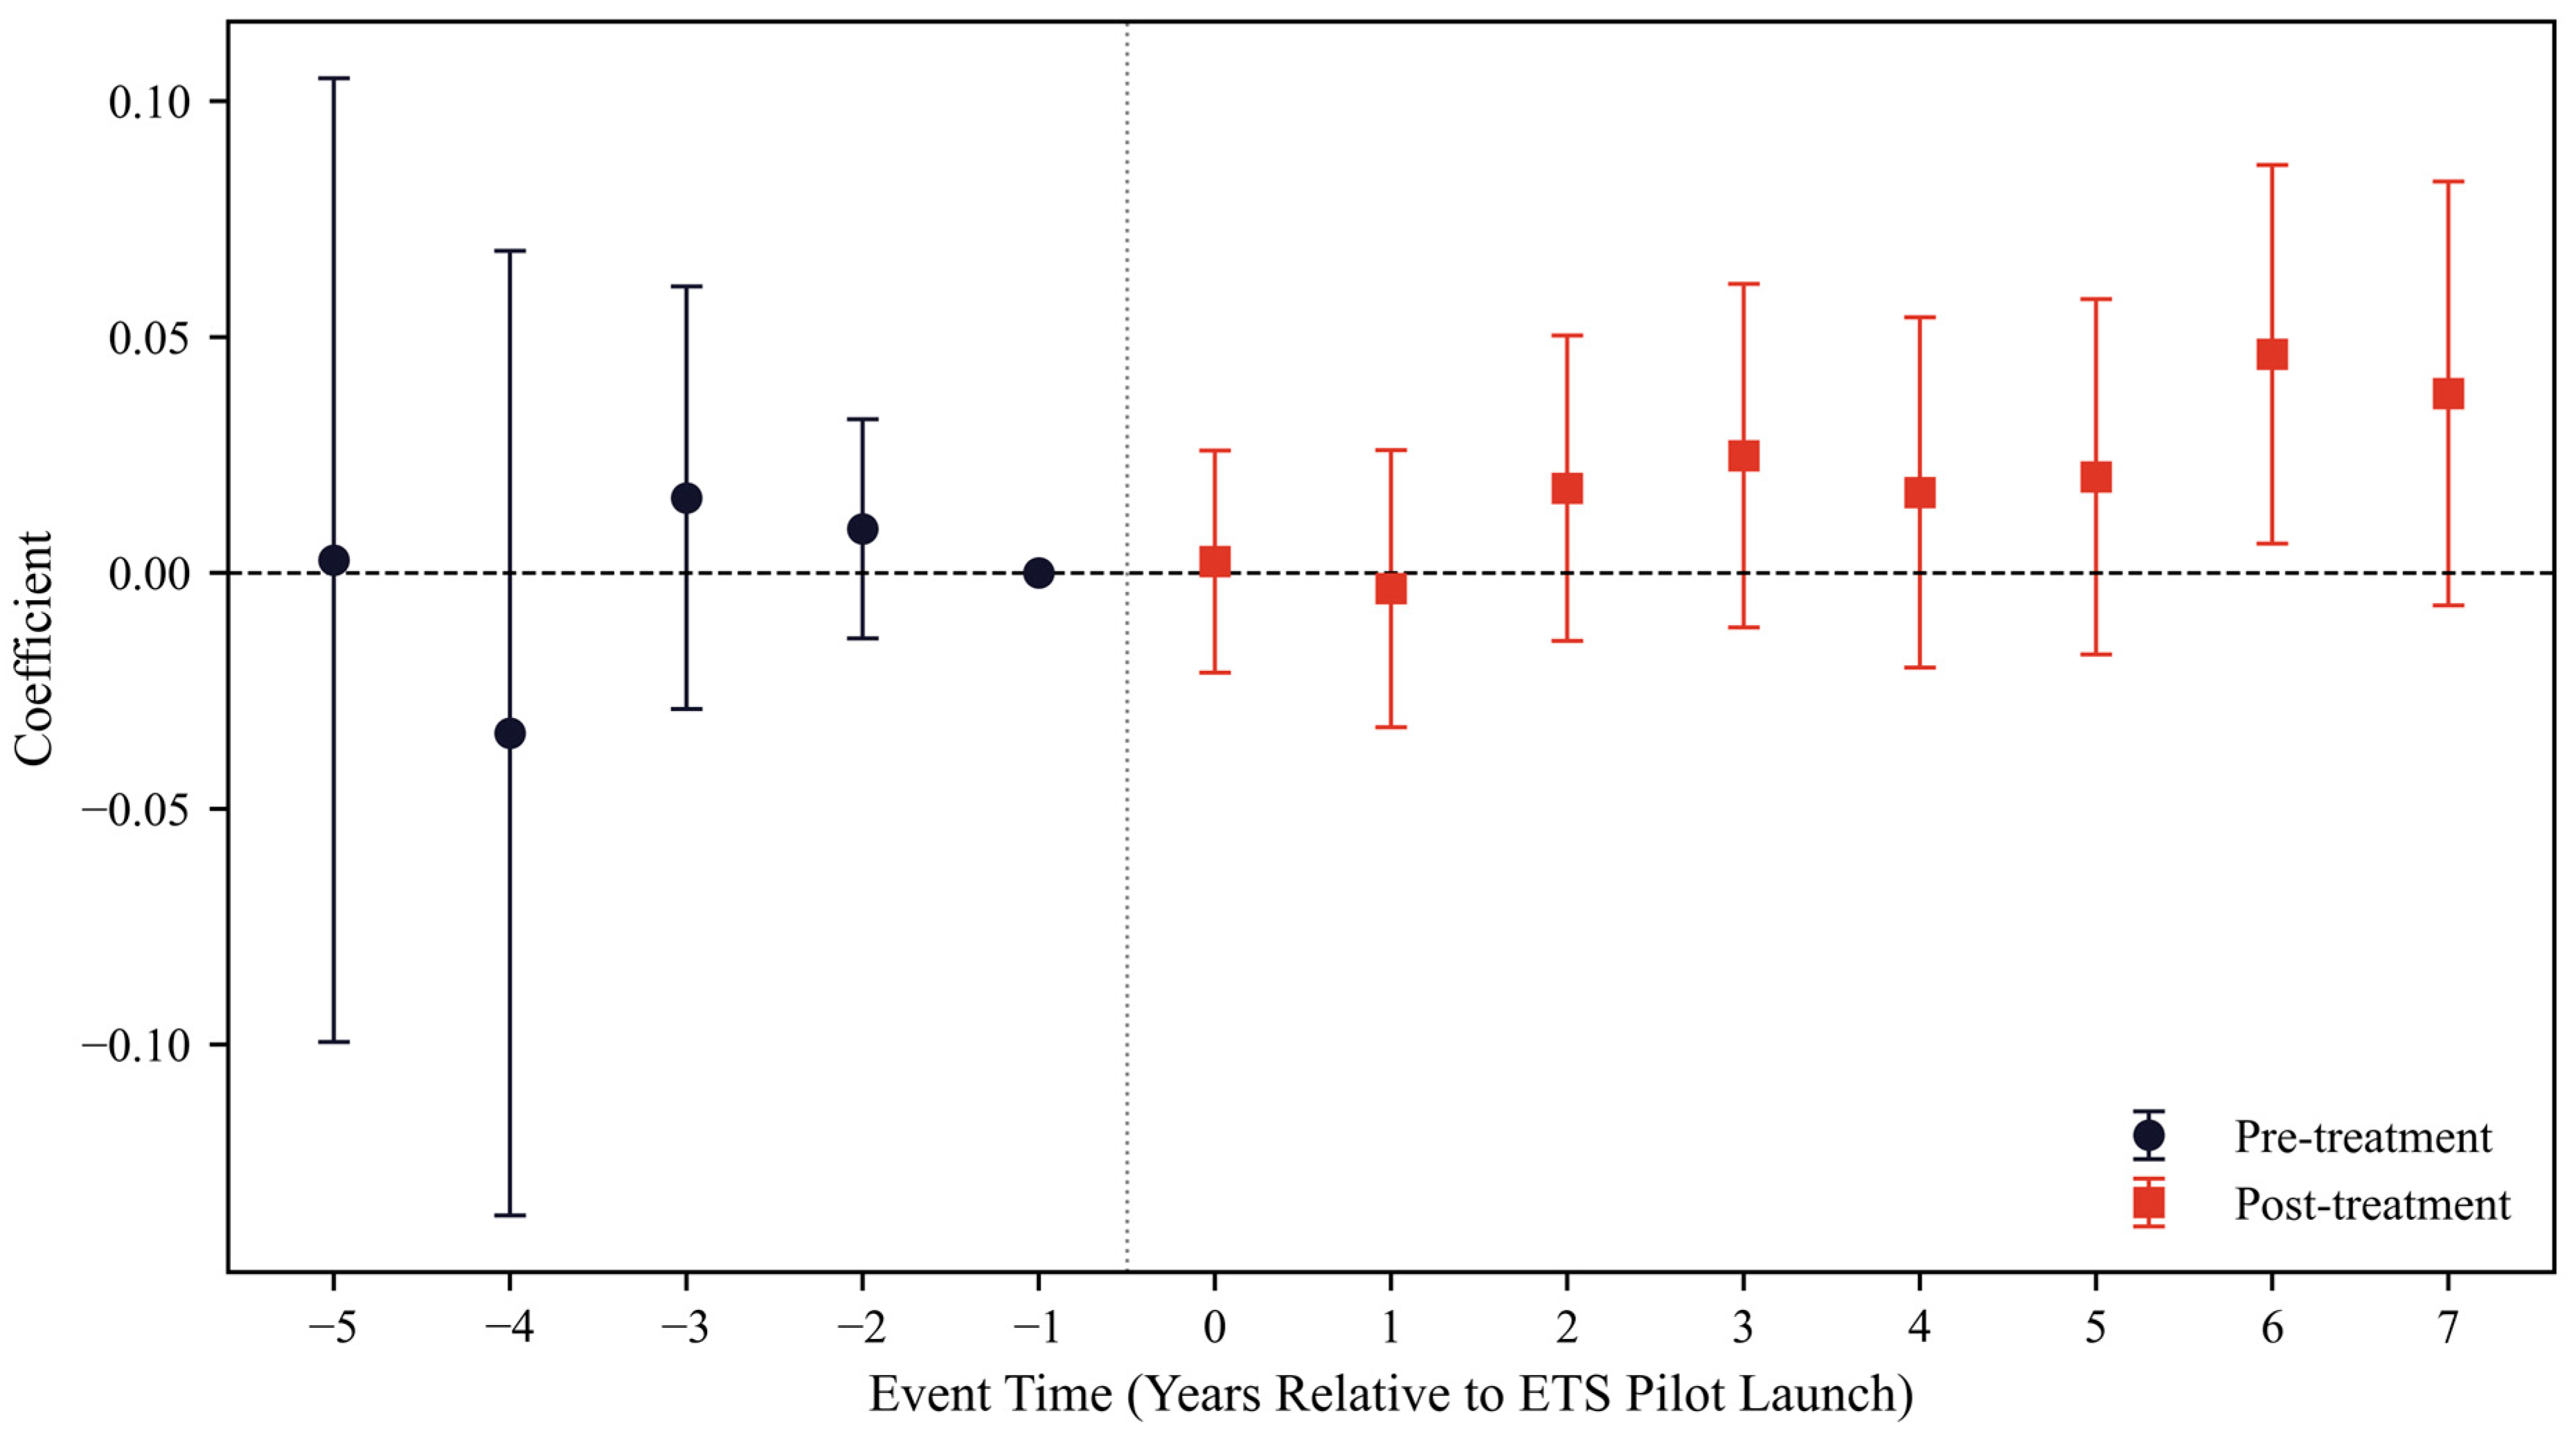
The event-study specification replaces Treat_Post with event-time indicators defined relative to each cohort’s pilot launch year, normalizing to t = −1. Because the sample begins in 2011, the available pre-treatment window varies by cohort: the 2013 cohort contributes two pre-treatment years (t = −2, −1), the 2014 cohort contributes three (t = −3, −2, −1), and the 2016 cohort contributes five (t = −5 to −1).
The full set of event-time coefficients and standard errors is reported in Appendix A Table A3. The pre-treatment coefficients fluctuate around zero, especially at t = −3 and t = −2, which suggests that the parallel-trends assumption is plausible but not perfectly tight (Callaway & Sant’Anna, 2021; Roth et al., 2023). The post-treatment coefficients show a gradual upward pattern, and the marginally significant estimate at t = +7 suggests a delayed response, although interpretation remains limited by the short post-treatment window (Calel & Dechezleprêtre, 2016). Figure 2 presents the full set of event-study estimates.
Figure 2.
Event-study estimates. Bands = 95% CI. Reference period: t = −1.
5.2. Alternative Specifications
Table 5 reports five robustness specifications. Specification (i) reproduces the TWFE baseline. Specification (ii) replaces year fixed effects with industry-by-year interactions to absorb industry-specific technological trends, a more demanding control structure that accounts for the possibility that treated and control firms differ systematically in their sectoral innovation trajectories. The moderating interaction remains significant (β3 = 0.0296, p = 0.0293). Specification (iii) uses the pre-determined DT index lagged by one fiscal year to address reverse causality; the significant estimate (β3 = 0.0349, p = 0.0066) confirms the complementarity reflects a pre-existing organizational prerequisite.
Table 5.
Robustness of the Moderation Effect.
Specification (iv) employs the Borusyak et al. (2024) imputation estimator, which constructs counterfactuals exclusively from clean control observations to address potential negative-weight bias under heterogeneous treatment effects (de Chaisemartin & D’Haultfœuille, 2020; Goodman-Bacon, 2021). The estimate β3 = 0.029 (SE = 0.0190, p = 0.1130) is directionally consistent with the TWFE benchmark but does not attain conventional significance, reflecting the reduced effective sample of clean controls and the more conservative variance estimator under this approach. We acknowledge this reduced precision and retain TWFE as the primary specification, while noting that the BJS point estimate supports the qualitative conclusion of a positive policy–digital transformation complementarity. Specification (v) adds lagged R&D intensity as a control to isolate the digital transformation channel from baseline R&D capacity; this specification is estimated on the 13,262 observations with non-missing R&D data (see Appendix A Table A2 for sub-sample comparability). The point estimate remains positive and similar in magnitude to the baseline result, but its confidence interval includes zero, indicating lower precision in the reduced sample rather than a clear attenuation of the effect.
5.3. Cohort-Specific ATT
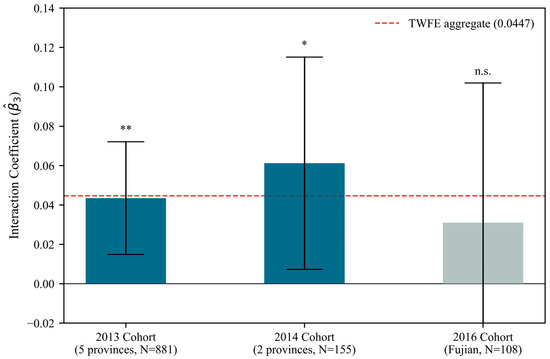
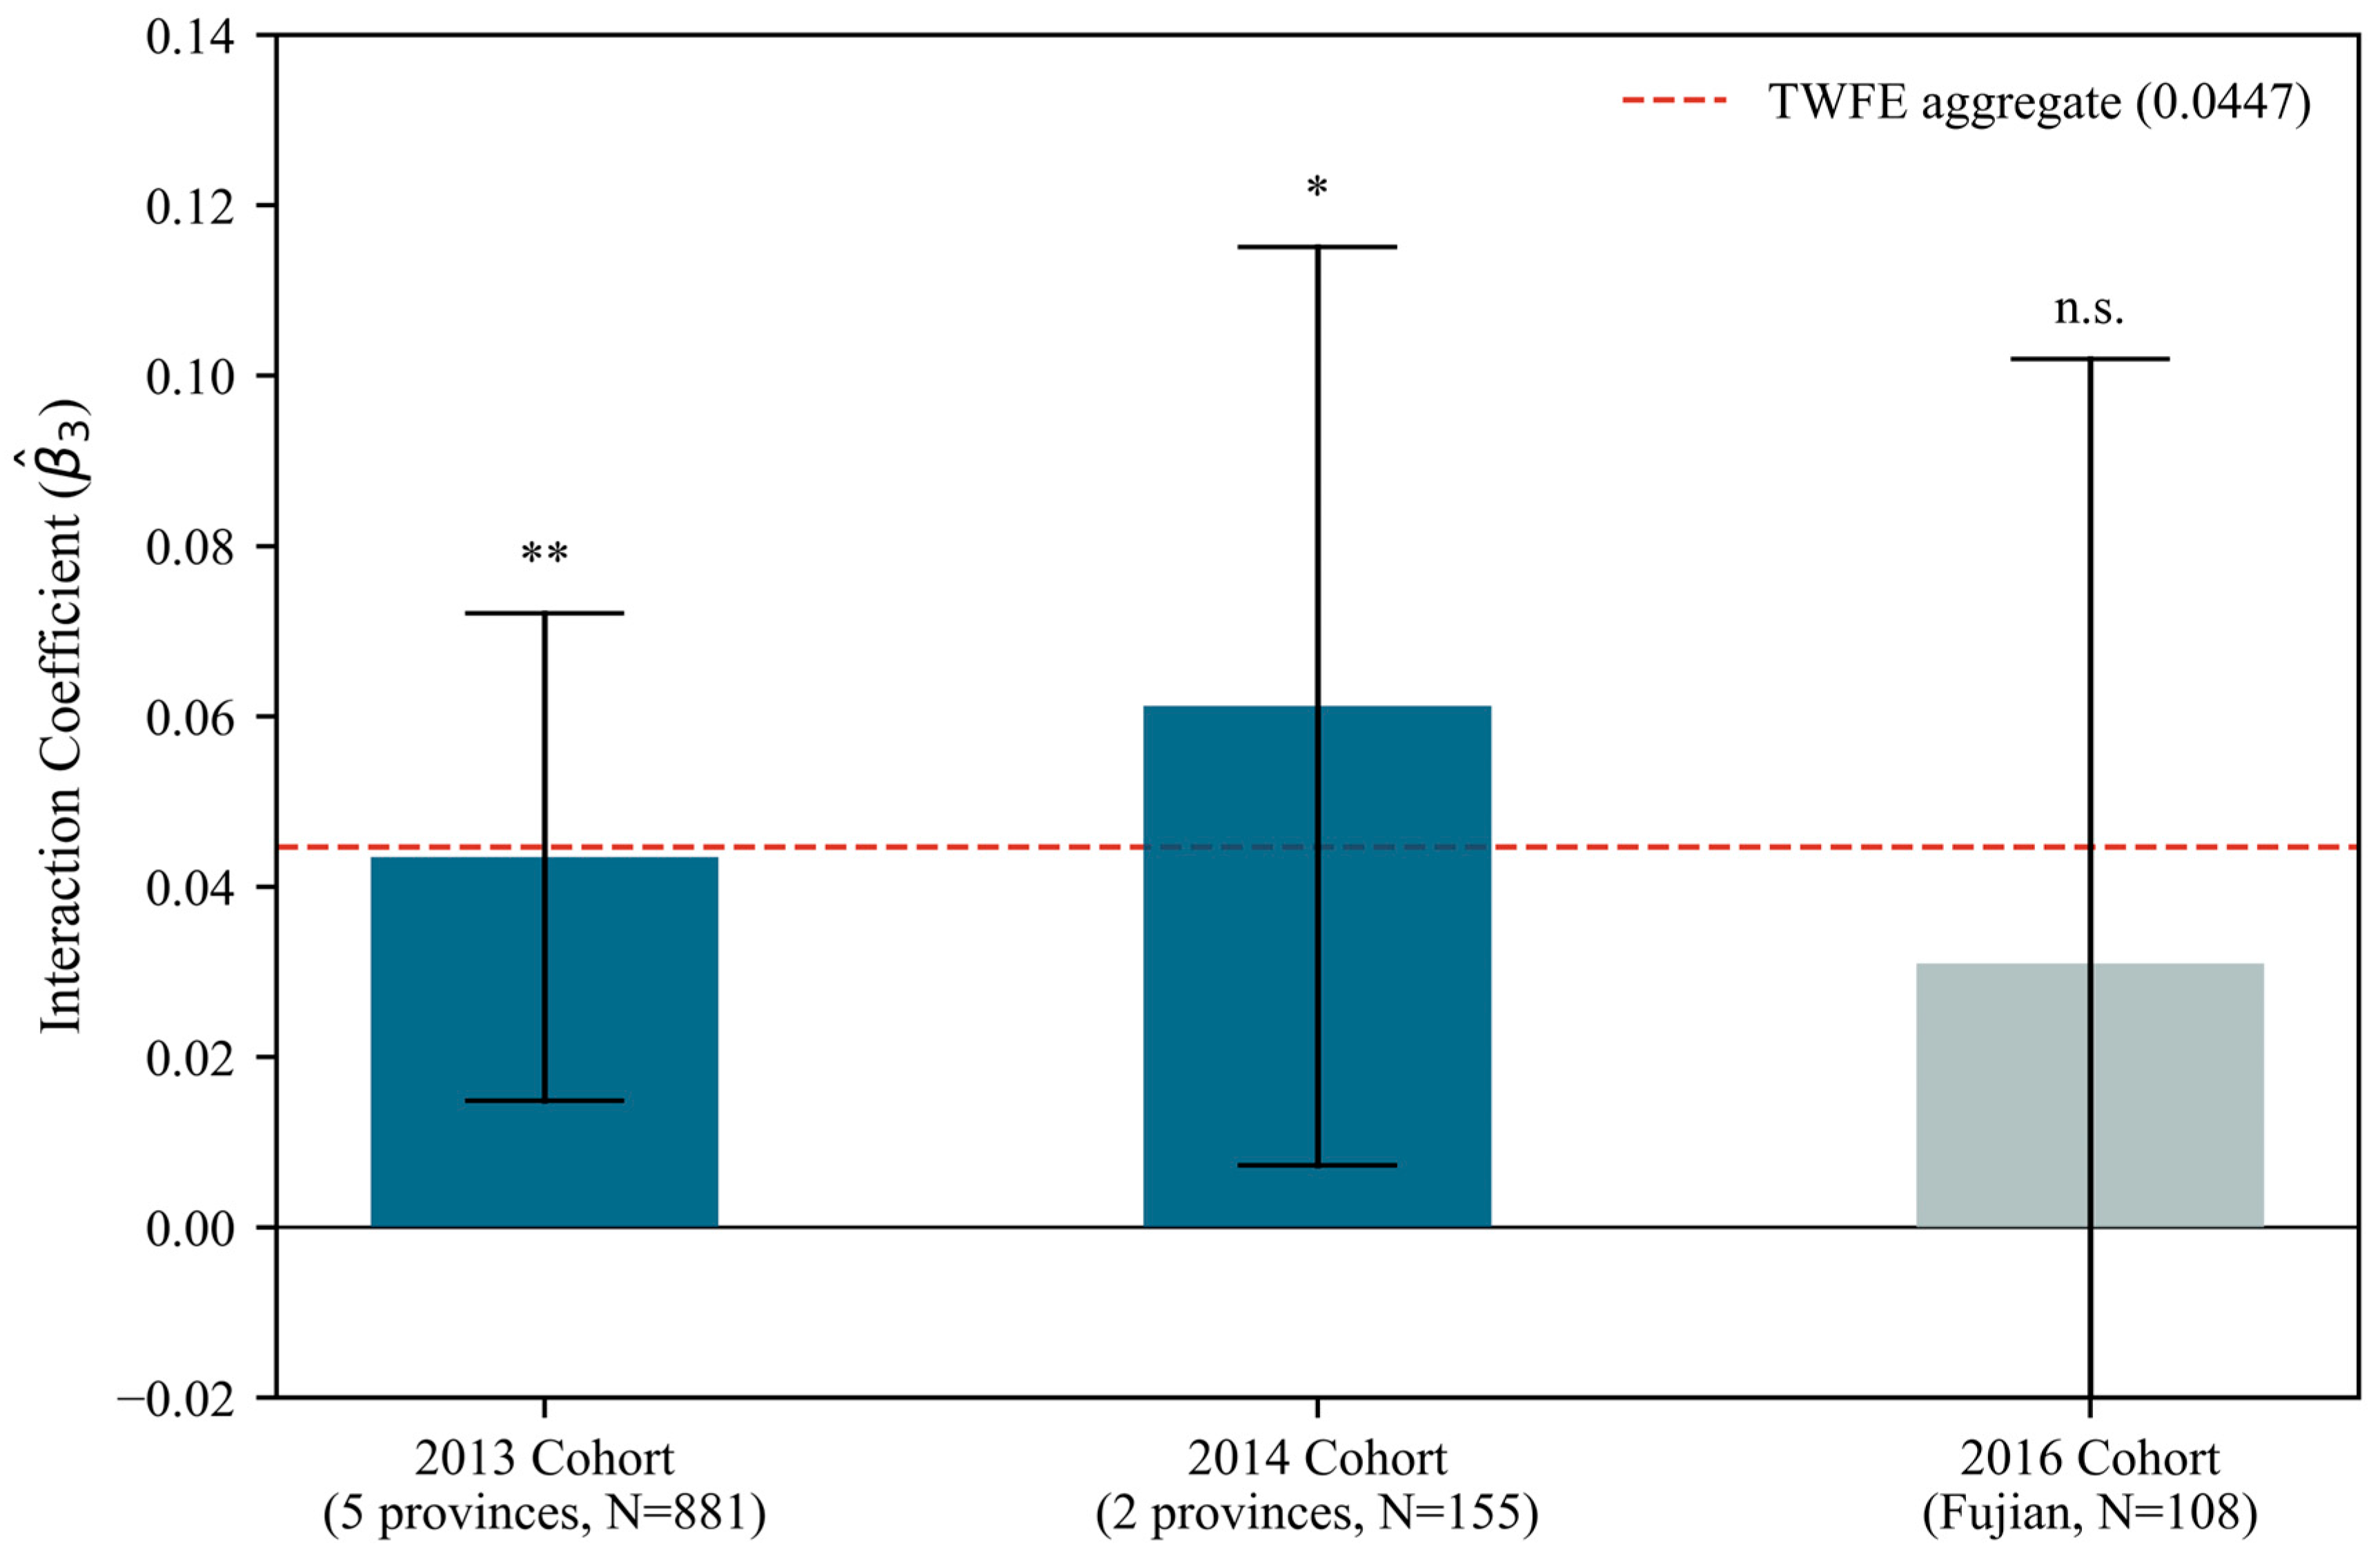
Following Sun and Abraham (2021), the moderation specification is re-estimated separately for each treatment cohort paired with the never-treated control group, eliminating cross-cohort contamination and producing cohort-specific ATT estimates. As shown in Figure 3, all three cohort estimates are positive. The 2013 cohort (Beijing, Shanghai, Tianjin, Guangdong, Shenzhen) yields β3 = 0.0435 (SE = 0.0146, p = 0.003, N = 22,763 with 881 treated firms). Although the cohort-specific estimation recovers observations dropped from the moderation sample due to DTI attrition, N = 22,763 remains smaller than the full moderation sample because it pairs only the 2013-cohort treated firms with never-treated controls. The 2014 cohort (Hubei, Chongqing) yields β3 = 0.0612 (SE = 0.0275, p = 0.026, N = 16,618 with 155 treated firms), though inference should be treated with caution given the limited number of treated firms. The 2016 Fujian cohort yields a positive but imprecise estimate (β3 = 0.0310, SE = 0.0362, p = 0.391, N = 16,112 with 108 treated firms), attributable to its small treated-firm count and short post-treatment exposure window. Directional consistency across cohorts confirms the TWFE result is not an artifact of negative implicit weighting (Baker et al., 2022; Goodman-Bacon, 2021).
Figure 3.
Cohort-specific ATT estimates. Dashed line = TWFE aggregate. Notes: * p < 0.1; ** p < 0.05; *** p < 0.01; n.s. = not statistically significant.
5.4. Placebo Test
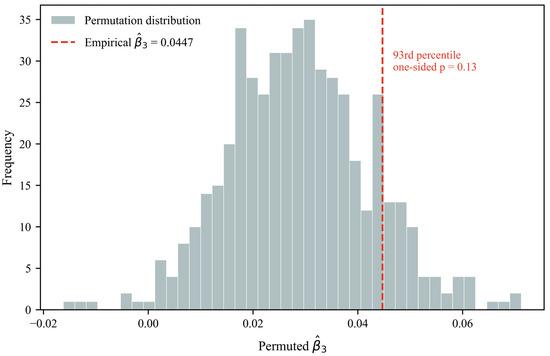
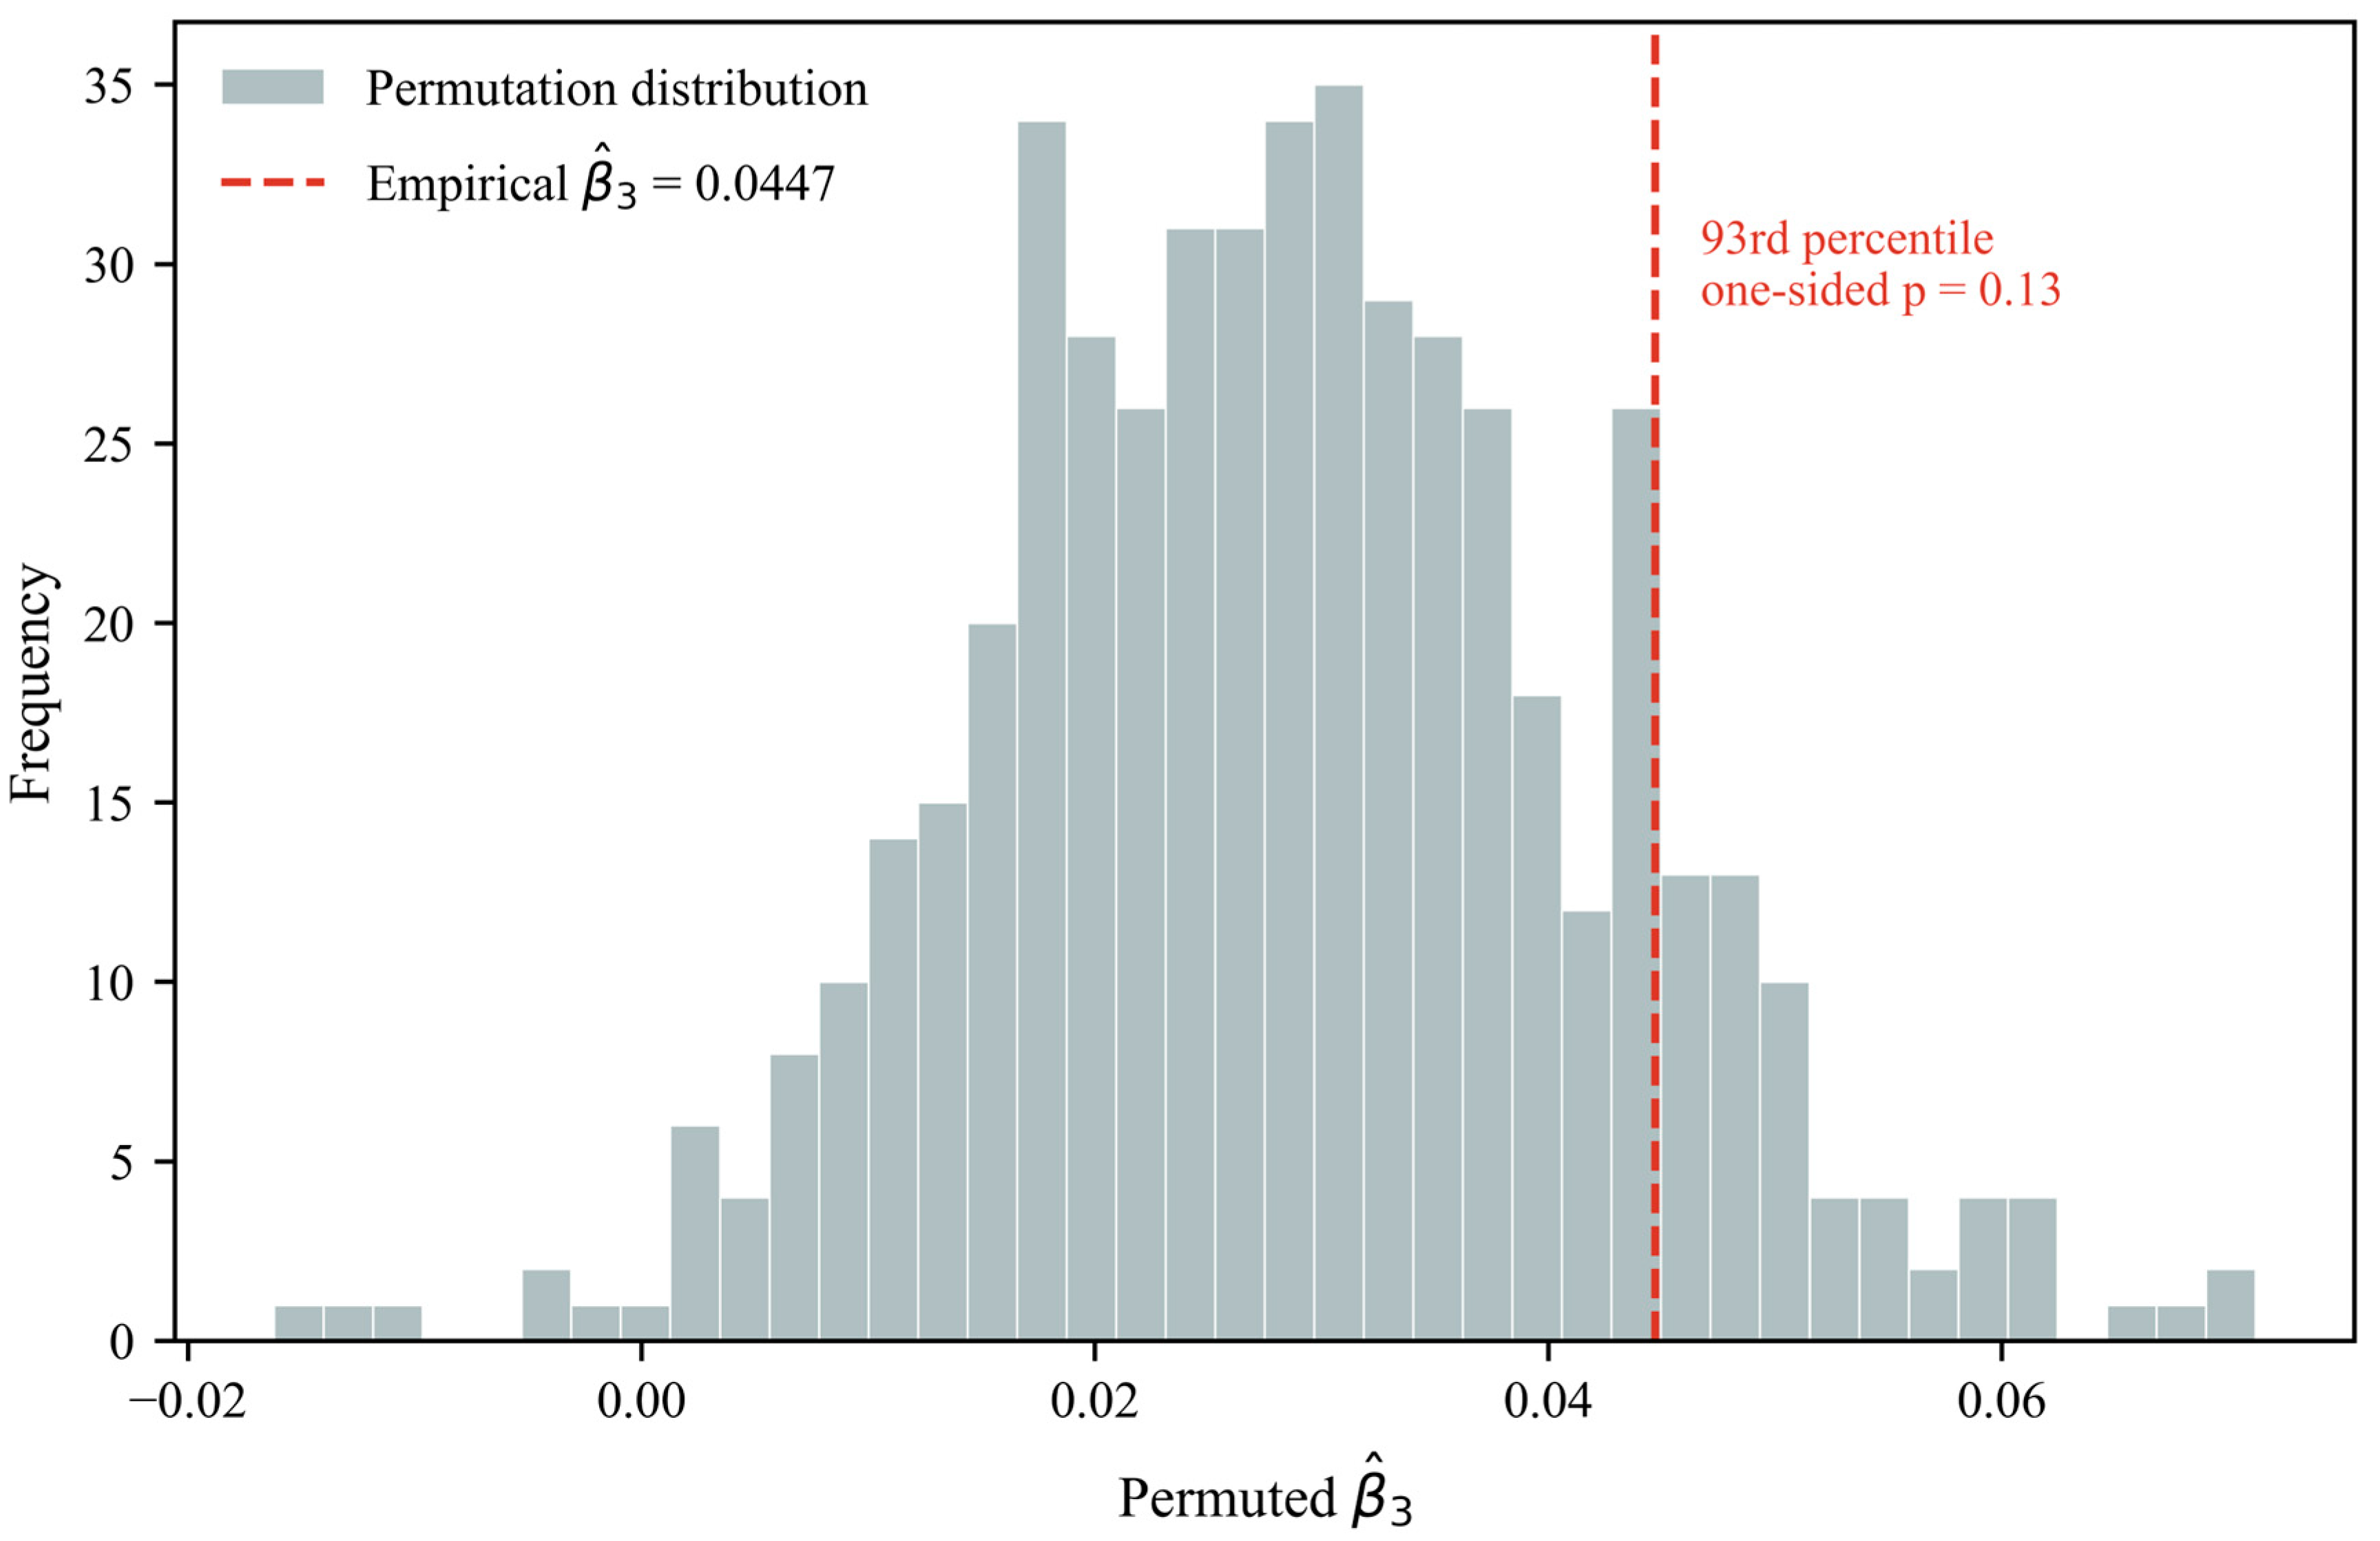
To assess whether the observed interaction reflects spurious correlation between digital capability and treatment assignment, a within-province-year permutation test is conducted with 500 replications. In each replication, firm-level treatment labels are randomly reshuffled within province-year cells, preserving the geographic and temporal structure of treatment while eliminating the systematic link to firm-level digital capability.
The empirical estimate β3 = 0.0447 lies at the 93rd percentile of the permutation distribution (one-tailed permutation p = 0.07), indicating that fewer than 7 percent of randomly assigned treatment-capability interactions produce an effect as large as the observed coefficient. We do not claim significance on this basis, as the result does not attain conventional two-sided thresholds (p = 0.14); however, the right-tail placement is inconsistent with a pure sampling artifact and corroborates the parametric inference reported in Section 4.2. Figure 4 displays the full permutation distribution. Province-level permutation is not adopted as the primary test because only seven non-pilot provinces are available for reshuffling, yielding a high-variance null distribution with insufficient resolution to distinguish genuine effects from sampling noise (MacKinnon & Webb, 2020).
Figure 4.
Permutation placebo distribution (500 replications).
5.5. Heterogeneity Analysis
Since SOE status and heavy-pollution designation are time-invariant firm characteristics, they are collinear with firm fixed effects and cannot be included directly in the main regression. Heterogeneity is therefore examined through subsample regressions, allowing the interaction coefficient β3 to vary across ownership type (SOE vs. non-SOE) and pollution intensity (heavy-polluting vs. non-heavy-polluting industries, per the Ministry of Environmental Protection 2008 classification). These characteristics are absorbed by firm fixed effects in the baseline specification and are introduced explicitly only in heterogeneity and robustness exercises. Among SOEs, β3 = 0.079 (SE = 0.025, p = 0.002; N = 1030 firms, firm-clustered SE); among non-SOEs, the interaction is positive but only marginally significant (β3 = 0.023, SE = 0.013, p = 0.087; N = 2038 firms). The more than threefold differential is consistent with the view that state-owned enterprises face stronger institutional pressure to demonstrate environmental compliance, conditions under which digital capability provides the organizational infrastructure through which policy mandates are translated into targeted R&D (C. Wang et al., 2024). The interaction is positive in both pollution strata but reaches conventional significance only among non-heavy-polluting firms (β3 = 0.046, SE = 0.013, p < 0.001; N = 2685 firms), while the heavy-polluting subsample yields a larger but imprecisely estimated coefficient (β3 = 0.072, SE = 0.055, p = 0.189; N = 383 firms). The absence of significance in the heavy-polluting subsample likely reflects limited statistical power given the smaller cluster count (383 firms) rather than a true null effect; the point estimate is directionally consistent with the view that regulatory pressure and digital capability are complementary rather than substitutable (Cohen & Levinthal, 1990; Tao et al., 2024). All subsample regressions retain firm-clustered standard errors; the minimum cluster count is 383 (heavy-pollution subsample), well above the threshold commonly recommended for reliable cluster-robust inference (Cameron & Miller, 2015).
6. Conclusions
6.1. Summary of Findings
This study examines the conditional innovation effect of China’s carbon trading pilot programs on firm-level green invention patents, with digital transformation capability as the primary moderating variable. Drawing on an unbalanced panel of 31,048 firm-year observations (29,482 in the moderation specification) from A-share listed companies over 2011–2022, and employing a two-way fixed-effects difference-in-differences estimator with firm-clustered standard errors, the null unconditional treatment effect and significant policy–digital interaction reported in Section 4 jointly indicate that China’s carbon trading pilots do not generate uniform innovation incentives; the green invention response is instead concentrated among firms with sufficient digital capability. The moderating effect applies exclusively to examination-intensive invention patents, as confirmed by the cross-equation Wald test reported in Section 4.2, and is consistent with a strong-form Porter mechanism requiring sustained, multi-period R&D capacity for activation (Porter & van der Linde, 1995; Ambec et al., 2013).
The findings indicate that the innovation effect of environmental regulation depends on firm-level organizational prerequisites rather than operating uniformly across the regulated population. Prior evidence has established the general validity of the Porter hypothesis, but the organizational conditions under which it operates remain underexplored (Ambec et al., 2013; Dechezleprêtre & Sato, 2017). This study shows that digital transformation capability is one such binding condition: firms without sufficient digital capacity may lack the information-processing infrastructure and strategic commitment needed to convert carbon price signals into green invention output (Cohen & Levinthal, 1990).
The mechanism analysis further suggests that the relevant digital capabilities are strategic leadership and digital achievement, not merely the breadth of technology adoption. The results therefore recast digital transformation as a policy-contingent complementary asset whose returns are higher when firms simultaneously face carbon pricing (Teece, 1986; Lv et al., 2021; Tao et al., 2024; X. Wang & Zhong, 2024).
6.2. Policy Implications
The results imply that carbon pricing alone is unlikely to produce a broad innovation dividend across firms with very different digital capabilities; the gains are likely to be concentrated among firms already able to translate price signals into R&D responses. Complementary policies should therefore lower the fixed costs of outcome-oriented digitization for regulated firms with weak digital infrastructure, rather than support digitization indiscriminately. The heterogeneity across SOEs and non-SOEs is consistent with the view that accountability channels shape how carbon pricing translates into innovation, especially as China’s national ETS expands beyond the power sector (C. Wang et al., 2024).
The sub-dimension results also suggest that policy should distinguish between surface-level technology deployment and outcome-oriented digital integration. Without this distinction, evaluations of the innovation dividend from carbon pricing and digital transformation are likely to be misleading.
6.3. Limitations and Future Research
Three limitations should temper interpretation. First, the identification relies on the parallel trends assumption, which is supported by the event-study evidence within the observed window but cannot be verified for periods before sample entry. The null baseline result should therefore be interpreted cautiously: it may reflect limited statistical power, measurement error in the treatment or outcome variables, or a delayed response that falls outside the observed post-treatment window, rather than a clean absence of policy effects. Future work employing synthetic control methods or matching estimators could provide complementary identification evidence (Callaway & Sant’Anna, 2021; Roth et al., 2023). Second, the sample is limited to A-share listed firms, which are larger and more digitally capable than the broader population of regulated enterprises, so the results may not generalize well to SMEs and non-listed firms. Third, the digital transformation index is text-based and may capture disclosed commitment rather than realized capability, so the mechanism estimates should be interpreted cautiously. Future research using alternative digitalization measures and longer post-treatment windows would help assess whether the complementarity persists over time.
The broader implication is that the effectiveness of carbon pricing depends not only on policy design but also on the organizational landscape of regulated firms (Qi et al., 2021; Wu et al., 2021).
Author Contributions
Conceptualization, M.X. and Y.Y.; methodology, M.X. and Z.T.; software, M.X.; validation, M.X., Z.T. and Y.Y.; formal analysis, M.X. and Z.T.; investigation, M.X.; resources, M.X.; data curation, M.X. and Z.T.; writing—original draft preparation, M.X.; writing—review and editing, M.X., Z.T. and Y.Y.; visualization, M.X.; supervision, Y.Y.; project administration, Y.Y.; funding acquisition, Y.Y. All authors have read and agreed to the published version of the manuscript.
Funding
This research received no external funding.
Institutional Review Board Statement
Not applicable.
Informed Consent Statement
Not applicable.
Data Availability Statement
The aggregated data analyzed in this study are available from the corresponding authors upon reasonable request.
Conflicts of Interest
The authors declare no conflicts of interest.
Appendix A
The two appendix tables address the two main sample-selection concerns raised in the internal review: (A1) whether the 5.0 percent attrition from missing DTI records is selective in ways that distort inference, and (A2) whether the R&D-reporting sub-sample used in Specification (v) of Table 5 is representative of the full moderation sample. Both tables are included here to support full transparency; they are recommended for the online appendix or a footnote reference in the submitted manuscript.
Table A1.
Sample Attrition from Missing DTI Records.
Table A2.
Comparability of the R&D-Reporting Sub-sample.
Table A3.
Event-study Estimates for the Parallel-trends Test.
References
- Acemoglu, D., Aghion, P., Bursztyn, L., & Hemous, D. (2012). The environment and directed technical change. The American Economic Review, 102(1), 131–166. [Google Scholar] [CrossRef] [Scilit] [PubMed]
- Aghion, P., Dechezleprêtre, A., Hémous, D., Martin, R., & Van Reenen, J. (2016). Carbon taxes, path dependency, and directed technical change: Evidence from the auto industry. The Journal of Political Economy, 124(1), 1–51. [Google Scholar] [CrossRef] [Scilit]
- Ambec, S., Cohen, M. A., Elgie, S., & Lanoie, P. (2013). The porter hypothesis at 20: Can environmental regulation enhance innovation and competitiveness? Review of Environmental Economics and Policy, 7(1), 2–22. [Google Scholar] [CrossRef] [Scilit]
- Baker, A. C., Larcker, D. F., & Wang, C. C. Y. (2022). How much should we trust staggered difference-in-differences estimates? Journal of Financial Economics, 144(2), 370–395. [Google Scholar] [CrossRef] [Scilit]
- Bertrand, M., Duflo, E., & Mullainathan, S. (2004). How much should we trust differences-in-differences estimates? The Quarterly Journal of Economics, 119(1), 249–275. [Google Scholar] [CrossRef] [Scilit]
- Borusyak, K., Jaravel, X., & Spiess, J. (2024). Revisiting event-study designs: Robust and efficient estimation. The Review of Economic Studies, 91(6), 3253–3285. [Google Scholar] [CrossRef] [Scilit]
- Calel, R., & Dechezleprêtre, A. (2016). Environmental policy and directed technological change: Evidence from the European carbon market. The Review of Economics and Statistics, 98(1), 173–191. [Google Scholar] [CrossRef] [Scilit]
- Callaway, B., & Sant’Anna, P. H. C. (2021). Difference-in-differences with multiple time periods. Journal of Econometrics, 225(2), 200–230. [Google Scholar] [CrossRef] [Scilit]
- Cameron, A. C., & Miller, D. L. (2015). A practitioner’s guide to cluster-robust inference. The Journal of Human Resources, 50(2), 317–372. [Google Scholar] [CrossRef] [Scilit]
- Chen, Z., Zhang, X., & Chen, F. (2021). Do carbon emission trading schemes stimulate green innovation in enterprises? Evidence from China. Technological Forecasting & Social Change, 168, 120744. [Google Scholar] [CrossRef] [Scilit]
- Cohen, W. M., & Levinthal, D. A. (1990). Absorptive capacity: A new perspective on learning and innovation. Administrative Science Quarterly, 35(1), 128–152. [Google Scholar] [CrossRef] [Scilit]
- de Chaisemartin, C., & D’Haultfœuille, X. (2020). Two-way fixed effects estimators with heterogeneous treatment effects. The American Economic Review, 110(9), 2964–2996. [Google Scholar] [CrossRef] [Scilit]
- Dechezleprêtre, A., & Sato, M. (2017). The impacts of environmental regulations on competitiveness. Review of Environmental Economics and Policy, 11(2), 183–206. [Google Scholar] [CrossRef] [Scilit]
- Fang, M., Nie, H., & Shen, X. (2023). Can enterprise digitization improve ESG performance? Economic Modelling, 118, 106101. [Google Scholar] [CrossRef] [Scilit]
- Goodman-Bacon, A. (2021). Difference-in-differences with variation in treatment timing. Journal of Econometrics, 225(2), 254–277. [Google Scholar] [CrossRef] [Scilit]
- Hambrick, D. C., & Mason, P. A. (1984). Upper echelons: The organization as a reflection of its top managers. The Academy of Management Review, 9(2), 193–206. [Google Scholar] [CrossRef] [Scilit] [PubMed]
- Hao, X., Li, Y., Ren, S., Wu, H., & Hao, Y. (2023). The role of digitalization on green economic growth: Does industrial structure optimization and green innovation matter? Journal of Environmental Management, 325(Pt A), 116504. [Google Scholar] [CrossRef] [Scilit] [PubMed]
- Hicks, J. (1932). The theory of wages. Macmillan. [Google Scholar]
- Li, H., Yang, M., Sun, Y., & Chen, J. (2022). The impact of relaxing technology export regulations on corporate innovation. Finance Research Letters, 50, 103256. [Google Scholar] [CrossRef] [Scilit]
- Lv, C., Shao, C., & Lee, C.-C. (2021). Green technology innovation and financial development: Do environmental regulation and innovation output matter? Energy Economics, 98, 105237. [Google Scholar] [CrossRef] [Scilit]
- MacKinnon, J. G., & Webb, M. D. (2020). Randomization inference for difference-in-differences with few treated clusters. Journal of Econometrics, 218(2), 435–450. [Google Scholar] [CrossRef] [Scilit]
- Popp, D. (2002). Induced innovation and energy prices. The American Economic Review, 92(1), 160–180. [Google Scholar] [CrossRef] [Scilit]
- Porter, M. E., & van der Linde, C. (1995). Toward a new conception of the environment-competitiveness relationship. The Journal of Economic Perspectives, 9(4), 97–118. [Google Scholar] [CrossRef] [Scilit]
- Qi, S.-Z., Zhou, C.-B., Li, K., & Tang, S.-Y. (2021). Influence of a pilot carbon trading policy on enterprises’ low-carbon innovation in China. Climate Policy, 21(3), 318–336. [Google Scholar] [CrossRef] [Scilit]
- Roth, J., Sant’Anna, P. H. C., Bilinski, A., & Poe, J. (2023). What’s trending in difference-in-differences? A synthesis of the recent econometrics literature. Journal of Econometrics, 235(2), 2218–2244. [Google Scholar] [CrossRef] [Scilit]
- Sun, L., & Abraham, S. (2021). Estimating dynamic treatment effects in event studies with heterogeneous treatment effects. Journal of Econometrics, 225(2), 175–199. [Google Scholar] [CrossRef] [Scilit]
- Tang, K., Qiu, Y., & Zhou, D. (2020). Does command-and-control regulation promote green innovation performance? Evidence from China’s industrial enterprises. The Science of the Total Environment, 712, 136362. [Google Scholar] [CrossRef] [Scilit] [PubMed]
- Tao, Y., Lu, H., Ye, Y., & Wu, H. (2024). Does the firms’ digital transformation drive environmental innovation in China? Sustainable Development (Bradford, West Yorkshire, England), 32(3), 2139–2152. [Google Scholar] [CrossRef] [Scilit]
- Teece, D. J. (1986). Profiting from technological innovation: Implications for integration, collaboration, licensing and public policy. Research Policy, 15(6), 285–305. [Google Scholar] [CrossRef] [Scilit]
- Wang, C., Guo, J., Xu, W., & Qin, S. (2024). The impact of digital transformation on corporate green governance under carbon peaking and neutrality goals: Evidence from China. PLoS ONE, 19(6), e0302432. [Google Scholar] [CrossRef] [Scilit] [PubMed]
- Wang, X., & Zhong, X. (2024). Dig ital transformation and green innovation: Firm-level evidence from China. Frontiers in Environmental Science, 12, 1–16. [Google Scholar] [CrossRef] [Scilit]
- Wen, H., Lee, C.-C., & Zhou, F. (2022). How does fiscal policy uncertainty affect corporate innovation investment? Evidence from China’s new energy industry. Energy Economics, 105, 105767. [Google Scholar] [CrossRef] [Scilit]
- Wu, F., Hu, H., Lin, H., & Ren, X. (2021). Enterprise digital transformation and capital market performance: Empirical evidence from stock liquidity. Management World, 37(7), 130–144. [Google Scholar] [CrossRef]
- Zhang, H., Sun, X., Ahmad, M., & Wang, X. (2023). Heterogeneous impacts of carbon emission trading on green innovation: Firm-level in China. Energy & Environment, 35, 3504–3529. [Google Scholar] [CrossRef] [Scilit]
- Zhang, W., Li, G., Uddin, M. K., & Guo, S. (2020). Environmental regulation, Foreign investment behavior, and carbon emissions for 30 provinces in China. Journal of Cleaner Production, 248, 119208. [Google Scholar] [CrossRef] [Scilit]
- Zhang, Z., Duan, H., Shan, S., Liu, Q., & Geng, W. (2022). The impact of green credit on the green innovation level of heavy-polluting enterprises—Evidence from China. International Journal of Environmental Research and Public Health, 19(2), 650. [Google Scholar] [CrossRef] [Scilit] [PubMed]
- Zhao, T., Ke, H., & Zhang, N. (2025). Comparing the innovation impacts on firms: Pilot vs. national carbon emission trading schemes in China. Applied Energy, 377, 124414. [Google Scholar] [CrossRef] [Scilit]

Disclaimer/Publisher’s Note: The statements, opinions and data contained in all publications are solely those of the individual author(s) and contributor(s) and not of MDPI and/or the editor(s). MDPI and/or the editor(s) disclaim responsibility for any injury to people or property resulting from any ideas, methods, instructions or products referred to in the content. |
© 2026 by the authors. Licensee MDPI, Basel, Switzerland. This article is an open access article distributed under the terms and conditions of the Creative Commons Attribution (CC BY) license.