


Abstract
The COVID-19 pandemic exposed significant vulnerabilities in public-sector administrative capacity, particularly in the implementation of crisis-related state aid schemes. Under conditions of extreme workload, time pressure, and legal constraints, administrative processes became critical determinants of policy effectiveness rather than routine implementation mechanisms. This study examines how such processes perform under crisis conditions and whether process modeling and simulation can identify efficiency gains without undermining procedural control. Using a case study of a COVID-19 state aid scheme administered by the Ministry of Transport of the Slovak Republic, the study combines Business Process Model and Notation (BPMN)-based process modeling, discrete-event simulation, and Monte Carlo analysis, and can identify efficiency gains in crisis-related state aid administration. The methodological approach integrates BPMN-based process modeling, discrete-event simulation, and scenario-based (“what-if”) sensitivity analysis to evaluate process performance under crisis-induced demand surges. Key performance indicators, including processing time, labor costs, and resource utilization, are analyzed using simulation outputs and dashboard-based visualization. Data analysis is conducted through simulation-based evaluation of key performance indicators, including processing time, labor costs, queue length, and resource utilization, under both baseline (AS-IS) and redesigned (TO-BE) process configurations. Scenario-based (“what-if”) and sensitivity analyses are applied to assess the effects of crisis-induced demand surges and capacity constraints on administrative performance. The results show that increased application volume during the crisis led to disproportionate growth in processing times due to queue accumulation and resource contention. Simulation-based process redesign reduced the average process cycle time by up to 12.8% and labor costs per application by up to 8.4% compared to the AS-IS configuration. However, efficiency gains diminished as resource utilization approached capacity limits, indicating structural constraints inherent to public administration. These findings demonstrate that process-oriented simulation provides a robust analytical tool for understanding administrative behavior under crisis conditions and for designing more efficient and resilient state aid mechanisms. The study contributes to public administration research by offering a micro-level, process-based perspective on crisis governance that complements the existing macro-level policy evaluations.
1. Introduction
Crisis situations fundamentally alter the operating conditions of public administration. Unlike routine policy implementation, crises confront administrative systems with sudden surges in demand, severe time pressure, heightened uncertainty, and intensified political and public scrutiny. Under such conditions, administrative processes no longer function merely as background implementation mechanisms; instead, they become critical determinants of policy effectiveness, fiscal performance, and public trust (Pollitt & Bouckaert, 2017; Benington & Moore, 2011).
The COVID-19 pandemic represented an unprecedented stress test for public administrations across Europe. Governments were required to design and implement emergency support measures within exceptionally short timeframes, often relying on administrative structures that were not designed to handle crisis-level workloads. In many cases, legislative frameworks had to be amended rapidly, resulting in procedural complexity, legal ambiguity, and increased coordination costs (OECD, 2015; Halaskova et al., 2023). As a consequence, crisis management was frequently reactive rather than anticipatory, exposing structural weaknesses in administrative capacity and process design.
State aid schemes introduced during the COVID-19 pandemic provide a particularly instructive governance setting for analyzing administrative performance under crisis conditions. These schemes combined extreme application volumes, strict legal and financial control requirements, and strong political pressure to deliver support quickly. Such conditions generate inherent operational tensions, including trade-offs between speed and control, capacity and quality of decision-making, flexibility and procedural consistency, and efficiency and legitimacy (Hood, 1991; Moore, 1995). Understanding how administrative processes behave under these tensions is essential for evaluating both the effectiveness and the sustainability of crisis interventions.
In the Slovak Republic, crisis management has historically played a limited role due to the relatively infrequent occurrence of large-scale systemic crises. Prior to 2020, the most significant economic disruption was the global financial crisis of 2008–2014, while subsequent shocks had comparatively modest impacts. The COVID-19 pandemic therefore marked a turning point, requiring the rapid activation of crisis management mechanisms across all levels of public administration. This sudden shift exposed the absence of pre-defined crisis scenarios, limited analytical capacity, and insufficient process readiness within public institutions (Řepa, 2008; Sedláková et al., 2013).
From a theoretical perspective, debates on public sector performance in such contexts are commonly framed through the lenses of New Public Management (NPM) and Public Value theory. NPM emphasizes efficiency, cost reduction, and performance measurement, often advocating the adoption of private-sector management tools to achieve “value for money” (Hood, 1991; Pollitt & Bouckaert, 2017). Public Value theory, by contrast, highlights the importance of legitimacy, transparency, and societal outcomes, arguing that public sector success cannot be assessed solely through efficiency metrics (Moore, 1995; Benington & Moore, 2011). Crisis-era administrative processes bring these two perspectives into direct tension, as demands for rapid and efficient action coexist with heightened expectations of accountability and fairness.
Despite the growing body of post-COVID-19 evaluation studies, the existing research has primarily focused on macro-level policy design, fiscal impacts, or comparative performance indicators. Much less attention has been paid to the micro-level behavior of administrative processes during crises. In particular, there is limited empirical evidence on how internal process dynamics—such as queues, role-specific workload, and sequential control procedures—contribute to delays, capacity bottlenecks, and cost escalation under extreme demand conditions (Gayialis et al., 2015; Alahakoon & Jehan, 2020). As a result, important learning opportunities regarding administrative resilience and process design remain underexplored.
This study addresses this gap by adopting a process-oriented perspective on crisis governance. Focusing on a COVID-19 state aid scheme administered by the Ministry of Transport of the Slovak Republic, the paper analyzes how administrative processes performed under crisis conditions and whether digital process modeling and simulation tools can identify feasible efficiency improvements. By combining Business Process Model and Notation (BPMN)-based process modeling with discrete-event simulation and Monte Carlo analysis, the study provides a granular examination of processing time, labor costs, and resource utilization within legally constrained public administration workflows (Gayialis et al., 2015; Vilkaite-Vaitone & Povilaitiene, 2022).
By grounding the analysis in established public management frameworks while employing advanced process-analytical methods, the study positions process optimization not merely as a technical exercise, but as a governance instrument. The findings aim to inform both academic debates on crisis-era administrative performance and practical efforts to strengthen the efficiency, transparency, and resilience of public sector operations in future emergencies (OECD, 2015; Lau et al., 2024). Based on the identified governance tensions and gaps in the existing research, this study advances a set of hypotheses that link crisis-induced demand pressure to administrative process performance. Specifically, the analysis focuses on (i) the relationship between demand surges and processing delays (H1), (ii) the potential of process redesign to reduce cycle time (H2), (iii) the fiscal implications of process optimization under capacity constraints (H3), and (iv) the existence of diminishing efficiency returns at high utilization levels (H4).
1.1. Aim and Tasks
Effective management of public expenditures represents a core challenge for contemporary public administration, particularly under conditions of fiscal pressure and crisis-driven uncertainty. The COVID-19 pandemic significantly increased public spending while simultaneously exposing structural weaknesses in administrative capacity and process design. In this context, improving the efficiency, transparency, and responsiveness of public expenditure management has become a central concern for both policymakers and scholars (OECD, 2015; Pollitt & Bouckaert, 2017).
The primary aim of this study is to examine whether process-oriented modeling and simulation can improve the performance of crisis-related state aid administration without compromising legal and procedural control. Rather than evaluating policy outcomes at an aggregate level, the study focuses on the internal behavior of administrative processes that translate policy decisions into financial disbursements. This perspective allows for a systematic assessment of how process design influences processing time, labor costs, and resource utilization under crisis conditions.
Specifically, the study seeks to achieve three interrelated research objectives. First, it aims to analyze the operational performance of a selected COVID-19 state aid scheme by identifying process bottlenecks, capacity constraints, and sources of delay within application processing and financial control procedures. Second, it aims to assess the potential efficiency gains achievable through process redesign based on Business Process Model and Notation (BPMN) modeling and discrete-event simulation, with particular attention to cycle time reduction and cost savings. Third, it aims to evaluate the robustness of these efficiency gains under varying workload and capacity scenarios, thereby capturing structural limits to administrative performance (Gayialis et al., 2015; Alahakoon & Jehan, 2020).
In line with the theoretical distinction between New Public Management and Public Value perspectives, the study does not conceptualize efficiency as an isolated objective. Instead, process performance is evaluated with regard to both fiscal efficiency and procedural legitimacy. Reducing processing time and labor costs is therefore treated as desirable only insofar as it remains compatible with legal compliance, accountability requirements, and transparent decision-making (Moore, 1995; Benington & Moore, 2011).
Methodologically, the study adopts a hypothesis-driven design. Four hypotheses are derived from the literature on crisis governance, administrative capacity, and process efficiency. These hypotheses guide the simulation framework and structure the empirical analysis by linking crisis-induced demand pressure to processing delays (H1), process redesign to cycle time reduction (H2), efficiency gains to cost reduction under capacity constraints (H3), and increasing utilization to diminishing marginal returns (H4).
By pursuing these objectives, the study aims to contribute to public administration research in two ways. Empirically, it provides micro-level evidence on how administrative processes behave under crisis conditions, an area that remains underexplored in post-COVID-19 evaluations. Methodologically, it demonstrates how process modeling and simulation can be used as governance tools to inform ex ante process redesign and resource allocation decisions in public administration. One of our intentions is to confirm that systematic process modeling will allow us to identify areas suitable for automation. We believe that implementing automated systems could achieve higher efficiency and cost reduction, supporting our assumptions. The implementation of the model should bring greater transparency to public finance management. Improved tracking and evaluation of processes should enable informed decision-making at the public administration level. While the existing post-COVID-19 studies predominantly focus on macro-level policy design, fiscal impact, and aggregate efficiency indicators, considerably less attention has been devoted to the micro-level behavior of administrative processes. In particular, empirical evidence on how internal process structures—such as queues, role-specific workloads, and legally mandated control sequences—affect administrative performance under crisis conditions remains limited. This study addresses this gap by providing a process-level, simulation-based analysis of crisis-era state aid administration.
1.2. Literature Review
While BPMN is frequently applied in public administration for descriptive documentation, its analytical value emerges primarily when combined with simulation-based methods. Discrete-event simulation enables dynamic performance analysis under uncertainty, yet prior studies also identify limitations related to data availability and institutional acceptance in legally constrained public sector environments.
The efficiency of public expenditure management has been extensively examined in both international and national public administration literature. Early analytical frameworks emphasized technical efficiency, understood as achieving policy objectives with minimal resource consumption, particularly in the context of fiscal consolidation and budgetary pressure (Atkinson & van den Noord, 2001; OECD, 2015). These concerns remain highly relevant in contemporary governance systems facing increasing expenditure demands and limited fiscal space.
Recent quantitative studies further underline the importance of efficiency assessment in public finance management. Using the “magic triangle” approach to analyze public finance performance during the COVID-19 period (2020–2021), Mikuš (2022) demonstrates that efficiency considerations must be balanced against competing fiscal and policy objectives. The study reinforces the view that process optimization in public administration remains a persistent and widely discussed challenge across European contexts, particularly under crisis-induced fiscal stress. The recent literature on crisis governance emphasizes that emergencies fundamentally alter administrative operating conditions by intensifying workload, uncertainty, and co-ordination demands (Pollitt & Bouckaert, 2017). Post-COVID-19 evaluation studies have predominantly focused on macroeconomic impacts, policy design, and fiscal sustainability, while micro-level administrative processes remain comparatively underexplored (Lee & Lee, 2020; Lau et al., 2024).
The theoretical foundation of efficiency-oriented public sector reform is strongly associated with the New Public Management (NPM) paradigm. NPM promotes the adoption of private-sector managerial practices, including performance measurement, decentralization, and process optimization, with the aim of improving economy and efficiency in public administration (Hood, 1991; Pollitt & Bouckaert, 2017). Empirical evidence from multiple jurisdictions suggests that public sector organizations frequently operate below their efficiency potential, indicating substantial room for improvement through better process design and management practices (Alahakoon & Jehan, 2020; Karfíková, 2018).
Several authors further note that inefficiencies in public expenditure management are often exacerbated by legislative complexity, fragmented institutional arrangements, and insufficient coordination mechanisms, particularly in transition and post-socialist economies (Karfíková, 2018; Drahošová & Čajková, 2022).
While NPM emphasizes efficiency and cost control, it has been criticized for its limited attention to democratic accountability, legitimacy, and societal outcomes (Dunleavy & Hood, 1994). In response, Public Value theory emerged as a complementary framework that conceptualizes public sector performance in terms of value creation for society rather than solely in terms of efficiency (Moore, 1995; Benington & Moore, 2011).
From a Public Value perspective, effective public expenditure management must balance efficiency with transparency, fairness, and political legitimacy. Several studies argue that governance reforms focusing exclusively on efficiency may undermine citizen trust if procedural safeguards and accountability mechanisms are weakened (Sedláková et al., 2013; Bogus, 2021). This tension becomes particularly pronounced in crisis situations, where rapid decision-making and accelerated spending coexist with heightened expectations of oversight and legal compliance.
Digitalization is widely recognized as a key enabler of efficient and transparent public administration. Research shows that digital public finance management systems contribute to improved resource allocation, reduced administrative burden, and enhanced budget transparency (OECD, 2015; Zeman, 2024). The COVID-19 pandemic further underscored the importance of digital infrastructure, as restrictions on physical interaction forced public authorities to rely heavily on electronic communication and information systems (Halaskova et al., 2023; Suhanyi et al., 2024).
Business Process Management (BPM) has gained increasing attention as a systematic approach to analyzing and improving administrative workflows. Business Process Model and Notation (BPMN) is a standardized graphical modeling language used to represent business and administrative processes in a structured and intuitive manner. BPMN enables the explicit visualization of process logic, role allocation, decision points, and task sequencing, thereby supporting systematic analysis, simulation, and optimization of organizational workflows. Business Process Model and Notation (BPMN)-based process modeling enables the visualization of process logic, identification of redundancies, and detection of automation opportunities (Řepa, 2008; Gayialis et al., 2015). However, empirical research indicates that BPM adoption in public administration often remains limited to technological implementation rather than comprehensive process optimization (Sedláková et al., 2013; Drahošová & Čajková, 2022).
Simulation-based methods, including discrete-event simulation and Monte Carlo analysis, extend traditional BPM approaches by enabling dynamic analysis of process behavior under uncertainty. These tools allow researchers and practitioners to test alternative scenarios, assess capacity constraints, and estimate performance outcomes before implementing changes in real administrative settings (Gayialis et al., 2015; Vilkaite-Vaitone & Povilaitiene, 2022).
The recent literature on crisis governance emphasizes that emergencies fundamentally alter administrative operating conditions by intensifying workload, uncertainty, and coordination demands (Pollitt & Bouckaert, 2017). Post-COVID-19 evaluation studies have predominantly focused on macroeconomic impacts, policy design, and fiscal sustainability, while micro-level administrative processes remain comparatively underexplored (Lee & Lee, 2020; Lau et al., 2024).
In the context of crisis-related state aid schemes, the existing studies often assess effectiveness through aggregate expenditure indicators or relative efficiency measures such as data envelopment analysis (DEA) (Alahakoon & Jehan, 2020). While informative, these approaches do not capture internal process dynamics, including queue formation, role-specific workload distribution, and sequential control mechanisms, which are central to understanding administrative delays and cost escalation during crises.
This study addresses this gap by integrating Business Process Model and Notation (BPMN)-based process modeling with discrete-event simulation to analyze the internal behavior of administrative processes under crisis conditions. By focusing on a COVID-19 state aid scheme in the Slovak Republic, the study contributes micro-level evidence that complements the existing macro-level evaluations and offers actionable insights for improving administrative efficiency, transparency, and resilience in future crisis situations.
1.3. Research Questions and Hypotheses
Each hypothesis reflects a specific theoretical tension: H1 addresses crisis-induced capacity saturation; H2 and H3 draw on New Public Management efficiency arguments; and H4 reflects Public Value concerns regarding legal and organizational limits to efficiency intensification.
Building on the literature on crisis governance, New Public Management, and public value creation, this study examines administrative process behavior under crisis conditions. The analysis is guided by the following research questions:
RQ1: How do administrative processing times, costs, and resource utilization behave under crisis-induced demand surges?
RQ2: Can process modeling and discrete-event simulation identify efficiency gains in crisis-related state aid administration without reducing procedural control?
From these questions, we derive the following hypotheses:
H1:
Crisis-induced increases in application volume lead to disproportionate increases in processing time due to queue accumulation and resource contention.
H2:
Process redesign based on Business Process Model and Notation (BPMN) modeling reduces average process cycle time compared to the AS-IS configuration.
H3:
Process redesign reduces total labor costs per application without increasing role-specific workload beyond feasible capacity limits.
H4:
Efficiency gains from process optimization exhibit diminishing returns as resource utilization approaches capacity constraints.
These hypotheses structure the subsequent methodological design and simulation experiments.
2. Methodology
For model validation, face validation was conducted with administrative experts to confirm the structural realism of the modeled processes. Data validation compared simulated output ranges with observed administrative records. Sensitivity analyses were used to test robustness under varying demand and capacity assumptions.
The public sector digital transformation program has focused on redesigning the existing processes to ensure the effective deployment of digital technologies. Such an approach allows not only the modernization of services, but also a systematic increase in their performance through the optimization of process steps (Vilkaite-Vaitone & Povilaitiene, 2022).
Using digital tools, it is now easier and more accurate to analyze process efficiency. In public administration, it is not customary to retrospectively evaluate the tools of public policy used. Such analyses are most common in the corporate sector and are now increasingly recognized by small and medium-sized enterprises.
In 2024, several analytical units that conducted analyses for public institutions were abolished. For example, the Analytical Centre at the Ministry of Justice of the Slovak Republic, the Institute of Cultural Policy at the Ministry of Culture of the Slovak Republic, and the Analytical Unit at the Ministry of Defence of the Slovak Republic were discontinued (Ministry of Finance of the Slovak Republic, 2024).
In our analysis, we used three digital tools whose outputs were subsequently integrated to evaluate the effectiveness and efficiency of the established administrative processes and capacities.
This study adopts a process-oriented, simulation-based research design to examine administrative performance under crisis conditions. The methodological approach is explicitly hypothesis-driven and is designed to test the relationships between crisis-induced demand pressure, process configuration, capacity constraints, and performance outcomes as formulated in H1–H4.
Rather than relying on aggregate efficiency indicators or ex post evaluations, the study focuses on the internal dynamics of administrative processes. To this end, the analysis integrates three complementary analytical components:
- (i)
- Business Process Model and Notation (BPMN)-based process modeling to formally describe administrative workflows;
- (ii)
- Discrete-event simulation (DES) to capture dynamic process behavior under uncertainty; and
- (iii)
- Monte Carlo analysis to assess the robustness of performance outcomes under parameter variability.
This integrated framework enables the examination of queue formation, resource contention, processing delays, and cost accumulation—mechanisms that are central to understanding administrative performance during crises but are not observable through static analytical methods.
2.1. Data Source
The empirical analysis is based on administrative data provided by the Ministry of Transport of the Slovak Republic and publicly available information from the Central Register of State Aid (IS SEMP) managed by the Antimonopoly Office of the Slovak Republic. The dataset covers all applications submitted under the COVID-19 state aid scheme DM-19/2021 for the road transport sector. The decision to focus on this scheme is motivated by two considerations. First, the scheme was explicitly introduced to address shortcomings identified in earlier assistance programs, making it a highly targeted crisis intervention. Second, the dataset includes the full population of applications processed under the scheme, thereby eliminating sampling bias within the defined scope. Although the data are sector- and country-specific, the core administrative processes analyzed—application processing, administrative control, and financial control—represent standard functions in public administration. As such, the findings provide analytically transferable insights into administrative process behavior under crisis conditions.
2.2. Collaboration Diagram Business Process Model and Notation (BPMN) Model
Administrative workflows were mapped using Business Process Model and Notation (BPMN 2.0), a standardized graphical language for representing process logic and actor responsibilities. BPMN modeling was conducted using the Camunda Modeler software (camunda-modeler-5.34.0) and focused on capturing the AS-IS configuration of the assistance scheme.
Two core processes were modeled:
- (1)
- application processing, including administrative review and decision preparation; and
- (2)
- basic financial control, including authorization and payment preparation.
Each activity was assigned to a specific organizational role, and process gateways were used to represent alternative paths, such as application rejection or requests for additional documentation. Activities involving waiting time without direct administrative effort (e.g., applicant supplementation) were modeled as external delays to ensure accurate representation of process duration without inflating labor costs.
The resulting Business Process Model and Notation (BPMN) models served as the structural foundation for the simulation model by defining process flow, task sequencing, and role involvement
Business Process Model and Notation (BPMN) functions as a graphical language specialized in describing business processes. Modeling business processes (in our case, processes in public administration) provides a clear picture of the organization’s functioning and precisely identifies ongoing processes. Thanks to these processes, it is possible to easily identify parts that can be automated. Identified use cases and modeled processes serve as a graphical representation of the steps required for a specific use case. This approach produces diagrams depicting business processes, with steps assigned to individual use cases (Camunda, 2025).
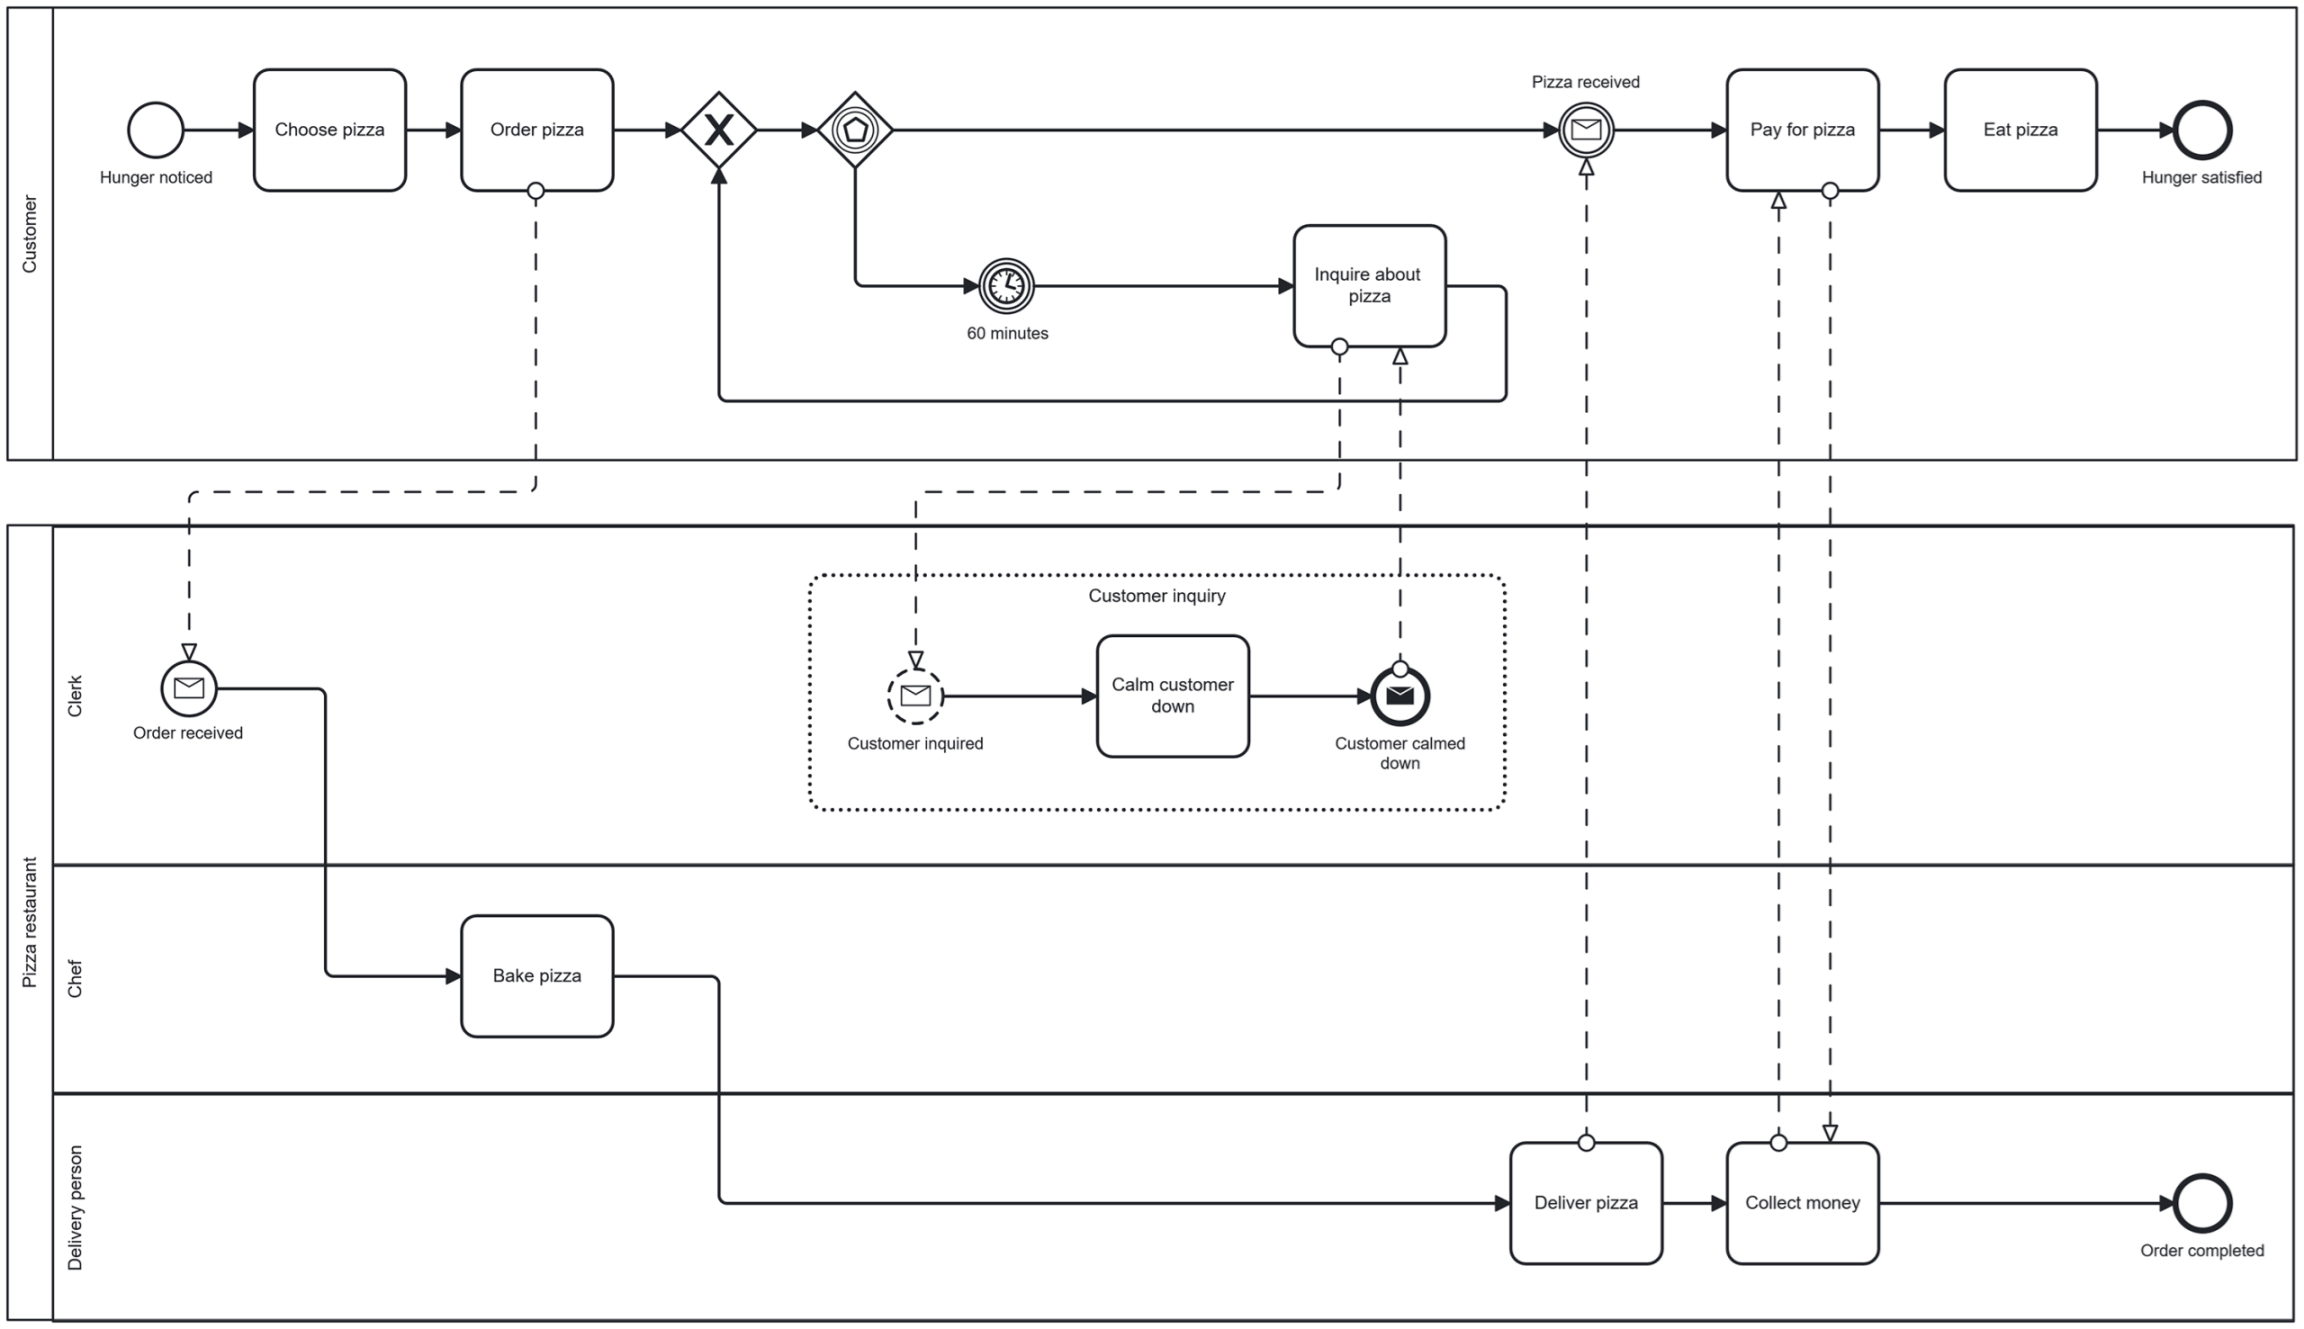
In Figure 1, we see a sample collaboration diagram that includes a triggering event, activities performed in the process, and an end event. Each activity is placed in the swimlane of the role that performs it in the process. In collaboration diagrams, processes display activities entering individual process phases. Activities are shown in sequence as they follow each other in time. Each activity is assigned a role and the duration of that activity.
Figure 1.
Business Process Model and Notation (BPMN) example. Source: Camunda; What is BPMN? Business Process Model and Notation.
For the purposes of our study, we mapped the disbursement of financial resources from our selected Minimum Aid Scheme to Support Certain Entities Operating in Road Transport in Connection with the Outbreak of COVID-19, DM-19/2021 into two collaboration diagrams.
The first diagram captures the processing of a received application (Figure 2). We named the triggering event of this process “It’s time to process the received application.” Activities in this process involve multiple roles. The process begins with the project manager, who assigns the application for processing to a controller, where the process ends. The process includes a situation where the application needs supplementation. In such cases, the controller requests the applicant to provide additional information, and we must account for the waiting time for this supplementation. This waiting does not affect the process’s cost, only its duration. For this reason, we depict this activity in so-called retention folders or with external entities. In our case, the external entity is the applicant. This process can end in two ways:
- (a)
- The application was not approved,
- (b)
- The application was approved.
Figure 2.
P01_01_ Processing the application.
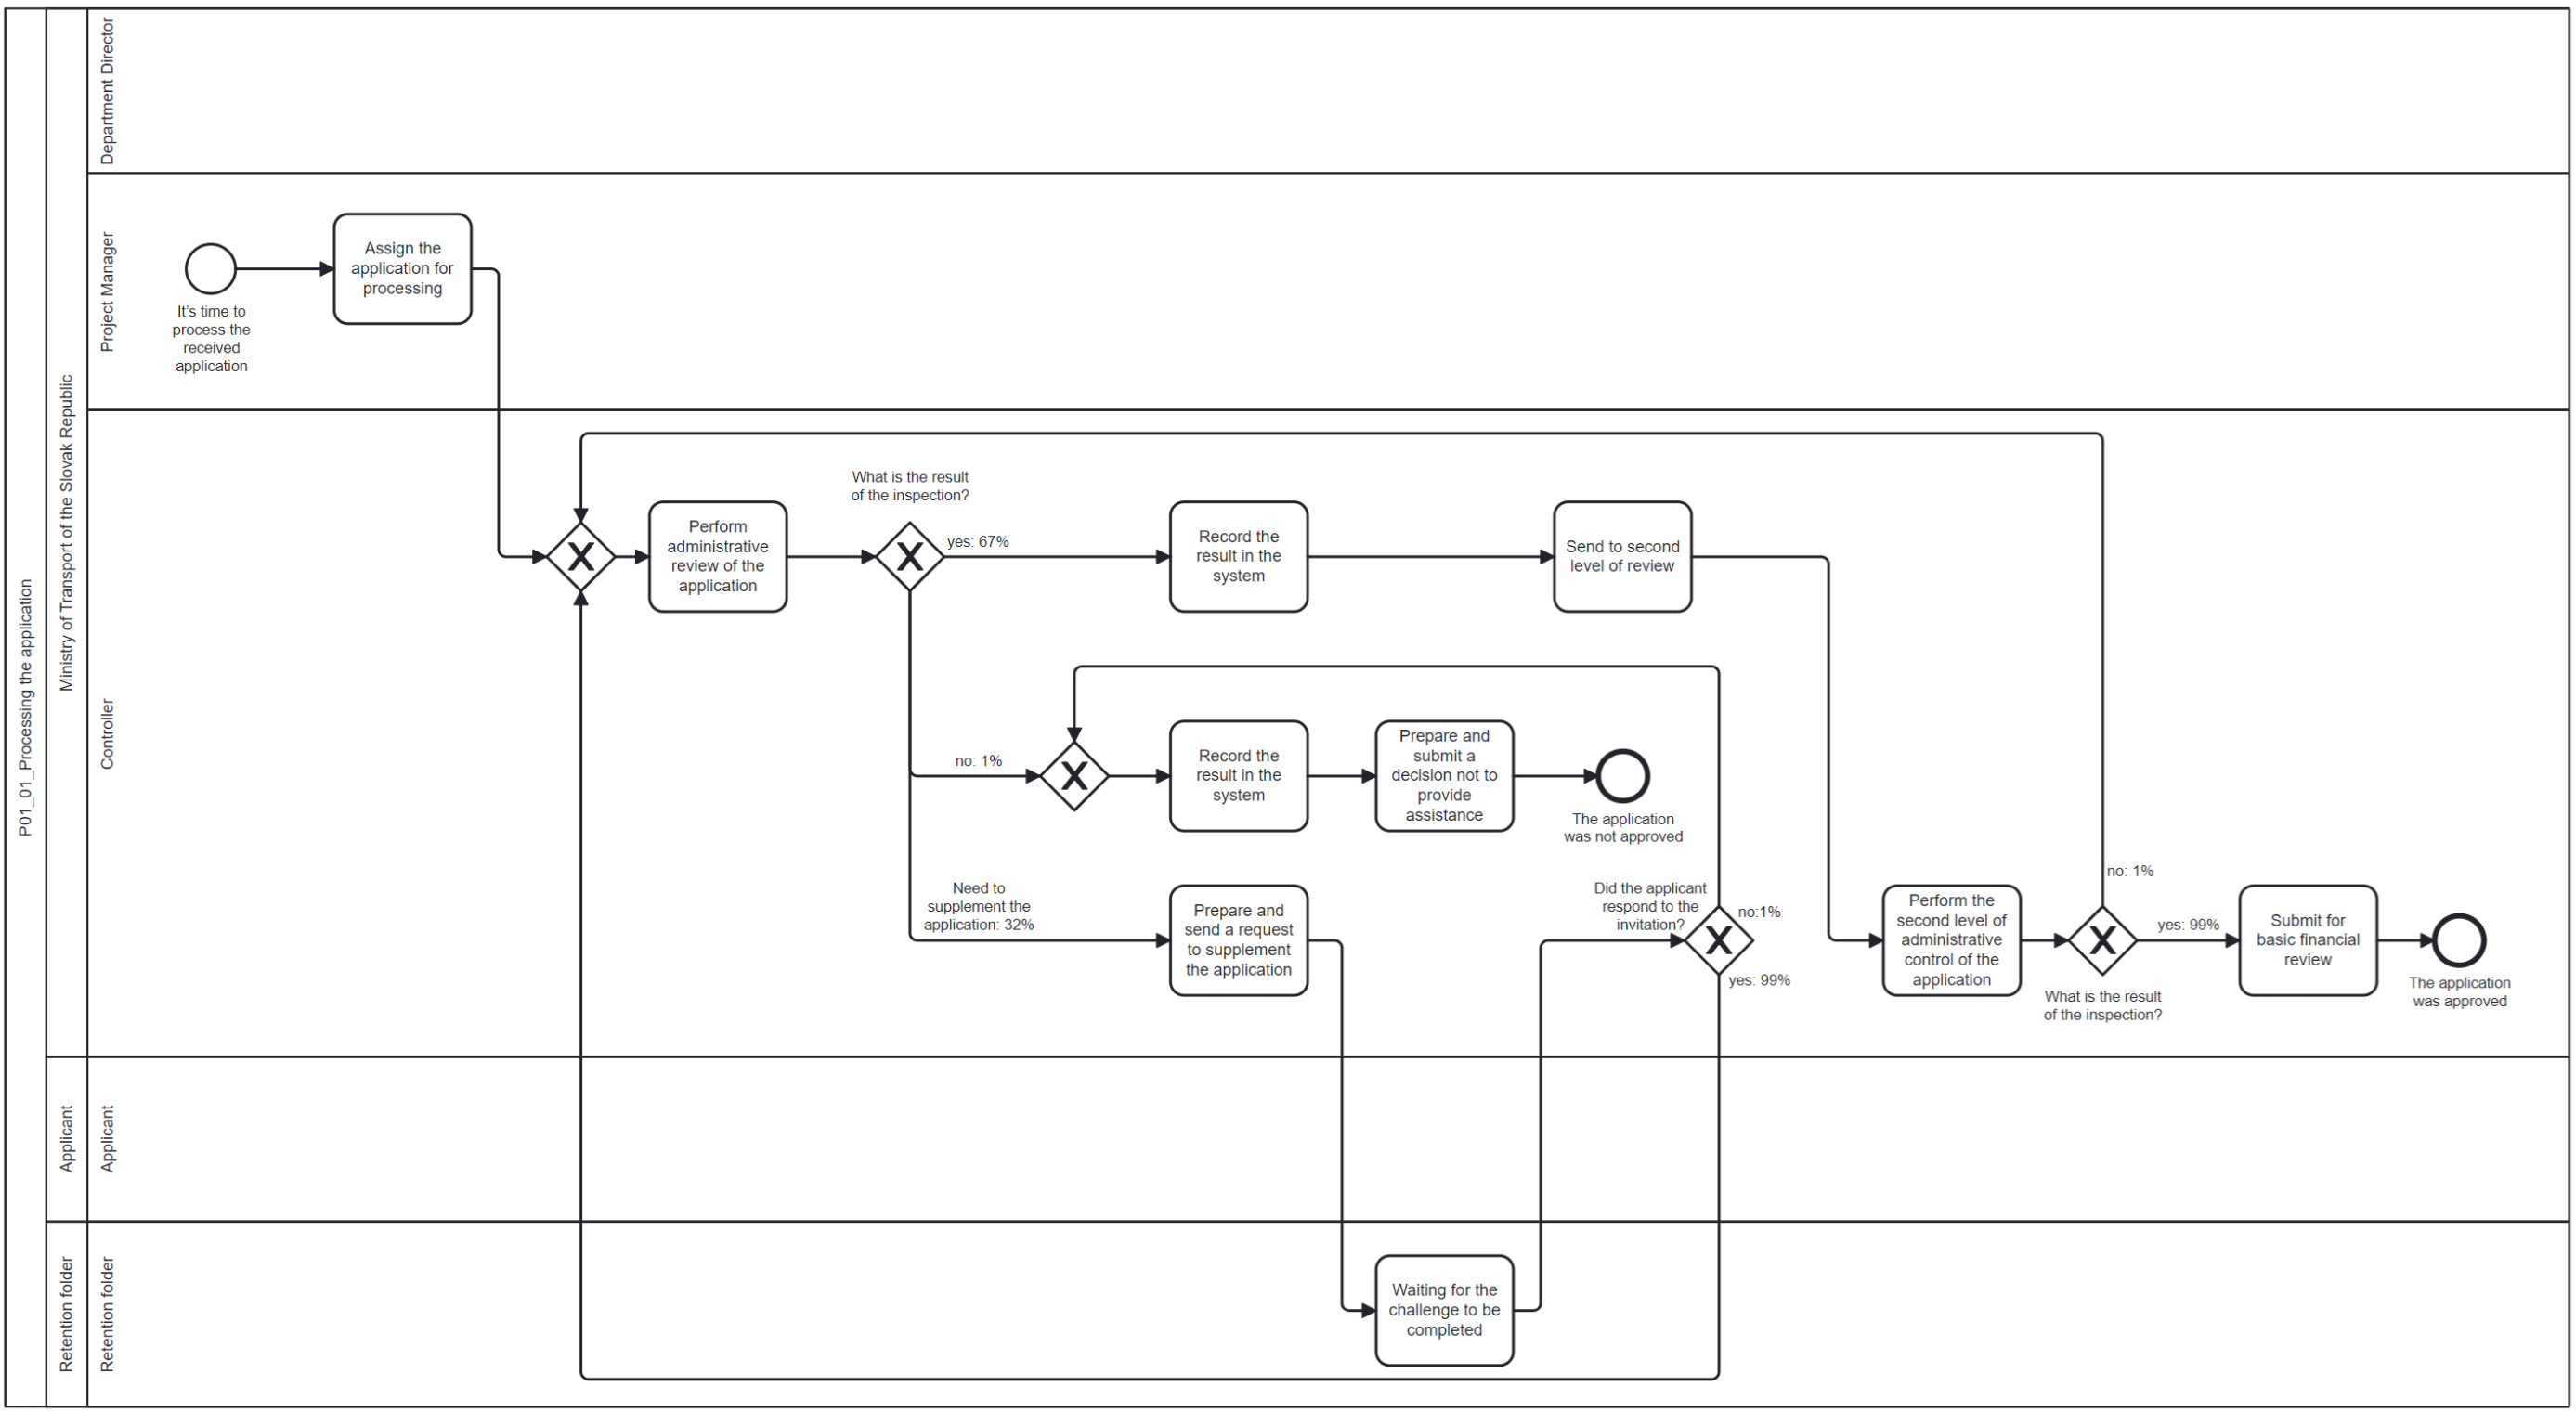
In the case of providing financial support during a crisis, the time to positively process an application is critical, as businesses need assistance quickly.
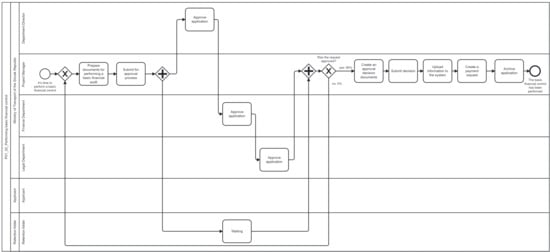
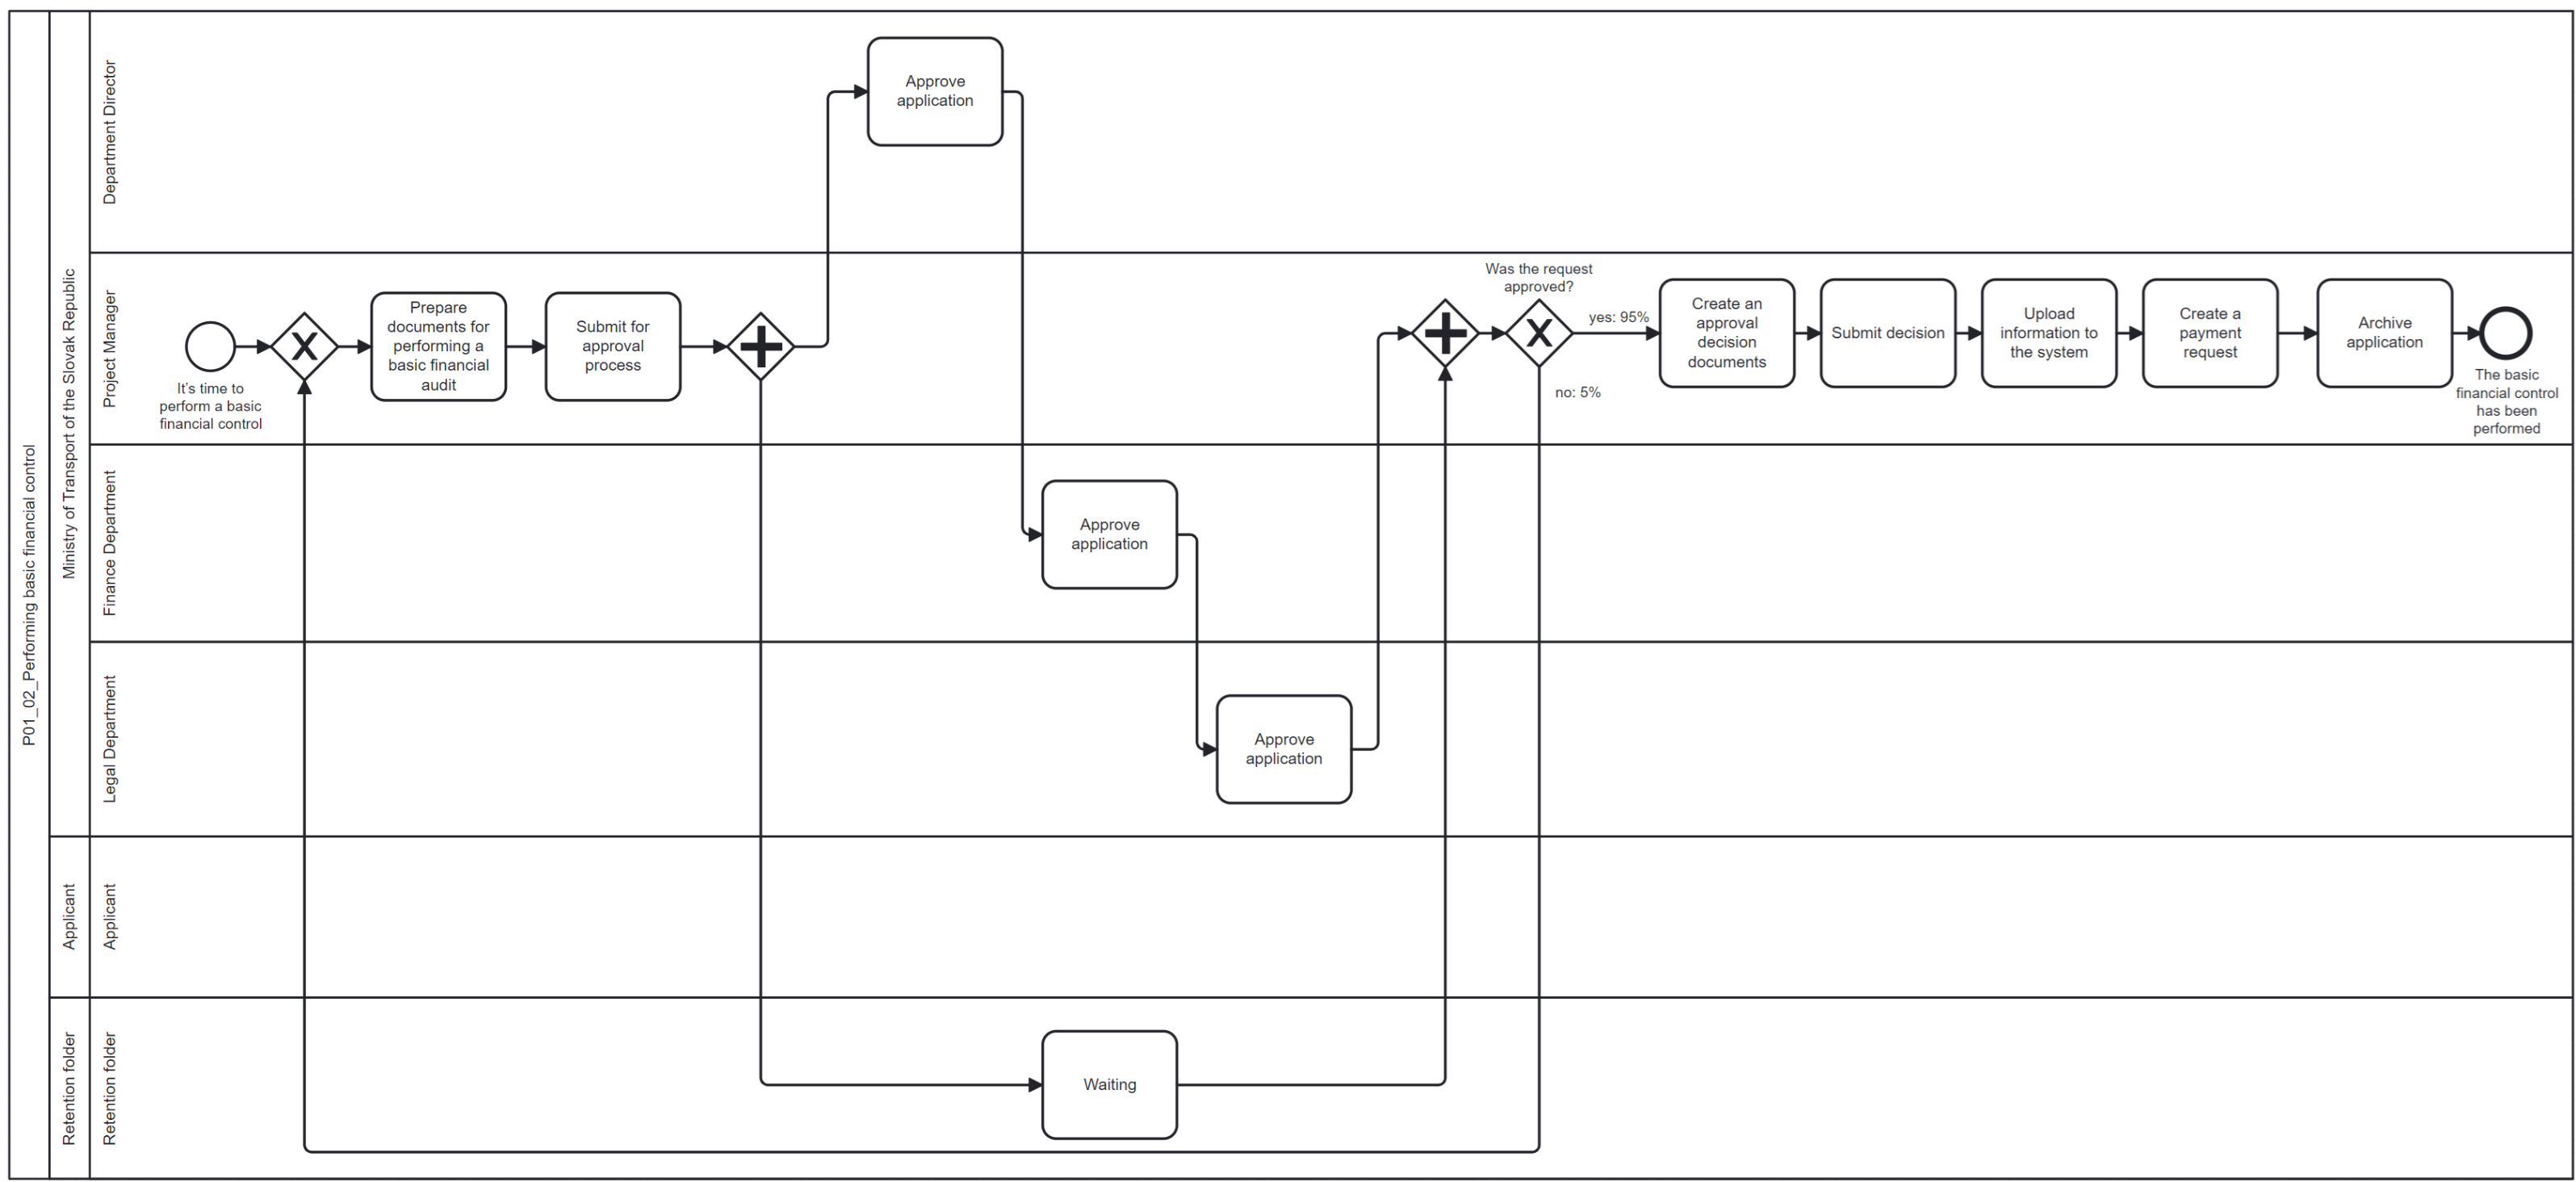
Figure 3 graphically details the mandatory steps for basic financial control (P01_02). The sequential involvement of four distinct roles highlights a potential source of delay, as the process must transition between the project manager, specialized departments, and the director. This multi-role structure is crucial for compliance but represents a prime area for time optimization through parallelization or automation of specific validation tasks.
Figure 3.
P01_02_Performing basic financial control.
Under the current legislation of the Slovak Republic, it is not possible to disburse public funds without conducting administrative and financial controls. Therefore, we considered it important to capture these processes and calculate their costs. Administrative and financial controls are standard tools for public administration employees. Thus, their optimization can also be applied outside of crisis management.
2.3. Simulation of Processes
The simulation model was designed explicitly to test hypotheses H1–H4. To this end, the model captures arrival dynamics, queue formation, resource contention, and cost accumulation under crisis conditions (H1), enables comparison between AS-IS and TO-BE process configurations (H2 and H3), and evaluates performance sensitivity across increasing utilization levels (H4).
Process simulation is a step through which we can simulate a process, its progress, duration, and costs from a Business Process Model and Notation (BPMN) diagram. In our research, we simulated the process using the AnyLogic simulation tool.
This study adopts a process-oriented, simulation-based research design tailored to the analysis of administrative performance under crisis conditions. The methodological framework integrates BPMN-based process modeling, discrete-event simulation, and Monte Carlo analysis to capture dynamic process behavior, capacity constraints, and performance variability under demand uncertainty. Rather than explaining these tools in isolation, their combination is employed analytically to examine queue formation, resource contention, and cost accumulation—mechanisms that are central to crisis-era administrative performance but remain largely invisible in static or aggregate evaluations (AnyLogic, 2025).
The simulation model was structured in three layers: process logic, resource allocation, and performance metrics. The Business Process Model and Notation (BPMN) diagrams served as the foundation for defining process flows, including start and end events, gateways, and actor-specific tasks. Each activity was parameterized using mean processing times derived from archival data of the Ministry of Transport (2019–2023), complemented by expert estimates where historical data were incomplete. For example, document verification averaged 12.4 min per case (SD = 3.1), while approval steps averaged 18.7 min (SD = 4.5).
Simulation Assumptions and Stochastic Variables:
- Processing times were modeled as triangular distributions (min, mode, max) to capture uncertainty.
- Resource availability incorporated absence probabilities based on historical HR data.
- Expenditure flows were treated as stochastic variables with ±10% variability to reflect budgetary uncertainty.
These stochastic specifications enable direct observation of non-linear delay effects and capacity saturation, which are central to testing hypotheses H1 and H4.
Validation Protocols:
To ensure robustness, we applied Monte Carlo simulations (1000 iterations) to assess variability in total process duration and cost under different demand scenarios. Sensitivity analysis was conducted on two key parameters:
- Crisis intensity factor (e.g., sudden 30% increase in case volume).
- Resource availability (e.g., 10% reduction in staff capacity).
Integration of Analytical Tools and Data Flow:
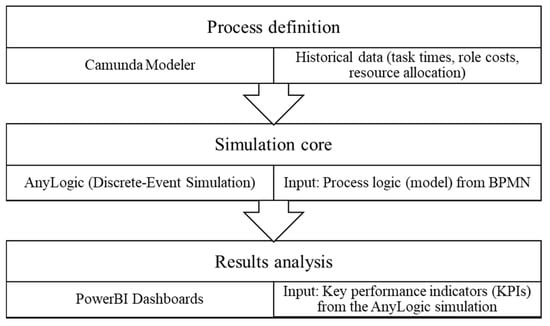
To directly address the need for transparency in the analytical architecture, we present the sequential data flow between the three core tools—Business Process Model and Notation (BPMN), AnyLogic, and Power BI—in Figure 4.
Figure 4.
Simulation Procedure.
Integration with Power BI:
Simulation outputs (cycle time, cost per case, resource utilization) were exported as structured datasets (e.g., CSV or Excel files) and visualized in Microsoft Power BI dashboards. Optimization metrics included:
- Cost–Time Trade-Off: ratio of cost savings to time reduction.
- Throughput Efficiency: number of cases processed per resource-hour.
Bias Mitigation:
To minimize aggregation bias, raw datasets and intermediate calculations were preserved in appendices, enabling full replicability. Alternative scenarios were tested to validate efficiency gains across varying operational conditions.
In the study, we will proceed with the following steps (Figure 4):
- Creation of collaboration diagrams (Business Process Model and Notation (BPMN)) and processes that reflect reality and serve as input for the simulation,
- Running the Anylogic simulation tool, which generates input data for dashboards (KPIs: Time, Cost, Utilization),
- Loading the data into dashboards in Microsoft PowerBI, where we visually compare the ‘AS-IS’ scenario with optimized ‘TO-BE’ scenarios,
- Interpreting the results from the dashboards to formulate data-driven recommendations for public expenditure optimization.
Running the simulation tool is a key part of the entire simulation. This is because the simulation itself controls the processes while simultaneously generating inputs for the dashboards, which are the final output of the study.
Another critical factor for a successful simulation is the data sources we use and input into the simulation. Individuals within the processes are used to calculate per-minute costs for individual roles and also serve as a parameter for the availability of each role. In the simulation, individuals represent an ideal employee who works 8 h a day, has a half-hour break, and does not work overtime. In simulating our process, we worked with the following values:
Working hours: Monday to Friday from 08:00 to 16:00
Lunch break: Monday to Friday from 12:00 to 12:30
Number of working days in the calendar year 2022: 250 working days
Average number of vacation days per employee per year: 23.9 days
Average number of other absence days per employee per year (sick leave, care for family members, etc.): 32.66 days
Calculation of the average number of days worked per year (subtracting vacation and absence days from the total working days): 250 (working days) − 23.9 (average vacation days) − 32.66 (average other absences) = 193.44 days
Calculation of the average number of hours worked per year: 193.44 (average days worked per year) ∗ 8 (daily working hours) = 1547.52 h
Calculation of the average number of minutes worked per year: 1547.52 (average hours worked per year) ∗ 60 = 92,851.2 min
These data were entered into the simulation as average values under the current legislation of the Slovak Republic (Table 1).
Table 1.
Salary values entered the simulation.
The table contains data on salaries for various job positions entered into the simulation. These data include minimum and maximum salary costs, average gross salary, super gross salary, and cost per minute of time for each position. This information is crucial for simulating and analyzing the costs and efficiency of individual processes within the organization.
2.4. PowerBI
PowerBI is a web service that enables searching, transforming, and visualizing data, as well as sharing created reports and dashboards with other users in the same or different departments or organizations, or even with the general public (Krishnan et al., 2017).
Using the PowerBI tool, which combines software services, applications, and connectors, we will display our data in the form of a clear report. We interpret the simulation results by loading the obtained results into this program. We pre-set a dashboard in Microsoft PowerBI to display relevant data for this study.
The choice of BPMN and Power BI tools was not accidental—both play a key role in assessing process efficiency. BPMN (Business Process Model and Notation) enables accurate and visually understandable process modeling, which is essential for identifying inefficient steps and designing optimizations. Power BI subsequently provides a robust analytical environment for interpreting data, visualizing outputs, and supporting decision-making. Their combination enables not only technically high-quality analysis, but also a clear presentation of results for various target groups, thereby increasing the performance and transparency of public institutions.
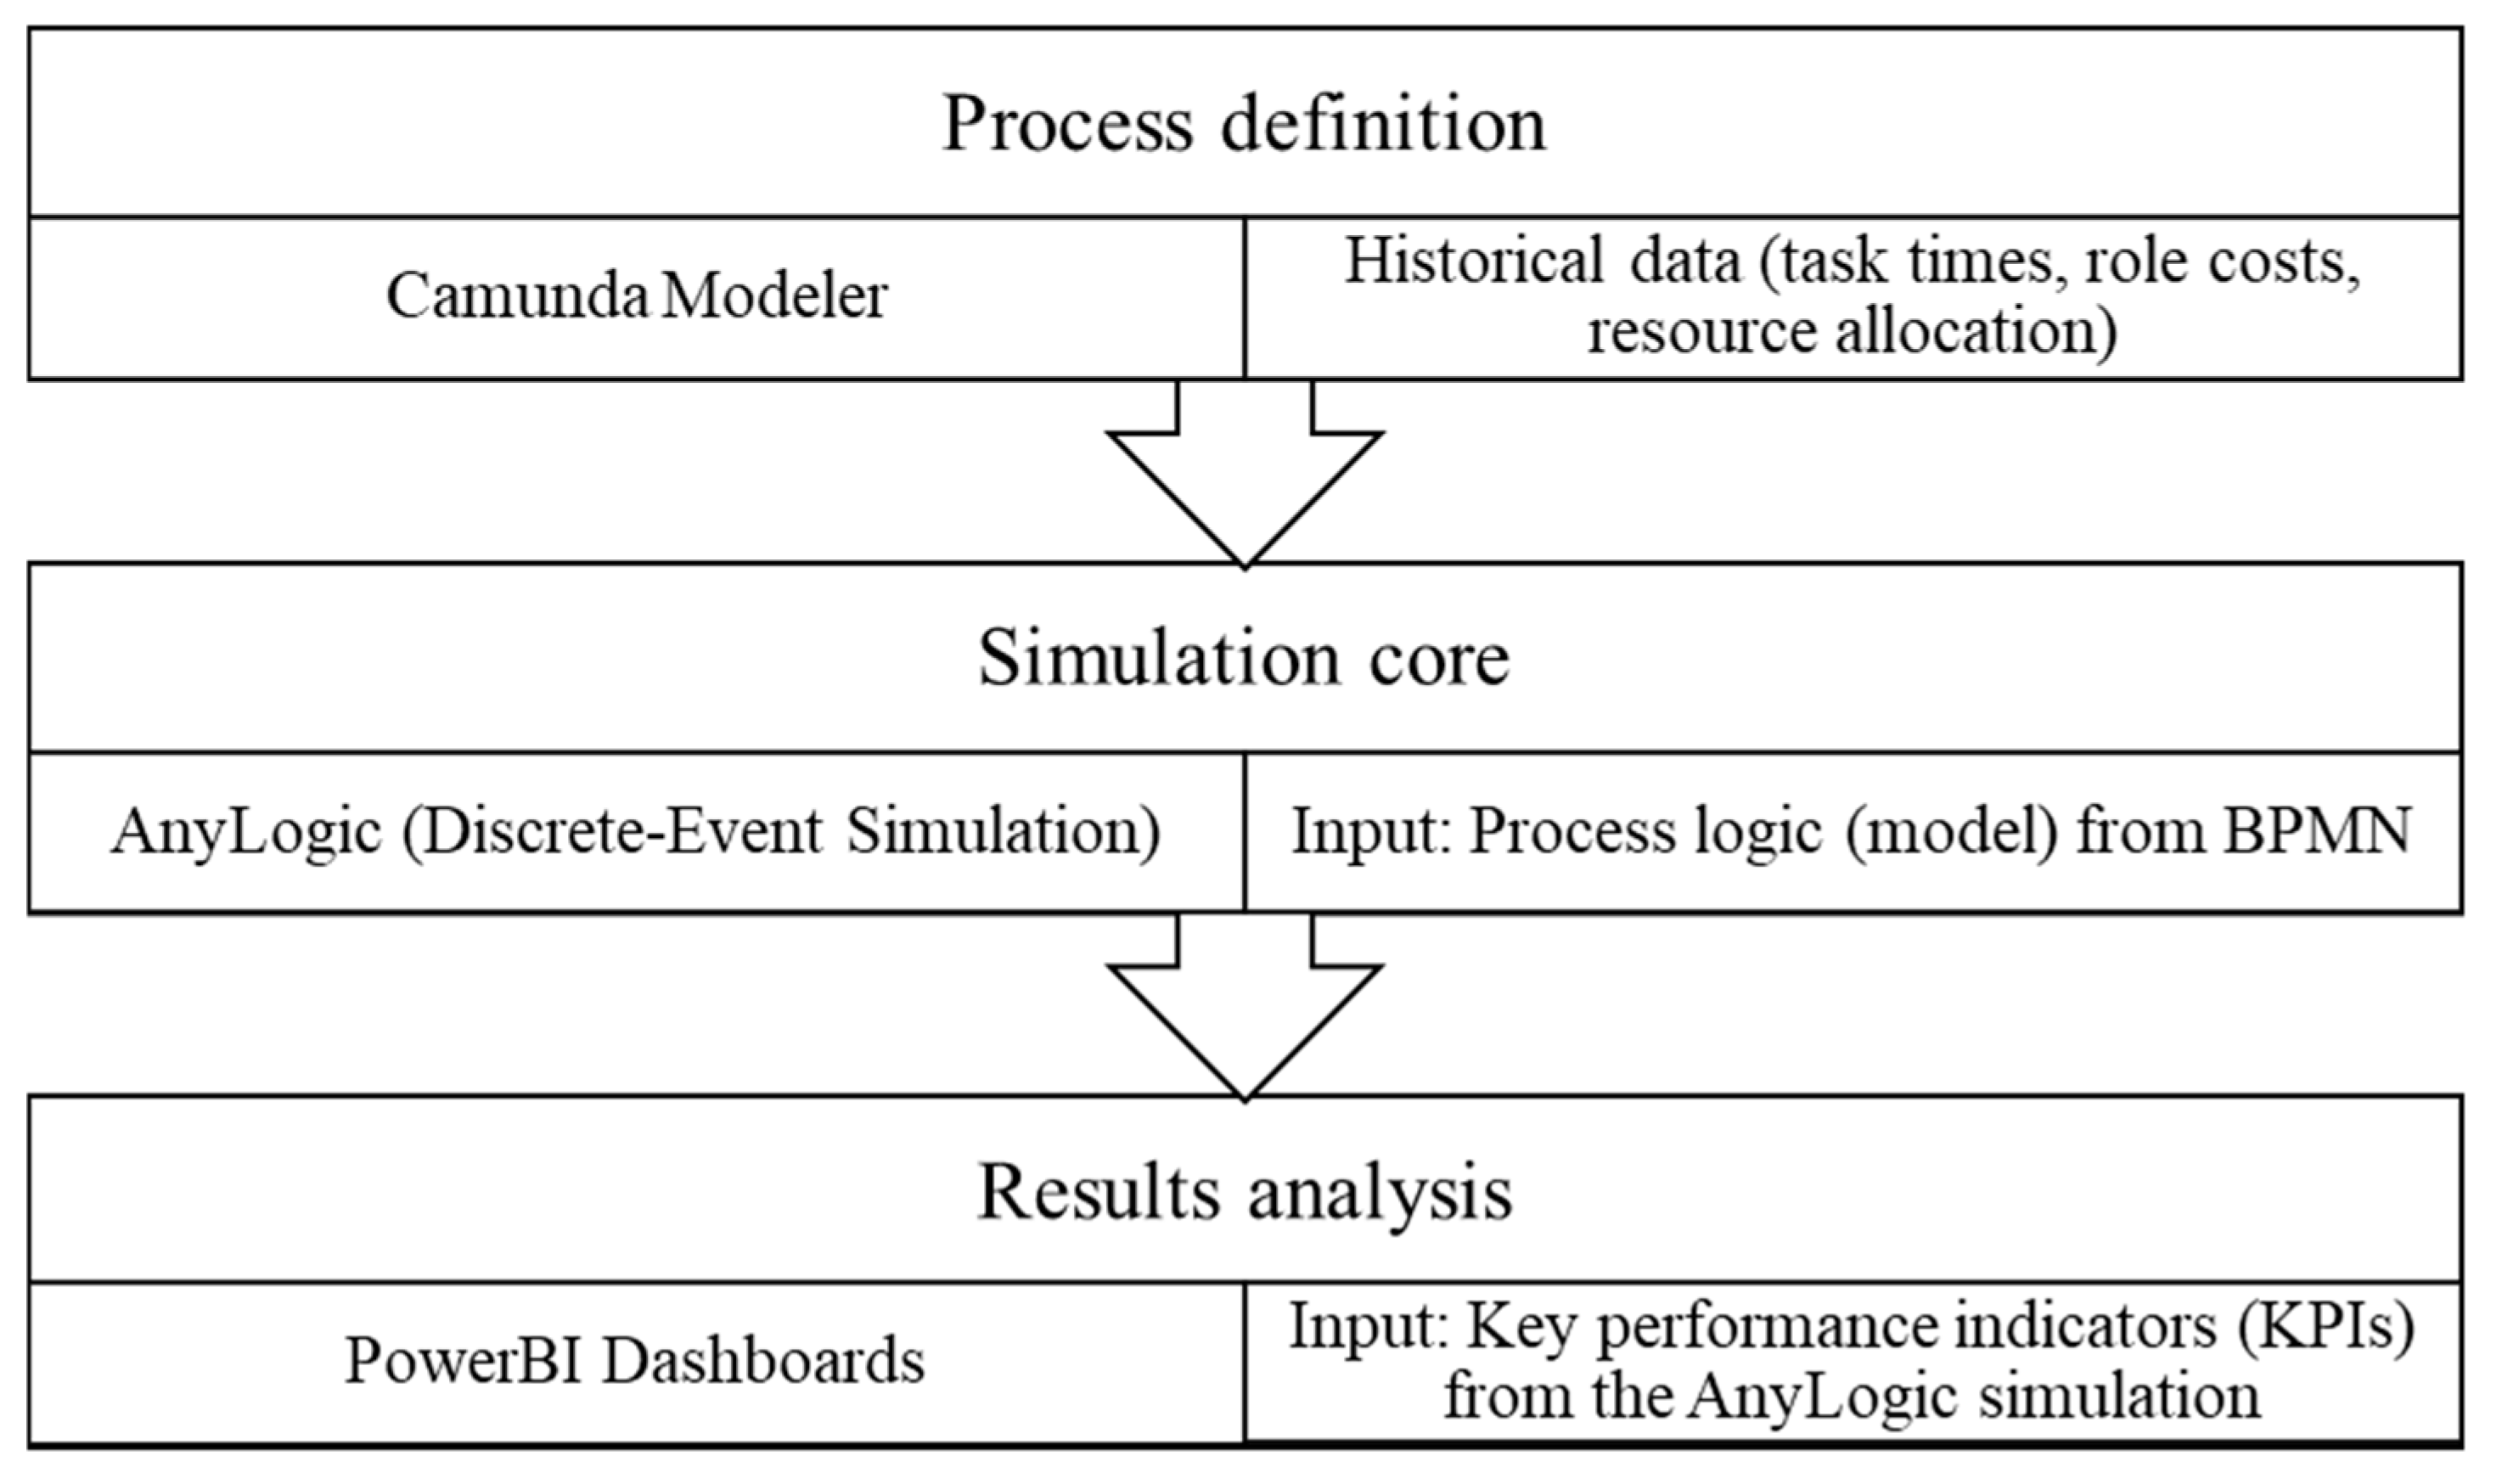
The Figure 5 illustrates the three-stage analytical framework used in the study to optimize the public expenditure process. The framework begins with Process Definition, where process logic is mapped using the Camunda Modeler, integrating historical data to establish initial parameters. This defined logic is then fed into the Simulation Core (AnyLogic) for discrete-event simulation, which runs “what-if” scenarios. The “what-if” analysis was employed as a structured form of sensitivity and scenario analysis rather than as a predictive forecasting tool. The defined process logic—captured through BPMN models and parameterized using historical administrative data—was transformed through discrete-event simulation into quantified performance outcomes. This transformation refers to the systematic conversion of process structure, workload assumptions, and capacity parameters into measurable key performance indicators, including cycle time, cost per application, queue length, and resource utilization. Finally, the simulation’s quantified outputs (Key Performance Indicators or KPIs) are imported into the Results Analysis stage (Power BI Dashboards) for visualization, comparison of scenarios, and formulation of final policy recommendations.
Figure 5.
Analytical Framework and Data Flow.
2.5. Simulation Design and Statistical Transparency
The study employs discrete-event simulation (DES) to model the dynamic behavior of administrative processes. Each simulation run represents a full operational year corresponding to the observed crisis period. The model is terminating, as it simulates a finite number of applications equal to the empirically observed case volume.
2.6. Arrival Process
Application arrivals are modeled as a non-homogeneous Poisson process, reflecting observed temporal fluctuations in demand during the crisis period. Arrival rates were calibrated using administrative records from the Ministry of Transport, allowing realistic queue formation and workload dynamics.
2.7. Processing-Time Distribution
Activity processing times were modeled using triangular distributions defined by minimum, mode, and maximum values. These parameters were derived from archival administrative data where available and supplemented by expert estimates. The resulting distributions were validated by comparing simulated means and standard deviations with empirical moments; discrepancies were tested through sensitivity analysis.
2.8. Simulation Replications and Monte Carlo Design
Two layers of stochastic analysis were applied. First, each DES scenario was replicated 100 times to account for within-model stochastic variability. Second, a Monte Carlo framework with 1000 iterations was used to assess parameter uncertainty by sampling processing times and arrival intensities. These two components are analytically distinct: DES replications address operational randomness, while Monte Carlo iterations address parameter uncertainty.
2.9. Performance Measures and Confidence Intervals
Key performance indicators include average cycle time, cost per application, queue length, and resource utilization. Results are reported with 95% confidence intervals, enabling statistically meaningful comparison between AS-IS and TO-BE scenarios.
2.10. Capacity Assumptions and Sensitivity Analysis
The baseline assumption of 70% effective working time reflects documented administrative workload patterns but is not treated as fixed. Sensitivity analyses were conducted at 60%, 75%, and 80% efficiency levels to test robustness. Results demonstrate that relative efficiency gains remain stable across these scenarios.
3. Results
The results are structured according to the four research hypotheses. First, we examine the impact of crisis-induced demand on processing times and queue dynamics (H1). Second, we compare AS-IS and TO-BE process configurations to assess cycle time reductions (H2). Third, we analyze labor cost implications and role-specific workload constraints (H3). Finally, we evaluate performance sensitivity across increasing utilization levels to identify diminishing efficiency returns (H4).
The analysis of the processes for processing received applications and performing basic financial controls revealed that the total costs of individual activities in the processes amount to 92,621.07 €.
We work with the hypothesis that an average employee works approximately 70% of their working time. The remaining time may be spent on breaks, unproductive activities, or interruptions. This proportion may vary depending on the type of work, work environment, and individual employee capabilities.
At 70% efficiency, 4.23 FTE (Full-Time Equivalent) are required, meaning that 4.23 full-time positions would be needed to perform these activities. At 75% efficiency, 3.95 FTE are needed, indicating that with higher efficiency, the number of required full-time positions decreases to 3.95. At 80% efficiency, 3.7 FTE are required, meaning that with even higher efficiency, only 3.7 full-time positions would be necessary (Table 2).
Table 2.
Full-Time Equivalent Analysis.
This overview demonstrates how increasing efficiency reduces the number of required full-time positions to perform the same volume of work, which can lead to cost savings and increased productivity. It remains questionable whether public administration is structurally and consciously capable of increasing employee efficiency.
Currently, increasing the efficiency of public administration in the Slovak Republic is also being addressed by the European Union through the Recovery and Resilience Plan tool (Regulation (EU) 2021/241, 2021). Implementing IT systems and software solutions for automating administrative tasks can significantly reduce bureaucracy and increase efficiency. For example, electronic filing systems and digital archives can speed up document processing (Efficient Public Administration and Digitalization, 2025).
Three controllers worked on disbursing funds from the assistance scheme we examined. Other roles in the process participated only minimally with their working time. The findings confirm that controllers worked beyond their capacity. Based on the calculations, it is evident that it was impossible to adhere to pre-set limits and timelines for disbursements. The process was not optimally configured, making it impossible to meet deadlines.
3.1. Process Execution
Based on data from the Ministry of Transport of the Slovak Republic, we simulated the execution of processes a total of 6062 times. This number reflects the actual disbursement of financial resources from the assistance scheme over one year. The processes include various administrative, financial, or other operations that are part of the workflow in the organization. The high number of process repetitions indicates extensive operational activity and may suggest the complexity and demands of managing these processes.
3.2. Effective Time
The average effective time of 9.52 working days indicates that completing one process takes approximately 9.5 working days. This finding supports H1 by demonstrating that increased application volume during the crisis translated into disproportionate processing delays driven by queue accumulation rather than proportional workload growth. This figure represents the average time required to execute a process, including various phases such as preparation, approval, execution, and control. A longer duration may point to the complexity of the process or the need to increase efficiency.
3.3. Cost per Process
To determine the current financial efficiency of the process, we calculated the average cost and duration of executing a single application. The key simulation results, derived from the PowerBI outputs, are summarized in Table 3.
Table 3.
Cost per process.
Table 3 indicates that the average cost of executing one complete process is 15.28 € of direct labor costs. This baseline cost metric provides the reference point for testing H3, which examines whether process redesign can reduce labor cost per application without exceeding feasible workload limits. This figure includes only the cost of employee salaries and does not account for indirect costs, such as administrative expenses, office materials, premises, technology, or maintenance. The calculated cost per process serves as a critical baseline for analyzing cost-effectiveness and identifying opportunities for savings when evaluating optimized scenarios. Furthermore, the average effective time of 9.52 working days highlights the slow turnaround time for providing crisis assistance, reinforcing the need for process adjustments.
3.4. Total Costs
As part of the analysis of processes at the Ministry of Transport of the Slovak Republic, two processes were analyzed, whose execution we simulated a total of 6062 times (Table 4). The processes may include various steps such as preparation, approval, execution, and control of applications.
Table 4.
Process costs.
Of these, the process P0101_Processing the application (Table 4) was executed 5727 times during the year, and the process P0102_Performing basic financial control (Table 4.) was executed 335 times. This execution was configured based on capacity and performance capabilities. Performing basic financial control was executed 335 times because one basic financial control includes approving a larger group of applications. The 5727 executions represent the actual number of individual application reviews performed.
The processes encompass administrative, financial, or other operations that are part of the workflow in this institution. The effective time indicates the total effective time required to complete all processes, expressed in working days, amounting to 57,717.26 working days.
The total cost figure represents the cost of completing all processes, expressed in euros. In our case, this amounts to 92,621.07 €. The cost of the process P0101_Processing the application is 75,290.28 €. This figure represents the total cost of completing all activities related to processing applications. The cost of the process P0102_Performing basic financial control is 17,330.79 €. This figure represents the total cost of completing all activities related to basic financial control.
The effective time per process indicates the average time required to complete one process, expressed in working days. An effective time of 9.52 working days means that each process takes approximately 9.5 working days from start to finish. The processes may include various activities such as preparation, approval, execution, and control of financial operations. These data provide important insights into the efficiency and cost-effectiveness of various processes at the Ministry of Transport of the Slovak Republic.
3.5. FTE Capacities
Table 5 presents the capacity for individual processes expressed in simulated FTE (Full-Time Equivalent) capacities, taking into account the availability of working time.
Table 5.
Overview of simulated FTE capacities according to the availability of working time for individual processes.
The observed decline in marginal efficiency gains as utilization increases provides empirical support for H4, indicating diminishing returns as administrative capacity approaches saturation.
The total FTE capacities for both processes are also provided for each percentage of availability, allowing us to see how overall capacity changes at different levels of working time availability. For example, at 50% availability, the total capacity is 534.17, while at 100% availability, it is 267.09.
Based on the following table, we can conclude that the capacity for controllers was under dimensioned. At the Ministry of Transport of the Slovak Republic, three controllers were employed, meaning it was impossible to perform their work efficiently.
Assuming an employee works at 70% of their capacity, we see that the total capacity for the Ministry of Transport is 4.23 FTE, while the capacity for controllers is 3.56 FTE. These data indicate that the capacity for controllers was insufficient, leading to issues with fulfilling work tasks and efficiently performing control activities. Given this capacity, it would be necessary to consider increasing the number of controllers or optimizing work processes to ensure sufficient capacity for all required tasks (Table 6).
Table 6.
FTE capacity.
4. Discussion
The findings extend crisis governance theory by providing micro-level evidence on how administrative process structures mediate the relationship between demand shocks and policy implementation outcomes. Practically, the results indicate that process modeling and simulation can be embedded within ministerial analytical units during the ex ante planning and design phases of crisis-related support schemes.
This study examined how administrative processes perform under crisis conditions and whether process-oriented modeling and simulation can identify efficiency gains in crisis-related state aid administration. The discussion interprets the findings in relation to the four research hypotheses and situates them within the broader literature on public administration, crisis governance, and process efficiency.
4.1. Crisis-Induced Demand and Processing Delays (H1)
The results provide clear support for H1, demonstrating that crisis-induced increases in application volume lead to disproportionate growth in processing times. Importantly, this effect is not driven by linear workload expansion alone, but by queue accumulation and resource contention within legally constrained administrative processes. Even modest increases in demand resulted in sharply rising waiting times once key roles—particularly controllers—approached capacity limits.
This finding aligns with crisis governance literature, which emphasizes that administrative bottlenecks often emerge endogenously under extreme operational pressure rather than as a result of individual inefficiency (Pollitt & Bouckaert, 2017). The simulation results illustrate how sequential control requirements and limited staffing amplify delays during crises, offering a micro-level explanation for implementation problems frequently observed in post-COVID-19 evaluations.
4.2. Effects of Process Redesign on Cycle Time (H2)
Consistent with H2, simulation-based process redesign led to a statistically meaningful reduction in average process cycle time compared to the AS-IS configuration. Importantly, these improvements were achieved without eliminating legally mandated control steps. Instead, cycle time reductions resulted from structural adjustments, including improved task sequencing, reduced handovers, and clearer role allocation.
This finding supports the argument that efficiency gains in public administration do not necessarily require deregulation or procedural shortcuts. Rather, meaningful improvements can be achieved through better process design within the existing legal frameworks. From a New Public Management perspective, this confirms the value of process-oriented analytical tools for improving operational performance while maintaining institutional integrity (Hood, 1991; Pollitt & Bouckaert, 2017).
4.3. Cost Efficiency and Capacity Constraints (H3)
The results also confirm H3, showing that process redesign reduced labor costs per application without exceeding feasible workload limits. Cost savings emerged primarily from reduced idle time, lower rework rates, and more balanced utilization of administrative roles. These findings demonstrate a direct link between process configuration and fiscal performance, reinforcing the relevance of micro-level process analysis for public expenditure optimization.
However, the results also indicate that cost efficiency gains are conditional on adequate capacity distribution. In particular, controller workloads remained a critical constraint, suggesting that process optimization alone cannot fully compensate for structural under-capacity in key roles. This underscores the importance of aligning process redesign with realistic staffing and capacity planning decisions.
4.4. Diminishing Returns at High Utilization Levels (H4)
H4 is supported by sensitivity analyses showing diminishing marginal efficiency gains as resource utilization approaches upper capacity thresholds. While moderate increases in effective working time generated noticeable improvements in throughput and cost efficiency, additional gains declined rapidly once utilization exceeded approximately 80%.
This pattern reflects structural limits inherent to public administration, where legal obligations, cognitive workload, and coordination requirements constrain the extent to which efficiency can be intensified. The findings caution against policy strategies that rely exclusively on workload intensification during crises and highlight the risk of burnout, error propagation, and declining decision quality at high utilization levels.
4.5. Theoretical Implications: Efficiency Versus Public Value
Taken together, the findings illustrate the persistent tension between efficiency-oriented reforms and public value considerations. While process modeling and simulation support New Public Management objectives by enabling measurable improvements in speed and cost efficiency, these gains remain bounded by legal, organizational, and legitimacy constraints emphasized in Public Value theory (Moore, 1995; Benington & Moore, 2011).
Rather than framing efficiency and public value as competing objectives, the results suggest that process-oriented tools can serve as governance instruments that make trade-offs explicit. By revealing where delays and costs originate, simulation enables more informed decisions about where flexibility is possible and where procedural safeguards must be preserved.
4.6. Practical Implications for Crisis Governance
From a practical perspective, the study demonstrates that administrative preparedness for future crises requires more than ad hoc capacity expansion. Process transparency, scenario-based analysis, and ex ante testing of administrative workflows are essential for avoiding implementation bottlenecks when demand surges unexpectedly.
The findings suggest that integrating process modeling and simulation into routine administrative planning could strengthen crisis resilience by enabling public organizations to identify vulnerabilities before they materialize. Such tools can support evidence-based decisions regarding staffing, digitalization priorities, and procedural redesign, thereby improving both efficiency and legitimacy in crisis response.
Proces P0101_Processing the application
- Reason for high cost/time: this activity requires intensive human labor due to the manual verification of physical or non-standardized digital documentation across various external registries, resulting in high FTE utilization and frequent delays caused by human error and data retrieval time.
- Using software for automated document processing and review can reduce the time required for administrative reviews and minimize errors.
- Implementing AI tools for faster and more efficient evaluation and review of applications.
- Reducing unnecessary steps and simplifying administrative procedures can shorten the activity’s duration.
- Prepare and submit a decision not to provide assistance:
- Reason for high cost/time: the complexity arises from the need for legal precision when drafting rejection documents. This often requires senior or specialized personnel to customize decision texts according to specific legal reasons for rejection, consuming significant cognitive load and time.
- Using predefined templates for preparing decisions can speed up the process and minimize the time needed to draft documents.
- Implementing a system of automated notifications can shorten the time required to inform applicants of the decision.
- Using a centralized system for storing and processing decisions enables better oversight and faster access to information.
- Record the result in the system:
- Reason for high cost/time: this activity suffers from system fragmentation, often involving manual double-entry or integration via non-seamless interfaces (e.g., exporting from one system and manually inputting into another, like the IS SEMP portal), leading to high error probability and increased labor time.
- Implementing tools for automatically recording results in the system can reduce manual work and speed up the process.
- Using integrated systems that enable seamless connection of various databases and modules can streamline result recording.
- Investing in training for employees on efficient system use can improve productivity and shorten recording time.
- This capacity saturation effect directly illustrates the mechanism described in H4, where efficiency improvements are constrained not by process logic but by structural and legal limits of administrative work.
From the process P0102_Performing basic financial control, we selected three activities proposed for optimization:
Approve application:
- Reason for high cost/time: approval is time-consuming due to its sequential and multi-authority nature, requiring physical or sequential digital sign-offs from various roles (Director, Legal Dept.) as mandated by law. This creates built-in waiting times and processing delays.
- Using software tools for automated request approval based on predefined criteria can shorten the time needed for approval.
- Enabling simultaneous approval by multiple authorities can reduce waiting time and increase efficiency.
- Transitioning to electronic documents and automated systems for their processing can improve the efficiency of the approval process.
- Prepare documents for performing a basic financial audit:
- Reason for high cost/time: this is a preparatory task that is highly dependent on the slow completion of upstream tasks (e.g., P0101) and involves manual aggregation of documentation from multiple disparate files, slowing the start of the audit itself.
- Using templates and predefined forms can speed up document preparation and minimize errors.
- Implementing tools that automate the preparation of necessary documents can reduce manual work and shorten time.
- Using centralized storage for easy access and document management can improve efficiency.
- Create a payment request:
- Reason for high cost/time: the final payment request involves strict compliance checks and requires manual data validation against budget codes and financial limits, often in a separate financial system, which increases scrutiny time and the risk of costly delays.
- Using software for automated generation of payment requests based on predefined criteria can shorten time and minimize errors.
- Implementing systems that integrate various financial data into one system can improve efficiency and simplify the process.
- Investing in regular training for employees on efficient financial operations can improve productivity and reduce the time needed to create requests.
At a strategic and governance level, the findings imply that crisis-related administrative capacity cannot be treated as a purely operational issue. Process transparency and simulation-based analysis should be institutionalized as part of strategic decision-making and crisis preparedness frameworks in public administration. Embedding process modeling capabilities within permanent analytical or policy units would support institutional learning by enabling administrations to retain and reuse process knowledge across successive crises rather than relying on ad hoc, reactive responses. From a governance perspective, simulation tools function as boundary-spanning instruments that link micro-level administrative processes with strategic oversight, thereby supporting evidence-based trade-offs between speed, procedural control, and legitimacy in crisis-related policy implementation (Table 7).
Table 7.
Long-lasting activities.
5. Conclusions
This study tested four hypotheses concerning administrative process behavior under crisis conditions. The results confirm that crisis-induced demand amplifies processing delays (H1), that simulation-based process redesign reduces cycle time (H2) and labor costs (H3), and that efficiency gains are bounded by diminishing returns at high utilization levels (H4).
Research article examined administrative process performance under crisis conditions using the case of a COVID-19 state aid scheme administered by the Ministry of Transport of the Slovak Republic. By combining Business Process Model and Notation (BPMN)-based process modeling with discrete-event simulation and Monte Carlo analysis, the paper provided a micro-level, process-oriented explanation of how crisis-induced demand pressure, capacity constraints, and process design shape administrative efficiency and fiscal outcomes.
Empirically, the analysis covered 6062 process executions related to the disbursement of financial assistance. In the baseline AS-IS configuration, the system exhibited an average effective processing time of 9.52 working days per application and an average direct labor cost of 15.28 € per case, resulting in total labor costs of 92,621.07 € for the analyzed processes. These values illustrate the substantial administrative burden associated with crisis-era assistance schemes, even when indirect costs are excluded.
The results further indicate that crisis-induced workload surges translate into disproportionate processing delays due to queue accumulation and resource contention. Capacity analyses show that controller staffing was structurally insufficient. Under the baseline assumption of 70% effective working time, the processes required 4.23 FTE, while even under higher efficiency assumptions, capacity constraints remained non-trivial. These findings support the view that administrative resilience depends not only on policy design but also on operational capacity and process architecture.
The simulation-based TO-BE scenarios demonstrate that process improvements can generate measurable performance gains without removing legally mandated control steps. Compared to the AS-IS configuration, optimized process variants reduced average process cycle time by up to 12.8% and labor costs per application by up to 8.4%. These improvements follow directly from addressing structural sources of delay—particularly sequential approvals and manual data handling—rather than from simple workload intensification.
Beyond the single case, the findings support a broader conclusion: process inefficiency can become a major driver of fiscal cost during crises, and process redesign can function as a governance tool that improves both efficiency and transparency. This is consistent with recent research highlighting the importance of sustainable digital initiatives, data governance, and administrative coordination as prerequisites for effective digital transformation in public services (Lau et al., 2024; Mathew et al., 2025).
At the same time, the Slovak context also illustrates that digitalization and centralization efforts must be approached realistically, given institutional fragmentation and system vulnerabilities. The disruption of public services following the cyberattack on the cadastral system demonstrates that resilience requires not only process improvement but also robust and secure digital infrastructure (Geodesy & Cadastre Authority of the Slovak Republic, 2025).
From a system-wide perspective, the case further suggests that coordination and interoperability across ministries could generate significant efficiency gains, particularly when multiple assistance schemes run in parallel. During the COVID-19 period, a large number of aid schemes were implemented across Slovak public institutions, including multiple schemes administered by the Ministry of Transport, illustrating the potential value of shared infrastructure and standardized process logic (Antimonopoly Office of the Slovak Republic, 2024; Turečková et al., 2024). Comparative evidence also indicates that even under constrained spending levels, efficiency can improve when expenditure structures and operational processes are better aligned with performance objectives (Lee & Lee, 2020).
Several limitations should be acknowledged. The analysis is simulation-based rather than an empirical causal evaluation, and the findings reflect the administrative and legal environment of the Slovak Republic. Future research should therefore focus on empirical validation through pilot implementations and comparative extensions.
This study demonstrates that administrative process design is a critical determinant of policy effectiveness during crises. Using a simulation-based, process-oriented approach, the analysis shows that crisis-induced demand surges generate disproportionate processing delays due to structural capacity constraints rather than linear workload growth. The findings confirm that BPMN-based process modeling combined with discrete-event simulation can identify efficiency gains without compromising legally mandated control mechanisms. Process redesign reduced average cycle time and labor costs; however, efficiency gains exhibited diminishing returns as resource utilization approached capacity limits. The primary contribution of this study lies in providing micro-level empirical evidence on administrative process behavior under crisis conditions, thereby complementing the existing macro-level policy evaluations. Future research should focus on empirical validation through pilot implementations, cross-country comparative studies, and the integration of automation and artificial intelligence into crisis-related administrative processes.
The analysis confirms that the examined state aid funds were administered in accordance with the principles of economy, purposefulness, transparency, and effectiveness. Economy and effectiveness were assessed through simulation-based evaluation of labor costs, processing time, and resource utilization, while transparency and purposefulness were ensured through BPMN-based process mapping and the preservation of legally mandated administrative and financial control procedures.
Author Contributions
Conceptualization, I.B.Š. and K.M.; methodology, K.T.; software, L.C.; validation, K.M., I.B.Š. and K.T.; formal analysis, I.B.Š.; investigation, L.C.; resources, K.T.; data curation, I.B.Š.; writing—original draft preparation, L.C.; writing—review and editing, I.B.Š.; visualization, K.M.; supervision, I.B.Š.; project administration, K.M.; funding acquisition, I.B.Š. All authors have read and agreed to the published version of the manuscript.
Funding
This research was funded by the project Modernization of the Financial System of Local Government in Slovakia, VEGA scheme, grant number 1/0265/25.
Institutional Review Board Statement
Not applicable.
Informed Consent Statement
Not applicable.
Data Availability Statement
The data supporting the findings of this study are available from the corresponding author upon reasonable request. No publicly archived datasets were generated or analyzed during the current study.
Conflicts of Interest
The authors declare no conflicts of interest.
References
- Alahakoon, M. U. I., & Jehan, S. N. (2020). Efficiency of public service delivery—A post-ICT deployment analysis. Economies, 8(4), 97. [Google Scholar] [CrossRef] [Scilit]
- Antimonopoly Office of the Slovak Republic. (2024). State assistance schemes in connection with the COVID-19 outbreak. Available online: https://semp.kti2dc.sk/ (accessed on 2 March 2025).
- AnyLogic. (2025). Why use simulation modeling? Available online: https://www.anylogic.com/use-of-simulation/ (accessed on 2 March 2025).
- Atkinson, P., & van den Noord, P. (2001). Managing public expenditure: Some emerging policy issues and a framework for analysis. OECD Economics Department Working Papers, No. 285. OECD Publishing. [Google Scholar] [CrossRef]
- Benington, J., & Moore, M. H. (Eds.). (2011). Public value: Theory and practice. Palgrave Macmillan. [Google Scholar]
- Bogus, A. (2021). Optimalization of public expenditure management from the perspective of consolidating the right to a decent living. Economy & Business, 15, 169–180. [Google Scholar]
- Camunda. (2025). What is BPMN? Business process model and notation. Camunda. [Google Scholar]
- Drahošová, S., & Čajková, A. (2022, June 19–21). Stop bureaucracy reforms—Case study in public administration in Slovakia. 10th IPMA Research Conference: Value Co-Creation in the Project Society, Belgrade, Serbia. [Google Scholar]
- Dunleavy, P., & Hood, C. (1994). From Old Public Administration to New Public Management. Public Money & Management, 14(3), 9–16. [Google Scholar] [CrossRef] [Scilit]
- Efficient Public Administration and Digitalization. (2025). Recovery and resilience plan. Efficient Public Administration and Digitalization. Available online: https://www.planobnovy.sk/kompletny-plan-obnovy/ (accessed on 9 February 2026).
- Gayialis, S. P., Papadopoulos, G. A., Ponis, S. T., Vassilakopoulou, P., & Tatsiopoulos, I. P. (2015). Integrating process modeling and simulation with benchmarking using a bpms for local government. International Journal of Computer Theory and Engineering, 8(6), 475–482. [Google Scholar] [CrossRef] [Scilit]
- Geodesy, C., & Cadastre Authority of the Slovak Republic. (2025). Current information on the situation in the resort. Cadastre Authority of the Slovak Republic. [Google Scholar]
- Halaskova, M., Linhartova, V., Gavurova, B., & Niroda, P. (2023). Indicators of government effectiveness in European countries: Empirical analysis with the use of panel data. Transformations in Business and Economics, 22(1), 280–298. [Google Scholar]
- Hood, C. (1991). New public management: A public management for all seasons? Available online: https://newdoc.nccu.edu.tw/teasyllabus/110041265941/hood%20npm%201991.pdf (accessed on 23 December 2025).
- Karfíková, M. (2018). Optimization of public revenues and expenditure. Available online: https://repozytorium.uwb.edu.pl/jspui/bitstream/11320/6972/1/M_Karfikova_Optimization_of_Public_Revenues_and_Expenditure.pdf (accessed on 28 February 2025).
- Krishnan, V., Bharanidharan, S., & Krishnamoorthy, G. (2017, August 2–4). Research data analysis with Power BI. 11th International CALIBER Conference, Chennai, India. [Google Scholar]
- Lau, E., Lindgren, I., Melin, U., & Axelsson, K. (2024). Sustainability of digital initiatives in public services in digital transformation of local government: Insights and implications. Sustainability, 16, 10827. [Google Scholar] [CrossRef] [Scilit]
- Lee, H., & Lee, D. (2020). Efficient expenditure allocation for sustainable public services?—Comparative cases of Korea and OECD countries. Sustainability, 12, 9501. [Google Scholar] [CrossRef] [Scilit]
- Mathew, S., Alomari, M., Weerakkody, V., & Irani, Z. (2025). Digital transformation and social inclusion in public services: A qualitative analysis of e-government adoption for marginalized communities in sustainable governance. Sustainability, 17, 2908. [Google Scholar] [CrossRef] [Scilit]
- Ministry of Finance of the Slovak Republic. (2024). Analytical units of the state. Ministry of Finance of the Slovak Republic. [Google Scholar]
- Moore, M. H. (1995). Creating public Value: Strategic management in government. Harvard University Press. [Google Scholar] [CrossRef] [Scilit]
- OECD. (2015). Reforming the slovak public sector. OECD Economics Department Working Papers, No. 1212. OECD Publishing. Available online: https://one.oecd.org/document/ECO/WKP(2015)30/en/pdf (accessed on 9 February 2026).
- Pollitt, C., & Bouckaert, G. (2017). Public management reform: A comparative analysis—New public management, governance, and the neo-weberian state (4th ed.). Oxford University Press. [Google Scholar]
- Regulation (EU) 2021/241. (2021). Regulation (EU) 2021/241 of 12 February 2021 establishing a recovery and resilience plan. European Union. [Google Scholar]
- Řepa, V. (2008). Procedural management in public administration. In Proceedings of the business process management conference. Ministry of the Interior of the Czech Republic. ISBN 978-80-254-1146-9. [Google Scholar]
- Sedláková, S., Vaľovská, Z., & Knežová, J. (2013). Process management as a path to implementing the principles of Good Governance. GRANT Journal, 63–70. Available online: https://www.grantjournal.com/issue/0402/PDF/0402valovska.pdf (accessed on 2 March 2025).
- Suhanyi, L., Gavura, S., & Suhanyiova, A. (2024). E-government and the sustainable public administration: Digital interaction with public authorities in the regions of the EU. Transformations in Business and Economics, 23(1), 106. [Google Scholar]
- Turečková, K., Nevima, J., Rumpel, P., Varadzin, F., Kula, D., & Lebiedzik, M. (2024). Resilience municipalit: Teoretický koncept odolnosti měst a obcí a kategorizace hrozeb a šoků. Acta Academica Karviniensia, 24(1), 64–72. [Google Scholar] [CrossRef] [Scilit]
- Vilkaite-Vaitone, N., & Povilaitiene, K. (2022). E-management as a game changer in local public administration. Economies, 10(8), 180. [Google Scholar] [CrossRef] [Scilit]
- Zeman, J. (2024). Digitalization of public finance management as a prerequisite for increasing the competitiveness of national economies. DF Working Paper, 12/2024. University of Economics in Bratislava, Faculty of National Economy, Slovak Republic. [Google Scholar]



Disclaimer/Publisher’s Note: The statements, opinions and data contained in all publications are solely those of the individual author(s) and contributor(s) and not of MDPI and/or the editor(s). MDPI and/or the editor(s) disclaim responsibility for any injury to people or property resulting from any ideas, methods, instructions or products referred to in the content. |
© 2026 by the authors. Licensee MDPI, Basel, Switzerland. This article is an open access article distributed under the terms and conditions of the Creative Commons Attribution (CC BY) license.