


Abstract
IT social responsibility (ITSR) projects—e-waste recycling, equipment reuse and donation, digital inclusion—are routinely excluded from annual corporate planning; no study has examined how they can be formalized through circular economy (CE) practices in a Latin American institutional context. This study addresses that gap for Ecuador. A PRISMA 2020-compliant review of 35 peer-reviewed studies (2023–2025) was combined with a qualitative multiple case study of seven organizations—four multinational corporations and three startups—analyzed through thematic content analysis of 23 documents anchored to the R0–R9 ladder, the 60R typology, the ReSOLVE framework, and a dynamic capabilities lens. The review documents a strong corporate social responsibility (CSR)–CE association (β = 0.893, p < 0.001, reported by a PLS-SEM study of 777 Spanish SMEs in the corpus; not estimated here). Multinational programs report quantified circular outputs mapped to R2–R9 strategies, whereas startups display emergent practices without governance for scaling—a difference in seizing and transforming capabilities rather than in sensing. No case reports economic indicators: environmental outcomes are documented and social outcomes partially so, but competitiveness effects remain untested and are advanced as a proposition for future research. Structured governance, public–private coordination, and measurement capability emerge as the mechanisms for embedding these initiatives in annual planning.
1. Introduction
The accelerating pace of digital transformation has positioned information technology at the center of organizational strategy across industries and geographies. Corporations invest heavily in IT infrastructure to optimize marketing, product development, and operational efficiency—activities that generate visible, immediate returns. A different category of technology initiative—one oriented toward social impact, environmental sustainability, and responsible resource management—occupies a far more precarious position within corporate hierarchies. These IT social responsibility (ITSR) projects—encompassing responsible e-waste recycling, equipment donation programs, digital inclusion initiatives, and software solutions for sustainable resource management—are routinely excluded from annual planning cycles, treated as peripheral to core business objectives rather than as strategic investments capable of generating long-term value (Vilardell, 2016).
The circular economy (CE) offers a conceptual and operational framework through which this marginalization can be addressed. Defined by the European Commission as a system in which the value of products, materials, and resources is maintained for as long as possible and waste generation is minimized, the CE has evolved from basic reduce–reuse–recycle models into multi-strategy typologies. Two of these typologies structure the present study and must be distinguished at the outset. The R0–R9 ladder—Refuse, Rethink, Reduce, Reuse, Repair, Refurbish, Remanufacture, Repurpose, Recycle, Recover—was formalized by Potting et al. (2017) and adopted by Kirchherr et al. (2017) in their analysis of 114 CE definitions; it orders strategies from higher to lower circularity and groups them into smarter product use and manufacture (R0–R2), lifespan extension (R3–R7), and useful application of materials (R8–R9). The 60R typology of Uvarova et al. (2023) is different in kind: from a review of 148 articles, the authors catalogued sixty distinct R-principles used in business practice and classified them into four groups—reduce, reuse, recycle, and reverse logistics—the last of which has no counterpart in the R0–R9 ladder. Subsequent empirical work has extended the ladder to IT-relevant settings: Quinto et al. (2025) applied nine R-strategies to e-waste multi-criteria decision-making, Nazir and Doni (2024) integrated R0–R9 principles with the Sustainable Development Goals, and Santiago et al. (2024) extended the framework to articulate the CE–CSR nexus within Industry 5.0. These advances signal a field moving beyond theoretical abstraction toward measurable, sector-specific operationalization.
Empirical evidence for the relationship between corporate social responsibility (CSR) and the CE has strengthened considerably in recent years. Gallardo-Vázquez et al. (2024), employing PLS-SEM with a sample of 777 Spanish SMEs, reported a path coefficient of β = 0.893 (p < 0.001) linking CSR practices to CE adoption. This coefficient recurs throughout the present article as a benchmark; it is a finding of the reviewed literature, not an estimate produced by this study. Its direction—if not its magnitude—is replicated by Khan et al. (2023), who demonstrated that green technology adoption positively predicts sustainable supply chain performance, and by Esposito et al. (2023), who found that corporate governance diversity significantly increases CE disclosure (p < 0.01). Among the quantitative studies in the current evidence base that test this association, none reports a negative or null result. This consistency is noteworthy, though it warrants caution: the absence of contradictory findings may partly reflect publication bias, and the geographic concentration of this evidence in European and Asian contexts limits its transferability to Latin American institutional environments.
The relationship between digital technologies and CE transitions has attracted growing scholarly attention. Neri et al. (2023a) demonstrated through rigorous interview coding that Big Data, IoT, and cloud computing serve as enabling infrastructure for CE practices in SMEs, while Tutore et al. (2024) showed that artificial intelligence can redesign business models toward loop-and-share configurations. Magnano et al. (2024) provided systematic review evidence that digital technology mediates the relationship between CE practices and organizational performance. The integration is not unidirectional: Hariyani et al. (2024) identified data privacy, system interoperability, and the digital divide as socio-technical barriers that constrain IT-enabled CE adoption, particularly in emerging economies where infrastructure asymmetries are pronounced. The critical gap in this body of work is sectoral specificity. Of the 35 studies synthesized in Section 4, only four address IT as a primary sector—and none employs quantitative circularity indices calibrated for software, platforms, or IT service delivery. The field has robust evidence that digital tools enable CE in manufacturing and logistics; it lacks equivalent evidence on how the IT sector can operationalize circular principles in its own operations.
A parallel stream of research on CE in supply chains and manufacturing planning bears directly on the planning problem examined here, because it treats circularity as a design parameter of the production plan rather than as an end-of-pipe activity. Kaswan et al. (2023) argued that CE principles must be embedded at the manufacturing planning stage—from concept to market-ready product—if micro, small, and medium enterprises are to capture environmental and economic benefits. They identified limited finance, low awareness, and regulatory hurdles as the obstacles that keep circularity out of the plan. Sabale et al. (2025b), modeling CE enablers in the product development process of Indian automobile SMEs through Pythagorean fuzzy DEMATEL, found top management support and a clear vision for CE adoption to be the most influential enablers, and artificial intelligence in the value chain the least—a hierarchy that places governance ahead of technology. Sabale et al. (2025a) extended this analysis to the barriers that SMEs face when aligning CE practices with net-zero objectives, and Rathi et al. (2024) had earlier situated the same research program within the broader transition of Indian manufacturing toward circularity. These studies share a conclusion with the present work: integration into planning is a governance decision before it is a technological one. They also share its boundary—none addresses the circularity of the IT sector’s own assets and none examines a Latin American institutional setting.
This sectoral gap is compounded by a geographic one. In the corpus assembled for this review, Europe and Asia account for 74% of the evidence on IT–CE integration, while Latin America contributes approximately 14% (Section 4.1.2). Ospina-Mateus et al.’s (2023) bibliometric mapping shows that this regional output is concentrated primarily in Brazilian scholarship. Within this already scarce regional literature, Ecuador-specific studies are limited to three: Quintana et al. (2024) identified barriers to reverse logistics through qualitative interviews (n = 7), Espinosa-Aquino et al. (2023) mapped e-waste management practices across eight Latin American countries, and Ospina-Mateus et al. (2023) conducted a bibliometric mapping of CE research. None of these studies examines the strategic integration of ITSR projects into corporate planning. Ecuador presents a particularly instructive context for such analysis. The country’s regulatory frameworks for CE remain underdeveloped—what Quintana et al. (2024) characterized as an environment marked by insufficient government resources and limited private investment—yet a growing ecosystem of ITSR initiatives has emerged, driven by multinational corporate programs, domestic startups, and public–private partnerships operating within these institutional constraints. The tension between institutional weakness and practical innovation creates theoretically generative conditions: it allows examination of how ITSR–CE integration occurs not through top-down regulatory mandates but through bottom-up organizational adaptation.
The barriers impeding this integration are well documented at the aggregate level. Trevisan et al. (2023) identified 45 barriers distributed across eight dimensions in their multiple case study of CE transitions, including technical, financial, regulatory, and cultural obstacles. Debnath et al. (2023) confirmed that high initial investment and insufficient legislative support constitute the dominant constraints in emerging economies—a finding that resonates directly with Ecuadorian conditions. Bhattacharjee et al. (2023) identified market orientation and cross-functional team capacity as critical success factors, while Mondal et al. (2023) highlighted organizational coordination and top management commitment as technical enablers. What remains unclear is how these barriers interact within the IT sector in a Latin American context, where the challenges of e-waste management intersect with limited digital literacy, uneven infrastructure, and the informal recycling economy that Espinosa-Aquino et al. (2023) and Ouro-Salim (2024) have documented as simultaneously vital and underregulated.
Two theoretical lenses illuminate the institutional dynamics at work. Institutional theory, as operationalized by Esposito et al. (2023) and Medaglia et al. (2024), suggests that weak regulatory frameworks in developing countries create institutional voids—spaces where formal governance mechanisms are absent or insufficient. In Ecuador, public–private partnerships such as the CNEL–CELEC agreements and the SENPLADES–DINTEL cloud platform initiatives fill these voids, performing governance functions that the state has not yet institutionalized. Stakeholder theory provides a complementary perspective: Gallardo-Vázquez et al. (2024) demonstrated that the CSR–CE linkage is mediated by stakeholder pressure (β = 0.861, p < 0.001), implying that the quality of stakeholder engagement—not merely its existence—determines the extent to which social responsibility initiatives translate into circular outcomes. Together, these frameworks suggest that ITSR–CE integration in contexts such as Ecuador depends less on regulatory compliance than on the capacity of organizations to construct collaborative governance architectures that compensate for institutional weakness.
The convergence of these sectoral, geographic, and theoretical gaps produces a clear research imperative. The literature has established that CSR is strongly associated with CE adoption, that digital technologies enable circular transitions, and that advanced R-strategy frameworks offer superior analytical granularity. It has not, to date, examined how IT-specific social responsibility projects—the kind that organizations routinely underestimate and exclude from annual planning—can be formally integrated into corporate strategy through circular economy practices within the institutional context of a developing Latin American economy. Existing Ecuadorian evidence documents isolated initiatives (HP’s Movilabs classrooms reusing 2000 kg of recycled components, SANOFI’s donation of 150 equipment units, SRI’s foundry recycling of technological waste) but does not subject these initiatives to systematic cross-case analysis using contemporary CE typologies. The result is an empirical landscape rich in descriptive examples but poor in analytical synthesis.
These gaps define the need for the present study. Managers in developing economies lack an evidence-based framework for deciding whether, and how, ITSR projects belong in the annual plan; researchers lack any Latin American case evidence analyzed with contemporary CE typologies; and the one quantitative anchor the field relies on—the CSR–CE path coefficient—has never been examined against organizational practice in the region. This study addresses these needs through a dual methodological strategy. First, a PRISMA 2020-compliant systematic review synthesizes 35 peer-reviewed studies (2023–2025) to establish the current state of evidence on IT–CE integration, assess the certainty of findings using an adapted GRADE framework, and identify the specific areas where the evidence base remains insufficient. Second, a qualitative multiple case study, designed following Yin’s (2018) methodological framework, analyzes seven organizational cases in Ecuador—four multinational corporations (MNCs) with documented ITSR–CE programs (HP Movilabs, OPTEX Remanufacturing, IBM 7-for-1, SANOFI-Reuse) and three domestic startups with emergent circular IT models (TramaQuito, La Máquina, Vortex Ecological Clothing)—using thematic content analysis anchored to the R0–R9 ladder, the 60R typology, and the ReSOLVE framework. The central research question guiding both components is: How can companies in Ecuador integrate IT social responsibility projects—especially those that are typically underestimated in annual planning—into their corporate strategy through circular economy practices, and what social and environmental impacts result from such integration?
The contribution of this work is threefold. First, it provides the first systematic synthesis of IT–CE evidence through the lens of social responsibility, addressing a field that the current literature treats either as a CSR problem (without CE operationalization) or as a CE problem (without IT sector specificity). Second, it applies the R0–R9 ladder, the 60R typology, and the ReSOLVE framework to real organizational cases in Ecuador, mapping specific corporate and startup practices to R-strategies with documented metrics—a level of analytical granularity that distinguishes this study from the descriptive case catalogues that characterize prior Ecuadorian scholarship. Third, by examining both formalized corporate programs and emergent startup practices within the same analytical framework, the study reveals the governance mechanisms that enable or constrain the transition from ad hoc ITSR activity to strategically planned circular integration.
The hypothesis that motivated this research—that incorporating ITSR projects into business strategy through CE practices improves the sustainability, competitiveness, and social contribution of organizations—is decomposed here into two formal research propositions so that each can be assessed against the evidence actually available. Proposition 1 (P1): the formal integration of ITSR projects into planning and governance structures is associated with documented environmental and social circular outcomes. P1 is assessable with the documentary evidence assembled, which contains quantified environmental outputs and partially quantified social outcomes. Proposition 2 (P2): such integration improves business competitiveness. P2 requires economic indicators—cost savings, return on investment, revenue effects—that, as the Results show, none of the seven cases reports. P2 is therefore stated as a proposition to be tested rather than as a claim this study demonstrates, and the absence of the economic evidence needed to test it is treated as a substantive finding in its own right. In design terms, the study is qualitative: it draws on documentary sources that contain quantitative environmental and social metrics but no financial ones, and its claims are correspondingly confined to the environmental, social, and governance dimensions of integration.
The remainder of this article is organized as follows. Section 2 presents the theoretical framework, detailing the R-strategy typologies (R0–R9 and 60R), the ReSOLVE framework, institutional and stakeholder theory—including the role of the informal recycling sector—the dynamic capabilities perspective, and the Green IT literature that explains why the IT function in particular struggles to carry sustainability into annual planning. Section 3 describes the materials and methods, including the systematic review protocol, the case selection strategy, and the analytical procedures. Section 4 reports the results of both the systematic review and the cross-case analysis of Ecuadorian organizations, and assesses the two propositions. Section 5 discusses the findings in dialogue with the existing literature, distributing limitations alongside the findings they affect. Section 6 concludes with the empirical contribution and its practical implications for corporate planning in developing economies.
2. Theoretical Framework
This section presents the concepts and theories that structure the empirical analysis. Five interconnected lenses operationalize the circular economy (CE)–IT social responsibility (ITSR) nexus at different analytical levels: the R-strategy typologies (the R0–R9 ladder and the 60R typology) at the operational level, the ReSOLVE framework at the strategic level, institutional and stakeholder theory at the contextual level, the dynamic capabilities perspective at the level of organizational heterogeneity, and the Green IT literature at the sectoral level. Together, they explain not only what circular practices organizations adopt but also why comparable organizations facing the same institutional environment convert social responsibility initiatives into circular outcomes to very different degrees—and why the IT function is a particularly difficult place to begin.
2.1. R-Strategy Typologies: From 3R/5R to the R0–R9 Ladder and the 60R Typology
At the operational level, the study classifies circular practices with two complementary instruments whose provenance should be stated precisely. The first is the R0–R9 ladder of Potting et al. (2017)—R0 Refuse, R1 Rethink, R2 Reduce, R3 Reuse, R4 Repair, R5 Refurbish, R6 Remanufacture, R7 Repurpose, R8 Recycle, R9 Recover—ordered from higher to lower circularity and grouped into three strategic bands: smarter product use and manufacture (R0–R2), extended lifespan of products and their parts (R3–R7), and useful application of materials (R8–R9). Kirchherr et al. (2017) adopted this ladder as their reference “9R” framework (R0–R9) in their analysis of 114 CE definitions, and Nazir and Doni (2024) and Quinto et al. (2025) applied it in the integrated-reporting and e-waste settings closest to the present cases. All R-codes in this article (Section 3.3.2, Section 3.4.1, and Section 4.2.2) refer to this ladder. The second instrument is the 60R typology of Uvarova et al. (2023), which does not rank ten strategies but catalogues the sixty R-principles found in a review of 148 business-oriented studies and classifies them into four groups: reduce, reuse, recycle, and reverse logistics. The typology serves two purposes here. First, its fourth group, reverse logistics, has no counterpart in the R0–R9 ladder and justifies the separate Reverse Logistics code family in our codebook; second, its strategic-orientation perspective frames circularity as a portfolio of business practices rather than as a waste hierarchy. The two instruments are therefore nested rather than interchangeable—the ladder supplies the coding resolution, the typology supplies the strategic groupings—and this article refers to them jointly as the 60R/R0–R9 framework.
Both instruments supersede the basic R-models that dominate the earlier CE and e-waste literature. The 3R model (reduce, reuse, recycle) and its 5R extensions—which typically add recover and a fifth strategy that varies by author (refuse, repair, or redesign)—treat all strategies as equivalent and collapse the lifespan-extension band (R3–R7) into a single reuse category, so that a repair program and a remanufacturing plant receive the same code. Uvarova et al. (2023) criticized precisely this lack of operational granularity, and Magnano et al. (2024) showed that multi-dimensional operationalization is a prerequisite for detecting the mediating role of digital technology in CE–performance relationships. Six of the 35 reviewed studies still rely on 3R/5R formulations (Section 4.1.4). The extended framework is also what makes the main empirical result visible: only a ladder that separates these strategies permits the observation that documented, quantified outcomes in the Ecuadorian cases cluster within R2–R9, that R0 Refuse is absent, and that R1 Rethink appears only as a non-quantified startup practice.
2.2. Strategic Integration: The ReSOLVE Framework
At the level of strategic integration, the study employs the ReSOLVE framework (Ellen MacArthur Foundation, 2015), operationalized through the empirical mappings established by Gallardo-Vázquez et al. (2024). This framework organizes CE strategies into six action domains: Regenerate, Share, Optimize, Loop, Virtualize, and Exchange. Each Ecuadorian case is mapped to the ReSOLVE actions its documented practices instantiate: HP Movilabs’ use of recycled components maps to Loop; SENPLADES–DINTEL’s cloud platforms map to Virtualize; IBM’s volunteer collection networks map to Share; and SANOFI’s equipment donation program maps to Exchange. This dual mapping—R-strategies at the operational level, ReSOLVE at the strategic level—provides the analytical granularity required to distinguish between organizations that recycle (a basic R8 practice) and organizations that strategically integrate circularity across multiple value chain nodes.
2.3. Institutional Theory, Stakeholder Theory, and Institutional Voids
At the level of institutional and relational dynamics, the analysis draws on two complementary theoretical lenses. Institutional theory, as applied by Esposito et al. (2023) and Medaglia et al. (2024) in the CE domain, accounts for the regulatory and normative environment within which Ecuadorian organizations operate. Quintana et al.’s (2024) documentation of institutional voids in Ecuador—characterized by insufficient government resources and limited private investment for reverse logistics—provides the contextual foundation. Stakeholder theory, operationalized through Gallardo-Vázquez et al.’s (2024) PLS-SEM evidence that stakeholder pressure mediates the CSR–CE linkage (β = 0.861, p < 0.001), grounds the analysis of how different stakeholder configurations (government agencies, private corporations, universities, NGOs, community groups) enable or constrain ITSR–CE integration across the case portfolio.
Institutional theory also directs attention to an actor that formal governance frameworks overlook. In Latin America, a substantial share of end-of-life electronics is recovered by informal recyclers (recicladores informales) operating outside regulatory safeguards: Espinosa-Aquino et al. (2023), reviewing eight countries in the region, identified informal waste management as a structural component of urban metabolism rather than a marginal anomaly, and Ouro-Salim (2024) documented the dependence of urban-mining collection logistics on informal actors in emerging economies. For the present study, this literature has two implications. First, the informal sector is part of the institutional environment to which formally constituted organizations respond—as a competitor, as a de facto supplier of recovered materials, or as an unacknowledged link in the reverse-logistics chain. Second, its presence qualifies what reverse logistics, the fourth group of the 60R typology, means in practice. Because the case selection is restricted to formally constituted organizations (Section 3.3.2), the informal sector enters the analysis as a contextual condition rather than as a case; Section 5.4 returns to the consequences of this boundary.
2.4. Dynamic Capabilities and the Microfoundations of Circular Transition
A fourth theoretical lens, the dynamic capabilities perspective, frames the CE transition as a problem of organizational capability rather than merely of technology or regulation. Teece (2007) disaggregated dynamic capabilities into three classes: sensing (identifying and assessing opportunities and threats), seizing (mobilizing resources, designing business models, and committing investment to the opportunity), and transforming (also termed reconfiguring: realigning structures, routines, and governance so that the new activity becomes a continuing part of the enterprise). Franco and Giannoccaro (2025), in a multiple case study of seven manufacturing firms that completed the circular transformation, identified seven microfoundations linked to these three capability classes through which firms overcome barriers located at the institutional, supply chain, and firm levels—a barrier taxonomy that maps closely onto the obstacles documented for Latin American contexts in this study. In a complementary multiple case investigation of eleven industrial firms, Neri et al. (2023b) showed that digital technologies do not support circularity directly but indirectly, by enabling specific dynamic capabilities and their microfoundations, which in turn sustain the adoption of CE practices. This capability-based reading supplies a mechanism for the institutional duality examined in the cross-case analysis. Sensing is not what separates multinationals from startups: both strata recognize the opportunity in e-waste recovery, reuse, and digital inclusion. The difference lies downstream. Multinational subsidiaries seize the opportunity through budgets and programs allocated within global corporate responsibility cycles, and transform by embedding circular routines into annual reporting, key performance indicators, and partnership governance; startups seize partially—through project-based and competition-based funding—and rarely transform, because they lack the planning, measurement, and governance structures into which routines could be embedded. Differences in governance between the two strata are thus interpreted as differences in seizing and transforming capability rather than in intent or awareness. The perspective also connects with the stakeholder-theoretic pathway described above: Hoang (2026), analyzing 165 manufacturing SMEs in Vietnam through PLS-SEM, found that stakeholder pressure improves sustainable performance through a sequential mediation in which corporate social responsibility (CSR) drives the adoption of CE practices, corroborating in a second emerging-economy context the CSR-to-CE directionality that underlies Proposition 1.
2.5. Green IT, IT Governance, and the Planning Gap
The general theories above explain variation across organizations; they do not by themselves explain why the IT function, specifically, struggles to carry sustainability into annual planning. The Green IT and Green information systems (Green IS) literature supplies that sectoral mechanism. Murugesan (2008) defined Green IT as the environmentally sound design, manufacture, use, and disposal of computing assets; early adoption in the field was driven largely by the energy cost of data centers and desktop fleets—a framing that positions sustainability as an operating-expense item rather than as a strategic program. Faucheux and Nicolaï (2011) distinguished green IT (reducing the footprint of IT itself) from IT for green (using IT to reduce the footprint of other activities); the distinction maps onto the gap identified in Section 1, since the reviewed literature is rich in IT-for-green evidence but thin on the circularity of IT’s own assets, which is where ITSR projects such as equipment reuse and e-waste recovery reside. Molla et al. (2011) conceptualized Green IT readiness (G-readiness) as the input, transformational, and output capabilities that organizations need for the sustainable management of IT, identifying five components—attitude, policy, practice, technology, and governance—of which governance, concerned with roles, budgets, and metrics, is the component that connects the others to planning. Loeser et al. (2017), surveying 118 senior IT executives, showed that environmental orientation translates into Green IT and Green IS practices only when mediated by an explicit Green IS strategy, with benefits accruing as cost reduction, reputation, and green innovation capability. Chen et al. (2011) added the institutional dimension: among 75 organizations, mimetic and coercive pressures—rather than internal conviction alone—were the significant drivers of Green IS/IT adoption, and the two pressures interacted most strongly for product-stewardship practices such as take-back and recycling.
Read together, these studies predict that ITSR projects will remain outside the annual plan wherever governance capability is weak, no explicit strategy links environmental orientation to IT action, and institutional pressure is absent—exactly the conditions that institutional theory describes for Ecuador. They also predict where integration will occur first: in organizations that import governance routines and coercive expectations from elsewhere, which is the profile of the multinational cases examined here. The convergence of these five frameworks—R0–R9/60R for operational classification, ReSOLVE for strategic mapping, institutional and stakeholder theory for contextual interpretation, dynamic capabilities for explaining inter-organizational variation, and Green IT for the sector-specific planning mechanism—constitutes the analytical architecture within which all case data are coded, compared, and theorized.
3. Materials and Methods
3.1. Research Design
This study employs a dual methodological architecture that integrates two complementary research strategies: (1) a PRISMA 2020-compliant systematic literature review (SLR) and (2) a qualitative multiple case study with embedded units of analysis, following Yin’s (2018) methodological framework for theory-building from empirical cases. The combination is not arbitrary. The research question—How can companies in Ecuador integrate IT social responsibility projects into their corporate strategy through circular economy practices?—is simultaneously explanatory and exploratory, requiring both a synthesis of existing evidence (what do we know about IT–CE integration?) and an empirical examination of organizational practices in context (how does this integration occur in Ecuador?). Neither component alone would suffice: the SLR without case data would remain abstract, lacking the institutional specificity that the Ecuadorian context demands; the case analysis without the SLR would lack the theoretical scaffolding necessary for cross-case interpretation.
The selection of a multiple case study design—rather than a survey, experiment, or single-case approach—is grounded in three conditions identified by Yin (2018) as prerequisites for case study research (see Figure 1). First, the phenomenon under investigation is contemporary and cannot be isolated from its real-world organizational context. IT social responsibility practices in Ecuadorian firms are embedded within specific governance structures, regulatory environments, and stakeholder networks that shape their implementation. Second, the researchers retain control over neither behavioral events nor implementation conditions; these are organizational decisions made independently by corporate actors. Third, the research question demands process-level understanding—not merely whether ITSR–CE integration occurs, but how it occurs and through what mechanisms. Shamsuzzaman et al. (2025) corroborated this methodological positioning: their systematic review of 104 studies on CE transitions found that case studies constitute 28% of the methodologies used in the field, establishing the approach as an accepted methodological standard in circular economy research.
Figure 1.
Embedded multiple case study design showing the macro-level unit of analysis and the two organizational sub-groups used for literal replication, with theoretical replication through cross-case comparison.
For the reader’s orientation, the study can be read as five sequential stages. Stage 1, a PRISMA 2020-compliant systematic literature review, identified and extracted the 35 studies (Section 3.2.1, Section 3.2.2, Section 3.2.3, Section 3.2.4 and Section 3.2.5). Stage 2 appraised their quality and graded the certainty of the evidence (Section 3.2.6 and Section 3.2.7). Stage 3 selected the seven Ecuadorian organizations and assembled their 23 documents (Section 3.3). Stage 4 analyzed the documents through thematic content analysis and cross-case comparison, mapping practices to the R0–R9 ladder and the ReSOLVE framework (Section 3.4). Stage 5 confronted the resulting patterns with the two research propositions and with the literature (Section 4.3 and Section 5). The stages are connected in both directions: the review supplied the theoretical expectations (E1–E3), the deductive code families, and the comparative benchmarks used in the case analysis, and the case findings were in turn triangulated against the reviewed literature—agreement, divergence, and boundary conditions are summarized in Section 4.2.3 and examined finding by finding in Section 5. Table 1 sets out precisely the research methods applied in each component—data sources and samples, protocols and instruments, analytical procedures, software, and quality safeguards—before they are detailed in Section 3.2, Section 3.3, Section 3.4 and Section 3.5.
Table 1.
Overview of the research methods applied in the two components of the study, with cross-references to the sections where each element is detailed. Source: Authors’ elaboration.
Table 2.
Operationalization of the quality-appraisal protocol: rating descriptors for each dimension and the rule used to assign the 35 included studies to quality tiers (Section 3.2.6). Source: Authors’ adaptation of the frameworks of Moustafa et al. (2025) and Shamsuzzaman et al. (2025); the latter is itself rated low on external validity in Section 4.1.3 as a single-sector review, a rating independent of its use as a protocol source.
3.2. Component I: Systematic Literature Review
3.2.1. Protocol and Registration
The systematic review follows the Preferred Reporting Items for Systematic Reviews and Meta-Analyses (PRISMA 2020) guidelines (Page et al., 2021). The review protocol was developed prior to the search and specified the research question, eligibility criteria, search strategy, screening procedures, data extraction variables, and quality assessment framework. The review was not registered in PROSPERO, as the database primarily accommodates health-related systematic reviews and does not currently support registration of interdisciplinary sustainability reviews that combine SLR with embedded case study components. This constitutes a transparency limitation; to mitigate it, the search string, eligibility criteria, screening process, extraction variables, quality assessment, and analytical procedures are reported in Section 3.2.2, Section 3.2.3, Section 3.2.4, Section 3.2.5, Section 3.2.6 and Section 3.2.7 with sufficient detail to permit independent replication.
3.2.2. Eligibility Criteria
Studies were included if they met all of the following criteria: (a) peer-reviewed journal article published in English between January 2018 and March 2025; (b) explicit conceptual or empirical engagement with circular economy principles (beyond generic sustainability references); (c) focus on the IT sector, digital technologies, or e-waste management as primary or secondary subjects; (d) inclusion of extractable data—whether quantitative (effect sizes, regression coefficients, descriptive statistics) or qualitative (thematic findings, case descriptions, framework propositions). Studies were excluded if they: (a) addressed CE only in non-technology sectors without digital technology linkage; (b) constituted grey literature, conference proceedings without subsequent journal publication, or editorial commentaries; (c) lacked an identifiable methodology section; or (d) were published in predatory journals as identified through Beall’s list and Cabell’s Predatory Reports. The temporal boundary of 2018 was established to capture the post-foundational phase of CE research, following the conceptual consolidation marked by Geissdoerfer et al. (2017) and Kirchherr et al. (2017), while ensuring currency in a rapidly evolving field.
3.2.3. Information Sources and Search Strategy
Two electronic databases were searched: Scopus and Web of Science (WoS) Core Collection, selected for their comprehensive coverage of high-impact journals in sustainability, information systems, and business management. The search was conducted in January 2025, with an update in March 2025 to capture recently indexed publications. The search string combined three conceptual blocks using Boolean operators: (“circular economy” OR “circular* model” OR “R-strateg*” OR “reverse logistics” OR “e-waste” OR “electronic waste”) AND (“information technology” OR “IT” OR “digital” OR “software” OR “ICT”) AND (“social responsibility” OR “CSR” OR “corporate sustainability” OR “sustainable development”). The string was adapted to the syntax requirements of each database. Searches were restricted to article titles, abstracts, and keywords. A complementary backward snowball search was performed on the reference lists of the five most highly cited included studies to identify articles missed by the electronic search.
3.2.4. Selection Process
The selection process followed a three-stage screening protocol. In the identification phase, database searches yielded 1247 records, reduced to 892 after automated and manual duplicate removal. In the screening phase, titles and abstracts were independently assessed by both authors against the eligibility criteria. Inter-rater agreement was not quantified statistically: the independent decisions of the two authors were not retained as separate records once consensus had been reached, so Cohen’s κ cannot be reconstructed retrospectively. Disagreements at both screening stages were resolved through discussion until consensus was reached, and each resolution was recorded in the analytical decision log (Supplementary Table S3.3). The absence of a formal agreement statistic is acknowledged as a limitation of the review in Section 5.8. Screening resulted in the exclusion of 715 records that did not meet the CE–IT–CSR intersection requirement. In the eligibility phase, full texts of the remaining 177 articles were retrieved and assessed by both authors. A total of 142 articles were excluded for the following reasons: no explicit IT–CE linkage (n = 89), grey literature or non-peer-reviewed sources (n = 31), and no extractable empirical or theoretical data (n = 22). The final synthesis included 35 studies. The complete selection process is reported in Figure 2, following the standard PRISMA 2020 flow diagram template.
Figure 2.
PRISMA 2020 flow diagram illustrating the systematic identification, screening, eligibility assessment, and inclusion of studies in the qualitative synthesis (n = 35). Source: Adapted from Page et al. (2021).
3.2.5. Data Extraction
A structured data extraction matrix, maintained in a Microsoft Excel workbook (Supplementary Table S2), was developed to ensure systematic and comparable extraction across all 35 included studies. The matrix captured 14 variables organized into four categories: (i) bibliographic metadata (authors, year, journal, country of study); (ii) methodological characteristics (research design, sample size, analytical technique, software used); (iii) substantive findings (CE framework adopted, R-strategies operationalized, barriers identified, enablers reported, effect sizes where available); and (iv) quality indicators (limitations reported, PRISMA compliance, external validity assessment). Data extraction was performed by the first author and verified by the second author; discrepancies were resolved through source re-examination. Assumptions for missing or unclear information were specified in advance. A variable not reported by a study was recorded as “not reported” (n/r); no value was imputed, estimated from related quantities, or requested from study authors. Studies with missing effect sizes or sample sizes were retained in the narrative synthesis but excluded from the effect-size comparisons in Section 4.1.4; studies that did not report limitations were coded as such, and this absence was itself treated as a quality indicator (Section 3.2.6). Where information was ambiguous (for example, a CE framework described but not named), the coding was agreed by both authors and the decision recorded in the decision log. The extraction matrix underpins the descriptive and thematic syntheses reported in Section 4.
3.2.6. Quality Assessment of Included Studies
Each included study was subjected to a critical appraisal protocol adapted from the frameworks employed by Moustafa et al. (2025) and Shamsuzzaman et al. (2025), both of which conducted PRISMA-compliant reviews in the CE domain. An adapted framework was preferred to a design-specific instrument because the corpus mixes systematic reviews, case studies, structural equation models, multi-criteria decision models, bibliometric analyses, and conceptual papers; no single validated checklist applies uniformly to all of these designs, whereas the three dimensions below can be assessed for every study type. The dimensions are methodological transparency (adherence to reporting standards for the design in question, explicit sampling or search procedure, and—for qualitative designs—a data saturation declaration), limitations reporting (self-acknowledged biases and constraints), and external validity (sample representativeness, geographic scope, and sectoral generalizability). Each dimension was rated as fully, partially, or not satisfied using the design-specific descriptors operationalized in Table 2: for systematic reviews, full transparency required a PRISMA or equivalent protocol with dual screening; for structural equation models, a sample exceeding 400 respondents with reported measurement validity; for multi-criteria decision models, a sensitivity analysis; for case studies, an explicit case selection logic and more than 20 informants or an equivalent documentary base. Tier assignment weights the two dimensions that bear directly on the trustworthiness of a study’s findings—methodological transparency and external validity—more heavily than limitations reporting: a study was classified as high quality (n = 9) when both were fully satisfied and limitations were at least partially acknowledged; as moderate (n = 18) when both were at least partially satisfied—typically case studies with fewer than 20 participants, reviews without dual coding, or bibliometric analyses restricted to a single database; and as low (n = 8) when either was not satisfied—conceptual-only contributions, studies with no explicit methodology, or studies offering no basis for generalization. Table 2 also states the tier-assignment rule. Appraisal was performed by the first author; the second author independently checked every rating against the descriptors in Table 2, and disagreements were resolved by consensus. This stratification informed the certainty-of-evidence assessment reported in the Results section, where findings are weighted by the quality of their supporting studies.
3.2.7. Synthesis Method
Given the methodological heterogeneity of the included studies—which span systematic reviews, case studies, structural equation modeling, multi-criteria decision analysis, bibliometric analyses, and conceptual contributions—a quantitative meta-analysis was neither feasible nor appropriate. The synthesis follows a narrative approach organized around four theoretical pillars established deductively from the literature: (i) CE principle typologies (the R0–R9 ladder, the 60R typology, ReSOLVE, and basic 3R/5R frameworks), (ii) drivers and barriers for IT–CE integration, (iii) geographic and sectoral patterns, and (iv) digital enablers and circularity metrics. Within each pillar, findings are presented with explicit reference to effect sizes, sample characteristics, and quality tier classifications, following the approach recommended by Magnano et al. (2024) for systematic reviews that integrate quantitative and qualitative evidence. An adapted GRADE (Grading of Recommendations, Assessment, Development, and Evaluations) framework was used to assess the certainty of evidence across each thematic domain, rated as high, moderate, low, or very low based on study quality, consistency, directness, and precision of findings.
3.3. Component II: Multiple Case Study
3.3.1. Unit of Analysis and Embedded Sub-Units
The primary unit of analysis is the organizational project implementing IT social responsibility with identifiable circular economy principles. This level of analysis captures the specific initiative—not the organization as a whole—because the research question concerns the mechanisms of project-level integration into corporate strategy, not aggregate firm behavior. Within each case, four embedded sub-units structure the analysis: the technological dimension (recycling processes, remanufacturing protocols, equipment donation systems), the social dimension (community impact metrics, digital inclusion outcomes), the economic dimension (cost savings, resource optimization indicators), and the governance dimension (strategic planning integration, annual planning mechanisms, stakeholder coordination structures). This embedded design follows the logic articulated by Yin (2018), who argues that sub-units allow attention to operational detail without losing the holistic advantage of the case study approach.
3.3.2. Case Selection Strategy
The case portfolio comprises seven organizational cases selected through purposive sampling, stratified by organizational type to ensure theoretical diversity and enable cross-case comparison through replication logic (Yin, 2018). The portfolio is organized in two organizational strata—multinational corporations with documented IT–CE programs operating in Ecuador (HP Movilabs, OPTEX Remanufacturing, IBM 7-for-1, SANOFI-Reuse) and Ecuadorian startups with emergent circular IT models (TramaQuito, La Máquina, Vortex Ecological Clothing)—plus a set of public–private partnerships embedded within the cases as analytical sub-units rather than as a third stratum (UCE–UCES academic collaborations, SENPLADES–DINTEL cloud platforms, CNEL–CELEC energy-IT agreements). This structure serves a specific analytical function: multinational cases provide benchmarks of formalized practices against global standards, startup cases reveal emergent ecosystem patterns and local innovation dynamics, and the public–private sub-units illuminate institutional bridging mechanisms in contexts of regulatory weakness.
Combining multinational subsidiaries and domestic startups in one portfolio is a deliberate design choice that carries a known cost. The choice follows Yin’s (2018) logic of theoretical replication: the two strata are polar types expected to differ for predictable reasons, and the analytical value lies in whether the predicted contrast appears and in what form. The cost is that the strata differ not only in the variable of theoretical interest—the degree of formal integration of ITSR into planning—but also in resources, reporting obligations, and governance capacity, so that any observed difference in documented circularity is confounded with a difference in the capacity to document. Three safeguards were adopted. First, the same codebook and the same documentary criteria were applied to both strata, and the unit of coding is the project rather than the organization, which limits—though it does not remove—the effect of organizational scale. Second, the rival explanation that the duality is an artifact of reporting infrastructure rather than of operational practice was formulated in advance and tested explicitly in the explanation-building step (Section 3.4.2) and in the Discussion (Section 5.1). Third, the ordinal maturity scores used for cross-stratum comparison (Section 4.2.4) are defined in terms of what the documents show—presence, formalization, and quantification—rather than as judgments about underlying performance. The comparison should accordingly be read as a comparison of documented practice between two organizational forms, and the findings on the startup stratum as lower bounds on its actual circular activity.
Four explicit selection criteria governed case inclusion, adapted from the criteria employed by Trevisan et al. (2023) in their multiple case study of CE transitions. First, the organization must have a demonstrated IT project with a documented circular economy component—meaning that circular principles (reuse, recycle, remanufacture, or other R-strategies) are identifiable in the project’s design or outcomes, not merely invoked rhetorically. Second, secondary data must be available in the form of corporate sustainability reports, published case descriptions, institutional records, or academic–practitioner documentation. Third, the organization must have an operational presence in Ecuador (for MNCs) or be of Ecuadorian origin (for startups and public institutions). Fourth, the initiative’s temporal scope must fall within 2015–2024, ensuring both historical depth and contemporary relevance; where an archive documents earlier origins (the UCE–UCES collaboration dates from 2000), only activity within the window was coded. A deliberate scope boundary should be noted: the case selection targets formally constituted organizations and does not include informal recyclers (recicladores informales), who play a documented role in Latin American e-waste recovery (Espinosa-Aquino et al., 2023; Ouro-Salim, 2024). This exclusion reflects the study’s focus on strategic corporate planning mechanisms—which require identifiable governance structures—but limits the comprehensiveness of the circular economy mapping, a constraint addressed in the Discussion. The sample size of seven cases is comparable in scope to the multiple case designs in the reviewed literature—Despoudi et al. (2023), for instance, reached analytical saturation with 15 expert interviews across multiple cases—although a 23-document corpus and an interview corpus are not commensurable in kind, a point taken up in Section 5.8. Table 3 summarizes the descriptive and operational characteristics of the seven cases, including the R0–R9 mapping of their principal circular practices.
Table 3.
Descriptive and operational characteristics of the seven organizational cases selected for cross-case analysis, including the R0–R9 mapping (Potting et al., 2017) of each case’s principal circular practices and documented impact metrics. Source: Authors’ compilation from corporate reports, institutional documentation, and startup portfolios (2015–2024).
3.3.3. Data Sources and Collection Protocol
The empirical corpus comprises 23 documents drawn from four source categories. Primary sources include eight corporate sustainability reports (HP Global Impact Reports 2015–2016, IBM Corporate Responsibility Reports, SANOFI CSR documentation), six institutional and contextual dossiers (including SRI management model documentation, OPTEX remanufacturing plant records, and CNEL–CELEC interinstitutional agreements), five startup portfolios (TramaQuito, La Máquina, and Vortex project descriptions, including documentation from innovation promotion programs), and four academic–practitioner collaboration archives (UCE–UCES program records spanning 2000–2024, UTN–BGOI project documentation). Following Nazir and Doni (2024)—who validated the extraction of CE-relevant data from corporate reports using NVivo thematic analysis—our approach treats these documents as institutional artifacts that encode organizational practices, strategic decisions, and operational outcomes. This documentary approach is consistent with the case-based data collection strategies represented in the systematic review (Trevisan et al., 2023; Nazir & Doni, 2024; Despoudi et al., 2023).
Secondary sources consist of the 35 peer-reviewed studies included in the systematic review (Section 3.2), which serve a dual function: they provide the theoretical framework against which case data are interpreted, and they supply comparative benchmarks from other geographic and sectoral contexts. Full citations for these secondary sources are provided in the reference list.
3.4. Analytical Framework: Thematic Content Analysis
3.4.1. Codebook Development
The analytical framework employs thematic content analysis with a hybrid deductive–inductive codebook, following the approach validated by Trevisan et al. (2023), who identified 45 barriers across eight dimensions through systematic coding, and by Neri et al. (2023a), who demonstrated the reliability of semi-structured interview coding for digital technology–CE integration research. The codebook (Table 4) was developed in two sequential phases.
Table 4.
Hybrid deductive–inductive codebook structure for thematic content analysis, specifying code families, source theories, operational definitions, and literature anchors. Source: Authors’ elaboration based on Potting et al. (2017), Uvarova et al. (2023), Gallardo-Vázquez et al. (2024), Neri et al. (2023a), and emergent codes from the Ecuadorian case corpus.
In the deductive phase, four code families were established from the theoretical framework: CE Principles, operationalized through the R0–R9 ladder (Potting et al., 2017) within the strategic groups of Uvarova et al.’s (2023) 60R typology, as any practice mappable to Refuse, Rethink, Reduce, Reuse, Repair, Refurbish, Remanufacture, Repurpose, Recycle, or Recover; Reverse Logistics, defined following Ouro-Salim (2024) and Espinosa-Aquino et al. (2023)—and corresponding to the fourth group of the 60R typology—as the collection, sorting, and transportation of e-waste back into the production cycle; Stakeholder Integration, operationalized through Gallardo-Vázquez et al.’s (2024) PLS-SEM findings (β = 0.893 in their Spanish SME sample) as public–private partnerships, community engagement, and supplier collaboration mechanisms; and Digital Enablers, defined following Neri et al. (2023a) and Tutore et al. (2024) as the application of AI, IoT, Big Data, or Digital Twins to CE processes.
In the inductive phase, following the iterative approach demonstrated by Despoudi et al. (2023), all 23 primary documents were read line by line and tagged with emergent codes unconstrained by the deductive framework. Open coding generated phenomenon-level labels (e.g., “HP Movilabs modular container from recycled components”); axial coding grouped these labels into analytical categories (e.g., “physical asset circularity”); and selective coding integrated categories around the central phenomenon of IT–CE integration in the Ecuadorian organizational context. This two-phase approach ensures that the analysis is both theoretically anchored and empirically responsive to patterns not anticipated by the existing literature.
3.4.2. Analytical Procedures
The analysis proceeded through four sequential steps anchored to established qualitative methods in CE research. In the data-reduction step, all 23 primary documents were compiled into an NVivo 14 project, and the deductive-phase codes were applied to the entire corpus; code frequency and coverage statistics were calculated to identify dominant patterns and underrepresented dimensions. In the pattern-matching step, following Yin’s (2018) logic, each case was compared against three theoretical expectations derived from the literature—labeled E1–E3 to distinguish them from the research propositions P1 and P2 stated in Section 1. E1 holds that multinational corporations exhibit formalized CE indicators, whereas startups display emergent, non-formalized practices; E2, drawn from Medaglia et al. (2024), holds that public–private partnerships enable CE adoption where regulatory frameworks are weak; and E3, informed by Khan et al.’s (2023) finding that green technology adoption positively predicts sustainable supply chain performance, holds that IT culture and training mediate between technology adoption and circular outcomes. IT culture is operationalized as the presence of organizational norms, training programs, and competency frameworks that embed environmental responsibility into technology management routines.
Coding in NVivo 14 was performed by the first author; the codebook iterations, the inductive code families, and all pattern-matching and maturity-scoring decisions were reviewed jointly by both authors and recorded in the decision log (Supplementary Table S3.3); no intercoder agreement statistic was computed, a limitation noted in Section 5.8. In the cross-case synthesis step, following the procedure implemented by Trevisan et al. (2023), a case-ordered descriptive matrix was constructed to enable systematic comparison across the seven cases (see Figure 3). Replication logic—both literal (similar results across MNC cases) and theoretical (contrasting results between MNC and startup strata for predictable reasons)—was applied to extract generalizable patterns. Cross-cutting themes were identified through thematic network analysis. In the explanation-building step, causal claims were iteratively refined through the question: How does each case’s CE practice generate its reported outcomes? Rival explanations were systematically tested—for instance, whether documented metrics represent operationally embedded circular practices or primarily serve public-relations functions—following the analytical rigor standards recommended by Yin (2018) for explanatory case studies.
Figure 3.
Conceptual framework illustrating the cross-case analytical architecture, linking organizational strata, embedded sub-units, and theoretical frameworks through pattern matching and replication logic. The 60R typology label denotes the 60R/R0–R9 framework described in Section 2.1. Source: Authors’ elaboration based on Yin (2018) and Trevisan et al. (2023).
3.5. Quality Criteria (Trustworthiness)
The trustworthiness of the qualitative component is established through four criteria following Lincoln and Guba (1985), operationalized according to the standards implemented by Trevisan et al. (2023) in their CE multiple case study. Credibility is ensured through prolonged engagement with the data corpus (covering organizational activities from 2015 to 2024) and source triangulation across the four source categories described in Section 3.3.3—corporate, institutional, startup, and academic–practitioner—totaling 23 documents. Transferability is supported through thick description: each case narrative includes contextual details (organizational scale, sector, regulatory environment, stakeholder networks) sufficient for readers to assess applicability to other settings. Dependability is supported by the documented codebook, case selection criteria, analytical decision points, and iterative refinements described in Section 3.3 and Section 3.4. Confirmability is addressed through a reflexivity statement: the authors acknowledge their prior involvement in several of the Ecuadorian initiatives examined, which provided privileged access to institutional documentation but also introduced a positionality that could influence interpretation. This involvement is disclosed transparently, and interpretive claims are systematically anchored to documented evidence rather than to experiential knowledge.
3.6. Ethical Considerations
This study relies exclusively on secondary data drawn from publicly available corporate reports, institutional documentation, published case descriptions, and peer-reviewed academic literature. No primary data were collected from human participants through interviews, surveys, or observation. Accordingly, ethics committee approval was not required. All data sources are cited and attributed in accordance with their respective licensing and access conditions. The authors confirm compliance with the ethical standards for research integrity as outlined by the Committee on Publication Ethics (COPE).
4. Results
This section presents the findings from both components of the study—the PRISMA 2020-compliant systematic review (Section 3.2) and the qualitative cross-case analysis of Ecuadorian organizations (Section 3.3)—in accordance with the methodological protocol established in Section 3. All empirical claims are anchored to the 35 studies in the extraction matrix and the 23 primary documents in the case corpus; the framework sources cited for classification (Potting et al., 2017; Kirchherr et al., 2017) introduce no additional empirical evidence. Interpretation is reserved for the Discussion (Section 5); the present section reports findings factually.
4.1. Systematic Literature Review: Study Selection and Characteristics
4.1.1. Study Selection
The systematic search across Scopus, Web of Science, and the backward snowball search identified 1247 records. After automated and manual duplicate removal, 892 unique records remained. Title and abstract screening, conducted independently by both authors, excluded 715 records that did not meet the CE–IT–CSR intersection criteria. Full-text assessment of the remaining 177 articles led to the exclusion of 142 studies for the following reasons: absence of explicit IT–CE linkage (n = 89), grey literature or non-peer-reviewed status (n = 31), and no extractable empirical or theoretical data (n = 22). The final synthesis comprises 35 peer-reviewed journal articles. The complete selection process is documented in Figure 2.
4.1.2. General Characteristics of Included Studies
All 35 included studies are peer-reviewed journal articles published between 2023 and 2025. The temporal distribution comprises 17 studies published in 2023, 14 in 2024, and 4 in 2025, reflecting the rapidly consolidating nature of IT–CE scholarship. Although the eligibility window opened in January 2018 (Section 3.2.2), no record published before 2023 satisfied all inclusion criteria at full-text assessment; earlier records retrieved by the search were excluded under those criteria.
Geographic distribution by first-author affiliation or study setting reveals a marked concentration in two regions: Asia (n = 14 studies, encompassing India, China, Bangladesh, Pakistan, and Indonesia) and Europe (n = 12, encompassing Spain, Italy, the UK, the Netherlands, and Germany). Latin American studies are scarce (n = 5), distributed across Ecuador, Colombia, Brazil, and Chile. Of these, only three—Quintana et al. (2024), Espinosa-Aquino et al. (2023), and Ospina-Mateus et al. (2023)—include Ecuador within their empirical scope. The remaining four studies adopt global or multi-regional perspectives (e.g., Liu et al., 2023; Pouyamanesh et al., 2023). This distribution confirms a geographic evidence gap in the Latin American context that the present study’s case component addresses but cannot resolve at the population level. Table 5 presents the geographic (Panel A) and methodological (Panel B) distribution of the corpus.
Table 5.
Geographic distribution (Panel A) and methodological distribution (Panel B) of the 35 studies included in the systematic review, organized by first-author affiliation and primary analytical approach. Source: Authors’ extraction matrix.
Methodological distribution across the corpus is heterogeneous. Systematic literature reviews employing PRISMA or equivalent protocols constitute the largest category (n = 12), followed by case studies (n = 8), structural equation modeling and other quantitative approaches (n = 4), multi-criteria decision-making models (n = 4), bibliometric and network analyses (n = 3), mixed methods (n = 2), and conceptual or theoretical contributions (n = 2). This heterogeneity precluded meta-analysis and necessitated the narrative synthesis approach described in Section 3.2.7.
4.1.3. Risk of Bias and Quality Assessment
Application of the critical appraisal protocol (Section 3.2.6; Table 2) yielded a three-tier quality stratification (Table 6). Nine studies were classified as high quality, fully satisfying the transparency and external-validity dimensions of Table 2—for example, through PRISMA-compliant dual screening, SEM analyses with samples exceeding 400 respondents, or MCDM models incorporating sensitivity analysis. Representative high-quality studies include Gallardo-Vázquez et al. (2024), who employed PLS-SEM with n = 777 and n = 165 across two models; Neves et al. (2024), who applied Arellano–Bond GMM estimation to panel data from 20 EU countries; Yazdi et al. (2024), who developed a CE index using FF-WINGS and Bayesian Networks; and Trevisan et al. (2023), who identified 45 barriers across eight dimensions through rigorous multiple case coding. Eighteen studies were classified as moderate quality, and eight as low quality, the latter rated as not satisfied on methodological transparency or external validity—conceptual-only contributions, studies with no explicit methodology, or single-sector reviews offering no basis for generalization.
Table 6.
Quality stratification of the 35 included studies based on methodological transparency, limitations reporting, and external validity criteria. Source: Authors’ appraisal following adapted protocols from Moustafa et al. (2025) and Shamsuzzaman et al. (2025).
Analysis of common limitations across the 35 studies reveals five recurring categories. The most frequent limitation is the absence of self-reported constraints: 12 studies (34.3%) did not include a dedicated statement of limitations and were rated partially or not satisfied on that dimension of Table 2. Geographic or sectoral specificity constraining generalizability was noted in eight studies—for instance, Gallardo-Vázquez et al. (2024) acknowledged restriction to Spanish SMEs, and Despoudi et al. (2023) to the Indian food sector. Exclusion of grey literature was reported in four studies, English-language bias in three, and subjectivity in qualitative coding in three. The consistency check across the studies that test the CSR–CE association reveals uniformly positive results, with no contradictory findings. Gallardo-Vázquez et al. (2024) reported β = 0.893 (p < 0.001) and β = 0.861 across two models, Khan et al. (2023) found positive green technology adoption effects on sustainable supply chain performance, and Esposito et al. (2023) detected significant CE disclosure effects associated with board diversity (p < 0.01). The absence of null or negative results across high-quality studies strengthens the reliability of the CSR–CE linkage, though it also raises the possibility of publication bias toward positive findings.
4.1.4. Narrative Synthesis
Finding 1: Theoretical Frameworks—From Basic 5R to Advanced Taxonomies
Nineteen of the 35 studies (54%) explicitly reference or operationalize circular economy principles beyond the basic 3R/5R model. Two typologies dominate this group. The R0–R9 ladder (Potting et al., 2017; Kirchherr et al., 2017) is applied by Quinto et al. (2025), who used nine R-strategies in e-waste multi-criteria decision-making; by Nazir and Doni (2024), who integrated R0–R9 principles with the SDGs in integrated reporting; and by Santiago et al. (2024), who extended the CE–CSR nexus to Industry 5.0. The 60R typology of Uvarova et al. (2023), which catalogues sixty R-principles in four groups (reduce, reuse, recycle, reverse logistics), is the most granular inventory of business-level circular practices in the corpus. A minority of studies (n = 6) continue to rely on basic 3R/5R formulations without refinement, including Espinosa-Aquino et al. (2023) and Ouro-Salim (2024). The evidence supports high certainty that advanced multi-R typologies are methodologically superior for empirical work, though low certainty persists regarding which R-strategies dominate in IT-specific contexts—only four studies (Nazir & Doni, 2024; Quinto et al., 2025; Santiago et al., 2024; Tutore et al., 2024) map digital technologies to particular R-levels.
Finding 2: Drivers and Barriers for IT–CE Integration
Seven quantitative studies in the corpus bear on the CSR–CE relationship (Gallardo-Vázquez et al., 2024; Khan et al., 2023; Esposito et al., 2023; Neves et al., 2024; Mondal et al., 2023; Magnano et al., 2024; Yazdi et al., 2024). Four of them test the association directly, and all four report statistically significant positive effects: Gallardo-Vázquez et al. (2024) provide the only path coefficient for the CSR→CE link (β = 0.893, p < 0.001, estimated in their sample of 777 Spanish SMEs); Khan et al. (2023) demonstrated that green technology adoption positively predicts sustainable supply chain performance; Esposito et al. (2023) found that corporate governance diversity—specifically, gender composition on boards and CSR committees—increases CE disclosure (p < 0.01); and Neves et al. (2024) showed, with panel data from 20 EU countries, that policy and economic drivers raise e-waste recycling rates. The remaining three (Mondal et al., 2023; Magnano et al., 2024; Yazdi et al., 2024) do not estimate the association but are consistent with it in direction. No high-quality study in the extraction matrix reports a negative or null CSR–CE effect. The certainty of this finding, which concerns the international evidence base and not the Ecuadorian cases, is rated as high.
The barrier landscape is well documented. Trevisan et al. (2023) identified 45 barriers distributed across eight dimensions (technical, financial, regulatory, cultural, organizational, informational, market, and supply chain). Debnath et al. (2023) confirmed that high initial investment costs and insufficient legislative support constitute the dominant constraints in emerging economies—a finding directly echoed in Ecuadorian conditions by Quintana et al. (2024), who reported insufficient government resources and limited private investment as primary obstacles to reverse logistics. Hariyani et al. (2024) added socio-technical barriers specific to IT-enabled CE: data privacy, system interoperability, and the digital divide. The certainty of evidence for barrier taxonomies is rated as moderate—the taxonomies are well structured but not quantitatively weighted across sectors or geographies.
Enabler analysis reveals a stacking pattern (Figure 4). Bhattacharjee et al. (2023) identified market orientation and cross-functional team capacity as dominant success factors. Mondal et al. (2023) highlighted organizational coordination and top management commitment as technical enablers. Neri et al. (2023a) demonstrated that digital technologies (Big Data, IoT, Cloud) enable the transition of SMEs to the CE, and Purushothaman et al. (2025) reported that 73.67% of recent CE literature (2018–2024) identifies financial support and human capital as prerequisites for circular transitions. The certainty for enabler stacking is rated as low: only four studies (Bhattacharjee et al., 2023; Mondal et al., 2023; Neri et al., 2023a; Purushothaman et al., 2025) provide hierarchical enabler models, and none has been validated in Latin America.
Figure 4.
Thematic network diagram synthesizing the evidence structure across 35 studies, organized by barriers, enablers, metrics, and geographic context with study frequency counts per sub-theme. Source: Authors’ synthesis from extraction matrix.
Finding 3: Geographic and Sectoral Patterns
The geographic concentration of evidence produces external validity concerns that are not merely numerical. Twenty-six of 35 studies (74%) originate from European or Asian contexts (Table 5; Table 7 contrasts the two contexts), where regulatory frameworks, data infrastructure, and formal recycling systems differ substantially from Latin American conditions. The five Latin American studies reveal a distinct empirical landscape: Quintana et al. (2024) and Espinosa-Aquino et al. (2023) both document the absence of official e-waste databases in Ecuador and the region, a data-infrastructure limitation largely absent from European studies, where Eurostat panel data are standard (Neves et al., 2024). Ospina-Mateus et al.’s (2023) bibliometric mapping confirms that Brazil accounts for the majority of Latin American CE publications, with stagnation in interdisciplinary collaboration across the region. Sectoral bias is equally pronounced: 23 studies (66%) focus specifically on manufacturing, electronics, or e-waste. Only four address IT as a primary service sector: Medaglia et al. (2024) in digital government, Ali et al. (2024) in SDG-linked IT, Tutore et al. (2024) in AI-enabled business models, and Khan et al. (2023) in green technology adoption. No study in the extraction matrix examines a pure IT service company applying circularity indices to its own operations.
Table 7.
Conceptual contrast matrix comparing the evidence base characteristics between Global North and Latin American contexts across six analytical dimensions. Source: Authors’ synthesis from extraction matrix, with specific anchors from Quintana et al. (2024), Espinosa-Aquino et al. (2023), Neves et al. (2024), and Hariyani et al. (2024).
Finding 4: Digital Enablers and Circularity Metrics
Four studies provide substantive evidence on the role of digital technologies as CE enablers. Neri et al. (2023a) demonstrated through rigorous interview coding that Big Data, IoT, and cloud computing serve as enabling infrastructure for circular practices in Italian SMEs. Tutore et al. (2024) found, through a PRISMA-based SLR of 63 articles, that artificial intelligence redesigns business models toward circular configurations, specifically loop and share models. Ali et al. (2024) proposed a four-step hierarchy linking digital technologies to SDG acceleration, and Khan et al. (2023) provided SEM evidence that green technology adoption positively predicts sustainable supply chain outcomes. The certainty of evidence for digital enablers is rated as moderate: the qualitative consensus is strong, but longitudinal validation and cross-regional replication are absent.
Circularity metrics remain the weakest link in the evidence base. Only Yazdi et al. (2024) provide a formal Circular Economy Index (CE index = 2.8036, with a correlation of 0.9790 between FF-WINGS and Bayesian Network methods), developed in a UK manufacturing context. Farjana et al. (2023) offer Life Cycle Assessment KPIs (treatment costs, 50% collection efficiency benchmarks) derived from e-waste data in Victoria, Australia. Liu et al. (2023) supply a global baseline: 53.6 million tonnes of e-waste generated in 2019, of which only 17.4% was formally collected and recycled. No study in the extraction matrix applies these or any other quantitative circularity metrics to an IT service company. The certainty of evidence for the applicability of CE metrics to the IT sector is rated as low.
4.1.5. Reporting Biases
Five categories of reporting bias affect the evidence base. Geographic bias is the most consequential: 74% of studies originate from Europe or Asia, limiting transferability to Latin American institutional contexts, where data infrastructure, regulatory maturity, and the informal economy operate under fundamentally different conditions. Methodological bias is reflected in the quantitative–qualitative imbalance: only 10 studies (29%) employ inferential or algorithmic quantitative methods (SEM, panel regression, MCDM, mixed designs; Table 5), while the remainder are qualitative or descriptive systematic reviews. This imbalance prevents effect-size pooling and meta-analytic synthesis. Publication bias toward positive results is a plausible concern: no study reports a negative or null CSR–CE association, which may reflect genuine positive effects or selective publication of confirmatory findings. Temporal bias is notable: all 35 included studies were published in 2023–2025, meaning that earlier (pre-2023) work is not represented in the final synthesis. Language bias is present: all 35 studies are English-language publications, excluding potentially relevant work in Spanish, Portuguese, or Chinese—a limitation acknowledged by Hariyani et al. (2024) and Moustafa et al. (2025).
4.1.6. Certainty of Evidence Summary
The adapted GRADE assessment yields the following certainty levels across six thematic domains (Table 8; Table 9 summarizes the related findings, study counts, and gaps). The CSR–CE positive relationship is rated as high certainty: the four studies that test it report consistent, significant positive effects, the one path coefficient available is large (β = 0.893; Gallardo-Vázquez et al., 2024, n = 777), and no high-quality study reports a contradictory finding—although the estimate itself comes from a single country. Barrier taxonomies are rated as moderate certainty: the structures are well developed (45 barriers, eight dimensions) and replicable across sectors, but lack quantitative weighting. Digital enablers (IoT, AI, Cloud) for CE are rated as moderate certainty: strong qualitative consensus exists across four rigorous studies, but longitudinal and cross-regional validation is absent. CE metrics and indices are rated as low certainty: formal instruments exist but have not been applied to IT services. Latin American and Ecuador-specific findings are rated as low certainty: only three peer-reviewed studies address Ecuador, with small samples (n = 7 interviews in Quintana et al., 2024). IT sector-specific evidence is rated as very low certainty: only four studies address IT as a primary sector, none applies quantitative circularity indices, and three of the four are qualitative or conceptual.
Table 8.
Certainty of evidence summary across six thematic domains, assessed using an adapted GRADE framework based on study quality, consistency, directness, and precision of findings. Source: Authors’ assessment from the extraction matrix of 35 studies.
Table 9.
Summary of findings across seven thematic domains, reporting key findings with citations, study counts, cross-study consistency, GRADE certainty ratings, and identified gaps. Source: Authors’ synthesis from the extraction matrix of 35 studies.
4.2. Cross-Case Analysis of Ecuadorian Organizations
4.2.1. Overview of the Case Portfolio
The case selection protocol (Section 3.3.2) identified seven organizational cases from an initial pool of 45 candidate organizations screened against the four inclusion criteria (Figure 5). Of these, 28 were retained after initial relevance screening for IT–CE alignment, and seven met the full eligibility requirements for data completeness, documented CE component, operational presence in Ecuador, and temporal scope (2015–2024). The final portfolio comprises four multinational corporation cases (HP Movilabs, OPTEX Remanufacturing, IBM 7-for-1, SANOFI-Reuse) and three Ecuadorian startup cases (TramaQuito and associated ecosystem, La Máquina, Vortex Ecological Clothing). Public–private partnerships (UCE–UCES academic collaborations, SENPLADES–DINTEL platforms, CNEL–CELEC energy-IT agreements) are embedded as analytical sub-units within the cases rather than treated as standalone entities, because they function as governance mechanisms enabling the primary organizational initiatives.
Figure 5.
PRISMA-style flow diagram for the case selection process, reporting the screening and eligibility stages from 45 candidate organizations to 7 included cases. Source: Authors’ case selection records.
4.2.2. Within-Case Thematic Coding Results
Application of the hybrid deductive–inductive codebook to the 23 primary documents yielded coding results organized by the four deductive code families and three emergent inductive themes (Table 10). Within the seven formal organizational cases, the CE Principle mappings reported in Table 3 show R8 Recycle in three cases (HP Movilabs, IBM 7-for-1, and La Máquina), R3 Reuse in two cases (SANOFI-Reuse and IBM 7-for-1), R6 Remanufacture in OPTEX, R2 Reduce in HP Movilabs and Vortex, R1 Rethink and R7 Repurpose in TramaQuito, R5 Refurbish in Vortex, and R9 Recover in SANOFI-Reuse and La Máquina. These mappings indicate a concentration in downstream and mid-loop strategies, while higher-order strategies are less frequent and generally lack quantitative metrics. The SRI documentation forms part of the contextual documentary corpus but is not treated as one of the seven formal organizational cases.
Table 10.
Selected code frequency and coverage across the seven formal organizational cases, reporting deductive and inductive code distributions with representative data points. Source: Authors’ NVivo coding of 23 primary documents.
The Barriers code family revealed three recurrent obstacles. Regulatory gaps were identified in five of seven cases, manifesting as the absence of clear policies for responsible IT recycling, unregulated e-waste disposal channels, and the lack of government-sponsored incentives for circular practices. Informal sector competition was documented in three cases, particularly in La Máquina’s waste management operations, where informal recyclers (recicladores) operate as both competitors and unrecognized contributors to the e-waste recovery chain. The most pervasive finding in the barrier analysis is metric absence: none of the seven cases employs a formal circularity index, CE performance indicator, or standardized environmental accounting framework to quantify its circular outcomes. Environmental metrics exist (tonnes recycled, kilograms reused, cubic meters of wood avoided) but are reported in ad hoc formats without standardization across cases or alignment with the indices available in the literature (e.g., Yazdi et al., 2024: CE index = 2.8036).
Among enablers, public–private partnerships were documented in six of seven cases, functioning as institutional substitutes where formal regulatory mechanisms are absent. The CNEL–CELEC agreements with international technology partners, SENPLADES–DINTEL’s cloud platform development with private companies, and the ICT Sectoral Council’s presidential programs (Knowledge, Full Steam Ahead, Connect Equality) represent distinct partnership modalities that channel IT resources toward social inclusion and technological sustainability. Institutional commitment sustained over five or more years was identified in four cases, the most notable being the UCE–UCES academic–practitioner collaboration, which has operated continuously since 2000. IT culture and training programs were explicitly mentioned in three cases, though none reported structured training outcomes or competency metrics.
4.2.3. Cross-Case Synthesis: Pattern Matching
Cross-case synthesis following Yin’s (2018) replication logic and the case-ordered matrix approach of Trevisan et al. (2023) yielded three cross-cutting patterns.
Pattern 1: Institutional Duality. Literal replication across the four MNC cases shows that multinational corporations document formalized CE metrics (tonnes, units, percentages, equipment counts), embedded strategic integration within annual corporate responsibility reporting cycles, and a multi-stage circular scope that extends beyond recycling to reuse, remanufacturing, and recovery. Theoretical replication across the three startup cases reveals a contrasting pattern: emergent CE practices without formal quantification, project-based and improvised strategic positioning rather than annual planning integration, and a narrow documented scope—typically one or two R-strategies per project, without quantified outcomes. The MNC stratum reports through structured corporate CSR documentation, while the startup stratum communicates impact through social media, pitch competitions, and innovation program portfolios. This institutional duality is consistent across all seven cases and constitutes the most robust finding of the cross-case analysis. Because both strata are observed exclusively through the documents they produce, it is, strictly speaking, a duality of documented practice; the extent to which it reflects operational reality is examined in Section 5.1.
Pattern 2: Enabler Stacking. Successful IT–CE integration in the Ecuadorian context requires the simultaneous presence of three conditions, none of which is individually sufficient (Figure 6). First, regulatory bridging through public–private partnerships compensates for weak formal governance: CNEL–CELEC agreements, SENPLADES–DINTEL cloud platforms, and presidential ICT programs each perform functions that established regulatory frameworks would otherwise provide. Second, temporal persistence—sustained institutional commitment exceeding five years—appears necessary for circular practices to become embedded rather than episodic: the UCE–UCES collaboration (active since 2000) and HP’s two-year Movilabs project represent opposite ends of this continuum, with the longer-duration partnerships exhibiting deeper institutional integration. Third, cultural infrastructure in the form of IT responsibility training and awareness programs supports adoption at the organizational level, though this condition is the least empirically documented across the case portfolio (present in only 3 of 7 cases). The absence of any single factor appears to impede integration, a pattern observable in cases where strong partnerships exist (CNEL–CELEC) but temporal persistence or cultural infrastructure is limited.
Figure 6.
Conceptual framework illustrating the enabler stacking pattern for IT–CE integration in weak regulatory environments, derived from cross-case synthesis of seven Ecuadorian organizational cases. Literature anchors are indicated for each enabler level: Level 1, Medaglia et al. (2024) and Esposito et al. (2023); Level 2, Trevisan et al. (2023); Level 3, Mondal et al. (2023) and Bhattacharjee et al. (2023). Source: Authors’ elaboration.
Pattern 3: Metric Asymmetry. Environmental metrics dominate the case portfolio, with documented examples including recycled materials, reused components, cubic meters of wood avoided, and equipment units diverted from disposal. Social metrics are documented in a subset of cases: HP Movilabs reports digital inclusion outcomes (12 schools, free access to technology classrooms), SANOFI-Reuse reports equipment donations to social institutions (150 units), and several startup initiatives report community engagement activities without quantification. Economic metrics represent the most significant gap: no case reports return on investment, cost savings from circular practices, cost per unit of recycled material, or any other financial performance indicator linked to ITSR–CE activities. The economic dimension is therefore not under-documented but absent (7/7 cases), which means that Proposition 2 cannot be assessed with the case evidence. Circularity indices are entirely absent: none of the seven cases employs the CE index developed by Yazdi et al. (2024) or the LCA-based KPIs proposed by Farjana et al. (2023), despite the documented availability of these instruments in the literature (Table 11). The global benchmark of 53.6 million tonnes of e-waste generated in 2019, with only 17.4% formally collected (Liu et al., 2023), provides a reference against which the Ecuadorian cases cannot be quantitatively compared owing to the absence of standardized national data, a limitation confirmed by Espinosa-Aquino et al. (2023).
Table 11.
Comparative analysis of Ecuadorian case findings against international literature benchmarks across five domains, identifying specific methodological and empirical gaps. Source: Authors’ cross-case synthesis mapped to the extraction matrix.
4.2.4. ReSOLVE Framework Mapping
Each case was mapped to the ReSOLVE framework actions its documented practices instantiate (Table 12). The Loop action (recycled components reintroduced into new products) is embodied by HP Movilabs, whose 40-foot modular containers constructed from recycled computer parts represent a closed-loop material flow. The Regenerate action (local resource recovery reducing transport emissions) is mapped to OPTEX’s remanufacturing plant, which replaced the practice of exporting vehicle parts for international destruction with local processing. The Share action (collaborative resource distribution through volunteer networks) is mapped to IBM’s seven-program donation and collection ecosystem. The Virtualize action (replacing physical infrastructure with digital solutions) corresponds to SENPLADES–DINTEL’s cloud platform development, which reduces the need for physical IT infrastructure in public institutions. The Exchange action (replacing ownership with access through donation programs) is mapped to SANOFI-Reuse’s extended producer responsibility model. The Optimize action (data-driven decision-making for CE performance) is mapped to the UCE–UCES KPI systems, though the optimization is institutional rather than technology-mediated. The Regenerate and Virtualize actions are the least documented across the case portfolio, indicating areas where the Ecuadorian ITSR ecosystem has not yet achieved the strategic depth observed in Global North contexts.
Table 12.
Mapping of case practices and embedded partnership sub-units to ReSOLVE framework actions, with identified CE mechanisms and supporting literature anchors. Source: Authors’ elaboration based on Gallardo-Vázquez et al. (2024) and the Ellen MacArthur Foundation (2015) framework.
Figure 7 summarizes the cross-stratum contrast across five dimensions using ordinal scores (0–4) assigned by the authors to each stratum from the coded evidence in Table 3 and Table 10: 0 = absent in all documents; 1 = mentioned or aspirational only; 2 = emergent practice, present but non-quantified in at least one case; 3 = formalized and quantified in at least one case but not standardized across the stratum; 4 = formalized, quantified, and documented in all cases of the stratum. The multinational stratum scores 4 on strategic formalization, R-strategy breadth (number of distinct R-strategies with documented outcomes), and governance and partnerships, and 3 on circularity metrics and digital enablement; the startup stratum scores 2 on R-strategy breadth, governance and partnerships, and digital enablement, and 1 on strategic formalization and circularity metrics. The largest gap (Δ = 3) is in strategic formalization and the smallest (Δ = 1) in digital enablement. The circularity-metrics dimension refers to the quantification of environmental outputs; composite circularity indices are absent in both strata (Table 11), and the scores describe documented practice rather than underlying performance (Section 3.3.2).
Figure 7.
Circular economy maturity profiles of multinational corporation cases (n = 4) and Ecuadorian startup cases (n = 3) across five analytical dimensions: (a) radar profile by stratum; (b) scores and inter-stratum gap (Δ) by dimension. Ordinal scores (0–4) were assigned by the authors from the coded evidence in Table 3 and Table 10 using the rubric stated in the text (0 = absent; 1 = mentioned only; 2 = emergent, non-quantified; 3 = formalized and quantified in at least one case; 4 = formalized, quantified, and documented across the stratum). Scores describe documented practice, not underlying performance. Source: Authors’ elaboration from cross-case synthesis.
4.3. Summary of Results
The dual-component analysis yields five principal findings. First, the CSR–CE positive relationship is well established across the international evidence base, with high certainty: the four studies that test the association report consistent positive effects, and the one available path coefficient is large (β = 0.893, Gallardo-Vázquez et al., 2024), though its magnitude has not been replicated in Latin American or IT-specific contexts and was not estimated in the present study. Second, the geographic and sectoral biases in the literature are severe: 74% of the evidence originates from Europe and Asia, manufacturing and e-waste dominate, and IT services are virtually absent as a unit of analysis. Third, the Ecuadorian case analysis reveals an institutional duality in which multinational corporations demonstrate formalized CE metrics and strategic planning integration while domestic startups exhibit emergent circular practices without quantification or governance structures for scaling. Fourth, successful IT–CE integration in Ecuador depends on an enabler stacking pattern requiring the simultaneous presence of public–private partnerships, sustained institutional commitment, and IT culture training—conditions whose absence impedes integration even when individual enablers are present. Fifth, a metric asymmetry characterizes the entire case portfolio: environmental outputs are documented, social outcomes are partially reported, economic indicators are absent, and circularity indices have not been applied, despite the availability of validated instruments in the international literature.
Against the two propositions stated in Section 1, the evidence is asymmetric. Proposition 1 is supported within the limits of documentary evidence: the four cases with formal planning integration are the only ones that report documented environmental outputs—quantified at HP Movilabs (2000 kg of recycled components; 370 m3 of wood avoided), SANOFI-Reuse (150 units donated; 1000 devices recycled), and IBM 7-for-1 (material recovery and seven donation programs), and described operationally at OPTEX (local remanufacturing replacing export for destruction)—and two of them also report quantified social outcomes (12 schools at HP Movilabs; 150 donated units at SANOFI-Reuse), whereas the three cases without such integration report community engagement without quantification. Because the indicator of integration and the indicator of outcomes are read from the same documents, this support is an association within documentary records rather than between practice and outcome (Section 3.3.2). Proposition 2 is untested: no case reports any economic indicator, so the claim that ITSR–CE integration improves competitiveness can be neither supported nor rejected with these data. The universal absence of economic measurement is itself the finding, and it is carried forward as such into the Discussion.
5. Discussion
The dual-component analysis conducted in this study—a PRISMA-compliant systematic review of 35 studies and a cross-case analysis of seven Ecuadorian organizations—yields five principal findings that collectively address the central research question: how companies in Ecuador can integrate IT social responsibility projects into their corporate strategy through circular economy practices. This section situates each finding within the broader literature, proposes explanatory mechanisms, questions alternative interpretations, and embeds relevant limitations alongside the findings they affect, following the recommendation that methodological constraints be discussed where they are analytically consequential rather than relegated to a closing paragraph.
5.1. Institutional Duality: Formalized Versus Emergent Circularity
The most robust pattern emerging from the cross-case synthesis is the institutional duality between multinational corporation programs and domestic startup initiatives. MNCs operating in Ecuador—HP, IBM, SANOFI, and OPTEX—exhibit formalized CE metrics (tonnes recycled, equipment units donated, cubic meters of wood avoided), structured reporting through corporate sustainability documentation, and lifecycle-spanning circular strategies that map to multiple levels of the R0–R9 ladder. Ecuadorian startups—TramaQuito, La Máquina, Vortex—operate with emergent, non-quantified circular practices, project-based strategic positioning, and a narrow documented scope of one or two R-strategies per project. In capability terms (Section 2.4), the two strata sense the same opportunity but differ in seizing and, above all, in transforming: the multinational programs are carried by budgets, reporting cycles, and partnership routines that make circular activity a continuing part of the organization, while the startups’ activity remains tied to the project or competition that funded it.
This finding aligns with the maturity differential that Nazir and Doni (2024) documented across multinational textile companies, where corporate report analysis revealed systematic R0–R9 integration linked to SDG achievement. The alignment is instructive but also reveals a boundary: Nazir and Doni’s subjects were European luxury brands with decades of sustainability reporting infrastructure, whereas the Ecuadorian MNC cases operate as branch programs of global corporations, not as locally governed entities. The formalization observed in HP Movilabs or SANOFI-Reuse is imported from global corporate governance structures, not generated by the Ecuadorian institutional environment. This distinction matters for policy: the presence of formalized CE metrics in Ecuador does not signal the maturation of domestic institutional capacity—it signals the transplantation of foreign governance mechanisms into a context that has not yet developed its own.
A rival explanation deserves consideration, and it is the single most important qualification of the findings reported in this article. The metric asymmetry between MNCs and startups could reflect not a governance gap but a reporting-incentive gap: MNCs report recycling tonnages and donation figures because global stakeholders demand this information, while startups—which answer to local communities, pitch judges, and small-scale investors—face no equivalent accountability pressure. If this interpretation is correct, then part of the duality observed is an artifact of reporting infrastructure rather than of operational reality. The evidence assembled here cannot adjudicate between the two explanations, because every case is observed through the documents the organization itself produced. Corporate sustainability reports may overrepresent formalized practices, presenting public-relations narratives as operational achievements, while startup portfolios may underrepresent genuine circular activity that lacks the resources for formal documentation. The scores in Figure 7 should therefore be read as bounds on actual circular practice: the startup stratum’s scores as a lower bound and the MNC stratum’s as an upper bound. Direct organizational interviews and site observation—explicitly excluded from the present design—are the only means of disentangling reporting behavior from operational reality, and Section 5.9 places them first among the research priorities. Moustafa et al.’s (2025) finding that all 38 studies in their PRISMA review focused on environmental dimensions—with economic and social impacts underrepresented—suggests that this measurement bias extends well beyond the Ecuadorian context.
5.2. The Enabler Stacking Mechanism: Why Single Interventions Are Insufficient
The fourth finding summarized in Section 4.3—that successful IT–CE integration requires the simultaneous presence of public–private partnerships, sustained institutional commitment, and IT culture training—extends the enabler literature in a direction that existing studies gesture toward but do not formalize. Bhattacharjee et al. (2023) identified market orientation and cross-functional teams as dominant success factors; Mondal et al. (2023) highlighted organizational coordination and top management; Neri et al. (2023a) demonstrated that digital technologies enable SME circular transitions; and Purushothaman et al. (2025) reported that nearly three-quarters of recent CE literature identifies financial support and human capital as prerequisites. Each of these studies isolates individual enablers. The Ecuadorian evidence reveals that these factors operate not independently but as a stacked configuration: the presence of any single enabler without the others does not produce integration.
The mechanism can be articulated through institutional theory. Quintana et al. (2024) documented that Ecuador’s regulatory environment for reverse logistics is characterized by insufficient government resources and limited private investment. In this context, public–private partnerships—CNEL–CELEC energy agreements, SENPLADES–DINTEL cloud platforms, the ICT Sectoral Council’s presidential programs—perform a regulatory substitution function, filling institutional voids (Esposito et al., 2023; Medaglia et al., 2024) that prevent CE adoption from proceeding through standard compliance channels. The substitution is necessary but not sufficient: without temporal persistence (exemplified by the UCE–UCES collaboration operating since 2000), partnerships remain episodic interventions that fail to embed circular practices within organizational routines. Without cultural infrastructure—IT responsibility training, digital literacy programs, awareness campaigns—the partnerships and commitments exist as governance architecture without operational substance. Gallardo-Vázquez et al.’s (2024) finding that stakeholder pressure mediates the CSR–CE linkage (β = 0.861, p < 0.001) provides the statistical counterpart to this qualitative pattern: the quality and sustained intensity of stakeholder engagement, not its mere existence, determine whether CSR activities translate into measurable circular outcomes.
The enabler stacking pattern is consistent with findings from other developing economy contexts. Debnath et al.’s (2023) identification of high initial investments and legislative support deficits as top barriers in emerging economies describes the same structural conditions that necessitate stacking in Ecuador. The absence of validated enabler-stacking models in Latin America—a gap noted in the systematic review, where none of the four hierarchical enabler studies (Bhattacharjee et al., 2023; Mondal et al., 2023; Neri et al., 2023a; Purushothaman et al., 2025) address the region—means that this finding represents a preliminary conceptual contribution rather than a confirmed theoretical proposition. An important limitation applies: the stacking pattern was identified through qualitative cross-case comparison across seven cases, a sample that permits pattern identification but not statistical generalization. Whether the three conditions are truly necessary (as opposed to merely frequently co-occurring) and whether their interaction is multiplicative (as the stacking metaphor implies) or additive are questions that require quantitative testing that the present design cannot provide.
5.3. The Metric Vacuum: Environmental Documentation Without Circularity Assessment
The fifth finding—that environmental outputs are documented across the case portfolio while formal circularity indices remain absent—exposes what is perhaps the most actionable gap identified in this study. The international literature offers validated instruments: Yazdi et al.’s (2024) CE index (2.8036, with a 0.9790 correlation between FF-WINGS and Bayesian Networks), Farjana et al.’s (2023) LCA-based KPIs for e-waste treatment, and Liu et al.’s (2023) global baseline of 53.6 million tonnes of e-waste with 17.4% formal collection efficiency. The Ecuadorian cases report case-specific outputs such as reused components (HP: 2000 kg) and equipment donations (SANOFI: 150 units), but these figures exist in isolation, without standardized benchmarking, temporal trend analysis, or conversion into the composite indices that the field recognizes for comparative assessment.
The explanation for this metric vacuum is likely multi-causal. First, the circularity index instruments developed in the literature have been calibrated for manufacturing and hardware e-waste contexts, not for IT service delivery or technology donation programs; their direct application to the Ecuadorian cases would require adaptation that has not been undertaken. Second, the absence of official national e-waste databases in Ecuador—a structural limitation documented by both Quintana et al. (2024) and Espinosa-Aquino et al. (2023)—deprives organizations of the denominator data necessary for calculating collection efficiency, recovery rates, or circularity ratios. Third, the startups in the case portfolio lack the technical capacity and resources to implement sophisticated CE assessment tools, a constraint that Debnath et al. (2023) identified as characteristic of emerging economies. The implication is that metric development for the IT–CE nexus in Latin America requires not only methodological innovation (adapting existing indices to IT service contexts) but also institutional investment in national data infrastructure. Without both, the metric asymmetry will persist regardless of how many circular initiatives operate on the ground.
Economic metrics constitute the most conspicuous absence, and this absence is a finding rather than a gap in data collection. No case in the portfolio reports return on investment, cost savings attributable to circular practices, or any financial performance indicator linked to ITSR activities. This pattern is not unique to Ecuador: Moustafa et al. (2025) found that economic indicators were underrepresented across 38 CE studies globally, and Farjana et al. (2023) noted that treatment costs and efficiency are the primary KPIs in e-waste research, with broader economic analysis remaining rare. For Proposition 2, the consequence is unambiguous. The claim that integrating ITSR into annual planning improves competitiveness is theoretically grounded in Gallardo-Vázquez et al.’s (2024) CSR–CE pathway and in the organizational benefits that Loeser et al. (2017) attribute to Green IS strategies, but it receives no direct economic evidence from the Ecuadorian cases; it can be neither supported nor rejected with these data. The competitiveness effect is therefore advanced here as a proposition for future research rather than as a finding, and the universal absence of financial measurement is reported in its place as a substantive result: organizations that do not measure the economic returns of their circular IT initiatives cannot defend those initiatives in the budget negotiations of which annual planning consists—a plausible, untested mechanism for the marginalization described in Section 1.
5.4. The Informal Sector Blind Spot
A finding that emerged during the cross-case analysis but was not anticipated by the theoretical expectations E1–E3 deserves attention: none of the seven Ecuadorian cases formally integrates informal recyclers (recicladores informales) into its CE value chain. This omission is notable because Espinosa-Aquino et al. (2023) identified informal recyclers as vital providers in Latin American e-waste networks, and Ouro-Salim (2024) documented that urban mining and collection logistics depend heavily on informal actors in emerging economies. The Ecuadorian startup La Máquina works with municipalities, universities, companies, and NGOs, but the documentation does not indicate formal recognition of, or structured partnerships with, the informal recycling workforce.
This blind spot creates both an analytical limitation and a practical concern. Analytically, the ReSOLVE mapping conducted in Section 4.2.4 may undercount the actual circularity of the Ecuadorian ecosystem by excluding the informal sector’s material recovery contributions—which in Latin American contexts can exceed formal collection rates. Practically, the exclusion of informal actors from ITSR governance structures risks perpetuating the power imbalances that the social circular economy literature has identified as a persistent barrier in developing countries. The social dimensions of CE—dignified work, health, education, community participation—remain theoretically valued but operationally marginal across the case portfolio. This pattern aligns with the broader evidence gap identified in the systematic review: social indicators appear in only 10 of the 38 studies reviewed by Moustafa et al. (2025), and the certainty of evidence for IT sector-specific findings is rated as very low in our adapted GRADE assessment.
5.5. The CSR–CE Pathway: Agreement, Divergence, and Boundary Conditions
The systematic review’s most robust finding—that CSR practices are consistently and positively associated with CE adoption, with one large path coefficient (β = 0.893) reported for Spanish SMEs—receives partial support from the Ecuadorian case evidence. The MNC cases are consistent with the pathway: HP’s Movilabs initiative and IBM’s 7-for-1 program are CSR-motivated investments that report documented circular outcomes mapped to R2–R9 strategies. The direction of the association—CSR investment accompanied by measurable CE practice—is observable in these cases. The effect size cannot, of course, be assessed qualitatively.
The divergence lies in context. Gallardo-Vázquez et al.’s (2024) findings derive from 777 Spanish SMEs operating within the EU Circular Economy Action Plan, a mature regulatory environment where CSR reporting is increasingly mandated and CE infrastructure is publicly subsidized. The Ecuadorian context lacks both elements. Gallardo-Vázquez et al.’s second finding—that stakeholder pressure mediates the CSR–CE relationship—is instructive here: in Spain, stakeholder pressure includes regulatory enforcement, consumer expectations shaped by decades of environmental policy, and industry associations promoting CE standards. In Ecuador, stakeholder pressure operates through fundamentally different channels: international corporate headquarters impose sustainability requirements on local branches, NGOs and universities provide collaborative infrastructure, and community expectations for digital inclusion create demand-side pull. The CSR–CE pathway exists in both contexts, but the mediating mechanisms differ structurally. The Spanish coefficients—however robust—should therefore not be extrapolated to predict Ecuadorian outcomes without controlling for institutional context. Researchers seeking to weigh these cross-context differences quantitatively could employ multi-group SEM or fuzzy-set qualitative comparative analysis (fsQCA) with institutional maturity as a moderating condition—a methodological step that no study in the extraction matrix has attempted but that the present findings empirically motivate.
Khan et al.’s (2023) finding that green technology adoption positively predicts sustainable supply chain performance in Pakistani SMEs is contextually closer to the Ecuadorian case and partially corroborative: both contexts feature developing economies with limited regulatory infrastructure and reliance on organizational-level initiative. The difference is methodological: Khan et al. employed SEM with 435 respondents, while the present study uses qualitative case analysis. Replicating Khan et al.’s quantitative approach in an Ecuadorian IT context would constitute a substantial extension of the evidence base.
Evidence accumulating after the review window strengthens this external validity assessment. Hoang (2026) reported, for 165 Vietnamese manufacturing SMEs, that stakeholder pressure improves sustainable performance through a sequential mediation in which CSR drives the adoption of CE practices—replicating the direction of the Gallardo-Vázquez et al. (2024) pathway in an emerging-economy institutional environment. That the pathway now holds in European and Southeast Asian samples increases confidence in its structural character, but it also underscores the persistent absence of Latin American estimates: no comparable structural model has yet been fitted to Andean data, and the present study’s qualitative evidence cannot substitute for one.
5.6. Theoretical Implications
This study contributes to three theoretical domains. First, it extends the operationalization of the R0–R9 ladder (Potting et al., 2017) and the 60R typology (Uvarova et al., 2023) by mapping specific organizational practices to R-strategies with documented metrics in a Latin American context. The mapping reveals that quantified circular outcomes in the Ecuadorian ITSR ecosystem fall within the R2–R9 range (Reduce through Recover), that R0 Refuse is absent from the portfolio and R1 Rethink appears only in startup project descriptions without empirical operationalization, and that reverse logistics—the fourth group of the 60R typology—operates largely through informal channels that no case formally governs. This R-strategy distribution differs from the European patterns documented by Nazir and Doni (2024), where multinational corporations integrate R0–R9 systematically, and suggests that CE maturity in emerging IT markets follows a bottom-up trajectory—from basic recycling toward higher-order strategies—rather than the top-down strategic planning approach observed in mature markets.
Second, the enabler stacking pattern contributes to institutional theory as applied to CE transitions. The existing literature treats institutional voids (Esposito et al., 2023; Medaglia et al., 2024) as static conditions that public–private partnerships fill. The Ecuadorian evidence suggests a more dynamic mechanism: partnerships create initial governance infrastructure, temporal persistence converts this infrastructure into embedded organizational routines, and cultural training generates the human capital necessary for operational execution. This three-stage model—substitution, institutionalization, operationalization—refines the binary understanding of institutional voids as either present or absent, proposing instead a graduated filling process that unfolds over years.
Third, the metric asymmetry finding challenges the implicit assumption in the CE literature that circular outcomes are universally quantifiable using existing instruments. The absence of CE indices in the Ecuadorian cases is not merely a data limitation; it reflects a fundamental misfit between the instruments available (designed for European manufacturing) and the practices observed (IT donation programs, digital inclusion initiatives, e-waste recovery in contexts without national databases). Santiago et al.’s (2024) CE–CSR framework for Industry 5.0 and Chabowski et al.’s (2023) Product-as-Service models assume measurement infrastructure that developing IT ecosystems do not possess. The field requires context-sensitive circularity metrics calibrated for IT services in emerging economies—an instrument-development challenge that the present study identifies but cannot resolve.
The dynamic capabilities perspective sharpens this theoretical contribution. The institutional duality documented across the seven cases is consistent with the microfoundational account advanced by Franco and Giannoccaro (2025): organizations that completed the circular transformation in their sample did so by developing sensing, seizing, and transforming routines capable of neutralizing institutional-, supply-chain-, and firm-level barriers. In the Ecuadorian portfolio, the multinational cases exhibit precisely these seizing and transforming routines—formal reporting templates for circular practice, planning integration, partnership orchestration—while the startups display strong sensing (opportunity recognition in e-waste and reuse markets) without the full seizing and transforming infrastructure needed to scale. Similarly, the finding of Neri et al. (2023b) that digital technologies support circularity indirectly, by enabling capabilities rather than outcomes, offers a candidate explanation for the metric vacuum: organizations that acquired digital tools without building the associated measurement capability document environmental outputs but cannot compute circularity indices. The Green IT literature adds the sectoral counterpart: the governance component of G-readiness (Molla et al., 2011) and the mediating Green IS strategy identified by Loeser et al. (2017) are, in capability terms, transforming routines, and their absence in the startup stratum is what the duality records. Framing the Ecuadorian evidence in capability terms thus converts a descriptive contrast (formalized versus emergent) into a testable mechanism for future research.
5.7. Practical Implications
For corporate managers in Ecuador and comparable developing economies, the findings suggest three operational priorities. First, ITSR projects should be formally embedded within annual planning cycles using the R0–R9 ladder as a classification tool: mapping each initiative to specific R-strategies transforms ad hoc activities into strategically legible investments that can be monitored, reported, and compared across fiscal periods. The ReSOLVE framework provides the complementary strategic lens, linking operational R-strategies to higher-level business model actions (Loop, Share, Virtualize, Exchange) that resonate with corporate governance language. Second, the enabler stacking pattern implies that organizations should not pursue isolated interventions—a single partnership, a one-time training program, a short-duration pilot—but should instead construct multi-layered governance architectures that combine regulatory-bridging partnerships with sustained institutional commitment (minimum five-year planning horizons) and systematic IT responsibility training. Third, the metric vacuum is the point at which the untested Proposition 2 becomes actionable: organizations that begin to measure the economic as well as the environmental returns of circular IT initiatives—even with adapted or simplified indices—will be the first able to establish whether these initiatives improve competitiveness. They are also likely, in any event, to be better positioned in sustainability reporting, investor communications, and regulatory compliance as Ecuador’s CE policy framework matures.
For policymakers, the evidence points to two structural interventions. The absence of official national e-waste databases represents a data-infrastructure deficit that constrains the entire ITSR–CE ecosystem: without denominator data, no organization can calculate meaningful recovery rates, collection efficiency, or circularity ratios. Investing in this infrastructure would create the preconditions for metric development that the private sector alone cannot provide. The finding that public–private partnerships function as regulatory substitutes in the Ecuadorian context should inform policy design: rather than attempting to replicate EU-style top-down regulatory mandates in a setting that lacks the enforcement capacity to implement them, policymakers could formalize and incentivize the partnership mechanisms that are already producing circular outcomes—CNEL–CELEC agreements, SENPLADES–DINTEL collaborations, ICT Sectoral Council programs—embedding them within a coherent national CE strategy rather than allowing them to operate in isolation.
5.8. Summary of Limitations
The limitations of this study have been distributed throughout the Discussion alongside the findings they affect; a consolidated summary is provided here for transparency. First, the reliance on secondary data—corporate reports, institutional documentation, startup portfolios—rather than primary data collection (interviews, surveys, direct observation) constrains the depth of causal inference. The documentary approach adopted following Nazir and Doni (2024) treats organizational reports as institutional artifacts, but these artifacts are produced by the organizations themselves and may reflect aspirational framing rather than operational reality. This concern applies especially to the MNC cases, where corporate sustainability reporting is shaped by global public-relations strategies, and it qualifies the institutional duality reported as the study’s main pattern (Section 5.1). Second, the two strata differ in resources, reporting obligations, and governance capacity as well as in the variable of interest, so that cross-stratum differences in documented circularity are confounded with differences in the capacity to document (Section 3.3.2); the startup findings should be read as lower bounds. Third, the sample of seven cases permits pattern identification through replication logic but does not support statistical generalization to the Ecuadorian IT sector as a whole, and its 23-document evidentiary base is not commensurable with the interview-based saturation thresholds reported in the literature. Fourth, the systematic review is limited by English-language bias (excluding potentially relevant Spanish and Portuguese literature), temporal concentration (100% of included studies from 2023–2025), the absence of PROSPERO registration, the lack of a formal agreement statistic for the screening stages (Section 3.2.4) and for the case coding (Section 3.4.2), and the use of an adapted rather than a design-specific quality appraisal instrument. Fifth, the authors’ prior involvement in several of the Ecuadorian initiatives examined—disclosed in the reflexivity statement in Section 3.5—provided privileged access to documentation but introduced a positionality risk that was managed, rather than eliminated, through systematic codebook anchoring. Sixth, the absence of economic metrics across all seven cases means that Proposition 2—that ITSR–CE integration improves business competitiveness—remains untested; the quantitative CSR–CE coefficient cited throughout (β = 0.893) belongs to the reviewed literature and was not estimated here. Seventh, the exclusion of informal sector actors from the case analysis limits the comprehensiveness of the circular economy mapping and underestimates the total material recovery occurring in the Ecuadorian IT ecosystem.
5.9. Future Research Directions
Six research priorities follow from the limitations and findings of this study. First, primary data collection—semi-structured interviews with managers of the seven organizations and site observation of their circular processes—is needed to test whether the institutional duality reported here is a difference in practice or in reporting, the rival explanation that documentary evidence cannot resolve. Second, quantitative replication of the CSR–CE pathway in an Ecuadorian IT context—employing SEM or equivalent methods with sample sizes comparable to Gallardo-Vázquez et al.’s (2024) n = 777 or Khan et al.’s (2023) n = 435—would test whether the strong European and Asian effect sizes transfer to Latin American institutional conditions, and would allow Proposition 2 to be tested directly by adding economic performance indicators to the model. Third, the enabler stacking pattern identified here requires formal theoretical testing through fuzzy-set qualitative comparative analysis (fsQCA) or equivalent configurational methods capable of identifying necessary and sufficient conditions across a larger case set. Fourth, the development of context-sensitive circularity indices calibrated for IT services in developing economies represents the most important instrument-development need identified by this study; pilot application of Yazdi et al.’s (2024) CE index to Ecuadorian organizations, with documented adaptations, would constitute a foundational contribution. Fifth, longitudinal research tracking the evolution of ITSR practices within the same organizations over five- to ten-year periods would test the temporal persistence mechanism proposed in the enabler stacking model and determine whether the institutional duality between MNCs and startups narrows over time. Sixth, the informal sector blind spot demands dedicated research: mixed-methods studies combining quantitative material flow analysis with qualitative interviews with informal recyclers in Ecuadorian IT waste streams would produce the integrated social–environmental evidence that is currently absent from the Latin American CE literature. Interdisciplinary approaches combining information systems, environmental management, and development studies are needed to advance a field that no single disciplinary lens can adequately address.
6. Conclusions
This study examined how Ecuadorian organizations integrate IT social responsibility projects into corporate strategy through circular economy practices, combining a PRISMA 2020-compliant systematic review of 35 peer-reviewed studies (2023–2025) with a qualitative multiple case analysis of seven organizational initiatives. The systematic review established that the CSR–CE positive relationship is robust in the international literature, with consistent positive effects across the studies that test it and one large reported path coefficient. It also revealed that IT-specific CE mechanisms remain poorly understood, Latin American evidence is critically scarce, and circularity metrics have never been applied to IT service contexts. The cross-case analysis uncovered three empirical patterns. First, an institutional duality separates multinational corporations—which document formalized circular metrics and strategic planning integration—from domestic startups, whose emergent practices lack governance structures for measurement or scaling; in capability terms, the strata differ in seizing and transforming, not in sensing, and, because the evidence is documentary, the duality is one of documented practice whose operational depth remains to be verified. Second, an enabler stacking mechanism requires the co-occurrence of public–private partnerships, sustained institutional commitment, and IT culture training for CE integration to succeed in weak regulatory environments. Third, a metric asymmetry persists across all cases: environmental outputs are documented, social outcomes are partially reported, and economic indicators and circularity indices are universally absent. Against the two propositions that structured the inquiry, the evidence is asymmetric: Proposition 1—that formal integration is associated with documented environmental and social outcomes—is supported within the limits of documentary evidence, whereas Proposition 2—that integration improves competitiveness—remains untested, because no organization in the portfolio measures the economic returns of its circular IT activity. That absence is the study’s most consequential finding for practice: initiatives whose returns are not measured cannot be defended in the budget negotiations of which annual planning consists—a plausible, as yet untested, explanation for why ITSR projects remain underestimated. The empirical contribution is thus preliminary but structured evidence that ITSR projects are formally integrated where governance routines, multi-layered partnership architectures, and measurement capability exist, and that the R0–R9 ladder and the ReSOLVE framework can make such integration legible for annual planning. Building the measurement capability—environmental and economic—needed to convert ad hoc activities into strategically monitored circular investments is the step the Ecuadorian portfolio has yet to take. The theoretical contribution—a graduated institutional filling model linking partnership substitution, organizational institutionalization, and cultural operationalization, read through the sensing–seizing–transforming sequence of dynamic capabilities—offers a framework that future research can test, refine, and generalize beyond the Ecuadorian context. For practitioners and policymakers, the operational priorities identified here—adopting R-strategy classification tools for annual planning, constructing multi-layered governance architectures, measuring economic as well as environmental returns, and investing in national e-waste data infrastructure—provide an actionable roadmap for formalizing ITSR–CE integration in comparable developing economies.
Supplementary Materials
The following supporting information can be downloaded at: https://www.mdpi.com/article/10.3390/admsci16110533/s1, Table S1: Review protocol and complete search strings by database; Table S2: Data extraction matrix for the 35 included studies; Table S3: Codebook, case selection audit trail, and analytical decision log (including screening disagreements and their resolution, Table S3.3); PRISMA 2020 checklist.
Author Contributions
Conceptualization, D.M.; Methodology, D.M.; Validation, D.M. and I.G.-C.; Formal analysis, D.M.; Investigation, D.M.; Data curation, D.M.; Writing—original draft, D.M.; Writing—review & editing, D.M. and I.G.-C.; Visualization, D.M.; Supervision, I.G.-C. All authors have read and agreed to the published version of the manuscript.
Funding
This research received no external funding.
Institutional Review Board Statement
Not applicable.
Informed Consent Statement
Not applicable.
Data Availability Statement
The evidence analyzed in this study derives from publicly available sources cited in the article. The analytical outputs supporting the reported findings are included in the article and its Supplementary Materials; further inquiries can be directed to the corresponding author.
Acknowledgments
The authors gratefully acknowledge the institutions and organizations whose publicly available reports and case documentation made this study possible, and thank the anonymous reviewers for their constructive comments. Any opinions, findings, conclusions, or recommendations expressed in this paper are those of the authors and do not necessarily reflect the views of the organizations whose documents were analyzed.
Conflicts of Interest
The authors declare no conflicts of interest.
References
- Ali, S. S., Weber, G.-W., Tirkolaee, E. B., & Goli, A. (2024). Circular economy practices in the context of emerging economies. Sustainability, 16(4), 1417. [Google Scholar] [CrossRef] [Scilit]
- Bhattacharjee, P., Howlader, I., Rahman, M. A., Taqi, H. M. M., Hasan, M. T., Ali, S., & Alghababsheh, M. (2023). Critical success factors for circular economy in the waste electrical and electronic equipment (WEEE) sector in an emerging economy: Implications for stakeholders. Journal of Cleaner Production, 401, 136767. [Google Scholar] [CrossRef] [Scilit]
- Chabowski, B. R., Gabrielsson, P., Hult, G. T. M., & Morgeson, F. V., III. (2023). Sustainable international business model innovations for a globalizing circular economy: A review and synthesis, integrative framework, and opportunities for future research. Journal of International Business Studies, 56, 383–402. [Google Scholar] [CrossRef] [Scilit]
- Chen, A. J., Watson, R. T., & Boudreau, M.-C. (2011). An institutional perspective on the adoption of Green IS & IT. Australasian Journal of Information Systems, 17(1). [Google Scholar] [CrossRef] [Scilit]
- D’Alessandro, C., Szopik-Depczyńska, K., Tarczyńska-Łuniewska, M., Silvestri, C., & Ioppolo, G. (2024). Exploring circular economy practices in the healthcare sector: A systematic review and bibliometric analysis. Sustainability, 16(1), 401. [Google Scholar] [CrossRef] [Scilit]
- Debnath, B., Bari, A. B. M. M., Pacheco, D. A. d. J., & Karmaker, C. L. (2023). An integrated Best-Worst Method and Interpretive Structural Modeling approach for assessing the barriers to circular economy implementation. Decision Analytics Journal, 8, 100250. [Google Scholar] [CrossRef] [Scilit]
- Despoudi, S., Sivarajah, U., Spanaki, K., Charles, V., & Durai, V. K. (2023). Industry 4.0 and circular economy for emerging markets: Evidence from small and medium-sized enterprises (SMEs) in the Indian food sector. Annals of Operations Research, 350, 453–491. [Google Scholar] [CrossRef] [Scilit]
- Ellen MacArthur Foundation. (2015). Growth within: A circular economy vision for a competitive Europe. Ellen MacArthur Foundation. [Google Scholar]
- Espinosa-Aquino, B., Gabarrell Durany, X., & Quirós Vargas, R. (2023). The role of informal waste management in urban metabolism: A review of eight Latin American countries. Sustainability, 15(3), 1826. [Google Scholar] [CrossRef] [Scilit]
- Esposito, B., Raimo, N., Malandrino, O., & Vitolla, F. (2023). Circular economy disclosure and integrated reporting: The role of corporate governance mechanisms. Business Strategy and the Environment, 32(8), 5403–5419. [Google Scholar] [CrossRef] [Scilit]
- Farjana, S. H., Mungombe, T. M., Gamage, H. M. K., Rajwani, A. S., Tokede, O., & Ashraf, M. (2023). Circulating the e-waste recovery from the construction and demolition industries: A review. Sustainability, 15(16), 12435. [Google Scholar] [CrossRef] [Scilit]
- Faucheux, S., & Nicolaï, I. (2011). IT for green and green IT: A proposed typology of eco-innovation. Ecological Economics, 70(11), 2020–2027. [Google Scholar] [CrossRef] [Scilit]
- Franco, S., & Giannoccaro, I. (2025). Dynamic capabilities and microfoundations to overcome barriers to circular economy implementation. Business Strategy and the Environment, 34(4), 4392–4408. [Google Scholar] [CrossRef] [Scilit]
- Gallardo-Vázquez, D., Herrador-Alcaide, T. C., & Matin, A. (2024). Circular economy orientation from corporate social responsibility: A view based on structural equation modeling and a fuzzy-set qualitative comparative analysis. Sustainable Development, 32(5), 5581–5601. [Google Scholar] [CrossRef] [Scilit]
- Geissdoerfer, M., Savaget, P., Bocken, N. M. P., & Hultink, E. J. (2017). The circular economy—A new sustainability paradigm? Journal of Cleaner Production, 143, 757–768. [Google Scholar] [CrossRef] [Scilit]
- Ghulam, S. T., & Abushammala, H. (2023). Challenges and opportunities in the management of electronic waste and its impact on human health and environment. Sustainability, 15(3), 1837. [Google Scholar] [CrossRef] [Scilit]
- Hariyani, D., Hariyani, P., Mishra, S., & Sharma, M. K. (2024). Leveraging digital technologies for advancing circular economy practices and enhancing life cycle analysis: A systematic literature review. Waste Management Bulletin, 2, 69–83. [Google Scholar] [CrossRef] [Scilit]
- Hoang, T. H. (2026). Impact of stakeholder pressure on sustainable performance: The mediating role of corporate social responsibility and circular economy practices. Strategy & Leadership. Advanced online publication. [Google Scholar] [CrossRef] [Scilit]
- Kaswan, M. S., Sabale, D. B., & Rathi, R. (2023). Integrating circular economy aspects with manufacturing planning: An MSME perspective. E3S Web of Conferences, 453, 01007. [Google Scholar] [CrossRef] [Scilit]
- Khan, S., Ahmad, Z., Sheikh, A. A., & Yu, Z. (2023). Green technology adoption paving the way toward sustainable performance in circular economy: A case of Pakistani small and medium enterprises. International Journal of Innovation Science, 16(5), 801–822. [Google Scholar] [CrossRef] [Scilit]
- Kirchherr, J., Reike, D., & Hekkert, M. (2017). Conceptualizing the circular economy: An analysis of 114 definitions. Resources, Conservation and Recycling, 127, 221–232. [Google Scholar] [CrossRef] [Scilit]
- Lincoln, Y. S., & Guba, E. G. (1985). Naturalistic inquiry. Sage Publications. [Google Scholar]
- Liu, K., Tan, Q., Yu, J., & Wang, M. (2023). A global perspective on e-waste recycling. Circular Economy, 2, 100028. [Google Scholar] [CrossRef] [Scilit]
- Loeser, F., Recker, J., vom Brocke, J., Molla, A., & Seidel, S. (2017). How IT executives create organizational benefits by translating environmental strategies into Green IS initiatives. Information Systems Journal, 27(4), 503–553. [Google Scholar] [CrossRef] [Scilit]
- Magnano, D. G., Grimstad, S. M. F., Glavee-Geo, R., & Anwar, F. (2024). Disentangling circular economy practices and firm’s sustainability performance: A systematic literature review of past achievements and future promises. Journal of Environmental Management, 353, 120138. [Google Scholar] [CrossRef] [Scilit]
- Medaglia, R., Rukanova, B., & Tan, Y.-H. (2024). Digital government and the circular economy transition: An analytical framework and a research agenda. Government Information Quarterly, 41, 101904. [Google Scholar] [CrossRef] [Scilit]
- Molla, A., Cooper, V., & Pittayachawan, S. (2011). The Green IT readiness (G-readiness) of organizations: An exploratory analysis of a construct and instrument. Communications of the Association for Information Systems, 29, 4. [Google Scholar] [CrossRef] [Scilit]
- Mondal, S., Singh, S., & Gupta, H. (2023). Green entrepreneurship and digitalization enabling the circular economy through sustainable waste management—An exploratory study of emerging economy. Journal of Cleaner Production, 422, 138433. [Google Scholar] [CrossRef] [Scilit]
- Moustafa, Z., Asif, M., & Wuni, I. Y. (2025). Circular economy in the building sector: A systematic review of environmental, economic, and social dimensions. Sustainable Futures, 9, 100690. [Google Scholar] [CrossRef] [Scilit]
- Murugesan, S. (2008). Harnessing Green IT: Principles and practices. IT Professional, 10(1), 24–33. [Google Scholar] [CrossRef] [Scilit]
- Nazir, S., & Doni, F. (2024). Nexus of circular economy R0 to R9 principles in integrated reporting: Insights from a multiple case study comparison. Business Strategy and the Environment, 33(5), 4058–4085. [Google Scholar] [CrossRef] [Scilit]
- Neri, A., Negri, M., Cagno, E., Franzò, S., Kumar, V., Lampertico, T., & Bassani, C. A. (2023a). The role of digital technologies in supporting the implementation of circular economy practices by industrial small and medium enterprises. Business Strategy and the Environment, 32(7), 4693–4718. [Google Scholar] [CrossRef] [Scilit]
- Neri, A., Negri, M., Cagno, E., Kumar, V., & Garza-Reyes, J. A. (2023b). What digital-enabled dynamic capabilities support the circular economy? A multiple case study approach. Business Strategy and the Environment, 32(7), 5083–5101. [Google Scholar] [CrossRef] [Scilit]
- Neves, S. A., Marques, A. C., & Silva, I. P. (2024). Promoting the circular economy in the EU: How can the recycling of e-waste be increased? Structural Change and Economic Dynamics, 70, 192–201. [Google Scholar] [CrossRef] [Scilit]
- Ospina-Mateus, H., Marrugo-Salas, L., Castilla Castilla, L., Castellón, L., Cantillo, A., Bolivar, L. M., Salas-Navarro, K., & Zamora-Musa, R. (2023). Analysis in circular economy research in Latin America: A bibliometric review. Heliyon, 9(9), e19999. [Google Scholar] [CrossRef] [Scilit]
- Ouro-Salim, O. (2024). Urban mining of e-waste management globally: Literature review. Cleaner Waste Systems, 9, 100162. [Google Scholar] [CrossRef] [Scilit]
- Page, M. J., McKenzie, J. E., Bossuyt, P. M., Boutron, I., Hoffmann, T. C., Mulrow, C. D., Shamseer, L., Tetzlaff, J. M., Akl, E. A., Brennan, S. E., Chou, R., Glanville, J., Grimshaw, J. M., Hróbjartsson, A., Lalu, M. M., Li, T., Loder, E. W., Mayo-Wilson, E., McDonald, S., … Moher, D. (2021). The PRISMA 2020 statement: An updated guideline for reporting systematic reviews. BMJ, 372, n71. [Google Scholar] [CrossRef] [Scilit]
- Potting, J., Hekkert, M. P., Worrell, E., & Hanemaaijer, A. (2017). Circular economy: Measuring innovation in the product chain (PBL Publication No. 2544). PBL Netherlands Environmental Assessment Agency.
- Pouyamanesh, S., Kowsari, E., Ramakrishna, S., & Chinnappan, A. (2023). A review of various strategies in e-waste management in line with circular economics. Environmental Science and Pollution Research, 30(41), 93462–93490. [Google Scholar] [CrossRef] [Scilit]
- Purushothaman, R., Alamelu, R., Selvabaskar, S., & Sudha, M. (2025). Theories, techniques and strategies of sustainable circular economy: A systematic literature review. Discover Sustainability, 6, 297. [Google Scholar] [CrossRef] [Scilit]
- Quintana, R. A., Donos, M. R., Quintana, C. A., & Zambrano, F. J. F. (2024). Barriers to reverse logistics and the circular economy in supply chain arrangements: A qualitative study in Ecuador. Revista Galega de Economia, 33(2), 1–23. [Google Scholar] [CrossRef] [Scilit]
- Quinto, S., Law, N., Fletcher, C., Le, J., Antony Jose, S., & Menezes, P. L. (2025). Exploring the e-waste crisis: Strategies for sustainable recycling and circular economy integration. Recycling, 10(2), 72. [Google Scholar] [CrossRef] [Scilit]
- Rathi, R., Sabale, D. B., & Kaswan, M. S. (2024). Circular economy for Indian manufacturing industry. AIP Conference Proceedings, 3007, 030122. [Google Scholar] [CrossRef] [Scilit]
- Sabale, D. B., Kaswan, M. S., & Rathi, R. (2025a). Circular economy practices for net zero: Analysis of barriers in Indian small and medium enterprises context. Circular Economy and Sustainability, 5(2), 817–836. [Google Scholar] [CrossRef] [Scilit]
- Sabale, D. B., Kaswan, M. S., & Rathi, R. (2025b). Investigating and modeling the circular economy enablers in product development process: Net zero as a moderator. Benchmarking: An International Journal, 32(1), 241–260. [Google Scholar] [CrossRef] [Scilit]
- Santiago, B. d. S., Scavarda, L. F., Caiado, R. G. G., Santos, R. S., & Nascimento, D. L. d. M. (2024). Corporate social responsibility and circular economy integration framework within sustainable supply chain management: Building blocks for industry 5.0. Corporate Social Responsibility and Environmental Management, 32(1), 269–290. [Google Scholar] [CrossRef] [Scilit]
- Shamsuzzaman, M., Mazed, I., Rishad, R., Abdullah Al, M. M., Saniyat, I., Kazi, S., & Muhammed, S. A. S. (2025). Fashion and textile waste management in the circular economy: A systematic review. Cleaner Waste Systems, 11, 100268. [Google Scholar] [CrossRef] [Scilit]
- Swarnakar, V., & Khalfan, M. (2024). Circular economy in construction and demolition waste management: An in-depth review and future perspectives in the construction sector. Smart and Sustainable Built Environment. Advance online publication. [Google Scholar] [CrossRef] [Scilit]
- Teece, D. J. (2007). Explicating dynamic capabilities: The nature and microfoundations of (sustainable) enterprise performance. Strategic Management Journal, 28(13), 1319–1350. [Google Scholar] [CrossRef] [Scilit]
- Trevisan, A. H., Lobo, A., Guzzo, D., Gomes, L. A. d. V., & Mascarenhas, J. (2023). Barriers to employing digital technologies for a circular economy: A multi-level perspective. Journal of Environmental Management, 332, 117437. [Google Scholar] [CrossRef] [Scilit]
- Tutore, I., Parmentola, A., & Costagliola Di Fiore, M. (2024). A conceptual model of artificial intelligence effects on circular economy actions. Corporate Social Responsibility and Environmental Management, 31(5), 4772–4782. [Google Scholar] [CrossRef] [Scilit]
- Uvarova, I., Atstaja, D., Volkova, T., Grasis, J., & Ozolina-Ozola, I. (2023). The typology of 60R circular economy principles and strategic orientation of their application in business. Journal of Cleaner Production, 409, 137189. [Google Scholar] [CrossRef] [Scilit]
- Vilardell, G. (2016). Manual of circular economy and social responsibility 4.0. Polytechnic University of Catalonia. [Google Scholar]
- Yaroson, E. V., Chowdhury, S., Mangla, S. K., Dey, P. K., Chan, F. T. S., & Roux, M. (2023). A systematic literature review exploring and linking circular economy and sustainable development goals in the past three decades (1991–2022). International Journal of Production Research, 62(4), 1399–1433. [Google Scholar] [CrossRef] [Scilit]
- Yazdi, M., Moradi, R., Nedjati, A., Pirbalouti, R. G., & Li, H. (2024). E-waste circular economy decision-making: A comprehensive approach for sustainable operation management. Neural Computing and Applications, 36, 13551–13577. [Google Scholar] [CrossRef] [Scilit]
- Yin, R. K. (2018). Case study research and applications: Design and methods (6th ed.). Sage Publications. [Google Scholar]
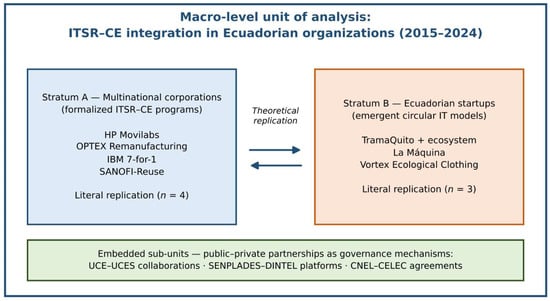
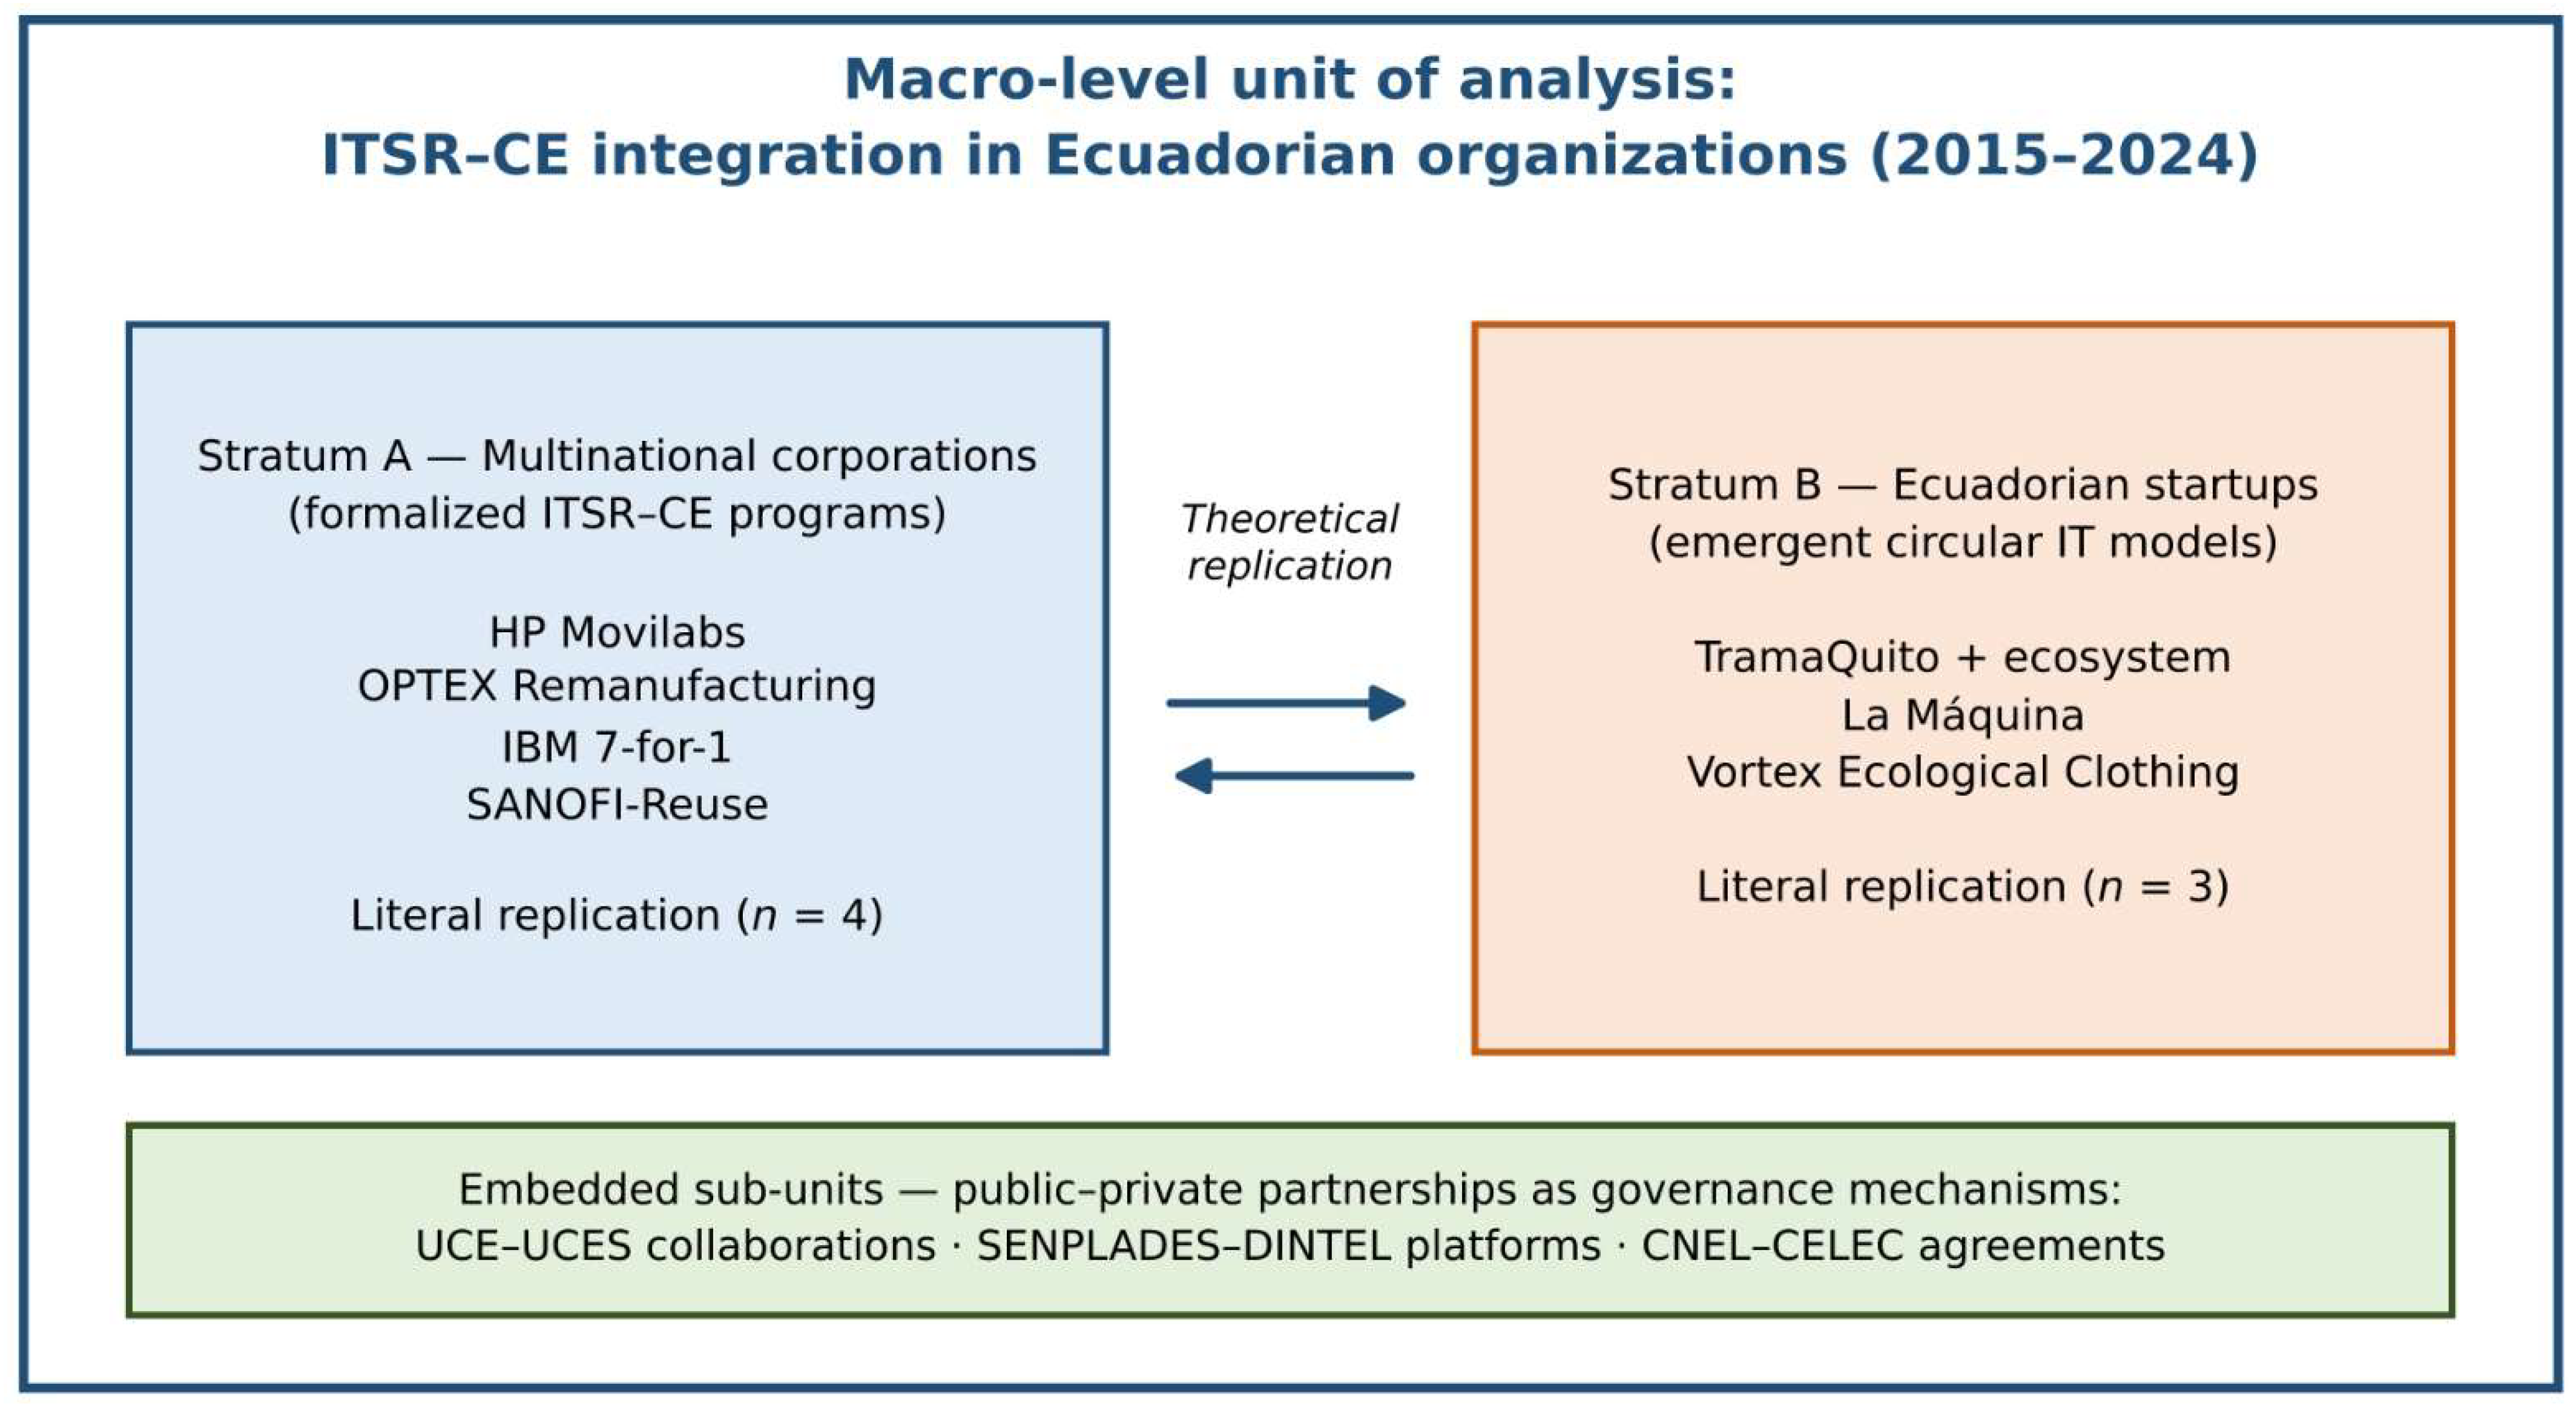
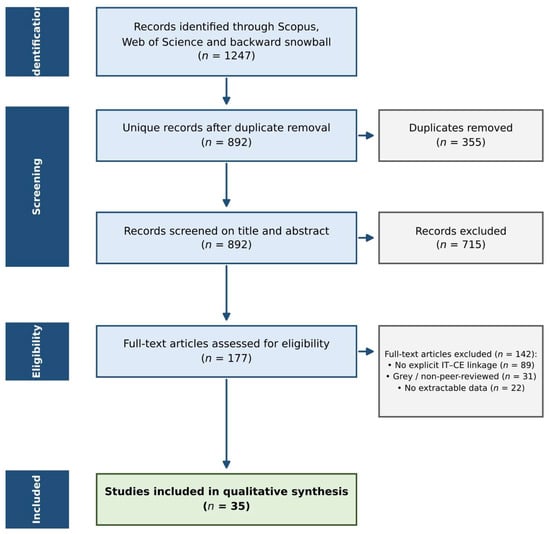
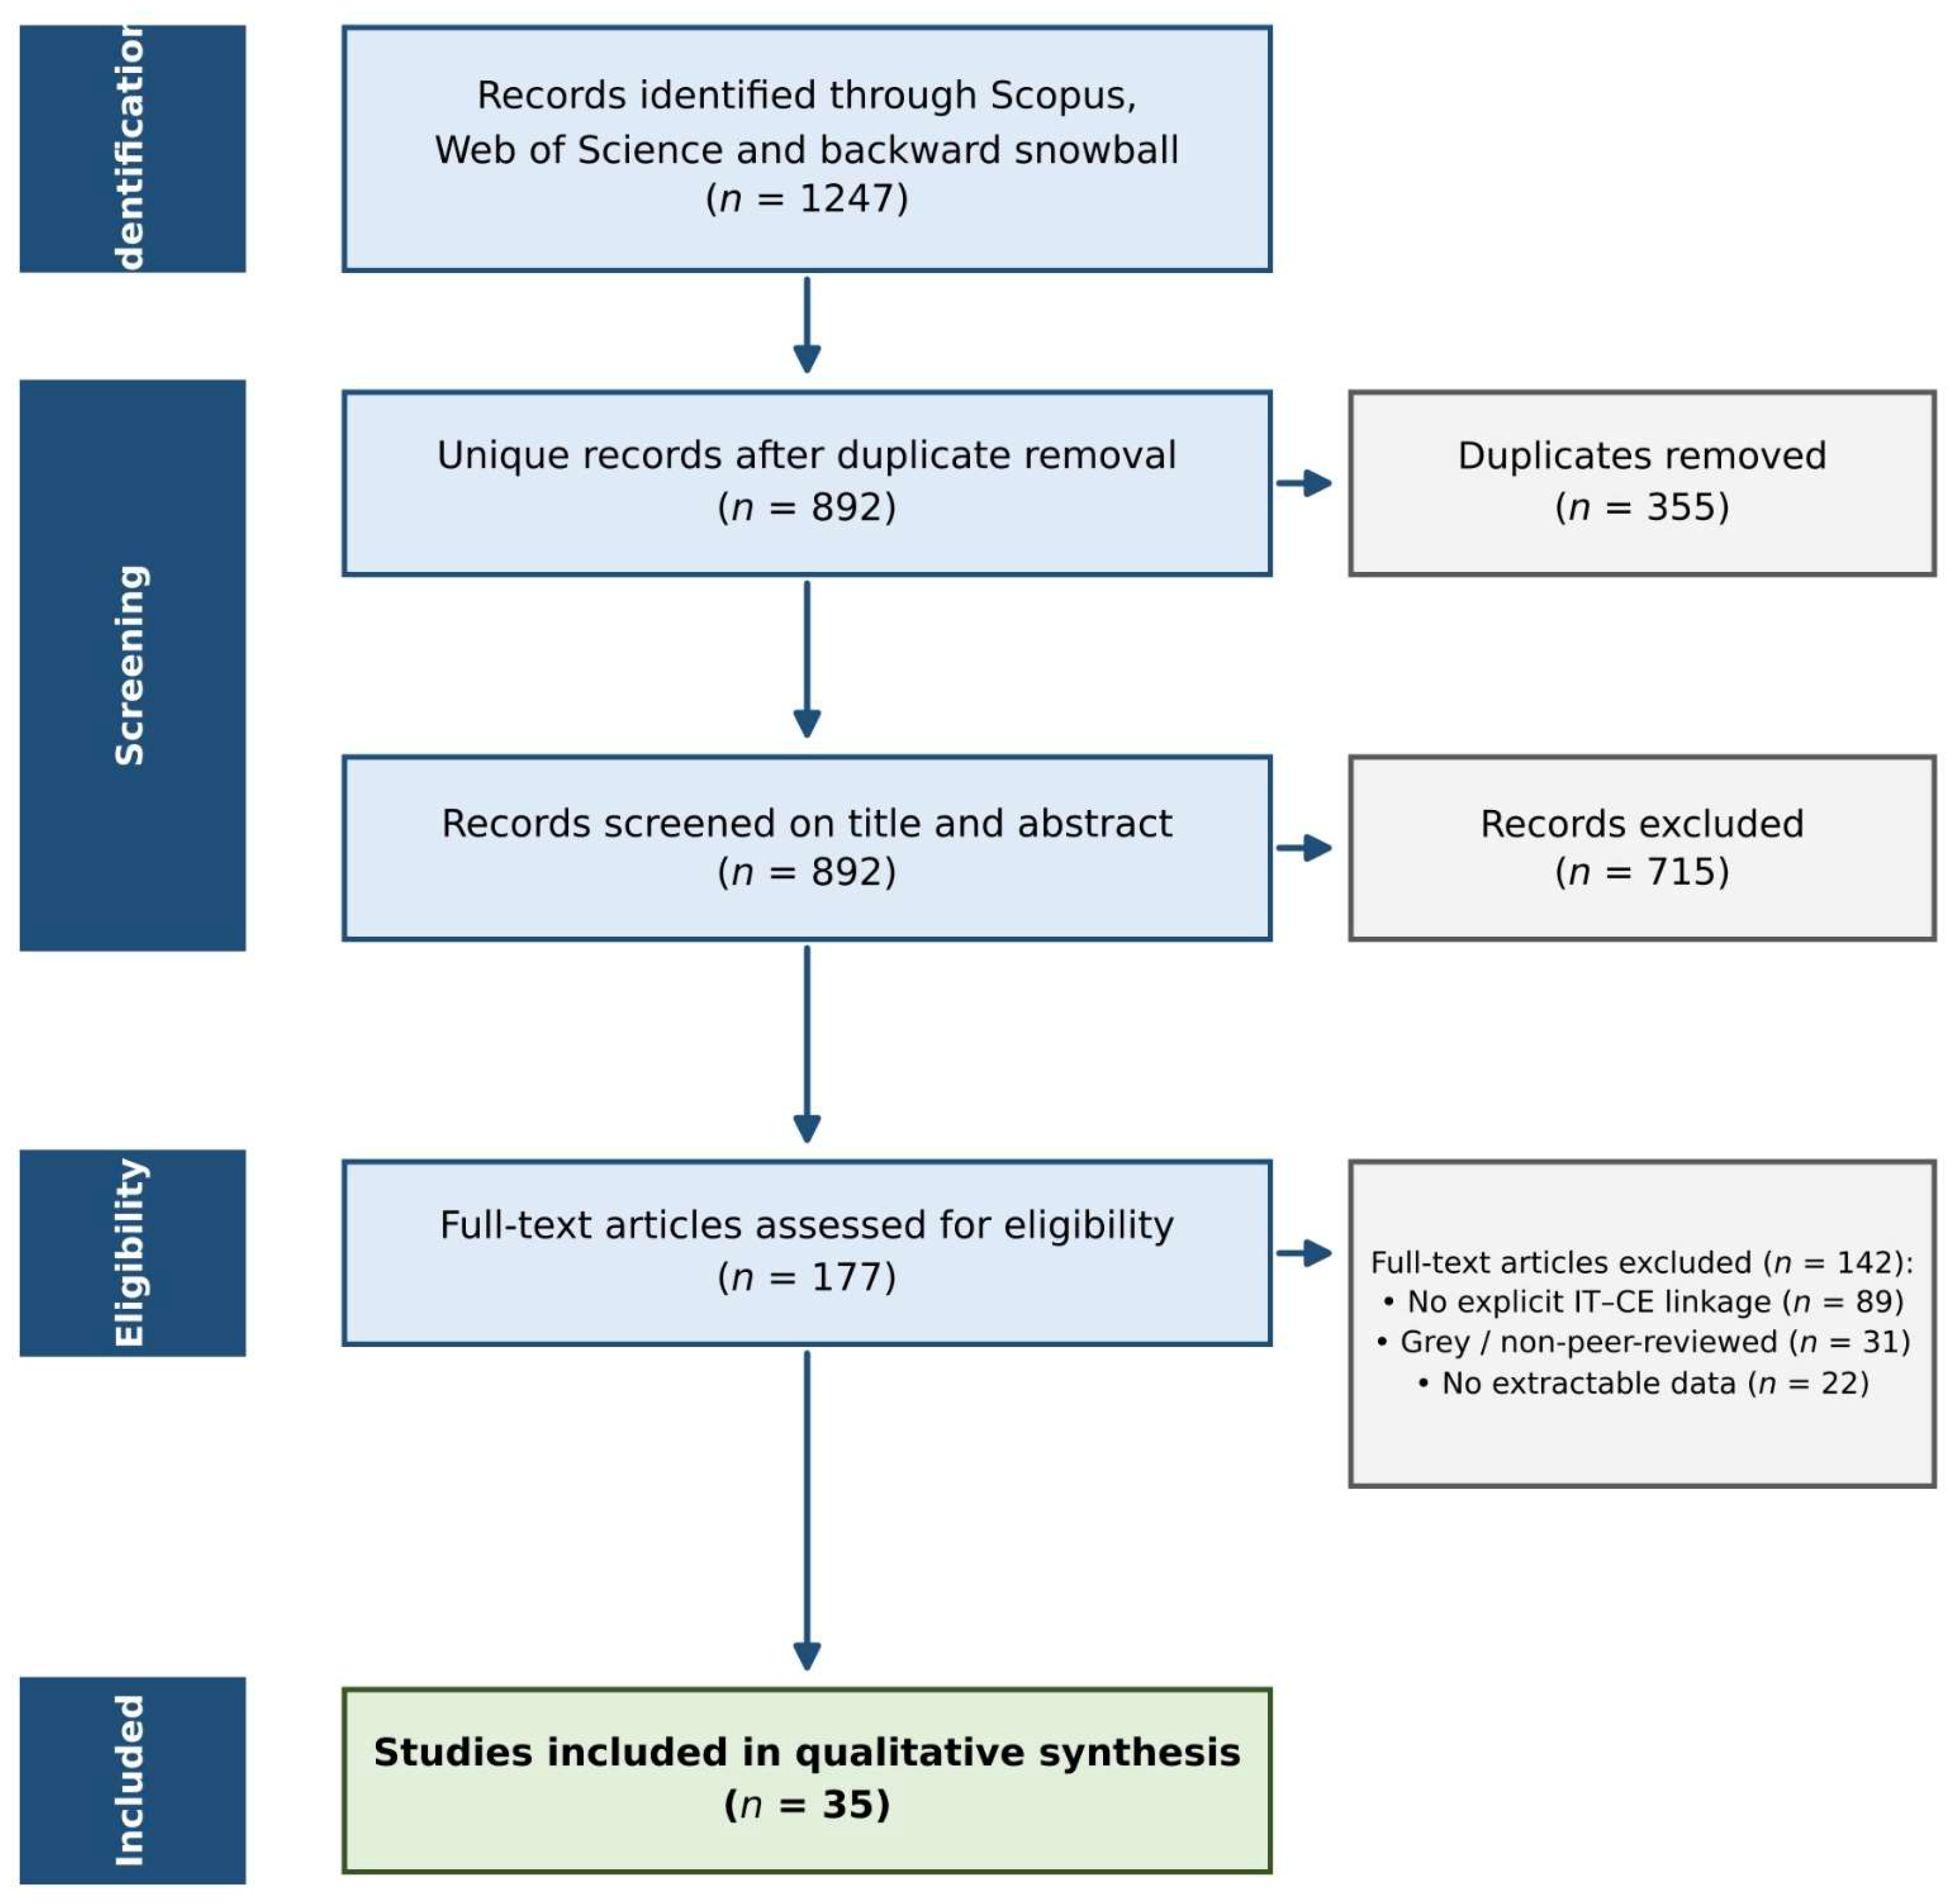
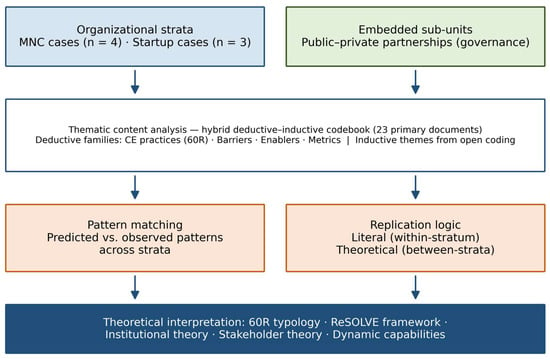
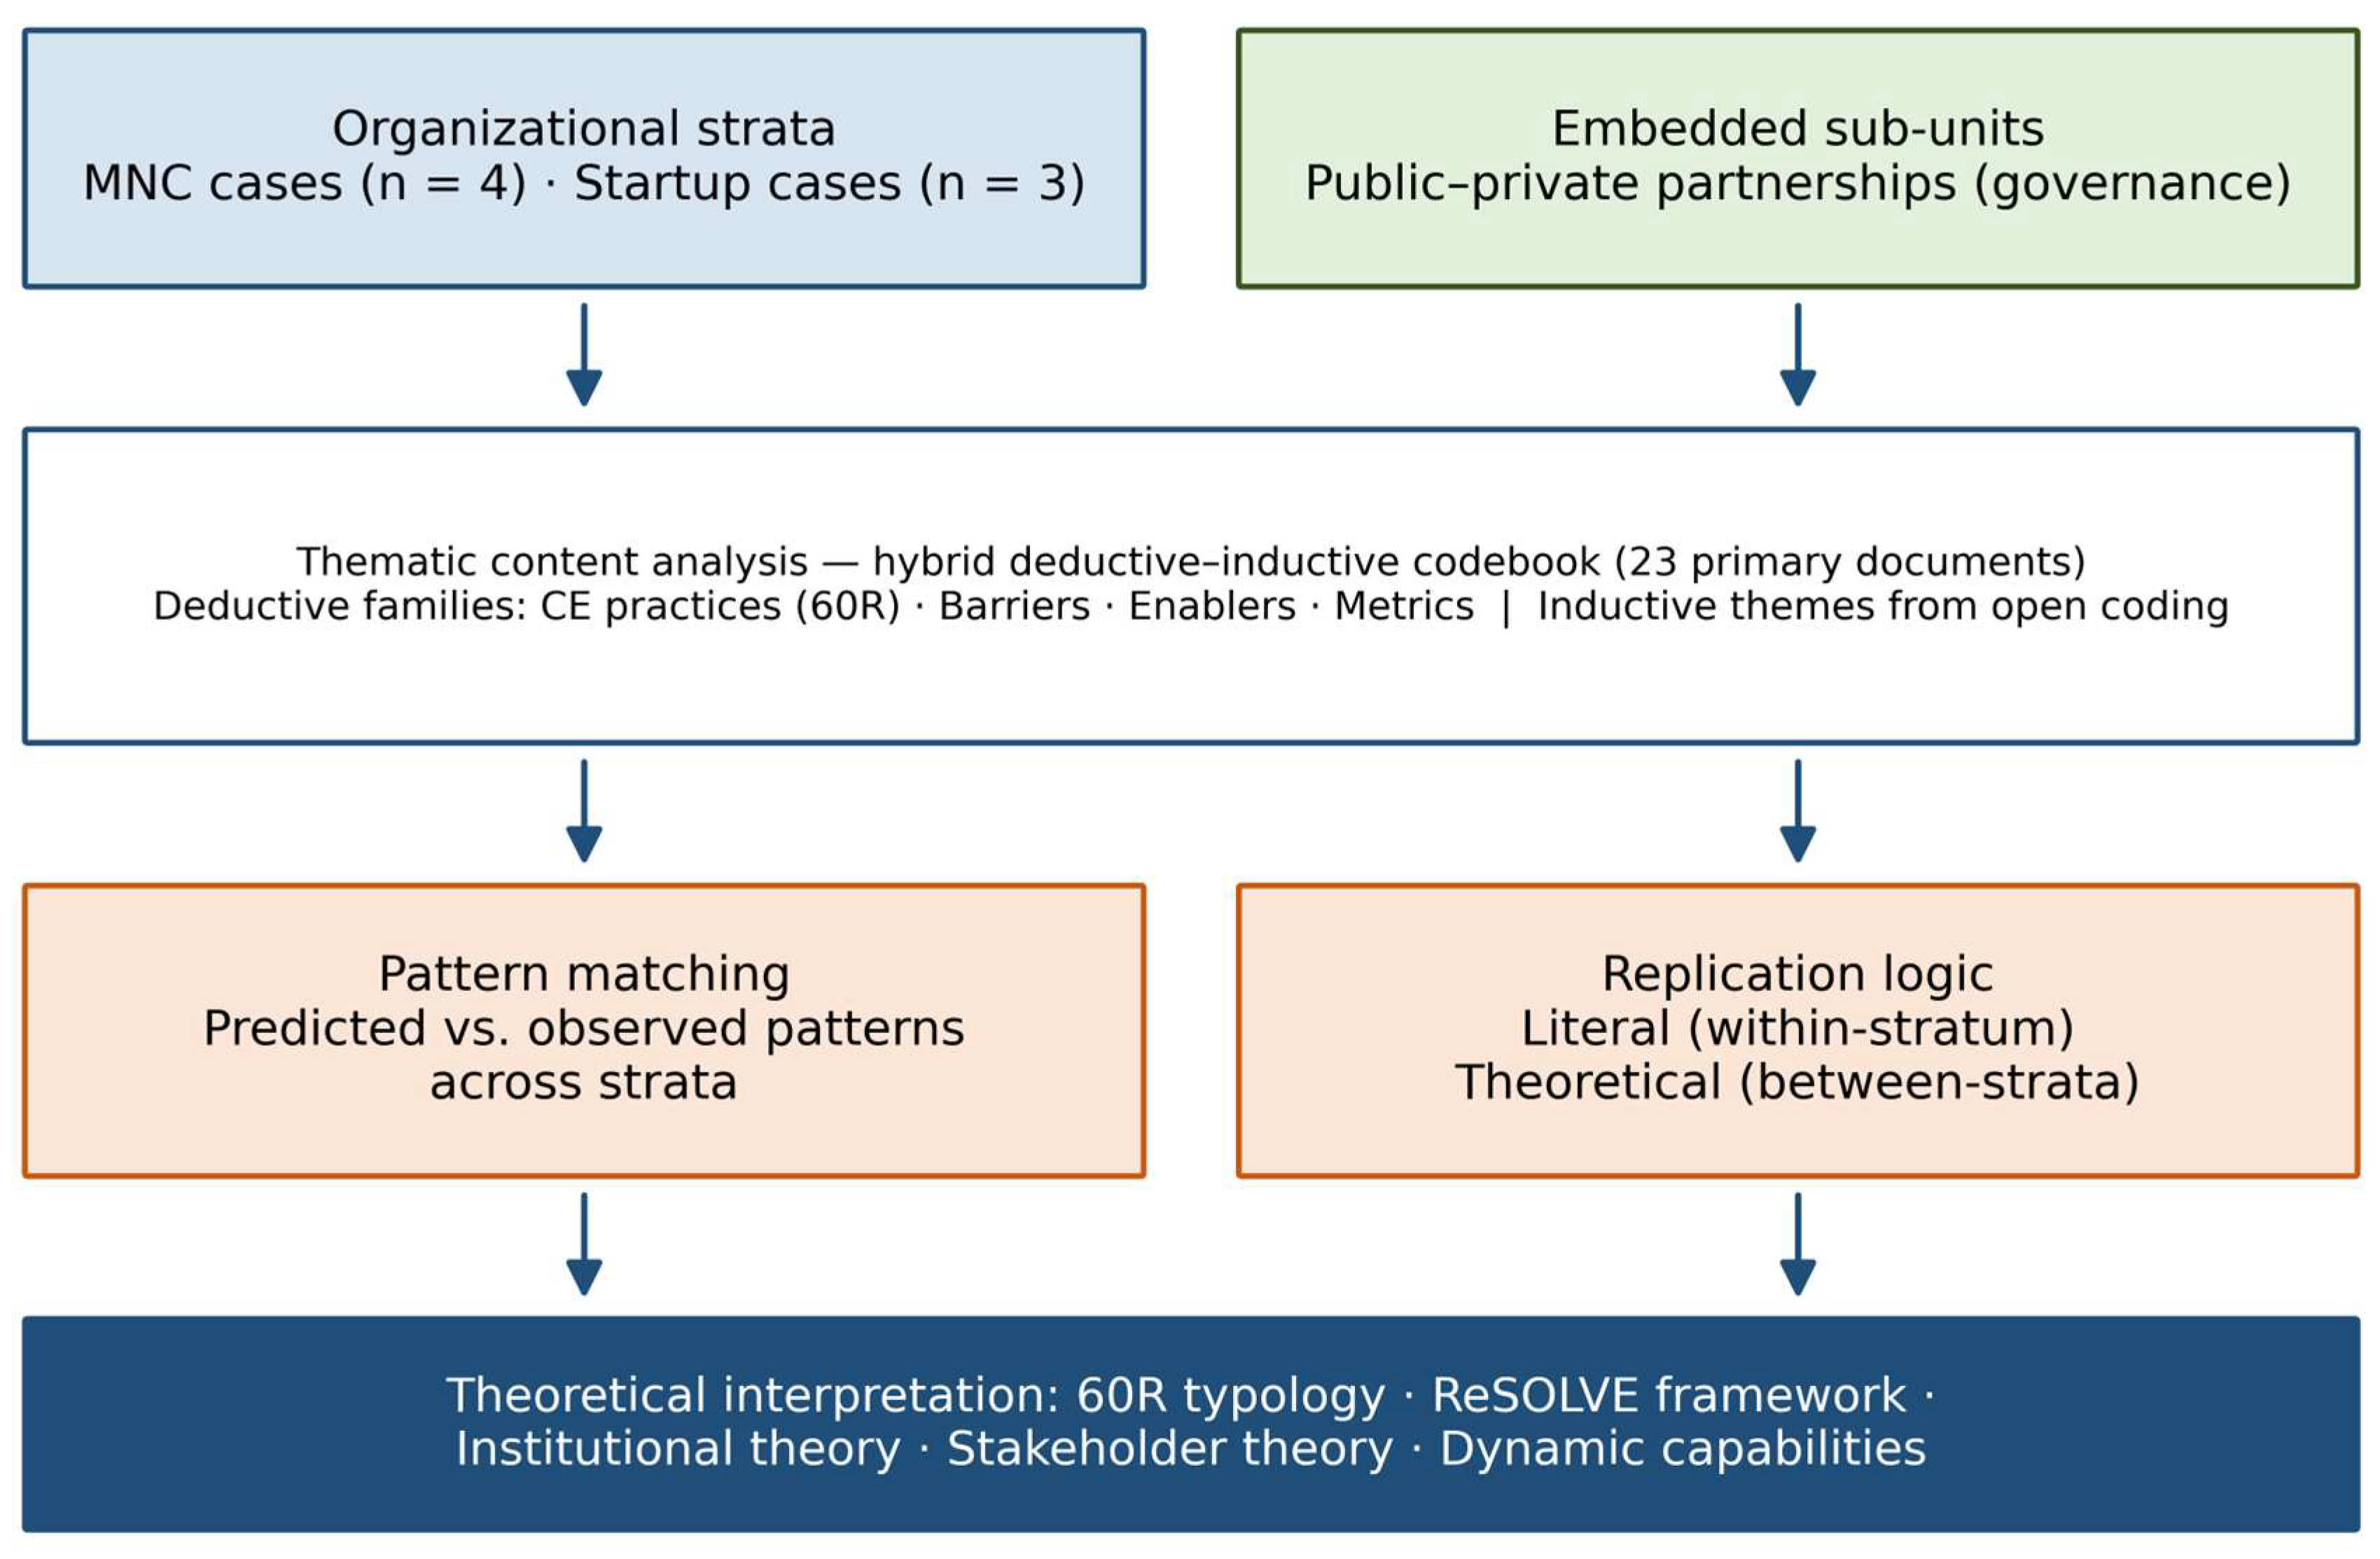
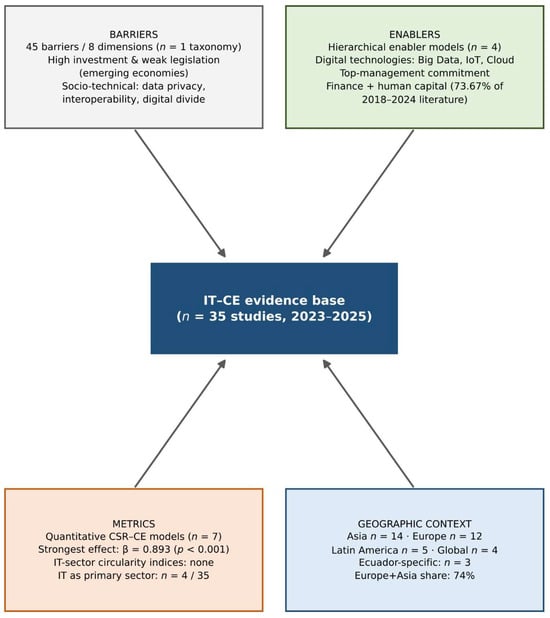
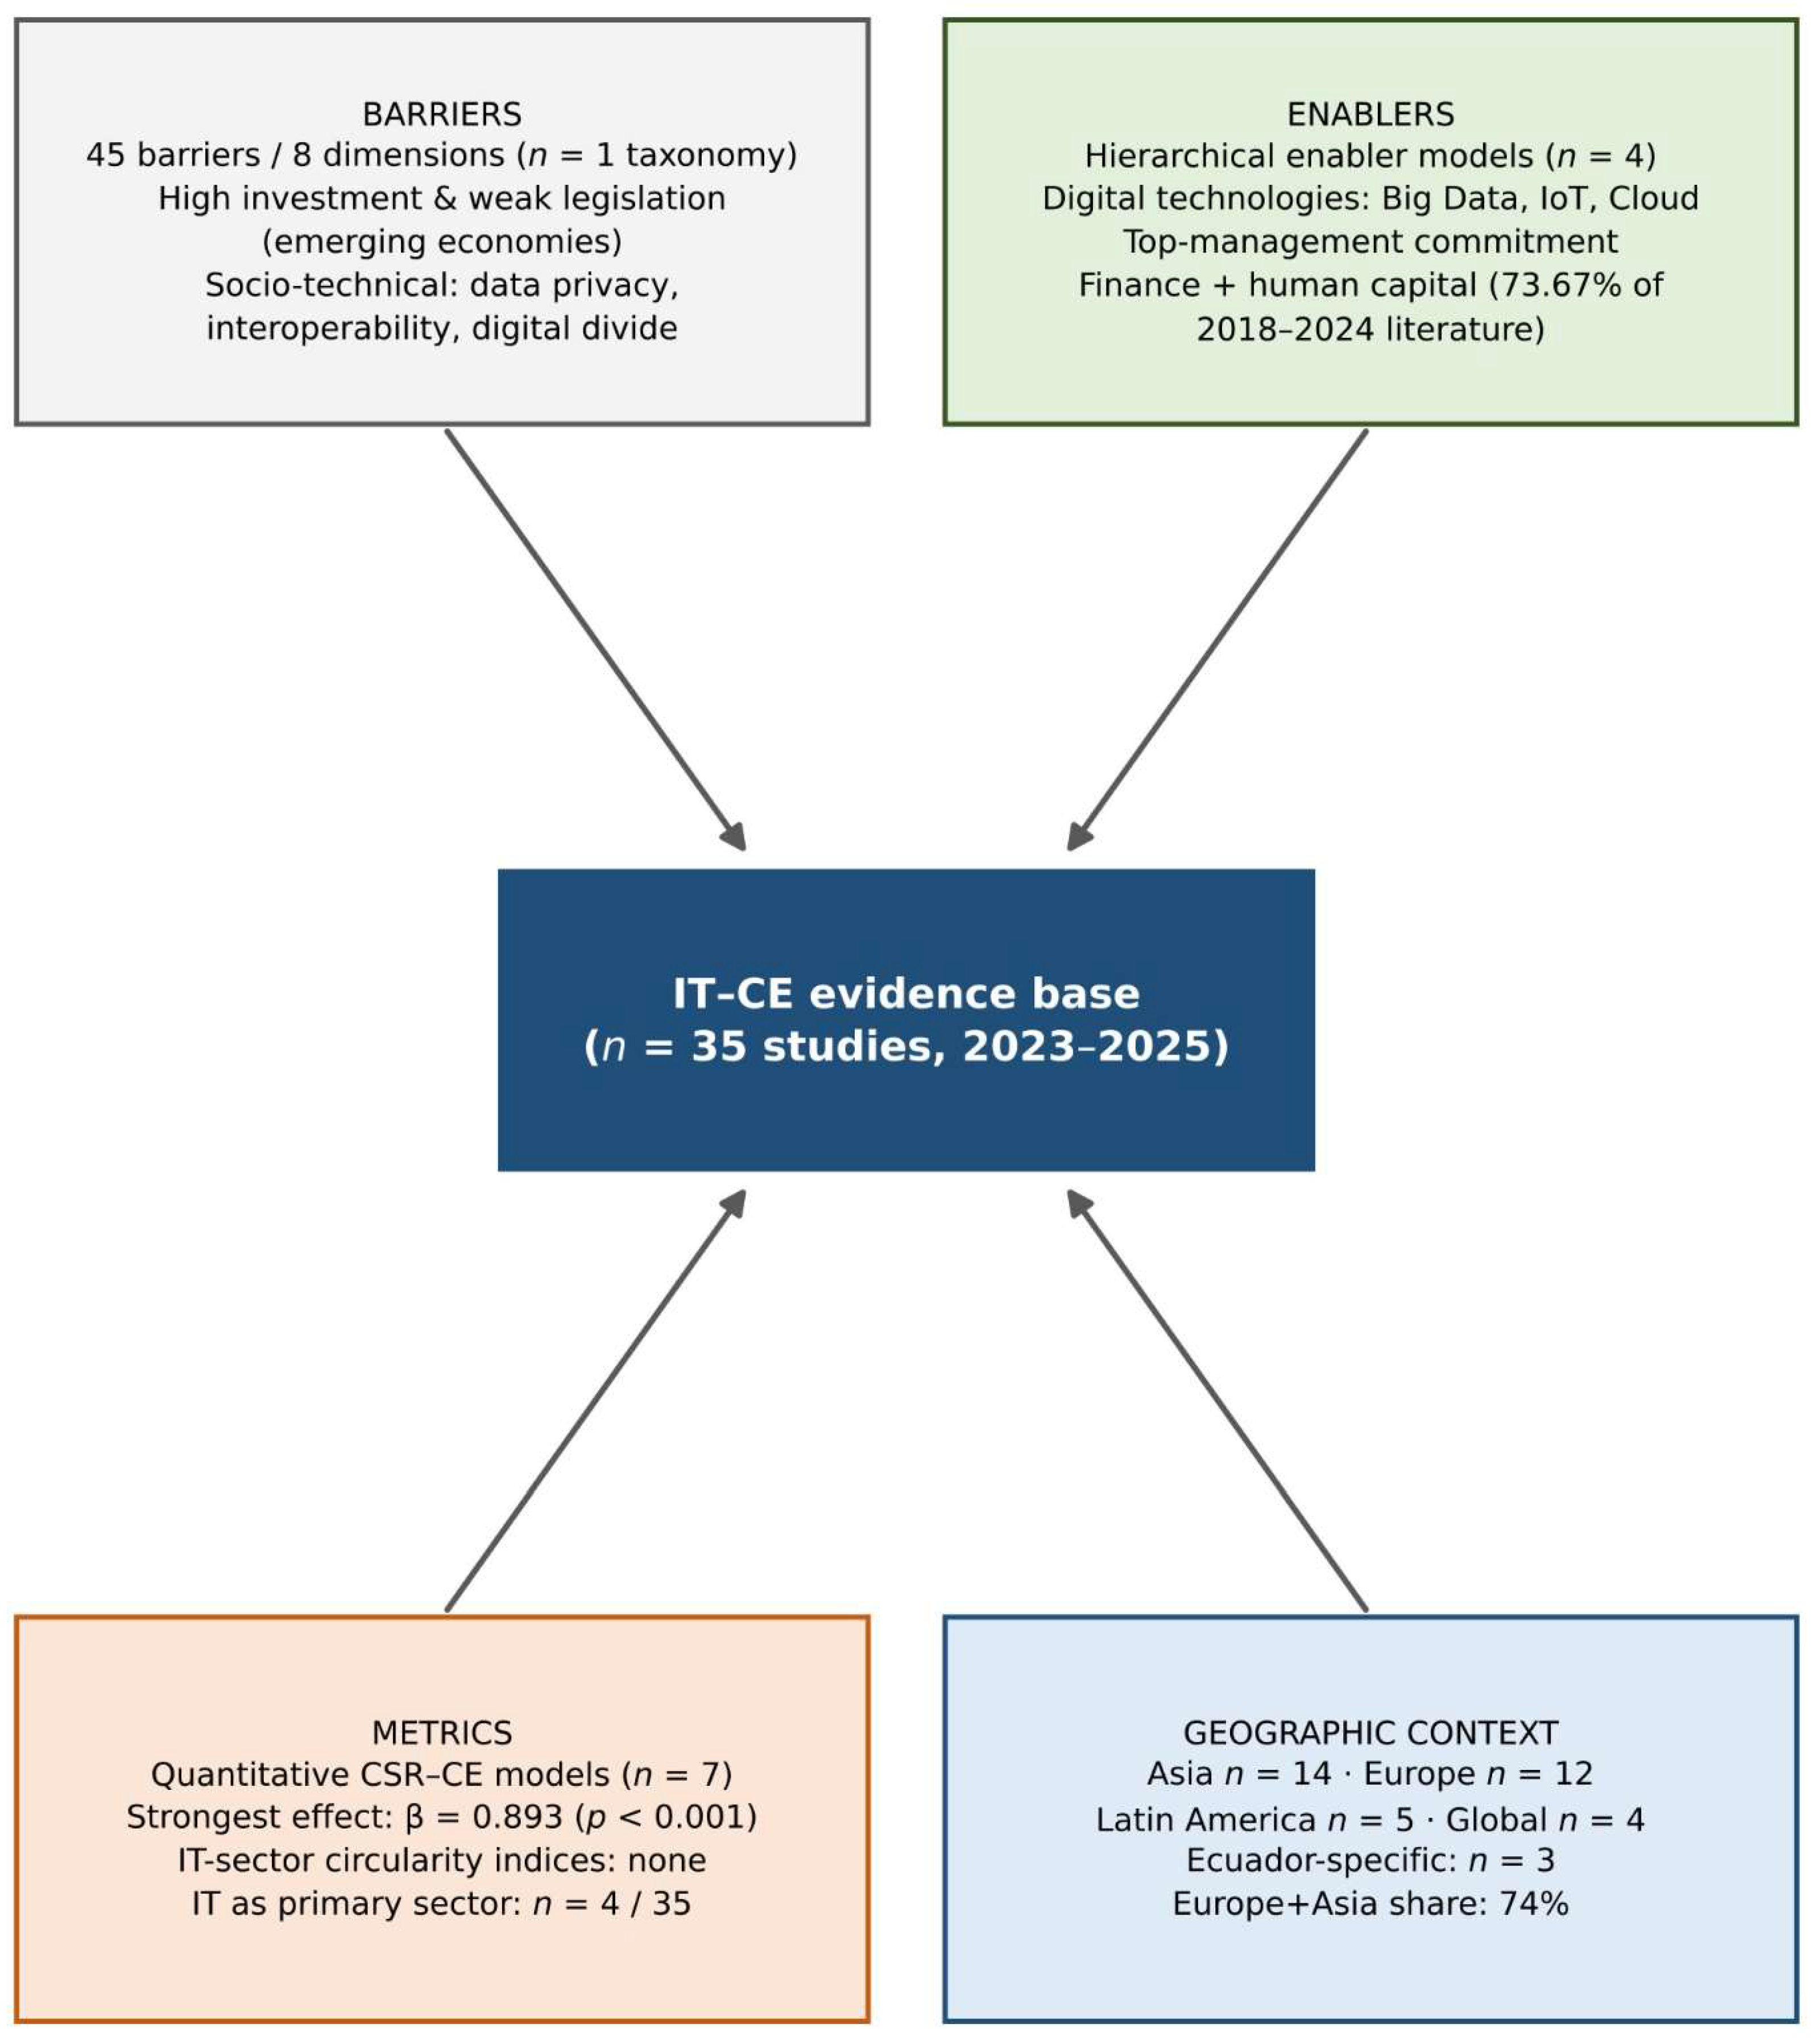
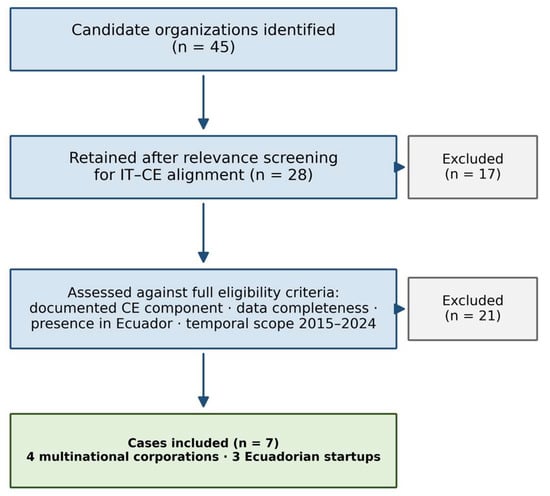
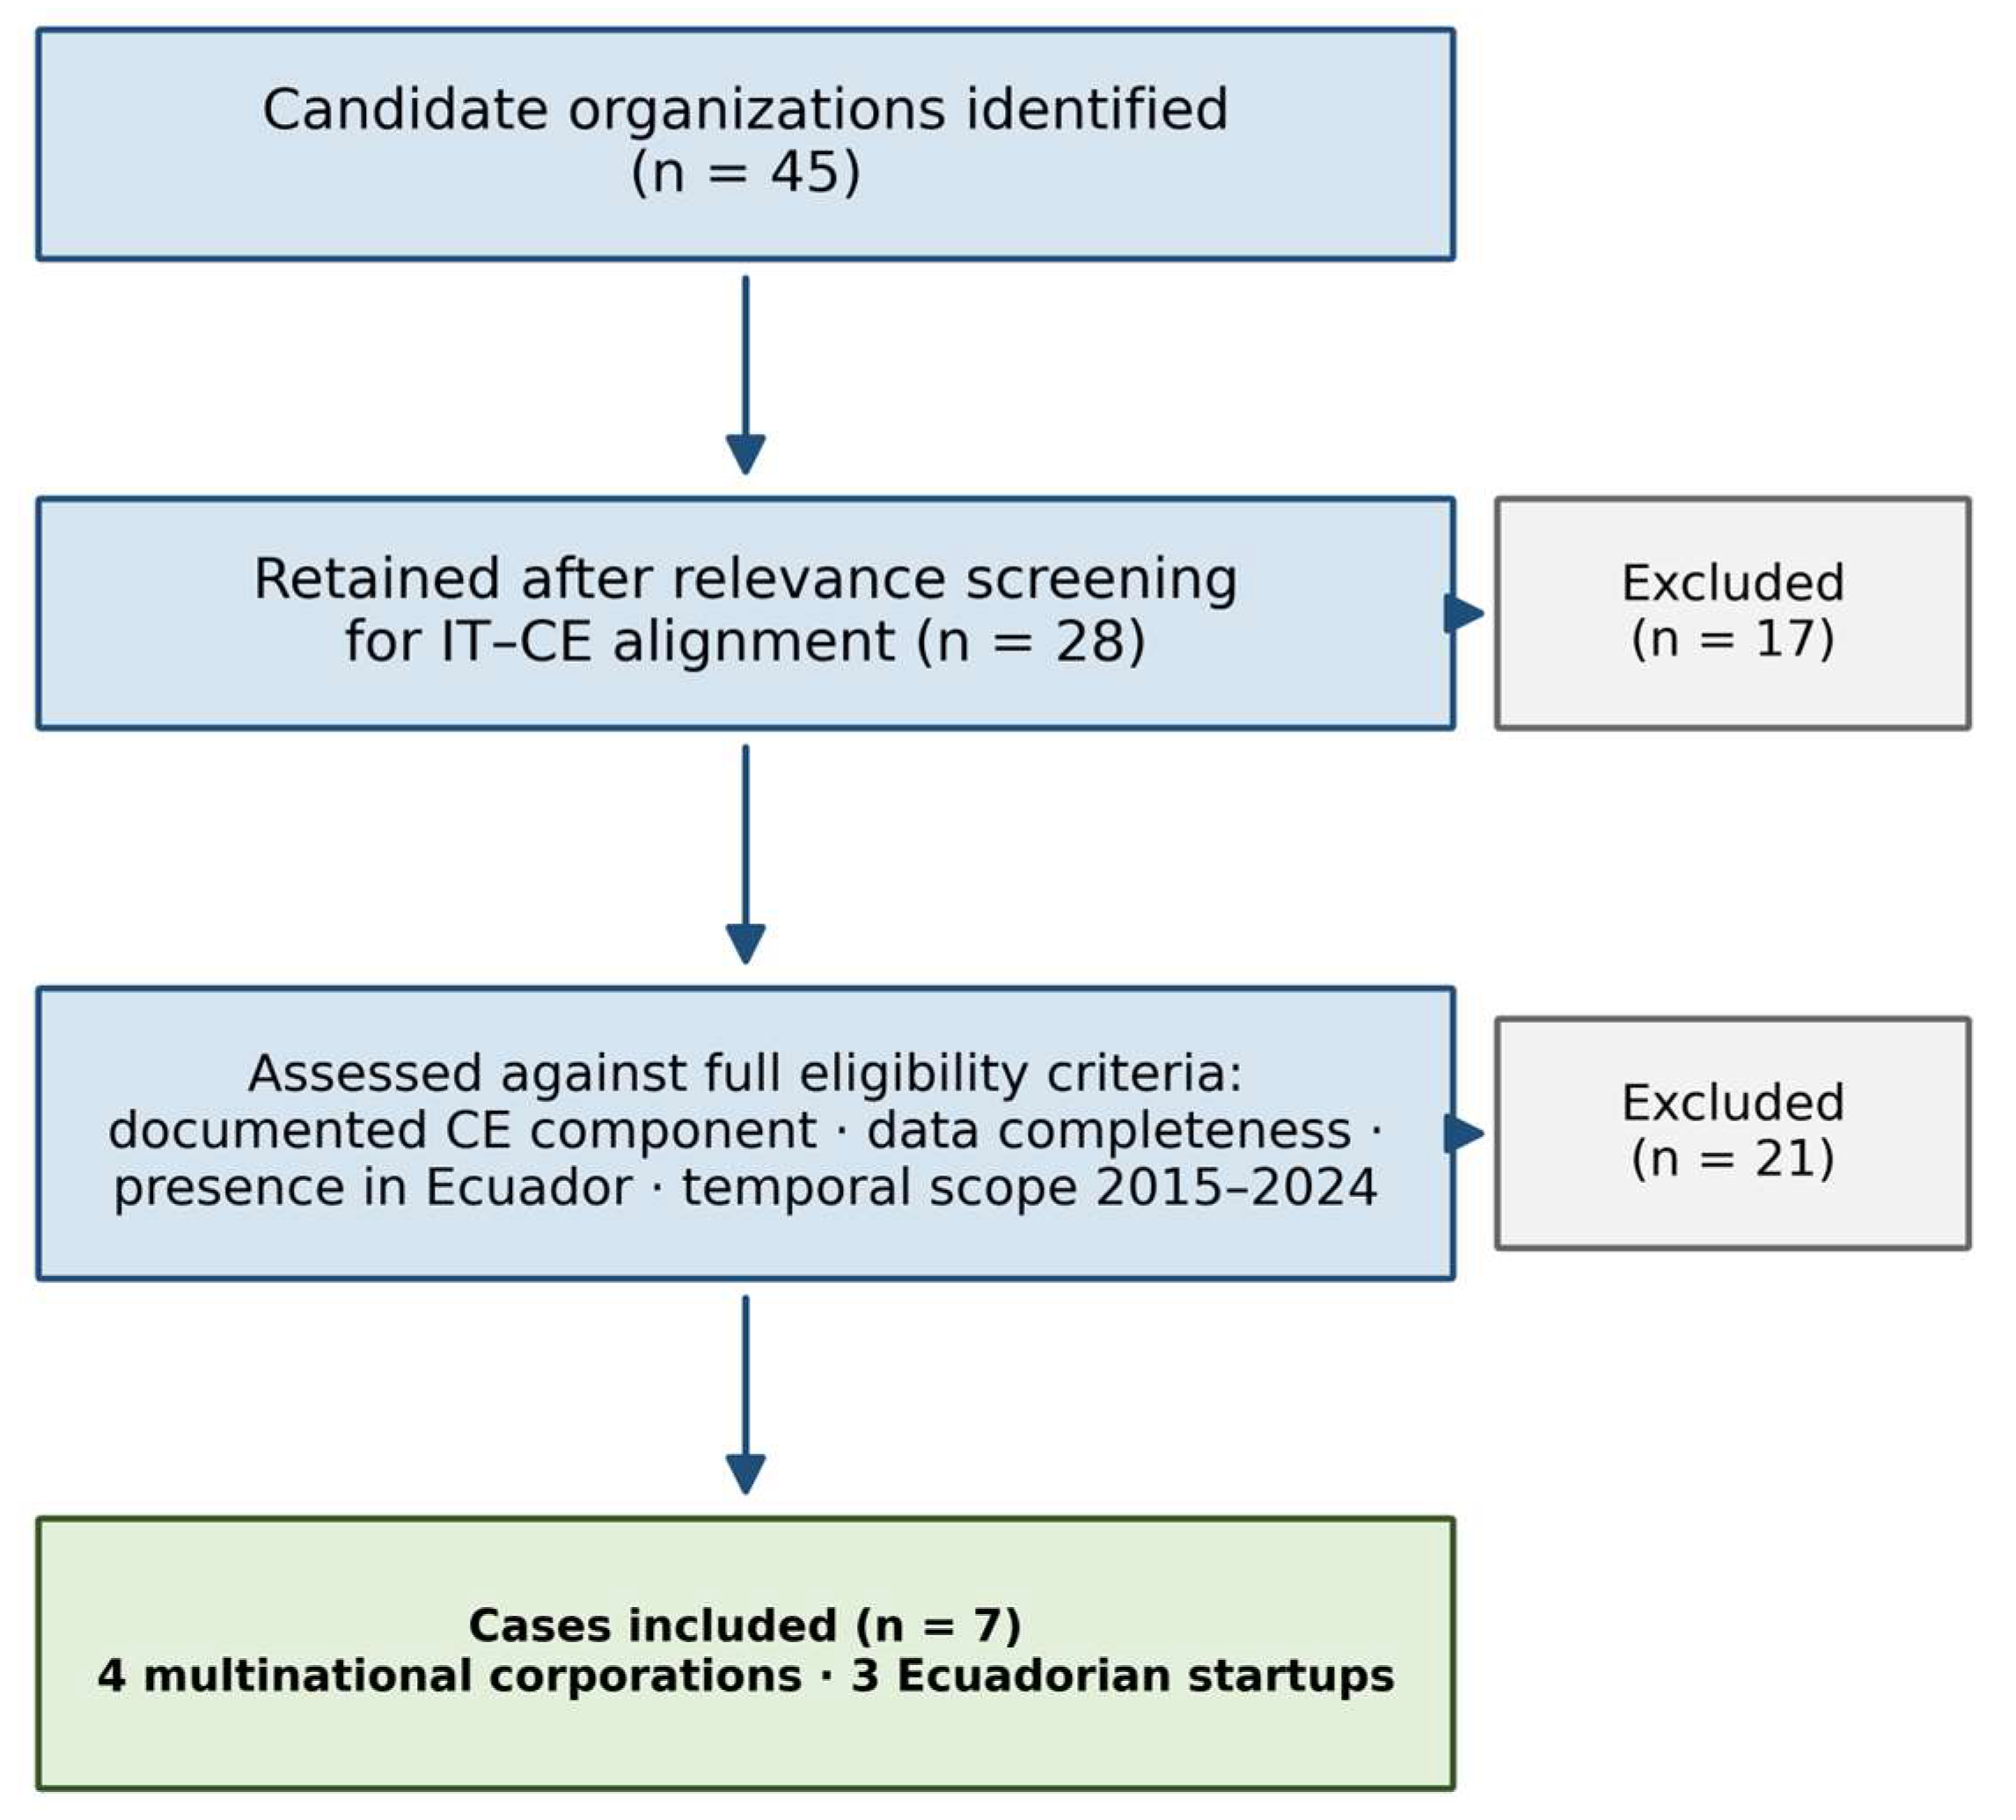
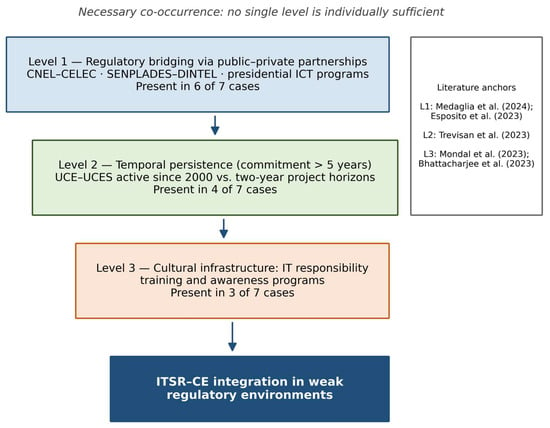
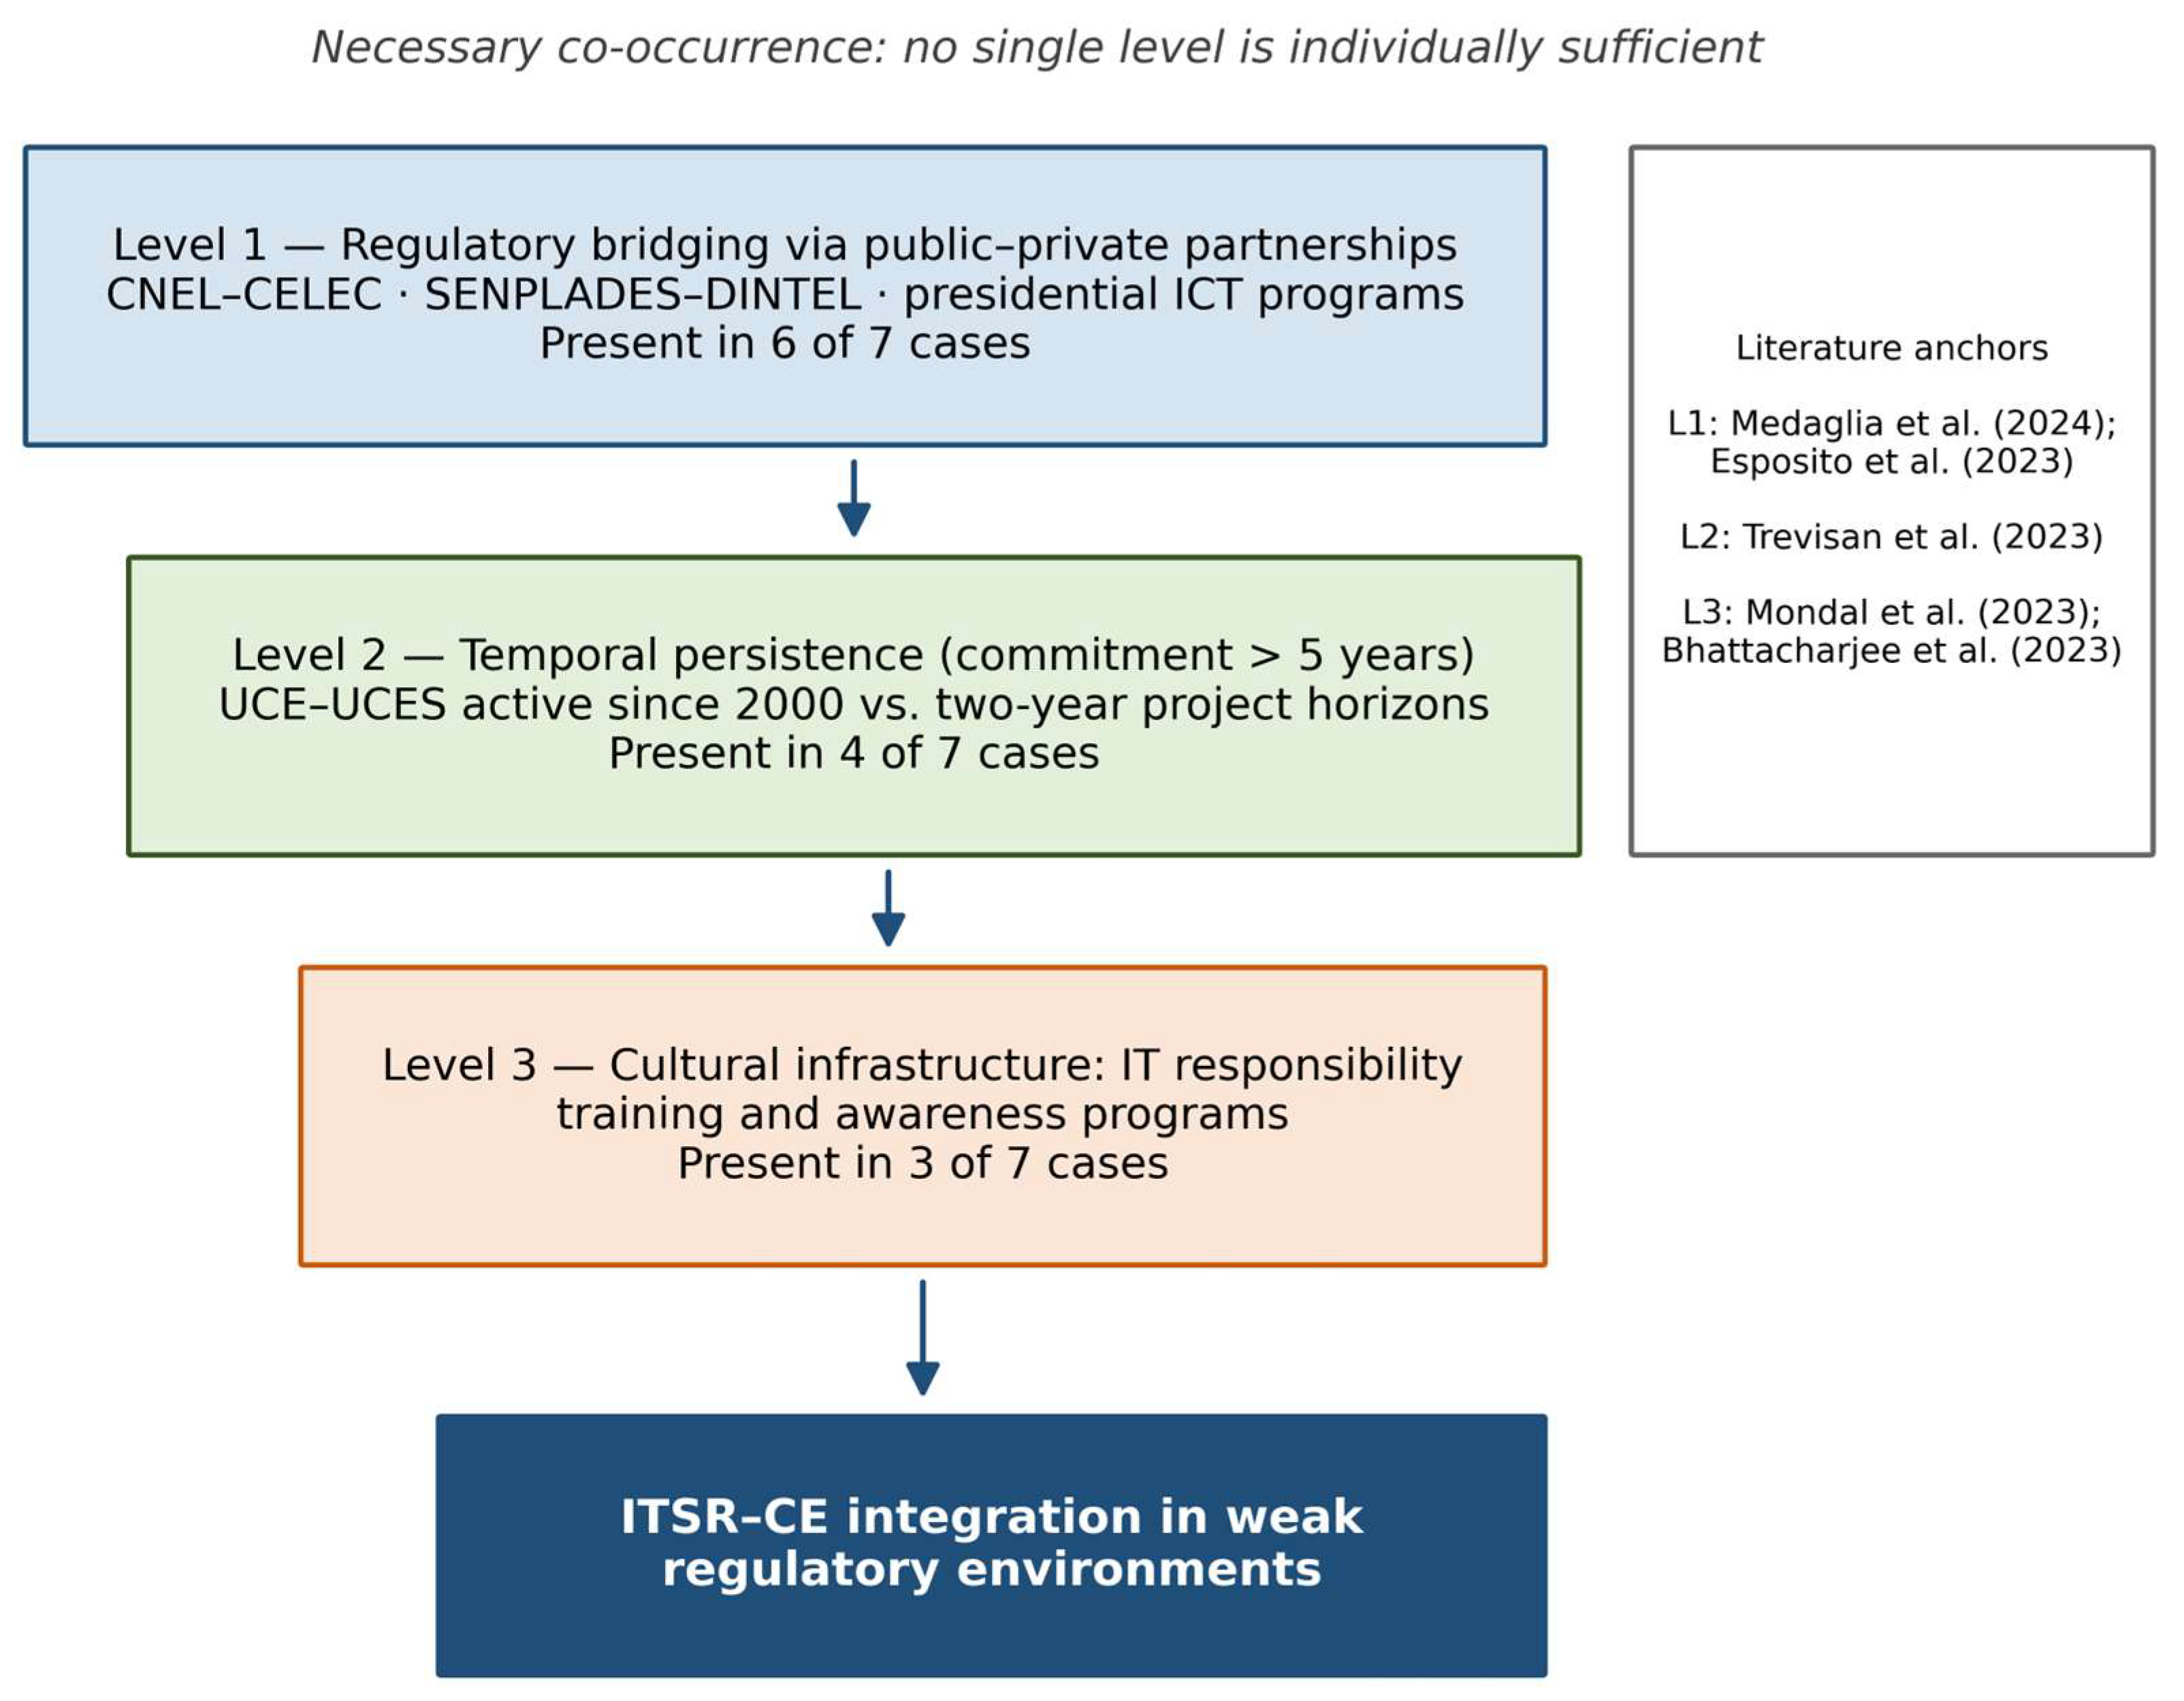
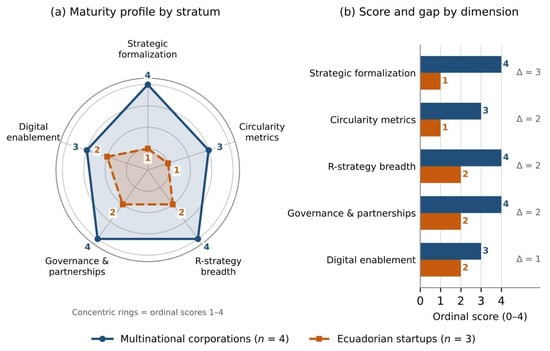
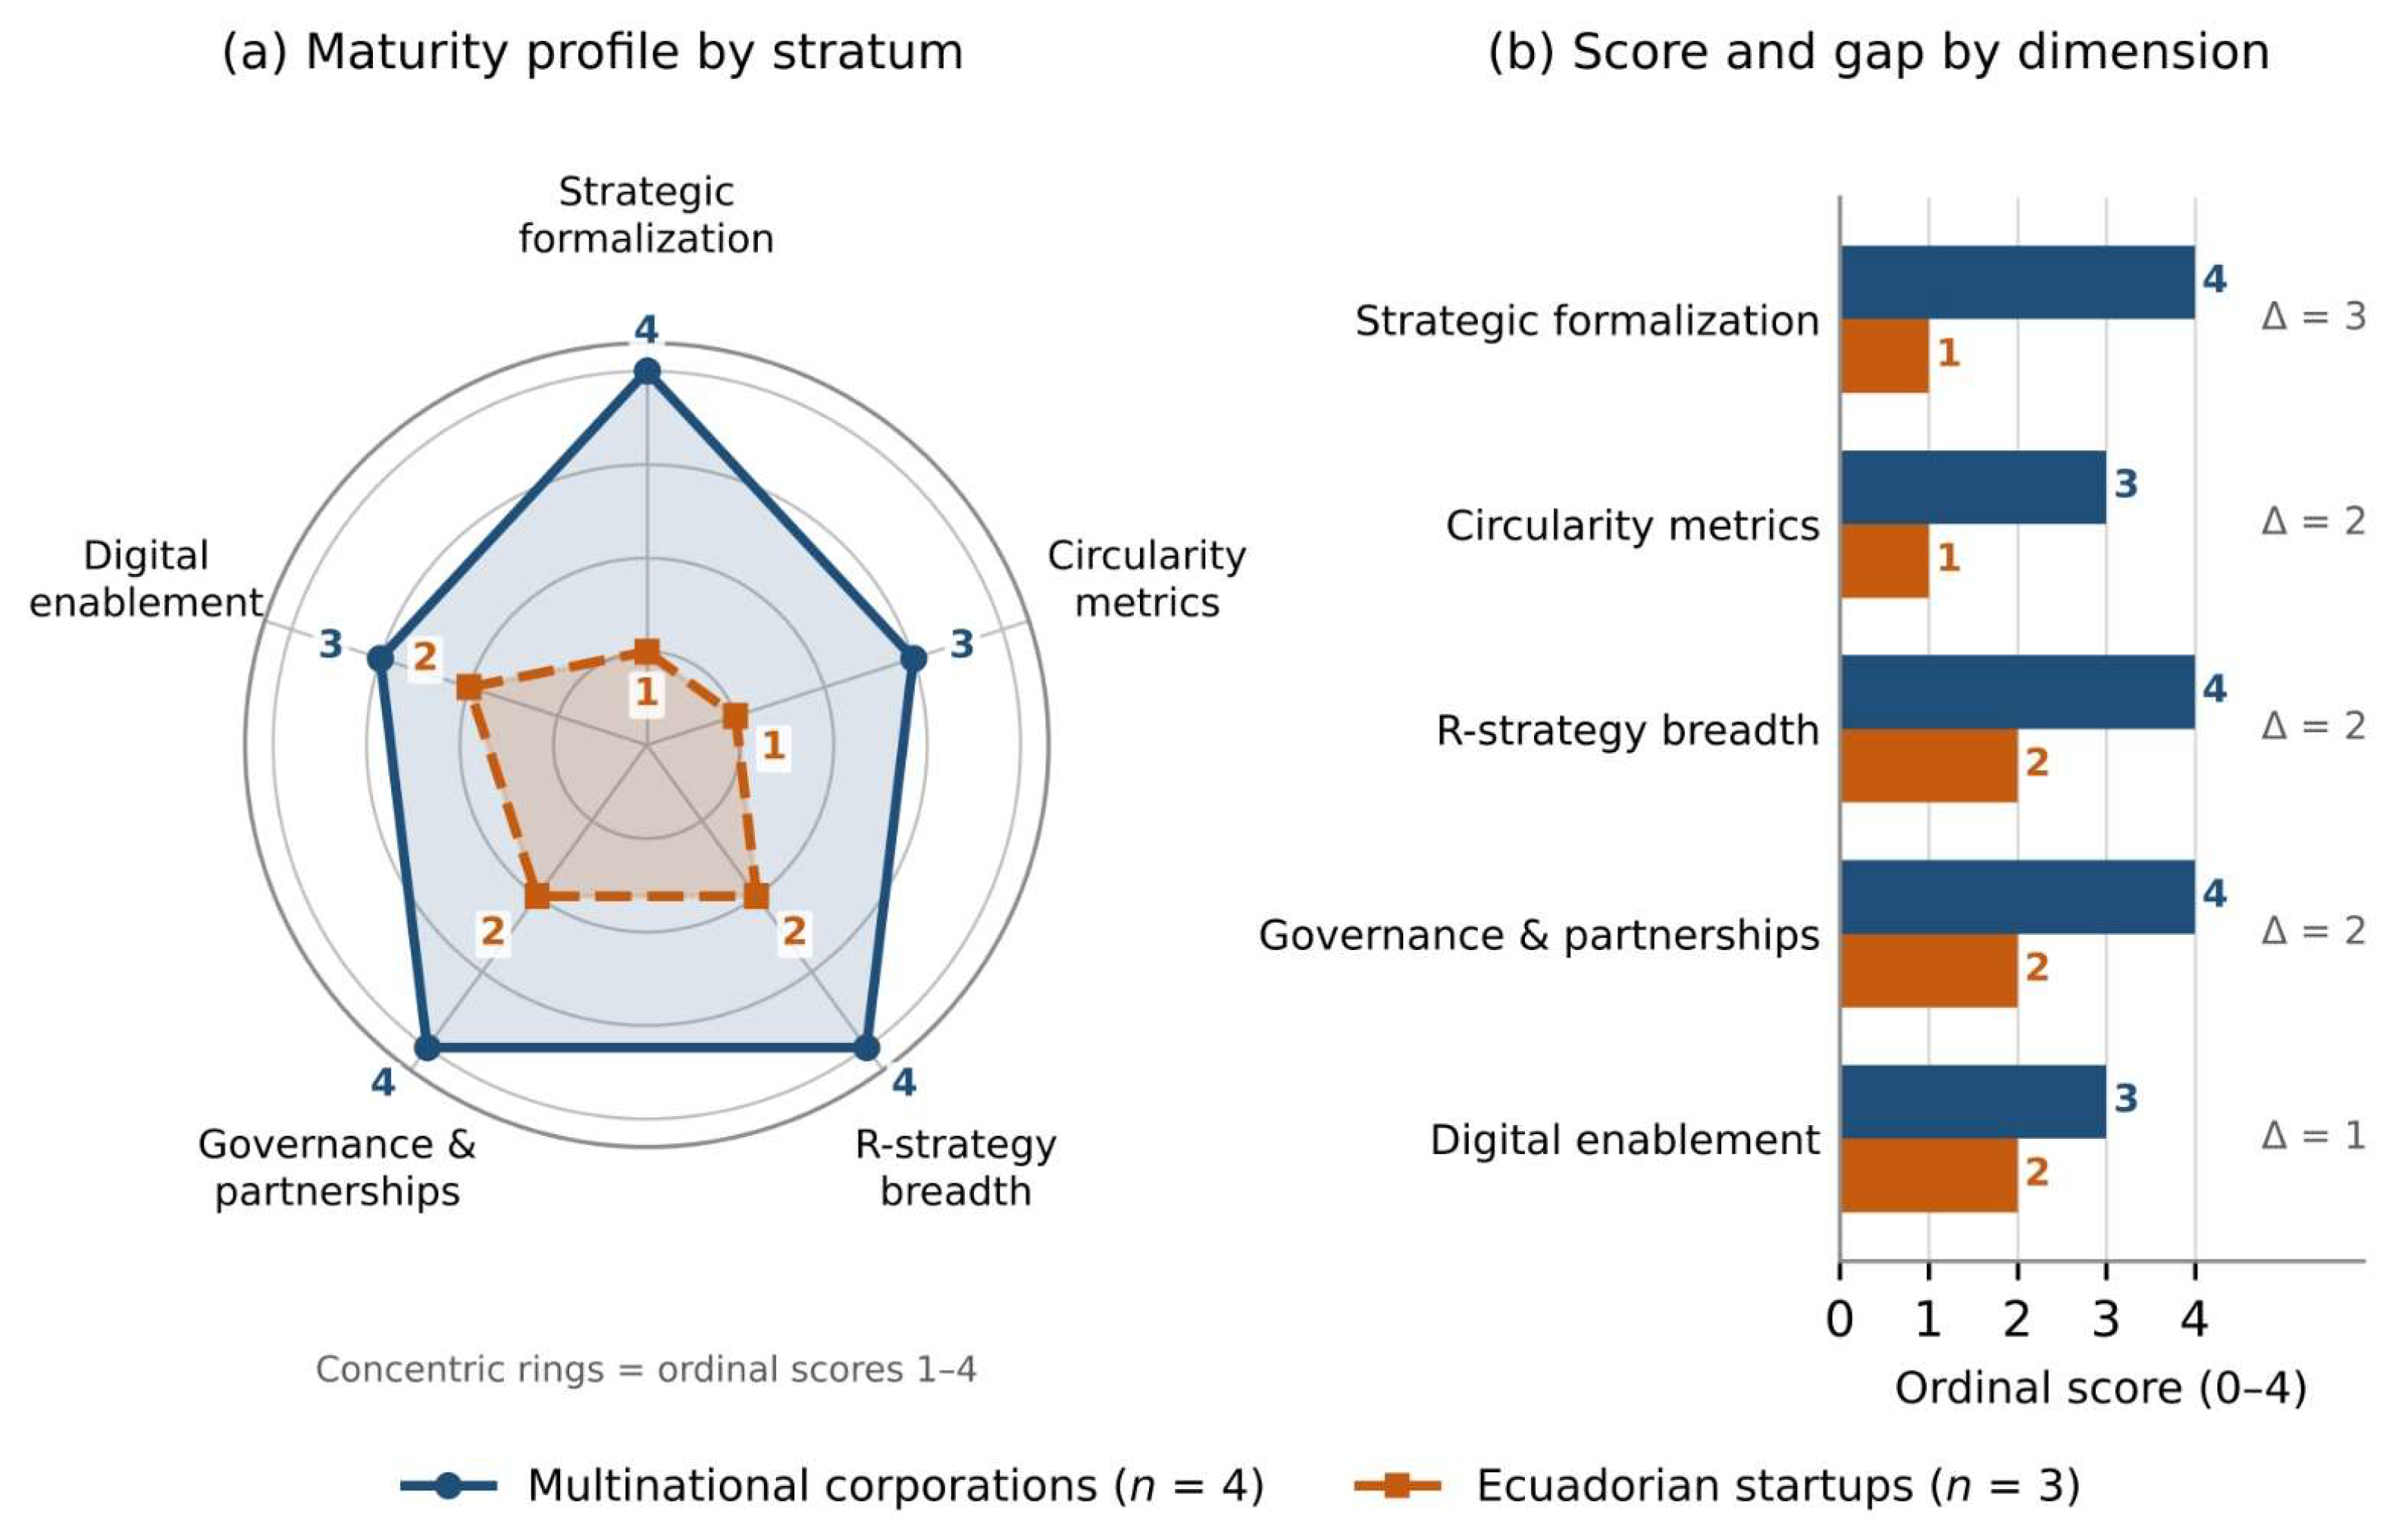

Disclaimer/Publisher’s Note: The statements, opinions and data contained in all publications are solely those of the individual author(s) and contributor(s) and not of MDPI and/or the editor(s). MDPI and/or the editor(s) disclaim responsibility for any injury to people or property resulting from any ideas, methods, instructions or products referred to in the content. |
© 2026 by the authors. Licensee MDPI, Basel, Switzerland. This article is an open access article distributed under the terms and conditions of the Creative Commons Attribution (CC BY) license.